Preprint
Article

Epithelial and Mesenchymal Pancreatic Cancer Cells Exhibit Different Stem Cell Phenotypes Being Associated with Different Metastatic Propensity

Altmetrics

Downloads

141

Views

100

Comments

0

A peer-reviewed article of this preprint also exists.

Submitted:

15 November 2023

Posted:

16 November 2023

You are already at the latest version

Alerts
Abstract
Pancreatic ductal adenocarcinoma (PDAC) is mostly diagnosed at advanced or even metastasized stages limiting patient´s prognosis. Metastasis requires high tumor cell plasticity implying phenotypic switching in response to changing environments. Here, Epithelial-Mesenchymal-Transition (EMT), being associated with the gain of cancer stem cell (CSC) properties, and its reversion are important. Since it is poorly understood whether different CSC-phenotypes exist along the EMT-axis and how these impact malignancy-associated properties, we aimed to characterize CSC-populations of epithelial and mesenchymal PDAC cells. Single-cell cloning revealed CSC (Holoclone) and non-CSC (Paraclone) clones from the PDAC cell lines Panc1 and Panc89. Panc1 Holoclone cells showed a mesenchymal phenotype dominated by high expression of the stemness marker Nestin, while Panc89 Holoclone cells exhibited a SOX2-dominated epithelial phenotype. Panc89 Holoclone cells showed enhanced cell growth and self-renewal capacity but slow cluster-like invasion. Contrarily, Panc1 Holoclone cells showed slower cell growth and self-renewal ability but were highly invasive. Moreover, cell variants differentially responded to chemotherapy. In vivo, Panc1 and Panc89 cell variants significantly differed regarding number and size of metastases as well as organ manifestation leading to different survival outcomes. Overall, these data support the existence of different CSC-phenotypes along the EMT-axis in PDAC manifesting in different metastatic propensities.
Keywords: 
Subject: Medicine and Pharmacology  -   Oncology and Oncogenics

1. Introduction

Pancreatic ductal adenocarcinoma (PDAC) is the most common malignant pancreatic tumor, still characterized by a poor prognosis with 5-year survival rates of around 12% and an still ongoing increase in death rate [1,2]. Due to the lack of early and specific symptoms, the majority of patients are diagnosed at an advanced or even metastasized stage leaving only palliative treatment. The only curative option is surgery which, however, is only eligible for about 20% of patients [3,4]. PDAC metastasizes predominantly in the liver, but also in lung and peritoneum [4,5,6]. PDAC patients with liver metastases or peritoneal exhibit a significantly shorter disease-free survival and overall poorer prognosis than patients with solitary lung metastases [7].
The multistep process of metastasis starts with dissemination of tumor cells from the primary tumor and ends with proliferation and outgrowth of macroscopic metastases at secondary sites [8,9,10]. As a prerequisite for dissemination, carcinoma cells have to acquire a motile and invasive phenotype, which is commonly described to be achieved by Epithelial-Mesenchymal-Transition (EMT) [11,12]. EMT is associated with the downregulation of adhesion molecules and loss of epithelial proteins like E-cadherin and conversely, a gain of mesenchymal characteristics like increased expression of mesenchymal markers such as Vimentin, L1CAM, or the transcription factors ZEB1, ZEB2 and OVOL2 (ZNF339) [11,12,13,14,15,16,17]. Furthermore, this loss of cell differentiation of carcinoma cells has been associated with the acquisition of cancer stem cell (CSC) properties [18,19,20]. Mani et al. were the first who demonstrated that breast cancer cells that have undergone EMT acquire a cancer stem cell-like phenotype, and likewise, stem cell-like cells resemble cells that have undergone EMT [18].
CSCs are a small group of cancer cells within a cancer cell population with the unique ability to both self-renewal and generation of more differentiated cells. Owing to these unique features, CSCs are regarded as essential for tumor initiation at primary and secondary sites, including PDAC [21,22,23]. Recent studies indicate that CSC-properties can be gained and lost depending on the microenvironment [20,24,25,26,27], indicating that CSCs are not a stable, but highly plastic cell population. Several markers, e.g. ABCG2, CD133, CD24, CD44, Nanog, Nestin and SOX2, have been proposed for the identification of CSCs in PDAC already indicating a high heterogeneity within the CSC population [28,29,30,31,32,33,34]. The intermediate filament Nestin and the stem cell (SC)-transcription factor SOX2 seem to play a role in the maintenance of CSC properties [35,36]. Nestin impacts cell motility and EMT properties in PDAC cells and its knockdown in PDAC cells led to reduced tumor incidence and volume, as well as formation of liver metastases in a murine PDAC model [37,38]. Elevated SOX2 expression has been rarely detected in pancreatic intraepithelial neoplasia rather than poorly differentiated and neurally invasive tumors supporting a role of this factor in later stages of tumorigenesis and metastasis [39]. In line with these findings it has been shown that SOX2 is involved in Mesenchymal-Epithelial-Transition (MET), the reversion of EMT, as knockdown of SOX2 in colorectal cancer (CRC) cells altered expression of key genes involved in the EMT process including E-cadherin and Vimentin [40]. Furthermore, de novo SOX2 expression in pancreatic cancer cells is sufficient to promote self-renewal, de-differentiation and impacting stemness characteristics via modulating specific cell cycle regulatory genes and EMT-driver genes [32].
In vitro, self-renewal abilities are assessed by colony formation and here, different colony types exhibiting distinct morphologies and different CSC potentials have been described [41]. While Holoclones are considered to be the colony type with the highest amount of CSCs, Paraclones are characterized by more differentiated cells [41,42]. Meroclones form an intermediate stage of these two colony types and differ from Holoclones mainly in their lower proportion of CSCs [41,42]. Our group previously demonstrated that Panc1 Holoclone cells derived by single-cell cloning from the parental PDAC cell line Panc1 showed elevated and exclusive expression of the CSC-marker Nestin compared to Paraclones [41]. Of note, experimental evidence has been provided that also carcinoma cells with an epithelial phenotype can contribute to metastasis, using a cluster-like migration pattern, which has also been described for PDAC cells [43]. Moreover, recent studies indicate that so-called hybrid cells concomitantly showing epithelial and mesenchymal characteristics exhibit the highest plasticity regarding cancer stemness, tumor initiation capacity as well as adaptation capability, which gives these cells the highest probability to metastasize [43]. Still, it is poorly understood whether different CSC-phenotypes exist along the EMT/MET axis and how these impact malignancy associated properties. Thus, to explore whether and how different EMT states are associated with CSC properties in PDAC and how this impacts tumor cell growth and metastasis, Holo- and Paraclone cells were isolated and expanded from another PDAC cell line (Panc89). In contrast to mesenchymal Panc1 cells which have presumably already undergone EMT but still are derived from a primary PDAC, Panc89 cells originate from a lymph node metastasis and have presumably undergone EMT and MET during the metastatic process. Using these well-defined cell models the present study aimed at a comprehensive in vitro and in vivo analysis of isolated Holo- and Paraclone cell variants from Panc1 and Panc89 cells concerning EMT and CSC properties as well as tumorigenicity and metastasis. Overall, our data support the view of great plasticity and heterogeneity within cancer (stem) cells in PDAC, differentially impacting tumor growth and metastatic behavior.

2. Materials and Methods

Cell lines and cell culture

As a model for mesenchymal PDAC cells, the human cell line Panc1 was used (purchased from ATCC, Manassas, Virginia US) originating from a primary tumor of a PDAC patient. As a model for epithelial PDAC cells, the human cell line Panc89 (kindly provided by Prof. T. Okabe, University of Tokyo, JP) originating from a lymph node metastasis of PDAC was used. Holo- and Paraclone cells of both cell lines were isolated and expanded via single-cell cloning (see below). All cell lines were cultivated in Panc-medium (RPMI 1640 supplemented with 10% FCS, 1% L-glutamine, and 1% sodium pyruvate (Biochrom, Berlin, DE)).
For analysis of PDAC cell adhesion behavior to endothelial cells of different metastatic sites, lung (HuLEC-5a) and liver (TMNK-1) endothelial cell lines as well as the mesothelial cell line Met-5a were used. HuLEC-5a cells (purchased from ATCC, Manassas, Virginia US) are human microvascular endothelial cells that are derived from the lungs of a male patient [44]. They were cultured in MCDB 131 (Biochrom, Berlin, DE) medium containing 10% FCS, 1% L-glutamine, 10 ng/ml Epithelial Growth Factor and 1 µg/ml hydrocortisone. TMNK-1 (purchased from NIBIOHN JCRB cell bank, Osaka, JP) are human liver sinusoidal endothelial cells [45], originating from the liver of a female patient [45]. They were cultured in DMEM (Biochrom, Berlin, DE) containing 10% FCS, 1% L-glutamine, and 1% penicillin-streptomycin. Met-5a cells (purchased from ATCC, Manassas, Virginia US) originating from mesothelium, were isolated from the pleural fluids of non-cancerous individuals [46,47] and cultured in Medium199 (Sigma Aldrich/Merck KGaA, Darmstadt, DE) containing 10% FCS, 400 nM hydrocortisone, 870 nM porcine insulin, and 20nM HEPES.

Single-cell cloning and clone expansion

Single-cell cloning and expansion was performed with parental PDAC cell lines to isolate and expand single-cell derived Holo- and Paraclone cells. Single-cell cloning of Panc1 cells to isolate Panc1 Holo- and Paraclone cells, respectively, was performed previously [41]. To isolate Holo- and Paraclone cells from Panc89 cells, the parental cells were pre-diluted to a cell count of 1000 cells per ml Panc-medium. From this cell suspension, 100 µl (corresponding to 100 cells) were added to 20 ml of Panc-medium to obtain a concentration of one cell per 200 µl of cell medium. Cells were seeded 1 cell/well in a transparent, flat 96-well plate. The plate was centrifuged and the first screening was performed directly after centrifugation by imaging the plate in the brightfield channel of a NYONE® Scientific Imager (SynenTec GmbH, Elmshorn, DE) and the brightfield channel of EVOS microscope (AMG, Bothell, US). Only wells containing exactly one cell were considered for further monitoring and expansion. Microscopical screening was performed twice per week. After 12-20 days, the colony shape was determined and the colonies were monitored until a cell confluence of about 80% was reached. Cell clones with a stable colony morphology [41,42] were detached from one well and transferred to one well of a 6-well plate. The morphology of expanded cell clones was checked regularly. Only clones with a clear CSC- or non-CSC morphology [41,42] and stable phenotype were further cultivated, expanded, and used for phenotypic and functional characterization. Phenotypes were regularly checked by marker analysis via qPCR.

Colony formation assay (CFA)

Colony formation ability was analyzed by CFA. For this purpose, 400 cells were seeded as duplicates or triplicates in 6-well plates in Panc-medium. After cultivation for 8-11 days, colonies were fixed with 4% Paraformaldehyde (Thermo Scientific, Schwerte, DE) for 10 min, stained with 0.1% crystal violet (Merck Millipore, Darmstadt, DE) for 1h, washed in dH2O and air-dried at RT. Only colonies containing more than 50 cells were counted and their morphology regarding Holo- and Paraclone was determined. Holoclones consisted of tightly, homogenously clustered cells with a regular borderline, while Paraclones consisted of dispersed, larger cells with an irregular boundary [48]. Meroclones defined by an intermediate colony type [48] were neglected in this study.

RNA isolation and RT-qPCR

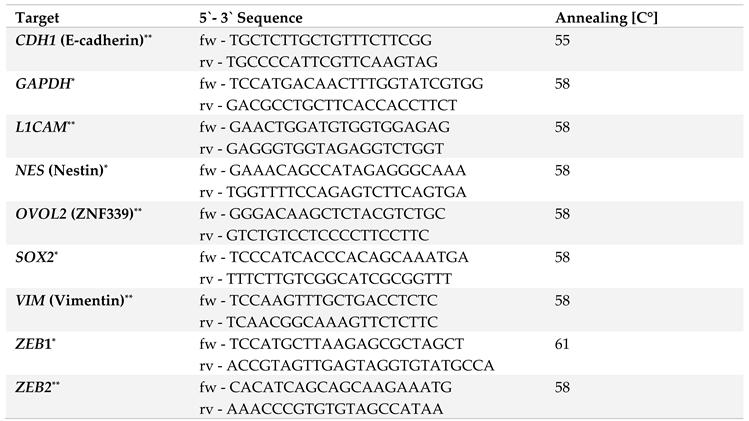
Total RNA was isolated using the total RNA kit peqGOLD (PeqLab, Erlangen, DE) and subjected to reverse transcription according to manufacturer’s instructions (Fermentas via Thermo Fisher Scientific, Darmstadt, DE). The qPCR analysis was performed in duplicates on a LightCycler 480 (Roche, Basel, CH) for a maximum of 50-60 cycles ending with a melting curve analysis for primer quality control. Primers used (Eurofins, Ebersberg DE; RealTime Primers via Biomol, Hamburg, DE), primer sequences, and annealing-temperatures are listed in Table 1. For relative quantification of RNA levels, CT-values of genes of interest were normalized to the respective CT-value for the reference gene GAPDH.

Analysis of CSC- and EMT- marker via immunofluorescence staining

For the analysis of different CSC- and EMT-marker on protein level in Panc1 and Panc89 cell variants, an immunofluorescent staining (IFS) was performed. Panc1 cell variants were stained with anti-Nestin (clone 10C2; Thermo Scientific, Schwerte, DE) and anti-ZEB2 (polyclonal; Novus Biologicals, Wiesbaden Nordenstadt, DE) antibodies, while all Panc89 cell variants were stained with anti-SOX2 (clone D6D9; Cell Signaling Technology, Danvers, MA - US) and anti-L1CAM (clone UJ127.11; Gerd Moldenhauer, German Cancer Research Center, Heidelberg, DE) antibodies.
First, glass coverslips were placed in each well of a 12-well plate. Then, 0.5 × 10⁴ cells/well were seeded. After 48h, cell culture medium was removed and the cells were washed with PBS. Fixation of the cells was performed by incubation with 4% PFA for 15 min at RT. Next, the coverslips were washed 3 × 5 min with PBS and incubated with ice-cold methanol (MetOH) for 10 min at -20°C for permeabilization of the cells. Afterward, the coverslips were washed with PBS and cells were blocked with 4% bovine serum albumin (BSA)-0.3% TritonX-100 in PBS for 1h at RT. After a washing step with 0.3% TritonX-100/PBS, incubation with the primary antibodies was performed (see below).
Concomitant double IFS staining of Nestin and ZEB2 in Panc1 cells:
Incubation of the antibodies and Hoechst 33258 (Merck Millipore, Darmstadt, DE) was carried out in 1% BSA-0.3% TritonX-100/PBS and in a humidity chamber. Incubation of the primary antibodies was performed at 4°C overnight (ON). Anti-Nestin antibody (Thermo Scientific, Schwerte, DE) was diluted 1:200 (= 5 µg/ml), anti-ZEB2 antibody (Novus Biologicals, Wiesbaden-Nordenstadt, DE) was diluted 1:50 (= 2 µg/ml), mouse IgG1 isotype control (R&D Systems GmbH, Wiesbaden, DE) was diluted 1:100 (= 5 µg/ml) and rabbit IgG isotype control (Bio-Techne, Minnesota, US) was diluted 1:500 (= 2 µg/ml). Incubation of primary antibodies was performed as a concomitant double staining incubating with both primary antibodies at the same time. After ON incubation, cells were washed with 0.3% TritonX-100/PBS. Afterward, anti-mouse antibodies conjugated with AlexaFluor 488 (Invitrogen, Carlsbad, US), anti-rabbit antibodies conjugated with AlexaFluor 647 (Invitrogen, Carlsbad, US) and Hoechst 33258 were each diluted 1:500 in 1% BSA-0.3% TritonX-100/PBS and added to the cells for 1h at RT. After washing with PBS and dH2O, coverslips were sealed with Fluor Safe Reagent (Electron Microscopy Sciences, Hatfield, PA) and transparent nail polish.
Sequential IFS staining of SOX2 and L1CAM in Panc89:
Incubation of anti-SOX2 (Cell Signaling Technology, Danvers, MA - US) and related secondary antibody was carried out in 1% BSA-0.3% TritonX-100/PBS and in a humidity chamber. Incubation of anti-L1CAM and related secondary antibody, as well as Hoechst 33258 staining was carried out in 1%BSA/PBS. Anti-SOX2 antibody was diluted 1:200 (= 25 µg/ml), anti-L1CAM antibody was diluted 1:100 (= 10 µg/ml), mouse IgG1 isotype control was diluted 1:50 (= 10 µg/ml) and rabbit IgG isotype control was diluted 1:40 (= 25 µg/ml). Incubation of primary antibodies was performed sequentially, starting with the ON staining of SOX2 at 4°C. After incubation with an anti-SOX2 antibody, cells were washed with 0.3% TritonX-100/ PBS and incubation with anti-rabbit antibody conjugated with AlexaFluor 647 diluted 1:500 in 1% BSA-0.3% TritonX-100/PBS was performed for 1h at RT. After washing with PBS, incubation with anti-L1CAM antibody was carried out for 1h at RT. After washing with PBS, cells were incubated with the anti-mouse antibody conjugated with AlexaFluor 488 and Hoechst 33258, both diluted 1:500 in 1% BSA/PBS for 1h at RT. After washing with PBS and dH2O, coverslips were sealed with Fluor Safe Reagent and transparent nail polish. Image acquisition and staining evaluation of all cell lines were performed with the Lionheart FX Automated Microscope and related software (Gen5 Data Analysis Software (BioTek, Bad Friedrichshall, DE).

RNA sequencing and transcriptomic analysis

Total high-purity RNA of all cell variants was isolated using the total RNA kit peqGOLD (PeqLab, Erlangen, DE) with an additional DNase digestion step according to manufacturer's specifications. Afterward, RNA-triplicates (3 biological replicates) of each cell line were placed in a 96-well plate in a concentration of at least 150 ng/15 µl RNase-free water. RNA sequencing was performed at the Institute of Clinical Molecular Biology (Kiel, DE) under the supervision of Sören Franzenburg. Input total RNA was quantified using the Quant-it RNA Assay (Thermo Fisher, Waltham, US), and RIN scores were determined using the Agilent Tape Station (Agilent, Santa Clara, US). All RIN scores were > 8. 200 ng input total RNA were processed using the Illumina stranded mRNA kit (Illumina, San Diego, US). Libraries were sequenced on the Illumina NovaSeq 6000 SP Flowcell using 100bp paired-end reads. Transcriptomic analysis of mRNA sequencing data was performed by Hauke Busch and Axel Künstner (Medical Systems Biology Group, Institute of Experimental Dermatology, University of Lübeck, DE). Raw sequencing data (fastq format) was mapped against the human transcriptome (Ensembl GRCh38.106) using kallisto (v0.46.1) [49], and gene expression was summarized from the scaledTPM values of the transcripts using tximport [50]. Differential gene expression was performed using DESeq2 [51]. Gene set enrichment analysis (GSEA) on the shrunken log2 fold changes from apeglm [52] was performed using GAGE (v2.48.0) [53] against HALLMARK, REACTOME and Gene Ontology Biological Processes (GOBP) gene sets extracted from the msigdbr R package (v7.5.1).

Cell growth analysis

Panc1 and Panc89 cell variants were seeded at 5 × 10³ cells/well in triplicates in 96-well plates for seven days (168h). Cells were imaged every day with the brightfield channel (confluence operator) and the UV channel (nuclei count operator) of the NYONE® Scientific Imager (SynenTec GmbH, Elmshorn, DE). To analyze the number of nuclei, every day three wells per each cell variant were dyed using Hoechst 33342 staining (1:5000; Thermo Fisher, Carlsbad/California, US). The examined data were analyzed via nonlinear regression (curve fit) to maintain the growth rate (κ) for logistic growth for the nuclei count analysis (kNuclei count) (YT®-Software (SYNENTEC GmbH, Elmshorn, DE) in GraphPad Prism 9.5.0 (GraphPad Software, California, US).

Treatment response analysis

Panc1 and Panc89 cell variants were seeded at 5 × 10⁴ cells/well in duplicates in 96-well plates. After 24h, cells were left untreated for control or treated with 0.0038 µM of the standard cytostatic drug Gemcitabine. After 72h, cells were stained with Hoechst 33342 (1:5000; Thermo Fisher, Carlsbad/California, US) and nuclei were counted using the NYONE® Imager (YT®-Software (SYNENTEC GmbH, Elmshorn, DE). Nuclei count data of treated cells were normalized to untreated cells.

Migration assay

To analyze cell migration of Panc1 and Panc89 cell variants, two-chambered silicone inserts by Ibidi® (Ibidi GmbH, Martinsried, DE) with a defined cell-free gap were used. Before use, inserts were pre-warmed at 37°C for about 30 min and then placed into wells of a 24-well plate. Per each chamber of an Ibidi® insert, 5 × 10⁴ PDAC cells were seeded in a volume of 75 - 100 µl Panc-medium and incubated for at least 24h or to a cell confluence of approximately 100%. Afterward, inserts were removed resulting in a cell-free gap between the cell layer of both chambers and wells were refilled with 1 ml of FCS-free Panc-medium.
Migration behavior was determined by measuring cell confluence on the cell-free gap over a period of 32h using the CELLAVISTA®/NYONE® Imager and the YT® Wound healing-operator (both SynenTec GmbH, Elmshorn, DE). Measuring intervals were 8h and the plate was stored in the incubator at 37°C, 5% CO2 and 85% relative humidity during the time between measurements. Migration rate was determined by measuring the cell confluence within the gap. Initially, the operator measured opposing areas at the edge of the gap and reported the cell confluence at this starting point as being between 10-20%. Throughout the experiment, the cell confluence was evaluated to this initial value with an increase in cell confluence within the gap defined as migration. If no migration occurred, the cell confluence within the gap remained unchanged.

Invasion assay

The invasive behavior of Panc1 and Panc89 cell variants was analyzed in spheroid invasion assays. For this purpose, 5 × 10³ cells/well were seeded in 96-well ultra-low-attachment plates (Corning, Kennebunk ME, US; faCellitate, Mannheim, DE) in 200 µl Panc-medium enabling spheroid formation. Directly after seeding, the plate was centrifuged. After spheroid formation for 48h, 150 µl of cell Panc-medium was removed from each well and replaced by 50 µl Matrigel (Corning, New York, US) to achieve a protein concentration of 6.25 mg/l. After addition of Matrigel, the plate was centrifuged and incubated at 37°C, 5% CO2 and 85% humidity. After 30 min, the first imaging was performed using NYONE® Scientific imaging device and the YT® Spheroid invasion-operator. Duration for monitoring cell invasion was chosen according to the invasive behavior of the PDAC cell variants. To account for these differences, Panc1 cell variants were imaged at time point 0, 24, 48, 72h, while Panc89 cell variants were measured at time point 0h as well as after 5 and 7 days. Determination of invasive fronts was carried by counting the number of protruding cells or cell clusters in each spheroid in the image data generated by the NYONE® Scientific Imager (YT®-Software, SynenTec GmbH, Elmshorn, DE). Invasive distances were measured using a digital measuring instrument integrated into the YT®-Software. Specifically, the invasive distance was determined by utilizing a green-marked circle corresponding to the spheroid diameter as the starting point, while the distal edge of the cells facing away from the spheroid was designated as the end point of maximum invasion.

Adhesion assay

To analyze cell adhesion of Panc1 and Panc89 cell variants, 1× 10⁵/well HuLEC-5a, Met-5a or TMNK-1 cells, each diluted in 200 µl of their respective medium, were seeded in a 96-well plate. After 24h, Panc1 and Panc89 cell variants were added. Before, 5 × 10⁵ cells/ml PDAC cells were suspended in FCS-free Panc-medium and stained with CellTracker Green CMFDA (5-chloromethylfluorescein diacetate, diluted 1:2000, Thermo Scientific, Schwerte, DE) for 30 min at 37° C under consistent agitation.
After staining, cells were washed with Panc-medium and seeded at 1 × 10⁴ cells/well in 200 µl Panc-medium onto HuLEC-5a, Met-5a or TMNK-1 cells. Afterward, plates were centrifuged at 300× g for 5 min at RT to ensure subsequent contact of all PDAC cells to endothelial or mesothelial cells. Immediately thereafter, the plate was measured in the NYONE® Imager (SynenTec GmbH, Elmshorn, DE), determining the maximal fluorescence count of PDAC cells (t = 0h). To determine the fluorescence of PDAC cells adhered to the endothelial or mesenchymal cells, measurement was performed after 4h. Before measuring, medium containing non-adhered PDAC cells was removed from the wells and replaced with fresh Panc-medium. The number of fluorescent cells at 4h was compared to the number of fluorescent cells at time 0 h to determine the adhesion rate. The adhesion rate was calculated as percentage of adherent cells by dividing the number of fluorescent cells at each time point by the number of fluorescent cells at time 0h.

Tumorigenicity assay in vivo

All animal studies were executed in compliance with the European guidelines for care and use of laboratory animals and approved by local authorities (V242-44598/2018 (80-8/18)). The tumorigenicity assay for Panc1 Holo- and Paraclone cells was already performed [41]. The analysis of tumorigenicity and metastatic behavior of Panc89 Holo- and Paraclone cells was performed accordingly [41]. For this purpose, 1 × 10⁴ cells of either Panc89 Holo- or Paraclone cells were diluted in 75 µl PBS and intrasplenically inoculated in 8-week-old, female SCID-beige mice (each group n = 10) (Charles River, Sulzfeld, DE). Progression of tumor formation was monitored regularly by palpation and abdominal ultrasound examination using Vevo 770 (FUJIFILM VisualSonics Inc., Toronto, CA). Mice were sacrificed depending on tumor burden and general health condition. Organs and tumors were fixed in 4% PBS-buffered formalin and embedded in Paraffin for sectioning and immunohistological examination.

Immunohistochemical staining of Paraffin-embedded tissue sections

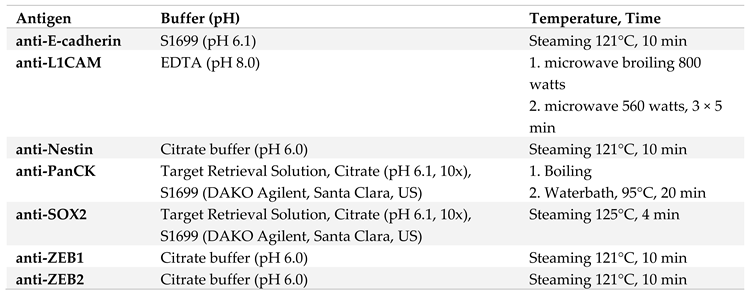
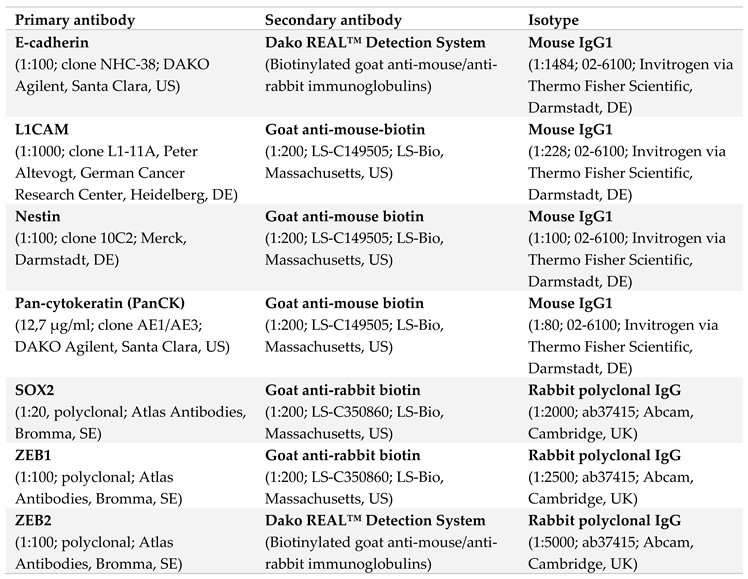
Formalin-fixed and Paraffin-embedded (FFPE) organs and tumors from Panc1 or Panc89 Holo- or Paraclone cell inoculated mice were used for immunohistochemical (IHC) analysis. Antigen retrieval was performed as listed in Table 2 and tissue sections were stained with antibodies listed in Table 3. Incubation of anti-PanCK, anti-L1CAM, anti-ZEB1, anti-Nestin and anti-SOX2 was performed 1h at RT (30 min for anti-E-cadherin), followed by 30 min incubation at RT for all secondary antibodies (15 min for ZEB2 secondary antibody).
IHC sections were digitalized (Axioscan Z1, Carl Zeiss AG, Jena, DE) and stainings were analyzed using ZEN3.3 software (Carl Zeiss AG, Jena, DE). To quantify IHC staining of tumors, a tumor score was defined to characterize tumors in terms of percentage of positive stained cells (Frequency) and staining intensity (Intensity). The Frequency score was set from 1-4, Intensity score was set from 1-3 (Table 4).

Statistical analysis

The statistical evaluation was carried out using GraphPad Prism (Version 9.5.0 (GraphPad Software by Docmatics, San Diego, California). All data sets were tested for normal distribution using Shapiro-Wilk test.
Parametric data including multiple groups were tested by one-way analysis of variance (one-way ANOVA) for statistical significance. Non-parametrical datasets of multiple groups were analyzed with Kruskal-Wallis one-way ANOVA on ranks test. Statistically significant differences between the groups were assumed at p-values ≤ 0.05 according to Student-Newman-Keuls method (parametric data) and Dunn’s method (non-Parametric data), respectively.
Graphs of parametric data were presented by mean with standard deviation or mean with standard error of means (depending on technical and biological replicates), while graphs of non-parametric data were presented by median with (interquartile) range. Students t-test was used to examine two samples of normally distributed data.
Columned data sets were analyzed using one-way-ANOVA plus Tukey´s multiple comparisons test for parametric data and Kruskal-Wallis test plus Dunn´s multiple comparisons test for non-parametric data. Grouped data sets were analyzed using two-way-ANOVA and Tukey´s multiple comparisons test. Growth curve experiments were analyzed via nonlinear regression (curve fit) to maintain the growth rate (κ) for logistic growth.
Survival analysis was performed by Kaplan-Meier-Survival analysis with curve comparison and Mantel-Cox log-rank test, resulting in significantly different survival curves with a p-value of ≤ 0.001 (***).
Statistical significance was defined at a p-value of ≤ 0.033. Significances are indicated by asterisks: p ≤ 0.033= *, p ≤ 0.002= **, p ≤ 0.001= ***.

3. Results

3.1. In vitro analysis of Panc1 and Panc89 cell variants

3.1.1. Panc1 and Panc89 cell variants exhibit differences in colony formation ability

From the two parental PDAC cell lines (Panc1 and Panc89), each representing a heterogeneous cell population with different cell clones, Holo- and Paraclone cell lines were generated via single-cell cloning. First, we comparatively analyzed the colony formation ability of parental Panc1 and Panc89 as well as Holo- and Paraclone cell variants, being indicative for the cellular self-renewal properties. Figure 1A depicts typical colony morphologies of Holoclones and Paraclones in the three cell variants of each PDAC cell line.
The total number of colonies/well formed by Panc1 Holo- and Paraclone cells was lower compared to Panc89 Holo- and Paraclone cells, while the total number of colonies formed per well by parental Panc1 and Panc89 cell variants was comparable (12 and 11, respectively). Parental Panc1 cells formed 2 Holo- and 10 Paraclone colonies, while parental Panc89 cells gave rise to 8 Holo- and 3 Paraclone colonies, indicating a dominance of Paraclones and Holoclones in Panc1 and Panc89 cell lines, respectively. Panc1 Holoclone cells formed a total of 9 colonies and Panc1 Paraclones formed 11 colonies per well. Contrary, Panc89 Holoclone cells formed a total of 102 colonies, presenting a ~10-fold increase in colony numbers compared to Panc1 Holoclone cells. Panc89 Paraclones formed 51 colonies per well, thus~5-fold more compared to Panc1 Paraclone cells (Figure 1B). Regarding the offspring colony type, parental Panc1 cells and Panc1 Paraclone cells predominately formed Paraclone colonies, while Panc1 Holoclone cells, even though few colonies were formed overall, primarily gave rise to Holoclone colonies (Figure 1A). On the other hand, parental Panc89 cells as well as Holo- and Paraclones, primarily formed Holoclone colonies (Figure 1B). However, Panc89 Holoclone cells brought up the highest number of colonies (n = 102), from which most of the colonies were Holoclones (n = 96) and only 6 Paraclone colonies (Figure 1B). Compared to these results, Panc1 Holoclone cells formed a total amount of 9 colonies, consisting of about 8 Holoclone colonies and 1 Paraclone colony only. Overall, these data indicate a distinct CSC-phenotype of both Panc1 and Panc89 Holoclone cells (Figure 1B). Furthermore, Panc1 Paraclone cells formed a total of 11 colonies, all of them exhibiting a typical Paraclone morphology, being indicative of their distinct non-CSC-phenotype. In contrast, the phenotype of Panc89 Paraclone cells was not that clear as these cells gave rise to 16 Paraclones but also 35 Holoclones, pointing to a high plasticity of this cell population.
Overall, these findings indicate a high heterogeneity with respect to self-renewal capacity between both parental PDAC cell lines but also between the generated Holo- and Paraclone cells.

3.1.2. Parental Panc1 and Panc89 as well as their derived Holo- and Paraclone cells show distinct transcriptional CSC and EMT signatures

Next, the different cell variants were characterized by transcriptomic analysis. In total, 10,429 out of 17,354 detected genes were differentially regulated between parental Panc1 and Panc89 cell lines. A Principal Component Analysis (PCA) on the 10% most variable transcripts of all samples arranges all cell lines along the highest (PC1) and the cell clones orthogonally along the second highest principal component (PC2), with a variance of about 77% and 7%, respectively (Figure 2A). These findings indicate distinct transcriptional signatures for parental Panc1 and Panc89 cells and consistent but smaller gene expression changes between Holo- and Paraclones, irrespective of their origin from Panc1 or Panc89 cells.
Next, a pathway enrichment of sequenced RNA samples from parental Panc1 and Panc89, Holo- and Paraclone cells was performed in order to evaluate differences in the Reactome and stemness pathway activities. Gene sets from the Molecular Signatures Database collection C2 [54], selected for Reactome pathways and a stemness gene set “MUELLER PLURINET” were evaluated via Gene Set Enrichment Analysis (GSEA). A GSEA on parental cell lines Panc1 and Panc89 indicated a stronger Interferon signaling, DNA methylation, and senescence activity in the latter cells. In contrast, parental Panc1 cells showed more cilium assembly, transport, autophagy, and mitotic processes (Supplementary Figure 1A). Comparative analysis of Panc1 Holo- and Paraclone samples revealed Holoclone cells to have increased activity of mRNA splicing, DNA repair, chromatin modifying enzymes, transcriptional regulation by TP53, cell cycle checkpoints, and Mueller Plurinet, the latter being a strong indicator for stemness properties [55]. Panc1 Paraclones, on the other hand, showed increased activity of ECM matrix organization and neutrophil degranulation (Supplementary Figure 1B). Panc89 Holoclones were characterized by increased activity of different mitotic phases, cell cycle checkpoints, organelle biogenesis and maintenance, and transcriptional regulation of TP53 and also Mueller Plurinet, while Panc89 Paraclones were characterized mostly by increased activity for neutrophil degranulation (Supplementary Figure 1C). In summary, parental Panc1 and Panc89 cells showed major differences in their pathway activities and also between the derived Holo- and Paraclone cells distinct differences could be observed.
GSEA performed on the marker genes described for PDAC subtypes according to Moffitt et al. [56] revealed that Panc89 cell variants exhibit gene features related to both the classical-like and basal-like PDAC subtypes, with a stronger tendency towards the basal-like subgroup. Contrarily, the expression pattern of Panc1 cell variants could not be clearly assigned to either subtype, but showed a tendency towards the classical subgroup. The transcriptome profile of parental Panc89 cells indicated immune cell pathways from dendritic cells, mast cells or neutrophils. Contrarily, the parental Panc1 cells were enriched for cell cycle markers with a significant regulation of mitotic processes (Supplementary Figure 1D). Overall, these data indicate that both PDAC cell lines and their derived CSC- and non-CSC population cannot be clearly assigned to the described PDAC subtypes.
Next, gene sets that are associated with positive or negative regulation of the EMT program and invasion properties [57] were comparatively analyzed for all cell variants via Gene Set Variation Analysis (GSVA). The analysis revealed a clearly positive regulation of EMT and invasion in parental Panc1 cells, while parental Panc89 cells showed a rather negative regulation of EMT. Panc1 cell lines were further characterized by highly invasive properties, reflected by the upregulation of genes that positively regulate EMT and invasion (Figure 2B). Further, Panc1 Holoclone cells also showed a trend towards positive EMT regulation, which could not be determined for Panc1 Paraclone cells. Parental Panc89 cells showed an overall low but significant increase of positive regulation of invasion compared to Panc89 Holoclones and Panc89 Paraclones. For the analysis of CSC properties for all analyzed cell variants the Mueller Plurinet gene set was used. Comparing the stemness characteristics in Panc1 cell variants it was found that Panc1 Holoclone cells showed the strongest CSC properties, followed by Panc1 parental cells. Panc1 Paraclone cells showed the weakest CSC characteristics of all Panc1 cell variants. In Panc89 cell variants it could be determined that parental Panc89 cells showed significantly higher CSC activity compared to Panc89 Paraclones, while for CSC activity between parental Panc89 cells and Panc89 Holoclone cells no significant differences could be observed (Figure 2B).
Moreover, clear differences in EMT and CSC characteristics in the cell variants analyzed were determined as exemplified by high expression of NES, VIM, L1CAM and ZEB1 in Panc1 cells, and CDH1, SOX2 and OVOL2 in Panc89 cells (Figure 2C). In detail, all Panc1 cell variants expressed similar amounts of the mesenchymal markers VIM and L1CAM and the EMT-inducer ZEB1. Expression of the CSC-marker NES was highest in parental Panc1 cells, followed by Panc1 Holoclones, and lowest in Panc1 Paraclones (Figure 2C). Contrarily, all Panc89 cell variants expressed similar amounts of the epithelial marker CDH1 (E-cadherin). Furthermore, parental Panc89 cells and Panc89 Paraclone cells both expressed similar levels of L1CAM, while Panc89 Holoclone cells showed only faint L1CAM expression. Moreover, Panc89 Paraclones were found to express higher levels of the mesenchymal marker VIM and the EMT-inducers ZEB1 and ZEB2 compared to parental Panc89 and Holoclone cells. Regarding the expression of CSC-markers, it was found that parental Panc89 and Panc89 Paraclone cells expressed similar levels of OVOL2, whereas SOX2 was similarly expressed in both parental Panc89 and Panc89 Holoclone cells (Figure 2C).
To confirm the transcriptomic differences regarding EMT and CSC characteristics identified by RNA sequencing, RNA expression of CSC- and EMT-markers was analyzed in parental as well as Holo- and Paraclone cell variants of Panc1 and Panc89 cells by qPCR. Thus, expression of the CSC-markers NES, SOX2 and OVOL2 was analyzed along with the EMT-markers CDH1, L1CAM, VIM, ZEB1 and ZEB2.
Whereas NES was highly expressed in parental Panc1 cells and Panc1 Holoclones, it could not be detected in any cell population of Panc89 cells. In Panc1 Paraclone cells, NES expression was detectable, but only in low amounts (Figure 2D). On the other hand, SOX2 expression was nearly not detectable in all Panc1 cell lines but SOX2 was highly expressed in Panc89 Holoclone cells, moderately expressed in parental Panc89 cells, and nearly not detectable in Panc89 Paraclone cells (Figure 2D). OVOL2 was higher expressed in all Panc89 cell variants compared to Panc1 cell variants but with distinct differences between the clones. It was moderately expressed in parental Panc1 cells and Holoclone cells, but not in Panc1 Paraclone cells. In contrast, OVOL2 expression was highest in parental Panc89 cells, followed by Paraclone cells and Panc89 Holoclone cells exhibiting the lowest OVOL2 expression among all Panc89 cell variants, but still higher expression compared to any Panc1 cell line (Figure 2D). While CDH1 expression was almost undetectable in all Panc1 cell variants, it was clearly expressed in all Panc89 cell variants, not showing any significant differences in the expression level (Figure 2E). An inverse expression pattern of mesenchymal markers L1CAM and VIM was detectable in two PDAC cell lines (Figure 2E). All Panc1 cell variants showed higher expression of L1CAM and VIM compared to Panc89 cell variants, with parental Panc1 cells exhibiting the highest expression of both markers. Compared to the Panc89 cell variants, Panc89 Paraclone cells showed the highest expression of either mesenchymal marker compared to parental and Holoclone cells (Figure 2E). Finally, the expression of the two EMT transcription factors ZEB1 and ZEB2 was analyzed. Although ZEB1 expression was generally low in all PDAC cells, it was significantly higher expressed in all Panc1 cell variants compared to Panc89 cell variants (Figure 2F). While no differences in the expression levels could be determined between the three Panc1 cell variants, Panc89 Paraclone cells exhibited higher ZEB1 expression compared to parental and Holoclone cells. Regarding ZEB2 expression, the highest expression was detectable in Panc1 Holoclone cells, followed by expression in Panc89 Holoclone cells. All other cell variants from Panc1 and Panc89 cells exhibited a rather low expression (Figure 2F).
Finally, double IFS were performed to confirm gene expression differences on protein level and to discriminate Holo- and Paraclone cells in the respective parental population. Since Panc1 Holo- and Paraclone cells showed differences in their NES and ZEB2 expression status, while Panc89 Holo- and Paraclone cells clearly differed regarding their expression of SOX2 and L1CAM, these markers were stained in IFS.
The parental Panc1 cell population comprised cells exhibiting both Nestin and ZEB2 expression but also cells lacking both markers, supporting the view of a heterogeneous cell population consisting of CSC- and non-CSC (Figure 2G). In line with the gene expression status, clear differences were determined between Panc1 Holo- and Paraclone cells with Panc1 Holoclone cells being clearly positive for Nestin and ZEB2, while Panc1 Paraclone cells lacked expression of both markers (Figure 2G). Analysis of SOX2 and L1CAM in parental Panc89 cells revealed expression of both markers, but showed no co-expression pattern of SOX2 and L1CAM within the heterogeneous population, as formed colonies were either positive for SOX2 or L1CAM. In contrast, Panc89 Holoclone cells showed SOX2 positive cells which lacked L1CAM expression, while Panc89 Paraclone cells exhibited strong L1CAM expression but which were SOX2 negative (Figure 2G), being well in line with gene expression status.
Overall, these data indicate the existence of different CSC-phenotypes which can be associated either with a mesenchymal or an epithelial phenotype. While Panc1 Holoclone cells are characterized by mesenchymal stemness phenotype with pronounced expression of the CSC-marker Nestin, Panc89 Holoclone cells are characterized by an epithelial SOX2 dominated stemness phenotype.

3.1.3. Panc89 cell variants show enhanced cell growth rates compared to Panc1 cell populations and differ with respect to responses to chemotherapeutic treatments

Having identified different CSC-EMT-phenotypes, we next analyzed their functional behavior in comparison to their parental population and the non-CSC-population. First, we analyzed the cell growth behavior of parental Panc1 and Panc89 cells as well as their derived Holo- and Paraclone cell lines by measuring nuclei counts over a time period of 168h.
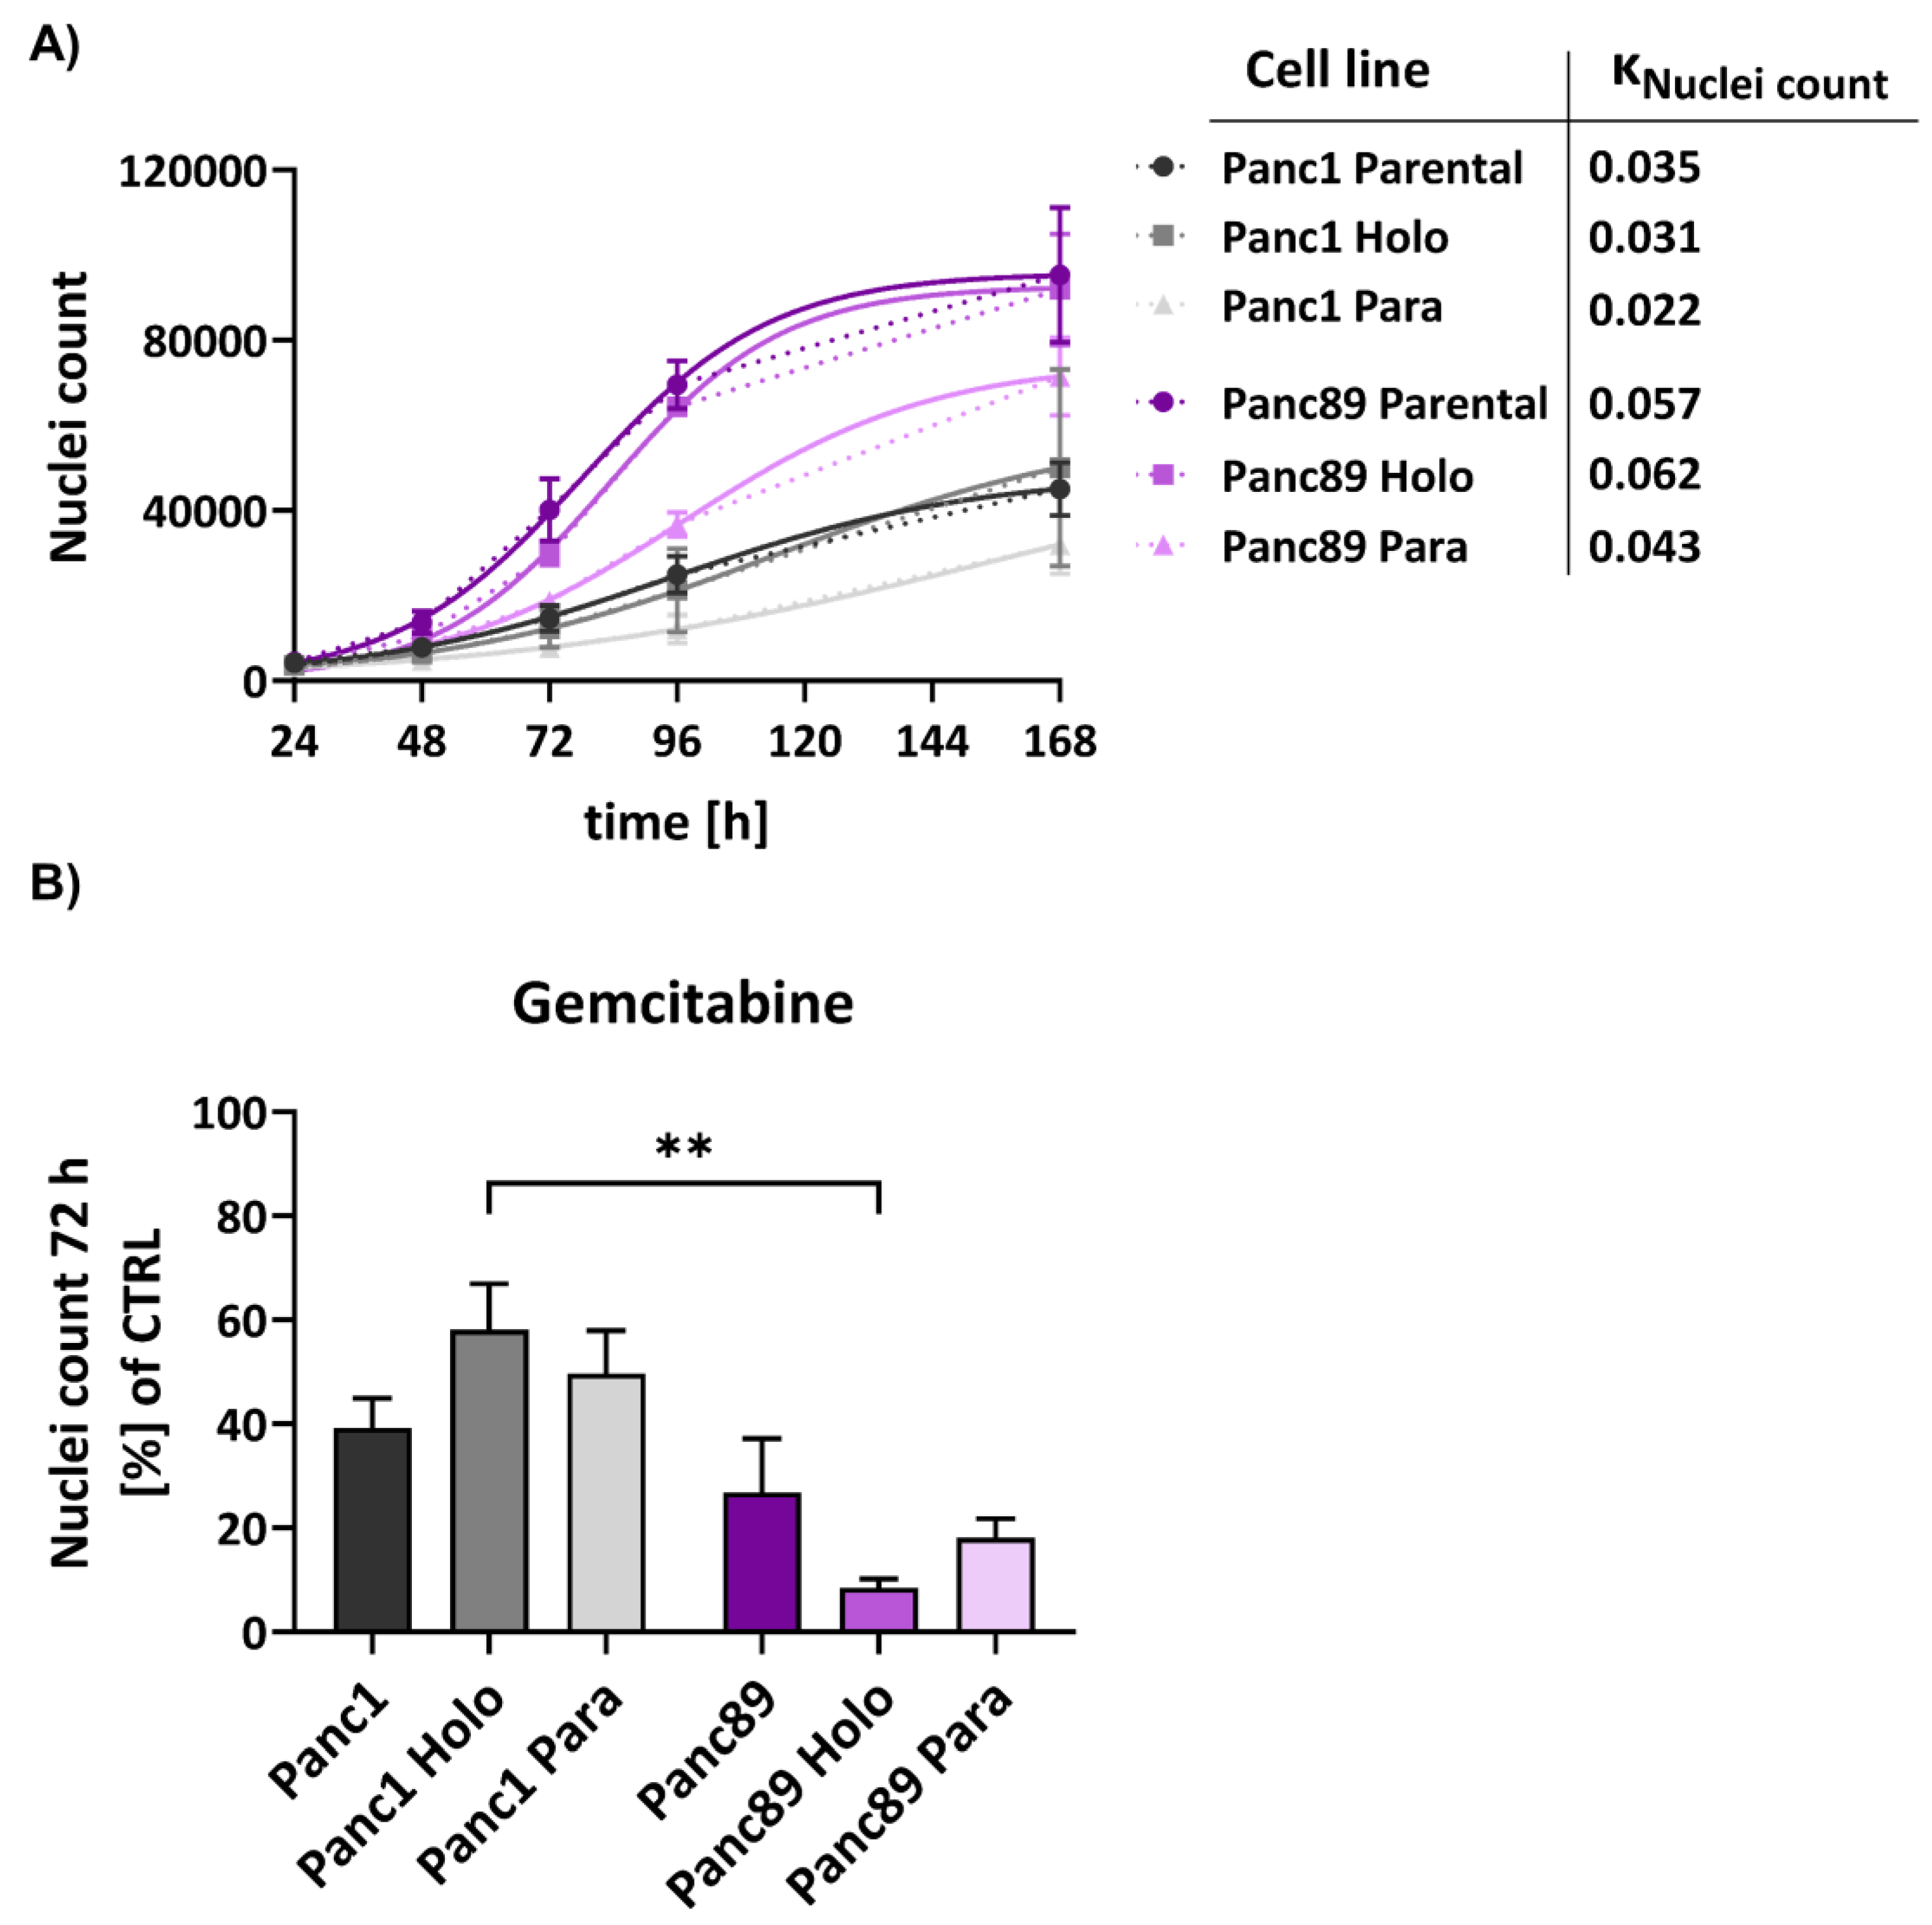
Comparing growth rates of parental Panc1 and Panc89 cells revealed that Panc89 cells grew 38.6% faster than Panc1 cells, with 0.057 kNuclei count for parental Panc89 cells and 0.035 kNuclei count for parental Panc1 cells. Furthermore, also Panc89 Holo- and Paraclones showed faster cell growth (0.062 kNuclei count and 0.043 kNuclei count, respectively) compared to Panc1 Holo- and Paraclone cells (0.031 kNuclei count and 0.022 kNuclei count, respectively) (Figure 3A). Moreover, Holoclone cells of either cell line grew faster compared to the respective Paraclone cells, so that growth of Panc1 Holoclones was increased by 29% compared to Panc1 Paraclone cells, and Panc89 Holoclone cells grew 30.65% faster than Panc89 Paraclones. Finally, parental Panc1 and Panc89 cell populations grew faster than their derived Holo- and Paraclone cells, despite Panc89 Holoclone cells which showed a slightly increased growth rate compared to parental Panc89 cells (Figure 3A). Overall, these data underscore that mesenchymal PDAC cells exhibit a slowly growing phenotype compared to epithelial PDAC cells, which also applies to the CSC-fraction.
Next, it was analyzed whether these different cell growth abilities are related to different responses to cytostatic drugs. For this purpose, parental Panc1 and Panc89 cells as well as their derived Holo- and Paraclone cell variants were either left untreated or treated with Gemcitabine for 72h. In general, all Panc1 cell variants showed a poorer response towards the cytostatic drug compared to Panc89 cell variants (Figure 3B). Gemcitabine treatment led to a reduction in cell numbers of 40-60% for Panc1 cell variants and 70-90% for Panc89 cell variants. Of note, distinct cell clone dependent variances could be determined. While Panc1 Holoclone cells showed the poorest drug response compared to the other Panc1 cell variants, Panc89 Holoclone cells showed the strongest reduction in cell number after treatment with Gemcitabine compared to parental Panc89 cells and Panc89 Paraclone cells but also compared to all Panc1 cell variants. Altogether, these data indicate a general poorer treatment response of mesenchymal Panc1 cell variants compared to epithelial Panc89 cell variants but which particularly manifested in the CSC population and which correlated with the differences in growth behavior. Thus, these findings suggest that mesenchymal CSC seemed to be even more drug resistant compared to their parental or non-CSC cells, while epithelial CSC responded even better compared to the parental or non-CSC variants further underscoring the heterogeneity among CSC.

3.1.4. Panc1 Holoclone cells are less migratory but highly invasive in a mesenchymal invasion manner, while Panc89 Holoclone cells show pronounced cell migration but slow invasion in clusters

Next, we analyzed the migratory behavior of parental Panc1 and Panc89 and their derived Holo- and Paraclone cells. After 8h, gap cell confluence was less than 20% for all Panc1 cell variants with no differences between parental, Holo- and Paraclone cells (Figure 4A). In contrast, gap cell confluences of all Panc89 cell variants were much higher with Panc89 Holoclone cells leading to the highest cell confluence on gap of 75%. Panc89 Paraclone cells showed only 25% cell confluence while parental Panc89 cells showed about 35% cell confluence on gap, indicating that epithelial Panc89 cells migrated faster than mesenchymal Panc1 cells and particularly the epithelial CSC fraction exhibited the highest migration potential (Figure 4A). Besides these clear differences in the migration velocity, Panc1 and Panc89 cells used different modes of migration fitting together with the different EMT phenotypes. While Panc89 Holoclone cells migrated in cell clusters with high cell-cell contacts, Panc1 Holoclone cells exhibited a mesenchymal-like migration of single cells (Figure 4B).
To analyze invasive properties, all PDAC cell lines were seeded in ULA plates to form spheroids. Initial tests revealed that cell invasion of Panc1 cells is much faster than those of Panc89 cell variants, resulting in a monitoring time of 3 days for Panc1 cell variants and 7 days for Panc89 cell variants, respectively. These findings are well in line with the results from GSEA analysis on invasion associated genes, indicating a higher invasive activity of Panc1 cells compared to Panc89 cells (Figure 2B). Accordingly, Panc1 cell populations formed more aggregate like spheroids indicating lower amounts of tight cell-cell contacts, while Panc89 cell populations formed compact spheroids leading to smaller spheroids of all Panc89 cell variants compared to Panc1 cell populations (Figure 4C). Moreover, the mode of cell invasion clearly differed between Panc1 and Panc89 cells. While Panc1 cell variants showed single cell invasion or invasion in chains of single cells, all Panc89 cell variants invaded as clusters comparable to tumor cell budds [58]. Spheroid sizes of all Panc1 cell variants were about 1000 µm at day 0 and did not considerably change until day 3. In contrast, all Panc89 cell variants formed spheroids of about 300 µm on day 0 which further increased in size up to 500 µm at day 7 (Figure 4C, D). Moreover, huge differences in formation of invasive fronts were detected. While Panc1 cell populations already showed 20 invasive fronts at day 1, with no clear differences between parental, Holo- and Paraclone cells, Panc89 cell populations only exhibited 5 invasive fronts at day 5, which not further changed until day 7 (Figure 4E). Interestingly, the number of invasion fronts declined in Panc1 cells, being most pronounced in the Panc1 Holoclone cells. However, invasion distances concomitantly increased in Panc1 cells, rising from 260-350 µm on day 1 to about 400-500 µm at day 3. In line with the results of the invasion fronts, the most pronounced increase of the invasion distance from day 0 to day 3 was observed in Panc1 Holoclone cells. In contrast, invasion distances of all Panc89 cell variants were much shorter (about 100 µm) and did not change over time (Figure 4F).
Despite the significantly higher cell migration of Panc89 Holoclone cells compared to Panc89 Paraclone cells, no clear differences regarding cell invasion were observed between the respective Holo- and Paraclone cell populations, also applying to the Panc1 cell populations. Overall, these data underscore that the EMT- rather than the CSC-phenotype predominantly determines the migration and invasion mode of PDAC cells. Thus, these data underscore that mesenchymal Panc1 cells use a mesenchymal mode of single-cell migration and invasion, while Panc89 cells exhibiting an epithelial phenotype use rather a cluster-like migration and invasion mode.

3.1.5. Panc1 and Panc89 cell variants only marginally differ regarding organ specific adhesion

As PDAC metastasizes predominantly in liver, lung and peritoneum [4,5,6], it was next analyzed whether the different PDAC CSC populations differ with respect to their adhesion properties to different organs. After 4h, about 70% of Panc1 Paraclone cells adhered to the liver endothelial TMNK-1 cells, which was significantly more than in Panc1 parental and Holoclone cells. Cell adhesion of all Panc89 cell variants was comparable to those of Panc1 parental and Holoclone cells of about 60% (Figure 4G). The largest difference in adhesion behavior could be detected for adhesion to lung endothelium. While only 60% of Panc1 parental, Holo- or Paraclone cells adhered to HuLEC-5a cells, cell adhesion of about 80% of all Panc89 cell variants could be observed. Regarding cell adhesion to mesothelial Met-5a cells no differences were detected for all PDAC cell lines showing 75-80% adhered cells after 4h (Figure 4G). Overall, these findings indicate that the EMT- and CSC-phenotypes of PDAC cells rather marginally impact cell adhesion to organ-specific endothelial cells, despite better adhesion of Panc1 Paraclone cells to liver endothelial cells compared to other Panc1 cell variants and Panc89 cells showed a better adhesion to lung endothelial cells compared to mesenchymal Panc1 cells.

3.2. Tumorigenicity analysis in vivo of Panc1 and Panc89 Holo- or Paraclone cells

3.2.1. Panc1 and Panc89 cell clones essentially differ with respect to their metastatic capacity in vivo

Finally, to assess whether the CSC-/EMT-phenotypes and the associated functional differences identified in vitro are related to differences in their metastatic behavior, a tumorigenicity assay with intrasplenic inoculation of either Panc1 and Panc89 Holo- or Paraclone cells was performed.
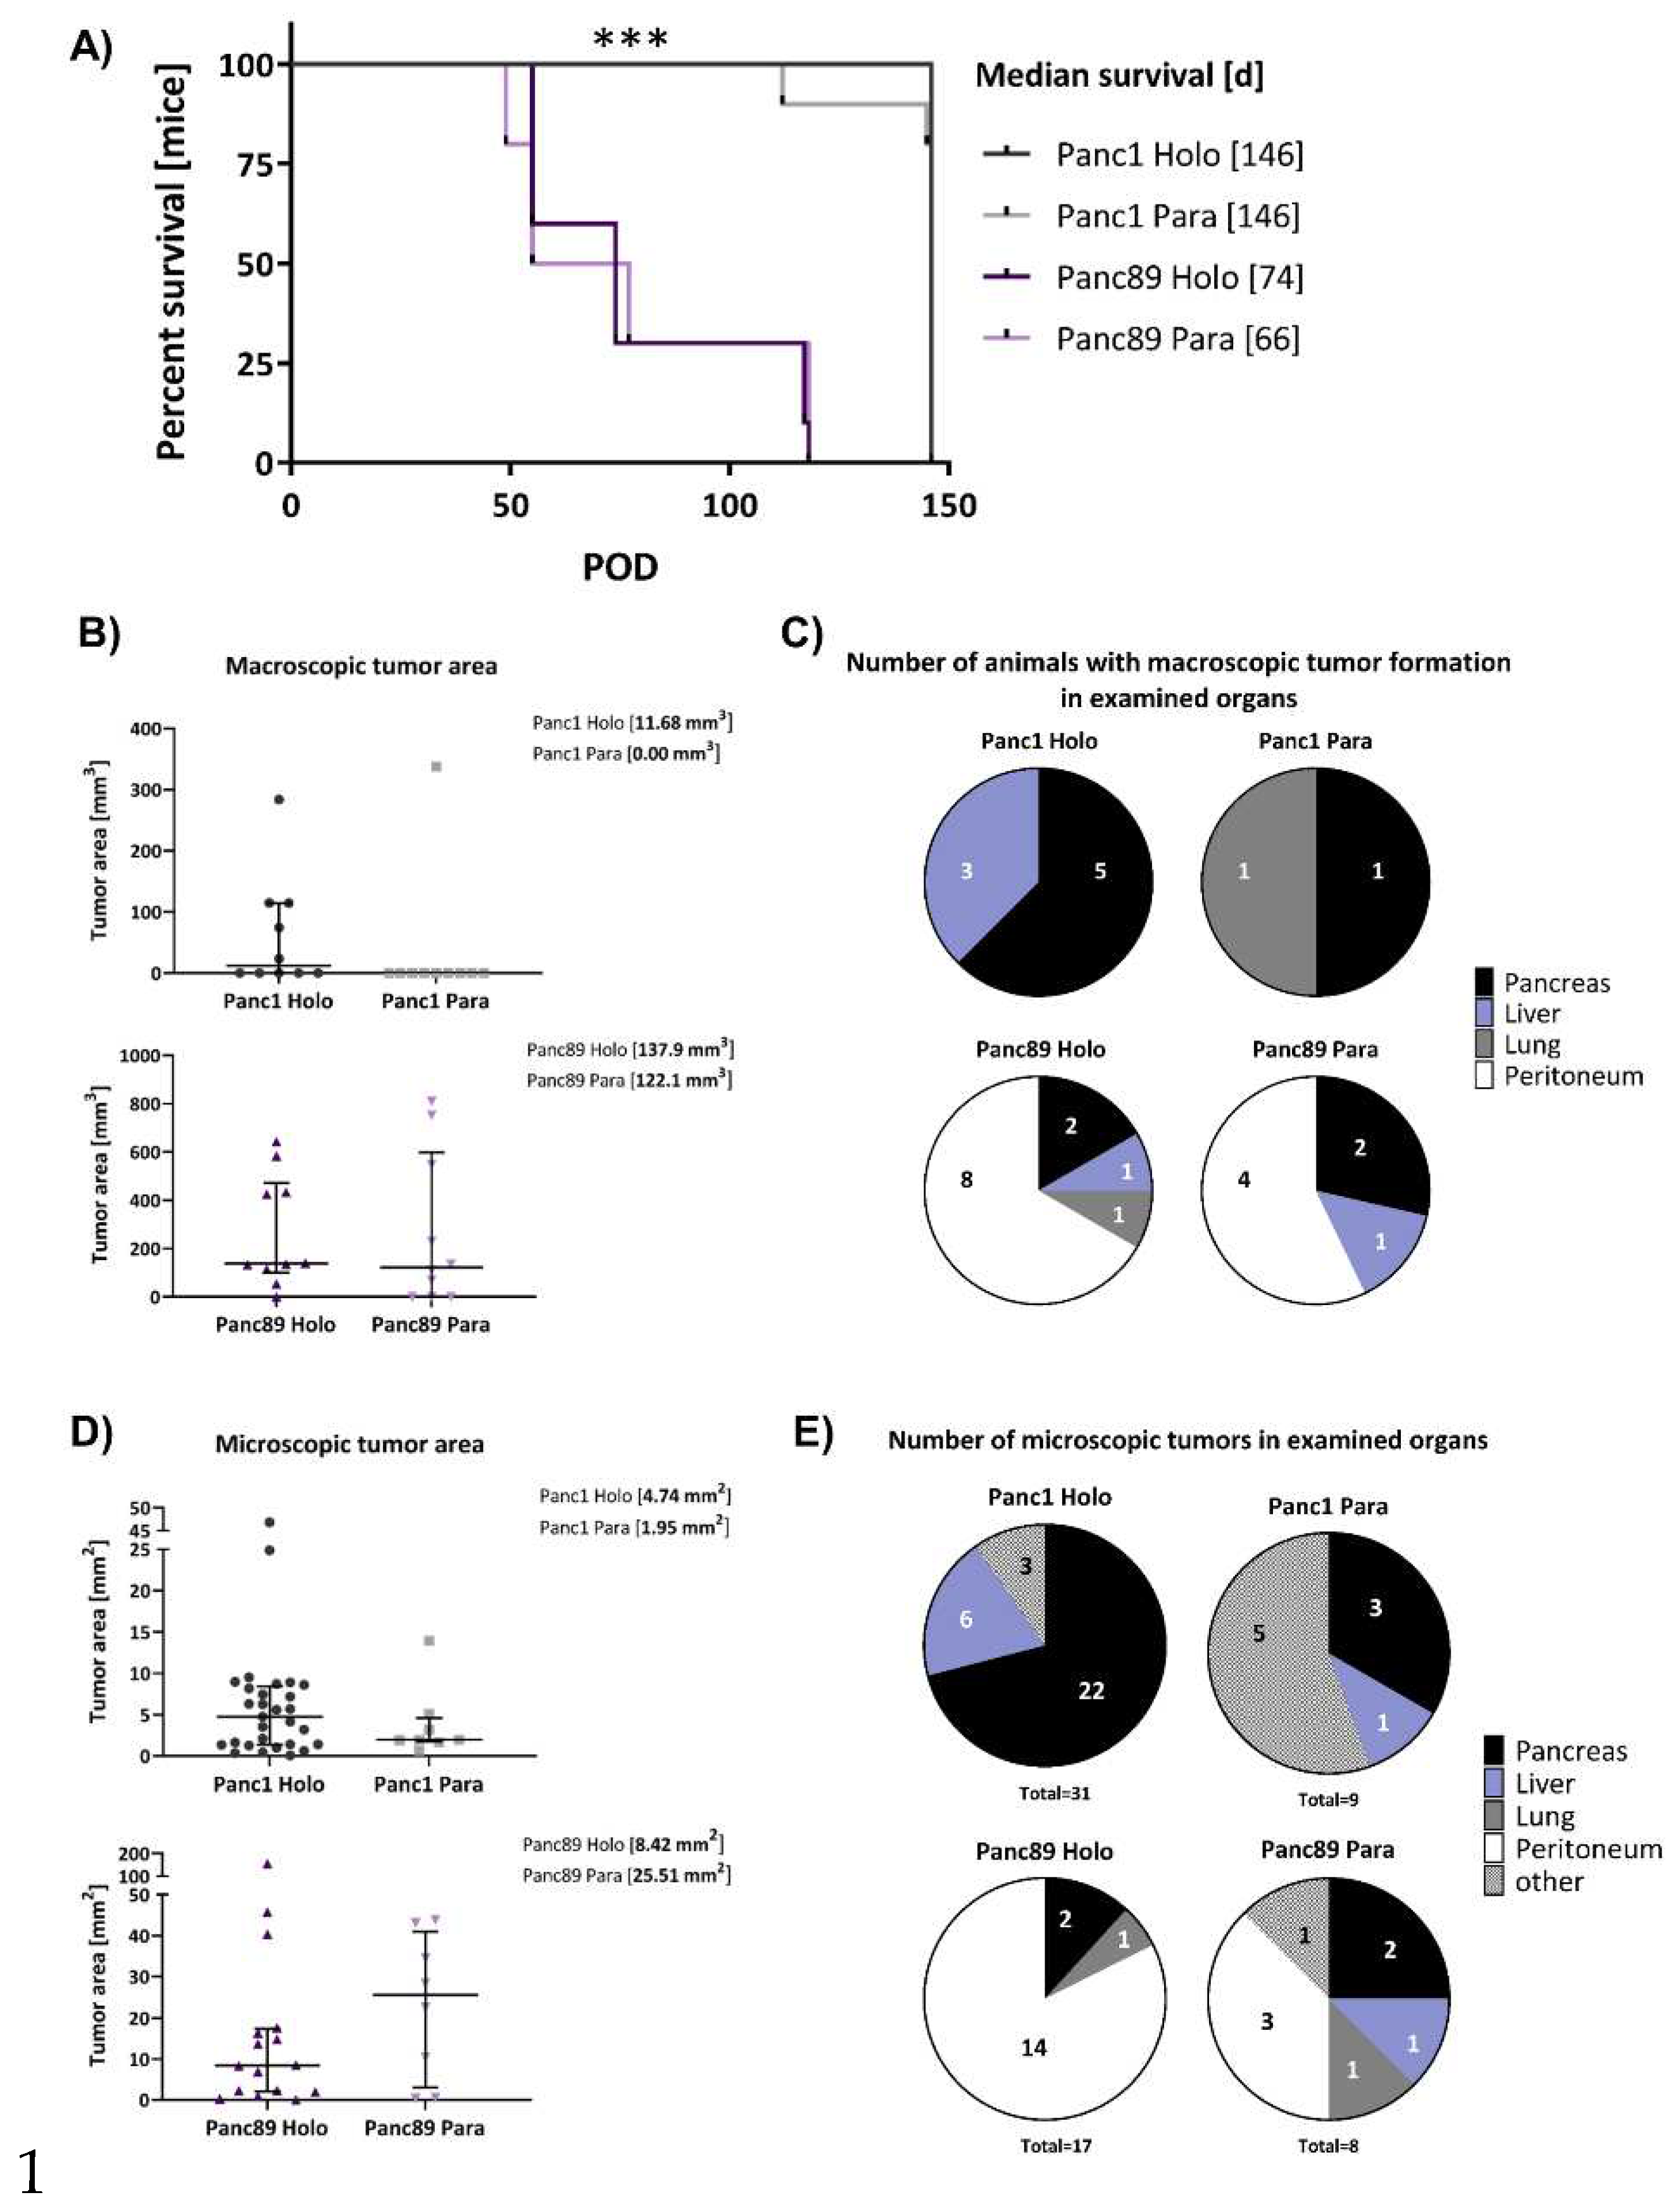
As shown in Figure 5A, animals inoculated with Panc89 Holo- or Paraclone cells survived much shorter than animals inoculated with Panc1 Holo- or Paraclone cells. The median survival of mice inoculated with Panc89 Holoclone cells was 74 days and 66 days for Panc89 Paraclone cells. In comparison, animals inoculated either with Panc1 Holo- or Paraclone cells showed a median survival of 146 days, twice the length of Panc89 Holo- and Paraclone cell inoculated animals (Figure 5A). Of note, animals inoculated with Panc1 cell variants were not killed because of reduced health status due to the tumor burden, but very slow tumor progression terminating the experiment in the end without harming animals included. Moreover, no significant differences in survival could be determined between Holo- and Paraclone cells of the distinct PDAC cell lines. Examination of the macroscopic tumor manifestation revealed clear differences between Panc1 and Panc89 cell variants, as well as between Holo- and Paraclone cells. Ultrasound examination revealed macroscopic tumor formation in 7/10 animals with a median tumor area of 11.68 mm3 for Panc1 Holoclone tumors and in 2/10 animals for Panc1 Paraclones (with no median macroscopic tumor area detectable because one of two tumors could not be measured via ultrasound). In contrast, in 10/10 animals inoculated with Panc89 Holoclone cells, tumors could be detected with a median tumor area of 137.9 mm3 and in 7/10 animals with a median macroscopic tumor area of 122.1 mm3 for Panc89 Paraclone tumors (Figure 5B, C). Thus, the shorter survival times of animals inoculated with Panc89 cell variants were associated with higher tumor burden compared to Panc1 Holo- and Paraclone cells.
Moreover, Panc1 Holo- and Paraclone tumors were predominantly found in the pancreas, but also in liver and lung, while Panc89 Holo- and Paraclone tumors were predominantly detectable in the peritoneum, followed by pancreas, liver, and lung (Figure 5C). In detail, intrasplenic inoculation of Panc1 Holoclone cells led to clearly more tumors compared to Panc1 Paraclone tumors, which were predominantly formed in the pancreas (5/10 animals) and liver (3/10 animals), while inoculation of Panc1 Paraclone cells only led to tumors in pancreas and lung of 1/10 animals (Figure 5C). Macroscopically, inoculation of Panc89 Holoclone cells also led to higher number of tumors compared to Panc89 Paraclone cells and also compared to all Panc1 cell variants. Panc89 Holoclone tumors were found in the peritoneum of 8/10 animals, in the pancreas of 2/10 animals and in the liver and lung of 1/10 animals. Panc89 Paraclone tumors were found in the peritoneum of 4/10 animals, in the pancreas of 2/10 animals and in the liver of 1/10 animal (Figure 5C).
Having determined clear differences regarding the frequency and site of metastases of the differentially inoculated animals, pancreatic, liver, lung and peritoneal tissues were stained for human PanCK (Figure 2A) to assess the microscopical metastatic burden in terms of size and number of formed microscopic tumors.
The size of the microscopic tumors was determined by measuring the PanCK positive areas in the tissues. In line with the size of the macroscopic tumors, the median tumor areas of both Panc89 Holo- and Paraclone tumors were larger than Panc1 Holo- and Paraclone tumors (Figure 5D). Inoculation of Panc89 Paraclone cells led to the largest microscopic tumor areas with a median of about 25 mm2, followed by Panc89 Holoclone tumors with a median tumor area of about 8 mm2. In contrast, Panc1 Holo- and Paraclone cells formed tumors with a median tumor area of less than 5 mm2 (Figure 5D). Besides, it could be noted that 5/8 Panc89 Paraclone tumors were characterized by a pronounced cyst formation (Figure 2B).
Furthermore, intrasplenic inoculation of Panc1 Holoclone cells led to a total of 31 microscopic lesions in 9/10 animals, while only 9 microscopic tumors were found in 8/10 animals inoculated with Panc1 Paraclone cells. Of note, the highest number of microscopic Panc1 Holoclone tumors were found in the pancreas (22/31), while Panc1 Paraclone lesions were mostly found at other sites (brown adipose tissue, duodenum, undefinable in 5/9 metastatic lesions) (Figure 5E). With 17 microscopic tumors in 10/10 mice the number of microscopic Panc89 Holoclone tumors was much lower compared to Panc1 Holoclones, and organ manifestation was also very different as most tumors were found in the peritoneum (14/17 metastatic lesions) like the macroscopic tumors (Figure 5E). The number of animals with Panc89 Paraclone tumors and the total number of microscopic lesions were similar to Panc1 Paraclone cells. Inoculation of Panc89 Paraclone cells gave rise to 8 microscopic tumors in 7/10 animals (Figure 5E). Here, a slightly higher prevalence of tumor formation in the peritoneum compared to other sites was detectable (3/8 lesions).
Overall, inoculation of Panc89 Holo- and Paraclone cells led to a more pronounced metastatic burden in terms of larger metastases which predominantly manifested in the peritoneum compared to Panc1 Holo- and Paraclone cells which led to smaller tumors mostly in the pancreas. Higher tumor burden after inoculation of Panc89 Holo- and Paraclone cells was associated with significantly shorter survival times. However, inoculation of Panc1 Holoclone cells led to the highest total number of tumoral lesions, being in line with the more pronounced invasive phenotype of the cells. The fact that Panc89 Paraclone cells also led to a pronounced tumor burden which was not observed for the two Panc1 cell variants underscores a higher plasticity of these cells. Altogether, these findings indicate clear differences in the metastatic capacity of mesenchymal and epithelial/hybrid CSC populations, respectively.

3.2.2. Panc1 and Panc89 Holo- and Paraclone tumors exhibit differences in EMT- and CSC-marker expression

To verify the in vitro identified CSC-EMT-phenotypes of Panc1 and Panc89 Holo- and Paraclone cells in vivo, IHC staining of resected tissues was performed to analyze the expression of the CSC-markers Nestin and SOX2 as well as the EMT-markers E-cadherin, L1CAM, ZEB1 and ZEB2. To identify human PDAC cells, staining of human PanCK was performed. PanCK staining of tumors revealed different morphologies of Panc1 and Panc89 Holo- and Paraclone tumors. While Panc1 Holo- and Paraclone tumors were characterized by a scattered arrangement of single tumor cells, Panc89 Holo- and Paraclone tumors showed the arrangement of positively stained cell clusters. Especially Panc89 Holoclone tumors presented distinct PanCK positive cell clusters, surrounded by tumor stroma. Cell clusters in Panc89 Paraclone tumors were larger, with less intense PanCK staining, but huge tumor stromal areas (Supplementary Figure 2A).
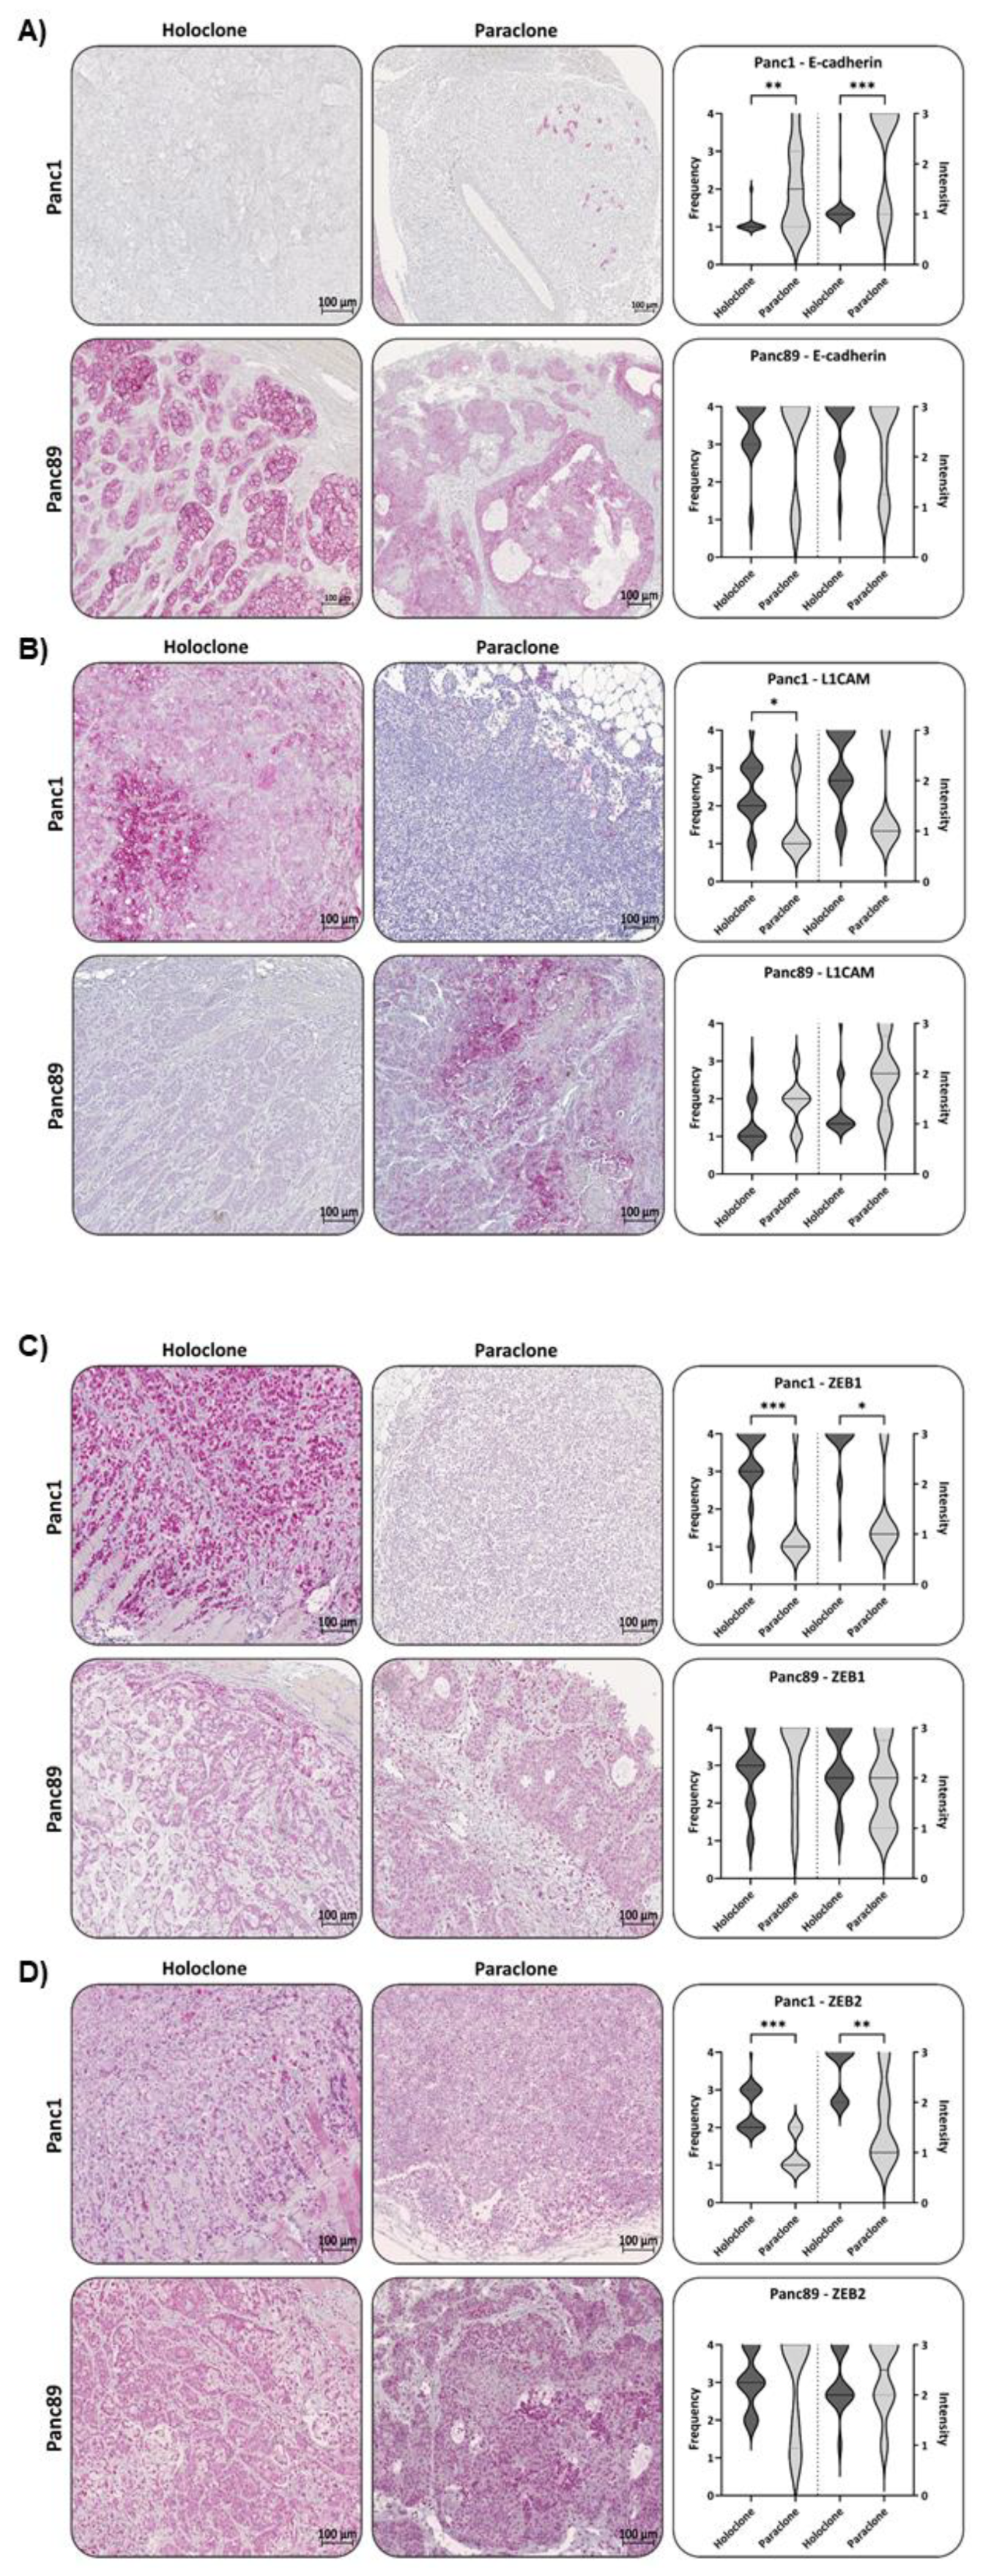
Confirming gene expression data, Panc1 Holoclone tumors showed negative to low expression of E-cadherin in analyzed tissues (Figure 6A). Panc1 Paraclone tumors showed a slight but significant increase of E-cadherin expression with a Frequency- and Intensity score of 2 compared to Panc1 Holoclone tumor tissues (Figure 6A). In Panc89 Holo- and Paraclone tumors, E-cadherin was highly expressed (Frequency and Intensity score of about 4) with no considerable differences between Holoclone and Paraclone tumors (Figure 6A).
L1CAM expression of Panc1 Holoclone tumors was scored with a Frequency of around 2 (Intensity score 1), while Panc1 Paraclone cells showed a significantly lower L1CAM expression (Frequency- and Intensity score 1, Figure 6B). In contrast, Panc89 Holoclone tumors showed a very faint expression of L1CAM compared to Panc89 Paraclone tumors, exhibiting the highest L1CAM expression of all tumors analyzed (Frequency and Intensity score of 3 and 2) (Figure 6B). However, in some Panc89 Holoclone tumors, L1CAM expression could be noted (Supplementary Figure 3).
IHC analysis of ZEB1 in Panc1 and Panc89 Holo- and Paraclone tumors revealed that Panc1 Holoclone tumors exhibited strong ZEB1 expression (Frequency and Intensity score 4) while Panc1 Paraclone tumors were characterized by low to negative ZEB1 expression (Figure 6C), which was not in line with the ZEB1 gene expression of the cells in vitro demonstrating similar RNA levels of ZEB1 in both Panc1 cell variants. In both Panc89 Holo- and Paraclone tumors high ZEB1 expression with a Frequency and Intensity score of 3-4 was noted (Figure 6C), which also differed from absent ZEB1 gene expression in Panc89 Holo- and Paraclone cells in vitro. Of note, ZEB1 and ZEB2 expression were mostly located in the nuclei indicative for their functional activity, and both markers could not only be detected in PDAC cells but also in stroma cells. Panc1 Holoclone tumors showed a significantly higher expression of ZEB2 (Frequency score of 2-3 and Intensity score of 1) compared to Panc1 Paraclone tumors exhibiting no or only weak expression of ZEB2 (Frequency and Intensity score of 1, Figure 6D). Panc89 Holoclone tumors showed a slightly lower ZEB2 expression (Frequency and Intensity score 3/2) compared to Panc89 Paraclone tumors with a Frequency and Intensity score of 4/3 (Figure 6D).
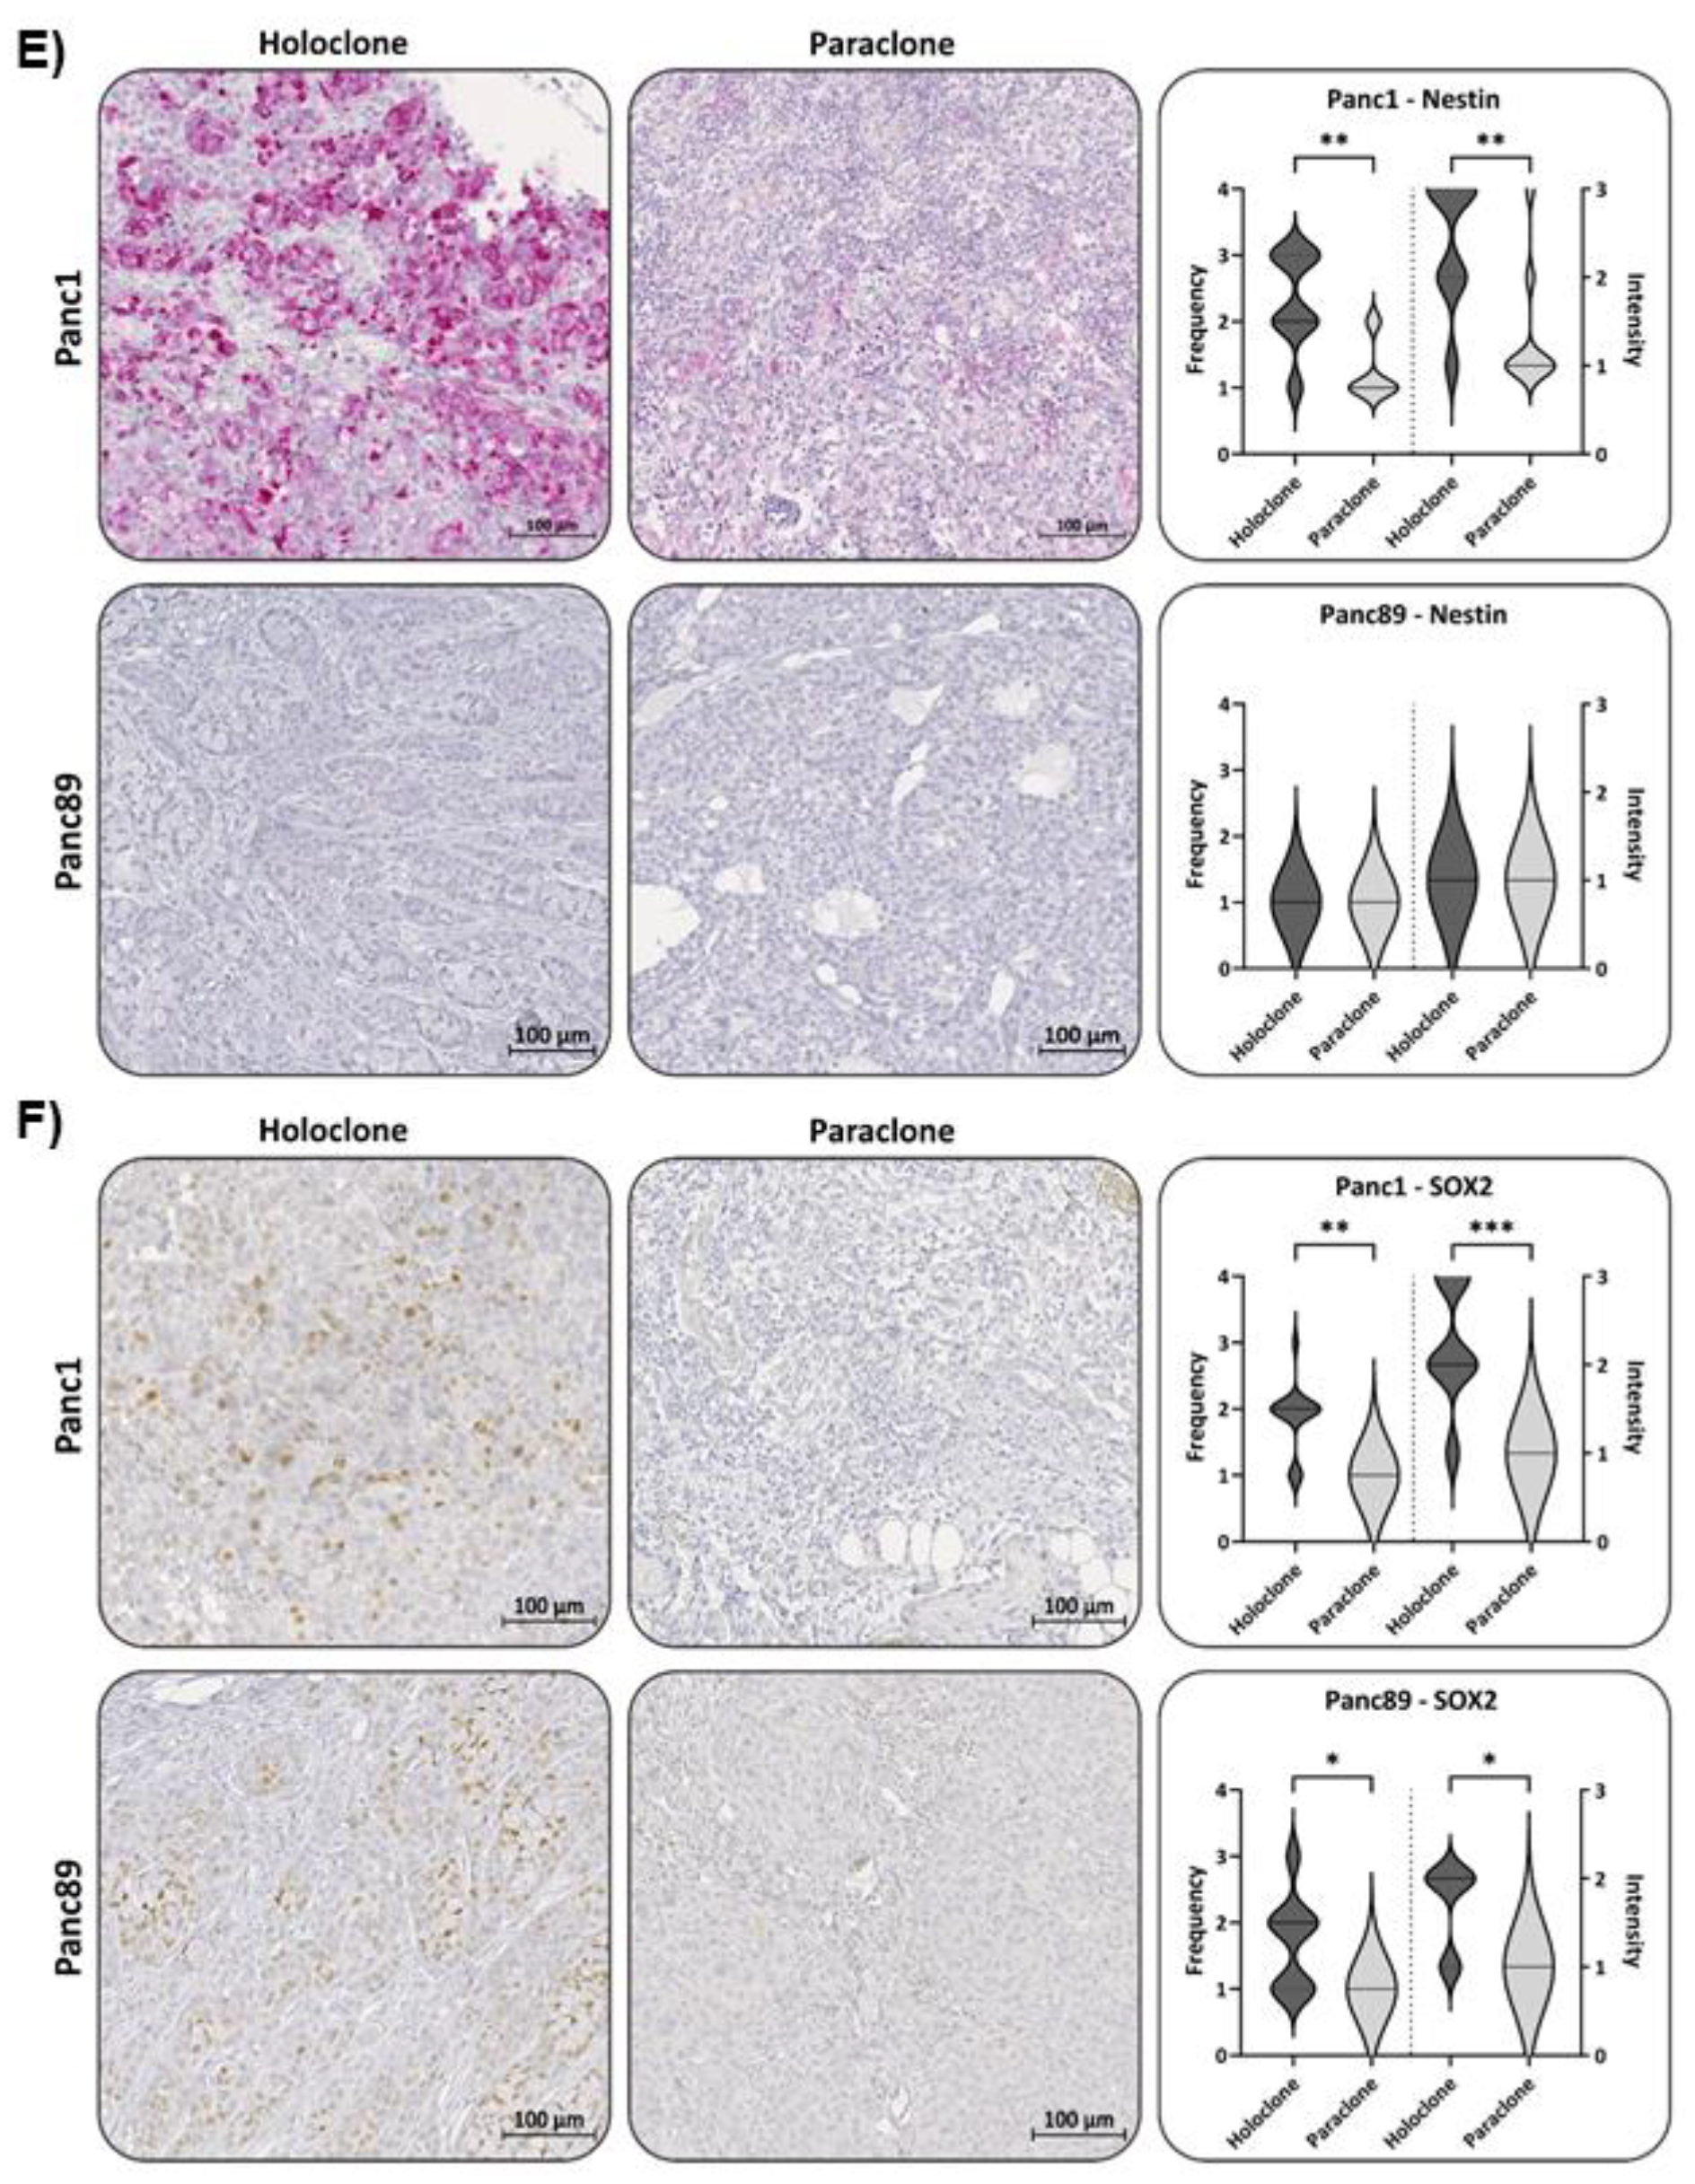
Finally, expression of the CSC-marker Nestin and SOX2 was assessed in all tumors. In Panc1 Holoclone tumors Nestin was strongly expressed (Frequency score 2-3 and Intensity score 4), significantly differing from Panc1 Paraclone tumors which showed no or only weak Nestin expression (Frequency- and Intensity score 1), which well reflected the different expression pattern identified in vitro. In line with our in vitro findings, both Panc89 Holoclone and Paraclone tumors showed no or only very faint Nestin expression (Figure 6E).
In contrast to the in vitro findings, SOX2 expression could be detected in Panc1 Holoclone tumors (Frequency and Intensity score of 2/3) and expression levels were higher compared to Panc1 Paraclone tumors (Frequency and Intensity Score of 1/2, Figure 6F). The expression of SOX2 in Panc89 Holoclone tumors was also significantly higher (Frequency and Intensity Score of 2/2) compared to Panc89 Paraclone tumors (Frequency and Intensity Score of 1/1, Figure 6F).
As mentioned above, 4/17 Pan89 Holoclone tumors showed areas of L1CAM expression. When correlating L1CAM and SOX2 expression in this group, no significant correlation could be noted. However, analyzing Panc89 Holoclone tumors expressing L1CAM (Frequency score of 2-3) regarding SOX2, L1CAM expression in these tumors was significantly associated with low/absent SOX2 expression (Supplementary Figure 3) being indicative of the phenotype of Panc89 Paraclone cells. By examining the tissues of origin of these tumors, it could be found that one tumor originated directly from the pancreas. The other tumors examined could not be clearly assigned to one organ but were all surrounded by adipose tissue, indicating the tumors to be localized in the peritoneum.
In summary, IHC analysis widely confirmed the gene expression profile of the cells identified in vitro, approving mesenchymal Panc1 Holoclone cells with a Nestin-dominated CSC-phenotype, while mesenchymal Panc1 Paraclone cells showing no stemness characteristics. Contrary, Panc89 Holoclone cells mostly exhibited an epithelial SOX2-dominated CSC-phenotype, whereas Panc89 Paraclone cells exhibited a partial/hybrid EMT cell phenotype with less CSC-marker expression. However, certain variations from the CSC-EMT-marker expression patterns identified in vitro could be noted in Panc89 Holo- and Paraclone tumors (e.g., L1CAM, SOX2, ZEB1 and ZEB2) but also in Panc1 Holoclone cells (SOX2) underscoring plasticity of the cells which is influenced by the tumor microenvironment.
Overall, these data indicate that different CSC-EMT-phenotypes of PDAC cell populations might yield different metastatic manifestations being associated with different survival times.

4. Discussion

Cancer cell plasticity and tumor heterogeneity, e.g., manifested by the presence and interplay of CSC and non-CSC populations, along with the pronounced tumor stroma are associated with poor prognosis and increased resistance to chemotherapy of PDAC [59,60,61,62,63,64,65,66,67,68,69,70,71]. Besides, CSCs and EMT are both linked to cancer progression and early metastasis, which is also applies to PDAC [18,19,20,72]. CSCs are characterized by the unique ability to self-renewal, initiation of tumoral lesions at primary and secondary sites, the capability to resist cell death induction and to give rise to plastic, highly proliferative transit-amplifying progenitor cell populations [21,22,23,73,74,75,76,77]. As they also generate more or less differentiated cancer cells, CSCs are one important origin of tumor cell heterogeneity [20,24,25,26,27,78]. The link between EMT and MET processes and CSCs has been already shown [18,19,20,72]s. Yet, it is still poorly understood whether CSC- and EMT-phenotypes are always interconnected, how CSC-phenotypes of epithelial and mesenchymal tumor cells are characterized, and whether these might be related to different functional malignant outcomes. To gain a better understanding of plasticity in PDAC with a particular focus on CSCs and EMT and its contribution to malignancy associated properties, two different PDAC cell models were comparatively analyzed. Mesenchymal Panc1 cells derived from a primary PDAC have presumably already undergone EMT, while Panc89 cells originate from a lymph node metastasis and have most likely undergone EMT and MET leading to metastatic outgrowth in the lymph node [79]. Isolated Panc1 and Panc89 Holo- and Paraclone cells, as well as the two related parental cell populations, were comprehensively analyzed by expression and functional analysis in vitro and in vivo. First, CFAs and expression analysis of CSC-markers revealed different CSC phenotypes in the two PDAC cell lines. While Panc1 Holoclone cells were characterized by high Nestin expression and absent SOX2 expression, Panc89 Holoclone cells exhibited an inverse expression pattern showing a SOX2 dominated phenotype. Moreover, the CSC-phenotype of Panc89 Holoclones was associated with a higher colony formation ability compared to Panc1 Holoclones, indicating a more pronounced self-renewal capacity of these cells. Of note, pathways involved in the activity of cell cycle checkpoints, transcriptional regulation of TP53 and Mueller Plurinet seemed to generally play a role in CSC populations of PDAC, as these genes were upregulated in both Panc1 and Panc89 Holoclone cells compared to related Paraclones. Mueller Plurinet is a protein-protein network shared by pluripotent cells and has become a prominent classifying system for pluripotency and self-renewal properties [55]. Activation of TP53 and cell cycle checkpoints are interconnected since TP53 enables dividing cells to repair anomalies before proceeding through cell cycle checkpoints, acting as a tumor suppressor [80,81,82,83]. Therefore, mutations in TP53 are strongly associated with tumor progression in various human cancers, also PDAC, and recent reports have shown its impact on stemness properties in cancer cells [79,80,81,82,83,84,85,86,87,88,89,90]. Overall, these data support the existence of distinct CSC-phenotypes in PDAC cells.
Furthermore, clear differences with respect to the EMT-phenotype were noted. Parental Panc89 and Panc89 Holoclone cells were predominantly characterized by an epithelial phenotype exemplified by high E-cadherin expression and concomitantly low expression of mesenchymal markers (Vimentin, L1CAM, ZEB1 and ZEB2). In contrast, all Panc1 cell variants were characterized by low E-cadherin expression and marked expression of mesenchymal markers underscoring the mesenchymal phenotype. As Panc89 Paraclone cells showed high E-cadherin expression, low Vimentin expression but also considerable expression of L1CAM, ZEB1 and ZEB2, which was higher compared to the other Panc89 cell variants but still lower compared to Panc1 cell variants (despite ZEB2 expression), these cells seemed to exhibit a partial/hybrid EMT-phenotype as described in other tumor cell models [91,92,93,94]. Moreover, these phenotypes were also widely confirmed by IHC staining of the tumors formed in vivo by the inoculated Holo- and Paraclone cell populations. However, in Panc89 Holoclone tumors areas with high L1CAM expression and low SOX2 expression but also with ZEB1 or ZEB2 expression were noted, and Panc1 Holoclone tumors showed elevated SOX2 expression which was absent in Panc1 Holoclone cells in vitro. This might be due to the fact that SOX2 functions as a stability factor in the control of PDAC cell proliferation, being required for growth of PDAC cells. Apparently, SOX2 needs to be stably expressed, as increased as well as decreased levels of SOX2 reduces tumor growth of PDAC in vivo and in vivo [95]. These findings support our data showing that a gain in SOX2 expression in Panc89 and Panc1 Holoclone tumors might be crucial to ensure tumor outgrowth. Altogether, these data indicate a robust phenotype stability of Holo- and Paraclones of either PDAC cell line under constant environmental conditions. Albeit when the latter are changing this might lead to a phenotypic switching of the tumor cells, presumably forced by altering environmental factors the tumor cells are exposed to, as seen in the in vivo tumors. Hence, myofibroblasts and macrophages, both important stroma cell populations in pancreatic tumors and metastases [96,97], were already shown to induce L1CAM expression in PDAC cells [98,99].
Even though the transcriptomic profiling revealed that both Panc1 and Panc89 Holoclone cells show similarities in TP53 and cell cycle checkpoint regulation as well as stemness associated Mueller Plurinet activity, we could identify two distinct EMT-CSC-phenotypes: a mesenchymal Nestin-dominated (Panc1 Holoclone cells) and an epithelial SOX2-dominated CSC-phenotype (Panc89 Holoclone cells). Of note, both phenotypes were associated with clearly different functional properties. Besides the more pronounced colony formation, Panc89 Holoclone cells showed a clearly faster growth behavior compared to Panc89 Paraclone cells but also to Panc1 Holoclone cells, being in line with the fact that proliferative activity of epithelial cells is generally higher than those of mesenchymal cells [100,101]. In line with a higher cell turnover of epithelial Panc89 cell variants, parental Panc89 cells as well as their Holoclone and Paraclone cells showed a better response towards Gemcitabine compared to mesenchymal Panc1 cell variants. These differences regarding the response to chemotherapeutic drugs were in accordance with those having already assigned to the classical and basal-like phenotype of PDAC cells [56,102]. Of note, mesenchymal CSC populations (Panc1 Holoclone cells) showed an even more resistant phenotype compared to their parental and non-CSC cells, while epithelial CSC (Panc89 Holoclone cells) showed the strongest treatment response. These data support the rationale for using chemotherapy as an effective treatment for fast proliferating tumor cells. However, this strategy fails to eliminate tumor cells with decreased growth rates [103,104,105]. Furthermore, these findings underscore the heterogeneity of CSC which manifests in different treatment sensitivities.
Showing a slower cell growth, Panc1 cells exhibited a faster cell invasion in a typical mesenchymal cell manner with increased numbers of invasive fronts and longer invasion distances, underscored by the activity of EMT and invasion associated genes shown by the transcriptomic analysis. In contrast, Panc89 Holoclone cells used a cluster mode of slow cell invasion, again fitting together with the epithelial phenotype of these cells [79,100,101]. Also in line with these findings, expression of VIM [106,107,108,109,110,111] and L1CAM [98,112,113,114] have been associated with an increased invasive potential in a variety of cancers, also in PDAC cells.
Moreover, these distinct growth and invasive properties were linked to different metastasis patterns in vivo. Accordingly, Panc1 Holoclone cells exhibiting the strongest invasive potential using a mesenchymal invasion mode led to the highest number of metastatic lesions predominantly in the pancreas compared Panc1 Paraclones as well as epithelial Panc89 cell variants which formed less but larger tumors. The fact that Panc1 Holoclone cells led to formation of more and larger tumors compared to Panc1 Paraclones underscores that the presence of CSC properties in mesenchymal PDAC cells is prerequisite for metastatic tumor formation.
However, inoculation of Panc89 Holoclones led the most pronounced macroscopic tumor burden with the highest number of large macroscopic tumors compared to all other cell variants. Albeit the differences between Panc89 Holo- and Paraclones were not that pronounced, also with respect to survival times, pointing again to a microenvironment mediated phenotypic switch of the tumor cells (see above). Of note, tumor formation of Panc1 and Panc89 Paraclone cells suggested that non-CSC variants can gain CSC properties, since both Paraclone variants were able to induce tumor formation, although not as pronounced as Panc1 and Panc89 Holoclone cells. Despite this gain of CSC properties in Panc1 and Panc89 Paraclone cells, expression of CSC-markers in vivo remained low in these tumors.
In contrast to Panc1 tumors, tumors formed by Panc89 cell variants predominantly manifested in the peritoneum. Adhesion assays to organ specific endothelial cells did not reveal any considerable differences between Holo- and Paraclone populations of either cell line but indicated that Panc89 cell variants better adhere to lung endothelium than Panc1 cell variants. However, these results were not in line with tumor manifestation patterns in vivo. In contrast, this might indicate that the different organ colonization and metastatic outgrowth of the inoculated cell populations rely more on other cell properties and the local microenvironment in the organ and not so much on adhesion to the organ-specific endothelium. Moreover, CSC properties do not seem to determine homing to secondary sites rather than dissemination mode and outgrowth of the tumor cells.
As outlined before, both Nestin and SOX2 have been associated with CSC-phenotypes and were linked to malignancy associated properties. Thus, in a murine PDAC model, shRNA mediated reduction of Nestin expression led to decreased tumor volume and hepatic metastases [37,38], being in line with our results demonstrating that Nestin expressing Panc1 Holoclone cells showed higher self-renewal capacity and invasive properties in vitro and formed a higher number of tumors in vivo compared to Panc1 Paraclone cells. In contrast, Panc89 Holoclones lacked Nestin expression but were characterized by high SOX2 expression compared to Panc89 Paraclone cells, as well as compared to all Panc1 cell variants. However, in vivo Panc1 and Panc89 Holoclone tumors both exhibited similar amounts of SOX2, supporting the role of the microenvironment as a determining factor of CSC properties [20,24,25,26,27,115]. Of note, elevated SOX2 expression in Panc89 Holoclones was associated with the formation of the highest number of colonies and the fastest growth rate in vitro and the formation of the largest tumors in vivo. Furthermore, it can be speculated that elevation of SOX2 might also be involved in the outgrowth of Panc1 Holoclone tumors [32,95,116].
PDAC cells are known to predominantly metastasize to the liver, lung and the peritoneum [4,5,6]. As described above, the highest number of Panc1 Holoclone tumors was predominantly found in the pancreas, while Panc89 Holoclone cells formed most tumors in the peritoneum.
The fact that mesenchymal Panc1 cells are derived from the primary tumor, together with their gene activity associated with EMT and invasion, suggests that these cells have undergone EMT to leave the primary tumor. However, whether these cells would ever have been able to form metastases in this patient remains unsolved. Furthermore, it may explain, why most Panc1 Holoclone tumors were found in the pancreas, indicating that these cells are still optimally adapted to their original tissue. In contrast, epithelial Panc89 cells originate from a lymph node metastasis, thus these cells have proven their disseminating potential to leave the primary tumor (either after EMT using a mesenchymal invasion mode or while maintaining an epithelial/hybrid cell stage using a cluster-like mode) and to grow out as metastasis at a secondary site (e.g., after MET).

5. Conclusions

In summary, these results support the view that mesenchymal CSC have a higher propensity to spread and the ability to colonize secondary sites (exemplified by the highest number of total tumoral lesions), which however, does not ultimately lead to immediate disease progression and short survival. In contrast, an epithelial CSC-phenotype seemed to be associated with slow cell invasion but the concomitant advantage for rapid tumor outgrowth, resulting in a rapid increase of a life-threatening tumor burden (exemplified by the highest number of macroscopic tumors and shorter survival). Overall, our data support the view that different CSC-phenotypes exist in PDAC which are associated with distinct EMT-phenotypes of PDAC cells essentially determining PDAC cell fate and function as well as treatment responses.

Supplementary Materials

The following supporting information can be downloaded at the website of this paper posted on Preprints.org.

Author Contributions

Conceptualization: L-MP and SSe; Investigation: L-MP, U-UY, AS, AK, A-SM, CH, J-PG, OW, PH, LS, SF, HK, US, HB; Resources: US, SF, HB, SSe; Writing—original draft preparation: L-MP, SSe; Writing—review and editing: all authors; Visualization: L-MP; Funding acquisition: SF, SSe. L-MP, U-UY, AS, AK, A-SM, CH, J-PG, OW, PH, LS, SF, HK, US, HB and SSe contributed to the article and approved the submitted version.

Funding

This work was supported by the Deutsche Forschungsgemeinschaft (GRK2501/0) and the Deutsche Krebshilfe (70112935). This work was also supported by the DFG Research Infrastructure NGS_CC (project 407495230) as part of the Next Generation Sequencing Competence Network (project 423957469). NGS analyses were carried out at the Competence Centre for Genomic Analysis (Kiel). We acknowledge financial support by DFG within the funding programme Open Access-Publikationskosten.

Data Availability Statement

The datasets used and/or analyzed during the current study are available from the corresponding author on reasonable request. The RNA-seq data have been deposited at GEO under the access ID GSE241182. The data are available to the reviewers using the secure token ‘wbyxocoublsrxij’.

Acknowledgments

The authors thank Dagmar Leisner, Sandra Ussat and Jenny Schröder-Schwarz for excellent technical support. Moreover, we thank SynenTec for the provision and support of the NyOne® Scientific.

Conflicts of Interest

The authors declare no conflicts of interest.

Abbreviations

CA: Canada; CAF: Cancer associated fibroblasts; CFA: Colony formation assay; CH: Switzerland; CRC: Colorectal cancer; CSC: Cancer stem cell; CO2: Carbon dioxide; DE: Germany; DRA: Dose-Response-Analysis; EDTA: Ethylenediaminetetraacetic acid; EMT: Epithelial-Mesenchymal-Transition; FCS: Fetal calf serum; FFPE: Formalin-fixed and Paraffin-embedded; GAPDH: Glycerinaldehyde-3-phosphate-Dehydrogenase; HEPES: N-(2-Hydroxyethyl)piperazine-N′-(2-ethanesulfonic acid); HCL: Hydrochloric acid; Ho-lo: Holoclone cells; IF: Intermediate filament; IFS: Immunofluorescent staining; IHC: Immunohistochemical staining; JP: Japan; k: growth rate; KMS: Kaplan-Meier-Survival analysis; MET: Mesenchymal-Epithelial-Transition; NIBIOHN JCRB: National Institutes of Biomedical Innovation, Health and Nutrition, Japanese Collection of Research Bioresources Cell Bank; ON: Overnight; Para: Paraclone cells; PA: Panama; PBS: Phosphate buffered saline; PCR: Polymerase chain-reaction; PDAC: Pancreatic ductal adenocarcinoma; PFA: Paraformaldehyde; POD: Post-operative day; qPCR: Quantitative real-time polymerase chain-reaction; RIN: RNA integrity number; RNA: Ribonucleic acid; RPMI: Roswell Park Memorial Institute; RT: Room temperature; SC: Stem cell; SCC: Single-cell cloning; SD: Standard deviation; SEM: Standard error of means; TF: Transcription factor; ULA: Ultra-low attachment; US: United states of America

References

  1. Siegel RL, Miller KD, Wagle NS, Jemal A. Cancer statistics, 2023. CA Cancer J Clin. 2023;73(1):17–48.
  2. Rahib L, Smith BD, Aizenberg R, Rosenzweig AB, Fleshman JM, Matrisian LM. Projecting cancer incidence and deaths to 2030: The unexpected burden of thyroid, liver, and pancreas cancers in the united states. Cancer Res. 2014;74(11):2913–21.
  3. Meslar E. Pancreatic adenocarcinoma. JAAPA. 2020 Sep;33(11):50–1.
  4. Sperti C, Pasquali C, Piccoli A, Pedrazzoli S. Recurrence after resection for ductal adenocarcinoma of the pancreas. World J Surg. 1997 Feb;21(2):195–200.
  5. Van den broeck A, Sergeant G, Ectors N, Van Steenbergen W, Aerts R, Topal B. Patterns of recurrence after curative resection of pancreatic ductal adenocarcinoma. Eur J Surg Oncol [Internet]. 2009;35(6):600–4. Available from: http://dx.doi.org/10.1016/j.ejso.2008.12.006.
  6. Groot VP, Rezaee N, Wu W, Cameron JL, Fishman EK, Hruban RH, et al. Patterns, Timing, and Predictors of Recurrence Following Pancreatectomy for Pancreatic Ductal Adenocarcinoma. Ann Surg. 2018;267(5):936–45.
  7. Kim S, Itchins M, Arena J, Nahm C, Pavlakis N, Clarke S, et al. Patterns and Determinants of Recurrence for Pancreatic Ductal Adenocarcinoma after Resection. J Pancreas. 2017;18(6):458–64.
  8. Valastyan S, Weinberg RA. Tumor metastasis: Molecular insights and evolving paradigms. Cell [Internet]. 2011;147(2):275–92. [CrossRef]
  9. Toh B, Wang X, Keeble J, Sim WJ, Khoo K, Wong WC, et al. Mesenchymal transition and dissemination of cancer cells is driven by myeloid-derived suppressor cells infiltrating the primary tumor. PLoS Biol. 2011;9(9).
  10. Nguyen DX, Bos PD, Massagué J. Metastasis: From dissemination to organ-specific colonization. Nat Rev Cancer. 2009;9(4):274–84.
  11. Sökeland G, Schumacher U. The functional role of integrins during intra- and extravasation within the metastatic cascade. Mol Cancer. 2019;18(1):1–19.
  12. Thiery JP, Acloque H, Huang RYJ, Nieto MA. Epithelial-Mesenchymal Transitions in Development and Disease. Vol. 139, Cell. Sinauer Associates, Inc., Sunderland, MA; 2009. p. 871–90.
  13. Nieto MA, Huang RY-J, Jackson RA, Thiery JP. EMT: 2016. Cell. 2016;166(1):21–45.
  14. Hanahan D, Weinberg RA. Hallmarks of cancer: The next generation. Cell [Internet]. 2011;144(5):646–74. [CrossRef]
  15. Roca H, Hernandez J, Weidner S, McEachin RC, Fuller D, Sud S, et al. Transcription Factors OVOL1 and OVOL2 Induce the Mesenchymal to Epithelial Transition in Human Cancer. PLoS One. 2013;8(10):1–20.
  16. Watanabe K, Liu Y, Noguchi S, Murray M, Chang JC, Kishima M, et al. OVOL2 induces mesenchymal-to-epithelial transition in fibroblasts and enhances cell-state reprogramming towards epithelial lineages. Sci Rep [Internet]. 2019;9(1):1–7. [CrossRef]
  17. Xia L, Gao J, Ma K, Lin H, Chen Y, Luo Q, et al. OVOL2 attenuates the expression of MAP3K8 to suppress epithelial mesenchymal transition in colorectal cancer. Pathol Res Pract. 2021;224(January).
  18. Mani SA, Guo W, Liao M-J, Eaton EN, Ayyanan A, Zhou AY, et al. The epithelial-mesenchymal transition generates cells with properties of stem cells. Cell. 2008;133(4):704–15.
  19. Andriani F, Bertolini G, Facchinetti F, Baldoli E, Moro M, Casalini P, et al. Conversion to stem-cell state in response to microenvironmental cues is regulated by balance between epithelial and mesenchymal features in lung cancer cells. Mol Oncol. 2016;10(2):253–71.
  20. Schwitalla S, Fingerle AA, Cammareri P, Nebelsiek T, Göktuna SI, Ziegler PK, et al. Intestinal tumorigenesis initiated by dedifferentiation and acquisition of stem-cell-like properties. Cell. 2013;152(1–2):25–38.
  21. Matsuda Y, Yoshimura H, Ueda J, Naito Z, Korc M, Ishiwata T. Nestin delineates pancreatic cancer stem cells in metastatic foci of NOD/Shi-scid IL2R??null (NOG) mice. Am J Pathol [Internet]. 2014;184(3):674–85. [CrossRef]
  22. Heeschen C, Herrler T, Ellwart JW, Guba M, Huber SL, Bruns CJ, et al. Distinct Populations of Cancer Stem Cells Determine Tumor Growth and Metastatic Activity in Human Pancreatic Cancer. Cell Stem Cell. 2007;1(3):313–23.
  23. Li C, Heidt DG, Dalerba P, Burant CF, Zhang L, Adsay V, et al. Identification of pancreatic cancer stem cells. Cancer Res. 2007;67(3):1030–7.
  24. Chaffer CL, Brueckmann I, Scheel C, Kaestli AJ, Wiggins PA, Rodrigues LO, et al. Normal and neoplastic nonstem cells can spontaneously convert to a stem-like state. Proc Natl Acad Sci U S A. 2011;108(19):7950–5.
  25. Dalla Pozza E, Dando I, Biondani G, Brandi J, Costanzo C, Zoratti E, et al. Pancreatic ductal adenocarcinoma cell lines display a plastic ability to bi-directionally convert into cancer stem cells. Int J Oncol. 2015;46(3):1099–108.
  26. O’Leary DP, O’Leary E, Foley N, Cotter TG, Wang JH, Redmond HP. Effects of surgery on the cancer stem cell niche. Eur J Surg Oncol. 2016;42(3):319–25.
  27. Mukherjee S, Manna A, Bhattacharjee P, Mazumdar M, Saha S, Chakraborty S, et al. Non-migratory tumorigenic intrinsic cancer stem cells ensure breast cancer metastasis by generation of CXCR4+ migrating cancer stem cells. Oncogene. 2016;35(37):4937–48.
  28. Zhu Y-Y, Yuan Z. Pancreatic cancer stem cells. Am J Cancer Res. 2015;5(3):894–906.
  29. Neradil J, Veselska R. Nestin as a marker of cancer stem cells. Cancer Sci. 2015;106(7):803–11.
  30. Bhagwandin VJ, Bishop JM, Wright WE, Shay JW. The metastatic potential and chemoresistance of human pancreatic cancer stem cells. PLoS One. 2016;11(2):1–16.
  31. Jeter CR, Yang T, Wang J, Chao H, Dean G, Park S, et al. Nanog in cancer stem cells. 2016;33(8):2381–90.
  32. Herreros-Villanueva M, Bujanda L, Billadeau DD, Zhang JS. Embryonic stem cell factors and pancreatic cancer. World J Gastroenterol. 2014;20(9):2247–54.
  33. Narita K, Matsuda Y, Seike M, Naito Z, Gemma A, Ishiwata T. Nestin regulates proliferation, migration, invasion and stemness of lung adenocarcinoma. Int J Oncol. 2014;44(4):1118–30.
  34. Gawlik-Rzemieniewska N, Bednarek I. The role of NANOG transcriptional factor in the development of malignant phenotype of cancer cells. Cancer Biol Ther. 2016;17(1):1–10.
  35. Lu Y, Zhu H, Shan H, Lu J, Chang X, Li X, et al. Knockdown of Oct4 and Nanog expression inhibits the stemness of pancreatic cancer cells. Cancer Lett. 2013 Oct;340(1):113–23.
  36. Su H-T, Weng C-C, Hsiao P-J, Chen L-H, Kuo T-L, Chen Y-W, et al. Stem cell marker nestin is critical for TGF-beta1-mediated tumor progression in pancreatic cancer. Vol. 11, Molecular Cancer Research. 2013. p. 768–79.
  37. Matsuda Y, Naito Z, Kawahara K, Nakazawa N, Korc M, Ishiwata T. Nestin is a novel target for suppressing pancreatic cancer cell migration, invasion and metastasis. Cancer Biol Ther. 2011;11(5):512–23.
  38. Arai T, Yamashita S, Matsuda Y, Yoshimura H, Ushijima T, Ishiwata T. Systemic Administration of Small Interfering RNA Targeting Human Nestin Inhibits Pancreatic Cancer Cell Proliferation and Metastasis. Pancreas. 2015;45(1):93–100.
  39. Sanada Y, Yoshida K, Ohara M, Oeda M, Konishi K, Tsutani Y. Histopathologic evaluation of stepwise progression of pancreatic carcinoma with immunohistochemical analysis of gastric epithelial transcription factor SOX2: Comparison of expression patterns between invasive components and cancerous or nonneoplastic intr. Pancreas. 2006;32(2):164–70.
  40. Han X, Fang X, Lou X, Hua D, Ding W, Foltz G, et al. Silencing SOX2 induced mesenchymal-epithelial transition and its expression predicts liver and lymph node metastasis of CRC patients. PLoS One. 2012;7(8).
  41. Knaack H, Lenk L, Philipp L-M, Miarka L, Rahn S, Viol F, et al. Liver metastasis of pancreatic cancer: the hepatic microenvironment impacts differentiation and self-renewal capacity of pancreatic ductal epithelial cells. Oncotarget [Internet]. 2018;9(60):31771–86. Available from: http://www.ncbi.nlm.nih.gov/pubmed/30167093%0Ahttp://www.pubmedcentral.nih.gov/articlerender.fcgi?artid=PMC6114965%0Ahttp://www.oncotarget.com/fulltext/25884.
  42. Beaver CM, Ahmed A, Masters JR. Clonogenicity: Holoclones and meroclones contain stem cells. PLoS One. 2014;9(2).
  43. Brabletz S, Schuhwerk H, Brabletz T, Stemmler MP. Dynamic EMT: a multi-tool for tumor progression. EMBO J. 2021;40(18):1–22.
  44. Mehta PK, Karls RK, White EH, Ades EW, Quinn FD. Entry and intracellular replication of Mycobacterium tuberculosis in cultured human microvascular endothelial cells. Microb Pathog. 2006;41(2–3):119–24.
  45. Matsumura T, Takesue M, Westerman KA, Okitsu T, Sakaguchi M, Fukazawa T, et al. Establishment of an immortalized human-liver endothelial cell line with SV40T and hTERT. Transplantation. 2004;77(9 SUPPL.):1357–65.
  46. Lechner JF, Tokiwa T, LaVeck M, Benedict WF, Banks-Schlegel S, Yeager H, et al. Asbestos-associated chromosomal changes in human mesothelial cells. Proc Natl Acad Sci U S A. 1985;82(11):3884–8.
  47. Reddel et al. Immortalized Human Bronchial Epitherial Mesothelial Cell Lines. 1989;43(19):1–6.
  48. Tan L, Sui X, Deng H, Ding M. Holoclone forming cells from pancreatic cancer cells enrich tumor initiating cells and represent a novel model for study of cancer stem cells. PLoS One. 2011;6(8).
  49. Bray NL, Pimentel H, Melsted P, Pachter L. Near-optimal probabilistic RNA-seq quantification. Nat Biotechnol. 2016;34(5):525–7.
  50. Soneson C, Love MI, Robinson MD. Differential analyses for RNA-seq: transcript-level estimates improve gene-level inferences. F1000Research. 2015;4(2):1521.
  51. Love MI, Huber W, Anders S. Moderated estimation of fold change and dispersion for RNA-seq data with DESeq2. Genome Biol. 2014;15(12):1–21.
  52. Zhu A, Ibrahim JG, Love MI. Heavy-Tailed prior distributions for sequence count data: Removing the noise and preserving large differences. Bioinformatics. 2019;35(12):2084–92.
  53. Luo W, Friedman MS, Shedden K, Hankenson KD, Woolf PJ. GAGE: Generally applicable gene set enrichment for pathway analysis. BMC Bioinformatics. 2009;10:1–17.
  54. Liberzon A, Birger C, Thorvaldsdóttir H, Ghandi M, Mesirov JP, Tamayo P. The Molecular Signatures Database Hallmark Gene Set Collection. Cell Syst. 2015;1(6):417–25.
  55. Müller FJ, Laurent LC, Kostka D, Ulitsky I, Williams R, Lu C, et al. Regulatory networks define phenotypic classes of human stem cell lines. Nature. 2008;455(7211):401–5.
  56. Moffitt RA, Marayati R, Flate EL, Volmar KE, Loeza SGH, Hoadley KA, et al. Virtual microdissection identifies distinct tumor- and stroma-specific subtypes of pancreatic ductal adenocarcinoma. Nat Genet. 2015;47(10):1168–78.
  57. Yuan H, Yan M, Zhang G, Liu W, Deng C, Liao G, et al. CancerSEA: A cancer single-cell state atlas. Nucleic Acids Res. 2019;47(D1):D900–8.
  58. Galván JA, Zlobec I, Wartenberg M, Lugli A, Gloor B, Perren A, et al. Expression of E-cadherin repressors SNAIL, ZEB1 and ZEB2 by tumour and stromal cells influences tumour-budding phenotype and suggests heterogeneity of stromal cells in pancreatic cancer. Br J Cancer. 2015;112(12):1944–50.
  59. Gallmeier E, Gress TM. Pancreatic ductal adenocarcinoma. Internist. 2018;59(8):805–22.
  60. Fulawka L, Donizy P, Halon A. Cancer stem cells--the current status of an old concept: literature review and clinical approaches. Biol Res [Internet]. 2014;47:66. Available from: http://www.pubmedcentral.nih.gov/articlerender.fcgi?artid=4335556&tool=pmcentrez&rendertype=abstract.
  61. Karamitopoulou E. Tumor budding cells, cancer stem cells and epithelial-mesenchymal transition-type cells in pancreatic cancer. Front Oncol. 2013;2 JAN(January):2009–13.
  62. Castellanos JA, Merchant NB, Nagathihalli NS. Emerging targets in pancreatic cancer: Epithelial-mesenchymal transition and cancer stem cells. Onco Targets Ther. 2013;6:1261–7.
  63. Zhan H xiang, Xu J wei, Wu D, Zhang T ping, Hu S yuan. Pancreatic cancer stem cells: New insight into a stubborn disease. Cancer Lett [Internet]. 2015;357(2):429–37. [CrossRef]
  64. Neesse A, Bauer CA, Öhlund D, Lauth M, Buchholz M, Michl P, et al. Stromal biology and therapy in pancreatic cancer: ready for clinical translation? Gut. 2019;68(1):159–71.
  65. Yuan S, Norgard RJ, Stanger BZ. Cellular plasticity in cancer. Cancer Discov. 2019;9(7):837–51.
  66. Elaskalani O, Razak NBA, Falasca M, Metharom P. Epithelial-mesenchymal transition as a therapeutic target for overcoming chemoresistance in pancreatic cancer [Internet]. Vol. 9, World Journal of Gastrointestinal Oncology. 2017. p. 37–41. Available from: http://www.wjgnet.com/1948-5204/full/v9/i1/37.htm.
  67. Gaianigo N, Melisi D, Carbone C. EMT and treatment resistance in pancreatic cancer. Cancers (Basel). 2017;9(9):1–17.
  68. Kyuno D, Yamaguchi H, Ito T, Kono T, Kimura Y, Imamura M, et al. Targeting tight junctions during epithelial to mesenchymal transition in human pancreatic cancer. World J Gastroenterol. 2014;20(31):10813–24.
  69. Ishiwata T. Cancer stem cells and epithelial-mesenchymal transition: Novel therapeutic targets for cancer. Pathol Int. 2016;66(11):601–8.
  70. Shibue T, Weinberg RA. EMT, CSCs, and drug resistance: The mechanistic link and clinical implications. Nat Rev Clin Oncol [Internet]. 2017;14(10):611–29. [CrossRef]
  71. Rhim AD. Epithelial to mesenchymal transition and the generation of stem-like cells in pancreatic cancer. Pancreatology [Internet]. 2013;13(2):114–7. [CrossRef]
  72. Paul R, Dorsey JF, Fan Y. Cell plasticity, senescence, and quiescence in cancer stem cells: Biological and therapeutic implications. Pharmacol Ther [Internet]. 2022;231(xxxx):107985. [CrossRef]
  73. Kreso A, Dick JE. Evolution of the cancer stem cell model [Internet]. Vol. 14, Cell Stem Cell. Elsevier Inc.; 2014. p. 275–91. [CrossRef]
  74. Valle S, Martin-Hijano L, Alcalá S, Alonso-Nocelo M, Sainz B. The ever-evolving concept of the cancer stem cell in pancreatic cancer. Cancers (Basel). 2018;10(2).
  75. Burdziak C, Alonso-Curbelo D, Walle T, Reyes J, Barriga FM, Haviv D, et al. Epigenetic plasticity cooperates with cell-cell interactions to direct pancreatic tumorigenesis. Science. 2023 May;380(6645):eadd5327.
  76. Al-Hajj M, Clarke MF. Self-renewal and solid tumor stem cells. Oncogene. 2004;23(43 REV. ISS. 6):7274–82.
  77. Yu QR. Stem cells and cancer stem cells. J Clin Rehabil Tissue Eng Res. 2007;11(15):2948–51.
  78. Aponte PM, Caicedo A. Stemness in Cancer: Stem Cells, Cancer Stem Cells, and Their Microenvironment. 2017;2017.
  79. Sipos B, Möser S, Kalthoff H, Török V, Löhr M, Klöppel G. A comprehensive characterization of pancreatic ductal carcinoma cell lines: Towards the establishment of an in vitro research platform. Virchows Arch. 2003;442(5):444–52.
  80. Hafner A, Bulyk ML, Jambhekar A, Lahav G. The multiple mechanisms that regulate p53 activity and cell fate. Nat Rev Mol Cell Biol [Internet]. 2019;20(4):199–210. [CrossRef]
  81. Kawauchi K, Wolf SJ. Understanding p53: New insights into tumor suppression. Expert Rev Anticancer Ther. 2014;14(10):1101–3.
  82. Mantovani F, Collavin L, Del Sal G. Mutant p53 as a guardian of the cancer cell. Cell Death Differ [Internet]. 2019;26(2):199–212. [CrossRef]
  83. Cultures BY. Chapter 26 Budding Yeast Cultures. Methods Mol Biol. 2014;1170:477–99.
  84. Wang H, Guo M, Wei H, Chen Y. Targeting p53 pathways: mechanisms, structures, and advances in therapy. Signal Transduct Target Ther. 2023;8(1):1–35.
  85. Chen J. The cell-cycle arrest and apoptotic and progression. Cold Spring Harb Perspect Med. 2016;6:1–16.
  86. Ghatak D, Das Ghosh D, Roychoudhury S. Cancer Stemness: p53 at the Wheel. Front Oncol. 2021;10(January):1–20.
  87. Hu H feng, Ye Z, Qin Y, Xu X wu, Yu X jun, Zhuo Q feng, et al. Mutations in key driver genes of pancreatic cancer: molecularly targeted therapies and other clinical implications. Acta Pharmacol Sin. 2021;42(11):1725–41.
  88. Wang S, Zheng Y, Yang F, Zhu L, Zhu XQ, Wang ZF, et al. The molecular biology of pancreatic adenocarcinoma: translational challenges and clinical perspectives. Signal Transduct Target Ther [Internet]. 2021;6(1). [CrossRef]
  89. Jung Y, Kraikivski P, Shafiekhani S, Terhune SS, Dash RK. Crosstalk between Plk1, p53, cell cycle, and G2/M DNA damage checkpoint regulation in cancer: computational modeling and analysis. npj Syst Biol Appl. 2021;7(1):1–13.
  90. Chen X, Zhang T, Su W, Dou Z, Zhao D, Jin X, et al. Mutant p53 in cancer: from molecular mechanism to therapeutic modulation. Cell Death Dis. 2022;13(11).
  91. Jolly MK, Boareto M, Huang B, Jia D, Lu M, Onuchic JN, et al. Implications of the hybrid epithelial/mesenchymal phenotype in metastasis. Front Oncol. 2015;5(JUN):1–19.
  92. Jolly MK, Ware KE, Gilja S, Somarelli JA, Levine H. EMT and MET: necessary or permissive for metastasis? Mol Oncol. 2017;11(7):755–69.
  93. Carstens JL, Yang S, Correa de Sampaio P, Zheng X, Barua S, McAndrews KM, et al. Stabilized epithelial phenotype of cancer cells in primary tumors leads to increased colonization of liver metastasis in pancreatic cancer. Cell Rep [Internet]. 2021;35(2):108990. [CrossRef]
  94. Jolly MK, Tripathi SC, Somarelli JA, Hanash SM, Levine H. Epithelial/mesenchymal plasticity: how have quantitative mathematical models helped improve our understanding? Mol Oncol. 2017;11(7):739–54.
  95. Wuebben EL, Wilder PJ, Cox JL, Grunkemeyer JA, Caffrey T, Hollingsworth MA, et al. SOX2 functions as a molecular rheostat to control the growth, tumorigenicity and drug responses of pancreatic ductal adenocarcinoma cells. Oncotarget. 2016;7(23):34890–906.
  96. Beckinger S, Daunke T, Aldag L, Krüger S, Heckl S, Wesch D, et al. Hepatic myofibroblasts exert immunosuppressive effects independent of the immune checkpoint regulator PD-L1 in liver metastasis of pancreatic ductal adenocarcinoma. Front Oncol. 2023;13(May):1–16.
  97. Aldag L, Beckinger S, Daunke T, Philipp LM, Surrow A, Yesilyurt UU, et al. The heterogeneity of the tumor microenvironment as essential determinant of development, progression and therapy response of pancreatic cancer. Cancers (Basel). 2021;13(19).
  98. Geismann C, Morscheck M, Koch D, Bergmann F, Ungefroren H, Arlt A, et al. Up-regulation of L1CAM in pancreatic duct cells is transforming growth factor β1- and slug-dependent: Role in malignant transformation of pancreatic cancer. Cancer Res. 2009;69(10):4517–26.
  99. Helm O, Held-Feindt J, Grage-Griebenow E, Reiling N, Ungefroren H, Vogel I, et al. Tumor-associated macrophages exhibit pro- and anti-inflammatory properties by which they impact on pancreatic tumorigenesis. Int J Cancer. 2014;135(4):843–61.
  100. Hanahan D, Weinberg RA. Hallmarks of Cancer: The Next Generation. Cell [Internet]. 2011;57(1):E41–6. [CrossRef]
  101. Kalluri R, Weinberg RA. The basics of epithelial-mesenchymal transition. J Clin Invest. 2009 Jun;119(6):1420–8.
  102. Collisson EA, Sadanandam A, Olson P, Gibb WJ, Truitt M, Gu S, et al. Subtypes of pancreatic ductal adenocarcinoma and their differing responses to therapy. Nat Med. 2011;17(4):500–3.
  103. Tsujii M. [Cancer therapy targeting cancer stem cell]. Nihon Rinsho. 2014;72(1):35–41.
  104. Benjamin B. Cytotoxic Drugs. In: Paul A, Anandabaskar N, Mathaiyan J, Raj GM, editors. Introduction to Basics of Pharmacology and Toxicology: Volume 2 : Essentials of Systemic Pharmacology : From Principles to Practice [Internet]. Singapore: Springer Nature Singapore; 2021. p. 1077–90. [CrossRef]
  105. Sazonova E V., Chesnokov MS, Zhivotovsky B, Kopeina GS. Drug toxicity assessment: cell proliferation versus cell death. Cell Death Discov. 2022;8(1):1–11.
  106. Kidd ME, Shumaker DK, Ridge KM. The role of Vimentin intermediate filaments in the progression of lung cancer. Am J Respir Cell Mol Biol. 2014;50(1):1–6.
  107. Domagala W, Lasota J, Dukowicz A, Markiewski M, Striker G, Weber K, et al. Vimentin expression appears to be associated with poor prognosis in node-negative ductal NOS breast carcinomas. Am J Pathol. 1990;137(6):1299–304.
  108. Burch TC, Watson MT, Nyalwidhe JO. Variable Metastatic Potentials Correlate with Differential Plectin and Vimentin Expression in Syngeneic Androgen Independent Prostate Cancer Cells. PLoS One. 2013;8(5):1–13.
  109. Dauphin M, Barbe C, Lemaire S, Nawrocki-Raby B, Lagonotte E, Delepine G, et al. Vimentin expression predicts the occurrence of metastases in non small cell lung carcinomas. Lung Cancer. 2013 Jul;81(1):117–22.
  110. Wang Z, Divanyan A, Jourd’heuil FL, Goldman RD, Ridge KM, Jourd’heuil D, et al. Vimentin expression is required for the development of EMT-related renal fibrosis following unilateral ureteral obstruction in mice. Am J Physiol - Ren Physiol. 2018;315(4):F769–80.
  111. Ridge KM, Eriksson JE, Pekny M, Goldman RD. Roles of vimentin in health and disease. Vol. 36, Genes and Development. 2022. p. 391–407.
  112. Grage-Griebenow E, Jerg E, Gorys A, Wicklein D, Wesch D, Freitag-Wolf S, et al. L1CAM promotes enrichment of immunosuppressive T cells in human pancreatic cancer correlating with malignant progression. Mol Oncol. 2014;8(5):982–97.
  113. Sebens Müerköster S, Werbing V, Sipos B, Debus MA, Witt M, Großmann M, et al. Drug-induced expression of the cellular adhesion molecule L1CAM confers anti-apoptotic protection and chemoresistance in pancreatic ductal adenocarcinoma cells. Oncogene. 2007;26(19):2759–68.
  114. Schäfer H, Geismann C, Heneweer C, Egberts JH, Korniienko O, Kiefel H, et al. Myofibroblast-induced tumorigenicity of pancreatic ductal epithelial cells is L1CAM dependent. Carcinogenesis. 2012;33(1):84–93.
  115. Kasashima H, Duran A, Martinez-Ordoñez A, Nakanishi Y, Kinoshita H, Linares JF, et al. Stromal SOX2 Upregulation Promotes Tumorigenesis through the Generation of a SFRP1/2-Expressing Cancer-Associated Fibroblast Population. Dev Cell. 2021;56(1):95-110.e10.
  116. Bylund M, Andersson E, Novitch BG, Muhr J. Vertebrate neurogenesis is counteracted by Sox1-3 activity. Nat Neurosci. 2003;6(11):1162–8.
Figure 1. Panc1 and Panc89 cell variants exhibit differences in their colony formation ability. Parental Panc1 and Panc89 as well as Holo- and Paraclone cells were analyzed regarding their colony formation ability via CFA. 400 cells of each cell line were seeded in duplicates/triplicates in 6-well plates and after eight to eleven days, colonies were fixed with paraformaldehyde and stained with crystal violet. The colonies formed were morphologically characterized regarding Holo- and Paraclones. A) Typical colony morphologies generated by parental cells as well as the respective Holo- and Paraclones. B) Number of Holo- and Paraclones per well formed by parental Panc1, Holo- and Paraclone cells (left) as well as parental Panc89, Holo- and Paraclone cells (right). Y-axis in B (right) is segmented with 0-18 for the bottom part and 30-200 for the upper part. Independent experiments n = 3, scale bar = 100 µm.
Preprints 90615 g001
Figure 2. Panc1 and Panc89 cell variants show distinct transcriptional and gene expression CSC and EMT signatures. A) Principal Component Analysis (PCA) based on the 10% most varying transcripts across all of parental Panc1 and Panc89, Holo- and Paraclone cell samples using the R package PCAtools (v2.10.0). PCA was performed for the highest variation in the first principal component (PC1) on the X-axis, and for the lower variations by the second principal component (PC2) on the Y-axis. All cell variants are denoted by color (red = Panc1 cell variants, blue = Panc89 cell variants) and symbol, respectively. B) Gene Set Variation Analysis (GSVA) of gene sets associated with positive or negative regulation on the EMT program and invasion properties in parental Panc1 and Panc89, Holo- and Paraclone cells. The numbering of all cell variants represents the number of the independent replicate. C) Transcriptomic analysis of CSC- and EMT- associated marker genes in parental Panc1 and Panc89 as well as Holo- and Paraclone cells. CDH1 (epithelial), VIM and L1CAM (mesenchymal) represented EMT-marker genes, ZEB1 and ZEB2 represented marker genes for EMT-induction and NES, OVOL2 and SOX2 represented CSC-marker genes. Data are represented as means with SD. Gene expression analysis by qPCR was performed for the CSC-marker D) NES, SOX2 and OVOL2, for the EMT-marker E) CDH1, L1CAM and VIM as well as for EMT-inducers F) ZEB1 and ZEB1. G) Immunofluorescence staining of EMT- and CSC-markers was performed for Panc1 cell variants with the CSC-markers NESTIN and the EMT-inducer ZEB2, while the CSC-markers SOX2 and the mesenchymal EMT-marker L1CAM were stained in Panc89 cell lines. All cell nuclei were stained with Hoechst 33342. Representative images from n = 3 independent experiments are shown (scale bar = 200 µm). Every analysis was performed with independent experiments n = 3.
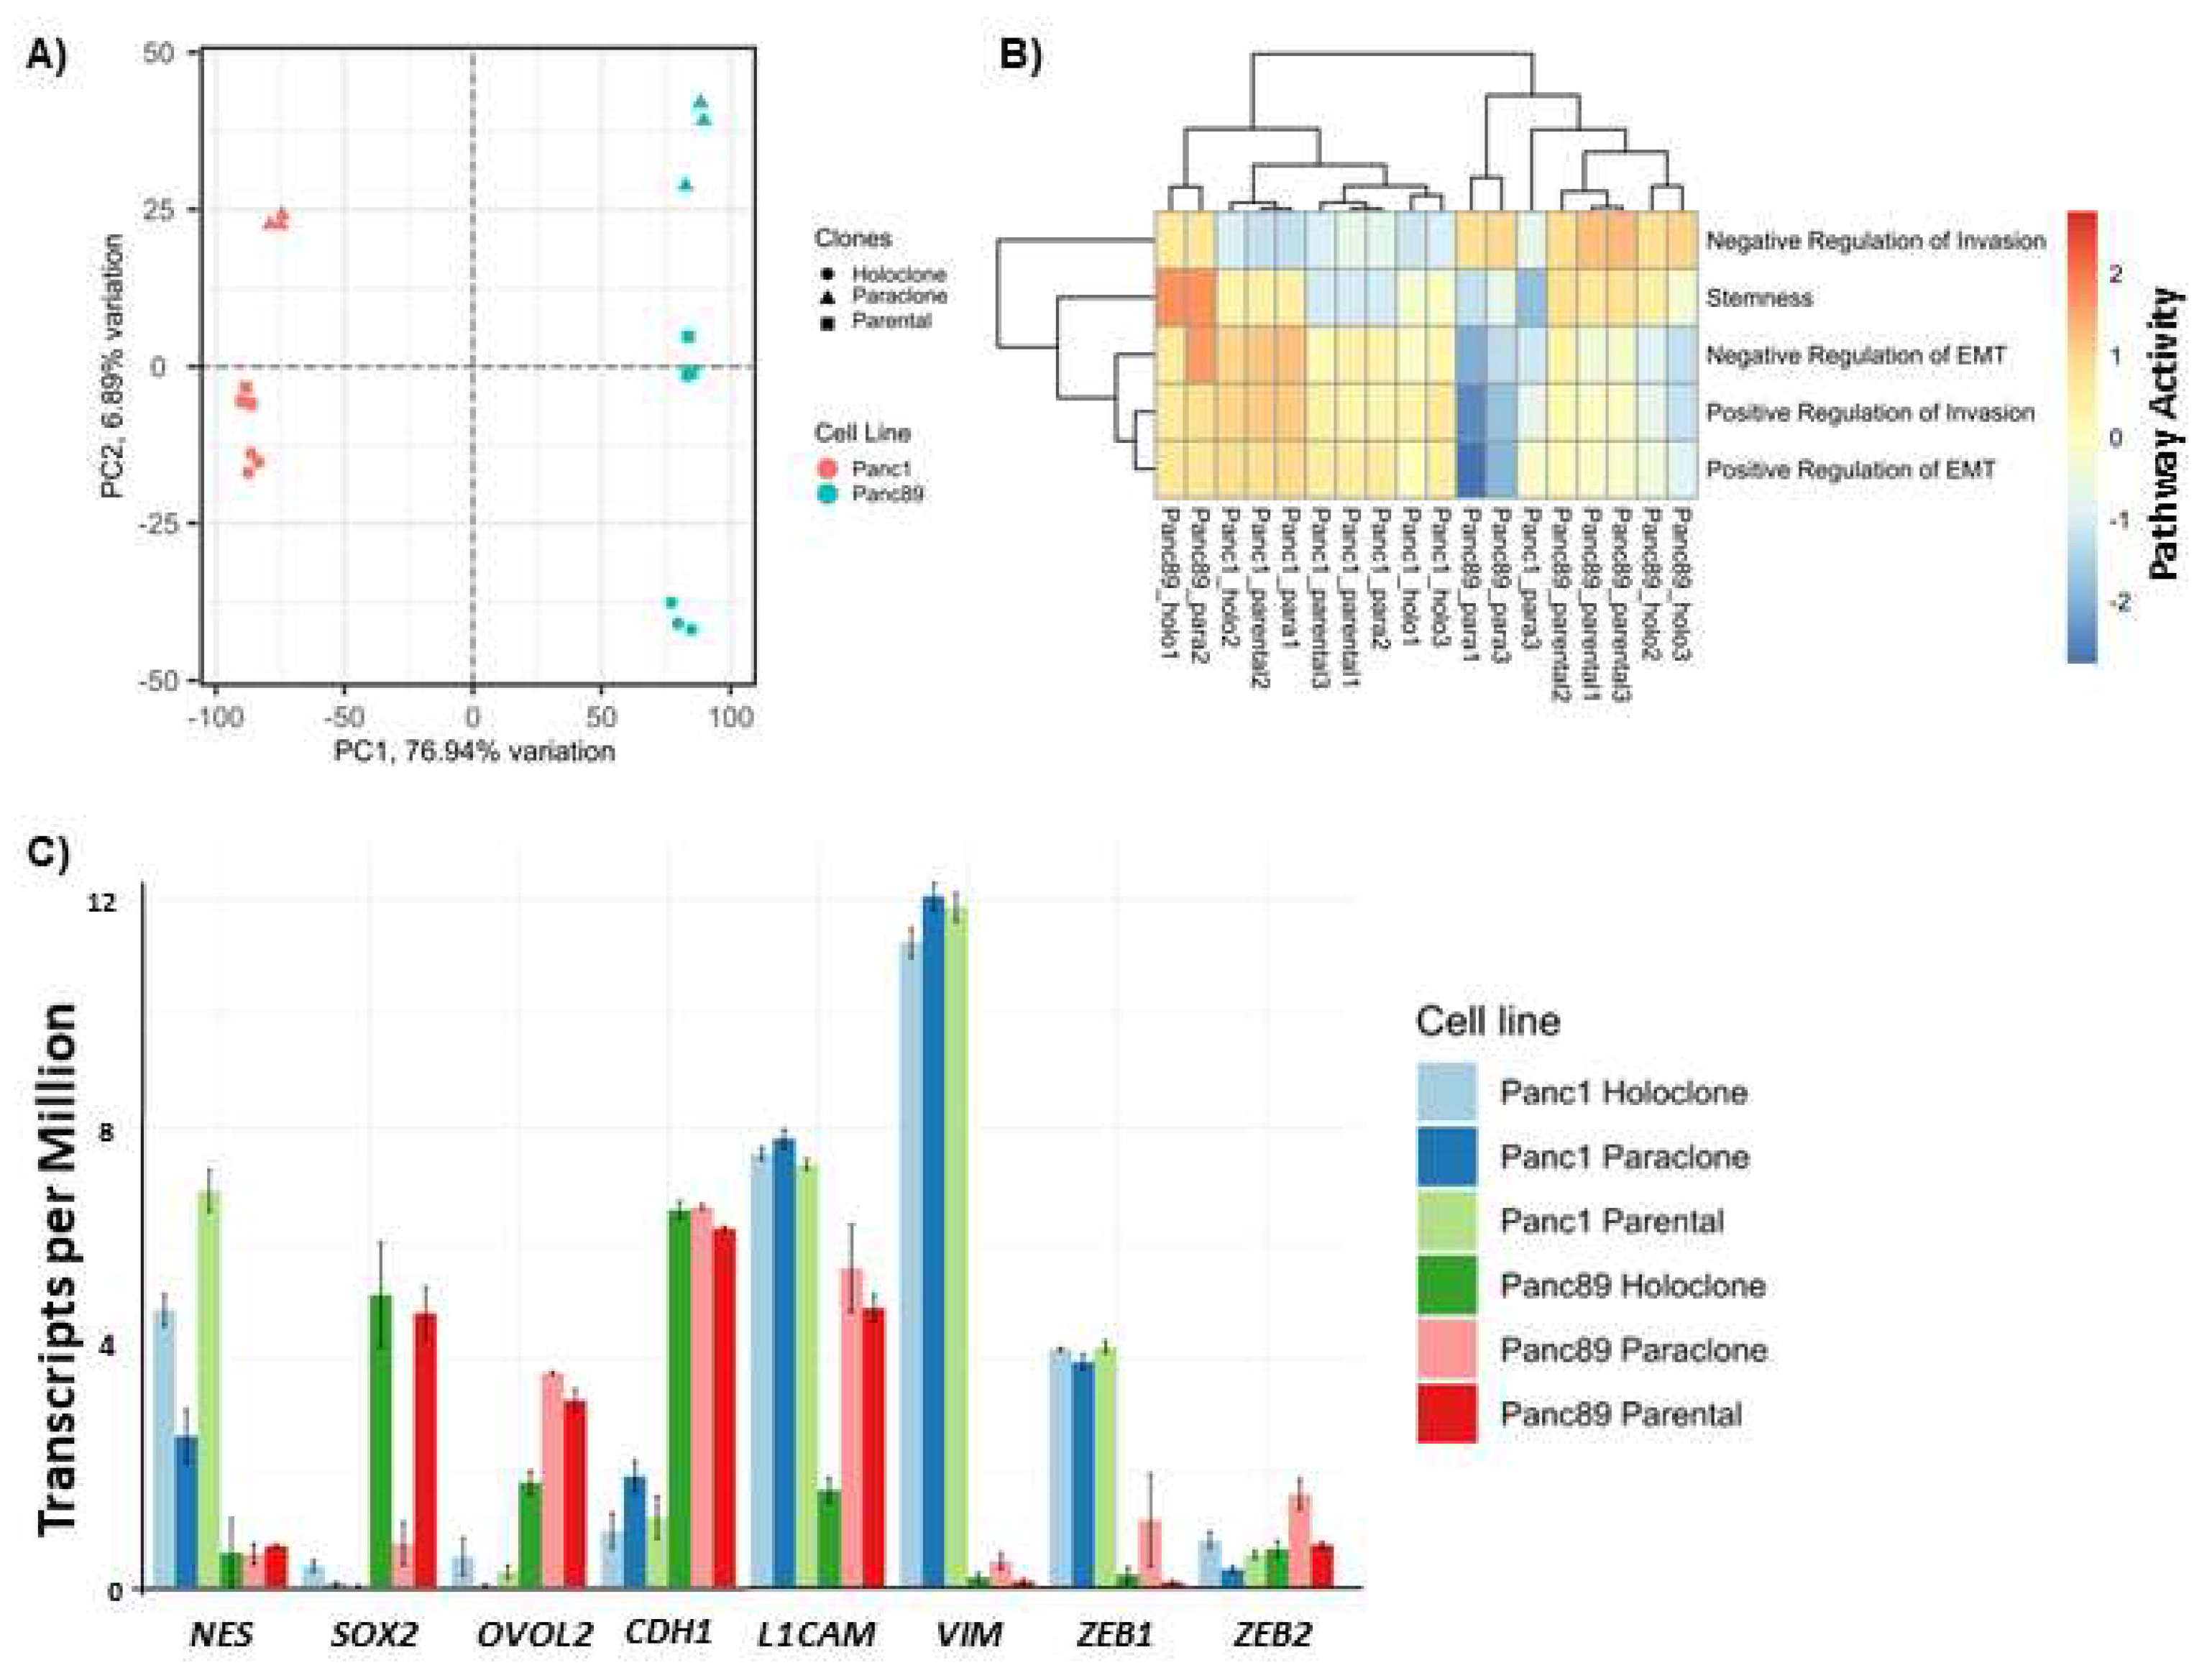
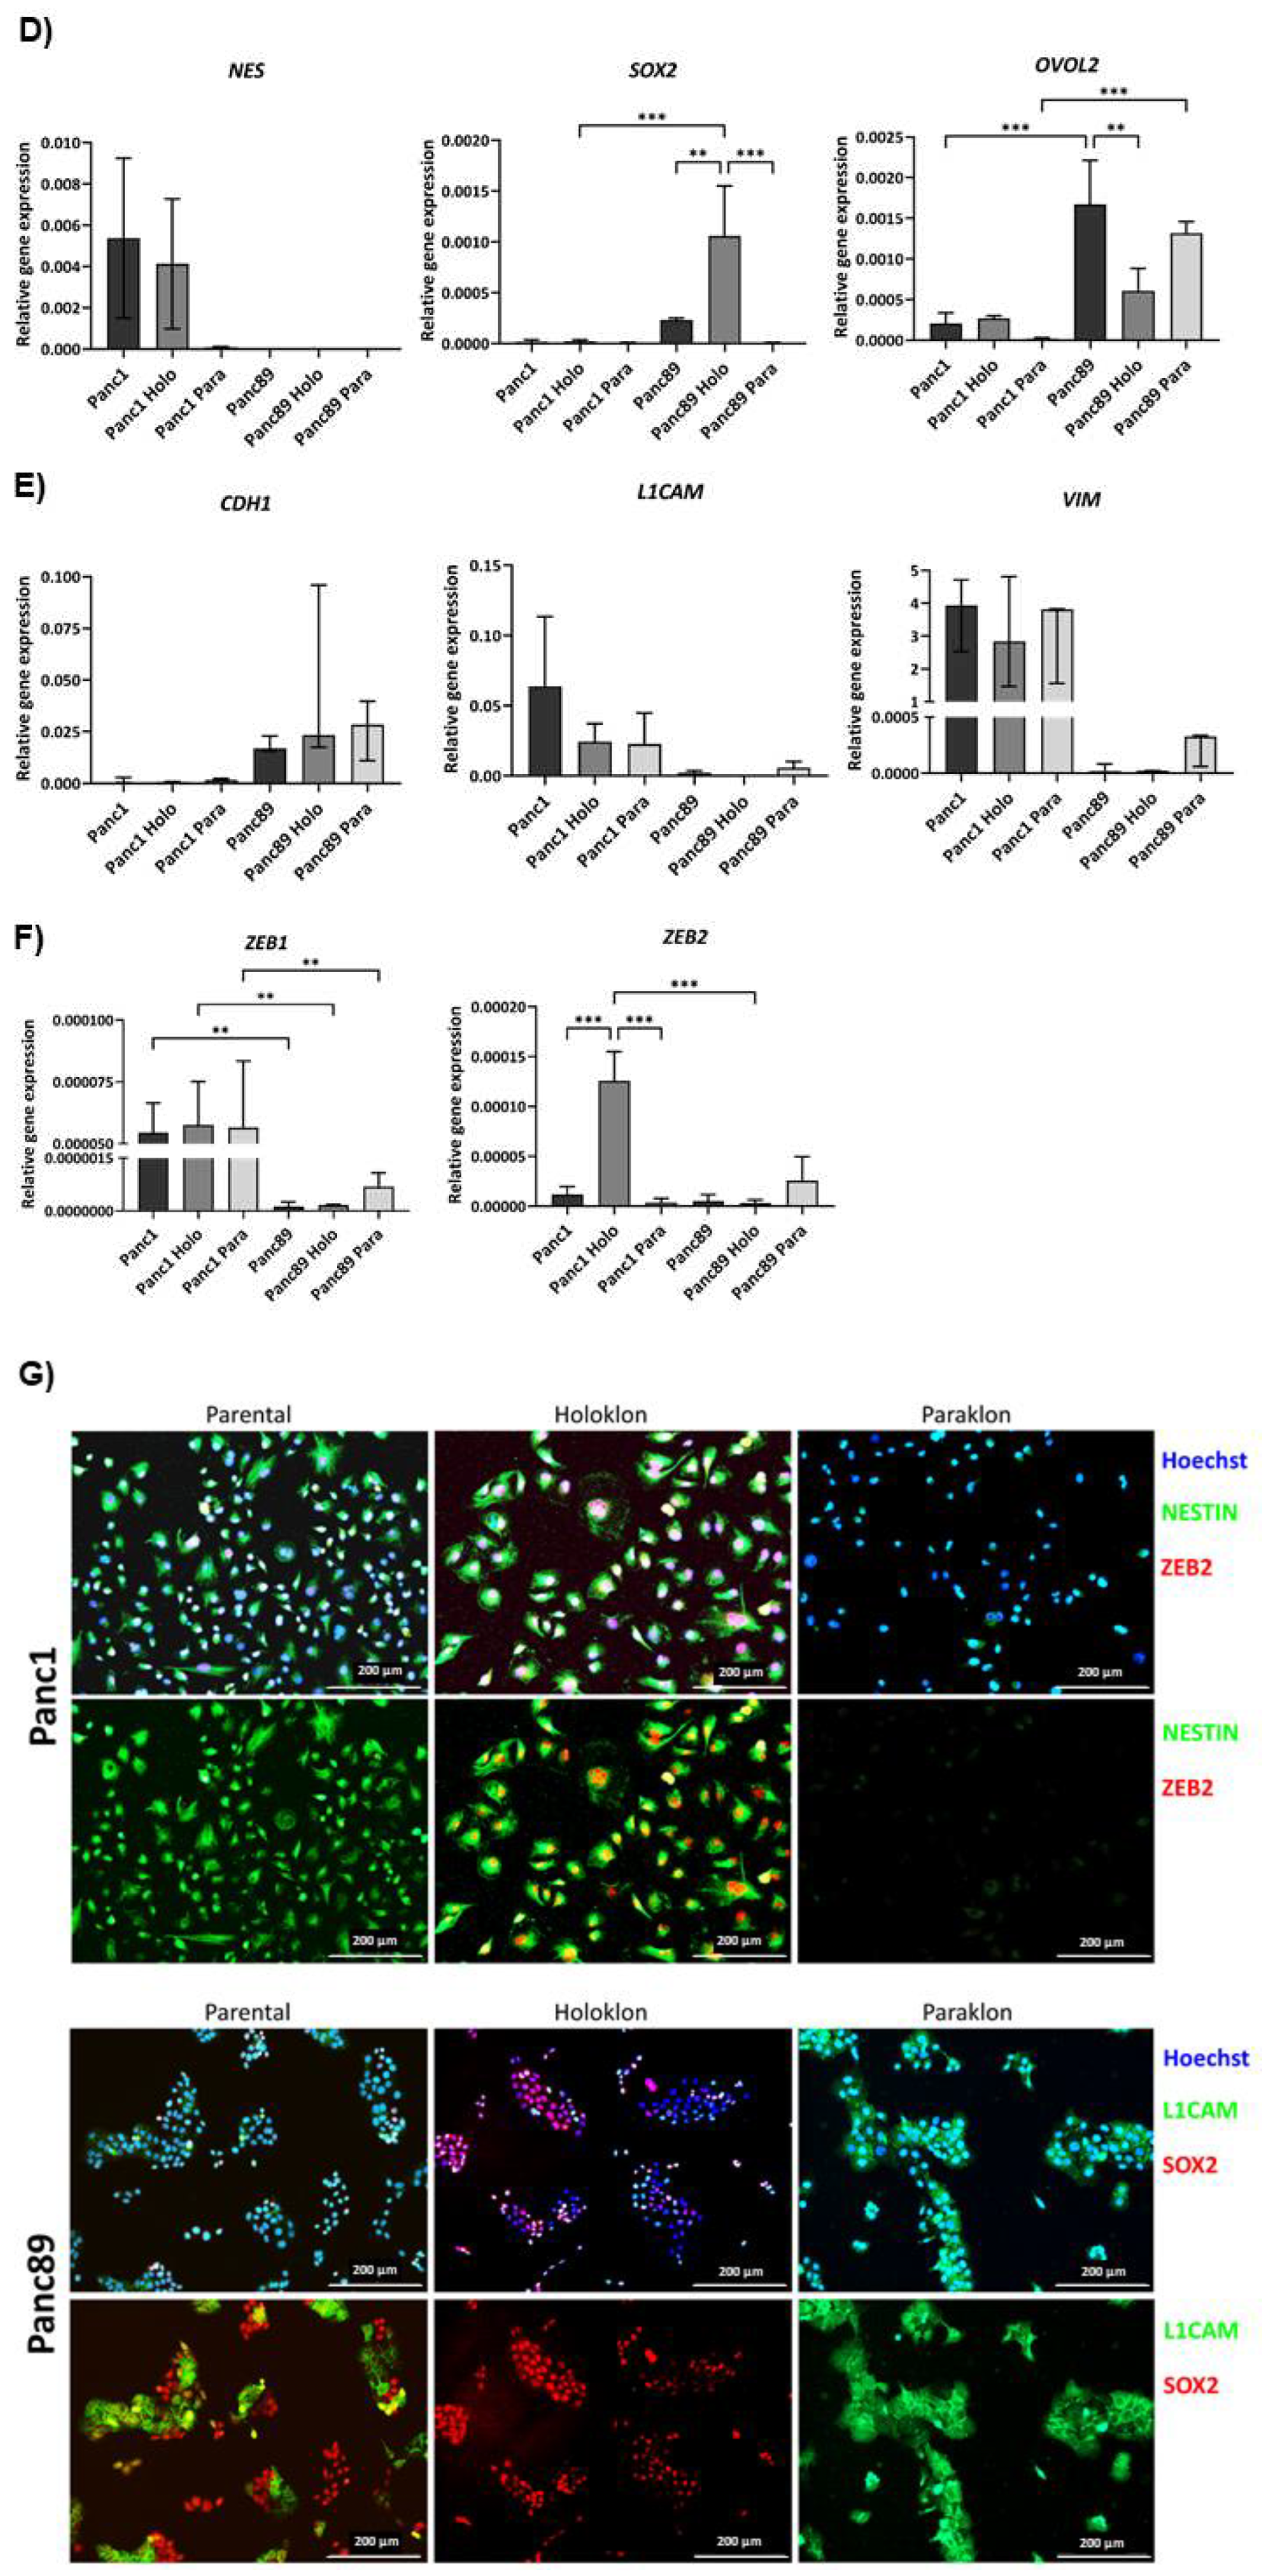
Preprints 90615 g002aPreprints 90615 g002b
Figure 3. Panc1 and Panc89 cell variants show different characteristics regarding cell growth rates and response to chemotherapy. A) Growth rate analysis of parental Panc1 and Panc89, as well as Holo- and Paraclone cells revealed Panc89 cell lines to show faster cell growth compared to Panc1 cell lines. 5×10³ cells of each cell line were seeded in a 96-well plate in triplicates and nuclei number was monitored via Hoechst 33342 staining for 168 h. Data are depicted as total number of counted cell nuclei. B) Panc1 and Panc89 cell variants were seeded at 5×10⁴ cells in duplicates in 96-well plates. After 24h, cells were left untreated or treated with 0.0038 µM Gemcitabine. After 72h, cells were stained with Hoechst 33342 for nuclei count analysis and nuclei number of treated cells was normalized to nuclei number of untreated cells. Every analysis was performed with independent experiments n = 3. (kNuclei count = growth rate).
Preprints 90615 g003
Figure 4. Panc1 and Panc89 cell lines show variances in their migration, invasion and adhesion abilities. A) Migration ability of parental Panc1 and Panc89 as well as Holo- and Paraclone cells was determined by monitoring the increase of cell confluence on a cell-free gap for 8h, revealing Panc89 cell lines to show increased cell migration compared to Panc1 cell lines. B) Representative images of cell migration of Panc1 and Panc89 cell variants after 8h. D) Representative images of spheroid formation and invasion ability of Panc1 and Panc89 cell variants. E) Spheroid size for Panc1 cell variants on day 0 and day 3 and Panc89 cell variants on day 0 and day 7. F) Analysis of the number of invasive fronts of Panc1 cell variants (day 1, day 3) and Panc89 cell variants (day 5, day 7). F) Analysis of invasion distance of Panc1 cell variants (day 1, day 3) and Panc89 cell variants (day 5, day 7). H) Adhesion assays for Panc1 and Panc89 cell variants were performed with liver endothelial cells, lung endothelial cells and mesothelial cells for 4h. Data of n = 3 independent experiments are shown.
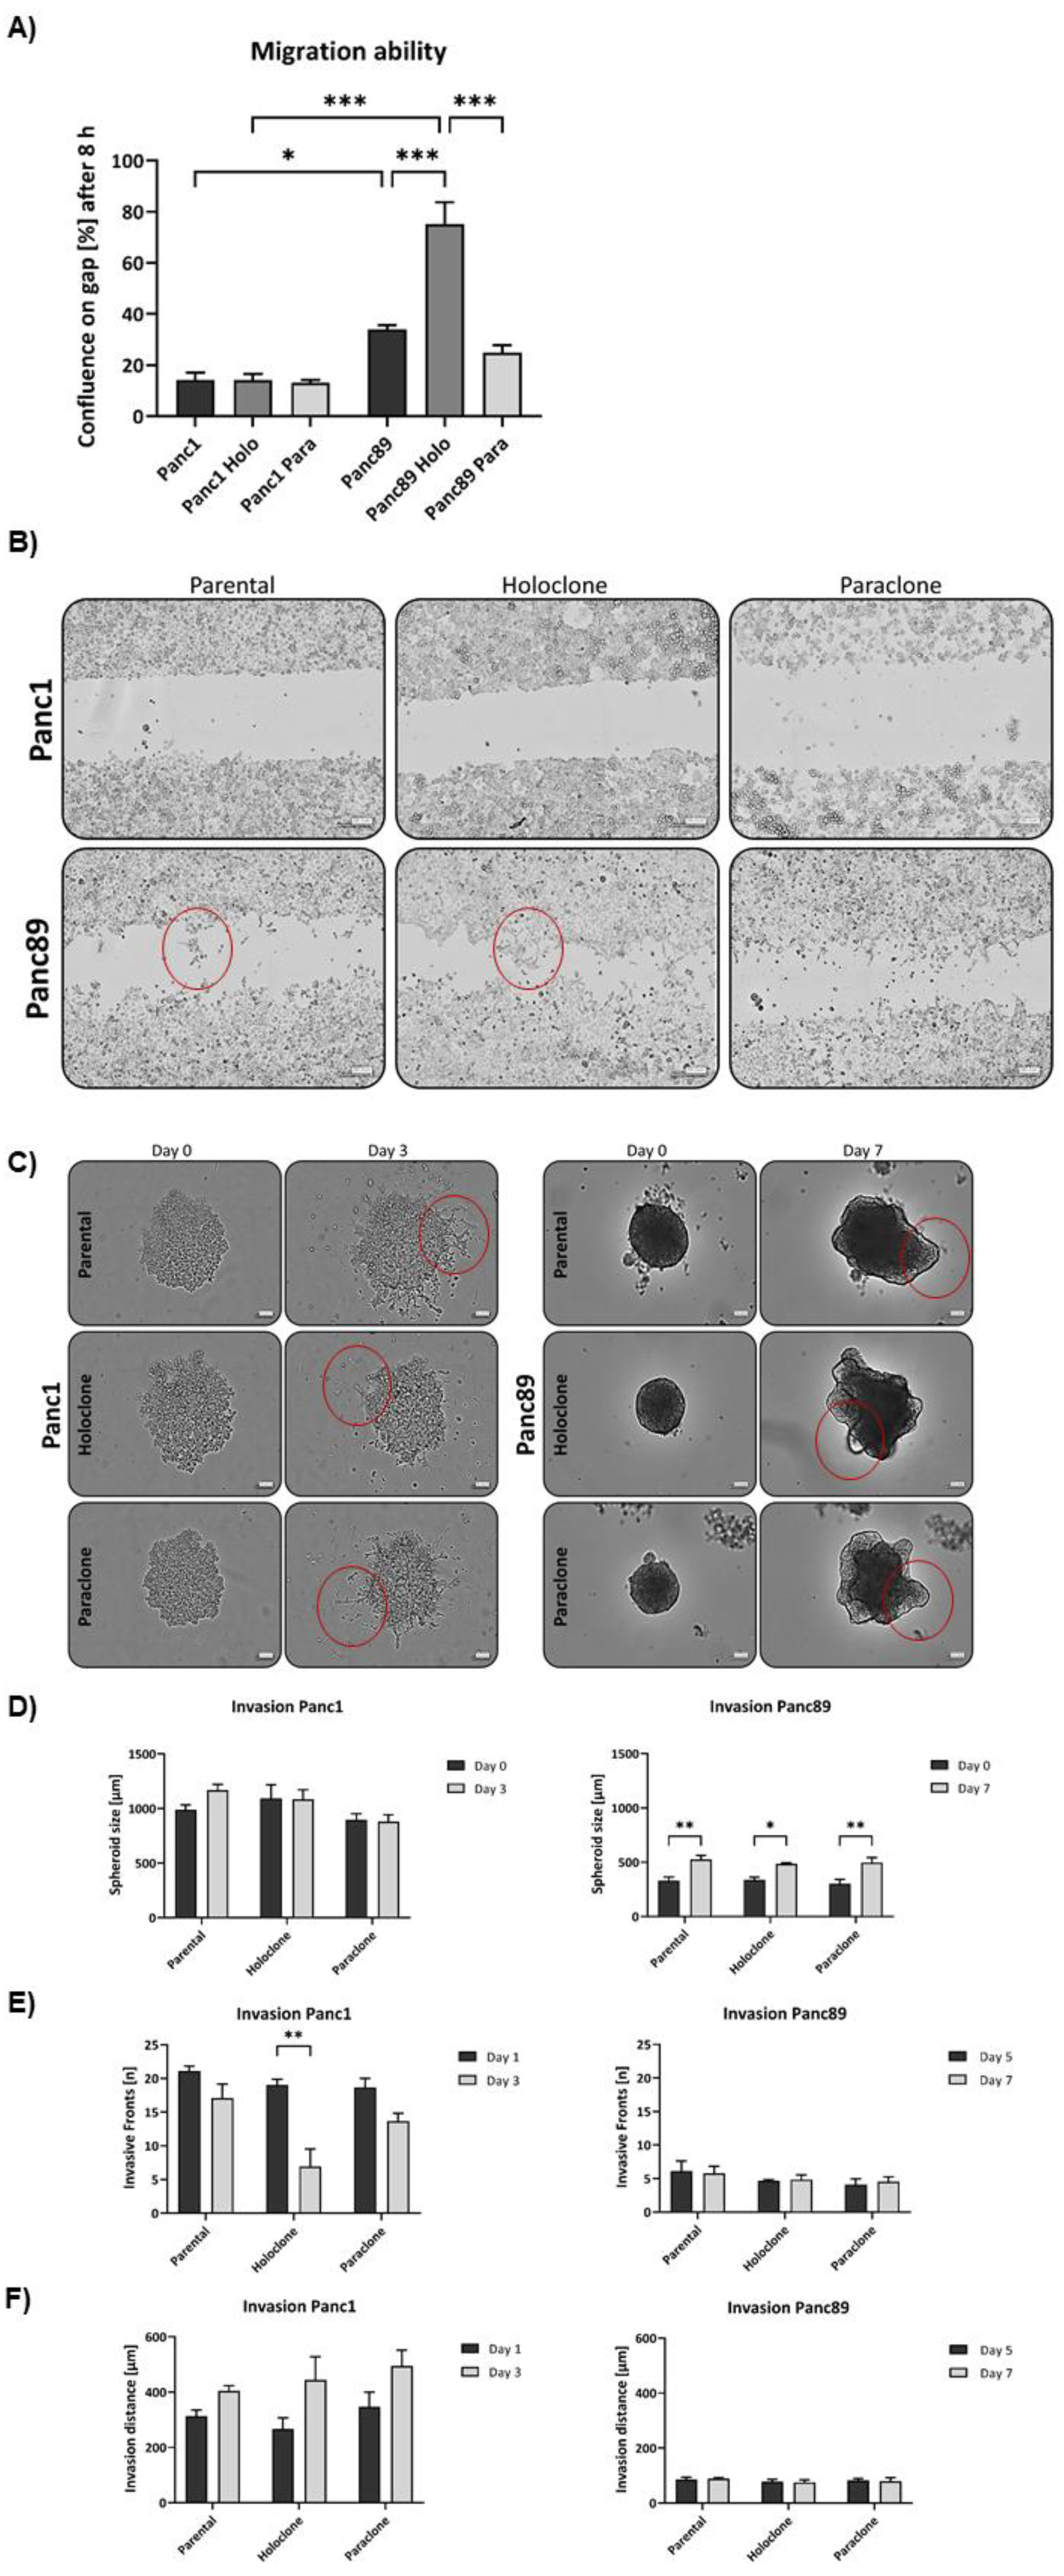
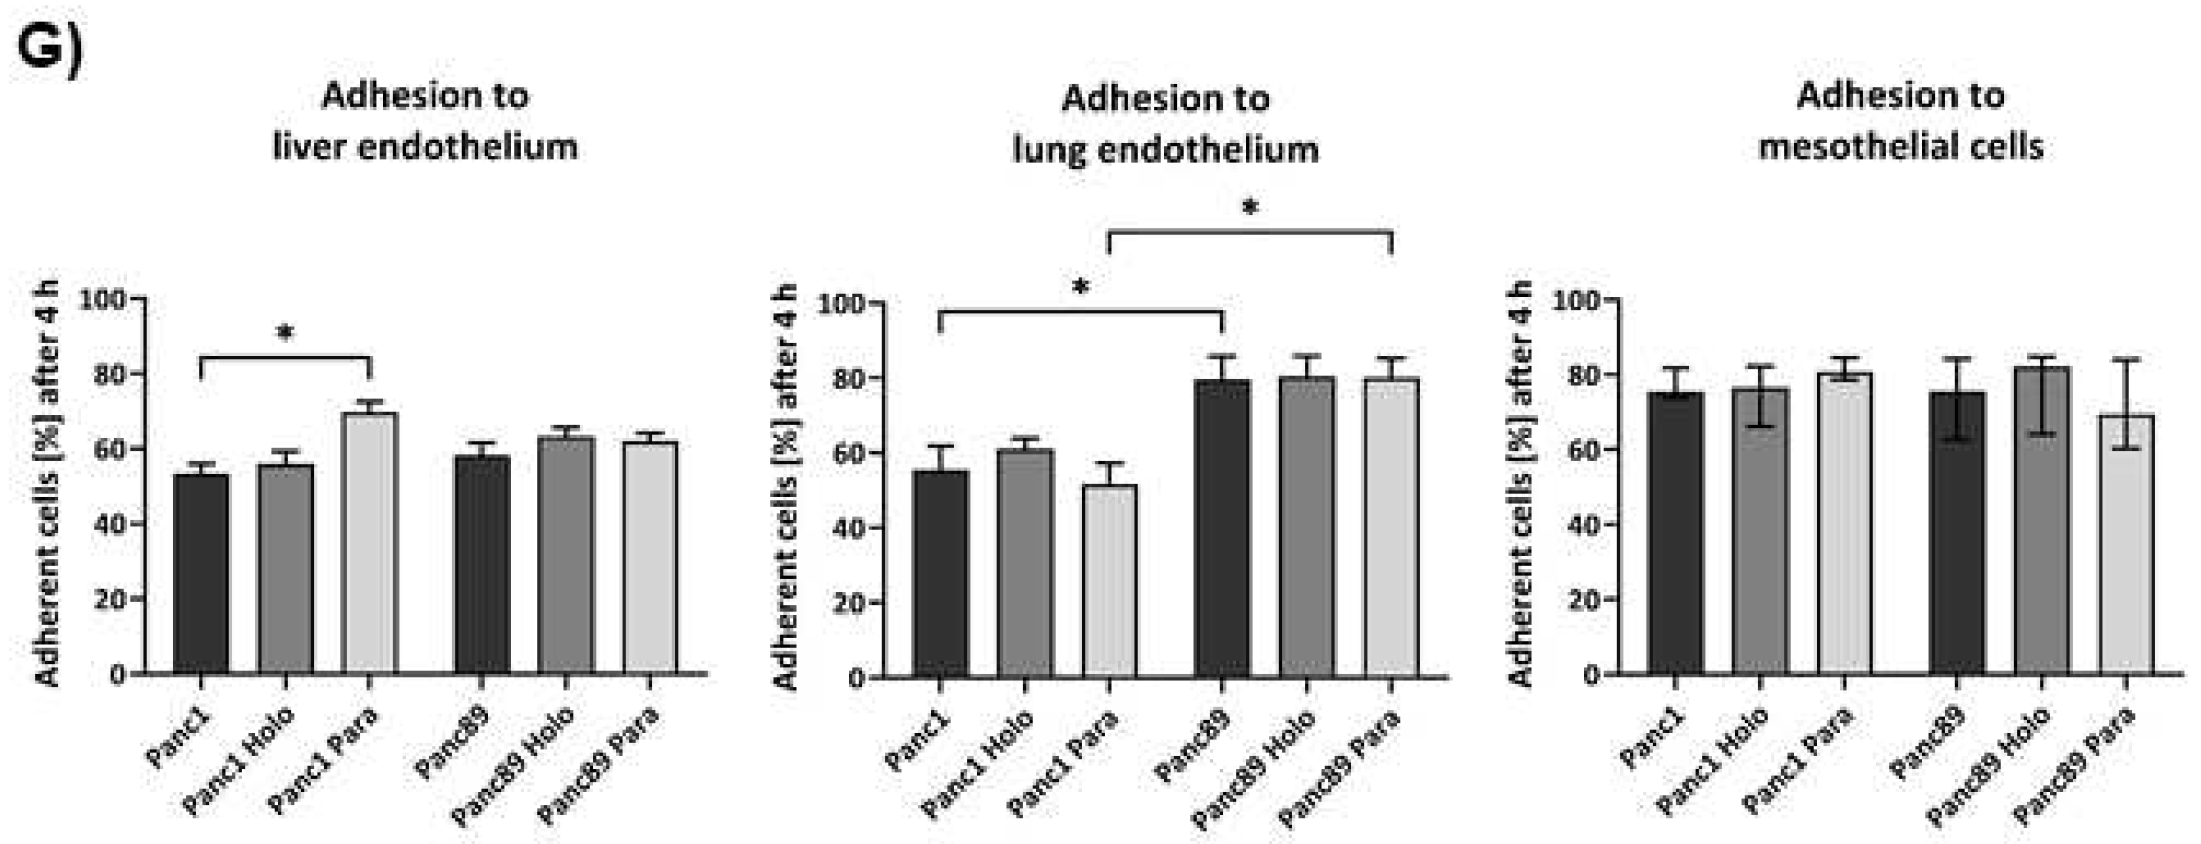
Preprints 90615 g004aPreprints 90615 g004b
Figure 5. Panc1 and Panc89 cell clones differ with respect to their metastatic capacity in vivo. Mice were inoculated intrasplenically with 1×10⁴ Panc1 or Panc89 Holo- or Paraclone cells (group of ten mice per cell line). A) Kaplan-Meier-Survival analysis of animals inoculated with Panc1 or Panc89 Holo- and Paraclone cells. B, C) Macroscopic tumor areas [mm3] and organs of macroscopic tumor manifestation in Panc1 and Panc89 Holo- or Paraclone cell inoculated mice. D, E) Microscopic tumor areas [mm2] as well as number and location of microscopic tumors after staining of tissue sections. Statistical analysis was performed with unpaired t-test for non-parametric data and Mann-Whitney test. (Holo = Holoclone cells, Para = Paraclone cells, POD = post-operative day).
Preprints 90615 g005
Figure 6. Panc1 and Panc89 Holo- and Paraclone tumors exhibit differences in EMT- and CSC- marker expression. Mice were inoculated intrasplenically with 1×10⁴ Panc1 or Panc89 Holo- or Paraclone cells (group of ten mice per cell line) and extracted tissues and tumor lesions were stained for the epithelial marker A) E-cadherin, the mesenchymal marker B) L1CAM, the EMT-inducers C) ZEB1 and D) ZEB2 and the CSC-markers E) Nestin and F) SOX2. Representative pictures of stained tissues of Panc1 and Panc89 Holo- or Paraclone tumors are presented in the left and middle picture panels, the right panel shows the statistical analysis of frequency and intensity score of positively stained cells. The upper row shows the data of analyzed Panc1 Holo- and Paraclone lesions, the lower panel shows the data of Panc89 Holo- and Paraclone lesions. Scale bar = 100 µm.
Preprints 90615 g006aPreprints 90615 g006b
Table 1. Target genes, primer sequences, and annealing temperatures used for quantitative polymerase chain reaction.
Preprints 90615 i001
* = Primers purchased from Eurofins Genomics GmbH (Ebersberg, DE). Stocks of forward (fw) and reverse (rv) diluted at 1 pmol/µl in nuclease-free ddH2O. ** = Primers purchased from RealTime Primers (via Biomol, Hamburg, DE). Provided as stocks of 50 µM primer mix (containing fw and rv primer) in nuclease-free ddH2O supplemented with 10 mM Tris-HCL and 0.1 mM EDTA (pH 7.5).
Table 2. List of antigen retrieval conditions.
Preprints 90615 i002
Table 3. List of antibodies used for IHC of FFPE tissue sections from Panc1 and Panc89 Holo- or Paraclone cell inoculated animals.
Preprints 90615 i003
Table 4. Frequency Score (= % positively stained cells) and Intensity score (= intensity of staining) used for quantification of IHC analysis.
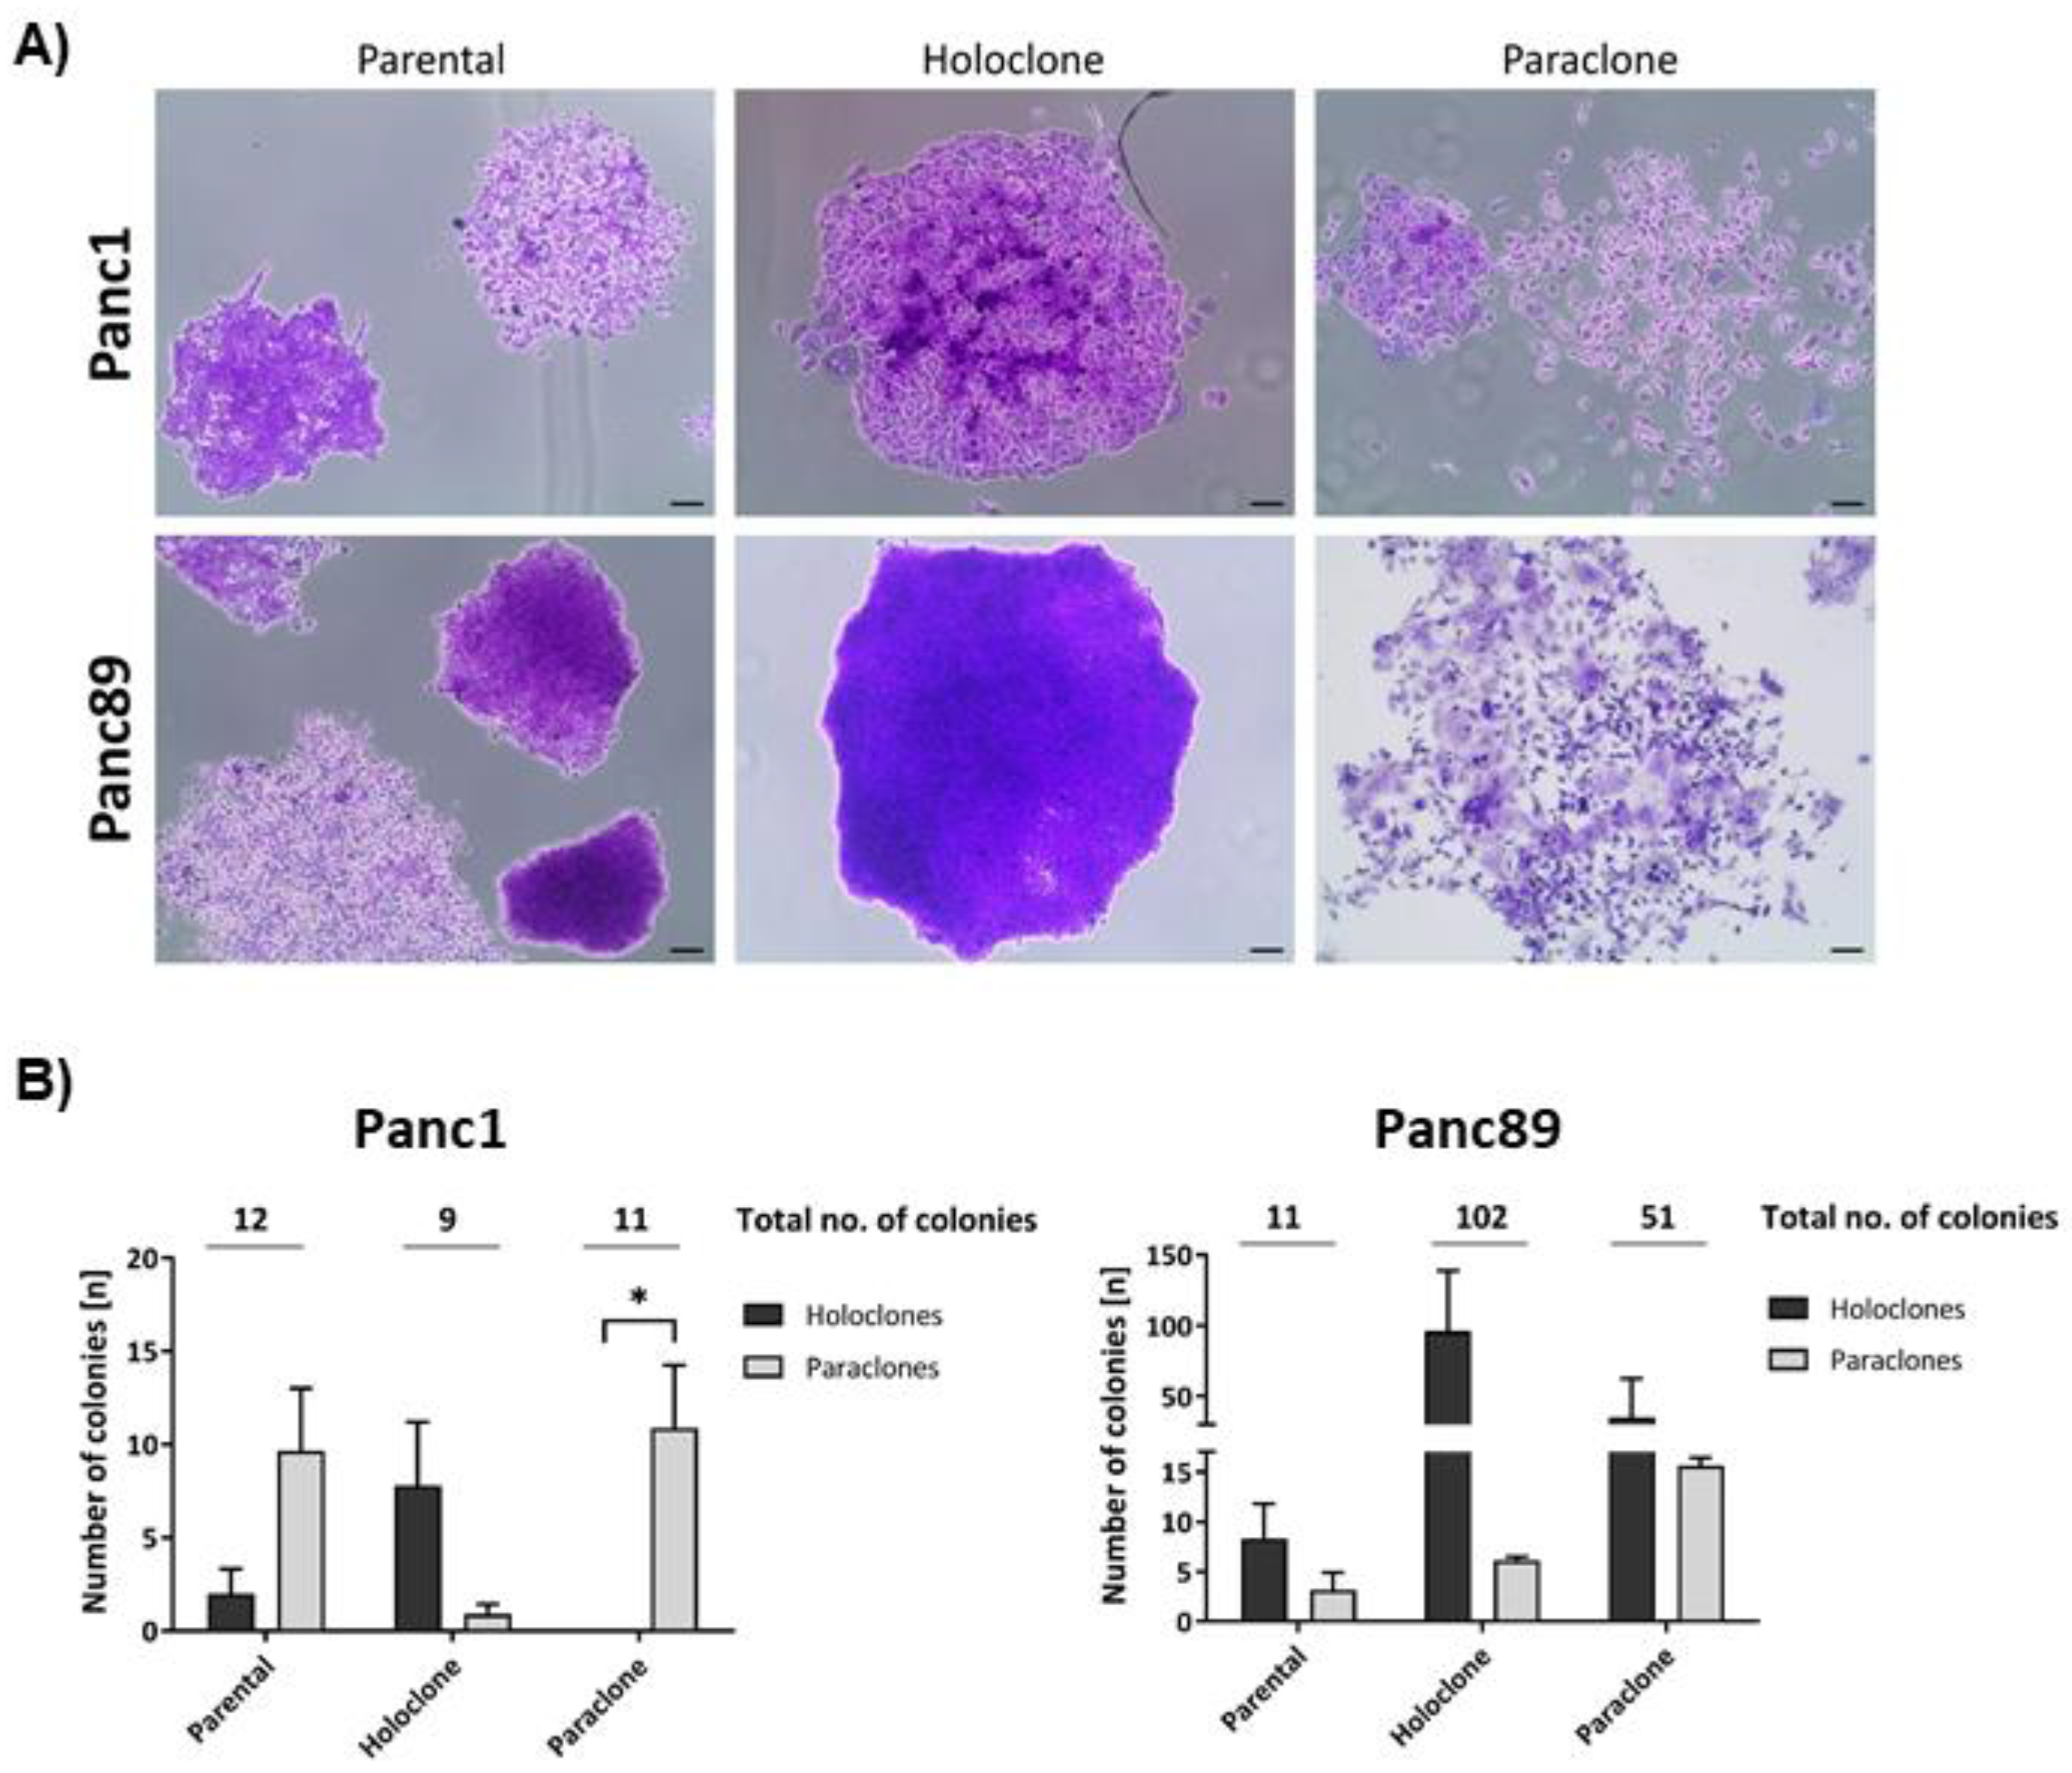
Preprints 90615 i003
Disclaimer/Publisher’s Note: The statements, opinions and data contained in all publications are solely those of the individual author(s) and contributor(s) and not of MDPI and/or the editor(s). MDPI and/or the editor(s) disclaim responsibility for any injury to people or property resulting from any ideas, methods, instructions or products referred to in the content.
Copyright: This open access article is published under a Creative Commons CC BY 4.0 license, which permit the free download, distribution, and reuse, provided that the author and preprint are cited in any reuse.
Prerpints.org logo

Preprints.org is a free preprint server supported by MDPI in Basel, Switzerland.

Subscribe

© 2024 MDPI (Basel, Switzerland) unless otherwise stated