1. Introduction
The improved intelligent transport system (ITS) concept known as Cooperative ITS (C-ITS) is a step towards the ideal smart city concept which can significantly improve the urban traffic network quality [
1,
2] with the proper implementation approach. In that sense, all functional areas of ITS [
3] such as traveller information systems, traffic control, incident management, and public transport management are mandatory tools for the improvement of traffic network quality. It is known that the quality of the urban traffic network directly affects the overall quality of living in cities. Regarding energy efficiency and fuel consumption, some agencies such as the International Energy Agency and the European Environment Agency are estimating that by 2050. traffic and transport will cause more than 50% of fuel usage, 40% of CO
2 emissions, and over 70% of other exhaust gas emissions [
4,
5]. Also, it is possible to distinguish different causes of exhaust gas emissions. According to [
6], nearly 22% of spent fuel is caused by excessive speed, inefficient traffic control, ineffective and aggressive acceleration and deceleration. As mentioned before, the C-ITS concept has the potential to enhance these parameters and address the underlying causes. One of the goals of the European eCoMove project [
7] was to prove (in the simulation environment) that the reduction of CO
2 and NO
x emissions can be achieved only by respecting the optimum/recommended speed limitations [
8]. Another approach to minimization of fuel consumption and exhaust gas emission is better (optimized) routing of personal vehicles in the urban traffic network and adaptive signal control at signalized intersections which directly affects the number of stop-and-go actions and the decrease of average delays on signalized intersections [
9,
10,
11]. Simulation software is widely used for the evaluation of different approach methods and ideas based on traffic control, optimization of vehicle movement through network, etc. Some authors presented the link between average travel times and fuel consumption with the usage of simulation-based optimization [
12], the upgrade of this research was conducted with q-learning algorithms where the improvements in CO
2 reduction and the number of vehicles in queue length were presented [
13]. Considering the possibilities of simulation of various traffic optimization methods, their impact was presented in several papers where the exhaust gas reduction was achieved with the implementation of k-means and LOESS (Locally Weighted Scatterplot Smoothing) algorithms [
14], dynamic speed limit control algorithms [
15] and adaptive transit priority strategies in urban areas [
16]. It is possible to conclude that advanced traffic control strategies have an impact on exhaust gas emission reduction, specifically when a complete smart city concept is implemented even though major infrastructure predispositions are necessary. At a lower level of implementation, it is possible to observe only one vehicle type (public transport vehicle, emergency vehicle, etc.) and to give priority at signalized intersections to that specific type of vehicle.
Traffic signal control, as mentioned before, is a measure that can have the most influence on ecological aspects in urban areas (regarding exhaust gas emission, noise reduction, etc.) [
17,
18]. Traditional traffic signal control (i.e., fixed signal timing) methods are not sensitive to real-time traffic variations and can be ineffective [
19], so adaptive (improved) control of signalized intersections in the context of giving priority to certain vehicle categories is suitable. Priority on signalized intersections includes providing green lights to certain vehicle categories whenever possible with three main priority strategies [
20]:
Passive techniques use predefined signal timings adapted to special needs (frequency of green lights on certain approaches, green light duration according to adjacent intersections, shortened cycle duration, etc.). Passive techniques do not need the presence of vehicles, nor the notification of their arrival at the intersection. Active priority techniques are activated only when a certain vehicle is present at the intersection or when the priority demand is sent by the vehicle. Active priority is activated within the limits of minimal safety parameters and three basic techniques are green extension, early green (red truncation) and green phase insertion. After the priority demand is sent to the traffic management centre, the system calculates the predicted time of vehicle arrival at the signalized intersection [
21]. Unconditional priority (vehicle preemption) ensures that a specific vehicle gets right-of-way through the signalized intersection by interrupting regular signal timing no matter which phase of the signal cycle is active. When the active phase ends, considering minimal safety green time, the green light for the approaching vehicle, which demanded unconditional priority, is activated. Unconditional priority is rarely used in public transport, but widely for emergency vehicles and VIP and other escorted vehicles. It can be stated that passive and active priority strategies modify the current signal timings, while the unconditional priority interrupts it and provides a green light on the desired approach as soon as possible [
18].
It is clearly visible that with the optimal selection of control strategy, it is possible to directly impact the energy consumption of vehicles in the urban traffic network which can strengthen the general idea of sustainable traffic management in urban areas. Also, by acting on certain aspects of traffic management on a local and isolated level, it is possible to contribute to the sustainability of the transport system, but with a comprehensive approach, the visibility of the impact is much greater.
The literature overview and present research in the field of traffic management with the impact on energy consumption is presented in the introduction, while the methodology and the connection of the presented idea with a specific vehicle class (escorted vehicles) is presented in the second chapter. In the third chapter, a case study regarding the modelling of unconditional priority in the city of Zagreb is presented, while the results and discussion with the presentation of future work are described in succeeding chapters respectively.
2. Model and Research Methodology
After the detection of the research area and with the presumption that improved traffic control can have a major impact on the energy efficiency and sustainability of urban traffic systems, it is necessary to define a specific problem to be processed. This paper focuses on escorted vehicles which with their presence influence the traffic flow using unconditional priority strategies. According to the Road Traffic Safety Act [
22], escorted vehicles are defined as vehicles that are monitored by the police and/or military police and are equipped with devices for giving special sound signals and red and blue light signals. Persons who may be accompanied are (state officials, delegations of foreign countries, etc.). The minimal number of escorted vehicles in one queue is not defined, but according to [
22], a vehicle queue implies at least three vehicles moving in the same direction one after the other. The communication between vehicles (cooperative V2V) is not covered by this research and can be the basis for further research.
2.1. Simulation Model Development
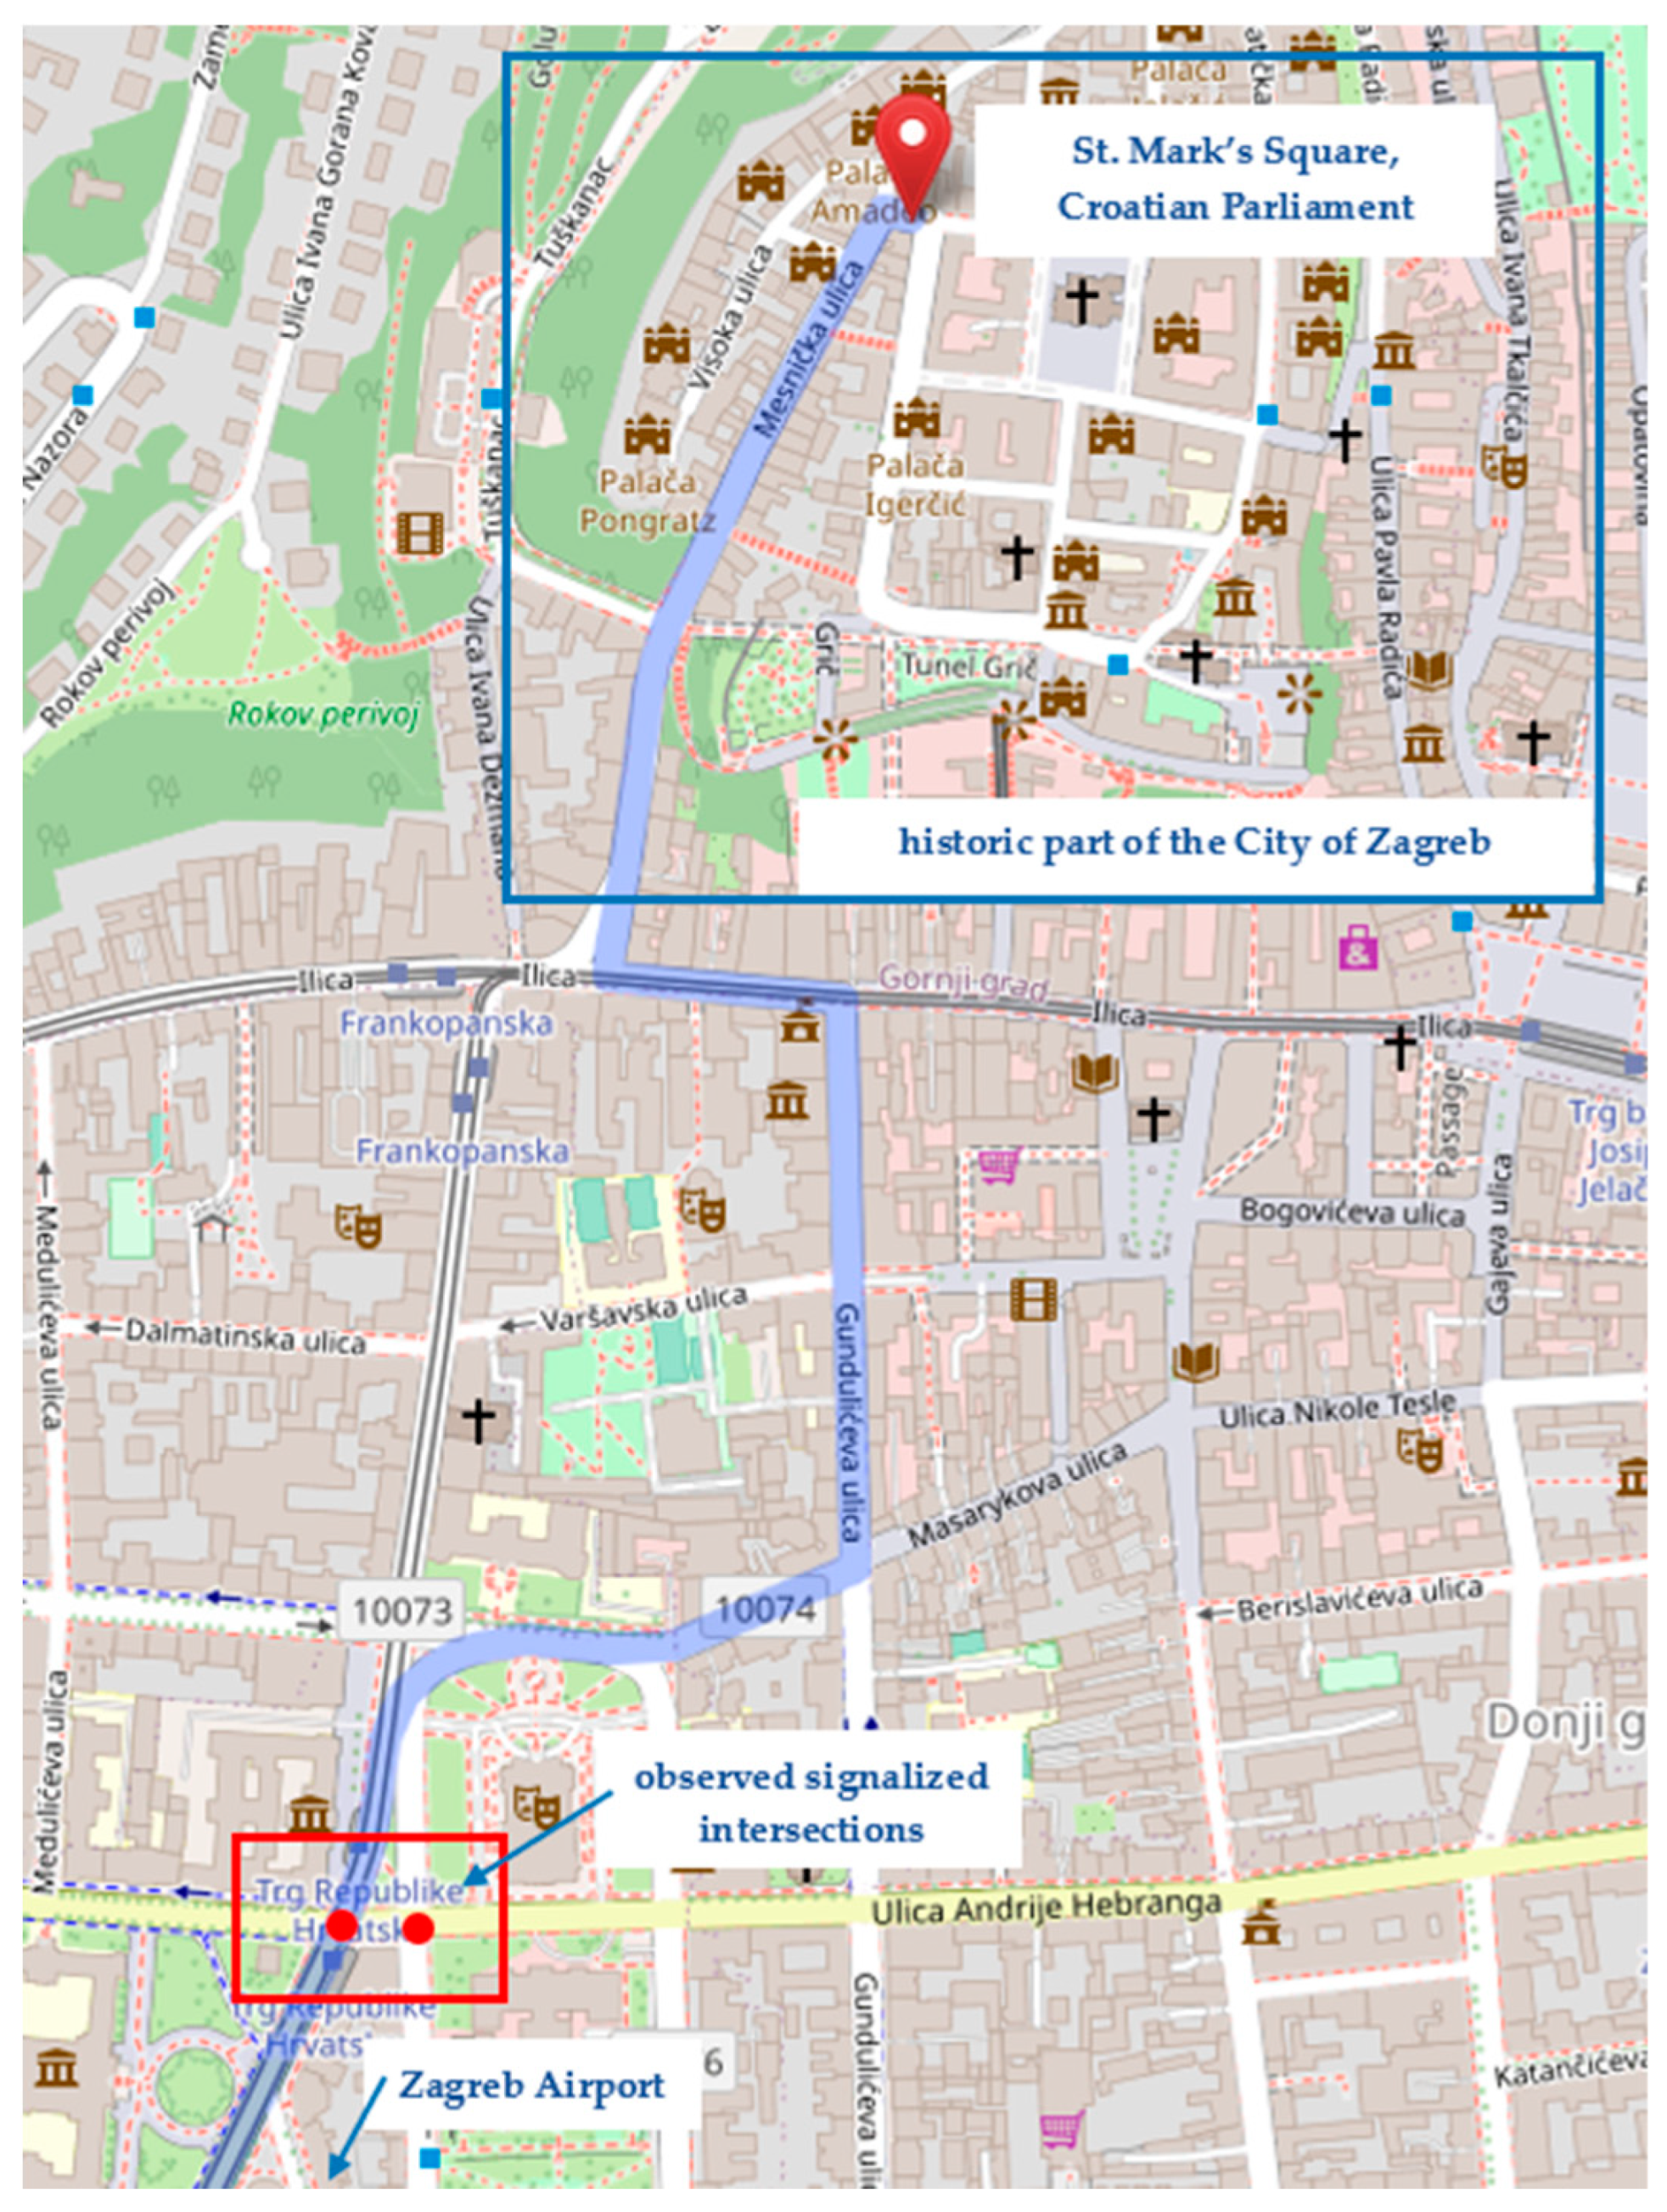
The City of Zagreb is the capital and largest city of the Republic of Croatia with a population of around 878.000 and where all government and administrative bodies are located. Despite the constant geolocation expansion of the City, all the major administrative bodies are located in the north of the City in the historic part, while the airport and two major entrances are located in the south of the City. For this research, the most common route used by escorted vehicles to the historic part of the City is shown in
Figure 1 on the mezolocation of the Zagreb map. The pin points to St. Mark’s Square where the Croatian Parliament with other administrative bodies are located. After the collection of all traffic parameters on the selected route (number of vehicles, vehicle categorization, vehicle routing, etc.), the critical signalized intersections were recognized and selected which is also depicted in
Figure 1.
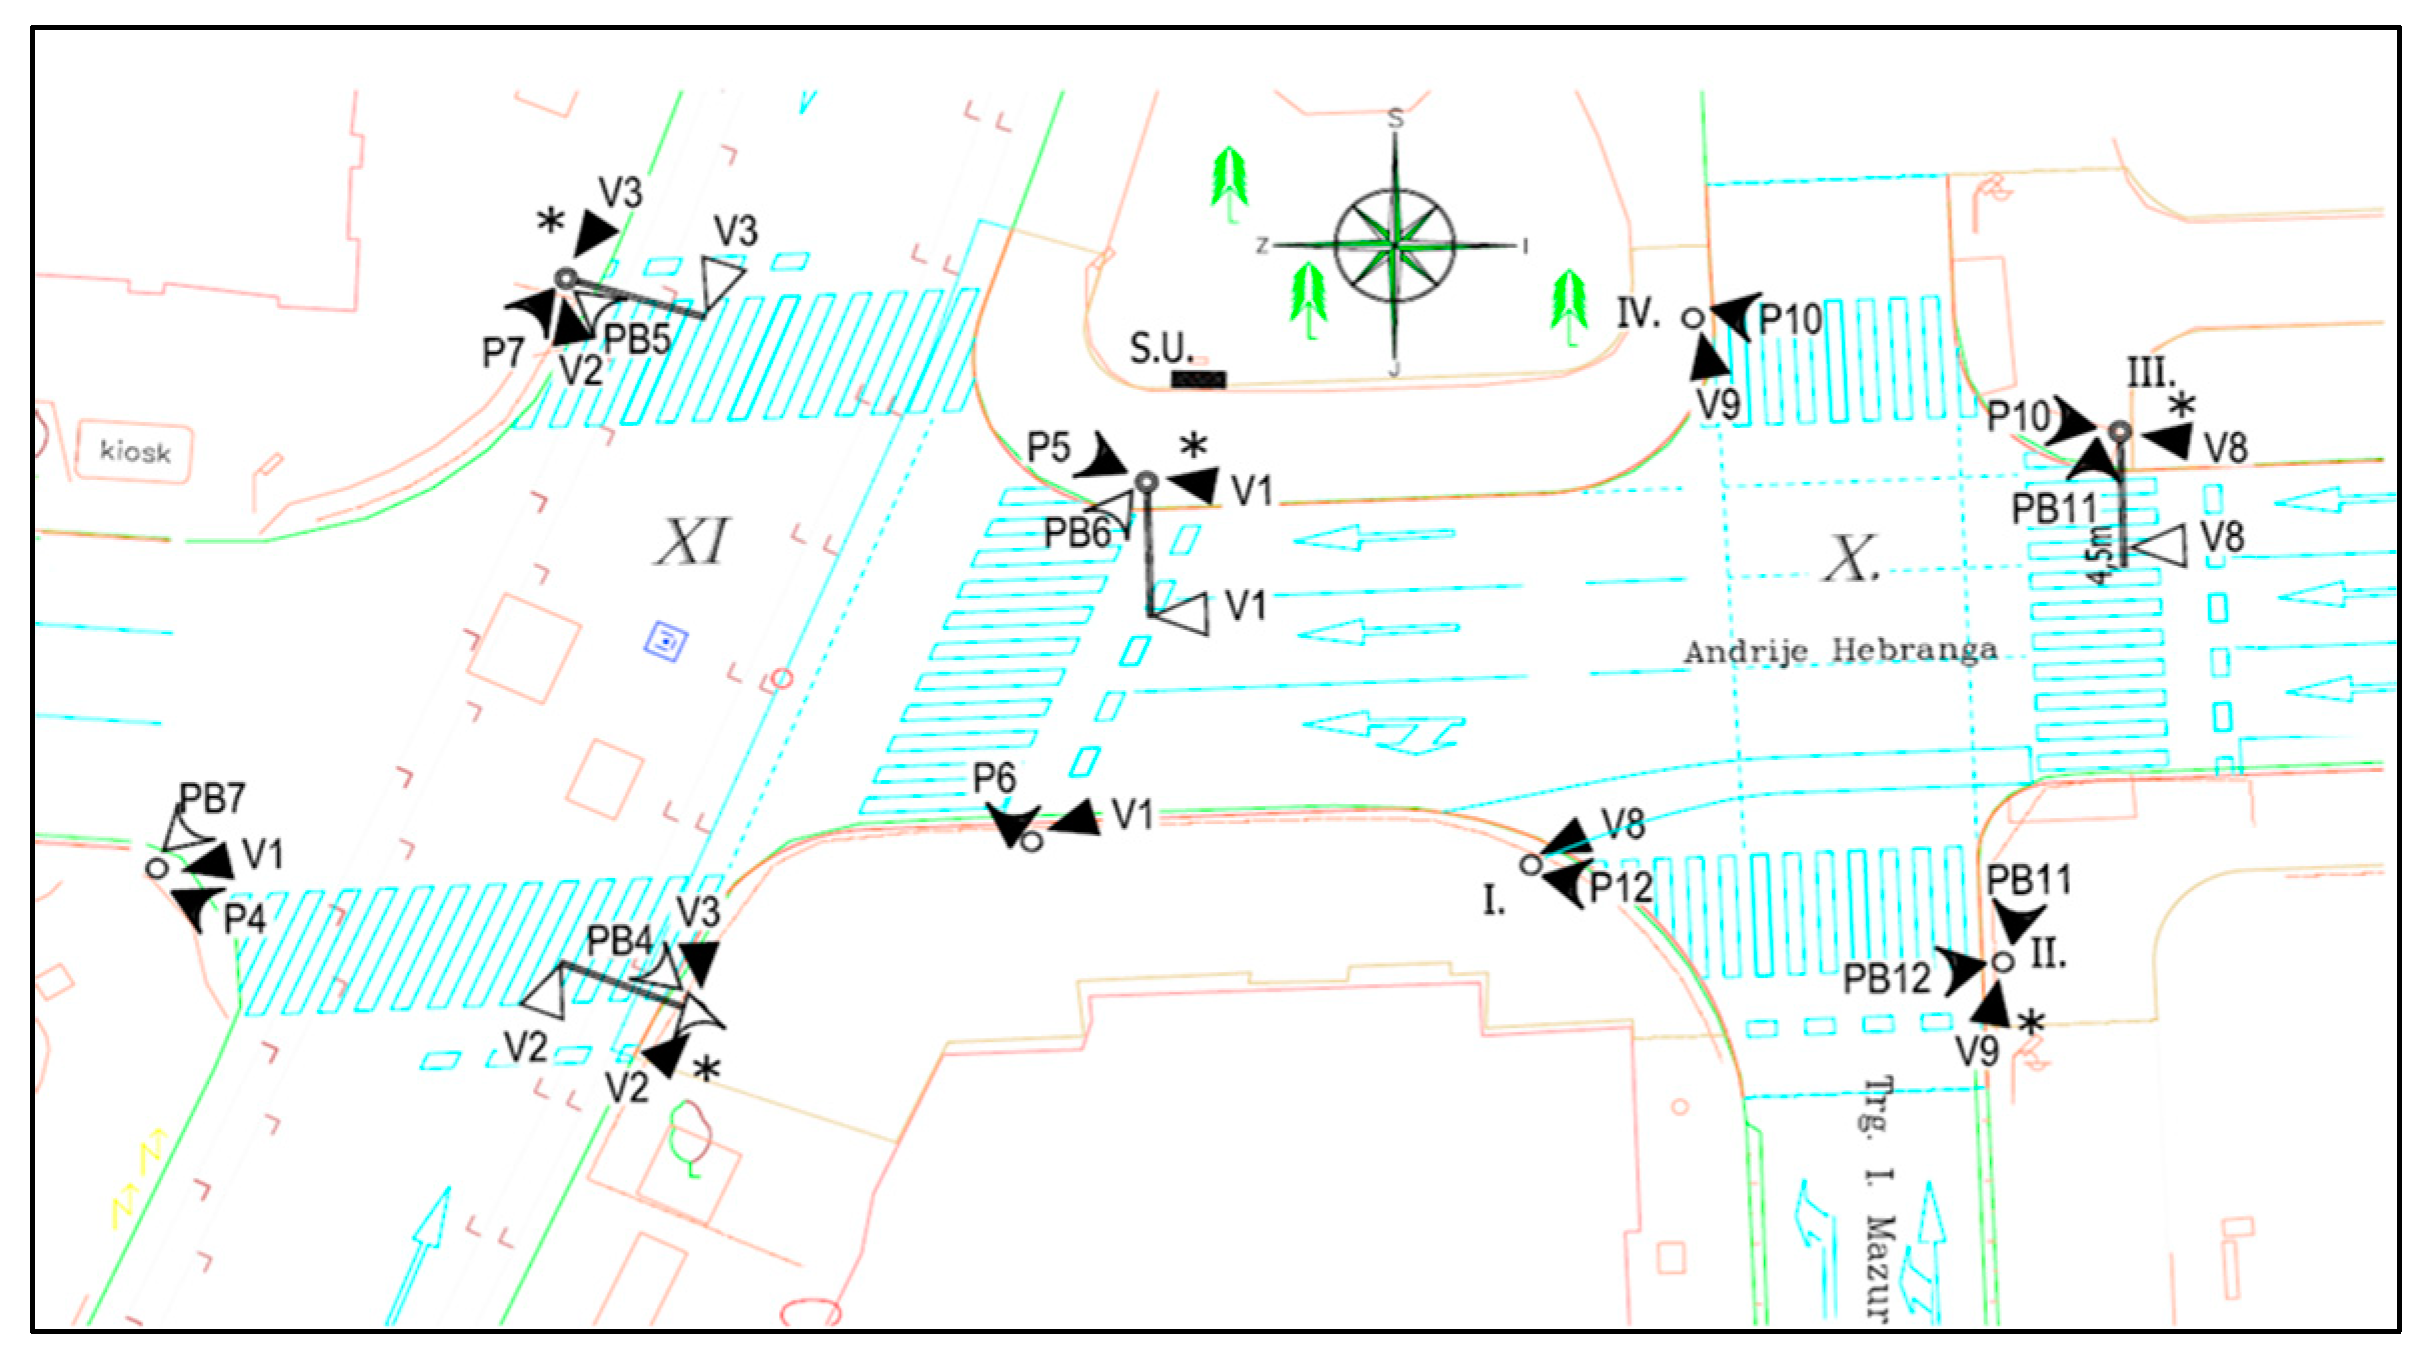
After the selection of a demonstration corridor with two signalized intersections where unconditional priority will be implemented, relevant traffic data was collected and analyzed. The morning peak hour (8 AM - 9 AM) was selected as relevant for the research. In order to create a simulation model in the PTV Vissim simulation software, physical components presented in
Figure 2 (number of lanes, lane width, the position of signal lanterns, etc.) were detected, measured and incorporated into the simulation model.
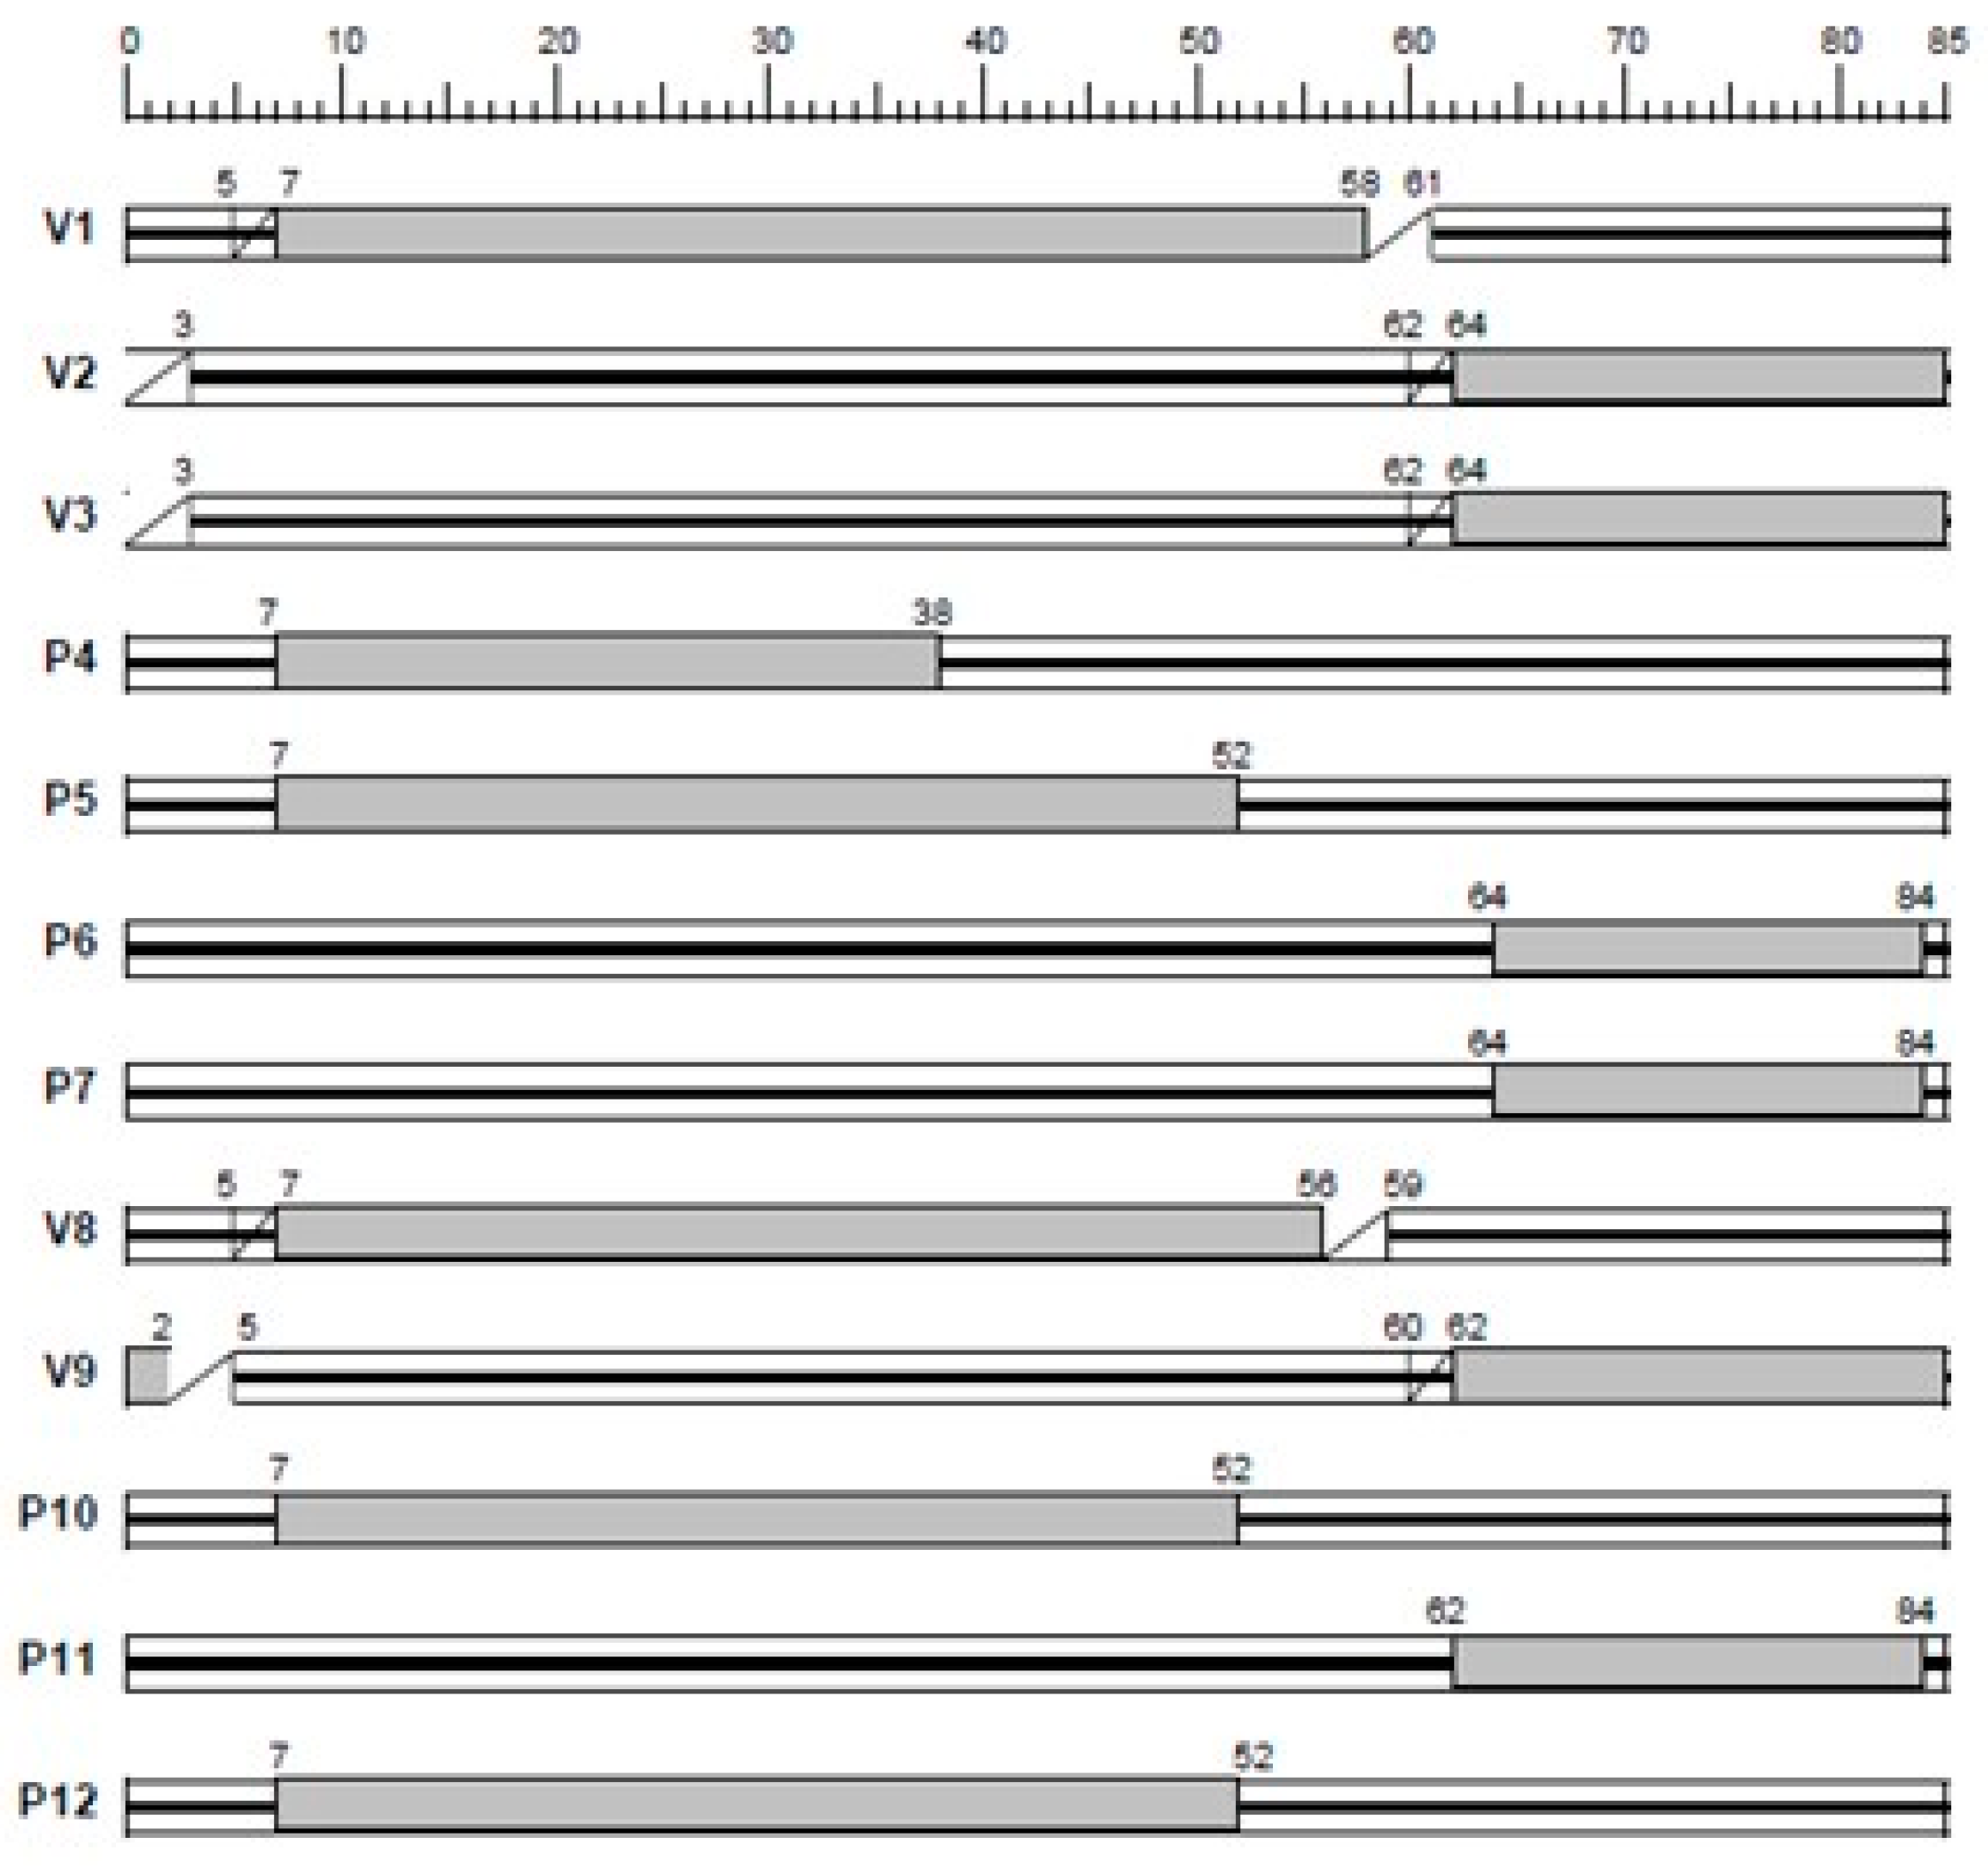
It is visible from
Figure 2 and
Figure 3 (signal timing) that both intersections are controlled from one signal controller and from that point it can be observed as one unique demonstration intersection. In that sense, four approaches of the intersection can be defined:
S1 – first south approach with signal group V2;
S2 – second south approach with signal group V9;
E – east approach with signal groups V1 and V8;
N – north approach with signal group V3.
On selected demonstration intersection, five vehicle signal groups (V1, V2, V3, V8 and V9) and seven pedestrian signal groups (P4, P5, P6, P7, P10, P11 and P12) are defined. The signal cycle is 85 [s], the intergreen matrix is calculated and implemented, and the signal timings are fixed. Respectively with signal timings (
Figure 3), main approaches and collected traffic data on the intersection, four vehicle inputs were defined as follows:
input 1 on south approach 1 – 348 [veh/h] with 0,02 heavy-duty vehicles,
input 2 on south approach 2 – 262 [veh/h] with 0,05 heavy-duty vehicles,
input 3 on east approach – 2029 [veh/h] with 0,01 heavy-duty vehicles and
input 4 on north approach – 279 [veh/h] with 0,04 heavy-duty vehicles.
Collected data was calibrated using GEH statistic [
23] with the equation
where:
M – hourly traffic from the traffic model,
C – real-world hourly traffic collected from the field.
The duration of the simulation is 4500 [s] where the first 900 [s] is used for model “warming up”, and 3600 [s] for simulation of observed peak hour. Collected and calibrated traffic data is shown in
Table 1.
According to [
23], if 85% of total traffic volume has a GEH coefficient below 5,0 the model is considered to be calibrated. Also, if the GEH coefficient is above 10,0, the model is not calibrated and the collected data and data produced in the simulation model are not relevant. The next step after the calibration of the model is the development of an unconditional priority algorithm for the selected signalized intersection, which is described in the next section.
2.2. Unconditional Priority Algorithm Development
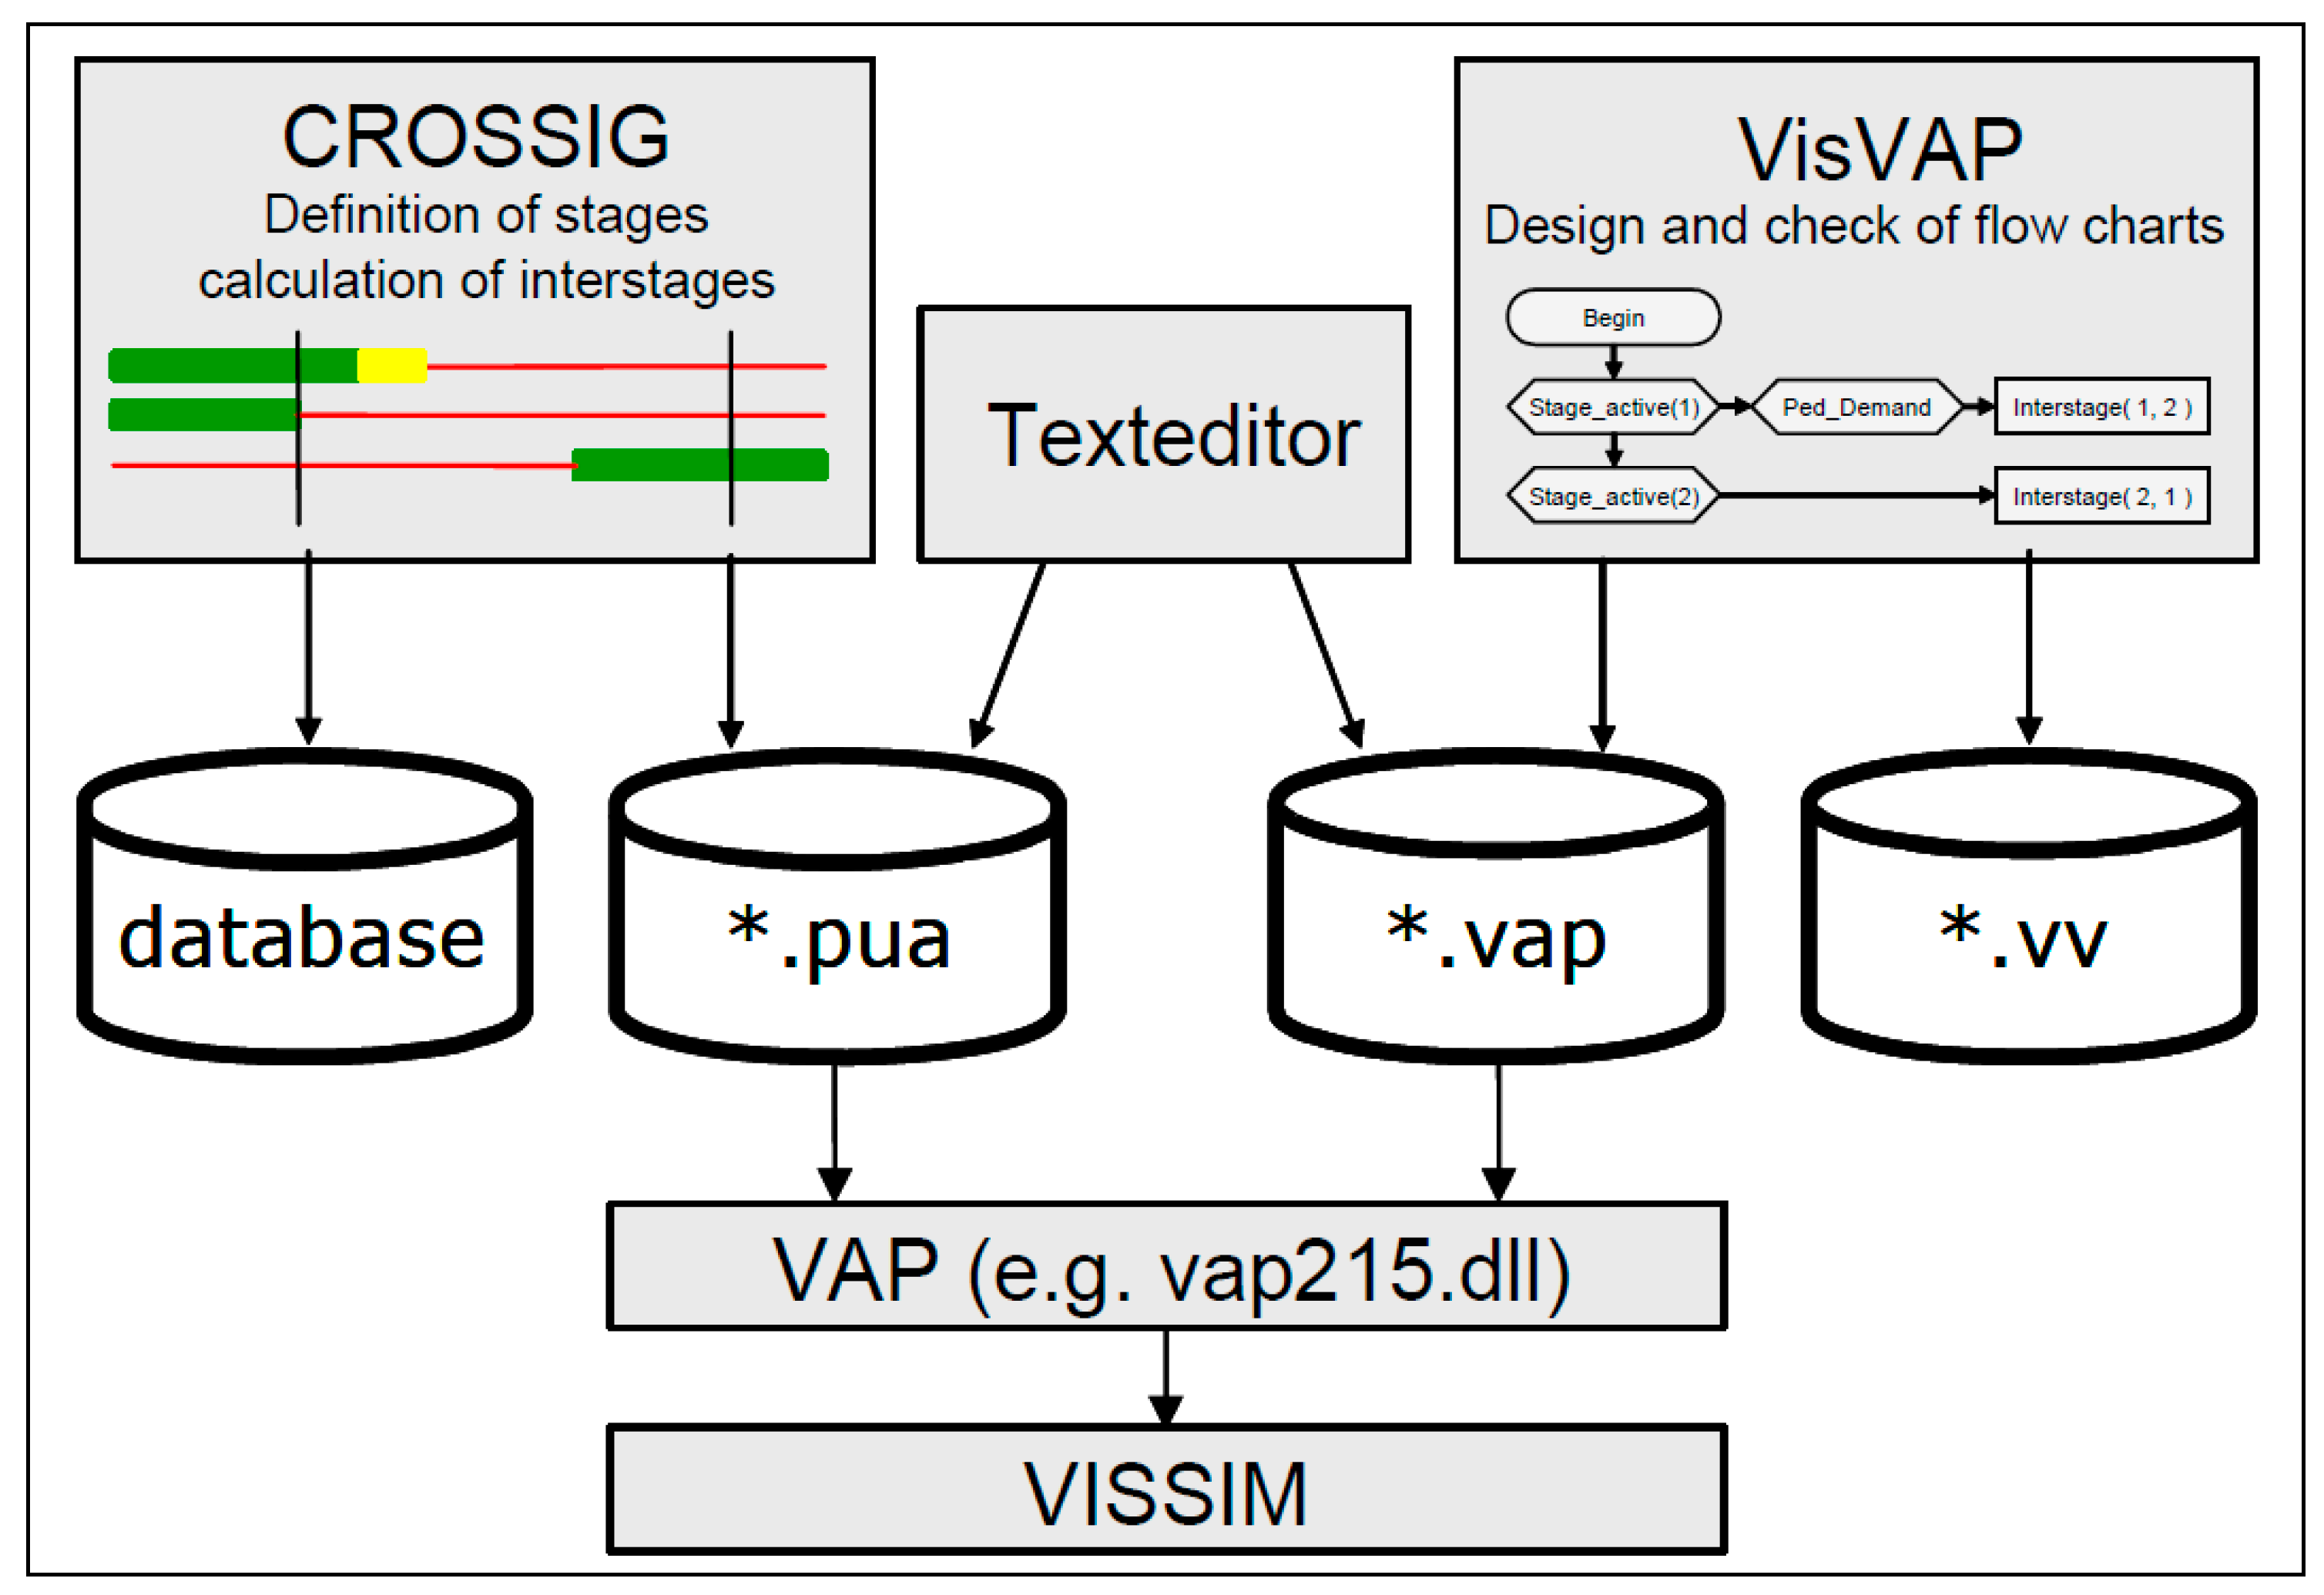
Unconditional priority algorithms were developed in the separate PTV VisVAP module (Visual Vehicle Actuated Programming) where the program logic of signal controllers is defined through flow charts with VAP commands. The algorithm is implemented in the calibrated simulation model after its completion as presented in
Figure 4.
Signal logic is defined with the *.PUA file, while the flow diagram of the unconditional priority algorithm is compiled in the *.VAP file. Both files are integrated into the existing simulation model where signal control logic changes according to the algorithm and present traffic situation [
24,
25]. The limitations of the VisVAP approach consist of the fact that the entire flow diagram must be traversed in each simulation second which prevents stopping in a certain loop until a predefined condition is fulfilled.
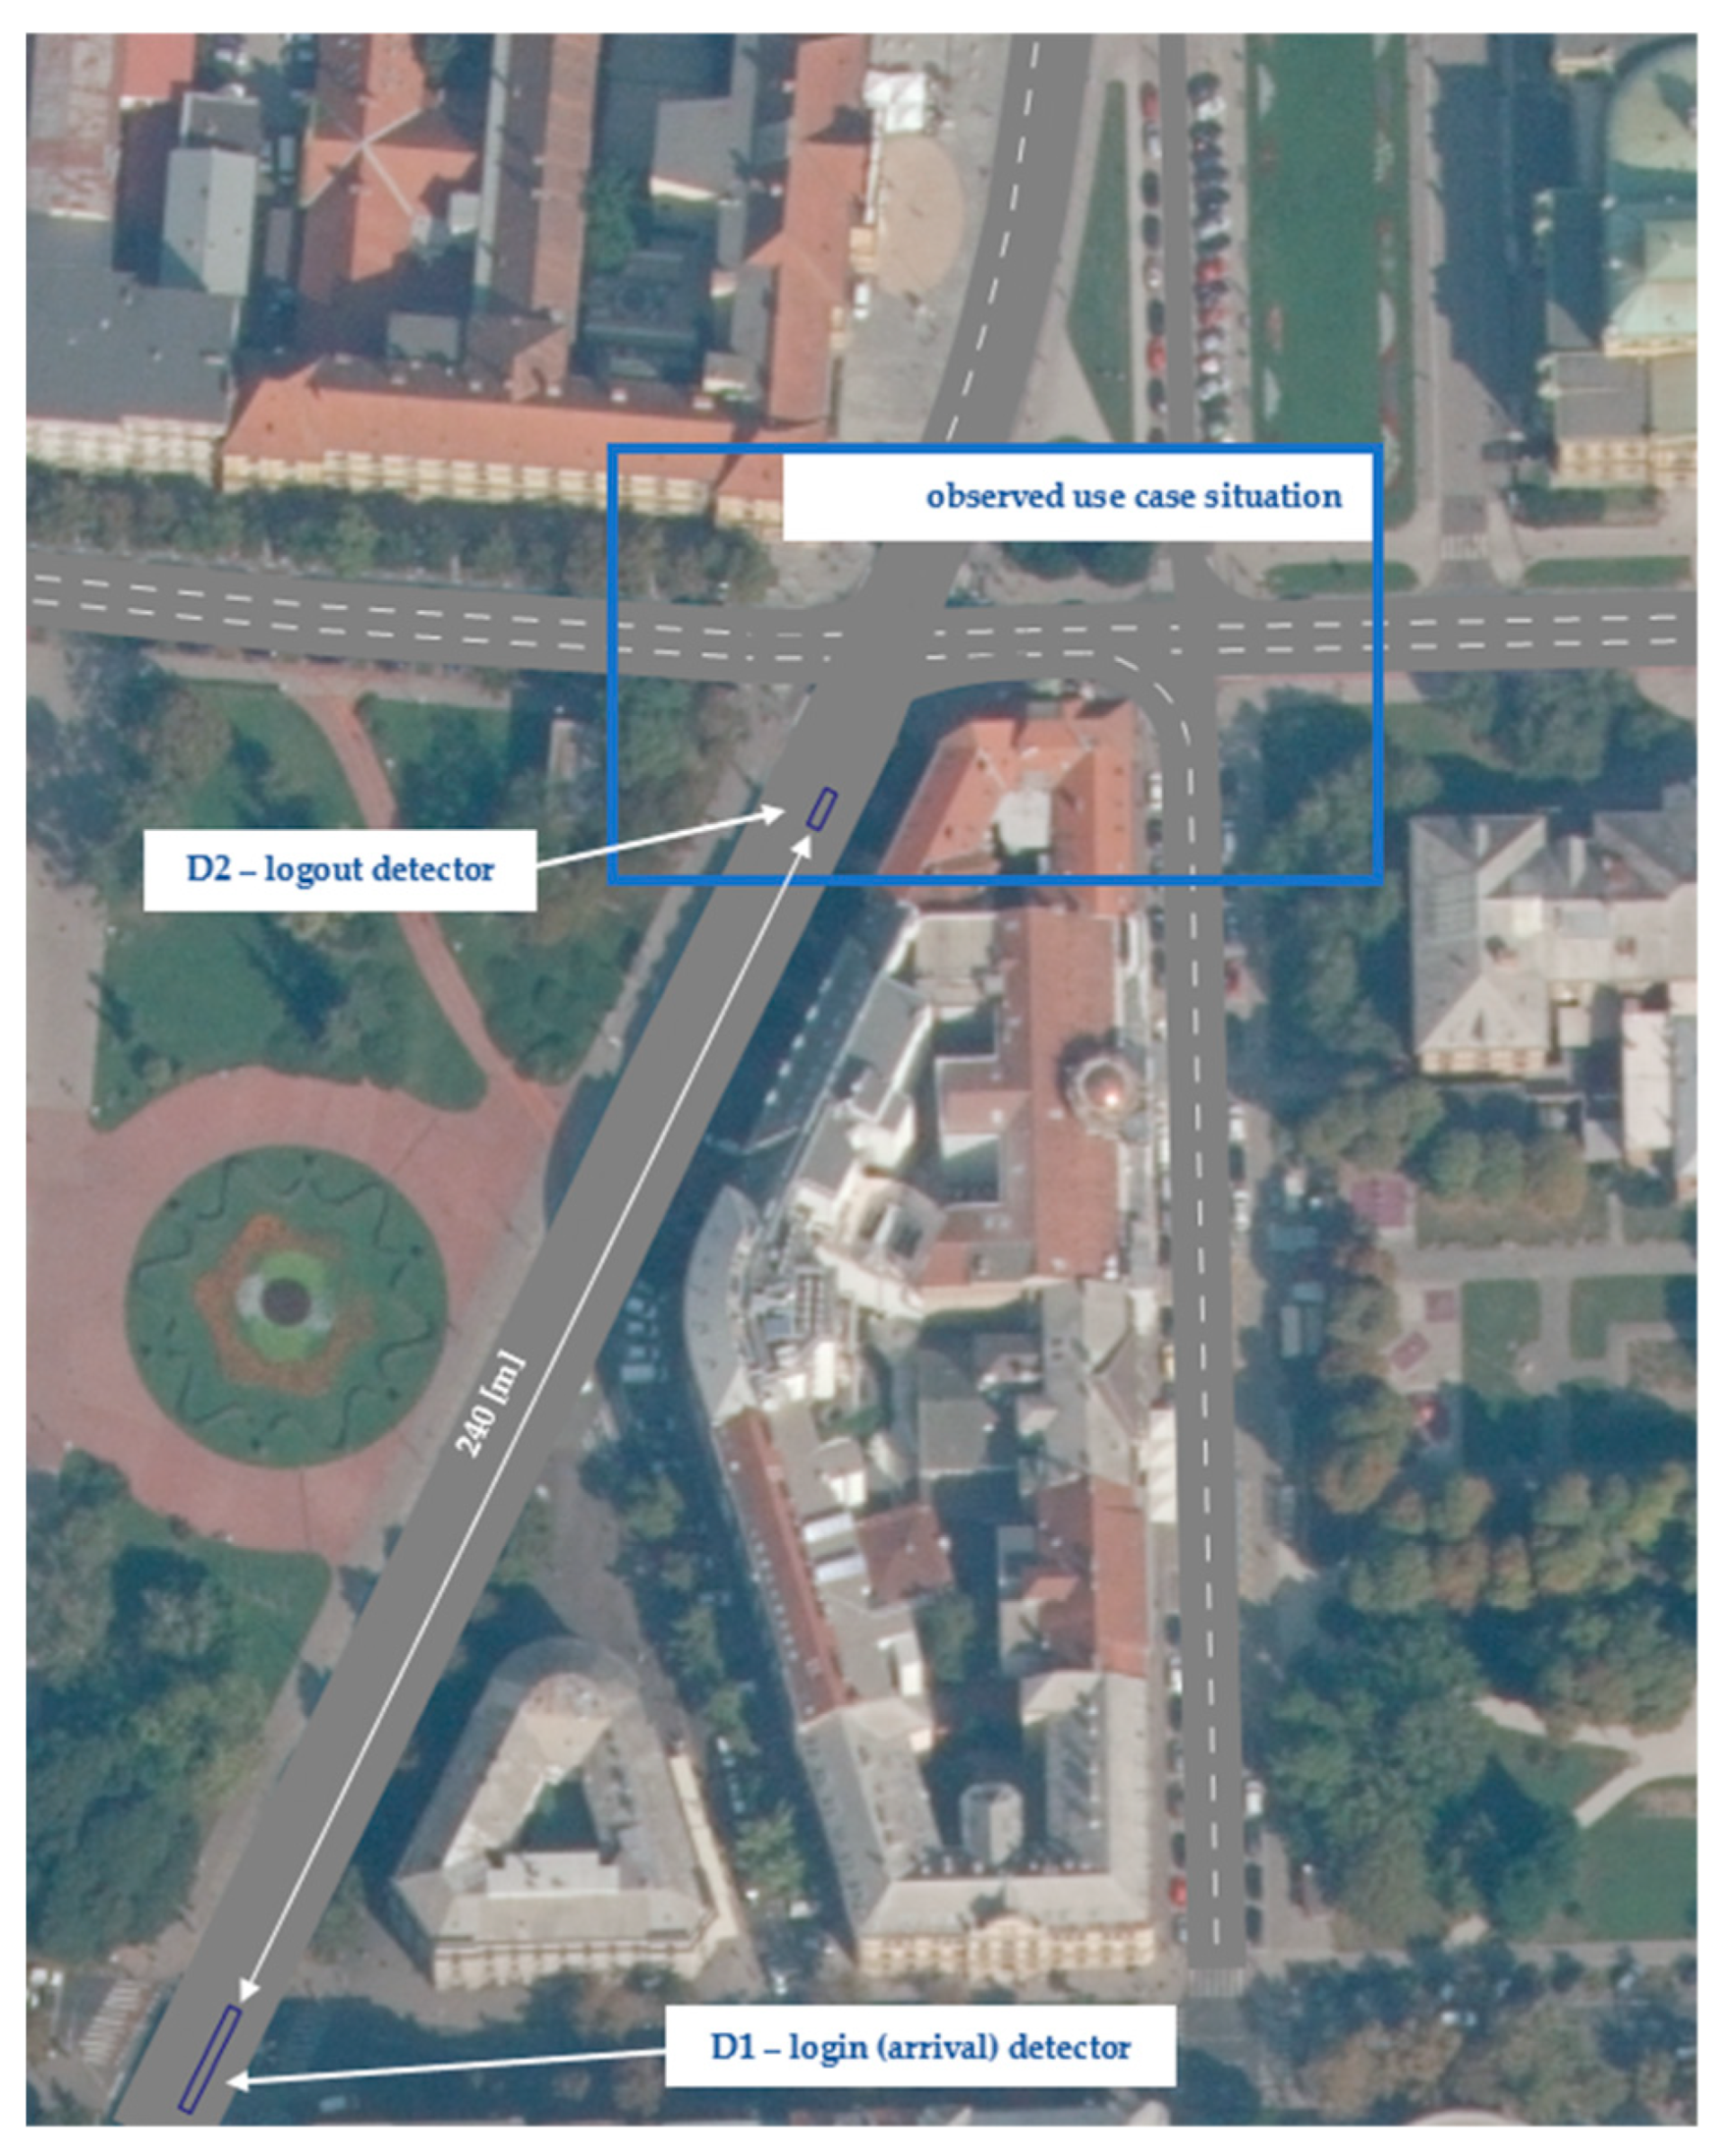
Before the development of the unconditional priority algorithms, it is necessary to enable the link between the simulation model and the flow diagram (algorithm). As presented in
Figure 5, the main link between the sections are detectors: arrival (or login) and logout detectors.
As presented in
Figure 5, detectors are located on the south approach of the observed signalized intersection, where D1 is detecting the presence (arrival) of the escorted vehicle platoon, while D2 is detecting the last point of the last escorted vehicle in line. The distance between the detectors is 240 [m] which is the minimum intergreen time of 15 [s] if the escorted vehicle platoon is driving at a speed of 60 [km/h]. The escorted vehicle platoon in this research is defined as a five-vehicle platoon with the average standstill distance of 2 [m] which makes the total distance of 29 [m].
The algorithm was developed for two situations: when the escorted vehicle stage is active while the “VIP platoon” is approaching the intersection and when the conflict stage (E – east approach) is active. A simplified algorithm developed in PTV VisVAP is presented in
Figure 6. Three main parts of the algorithm can be detected: 1) cycle counter, 2) algorithm functions while the south approach stage is active and 3) algorithm functions while the opposite (conflict) east approach stage is active.
The first part of the algorithm is the cycle counter. When exporting fixed signal logic from the VisSIG module, it is necessary to define the cycle length which is with other basic signal control information (number and definition of signal groups, types of signal groups, etc.) exported in the *.PUA file. According to this information, the algorithm has to calculate and increase cycle seconds because the system checks the whole diagram from START to END in every simulation second.
When the stage for the escorted vehicle platoon is active, it is necessary to calculate the time of its arrival at the intersection. The first condition that is examined is whether there is enough time for the escorted vehicle platoon to pass through the intersection for the duration of the stage. Because of the defined intergreen matrix and the travel time needed to approach the intersection, the last 12 [s] of the stage are observed and if in that period the escorted vehicle platoon is being detected, the active stage is extended (green extension strategy) for additional 10 [s] which makes enough time for the VIP platoon to pass through the intersection. When the last vehicle of the platoon passes through the logout detector, the procedure for stage change is activated.
The third part of the algorithm deals with the situation when the opposite stage (east approach of the intersection) is active. It is necessary to provide free passage to the escorted vehicle platoon “as soon as possible” – to provide unconditional priority bearing in mind all the safety elements regarding vehicles and pedestrians. Before the detection of escorted vehicles, it is necessary to provide minimum green time for vehicles on the east approach so that the green truncation in the first period of the active phase is avoided. This was achieved with the first condition of calculation of active stage duration. After the minimum duration of green time on the east approach is fulfilled, the presence of an escorted vehicle platoon on the arrival (login) detector is examined. When the escorted vehicle platoon is detected, the stage change procedure is activated. With this calculation, and presuming that the escorted vehicle platoon is operating at 60 [km/h], all the safety parameters were taken into account (pedestrian crossing times, intergreen matrices, etc.). When there is no demand for unconditional priority for escorted vehicles, the signal timing is fixed, as defined in
Figure 3.
3. Simulation Results
The next step was to define the parameters needed for the evaluation of developed algorithms and the impact on energy efficiency, network performance, etc. The simulation was performed ten times for each defined scenario (existing and priority model) with a duration of 4500 [s] and data collection interval of 3600 [s] after 900 [s] of network “warming up”. The random seed value (which affects stochastic functions in PTV Vissim and traffic flow) is set to 42, with the random seed increment of 1. For this research, the network performance parameters which directly impact the quality of the traffic network were used, together with the exhaust gas emission and fuel consumption. The defined evaluation parameters are delay, queue length [veh], average number of stops, CO2 emission [g], NOx emission [g], PM10 emission [g] and fuel consumption [g].
After conducting simulations of existing and escorted vehicles' priority models, the evaluation data is collected. Base data which affects network performance and quality (delay, queue length, number of stops) is gathered through node evaluation and energy efficiency data is gathered through vehicle network performance evaluation. Traffic network quality indicators of the existing traffic situation and the unconditional priority model are presented in
Table 2 and
Table 3, respectively.
Network performance indicators were collected through node evaluation in PTV Vissim, which is used to determine specific data from defined intersections. According to [
26], there is no need for a manual section definition, thus the data is collected for the defined node and selected vehicle classes. Node evaluation can determine exhaust emissions, but the calculation is based on data on emissions of the Oak Ridge National Laboratory (U.S. Department of Energy), so because of the differences from European standards, energy efficiency data is collected and analyzed differently through vehicle network performance evaluation.
Vehicle network performance evaluation takes into account all vehicles which have already left the network or reached their destination and the vehicles that are still in the network at the end of the evaluation interval [
26]. The vehicle network performance evaluation is updated with every time step in the microscopic simulation. All the values of exhaust emission and fuel consumption are presented in grams [g].
Table 4.
Vehicle network performance evaluation of energy efficiency parameters (in grams [g]).
Table 4.
Vehicle network performance evaluation of energy efficiency parameters (in grams [g]).
| Model/Scenario |
CO2
|
NOX
|
PM10
|
Fuel Consumption |
| Existing |
4051,806 |
10804,816 |
31063,848 |
6753,010 |
| Priority |
4171,327 |
11123,540 |
31980,177 |
6952,212 |
In addition to the mentioned parameters, the average speed of vehicles was also taken into account, which is an indicator that affects the energy efficiency and sustainability of the traffic network. The average speed for personal vehicles in the existing traffic situation is 26,57 [km/h], while in the model with unconditional priority for escorted vehicles, the average speed is 25,82 [km/h].
4. Discussion
A large number of studies proved that traffic control and better quality of the network have a direct impact on energy efficiency and sustainability of traffic systems, especially in urban areas. The research in this paper includes the impact of unconditional priority on the emission of exhaust gases and fuel consumption in the city of Zagreb. The research was conducted with the data collected from a real traffic situation with the development of an unconditional priority algorithm in the PTV VisVAP module. After determining the evaluation parameters, a simulation of the existing traffic network and situation with the implemented algorithm was carried out, on the basis of which the relevant data presented in the previous chapter were collected. Evaluation parameters were divided into two groups: network evaluation parameters (node evaluation) and energy efficiency parameters (vehicle network performance).
Delay is the most common measure of the quality of an intersection and it directly defines the Level of Service (LoS). Along with queue length and number of stops, it can define the vehicle behaviour in the network. In the simulation of the existing traffic situation, the delay was measured for every approach of the intersection, and an average delay of 19,81 [s] was measured. In the simulation with the implemented unconditional priority algorithm the delay of 19,54 [s] was measured, which is reflected in the improvement of 1,36% and the Level of Service is B. The next observed evaluation parameter is queue length measured in the number of vehicles. In the existing model simulation an average of 13, 96 vehicles were in the queue (in all approaches), while in the priority simulation was increased to 14,60 vehicles, which makes an increase of 4,38%. The last observed parameter was the number of stops which remained the same but with a minor reduction on the approach where escorted vehicles are operating where the average number of stops (because of the unconditional priority algorithm) reduced by 2,47%. It must be noted that in observed scenarios changes in network performance were minimal and in favour of the approach where the escorted platoon of vehicles is operating.
Regarding energy efficiency indicators, all defined parameters have an increase after the implementation of the unconditional priority algorithm. With the implemented algorithm for unconditional priority, the emission of CO2 gas was increased by 119,52 [g], NOx by 318,72 [g], the emission of PM10 increased by 916,33 [g], and the fuel consumption increased by 199,20 [g]. Measured energy efficiency parameters are overall increased by an average of 2,8%. The average operating speed of vehicles is also reduced from 26,57 [km/h] to 25,82 [km/h] which makes the change of 2,82%.
It must be noted that in this use case, unconditional priority has minimal impact on the traffic network, but mostly because only one passage of the escorted vehicle platoon is considered in a one-hour simulation. Also, the specifics of the selected signalized intersection (major disproportion of traffic volumes on the east “green wave” approach to the escorted platoon approach) impact the slight increase in measured evaluation parameters. the current practice is that the priority passage of escorted vehicles is realized by placing police officers at the intersection who regulate traffic based on the radio report of the arrival of the vehicle at the intersection. Preparation of the passage through the intersection covers at least 10-15 minutes, which includes approximately 11 signal cycles with the flashing yellow signal and police officer regulation which has a high impact on energy efficiency and fuel consumption on the traffic network. Taking into account the above, the situation regarding fuel consumption, emissions of exhaust gases and other evaluation parameters, regarding those specific circumstances, were not considered in this research, and it would greatly influence the research results which makes the basis for future research.
5. Conclusions
This paper considers the importance of managing escorted vehicle platoons passing through signalized intersections in urban traffic networks with the impact on energy consumption and exhaust gas emission. The basic idea was to develop an algorithm for unconditional priority with the main purpose of replacing a great number of police officers managing traffic before and during the passage of escorted vehicles. The realistic traffic scenario based on the use case in the city of Zagreb, Croatia, was taken into account and the most frequently used route for the passage to the district with government and other administrative destinations in the historic part of the City. After the collection of data and definition of evaluation parameters, the calibrated model of the existing situation and the new model with unconditional priority were developed and compared. The morning peak hour was selected as relevant for the evaluation of the specific situation of the signalized intersection. A slight increase in the defined evaluation parameters was recognized (given the specifics of the observed situation), but some details must be considered in future research. The general practice is that the preparation of the passage of escorted vehicles takes at least 15 minutes, which greatly affects the traffic flow and delays on intersections. Also, in this research, only one hour of simulation with one VIP passage through the intersection is considered, with the discrepancy of traffic volumes on the side approaches. Bearing all this in mind, it is possible to positively impact fuel consumption and emission of gases, which will be the subject of future research.
The extent of this research is just a small part of traffic management and its impact on the quality of traffic networks. Together with adaptive traffic control, parking management and incident management systems, and public transport management, significant advantages and improvements can be achieved towards a smart and sustainable urban traffic network.
References
- Li Y, Miao L, Chen Y, et al. Exploration of Sustainable Urban Transportation Development in China through the Forecast of Private Vehicle Ownership. Sustainability 2019; 11: 4259. [CrossRef]
- Guo Y, Tang Z, Guo J. Could a Smart City Ameliorate Urban Traffic Congestion? A Quasi-Natural Experiment Based on a Smart City Pilot Program in China. Sustainability 2020; 12: 2291. [CrossRef]
- Gordon, R. Intelligent Transportation Systems. Cham: Springer International Publishing, 2016. Epub ahead of print 2016. [CrossRef]
- Vreeswijk JD, Mahmod MKM, van Arem B. Energy efficient traffic management and control - the eCoMove approach and expected benefits. In: 13th International IEEE Conference on Intelligent Transportation Systems. IEEE, 2010, pp. 955–961.
- Turksma Siebe, Vreeswijk Jaap. Fuel Efficiency in Cooperative Network Control Systems. In: Proceedings of the 14th ITS World Congress. New York, 2008.
- Vujić M, Dedić L, Vojvodić, H, The Benefits of Adaptive Traffic Control for Emission Reduction in Urban Areas, New Solutions and Innovations in Logistics and Transportation, ZIRP2017, Opatija, Croatia, 2017, pp. 419-428.
- eCoMove-Description of Work. eCoMove Consortium. Brussels, Belgium, 2010.
- Pandazis Jean-Charles. J. Pandazis, "eCoMove: Cooperative ITS for Green Mobility. In: European Wireless 2012; 18th European Wireless Conference. Poznan, Poland: VDE, 2012, pp. 1-5.
- Ahn K, Rakha H. The effects of route choice decisions on vehicle energy consumption and emissions. Transp Res D Transp Environ 2008; 13. pp. 151–167.
- Leistner D, ''Impact of Cooperative Systems'', University of Dresden, Germany, 2009.
- Vujić M, Mandžuka S, Dedić L, Cooperative Vehicle Actuated Traffic Control in Urban Areas, In: Karabegović, I. (eds) New Technologies, Development and Application. NT 2018. Lecture Notes in Networks and Systems, vol 42. Springer, Cham. [CrossRef]
- Osorio C, Nanduri K. Energy-Efficient Urban Traffic Management: A Microscopic Simulation-Based Approach. Transportation Science 2015; 49. pp. 637–651. [CrossRef]
- Stevens M, Yeh C, Reinforcement Learning for Traffic Optimization. In: Stanford. edu. 2016.
- Chamberlin R, Swanson B, Talbot E, et al. Measuring the Emissions Impact of a Traffic Control Change. University of New Hampshire, 2011.
- Solomon, Z. Model-Based Traffic Control for Balanced Reduction of Fuel Consumption, Emissions, and Travel Time. In: Proceedings of mobil.Tum 2009 – International Scientific Conference on Mobility and Transport. Munich, Germany, 2009, pp. 149–154.
- Vujić M, Šemanjski I, Vidan P. Improving Energy Efficiency by Advanced Traffic Control Systems. Transactions on Maritime Science 2015; 4: 119–126.
- Yin, Y. Robust optimal traffic signal timing. Transportation Research Part B: Methodological 2008; 42: pp. 911–924. [CrossRef]
- Asaduzzaman, M. A Traffic Signal Control Algorithm for Emergency Vehicles (Doctoral dissertation. University of Newfoundland, 2017.
- Kim M, Schrader M, Yoon H-S, et al. Optimal Traffic Signal Control Using Priority Metric Based on Real-Time Measured Traffic Information. Sustainability 2023; 15: 7637. [CrossRef]
- Vujić, M. Sustav dinamičkih prioriteta za vozila javnoga gradskoga prijevoza u automatskom upravljanju prometom. University of Zagreb, 2013. [CrossRef]
- Vujić M, Mandzuka S, Greguric M. Pilot Implementation of Public Transport Priority in the City of Zagreb. PROMET - Traffic&Transportation 2015; 27: 257–265. [CrossRef]
- Road Traffic Safety Act. Republic of Croatia, 2008.
- Feldman, O. The GEH measure and quality of the highway assignment models. Association for European Transport and Contributors 2012; 1–18.
- PTV - Planung Transport Verkehr AG: VisVAP 2.16., 2006.
- Satiennam T, Fukuda A, Muroi T, et al. An Enhanced Public Transportation Priority System for Two-Lane Arterials with Nearside Bus Stops, Proceedings of the Eastern Asia Society for Transportation Studies. Proceedings of the Eastern Asia Society for Transportation Studies 2005; 5, pp. 1309–1321.
- PTV - Planung Transport Verkehr AG: PTV Vissim. User manual 2022, pp. 1043–1047.
|
Disclaimer/Publisher’s Note: The statements, opinions and data contained in all publications are solely those of the individual author(s) and contributor(s) and not of MDPI and/or the editor(s). MDPI and/or the editor(s) disclaim responsibility for any injury to people or property resulting from any ideas, methods, instructions or products referred to in the content. |
© 2023 by the authors. Licensee MDPI, Basel, Switzerland. This article is an open access article distributed under the terms and conditions of the Creative Commons Attribution (CC BY) license (http://creativecommons.org/licenses/by/4.0/).
