1. Introduction
One of the most promising electrochemical conversion devices are the Solid Oxide Fuel Cells (SOFCs). They typically have operating temperatures between 800 and 1000°C. They drive the direct transformation of the chemical energy stored in a fuel directly into electricity [
1,
2]. These fuel cells are highly efficient devices with the added advantage over other fuel cells that they can operate not only with pure H
2, but accept low purity H
2 and other fuels such as methane (CH
4) and ammonia (NH
3) [
3,
4], due to their high working temperatures. Their use is relevant mainly for stationary applications, where they may replace conventional combustion systems, constituting essential s in the hydrogen-based energy economic model [
5,
6,
7,
8,
9]. It should be noted that SOFCs can operate reversibly, producing H
2 from H
2O vapor electrolysis with higher yields than low-temperature electrolysers. A major disadvantage of these devices is the high working temperatures around 1000°C, which is detrimental to the stability and duration of the cell components. Therefore, it is essential to implement new materials that are active at lower temperatures, taking care not to sacrifice the great performance of these cells.
The cathode is one of the most important components in a SOFC, since the reduction of oxygen from the air to O
2- ions (oxygen reduction reaction, ORR) has a sluggish kinetics that determines the performance of the cells [
10,
11,
12]. Their optimization at lower temperatures is a real challenge. These electrodes must be mixed ionic-electronic conducting material (MIEC). In this way, they provide the contact area necessary for the ORR reaction to happen in the entire surface of the electrode, and not only in the triple phase boundary (TPB), where the electrolyte, the fuel and the electrode come together [
13,
14,
15,
16].
Among the compounds commonly considered as cathodes in SOFCs, an appealing candidate is the SrCoO
3-δ perovskite, one of the most metallic oxides. In its cubic phase (denominated 3C in the perovskite nomenclature, with a vertex-sharing octahedral framework) it exhibits one of the highest electrical conductivities and, additionally, it can host many oxygen vacancies. Unfortunately, above 900 °C the cubic phase irreversibly transforms into a 2H hexagonal phase with low electrical conductivity [
17,
18,
19,
20]. Therefore, it is necessary to stabilize the 3C phase in the temperature range in which a SOFC would normally operate. Much research has been conducted to stabilize this phase in a large temperature range, mainly by replacing some strontium [
21,
22,
23,
24] or cobalt [
25,
26,
27] by aliovalent elements.
In this work, we describe the stabilization of a cubic perovskite phase by Y doping at the Sr positions. These samples has been studied by the pertinent characterization techniques: X-ray diffraction (XRD), to check the correct synthesis of the compounds and the chemical nature of the samples, and neutron powder diffraction (NPD) for a complete crystallographic characterization and determination of oxygen vacancies. Thermal analysis permitted to study the chemical stability of the samples; electrical conductivity as a function of temperature was complemented with single cell tests, as real energy conversion devices where these materials demonstrate its performance with pure hydrogen as fuel.
2. Materials and Methods
2.1. Synthesis
Polycrystalline samples of Sr1-xYxCoO3-δ (x= 0.1, 0.2) were synthesized by solid-state reaction. SrCO3, Y2O3 and Co(NO3)2.6H2O oxides were ground in an agate mortar for half an hour and then annealed in air at 800°C for 20 h. Subsequently, the reagents were ground again for half an hour and then heated to 1200°C for another 20 h.
2.2. Structural Characterization
A Huber diffractometer was used to perform the X-ray diffraction (XRD). A CuKα radiation (λ = 1.5418 Å; 40 kV, 30 mA) was used in Bragg-Brentano mode. The scanned range was from 20º to 80° with steps of 0.02°. The D2B high-resolution powder diffractometer at the Laue-Langevin Institute (ILL) (Grenoble, France) was used for the neutron powder diffraction (NPD) analysis with λ= 1.549 Å. 2 g of product were placed in a cylindrical vanadium can; the data collection lasted 3 h. NPD data were analyzed by the Rietveld method [
28] through the FULLPROF [
29] software. A pseudo-Voigt function was used to model the shape of the diffraction peaks. The order of the refined parameters were: the scale factor, zero point offset, background coefficients, unit cell parameters, asymmetry correction for the shape of the profile, the atomic positional coordinates and finally, the isotropic thermal factor of cations. In the case of the oxygens atoms, an anisotropic model was used to describe the thermal displacements. The NPD data also allowed us to refine the occupancy factor of oxygen atoms.
2.3. Thermal Analyses
To determine the sample weight as function of temperature, thermal analysis for the samples was carried out in a Setaram TG-DTA system. Alumina oxide crucibles of 70 μl were used for about 50 mg of sample in air. The heating ramp was of 10°C min-1 from RT until 1000°C. The cooling was also recorded.
2.4. XPS
A SPECS GmbH electron spectrometer was used to obtain the X-ray photoelectron spectroscopy. The spectrometer was equipped with a hemispherical electron analyzer, with a X-ray source (200 W, 12 kV) of Mg Kα (hν = 1253.6 eV, 1 eV = 1.603 × 10⁻¹⁹ J) radiation. The degassing process was at 10−6 mbar. The residual pressure of the ion-pumped analysis chamber was maintained below 4 × 10⁻⁹ mbar during data acquisition. Binding energies (BE) were referenced to the C 1s signal from carbon contamination of the samples (284.8 eV). The experimental peaks were fitted by a combination of Lorentzian/Gaussian lines of variable proportions and the peak intensities were assessed. Atomic surface contents were estimated from the areas of the peaks.
2.5. Electrical Characterization
Four-probe method: The powders obtained were compacted at 1 [Ton] of pressure in a bar-shaped die and then sintered at 1000°C obtaining dense pellets. Four platinum wires were wound around these pellets and then painted with platinum ink to create a weld between the wires and the material, completing the circuit of the four-probe method. The conductivities were measured between 25 and 800°C, applying an electric current in a range of 0 to 100 [mA].
Impedance spectroscopy: Impedance was measured in a symmetrical cell using LSGM (La0.83Sr0.17Ga0.8Mg0.2O3-δ) as electrolyte. Cathode inks were prepared by mixing the powders with terpineol and then calcined at 1000°C for 1 h. To ensure the electrical contact, both sides were painted with platinum ink and finally annealed at 800°C for 1 h. The data were collected in an AC from an Solartron 1260 FRA from 1 KHz to 10 mHz frecuencies and a signal amplitude of 50 mV between 500°C - 800°C temperature range. The software ZView was used to analyze the data to yield the Area-specific resistance (ASR) (Ωcm2).
Single Cell Performance: Single-cell experiments were conducted by assembling an authentic fuel cell comprising the Sr
0.9Y
0.1CoO
3-δ cathode, LSGM electrolyte, and SrMo
0.8Fe
0.2O
3-δ anode (also prepared in our lab [
30]). The electrolyte was fabricated using the ceramic method with initial materials; the final sintering temperature was 1450ºC. A final pellet was meticulously polished with a diamond wheel to a thickness of 300 μm. Once the desired thickness was achieved, a buffer-layer ink was applied to one side of the electrolyte. This buffer layer serves to prevent ionic interdiffusion and chemical reactions between the electrolyte and anode. It comprises a suspension of lanthanum-doped ceria Ce
0.6La
0.4O
2-δ (LDC) in terpineol. Subsequently, the electrolyte and buffer layer were subjected to heating at 1300 °C for 1 hour to enhance adhesion.
Following this, an anode ink, prepared in a similar manner, was deposited on the surface of the buffer layer and heated at 1100 °C for 1 hour. The cathode was deposited on the opposite surface of the electrolyte, using the corresponding ink and undergoing heating at 1100 °C for 1 hour. Once the single-cell assembly was completed, a platinum gauze was positioned on both the anode and cathode to serve as an electrical collector, with two intertwined platinum wires attached through platinum ink, dried for 1 hour at 850 °C. The working electrode area of the cell was 0.25 cm2 (0.5 × 0.5 cm2). The cells underwent testing in a vertical tubular furnace at 650°C, 700°C, 750°C and 800°C; the anode side was fed with pure dry H2, while the cathode operated in air. Fuel cell tests were conducted using an AUTOLAB 302N Potentiostat-Galvanostat by varying the cell voltage from the OCV ("open current voltage") to 0.1 V, with increments of 0.010 V and holding for 10 seconds at each step. The current density was calculated based on the recorded current flux through the effective area of the cell (0.25 cm2).
3. Results
3.1. XRD and NPD Characterization
The characterization of Sr
1-xY
xCoO
3-δ (x= 0.1 and 0.2) polycrystalline samples was performed by XRD at 25 °C (
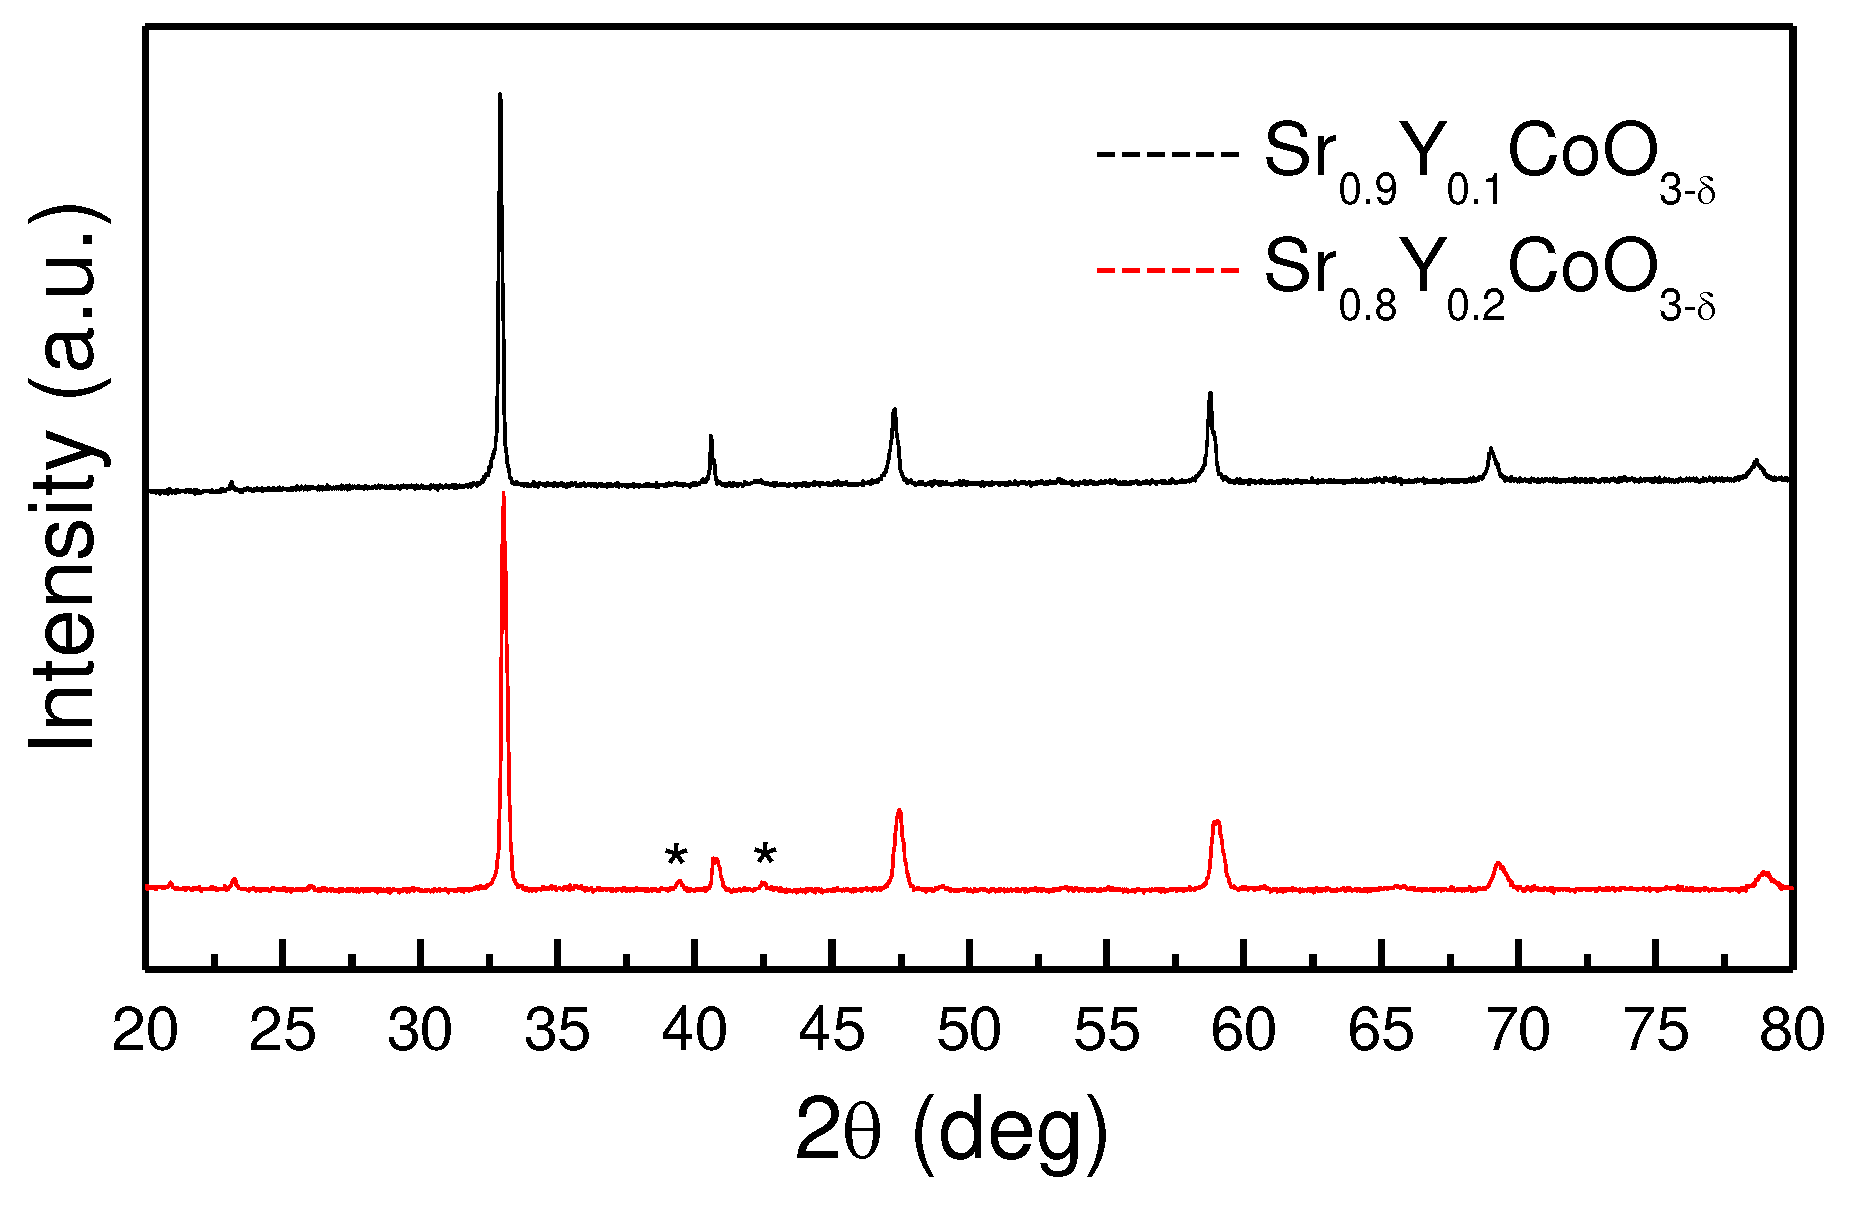
Figure 1) to assess the purity and crystallographic nature of the samples. The XRD patterns effectively show that by doping with small amount of Y at the strontium site, it is possible to stabilize a cubic phase [
31] at room temperature. No impurities appear in the 10% Y sample. Two additional peaks appears in the 20% Y sample at 38° and 42.5° (asterisks in
Figure 1) indicating a tiny impurity. The XRD diagrams seem to be characteristic of cubic structures, with a
0 parameters close to 3.8 Ả.
3.2. NPD Investigation
A neutron powder diffraction analysis at 25°C was essential to investigate the actual symmetry and crystallographic features of the selected Sr
0.9Y
0.1CoO
3 compound. Whereas the previous analysis from XRD data suggested a cubic symmetry, the presence of some superstructure reflections in the NPD pattern clearly indicated the presence of a tetragonal superstructure with doubled c axis. The crystal structure was then properly refined in the P4/mmm space group (s.g. # 123), with unit-cell parameters a = b ≈ a
0, c ≈ 2a
0, where a
0 stands for the cubic edge of the aristotype. In this model, Sr atoms are situated at 2h (1/2,1/2,z) positions, two types of cobalt atoms, Co1 and Co2 at 1a (0,0,0) and 1b (0,0,1/2) sites, respectively, and the three kinds of oxygen atoms O1 at 2f (1/2,0,0), O2 at 2g (0,0,z) and O3 at 2e (1/2,0,1/2) positions. Y atoms are statistically distributed at the Sr 2h positions.
Table 1 includes the unit-cell parameters and volume, atomic positions, anisotropic displacement parameters for some O atoms and isotropic ones for the metal atoms and reliability factors, after the Rietveld refinement of the crystal structure at 25° C.
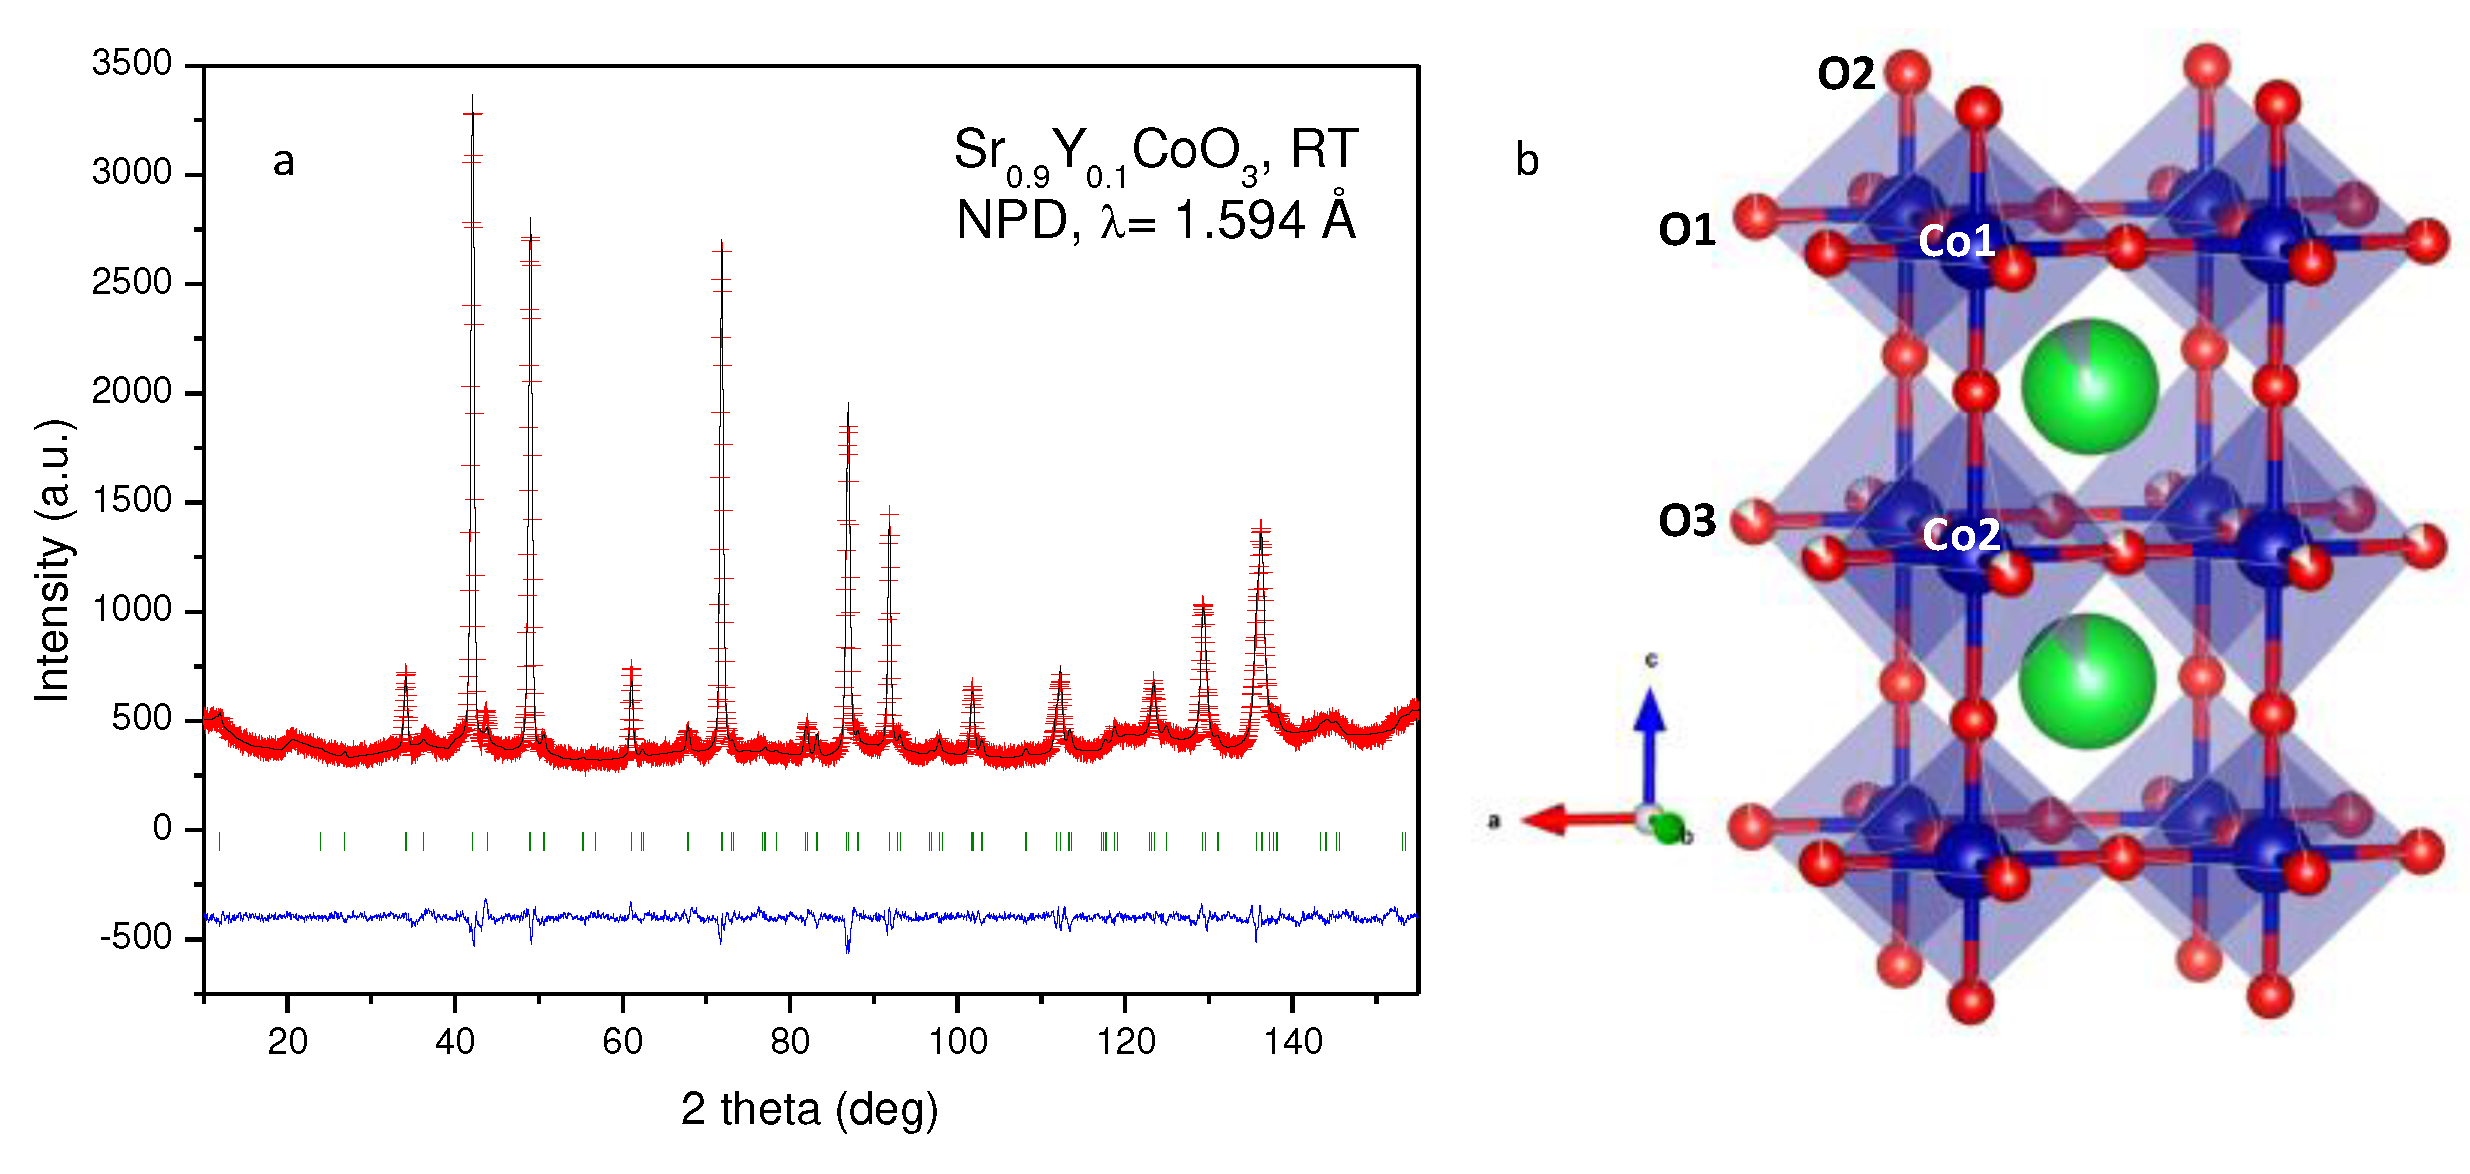
Figure 2a shows the NPD pattern for Sr
0.9Y
0.1CoO
3-δ after the Rietveld refinement against the 25° C data, where the observed and calculated NPD profiles are in good agreement. The oxygen content was also refined (
Table 1), yielding a final formula Sr
0.9Y
0.1CoO
2.79(1). O1 and O2 are almost stoichiometric, whereas the highest amounts of vacancies are found in O3, as shown in
Table 1. From these formulae, and assuming Sr
2+ and Y
3+ oxidation states, a mixed valence for Co ions are obtained, as Co
3.48+.
Figure 2b displays the tetragonal superstructure of Sr
0.9Y
0.1CoO
3-δ at 25° C, in which layers of contracted octahedra containing Co1 are alternated with layers of elongated Co2O
6 octahedra. Co1-O1 and Co2-O3 bond lengths exhibit the same distance of 1.919(1) Å, whereas Co1-O2 bond length is much shorter (1.784(5) Å) than Co2-O2 (2.066(5) Å). This fact, together with the long-range ordering of the oxygen vacancies in the crystal, could be the origin of this superstructure, as suggested in previous works with similar compositions [
26,
32,
33,
34]. These significant differences in the octahedral size could imply a higher oxidation state in Co1 with respect to Co2, presenting a virtually tetravalent oxidation state at Co1 positions, while Co2 sites exhibit a trivalent oxidation state. This scenario implies a full charge disproportionation of Co ions: thus, the Jahn–Teller axial elongation of Co2O6 octahedra would be attributed to the existence of Co
3+ in an intermediate-spin configuration.
3.2. Thermal Analysis
A thermogravimetric analysis (TG) was carried out from 25 to 900 °C to determine the oxygen deficiency of the Sr
0.9Y
0.1CoO
3-δ sample at the working temperature of a SOFC.
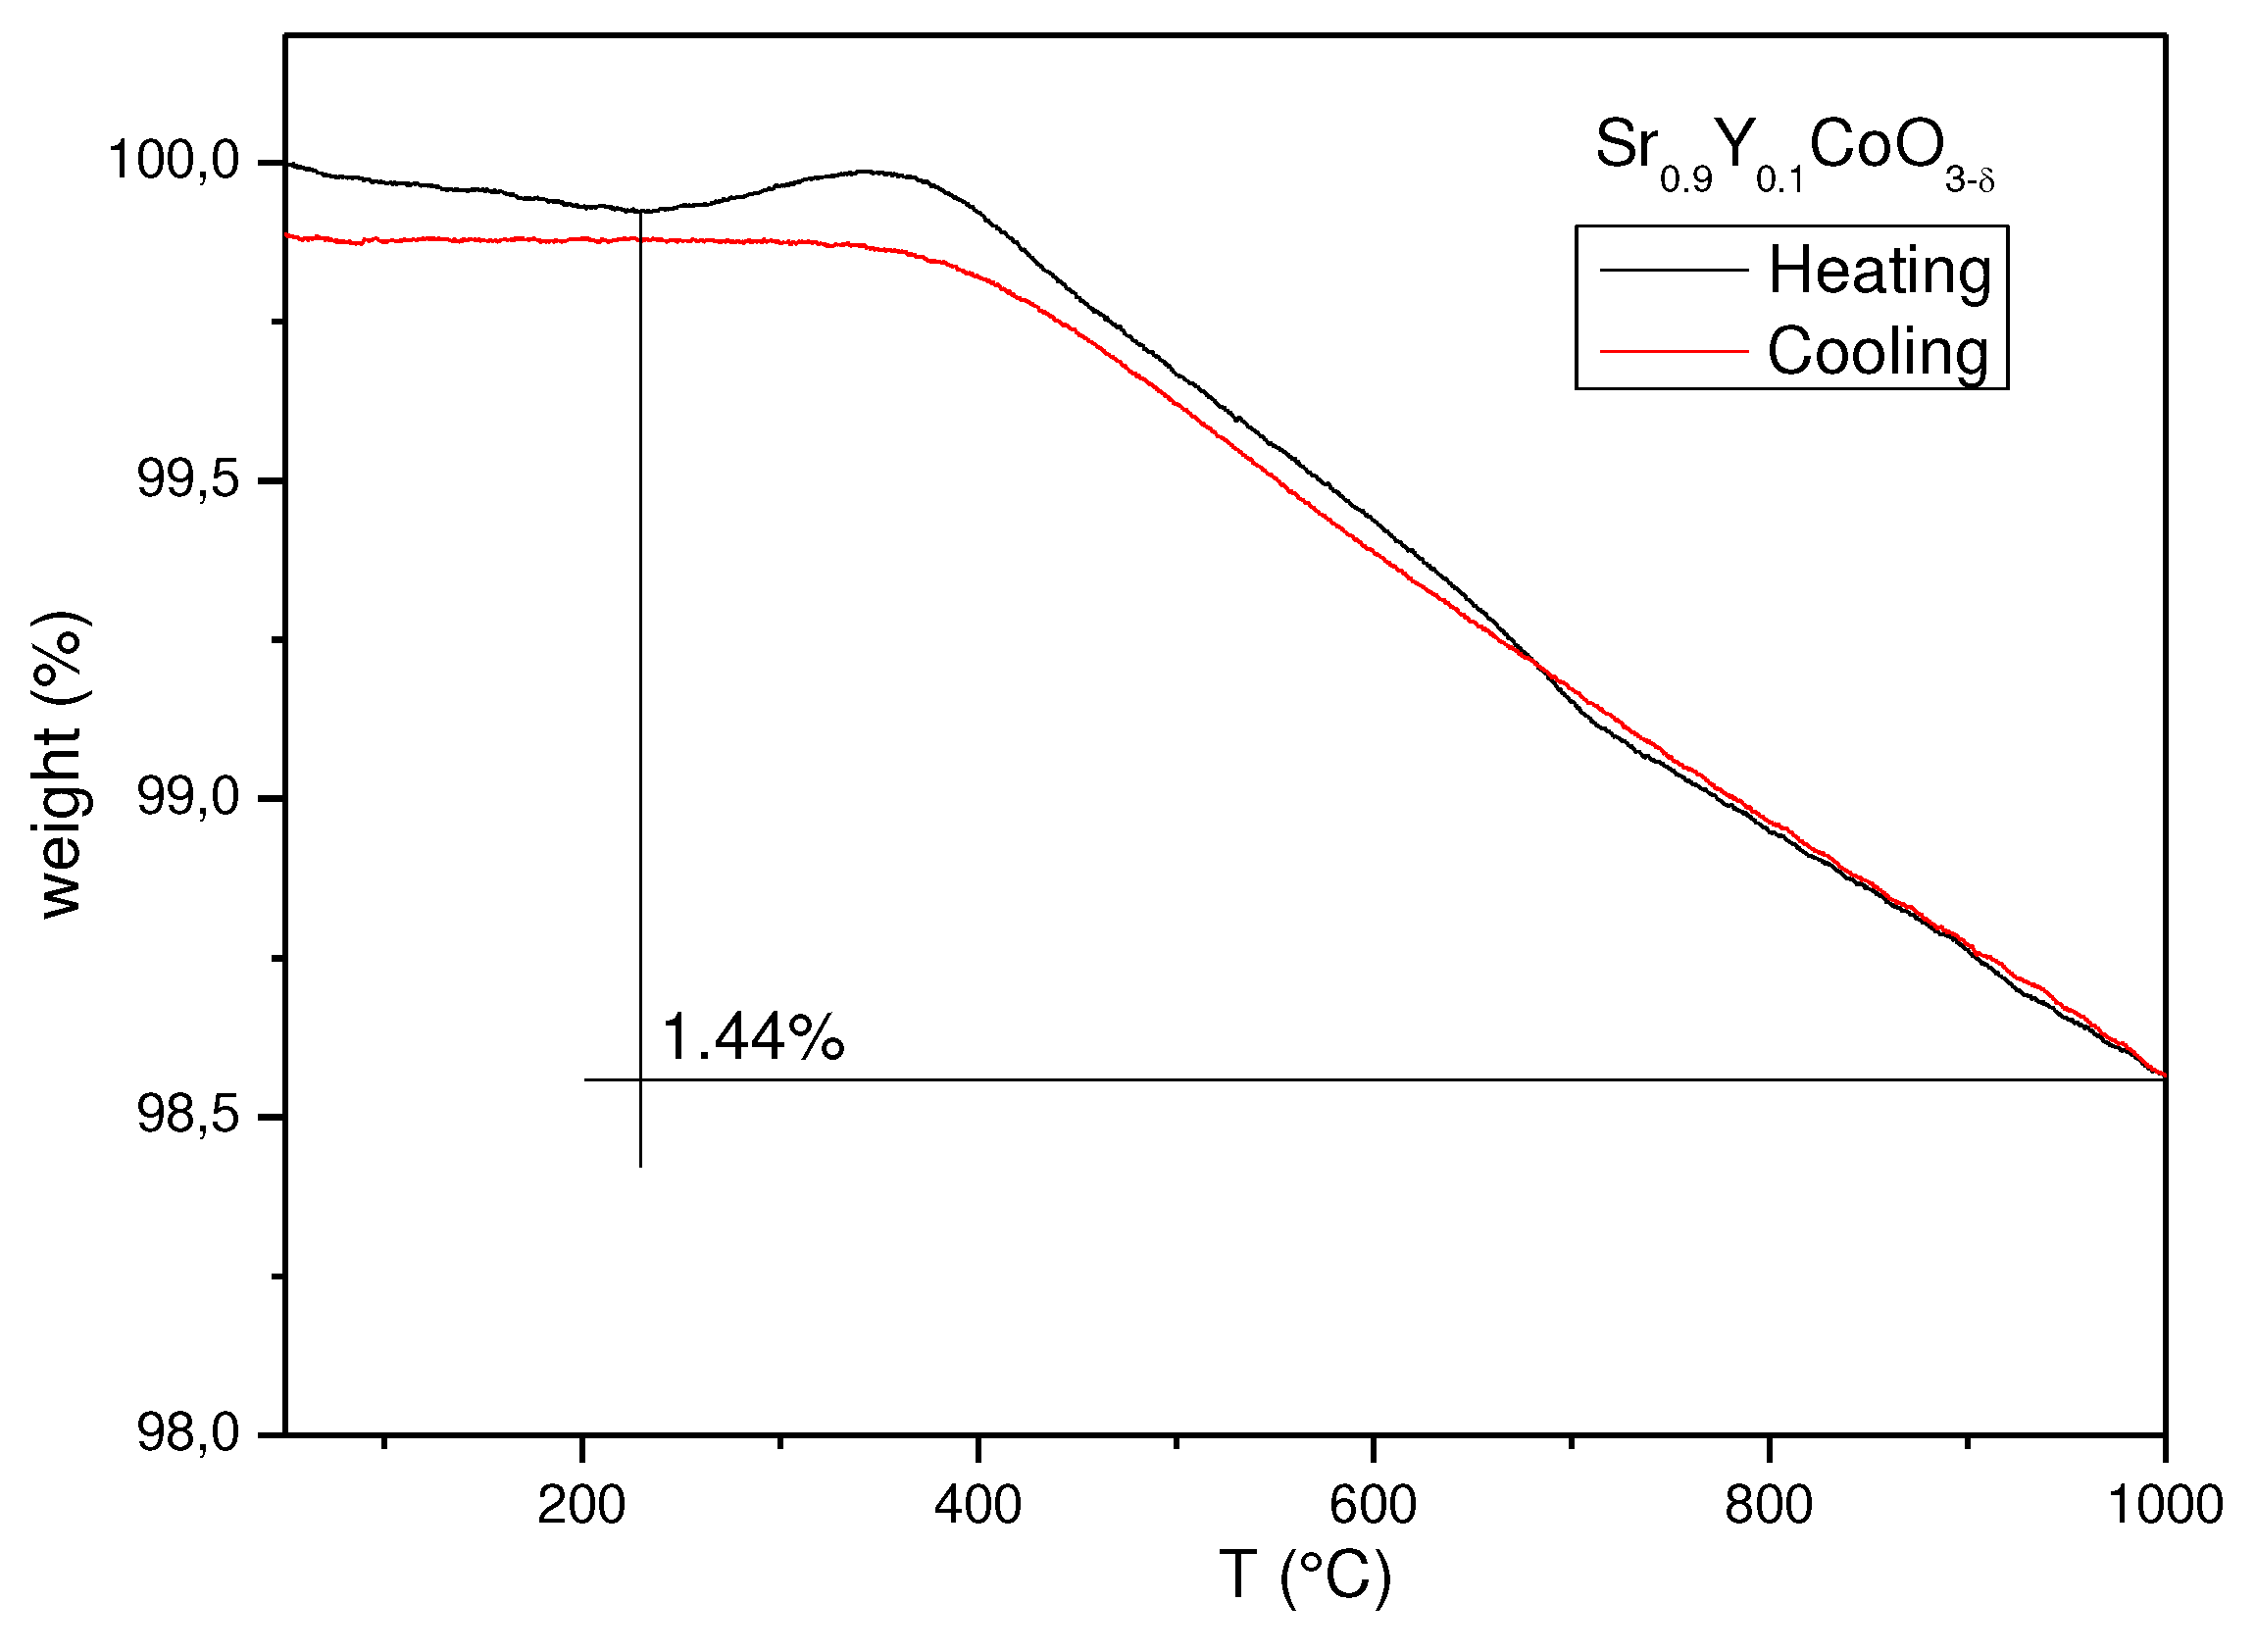
Figure 3 shows the experimental TG curves in the heating and cooling runs, showing a total weight loss of 1.44% at 1000ºC that corresponds to the creation of new oxygen vacancies with increasing temperature. There is a weight gain at 400 °C; in similar compounds [
32,
33,
35] related to doped SrCoO
3, a phase transition from tetragonal to cubic phase has been observed in this temperature range, which is concomitant with a subtle oxygen uptake. The cooling run confirms the reversibility in air atmospheres of the oxygen of the perovskite, the specimen recovers the lost oxygen, virtually reaching the same initial composition.
3.3. XPS Measurements
The characterization of the surface of the sample was carried out to know the oxidation state of the Sr, Y, and Co elements in the Sr
0.8Y
0.2CoO
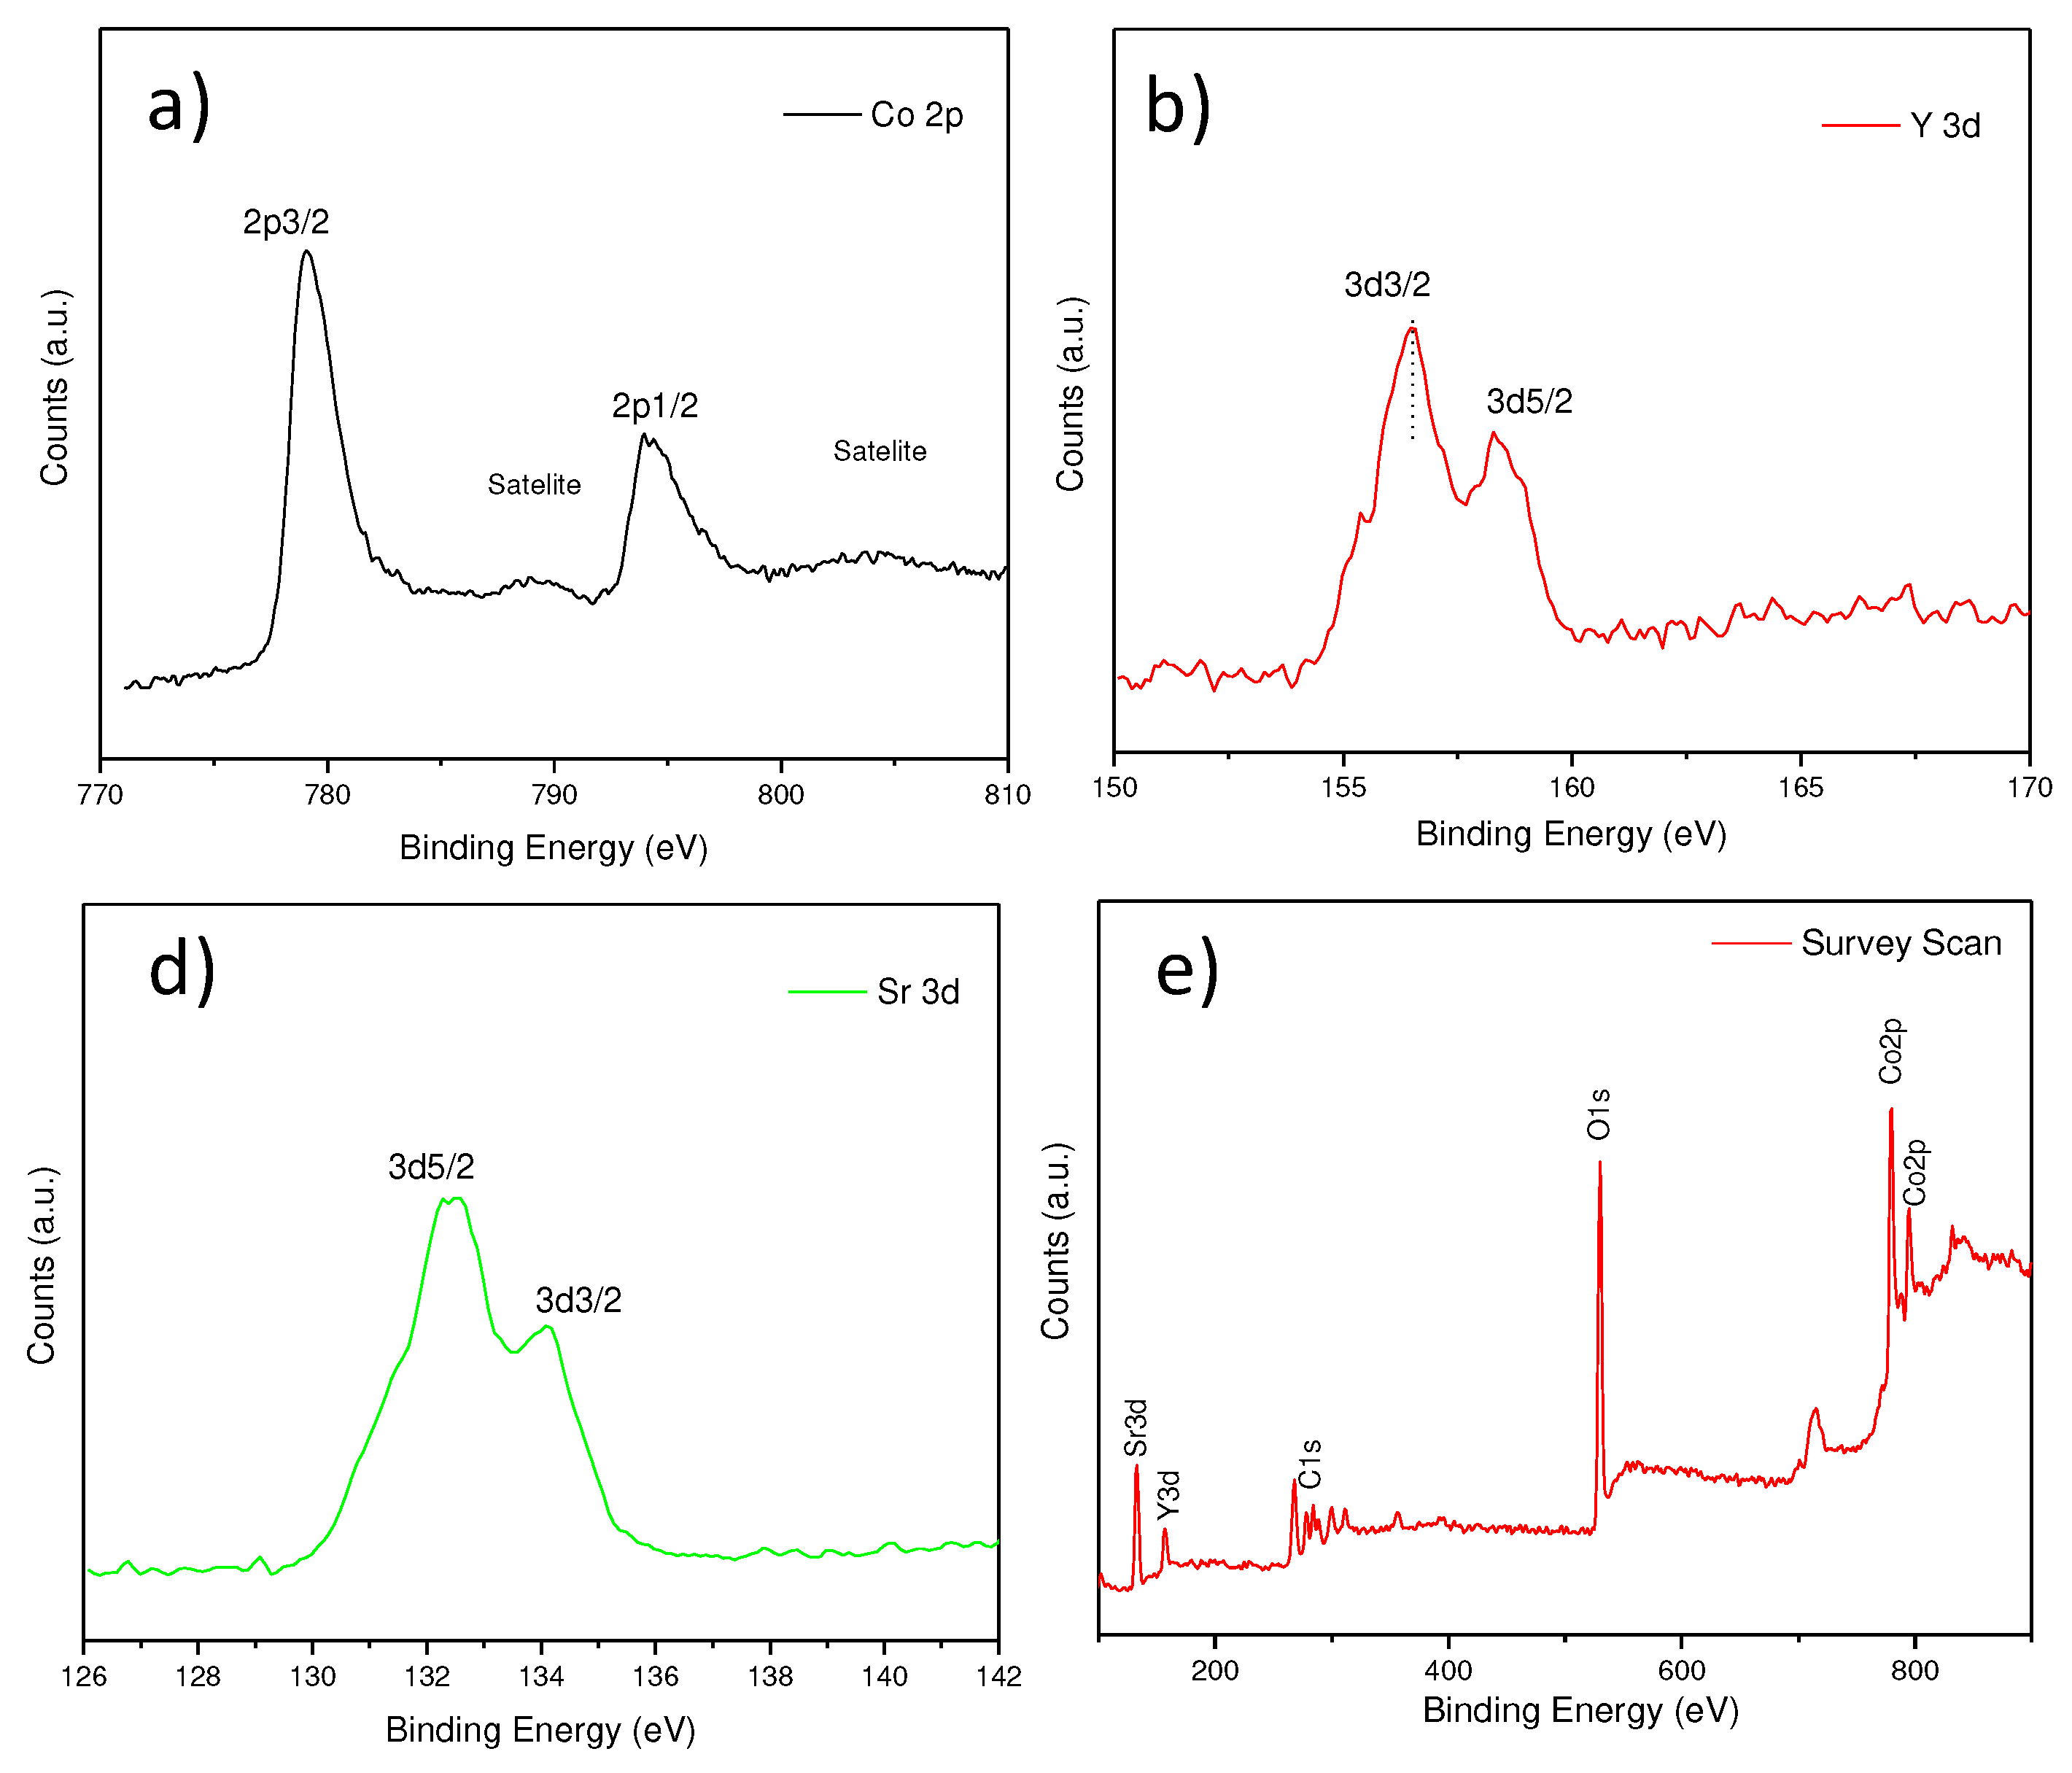
3-δ sample. The XPS spectra are shown in
Figure 4. The peaks at binding energy (see
Figure 4d) of 133.1, 157.1, 284.1, 530.1 and 781.8 eV are ascribed to Sr 3d, Y 3d, C 1s, O 1s, and Co 2p.
Figure 4a shows that the binding energy value is compatible to Co 2p3/2. Two doublets are observed at 781.1 eV and 794.2 eV, those corresponding respectively to Co 2p3/2 peak Co 2p1/2. Their corresponding satellite are located at 790 and 803 eV. This means that Co is present as a mixed oxidation state of Co(IV) and Co(III), which is consistent with the cation distribution inferred by NPD. The energy difference between Co 2p3/2 and Co 2p1/2 due to spin-orbit splitting is about 13.1 eV. Concerning the binding energy of the Y 3d core level,
Figure 4b shows a value of doublets around 156.5 and 158.3 eV, characteristic of Y
3+ species.
Figure 4c also shows the surface information of the Sr 3d that correspond to Sr
2+ oxidation state.
3.4. Electrical Conductivity
The electrical conductivity of the Sr
0.8Y
0.2CoO
3-δ sample was determined by the dc four-probe method between 100 and 800 °C in a densified pellet under the air atmosphere (
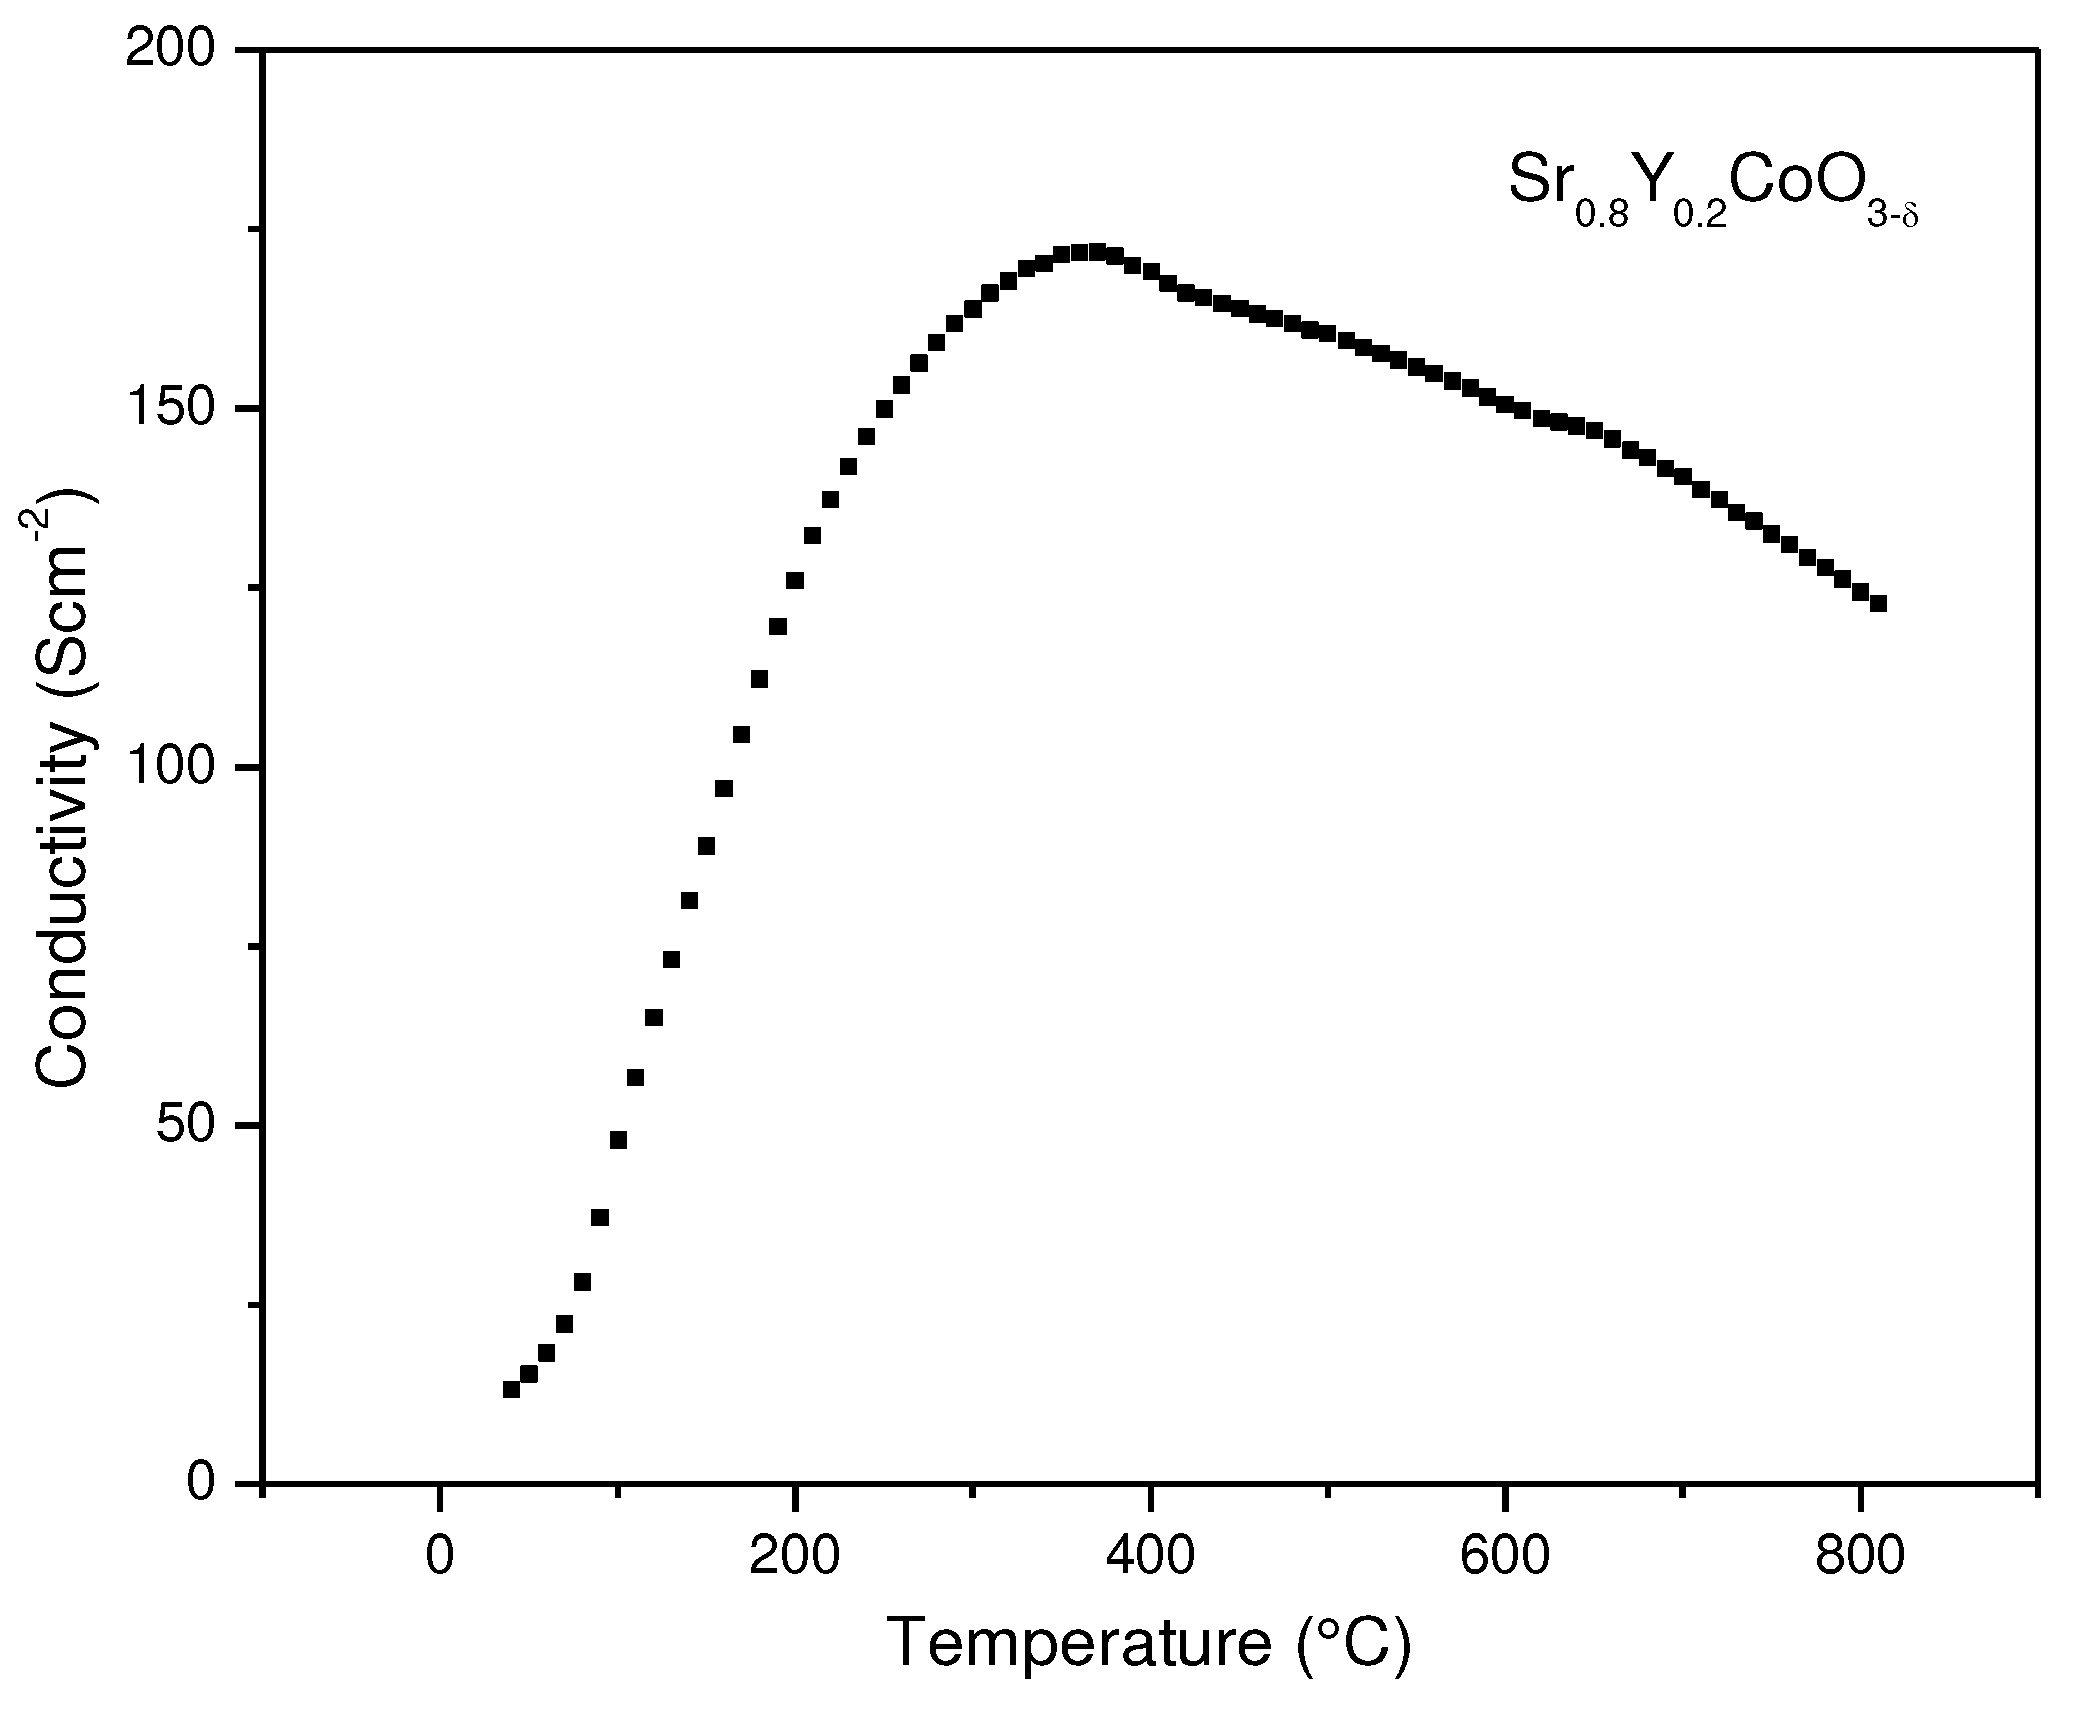
Figure 5). The material shows semiconductor behavior with a maximum conductivity of 170 S·cm
–1 at 360 °C. A metal–insulator transition occurs around 400°C. The conductivity at 800 °C is 122 S·cm
–1. The conductivity values at this last temperature can be considered quite high, which is attractive for the performance of this material as a cathode. In fact, it is comparable with the magnitudes obtained for related derivatives of SrCoO
3−δ that have been used successfully as electrode materials in SOFC [
26,
31,
32,
35].
3.5. EIS Measurements
The electrode performance was initially assessed through impedance spectroscopy in ambient air under open-circuit potential (OCP) conditions, utilizing the same electrode on opposing sides of the LSGM electrolyte.
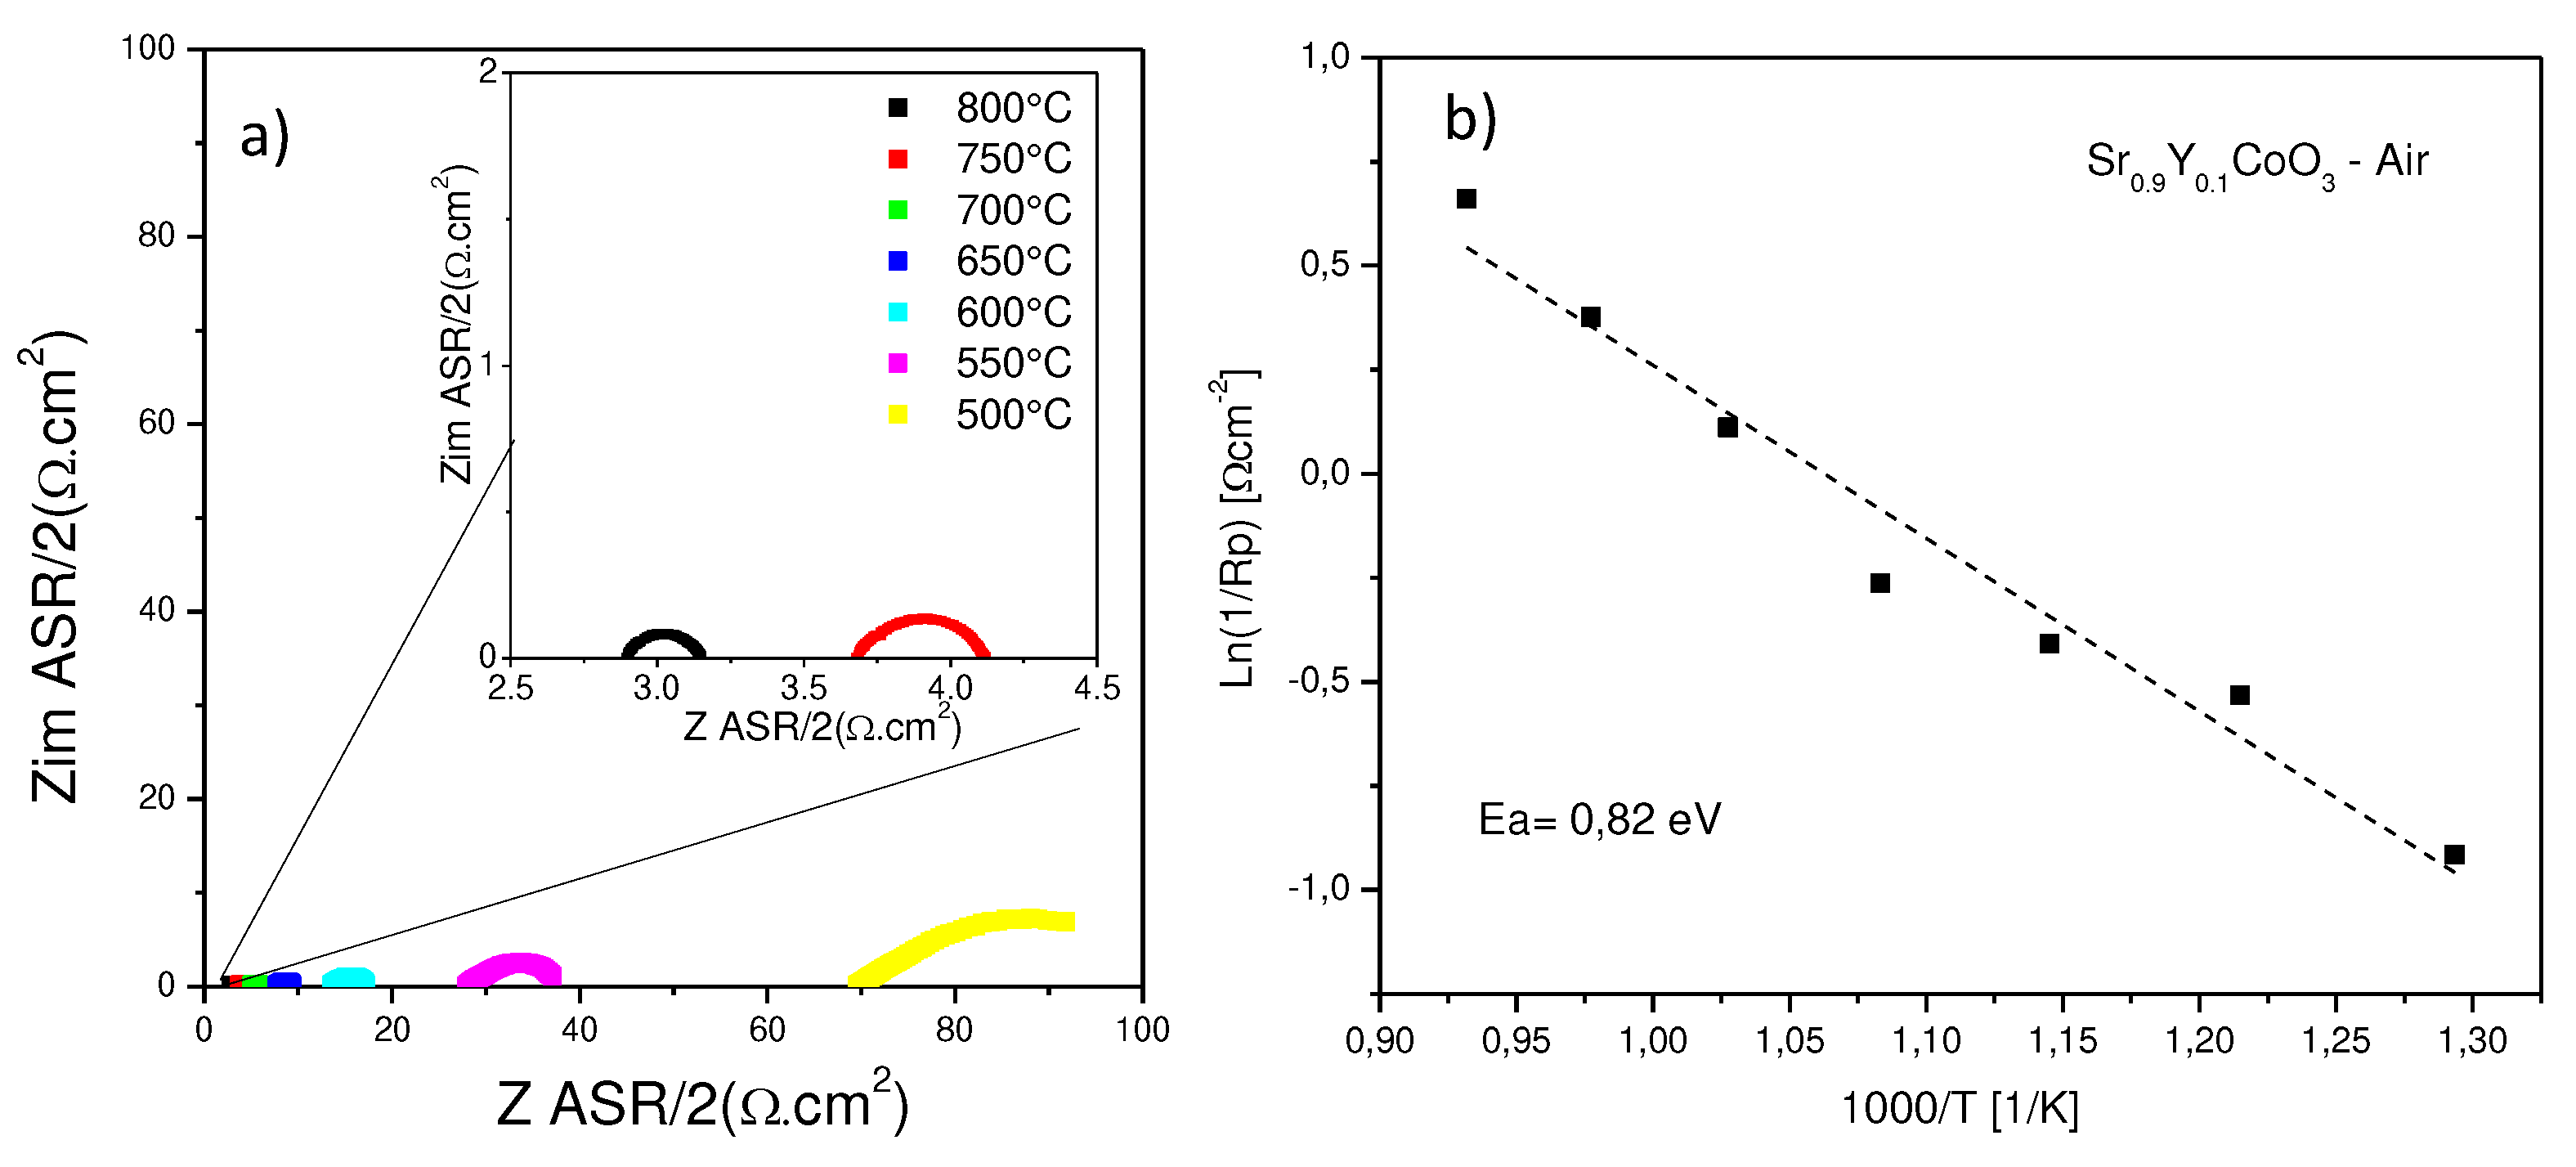
Figure 6 illustrates the impedance spectra recorded from 500 to 800 °C for Sr
0.9Y
0.1CoO
3-δ. The resistances ASR associated with the kinetics of electrode processes decrease with increasing temperature, as expected.
In general, the charge conduction processes within these materials exhibit characteristics of both resistive (impediment to charge circulation) and capacitive ("double layer" effect) processes, operating concurrently. Consequently, each of these transport processes is typically modeled as an (R-CPE) circuit, with both contributions represented as a semicircle in a Nyquist diagram. CPEs represent a time-dependent capacitive element, often referred to as pseudo-capacitance.
All measured spectra incorporate an ohmic resistance (R1) (the intercept between the impedance arc at high frequencies and the real axis), which represents the resistance of the electrolyte. As expected, this resistance increases with decreasing temperature.
A lower temperatures, the spectra here were simulated by a (R1, R2-CPE1, R3-CPE2) circuit, indicating that two processes are associated with the mechanism of oxygen incorporation in the material implying that the oxygen reduction reaction is diminished by the effect of temperature, becoming more resistive the ionic conduction within the electrode structure.
From 600°C to 800°C only one arc is observed for this compound, as observed in the inset of
Figure 6. The spectra were simulated by (R1, R2-CPE1) elements. Due to these high temperatures, it becomes evident that the hopping of oxygen species from the electrode to the electrolyte structure it becomes much more efficient. The lowest polarization resistance was found at 800°C.
The electrode polarization in this case measures 0.25 and 0.43 Ω·cm2 at temperatures of 800 °C and 750 °C, respectively, while for 500°C a value of 30.43 Ω·cm2 is obtained.
The favorable performance of Sr0.9Y0.1CoO3-δ as a cathode with the LSGM electrolyte is evident in the low electrode polarization resistances. These values, particularly at 800 °C, closely resemble those of perovskites within the same class.
The activation energy (Ea) for Sr
0.9Y
0.1CoO
3-δ perovskite was obtained from an Arrhenius plot, as shown in
Figure 6, where the total area specific polarization resistance (ASR) is represented as a function of temperature. This value of activation energy, Ea = 0.82 eV [
34,
36,
37], is associated with the process of oxygen reduction reaction. It is noteworthy to mention that this value is much lower than those reported for other similar compounds, typically around 1.0-1.5 eV. This value implies that there will be a greater mobility of oxygen ions in the structure of the perovskite, given the large number of vacancies existing within its crystalline structure.
3.6. Single Cell Performance
The performance of the Sr0.9Y0.1CoO3-δ oxide as a cathode material was tested in single cells in an electrolyte-supported configuration using a 300-μm-thick LSGM electrolyte. The test was carried out only for x= 0.1, because this sample does not present impurities.
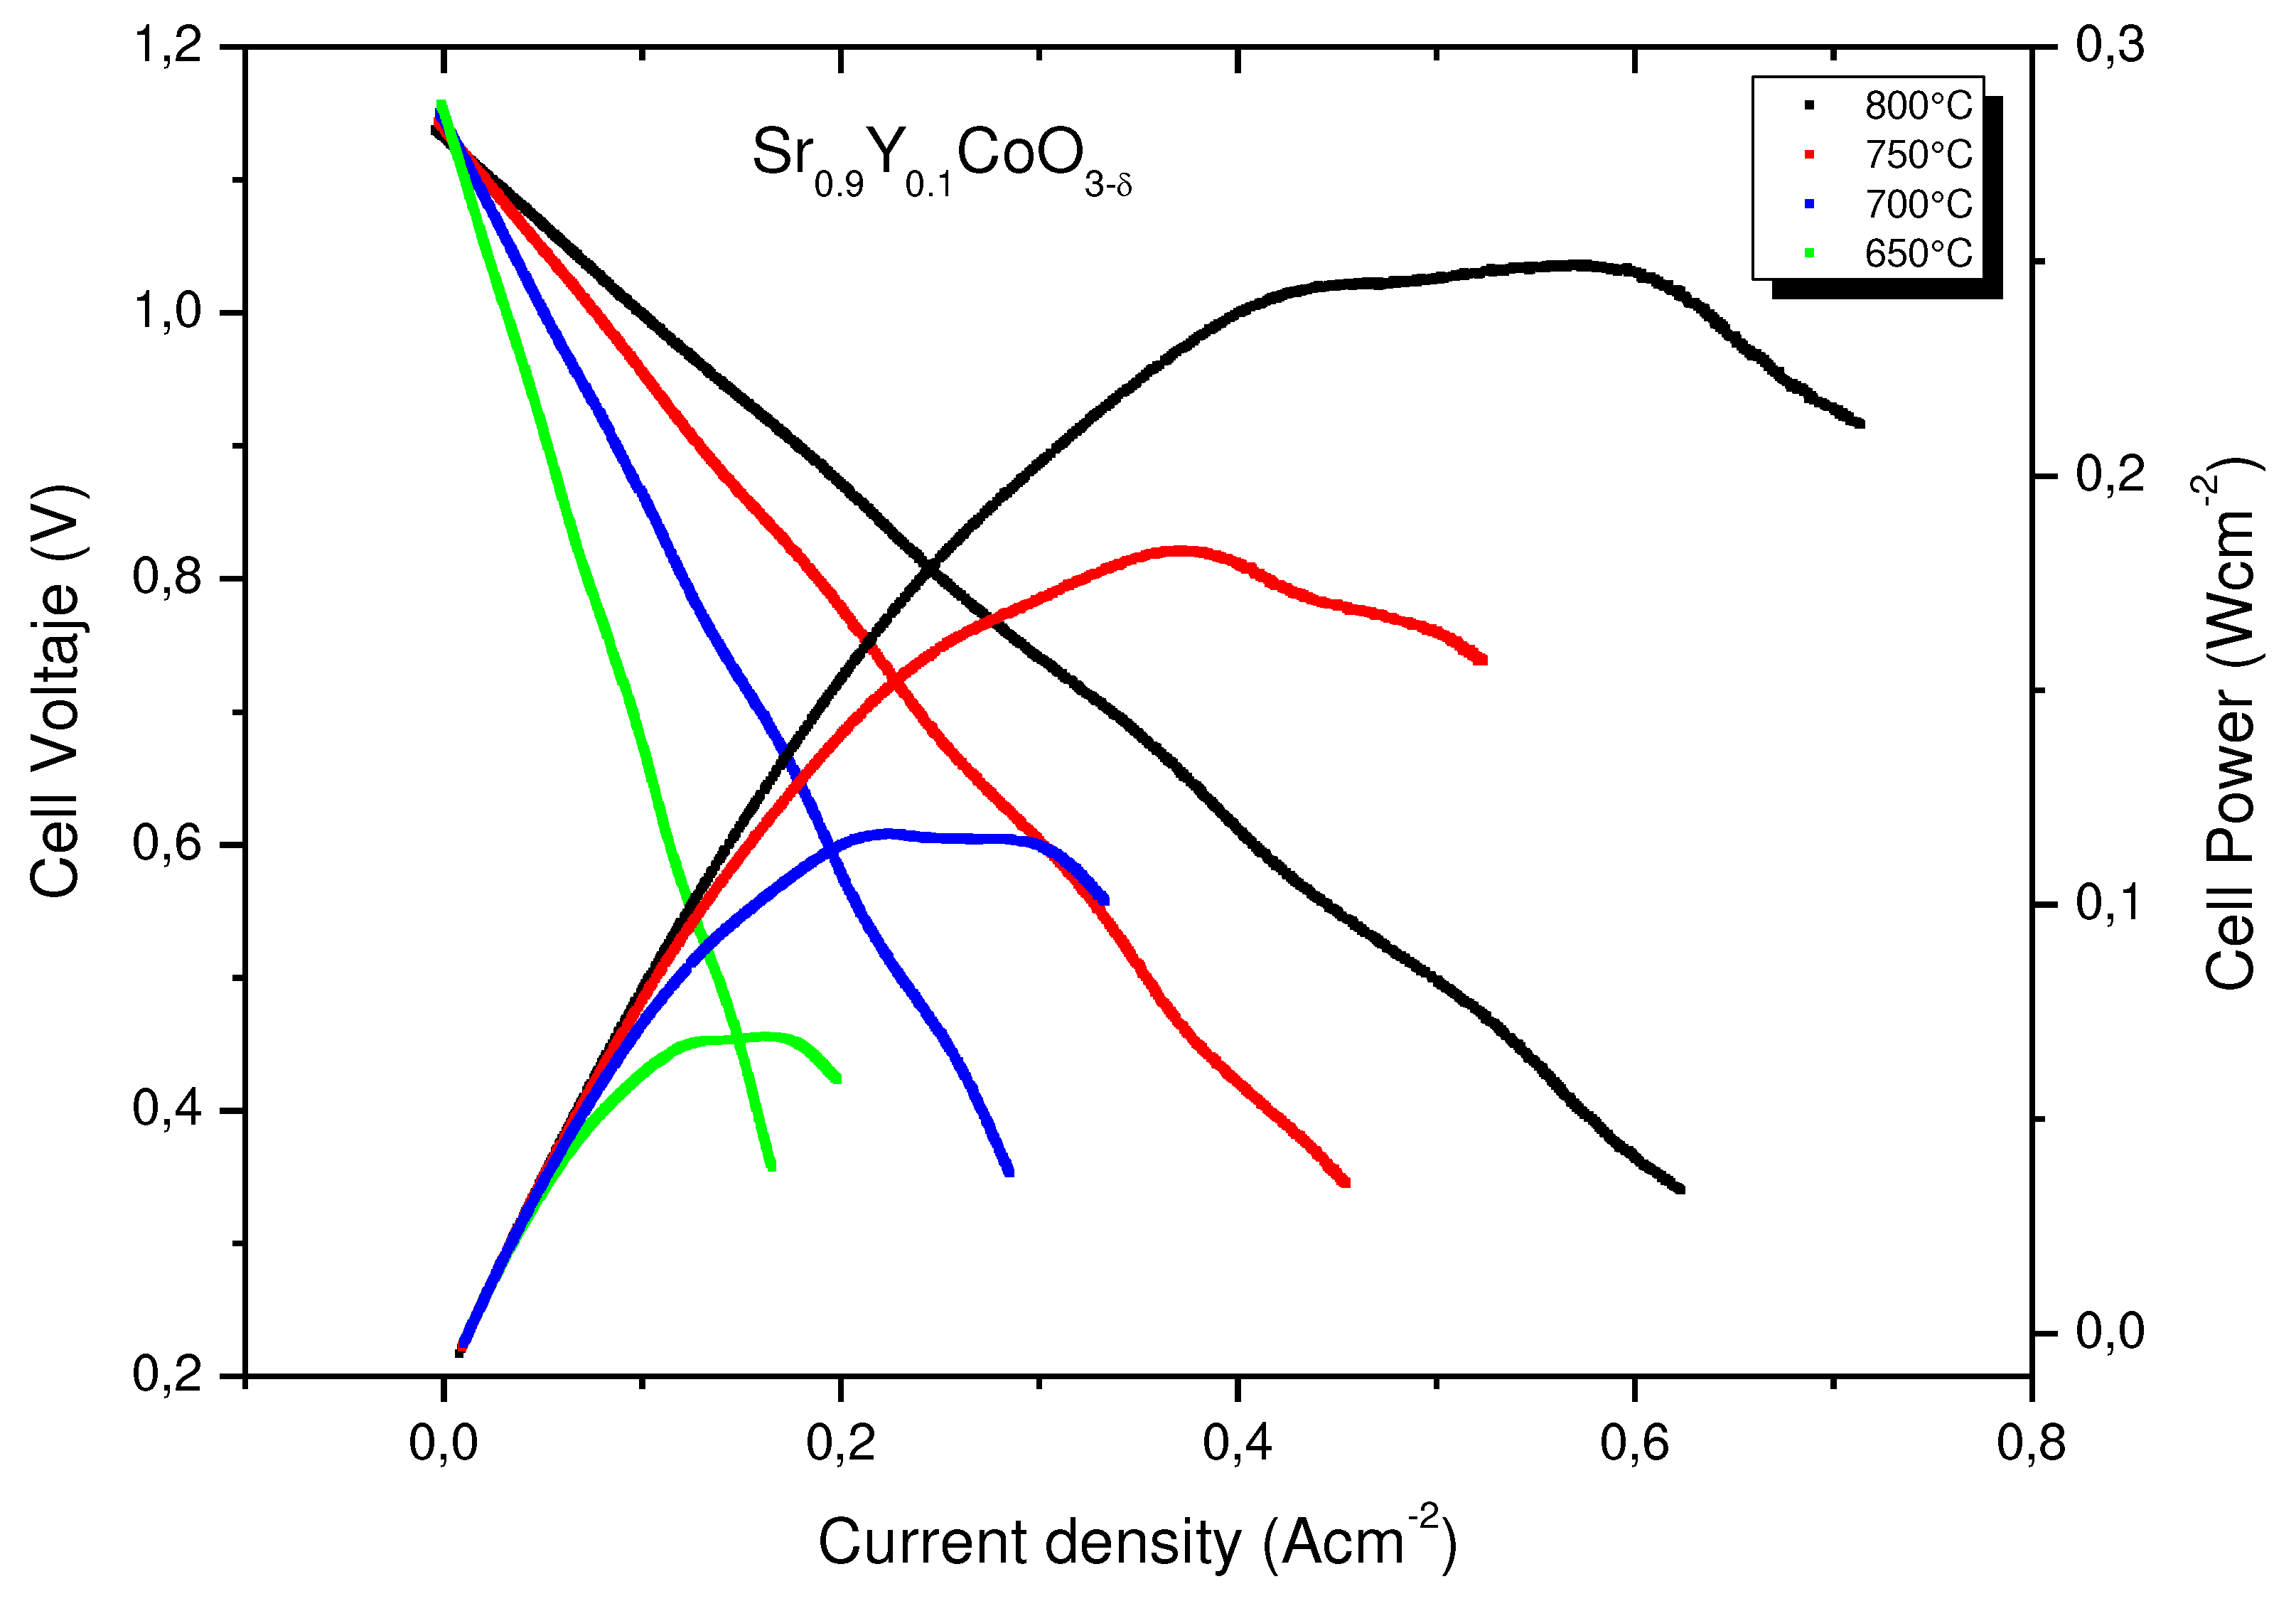
Figure 7 illustrates the cell voltage and power density as a function of current density between 650°C and 800 °C for the single cells fed with pure H
2. The cathode side is in direct contact with air atmosphere. The maximum power densities generated by the cell are 0.25, 0.18, 0.11 and 0.06 Wcm
−2 at 800, 750, 700 and 650°C respectively. The obtained results show that Sr
0.9Y
0.1CoO
3-δ exhibit a moderate catalytic activity for the oxygen reduction reaction at intermediate temperatures, i.e, and the material is a plausible candidate to be used as a cathode in a SOFC.
5. Conclusions
We have studied the effect of the Y doping in the SrCoO3-δ perovskite, showing that Sr1-xYxCoO3–δ (x = 0.1 and 0.2) oxides can be successfully utilized as cathode materials in single SOFC cells with LSGM as electrolyte. A structural study from NPD data unveils the presence of conspicuous amounts of oxygen vacancies, ordered in layers and responsible for the formation of a tetragonal superstructure with doubled c axis. A maximum power density of 0.25 W·cm−2 was obtained at 800 °C with pure H2 as fuel for x = 0.1. This result is consistent with the excellent electronic conductivity and low ASR resistance, similar to those observed for other cathodes used in SOFC.
Author Contributions
Conceptualization, Y.L. and J.A.; methodology, Y.L.; formal analysis, Y.L., J.A, L.T; investigation, Y.L., J.A, L.T., M.T.F.D; writing—original draft preparation, J.A, L.T, Y.L.; writing—review and editing, J.A, L.T, Y.L.; project administration, Y.L.; funding acquisition, Y.L, J.A, L.T. All authors have read and agreed to the published version of the manuscript.
Funding
This work was supported by the National Science Foundation of China (Grant No. 51402019) and Beijing Natural Science Foundation (Grant No. 2152011). J.A.A. thanks the financial support of the Spanish Ministry for Science and Innovation (MCIN/AEI/10.13039/501100011033) for funding the project number: PID2021-122477OB-I00. L.T. thanks the project Fondecyt Regular 1220630, the Millennium Institute on Green Ammonia as Energy Vector - MIGA (ICN2021_023) supported by the Millennium Scientific Initiative by ANID and EQM190016 Fondequip project. We thank ILL for the beam time availability.
Conflicts of Interest
The authors declare no conflict of interest.
References
- J.A. Caton, Maximum efficiencies for internal combustion engines: Thermodynamic limitations. Int. J. Engine Res., 19, 1005–1023, 2018. [CrossRef]
- N.Q Minh, Ceramic Fuel Cells, J. Am. Ceram. Soc, 76, 563-588, 1993. [CrossRef]
- 3. Min-Fang Han, Jie Xiong, Tenglong Zhu and Subhash C. Singhal, Performance of Solid Oxide Fuel Cells on H2, NH3 and Hydrocarbon Fuels, ECS Trans, 50, 163, 2013. [CrossRef]
- G. Cinti, U. Desideri, D. Penchini, G. Discepoli, Experimental Analysis of SOFC Fuelled by Ammonia, Experimental Analysis of SOFC Fuelled by Ammonia. Fuel Cells, 14, 221-230, 2014. [CrossRef]
- P. Marcello Falcone, M. Hiete, A. Sapio, Hydrogen economy and sustainable development goals: Review and policy insights, Current Opinion in Green and Sustainable Chemistry, 31, 2452-2236, 2021. [CrossRef]
- The Hydrogen Economy. In: Biohydrogen. Green Energy and Technology. Springer, London, 2009. [CrossRef]
- S. Cloete, O. Ruhnau, L. Hirth, On capital utilization in the hydrogen economy: The quest to minimize idle capacity in renewables-rich energy systems, International Journal of Hydrogen Energy, 46, 169-188 2021. [CrossRef]
- 8. Noussan, M.; Raimondi, P.P.; Scita, R.; Hafner, M. The Role of Green and Blue Hydrogen in the Energy Transition—A Technological and Geopolitical Perspective. Sustainability 2021, 13, 298. [CrossRef]
- D. Milani, A. Kiani, R. McNaughton, Renewable-powered hydrogen economy from Australia's perspective, International Journal of Hydrogen Energy, 45, 24125-24145,2020. [CrossRef]
- [Areum Jun, Jeeyoung Shinb and Guntae Kim, High redox and performance stability of layered SmBa0.5Sr0.5Co1.5Cu0.5O5+δ perovskite cathodes for intermediate-temperature solid oxide fuel cells, Phys. Chem. Chem. Phys., 15, 19906-19912, 2013. [CrossRef]
- C. Sun, R. Hui, J. Roller, Cathode materials for solid oxide fuel cells: a review. J. Solid State Electrochem., 14, 2010, 1125-1144, 2010. [CrossRef]
- [12 J.-H. Kim and A. Manthiram, Layered LnBaCo2O5+δ perovskite cathodes for solid oxide fuel cells: an overview and perspective, J. Mater. Chem. A, ,3, 24195-24210, 2015. [CrossRef]
- 13. S.V. Moharil, B.S. Nagrare, S.P.S. Shaikh,Nanostructured MIEC Ba0.5Sr0.5Co0.6Fe0.4O3−δ (BSCF5564) cathode for IT-SOFC by nitric acid aided EDTA–citric acid complexing process (NECC),International Journal of Hydrogen Energy, 37, 5208-5215, 2012. [CrossRef]
- Jin, F., Liu, X., Chu, X. et al. Effect of nonequivalent substitution of Pr3+/4+ with Ca2+ in PrBaCoFeO5+δ as cathodes for IT-SOFC. J Mater Sci 56, 1147–1161, 2021. [CrossRef]
- W. Xia, X. Liu, F. Jin, X. Jia, Y. Shen, J. Li, Evaluation of calcium codoping in double perovskite PrBaCo2O5+δ as cathode material for IT-SOFCs, Electrochimica Acta, 364, 137274, 2020. [CrossRef]
- J. Fleig, J. Maier, The polarization of mixed conducting SOFC cathodes: Effects of surface reaction coefficient, ionic conductivity and geometry, Journal of the European Ceramic Society, 24, 6, 1343-1347, 2004. [CrossRef]
- I.I. Gainutdinov, A.P. Nemudry, I.L. Zilberberg, The influence of A- and B-cation substitution on electronic structure of SrFeO3 and SrCoO3, Materials Today: Proceedings, 12 Part 1, 21-24, 2019. [CrossRef]
- Sea-Fue Wang, Yung-Fu Hsu, Chun-Ting Yeh, Chien-Chung Huang, Hsi-Chuan Lu, Characteristics of SrCo1−xSnxO3−δ cathode materials for use in solid oxide fuel cells, Solid State Ionics,227, 10-16, 2012. [CrossRef]
- Sea-Fue Wang, Chun-Ting Yeh, Yuh-Ruey Wang, Yung-Fu Hsu, Effects of (LaSr)(CoFeCu)O3−δ cathodes on the characteristics of intermediate temperature solid oxide fuel cells,Journal of Power Sources, 201, 18-25, 2012. [CrossRef]
- X. Xu, J. Zhao, M. Li, L. Zhuang, J. Zhang, S. Aruliah, F. Liang, H. Wang, Z. Zhu, Sc and Ta-doped SrCoO3-δ perovskite as a high-performance cathode for solid oxide fuel cells, Composites Part B: Engineering, 178, 107491, 2019. [CrossRef]
- N. Tsvetkov, Q. Luac and B. Yildiz, Improved electrochemical stability at the surface of La0.8Sr0.2CoO3 achieved by surface chemical modification, Faraday Discuss.,182, 257-269, 2015. [CrossRef]
- Radenka Maric et al, Solid Oxide Fuel Cells with Doped Lanthanum Gallate Electrolyte and LaSrCoO3 Cathode, and Ni‐Samaria‐Doped Ceria Cermet Anode, J. Electrochem. Soc., 146, 2006, 1999. [CrossRef]
- Sh.I. Elkalashy, A.R. Gilev, T.V. Aksenova, A.S. Urusova, V.A. Cherepanov, Phase equilibria, structure and properties of complex oxides in the NdFeO3−δ – SrFeO3−δ – SrCoO3−δ – NdCoO3−δ system as potential cathodes for SOFCs, Solid State Ionics, 316, 85-92, 2018. [CrossRef]
- S. Sydyknazar, V. Cascos, L. Troncoso, A. L. Larralde, M. T. Fernández-Díaz, J. A. Alonso, Design, Synthesis, Structure and Properties of Ba-Doped Derivatives of SrCo0.95Ru0.05O3−δ Perovskite as Cathode Materials for SOFCs, Materials 1957,12, 2019. [CrossRef]
- Rida Batool et al, Mater. Res. Express, 6, 095531, 2019.
- A. Aguadero, J.A. Alonso, D. Pérez-Coll, C. de la Calle, M.T. Fernández-Díaz, and J.B. Goodenough, SrCo0.95Sb0.05O3−δ as Cathode Material for High Power Density Solid Oxide Fuel Cells, Chem. Mater., 22, 789–798, 2010. [CrossRef]
- S. Le, C. Li, X. Song, Y. Zhang, Y. Feng, Y. Mao, X. Zhu, N. Zhang, Z. Yuan, A novel Nb and Cu co-doped SrCoO3-δ cathode for intermediate temperature solid oxide fuel cells, International Journal of Hydrogen Energy, 45, 10862-10870, 2020. [CrossRef]
- H. M. Rietveld, J. Appl. Crystallogr., 1969, 2, 65–71.
- J. Rodríguez-Carvajal, Phys. B, 1993, 192, 55–69.
- Martínez-Coronado, R.; Alonso, J. A.; Aguadero, A.; Fernández-Díaz, M. T. Optimized energy conversion efficiency in solid oxide fuel cells implementing SrMo1‑xFexO3‑δ perovskites as anodes. J. Power Sources 2012, 208, 153−158. [CrossRef]
- C. Sarno, T. Yang, E. Di Bartolomeo, A Huq, K Huang, S. McIntosh, Oxygen vacancy localization and anisotropic oxygen anion transport in Sr1−xYxCoO3−δ(x=0.1,0.2) under solid oxide fuel cell cathode conditions, Solid State Ionics 321 (2018) 34–42. [CrossRef]
- V. Cascos, L. Troncoso, M. T. Fernández-Diaz, and J. A. Alonso, SrCo1-xRuxO3-δ (x = 0.05, 0.1 and 0.15) perovskites as outperforming cathode material in Intermediate-Temperature Solid Oxide Fuel Cells (IT-SOFC), ACS Appl. Energy Mater., 1, 4505–4513, 2018. [CrossRef]
- V. Cascos, M.T. Fernández-Díaz, J.A. Alonso, Structural and electrical characterization of the novel SrCo1-xTixO3–δ (x = 0.05, 0.1 and 0.15) perovskites: Evaluation as cathode materials in solid oxide fuel cells, Renewable Energy, 133, 205-215, 2019. [CrossRef]
- Xuening Jiang, Jiao Wang, Guoqiang Jia, Zijian Qie, Yuchao Shi, Asim Idrees, Qingyu Zhang, Lei Jiang, Characterization of PrBa0.92CoCuO6−δ as a potential cathode material of intermediate-temperature solid oxide fuel cell, International Journal of Hydrogen Energy, 42, 9, 2017, Pages 6281-6289. [CrossRef]
- M. Chivite, A. Alveal, J. Prado-Gonjal, J.A. Alonso, M.T.Fernández Díaz, L.Troncoso, and V. Cascos, Reducing the Cobalt Content in SrCo0.95Ti0.05O3-δ-Based Perovskites to Produce Cleaner Cathodes for IT-SOFCs, ACS Applied Energy Materials 2023 6 (2), 1046-1055. [CrossRef]
- Jie Hou, Jing Qian, Lei Bi, Zheng Gong, Ranran Peng and Wei Liu, The effect of oxygen transfer mechanism on the cathode performance based on proton-conducting solid oxide fuel cells, J. Mater. Chem. A, 2015,3, 2207-2215. [CrossRef]
- Changrong Xia et al, Functionally Graded Cathodes for Honeycomb Solid Oxide Fuel Cells 2002 Electrochem. Solid-State Lett. 5 A217. [CrossRef]
|
Disclaimer/Publisher’s Note: The statements, opinions and data contained in all publications are solely those of the individual author(s) and contributor(s) and not of MDPI and/or the editor(s). MDPI and/or the editor(s) disclaim responsibility for any injury to people or property resulting from any ideas, methods, instructions or products referred to in the content. |
© 2023 by the authors. Licensee MDPI, Basel, Switzerland. This article is an open access article distributed under the terms and conditions of the Creative Commons Attribution (CC BY) license (http://creativecommons.org/licenses/by/4.0/).
