1. Introduction
With the rapid development of the Chinese economy, there is also a growing demand for mineral resources, which has resulted in the large-scale exploitation of various minerals, including molybdenum minerals. However, the ore grade of molybdenum deposits is low [
1,
2]. After separating the valuable metals from the ore, the majority (95% of the total) is discharged as molybdenum tailings [
3,
4]. The accumulation of molybdenum tailings not only occupies large amounts of land, but also pollutes the surrounding environment [
5,
6]. Therefore, the utilization of molybdenum tailings as a resource is of great significance in reducing environmental pollution and achieving a low-carbon economy. Molybdenum tailings powder (MTs) used as an admixture in cementitious materials can not only effectively reduce cement consumption and carbon emission, but also contribute to the sustainable development of resources and the environment [
2,
3,
4,
7].
Mineral admixtures are an important component of modern concrete. Studies have shown [
8,
9,
10,
11,
12,
13,
14] that tailings containing SiO
2, Al
2O
3, CaO, and Fe
2O
3 can be used as concrete admixtures after being made into fine powders. Han et al. [
8] and Cheng et al. [
9,
10] confirmed the feasibility of using activated iron tailings powder as an admixture in concrete preparation. Geng [
11] and Qiu et al. [
14] reported that activated lead-zinc tailings powder can be used as an admixture in concrete preparation. Xu et al. [
12] and Huang et al. [
13] found that it is feasible to use the activated copper tailings powder as a concrete admixture. Molybdenum tailings have a chemical composition similar to that of iron, lead-zinc, and copper tailings, and can be used as an admixture in concrete. However, different types of tailings fine powders have different performances as concrete admixtures due to differences in beneficiation process and ore composition. It has also been shown [
15,
16,
17] that the incorporation of copper, iron, or bauxite tailings powders reduces the hydration rate and accumulated heat release of the cement paste, and then there were some differences in the hydration process of cement by different tailings powders. Meanwhile, studies have shown [
18,
19,
20,
21,
22] that molybdenum tailings can be used as fine aggregate to replace natural sand or as admixture to replace cement in preparing mortar or concrete. At present, research on the influence of molybdenum tailings as fine aggregate or admixture on the performance of mortar or concrete mainly focuses on macro-performance and micro-performance. Furthermore, the influence of MTs as an admixture on the early hydration process of composite cementitious materials (CCMs) is of great significance to the later performance of CCMs. Therefore, further study the influence of MTs on the hydration hardening mechanism and kinetics of CCMs, it is of great significance to study the properties of molybdenum tailings powder-cement cementitious materials and fully understand the influence of MTs on the early hydration process of cement. This will enhance the utilization rate of molybdenum tailings resources.
Presently, there are more methods available to investigate the hydration process and kinetics of CCMs [
23,
24,
25,
26,
27], with the Krstulovic-Dabic model being the most commonly used. Krstulovic et al. [
27] proposed a hydration kinetic model that can calculate the rate curve of the hydration reaction and the kinetic parameters. This model is based on the hydration heat and can be used to determine the hydration process and kinetic parameters of the CCMs. Yan et al. [
28,
29] discovered that the Krstulovic-Dabic model can better characterize the hydration process of the CCMs when the fly ash (FA) content is not more than 65% and the slag (SL) content does not exceed 70%. Cheng et al. [
16] found that the Krstulovic-Dabic model can also simulate the hydration kinetics of cement-iron tailings powder composite cementitious materials. Therefore, the Krstulovic-Dabic model could be used to characterize the hydration process of CCMs with MTs.
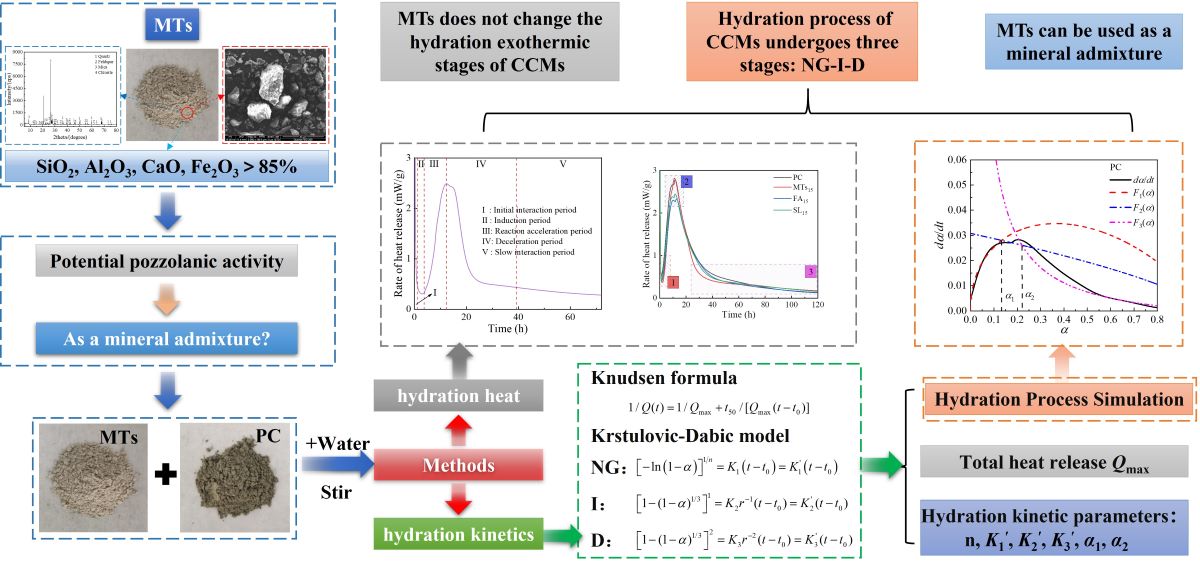
In this paper, the MTs comes from Yichun Luming Mining Co., Ltd, China. The hydration heat of CCMs was measured by an isothermal calorimeter to investigate the influence of MTs on the hydration heat of cement. Based on the Krstulovic-Dabic model, the hydration process and kinetic parameters of the CCMs were calculated and analyzed. The influence of MTs, FA, and SL on the hydration heat and hydration kinetics of cement were compared and analyzed under the same dosage. Additionally, the influence of MTs on the early hydration process of cement was discussed. The purpose of this paper is to explore the influence of MTs as mineral admixture on cement hydration process. This research aims to provide a theoretical and experimental basis for the efficient utilization of molybdenum tailings as a valuable resoure.
2. Hydration Kinetic Model
The hydration process of CCMs is generally divided into five stages: initial interaction period (I), induction period (II), reaction acceleration period (III), deceleration period (IV), and slow interaction period (V) [
30,
31]. While in early hydration, its heat release normally accounts for only about 5% of the total heat release, which is negligible compared to the whole hydration process. Therefore, the influence of the first exothermic peak is generally ignored in the study of hydration kinetics, and the simulation discussion begins at the end of the induction stage [
32,
33,
34].
The Krstulovic-Dabic model shows the relationship between the hydration degree (
α) and the hydration time (
t), and the kinetic model is divided into the following three stages [
27,
35]:
Nucleation and Crystal Growth, NG
Interactions at phase boundaries, I
Differentiating Equations (1) ~ (3) yields Equations (4) ~ (6).
Where
α is the hydration degree;
n is the reaction order;
Ki and
Ki′ (i = 1, 2, 3) are the reaction rate constants of three hydration processes;
t is the hydration time;
t0 is the end time of the induction period, which is the point at which the hydration exothermic rate starts to increase uniformly [
36];
r is the reaction particle radius;
dα/
dt is the hydration rate.
Based on the hydration heat test measured by isothermal calorimetry, the hydration heat release rate and cumulative heat release of CCMs were obtained. The formulas (7) ~ (8) were used to transform the hydration heat date into the required in the hydration kinetics model. The hydration kinetic formula (Equation (9)) proposed by Knudsen [
37] was used to calculate the
Qmax. The formula is as follows.
Where Q(t) is the heat released by time t; Qmax is the total heat release at the end of hydration; and t50 is the hydration time required for the heat release to reach 50% of Qmax.
3. Experimental
3.1. Raw Materials
P.I 42.5 Portland cement (PC) satisfied Chinese GB 175 was supplied by China Fushun Aocell Technology Co., Ltd. Molybdenum tailings powder (MTs) from Yichun Luming Mining Co., Ltd, China. The low calcium class F fly ash (FA) and S95 grade fine slag (SL) were employed, produced by Xiangtan Power Plant and Xiangtan Steel Plant (Hunan Province, China), respectively. Distilled water was used. The photos of raw materials are shown in
Figure 1, their chemical compositions and physical properties are shown in
Table 1.
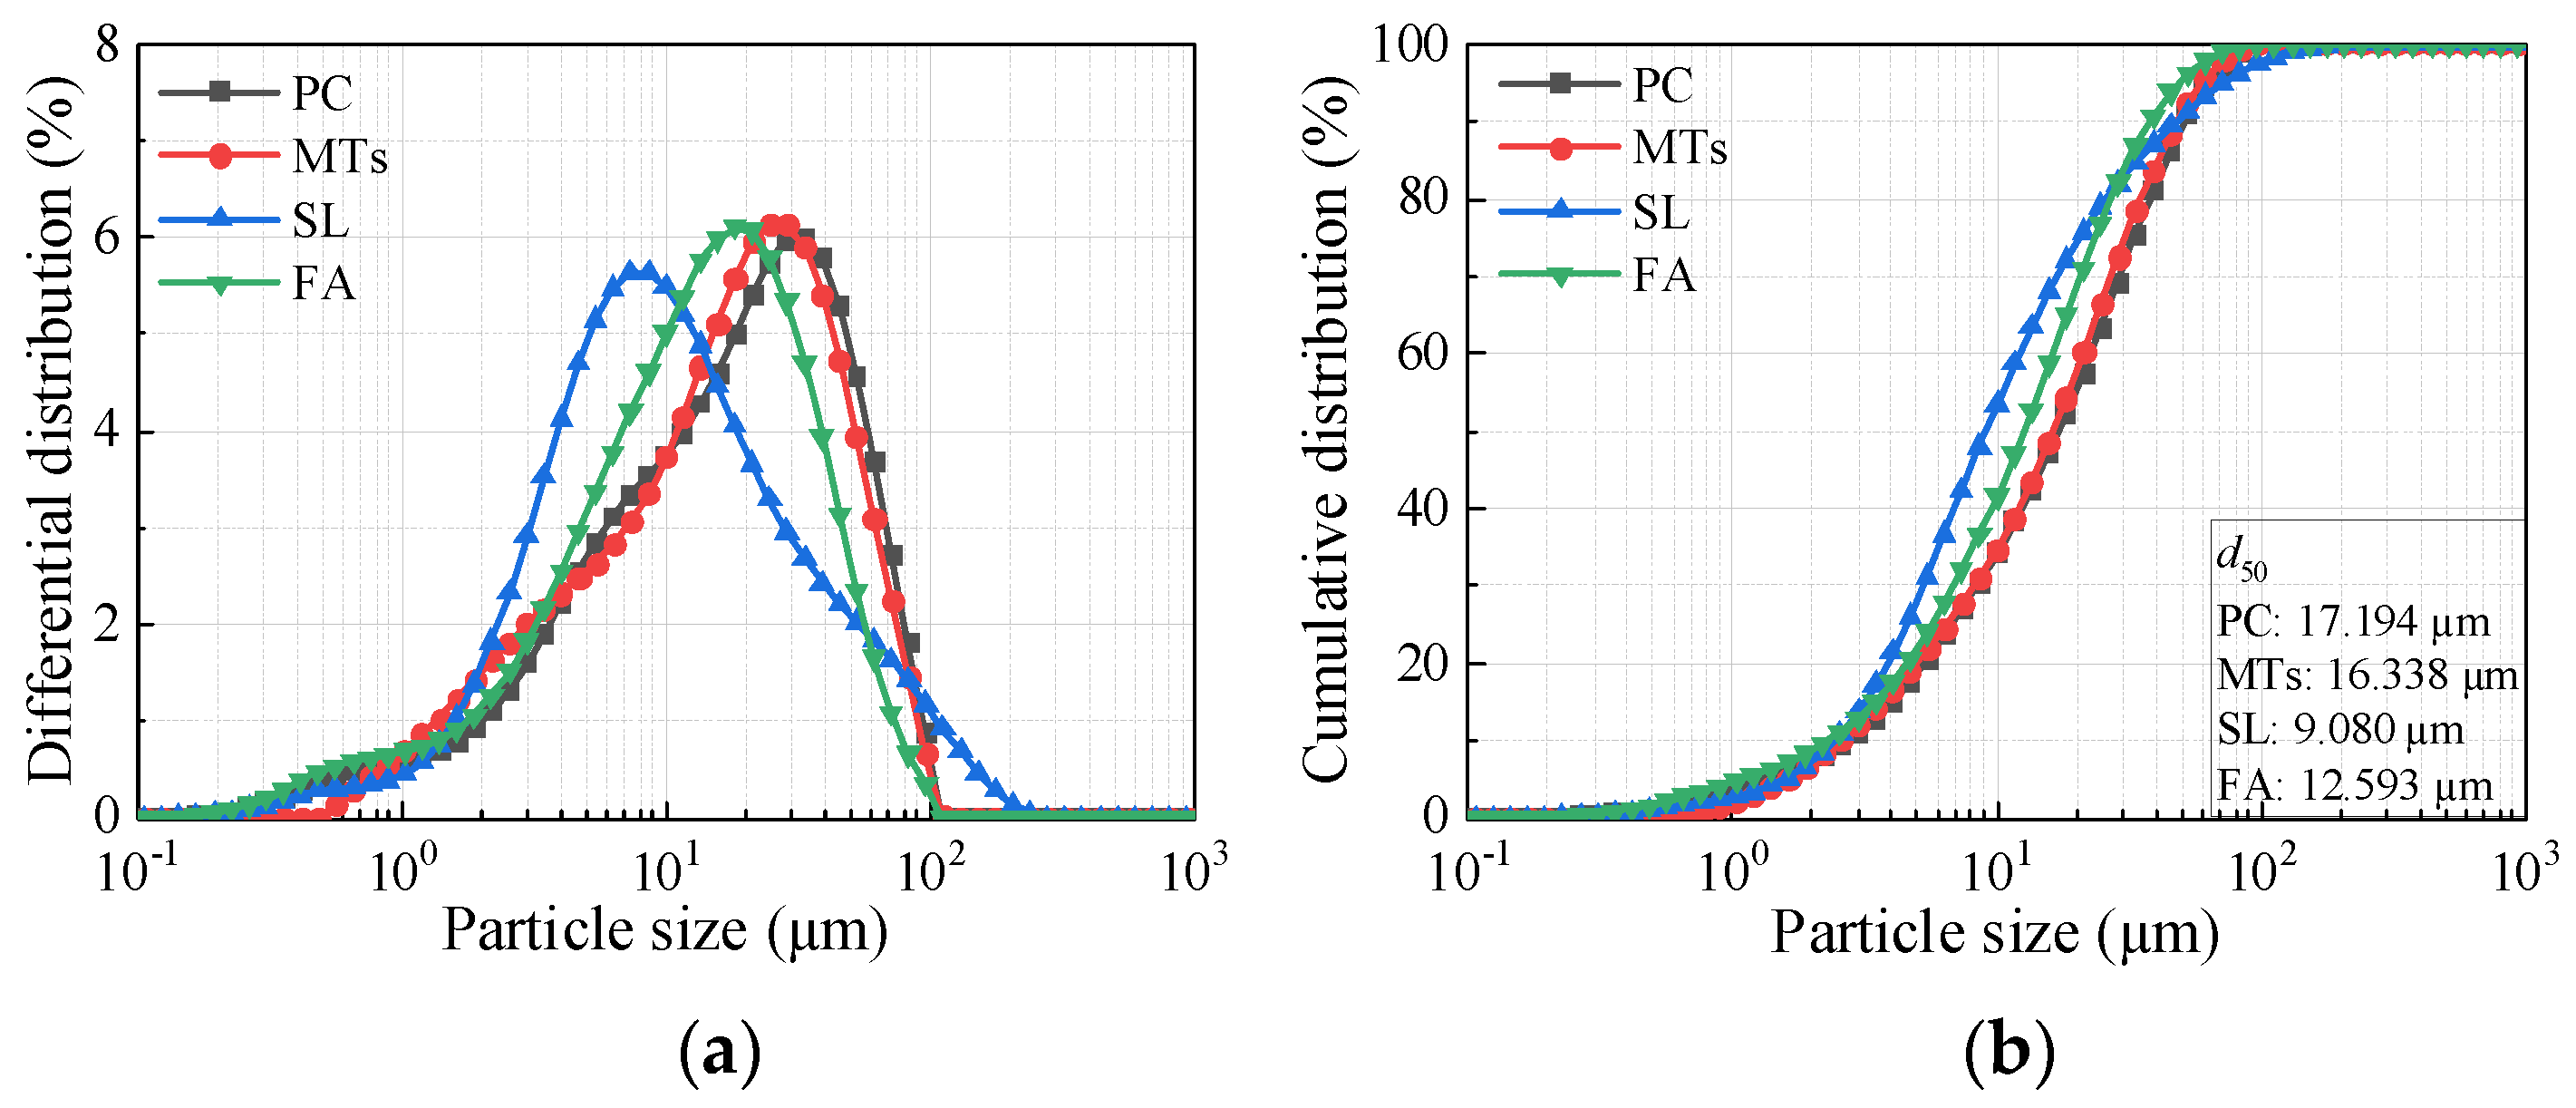
Table 2 lists the main technical indexes of MTs. The particle size distribution of raw materials is shown in
Figure 2. The XRD pattern of MTs is shown in
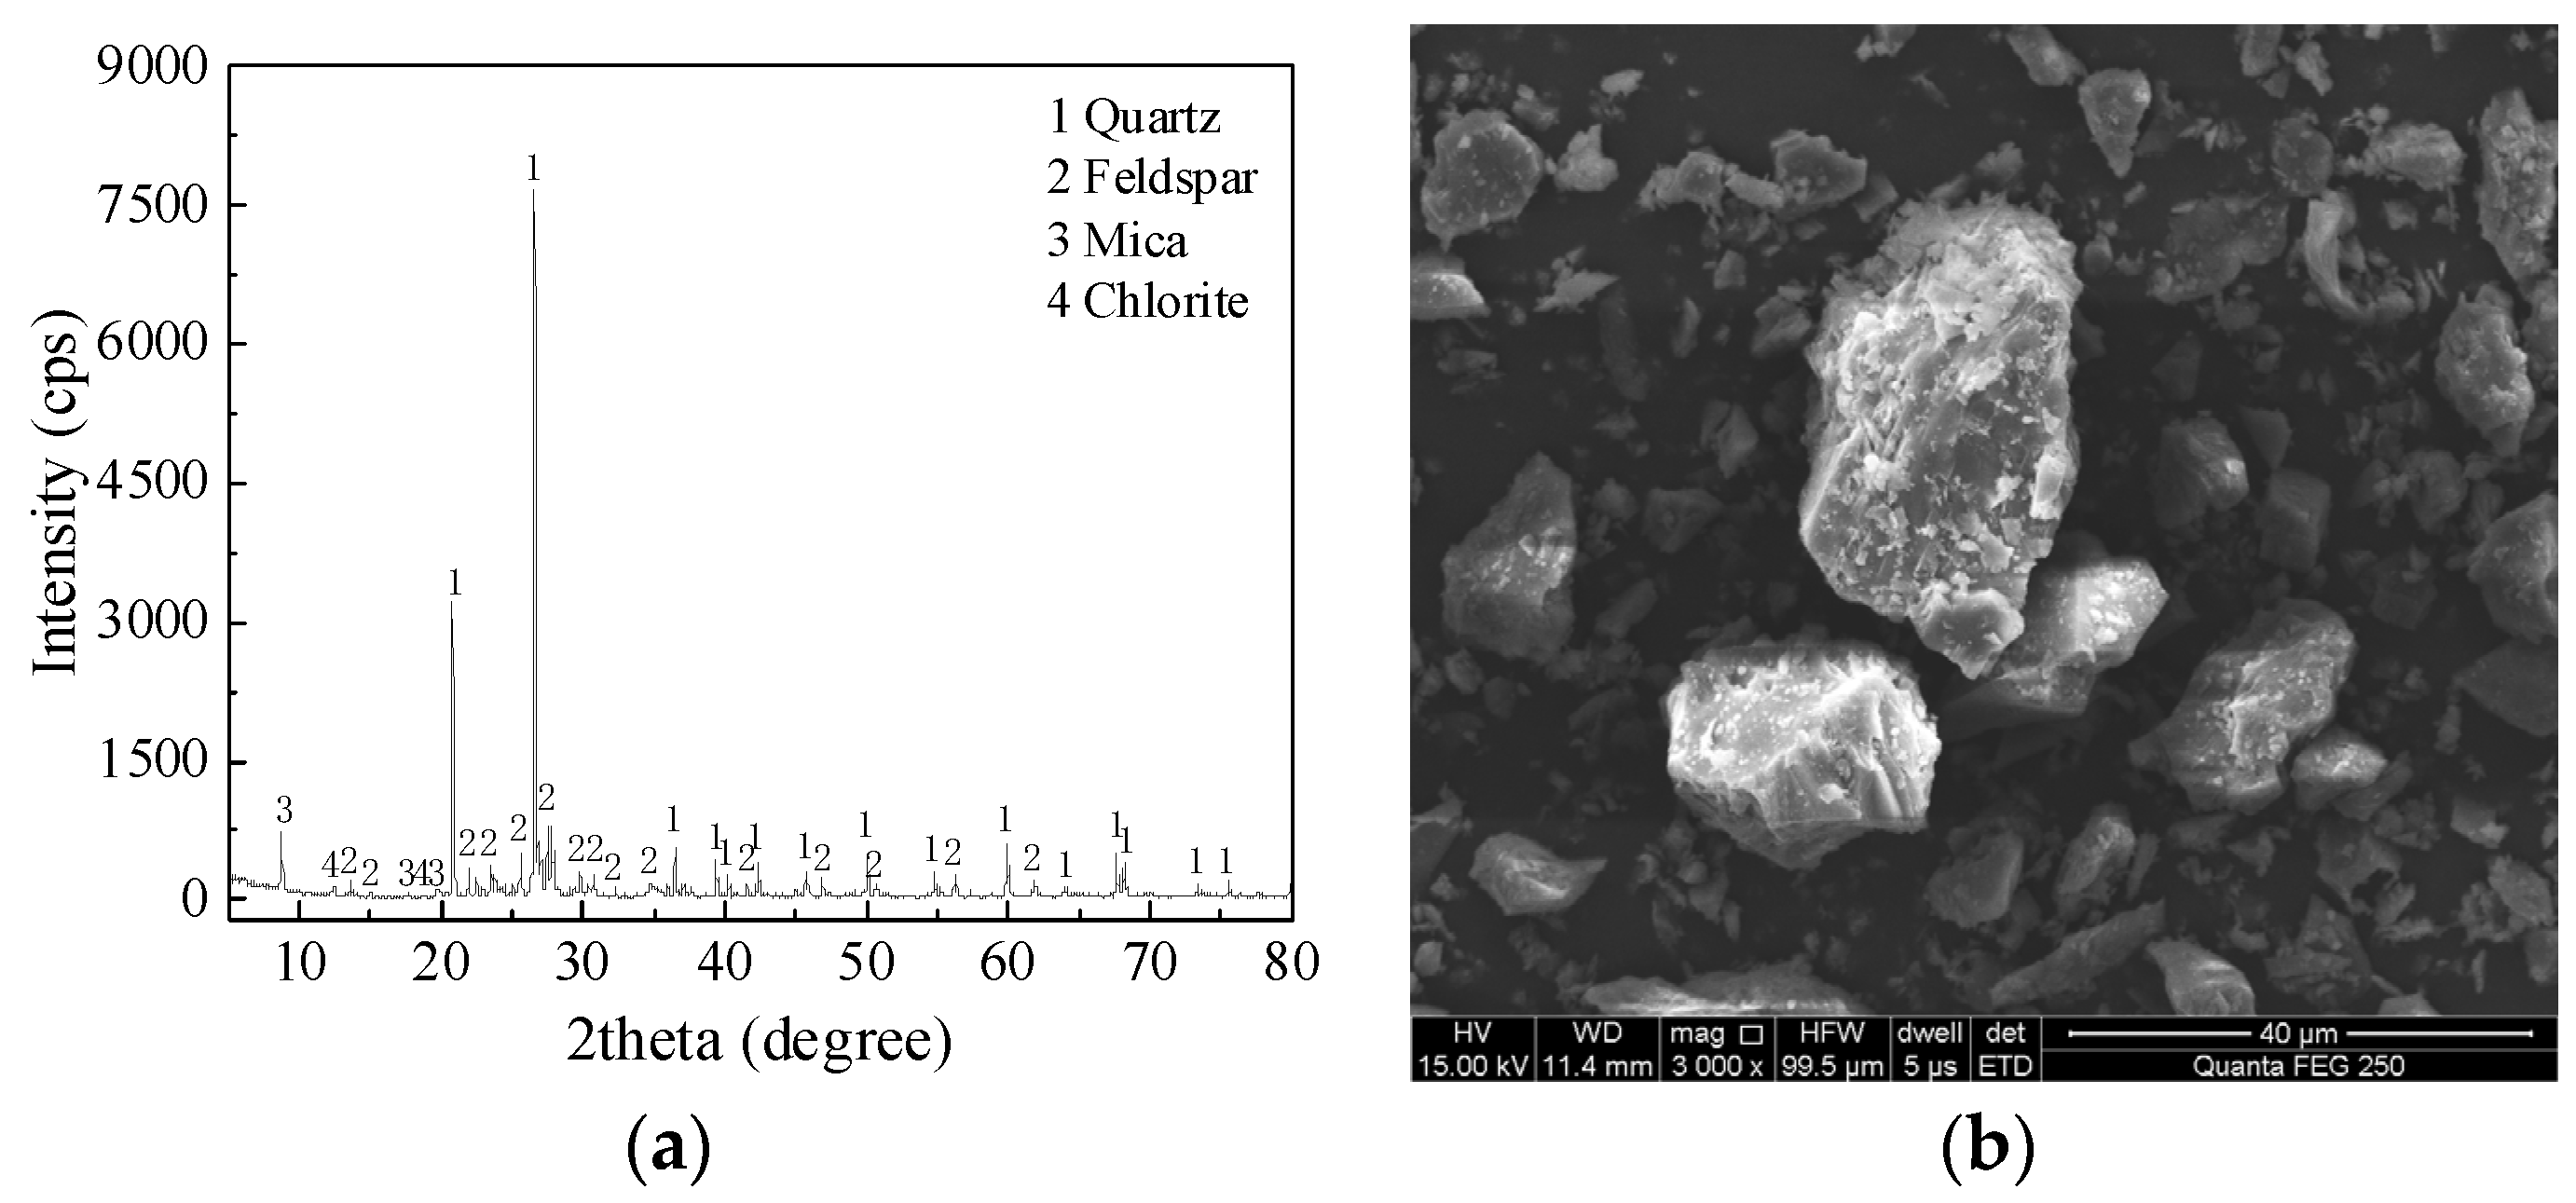
Figure 3a. The main mineralogical compositions of MTs are quartz, feldspar, mica and chlorite. The SEM pattern of MTs is shown in
Figure 3b, the MTs particles with irregular shapes and rough surfaces.
3.2. Mixture Proportions and Testing Methods
The mixture proportions of the CCMs pastes are summarized in
Table 3. The MTs substitution rates were 0%, 5%, 15%, 25%, and 35%, the FA and SL replacement rates were both 15%, and the water-to-binder (w/b) ratio of 0.4 was used in this study. An eight-channel TAM Air isothermal calorimeter (as shown in
Figure 4) was used to determine the exothermic characteristics of CCMs pastes. In the preparation of pastes, each CCMs sample was 50 g, and it had the same mixing period (dry stirring for 60 s, slow and fast stirring for 60 s after adding water). The test temperature is set at 20 ◦C, and the test time is 120 h.
4. Results and Discussion
4.1. Effect of Hydration Heat
4.1.1. MTs Content
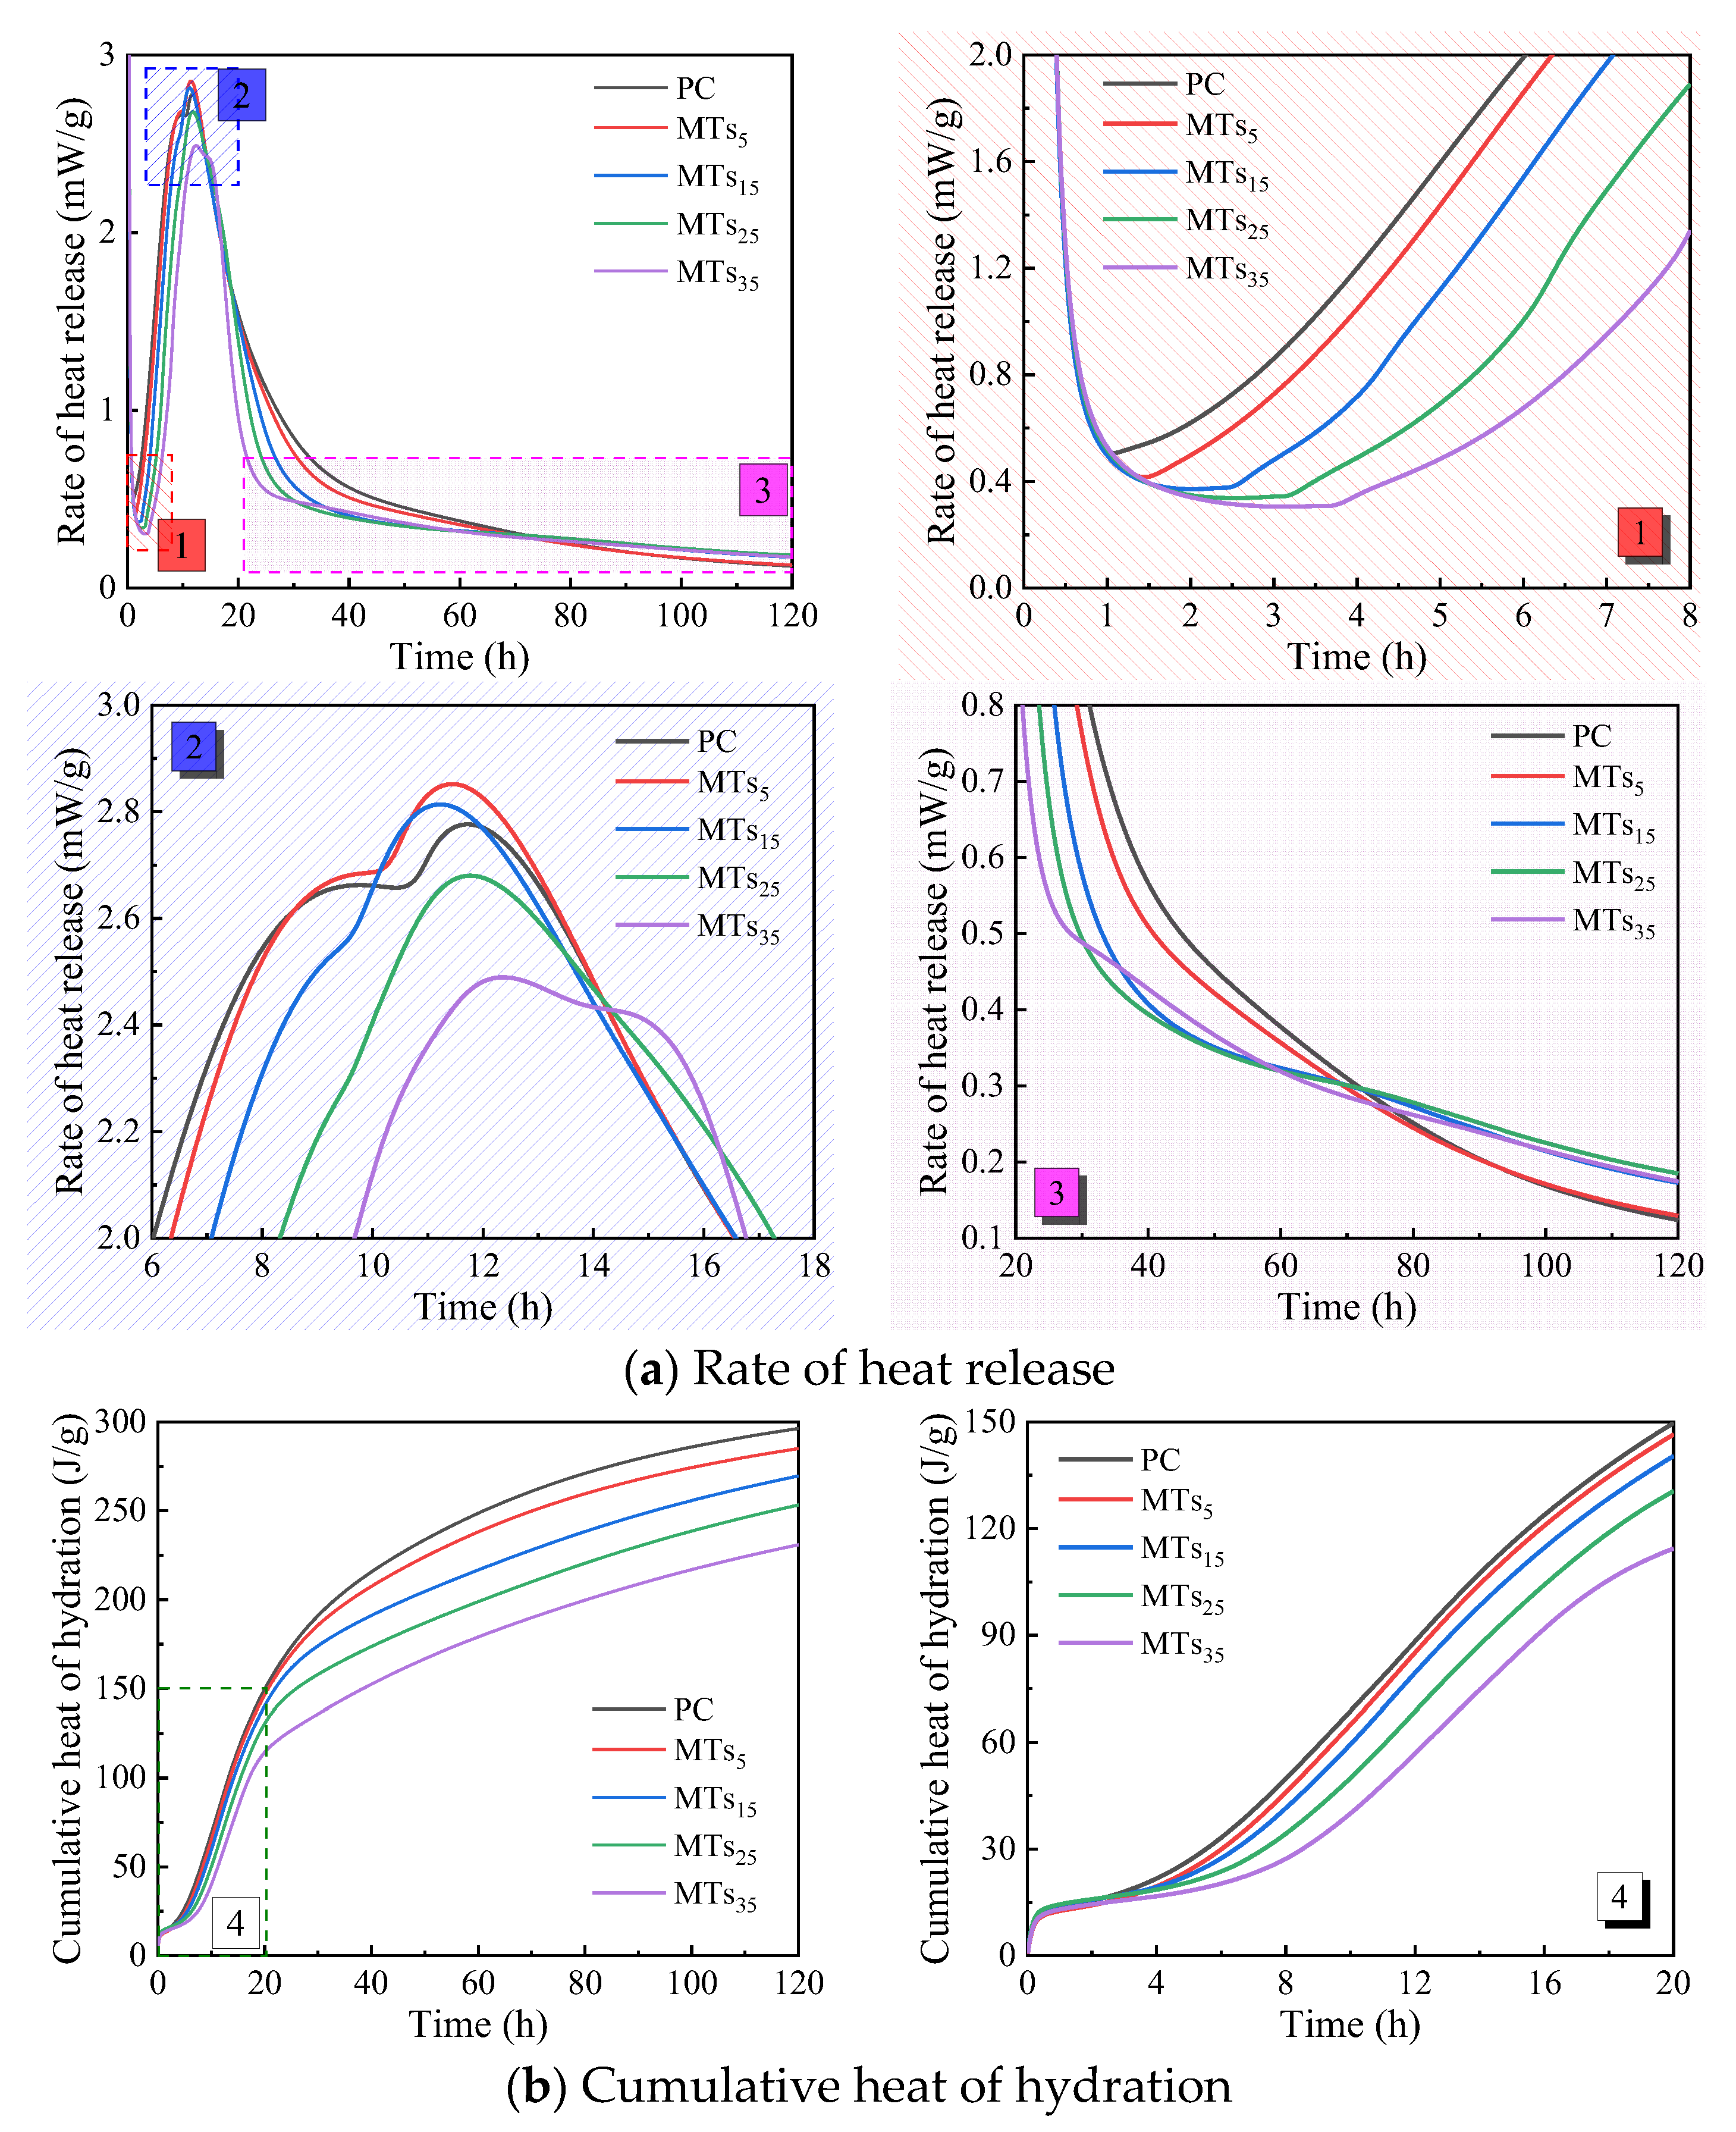
The hydration heat of CCMs with different MTs content is shown in
Figure 4. As presented in
Figure 4a, the end time of the induction period of CCMs delays and the rate of heat release decreases with MTs increasing. When the content of MTs is not more than 15%, the second exothermic peak of the CCMs is advanced and its peak heat release enhanced. When the content of MTs exceeds 15%, the second exothermic peak of CCMs is delayed and its peak heat release decreases. And the addition of MTs influences the peak pattern of the second exothermic peak of CCMs. The PC undergoes a relatively gentle exothermic phase before reaching the second peak of exothermic reaction. However, as the MTs increases, the gentle section before the peak of the second exothermic peak of CCMs gradually shortens until it disappears. Furthermore, the pozzolanic activity of MTs is activated in the later stage of hydration, and its pozzolanic effect results in higher heat release rate for MTs
5, MTs
15, MTs
25, and MTs
35 compared to PC.
As shown in
Figure 4b, the cumulative heat release of CCMs gradually decreases with increasing MTs content. When the hydration time is not more than 20 hours, there are minimal differences in the cumulative heat release curves of MTs
5, MTs
15, and PC. However, the difference between the cumulative heat release curves of MTs
5 and MTs
15 and that of PC gradually increases as the hydration time extends.
The incorporation of MTs influences the heat release rate and cumulative heat release of CCMs due to its crystallization nucleation and pozzolanic effect. The crystallization nucleation and pozzolanic effect of MTs occur in the hydration acceleration period and the hydration stable period of CCMs, respectively [
28,
29,
38,
39,
40]. Meanwhile, the incorporation of MTs reduces the proportion of cement clinker in CCMs and influences the effective water-to-cement (w/c) ratio of CCMs. Therefore, when the content of MTs is small, the effective w/c ratio of CCMs increases. Moreover, cement particles wrap around MTs particles, and the surface of MTs acts as a crystallization nucleation site. This provides more nucleation points, increases the formation rate of hydration products such as C-S-H gel, and enhances the rate of hydration heat release. However, when the MTs content is higher, the proportion of cement clinker in CCMs significantly decreases, and the promotion effect of crystallization nucleation of MTs is not significant. Therefore, the hydration heat release rate is reduced. Furthermore, in the later stage of hydration, the formation of Ca(OH)
2 increases the pH value, which stimulates the pozzolanic activity of MTs. This promotes the secondary hydration reaction of CCMs, resulting in the generation of hydration products such as C-S-H gel and a slight increase in the rate of hydration heat release.
Table 4 presents the influence of MTs content on the acceleration period of CCMs. The incorporation of MTs delays the end time of induction period
t0 of CCMs. Furthermore, as the amount of MTs increased,
t0 was progressively delayed. When the content of MTs increased from 0% to 35%,
t0 was delayed from 1.07 h to 3.72 h. Compared with PC, MTs
5 and MTs
15 reach the second exothermic peak with shorter time
t1 and higher exothermic peak
V, while MTs
25 and MTs
35 reach the second exothermic peak with later time
t1 and lower exothermic peak
V. However, the incorporation of MTs shortens the time from the end of the induction period to the second exothermic peak (the acceleration period (
t1-
t0) is shortened).
The incorporation of MTs reduces the proportion of cement clinker and the concentration of Ca
2+ in CCMs, therefore, prolonging the nucleation time of Ca(OH)
2 and delaying the end time of the induction period [
28]. When the MTs content is small, the dilution effect of MTs and the surface of MTs act as crystallization nucleation sites in CCMs, thus promoting the hydration of CCMs and increasing their hydration heat release rate. When the MTs content is larger, the proportion of cement clinker in CCMs is significantly reduced, and MTs has a lower promote effect on cement hydration, which reduces the hydration heat release rate of CCMs.
Table 5 indicates the relative percentage of hydration heat of CCMs. The relative percentage of hydration heat is the ratio of the hydration heat of CCMs with the mixture to the hydration heat of the reference sample [
15]. It can be seen from
Table 5 that the incorporation of MTs reduces the relative percentage of hydration heat of CCMs. With the extension of hydration time, the relative percentage of hydration heat of CCMs gradually stabilized, which is greater than the mass fraction of cement in CCMs. MTs has a certain potential activity. However, in the early stage of hydration, the filler effect and nucleation role of MTs are mainly played [
38,
41,
42,
43]. In the later stage of hydration, the pozzolanic activity of MTs is stimulated, resulting in a pozzolanic exothermic effect, so that the percentage of hydration heat is greater than the mass fraction of cement in CCMs.
4.1.2. Mineral Admixture Types
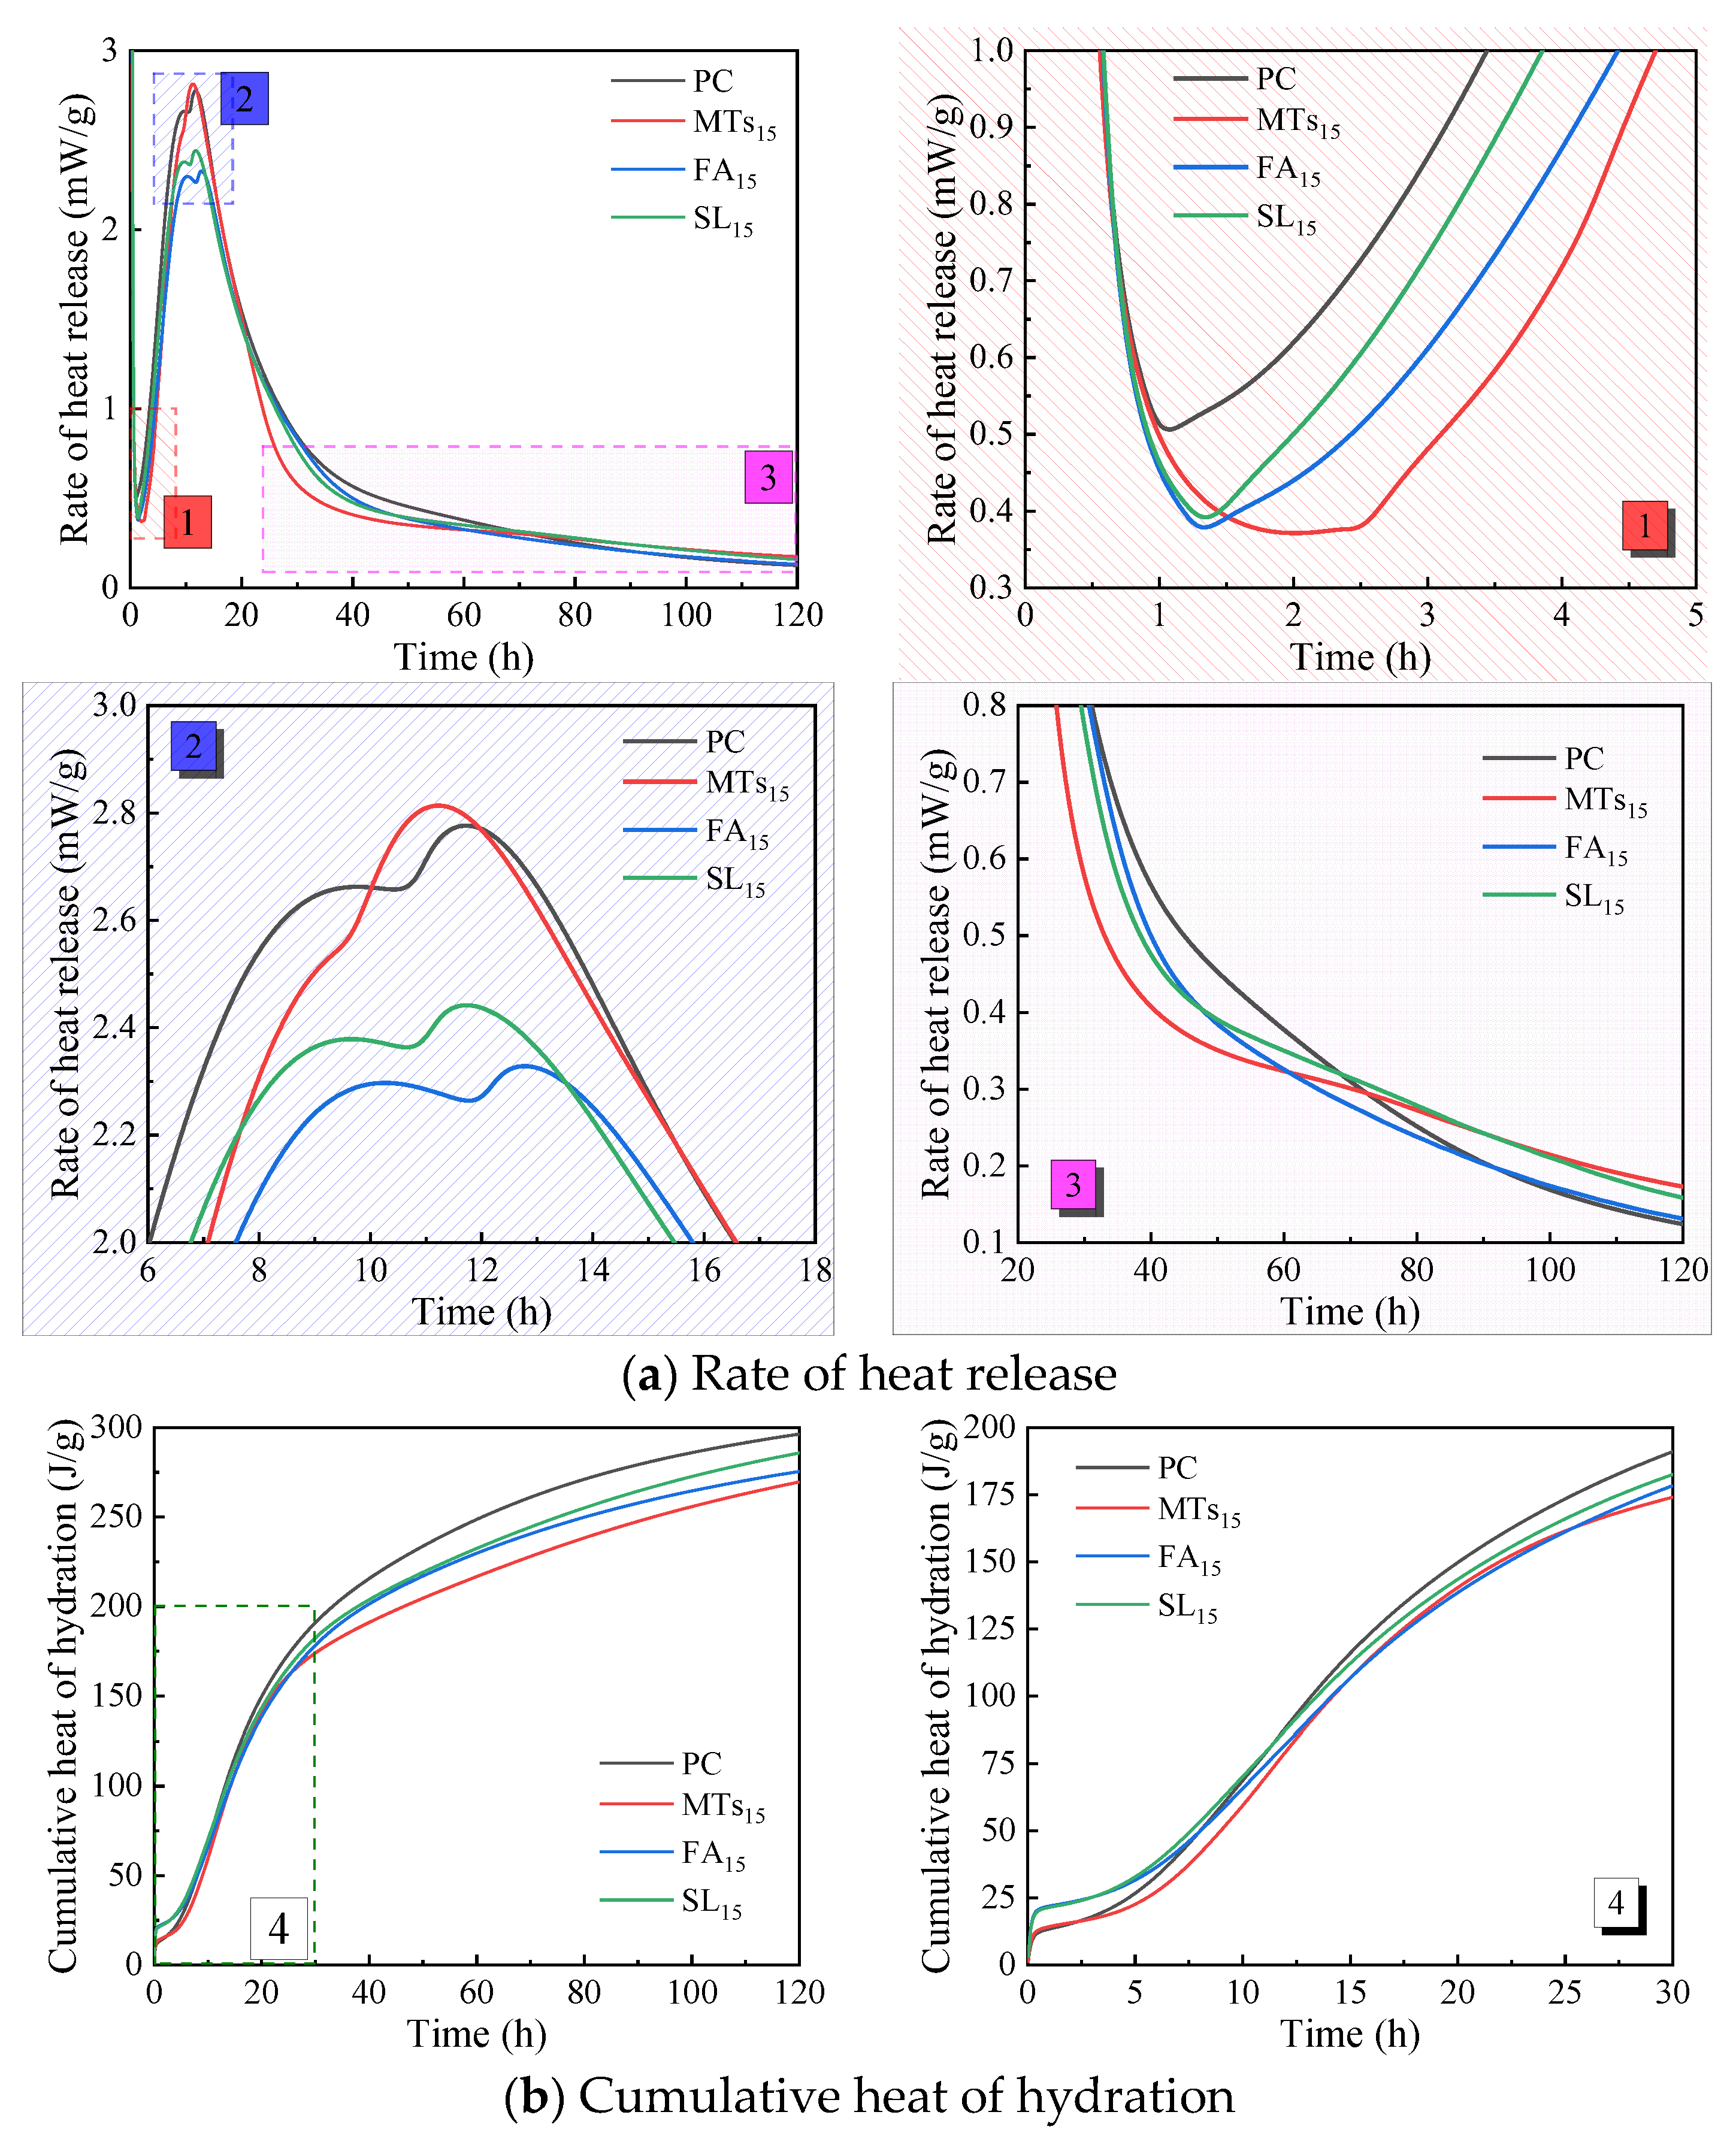
Figure 5 shows the influence of MTs, FA, and SL with the same replacement ratio of 15% on the hydration heat of CCMs. According to
Figure 5a, the incorporation of MTs, FA, and SL all delays the end time of the induction period of the cementitious system, among which MTs has a significant influence on the end time of the induction period of CCMs, and the end time of the induction period of CCMs mixed with FA and SL is similar. The incorporation of MTs, FA, and SL all reduces the heat release rate at the end of the induction period of CCMs, and the reduction range is similar, which decreases from 0.5 mW/g to about 0.35 mW/g. And the incorporation of MTs, FA, and SL influences the peak value and peak pattern of the second exothermic peak of CCMs. The second exothermic peak of CCMs with MTs is advanced and its peak heat release increases, the second exothermic peak of CCMs with FA is delayed and its peak heat release decreases, and that of CCMs with SL is reduced. It shows that compared with FA and SL, the same replacement ratio of MTs resulted in faster hydration products in CCMs during the acceleration period [as shown in
Figure 5a-2]. After 60 h of hydration of CCMs [as shown in
Figure 5a-3], the hydration heat release rate of MTs
15 and SL
15 gradually exceeds that of PC and FA
15.
According to
Figure 5b, when the hydration time is not more than 30 h, the cumulative heat release curves of the PC, MTs
15, FA
15, and SL
15 are similar. When the hydration time is 120 h, the order of cumulative heat release is PC>SL
15>FA
15>MTs
15.
From the hydration heat curve, it can be seen that MTs, FA, and SL play a similar role in CCMs. In the hydration acceleration period, they mainly play the role of crystallization nucleation. In the hydration stable period, the pozzolanic effect of them mainly occurs to promote the secondary hydration of CCMs. Studies have shown [
38,
44] that the specific surface area and surface properties of the admixture will influence the nucleation role, and the nucleation role of the SL in the hydration acceleration period is stronger than that of FA. It can be seen from
Table 1 that the specific surface areas and surface properties of MTs, FA, and SL are different, so their effects on the hydration heat release of cement are also different. Meantime, the difference of MTs, FA, and SL of the potential activity, resulted in different activities excited in the later stage of hydration. Therefore, the hydration heat release rate and cumulative heat release of CCMs are different with different intensities of the pozzolanic effect.
The influence of admixture types on the acceleration period of CCMs is shown in
Table 6. The incorporation of MTs, FA, and SL all delays the end time of the induction period of the cementitious system, and the incorporation of MTs has the greatest influence on the end time of the induction period of the system. The second exothermic peak of CCMs with MTs is advanced and its peak heat release increases; the second exothermic peak of CCMs with FA or SL is delayed and its peak heat release decreases. The incorporation of FA prolongs the acceleration period of CCMs, and the incorporation of MTs and SL shortens the acceleration period of CCMs. The acceleration period of MTs
15 is the shortest, indicating that the incorporation of MTs accelerates the hydration rate of CCMs and shortens the hydration time of CCMs.
Table 7 shows the relative percentage of hydration heat of CCMs with MTs, FA, and SL, respectively. The relative percentage of hydration heat of MTs
15 is 94% and 82% at 3 h and 6 h, which is lower than 100%. The relative percentage of hydration heat of FA
15 is 139% and 109% at 3 h and 6 h, and the relative percentage of hydration heat of SL
15 is 139% and 115% at 3 h and 6 h, which are higher than 100%. With the extension of hydration time, the relative percentage of hydration heat of MTs
15, FA
15, and SL
15 gradually approaches 91%, 93%, and 96%, respectively, which are all greater than the mass fraction of cement in CCMs. It shows that the pozzolanic activity of MTs, FA and SL is activated in the stable hydration period, which leads to the relative percentage of hydration heat greater than the mass fraction of cement in CCMs.
4.1.3. Total Heat Release
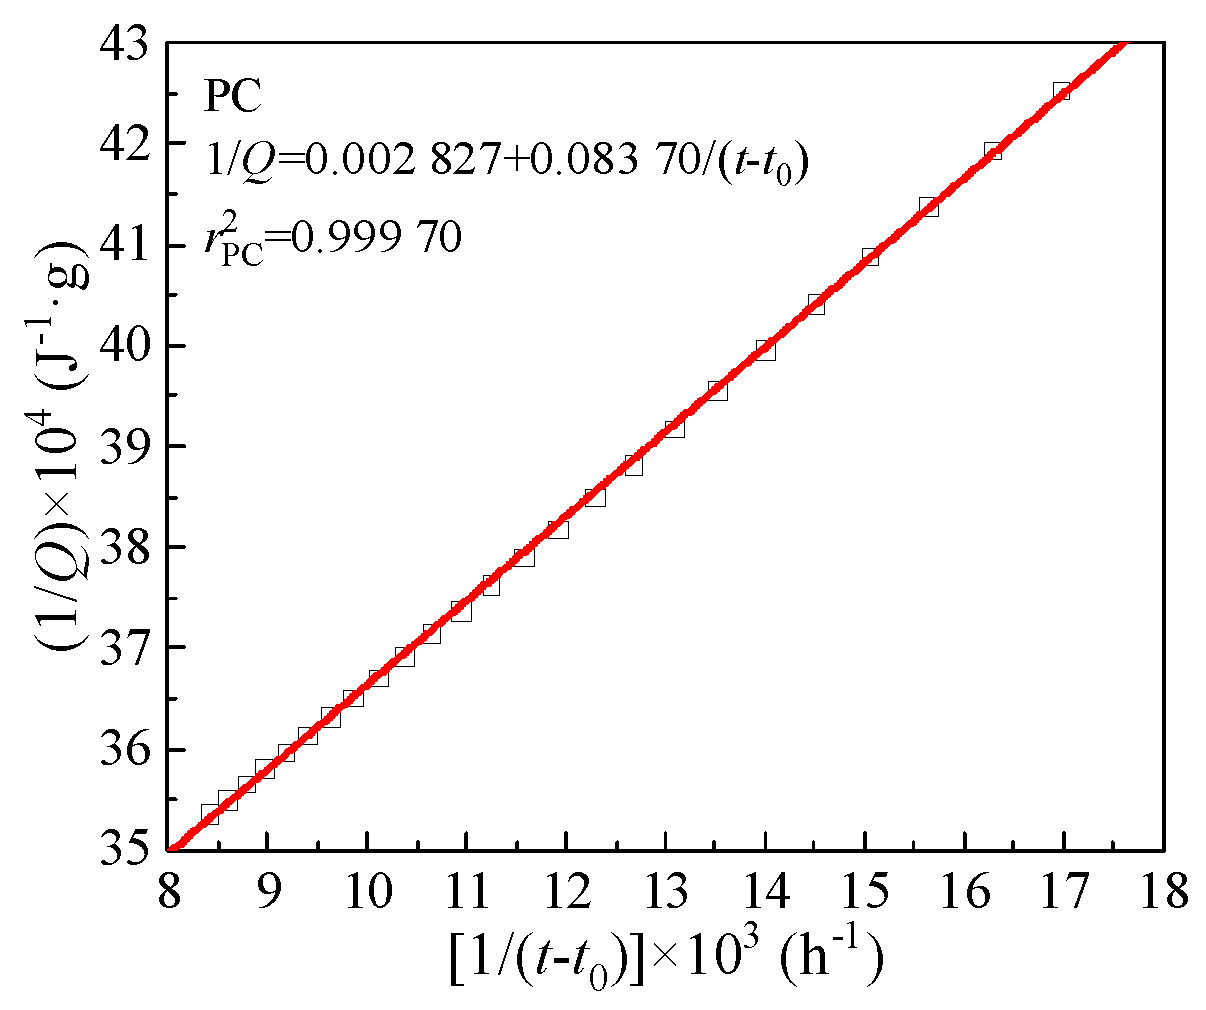
The hydration heat only measured the cumulative heat release of CCMs for 120 h. The total heat release
Qmax of CCMs was derived according to hydration heat data and the Knudsen formula [Equation (9)]. Herein, PC was used as an example to derive the total heat release
Qmax and the time
t50 to reach 50% of
Qmax. The fitting curve in
Figure 6 was linearly fitted according to the hydration heat data. The calculation process of other groups was similar to that of PC. The Knudsen formula,
Qmax and
t50 are shown in
Table 8. It can be seen from
Table 8 that with the increase of MTs content, the
Qmax of CCMs gradually decreases, and the time
t50 gradually prolongs, which is the same as the conclusion of the hydration heat test.
The
Qmax can reflect the hydration trend and degree of CCMs to a certain extent. The higher the
Qmax value, the higher the hydration degree of CCMs. According to
Table 8, the
Qmax of SL
15 is the largest, followed by MTs
15, which is different from the 120 h cumulative heat release obtained by the hydration heat test. The activation effect of MTs may be stronger than that of FA in the later stage, thus leading to its accumulated heat release gradually exceeding that of FA. Compared with FA
15 and SL
15, the
Qmax of MTs
15 is increased by 4.95% and -3.83%, respectively. This shows that the hydration degree of SL is higher, followed by MTs.
4.2. Hydration Kinetic Analysis
The
Qmax of CCMs has been calculated according to the Knudsen formula. And the hydration degree (
α) and hydration rate (
dα/
dt) required by the Krstulovic-Dabic model can be obtained according to formulas (7) and (8). Taking PC as an example, the kinetic parameters
K1′ and
n of stage NG can be derived by the formula (1) and linearly fitting the curve of ln[-ln(1-
α)] vs. ln(
t-
t0), as shown in
Figure 7a. The
K2′ of stage I and
K3′ of stage D can also be derived using the formulas (2) and (3) for linear fitting, respectively, as shown in
Figure 7b,c. Substituting the parameters
n,
K1′,
K2′ and
K3′ into formulas (4) - (6), the hydration reaction rate curves of NG, I, and D can be obtained. The hydration reaction rate curves and hydration kinetic parameters of other groups were similar to those of PC.
4.2.1. Hydration Process Simulation of CCMs
Based on the Krstulovic-Dabic model, the hydration process is divided into three stages: nucleation and crystal growth (NG), interactions at phase boundaries (I), and diffusion (D). These three stages may take place simultaneously, but the whole development of the hydration process depends on the slowest reaction stage [
33,
45]. In the early stage of hydration, the CCMs have more water and fewer hydration products, and the ion migration resistance and rate are smaller and faster, respectively, thus the hydration becomes controlled by NG. As the extension of hydration time, the hydration products in the CCMs increase and the structure becomes dense. Therefore, ion migration resistance is increased and migration rate decreases, and the hydration process is controlled by the I stage and then by the D stage [
17].
The relationship between hydration degree
α and hydration reaction rate
dα/
dt of CCMs are shown in
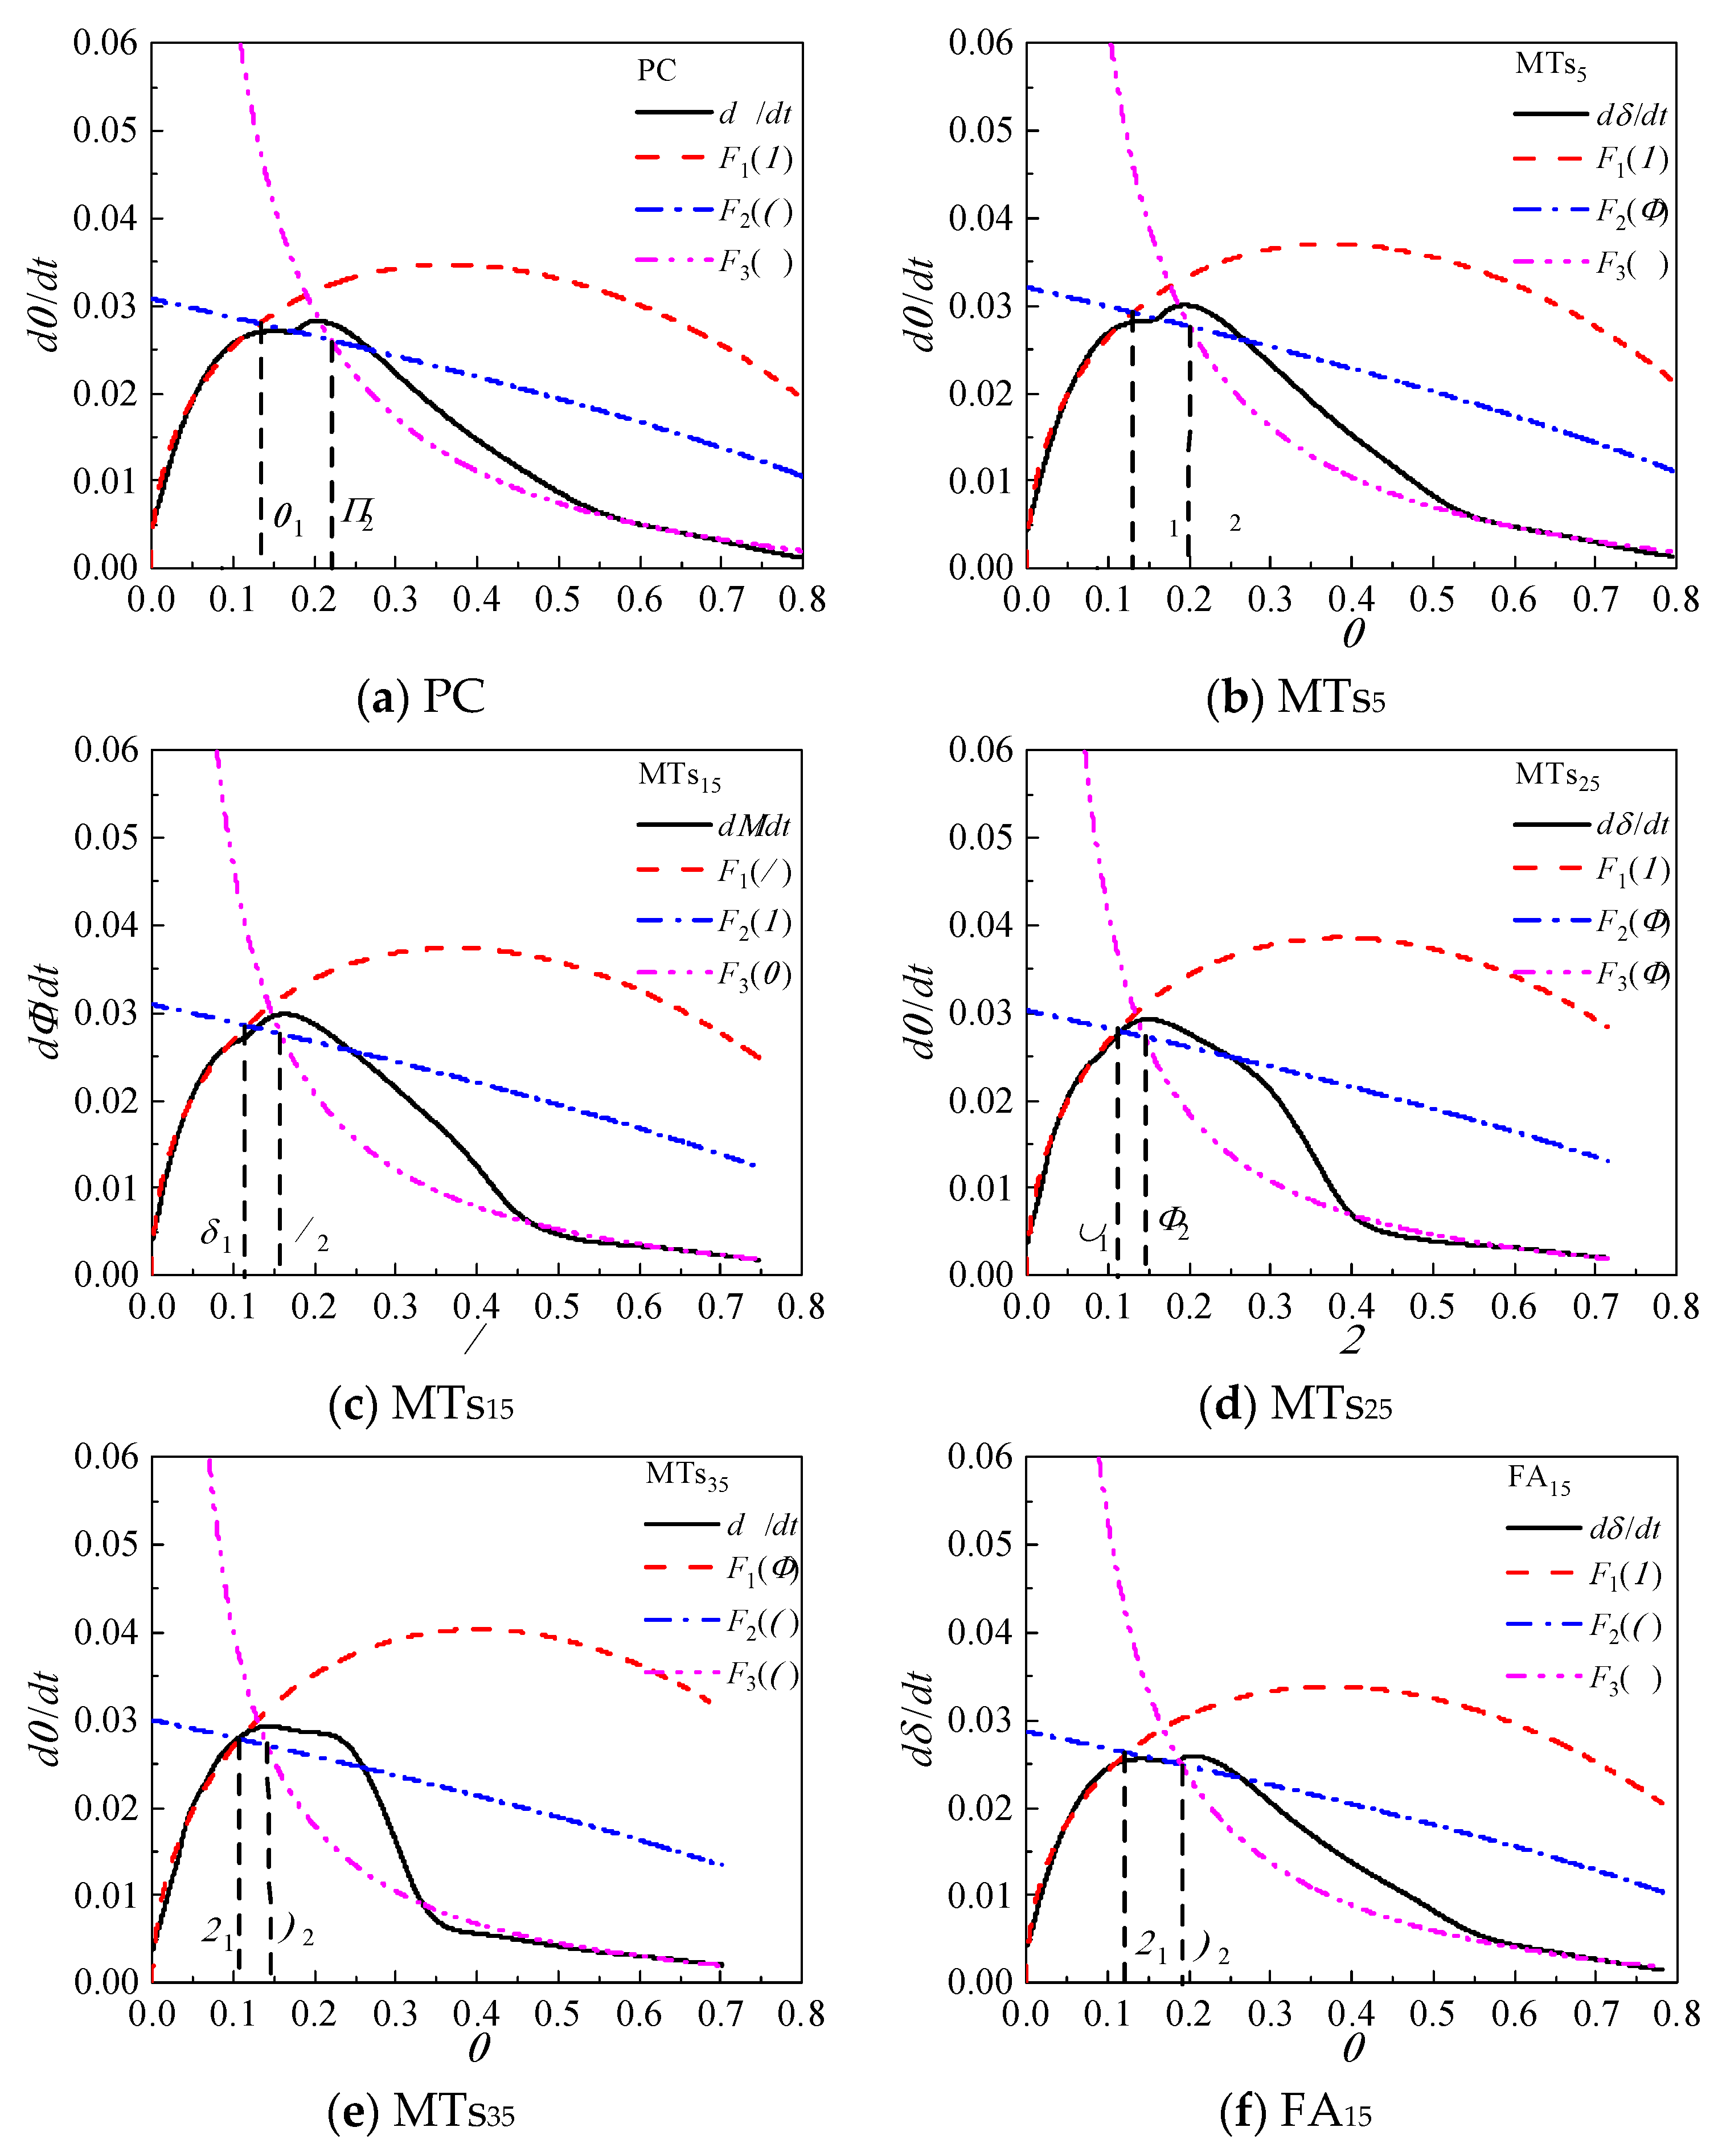
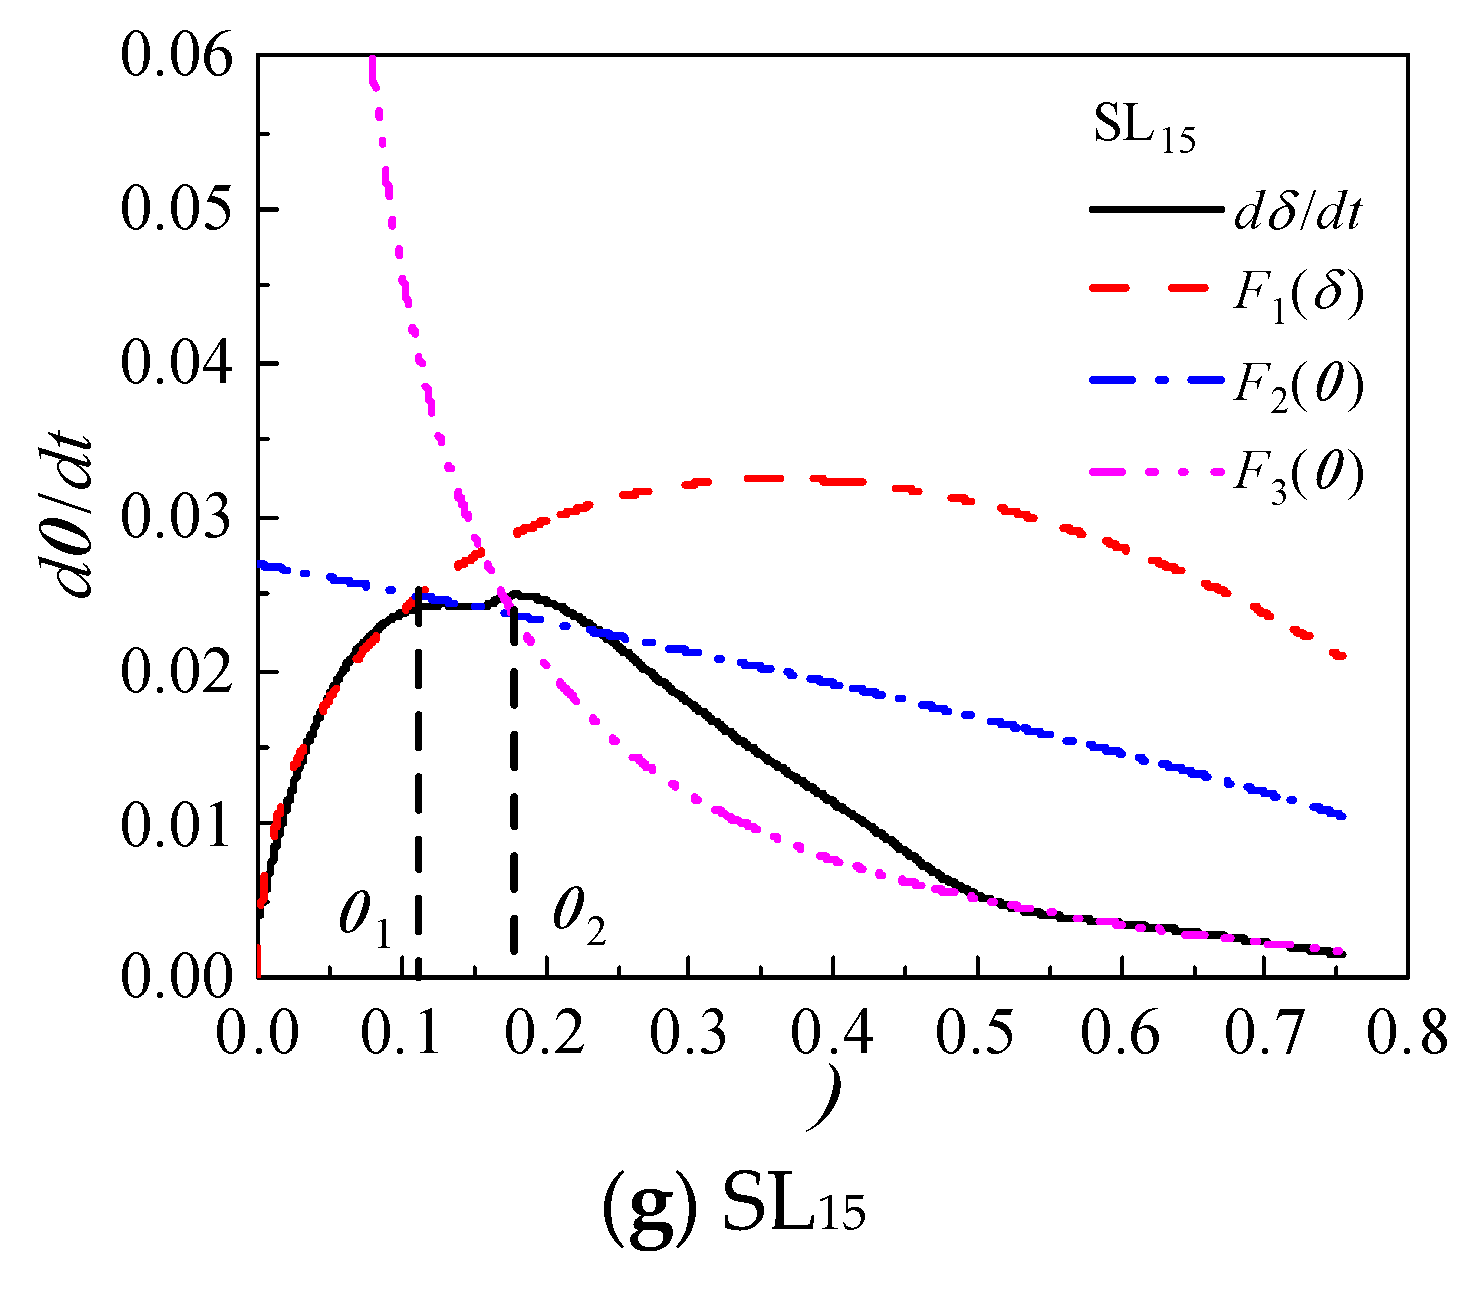
Figure 8. The curves of
F1(
α) and
F2(
α) intersect with
F3(
α) at
α1 and
α2, where
α1 is the transition point from NG process to I process and
α2 is the transition point from I process to D process. This shows that the incorporation of MTs, FA, and SL does not influence the hydration process of CCMs, and the hydration process all undergoes three stages: NG-I-D. The Krstulovic-Dabic model can better simulate the hydration processes NG, I, and D of CCMs, respectively.
According to
Figure 8, when the MTs content is not more than 35%, the simulation effect of NG, I and late D stages of the hydration reaction with the hydration rate curve obtained from the hydration heat test is well. When the MTs content is 35%, the simulation effect of NG and late D stages are better, while the simulation effect of the I stage has a large deviation from the reaction rate measured by the experiment. This is because the degree of influence of MTs on the total hydration reaction of CCMs increases with the MTs content, and the deviation of the simulation gradually increases with the MTs content. When the content of MTs, FA, and SL is 15%, the Krstulovic-Dabic model has a better simulation effect on FA, SL, and MTs. However, the simulation effect of the pre-D stage deviates from the actual data due to the weak pozzolanic effect produced by admixture in the late hydration.
4.2.2. Hydration Kinetic Parameters of CCMs
The hydration kinetic parameters of CCMs are presented in
Table 9. The reaction order
n reflects the crystallization nucleation and crystal production of the hydration products of the CCMs [
46]. The greater the n value, the greater the reaction resistance of CCMs [
16,
47]. The
n of the CCMs gradually increases with increasing MTs content. This shows that the introduction of MTs has reached the reaction resistance in the crystallization process of hydration products in CCMs, and the influence of MTs content of 35% is the most obvious [
27,
29]. When the content of MTs, FA and SL is 15%, the order of
n of the CCMs is FA
15 > MTs
15 > SL
15, indicating that MTs, FA, and SL have different influences on the nucleation effect, and the influence of FA is more than MTs and SL on the crystallization process of the hydration products of CCMs.
The reaction rate constant K1′ of the NG process gradually increases with increasing MTs content. This is because the incorporation of MTs increases the effective w/c ratio of CCMs, and MTs can be used as a nucleation site to increase the hydration reaction rate. The reaction rate constant K2′ of the I process increases first and then decreases with the increase of MTs content. When the MTs content is small, the addition of MTs disperses the not-hydrated cement particles in the paste, causing the contact area between cement and water to increase, and the degree of hydration also increases, thereby improving the reaction rate. When the MTs content is high, the cement content decreases and the concentration of Ca2+ in CCMs decreases, which delays the time for Ca(OH)2 crystals to reach saturation, resulting in the hydration reaction rate decreasing. The reaction rate constant K3′ of the D process gradually decreases with the increase of the MTs content. This is because the hydration products in the paste increase in the later stage of hydration. Furthermore, the filling effect of MTs fills the pores and the pozzolanic effect of MTs promotes the generation of hydration products, making the structure denser, resulting in greater ion migration resistance, and the hydration reaction rate reduces. When the content of MTs, FA and SL is 15%, the K1′ and K2′ parameters of MTs15 are greater than those of FA15 and SL15. This indicates that the reaction rate of crystallization nucleation and phase boundary reaction of hydration products of paste with MTs is higher than that of FA and SL, and the hydration heat release rate of the CCMs in the acceleration period is larger. The K3′ of MTs15 is smaller than that of FA and larger than that of SL, indicating that the reaction rate of MTs in the diffusion process is lower than that of FA but higher than that of SL.
The hydration degree α1 gradually decreases with the increasing MTs content, indicating that MTs shortens the NG process of CCMs, and the higher the amount of MTs, the more obvious the shortening. This is because the incorporation of MTs accelerates the hydration rate and shortens the time for crystal nucleation and crystal growth, resulting in a shortened NG process. The α2-α1 gradually decreases as the MTs content increases, indicating that the MTs shortens the I process of CCMs. When the content of MTs, FA and SL is 15%, the α1 of MTs15 is less than that of FA15 and greater than that of SL15. The difference of α1 indicates that mineral admixtures have different influences on the NG process, and the influence effect of SL is greatest. The α2 and α2-α1 parameters of MTs15 are smaller than those of FA15 and SL15, indicating that the incorporation of admixtures all shortens the I process, and the influence effect of MTs on the I process is greatest.
5. Conclusions
- (1)
The incorporation of MTs prolongs the end time of the induction period (t0 increases) and shortens the acceleration period of CCMs (t1-t0 shortens). When the content of MTs is not more than 15%, the second exothermic peak of CCMs appears earlier and the peak heat release value increases. When the content of MTs exceeds 15%, the second exothermic peak of CCMs appears later and the peak heat release value decreases. The cumulative heat release of CCMs gradually decreases with increasing MTs content, but the relative percentage of hydration heat is greater than the mass fraction of cement in the paste.
- (2)
When the content of MTs, FA, and SL is 15%, compared with FA and SL, the influence of MTs on the extension of the end time of the induction period of CCMs is most significant, and the second exothermic peak of CCMs with MTs is advanced and its peak heat release increases. When the hydration time is 120 h, the cumulative heat release of FA and SL is greater than that of MTs. Based on the final cumulative heat release calculated by the Knudsen formula, the final cumulative heat release of MTs exceeds that of FA. Compared with FA15 and SL15, the Qmax of MTs15 is increased by 4.95% and -3.83%, respectively;
- (3)
The hydration process of CCMs undergoes three stages: nucleation and crystal growth (NG) - interactions at phase boundaries (I) - diffusion (D), and the relationship curve between hydration degree and hydration reaction rate calculated based on the Krstulovic-Dabic model can better simulate the hydration reaction rate curve measured by hydration heat test. With the increase of MTs content, the reaction order n and K1′ of CCMs increase, K2′ increases first and then decreases, and K3′, α1, and α2 decrease. The incorporation of MTs shortens the NG and I process of CCMs.
Author Contributions
Data curation, formal analysis, writing - original draft preparation, writing - review & editing, Q.C.; resources, supervision, writing—review and editing, W.M.; investigation, methodology, conceptualization, K.M. All authors have read and agreed to the published version of the manuscript.
Funding
This research was funded by Graduate School-enterprise Joint Innovation Project of Central South University (No.: 506022129), China Railway Resources Science and Technology Program Project (No.: LM (2022)-F-53).
Institutional Review Board Statement
Not applicable.
Data Availability Statement
The data presented in this study are available on request from the corresponding author.
Conflicts of Interest
The authors declare no conflict of interest.
References
- L. Yu. Overview of the latest research progress on comprehensive utilization of molybdenum tailings resources. Metallurgy and materials 2021, 41, 21–22. (In Chinese)
- B.L. Hu, K.S. Wang, P. Hu, et al. Research Progress of Molybdenum Tailings Resources Recycling and Utilization. Materials Review 2015, 29, 123–127. (In Chinese)
- H.Q. Wu, C. Liu, Y.F. Chen. Research Progress of and Comprehensive Utilized on Molybdenum Tailings Resources in China. Metal Mine.
- F. Li, X.W. Cui, X. Liu, et al.Research Progress in Secondary Utilization of Molybdenum Tailings in Building Materials. Multipurpose Utilization of Mineral Resources.
- T.Luo, Y. Yi, Q. Sun, et al. The effects of adding molybdenum tailings as cementitious paste replacement on the fluidity, mechanical properties and micro-structure of concrete. Journal of Building Engineering 2022, 62, 105377. [CrossRef]
- X.Y. Quan, S.L. Wang, J.T. Li, et al. Utilization of molybdenum tailings as fine aggregate in recycled aggregate concrete. Journal of Cleaner Production 2022, 372, 133649. [CrossRef]
- G.S. Hu, C. Zhang, C.Y. Qian, et al. Recent Research Progress of Comprehensive Utilization of Molybdenum Tailings Resources. Materials Review 2019, 33, 233–238. (In Chinese)
- F.H. Han, A. Luo, J.H. Liu, et al. Properties of high-volume iron tailing powder concrete under different curing conditions. Construction and Building Materials 2020, 241, 118108. [CrossRef]
- Y.H. Cheng, F. Huang, S.S. Qi, et al. Effects of High-Silicon Iron Tailings on Carbonation and Sulphate Corrosion Resistance of Concrete. Journal of Northeastern University(Natural Science) (In Chinese). 2019, 40, 121–125.
- Y.H. Cheng, F. Huang, W.C. Li, et al. Test research on the effects of mechanochemically activated iron tailings on the compressive strength of concrete. Construction and Building Materials 2016, 118, 164–170. [CrossRef]
- B.Y. Geng. Preparation of high performance concrete mixture with lead-zinc ore tailings from Youxi, Fujian province[D]. (In Chinese). University of Science and Technology Beijing: Beijing, China,, 2016.
- W. Xu, Y. Lu, Q. Shi, et al. Research on application of copper tailings admixture in ready-mixed concrete. New Building Materials 2021, 48, 12–15. (In Chinese)
- X.Y. Huang, W. Ni, Z.J. Wang, et al. Experimental study on autoclaved aerated concrete made from copper tailings without using lime as calcareous materials. Materials Science and Technology 2012, 20, 11–15. (In Chinese)
- X.J. Qiu, W. Ni. Preparation of High Strength Concrete Using Fujian Lead-zinc Tailings and Slag Powder. Metal Mine 2015, 176–180. (In Chinese)
- J.L. Zhu, J.W. Song, L. Wang, et al. Hydration Heat and Kinetics of Copper Slag Powder-Cement Composite Cementitious System. Journal of Building Materials 2020, 23, 1282–1288. (In Chinese)
- Y.H. Cheng, X.H. Sun, J.Y. Zhang. Hydration kinetics of cement–iron tailing powder composite cementitious materials and pore structure of hardened paste. Construction and Building Materials 2023, 370, 130673. [CrossRef]
- L.F. Zhou, M.F. Gou, X.M. Guan. Hydration kinetics of cement-calcined activated bauxite tailings composite binder. Construction and Building Materials 2021, 301, 124296. [CrossRef]
- S. Gao, X.W. Cui, S.B. Kang, et al. Sustainable applications for utilizing molybdenum tailings in concrete. Journal of Cleaner Production 2020, 266, 122020. [CrossRef]
- M. Sun, Y. Fu, W.X. Wang, et al. Experimental Research on the Compression Property of Geopolymer Concrete with Molybdenum Tailings as a Building Material. Buildings 2022, 12, 1596. [CrossRef]
- T. Luo, Y. Yi, F. Liu, et al. Early-age hydration and strength formation mechanism of composite concrete using molybdenum tailings. Case Studies in Construction Materials 2022, 16, e1101.
- X.Y. Quan, S.L. Wang, K.N. Liu, et al. Evaluation of molybdenum tailings as replacement for fine aggregate in concrete: Mechanical, corrosion resistance, and pore microstructural characteristics. Construction and Building Materials 2022, 343, 127982. [CrossRef]
- X.Y. Quan, S.L. Wang, K.N. Liu, et al. Influence of molybdenum tailings by-products as fine aggregates on mechanical properties and microstructure of concrete. Journal of Building Engineering 2022, 54, 104677. [CrossRef]
- P.M. Wang, S.X. Feng, X.P. Liu. Research Approaches of Cement Hydration Degree and Their Development. Journal Of Building Materials 2005, 8, 646–652. (In Chinese)
- X.Q. Wu. Study on hydration kinetics of slag cement. Journal of the Chinese Ceramic Society 1988, 423–429. (In Chinese)
- T. Merzouki, M. Bouasker, N.E. Houda Khalifa, et al. Contribution to the modeling of hydration and chemical shrinkage of slag-blended cement at early age. Construction and Building Materials 2013, 44, 368–380. [CrossRef]
- B. Kolani, L. Buffo-Lacarrière, A. Sellier, et al. Hydration of slag-blended cements. Cement and Concrete Composites 2012, 34, 1009–1018. [CrossRef]
- R. Krstulovic, P. Dabic, WCA. A conceptual model of the cement hydration process. Cement and concrete research 2000, 30, 693–698. [CrossRef]
- F.H. Han. Study on hydration characteristics and kinetics of composite binder[D]. (In Chinese). China University of Mining & Technology: Beijing, China, 2015.
- F.H. Han, D.M. Wang, P.Y. Yan. Hydration Kinetics of Composite Binder Containing Different Content of Slag or Fly Ash. Journal of the Chinese Ceramic Society 2014, 42, 613–620. (In Chinese)
- B. Yin, T.H. Kang, J.T. Kang, et al. Investigation of the hydration kinetics and microstructure formation mechanism of fresh fly ash cemented filling materials based on hydration heat and volume resistivity characteristics. Applied Clay Science 2018, 166, 146–158. [CrossRef]
- A. Adamtsevich, A. Pustovgar. Effect of Modifying Admixtures on the Cement System Hydration Kinetics. Applied Mechanics and Materials 2015, 725-726, 487–492. [CrossRef]
- X. Chen, H.Q. Yang, Y. Shi, et al. Hydration Characteristics of Cement-Based Materials with Incorporation of Phosphorus Slag Powder. Journal of Building Materials 2016, 19, 619–624. (In Chinese)
- P.Y. Yan, F. Zheng. Kinetics Model for the Hydration Mechanism of Cementitious Materials. Journal of the Chinese Ceramic Society 2006, 34, 555–559. (In Chinese)
- T. Wang, Y.J. Xue, M. Zhou, et al. Hydration kinetics, freeze-thaw resistance, leaching behavior of blended cement containing co-combustion ash of sewage sludge and rice husk. Construction and Building Materials 2017, 131, 361–370. [CrossRef]
- S.H. Liu, Q.L. Li, X.Y. Zhao. Hydration Kinetics of Composite Cementitious Materials Containing Copper Tailing Powder and Graphene Oxide. Materials 2018, 11, 2499. [CrossRef] [PubMed]
- Z.H. Liu. Study on the mechanism of hydration induction period of Portland cement[D]. (In Chinese). Guangzhou University: Guangzhou, China, 2023.
- T. Knudsen. The dispersion model for hydration of portland cement I. General concepts. Cement and Concrete Research 1984, 14, 622–630. [CrossRef]
- P.Y. Yan, Z.Q. Zhang. Review on Hydration of Composite Cementitious Materials. Journal of the Chinese Ceramic Society 2017, 45, 1066–1072. (In Chinese)
- S.C. Deng, L. Liu, P. Yang, et al. Experimental Study on Early Strength and Hydration Heat of Spodumene Tailings Cemented Backfill Materials. Materials 2022, 15, 8846. [CrossRef]
- J. Chen, Z.H. Shui, T. Sun, et al. Early Hydration Kinetics Research of Calcined Coal Gangue in Cement-Based Materials. Bulletin of the Chinese Ceramic Society 2019, 38, 1983–1990. (In Chinese)
- C.L. Wang, P.F. Ye, K.F. Zhang, et al. Study on Preparation and Hydration Mechanism of Composite Cementitious Materials using Molybdenum Tailings. Metal Mine 2020, 41–47. (In Chinese)
- Y.J. Zhang, S.F. Fu, G.T. Zhang, et al. Study on the Influence of Molybdenum Tailings Powder on the Strength and Microstructure of Cement-based Materials. Metal Mine 2023, 253–259. (In Chinese)
- Z.Z. Quan, X.L. Feng, Y.Y. Chen. Study on the preparation of reactive powder concrete with molybdenum tailings. New Building Materials 2022, 49, 46–49. (In Chinese)
- J.H. He, G.C. Long, K.L. Ma, et al. Influence of fly ash or slag on nucleation and growth of early hydration of cement. Thermochimica Acta 2021, 701, 178964. [CrossRef]
- X.J. Lyu, G. Yao, Z.M. Wang, et al. Hydration kinetics and properties of cement blended with mechanically activated gold mine tailings. Thermochimica Acta 2020, 683, 178457. [CrossRef]
- A. Bezjak. Nuclei growth model in kinetic analysis of cement hydration. Cement and Concrete Research 1986, 16, 605–609. [CrossRef]
- L. Zhou, M. Gou, S. Luo. Hydration kinetics of a calcination activated bauxite tailings-lime-gypsum ternary system. Journal of Building Engineering 2021, 38, 102189. [CrossRef]
Figure 1.
Raw materials. (a) PC, (b) MTs, (c) FA, (d) SL.
Figure 1.
Raw materials. (a) PC, (b) MTs, (c) FA, (d) SL.
Figure 2.
(a) Differential distribution and (b) Cumulative distribution of raw materials.
Figure 2.
(a) Differential distribution and (b) Cumulative distribution of raw materials.
Figure 3.
Figure 3. (a) XRD pattern and (b) SEM pattern of MTs.
Figure 3.
Figure 3. (a) XRD pattern and (b) SEM pattern of MTs.
Figure 4.
Influence of MTs content on hydration heat release of the CCMs. (1~4 is enlargements of corresponding parts).
Figure 4.
Influence of MTs content on hydration heat release of the CCMs. (1~4 is enlargements of corresponding parts).
Figure 5.
Influence of admixture types on hydration heat release of CCMs (1~4 is enlargements of corresponding parts).
Figure 5.
Influence of admixture types on hydration heat release of CCMs (1~4 is enlargements of corresponding parts).
Figure 6.
Determination of total heat release Qmax from linear regression.
Figure 6.
Determination of total heat release Qmax from linear regression.
Figure 7.
Determination of kinetic parameters n, K1′, K2′, K3′ via linear regression.
Figure 7.
Determination of kinetic parameters n, K1′, K2′, K3′ via linear regression.
Figure 8.
Hydration rate curves for CCMs.
Figure 8.
Hydration rate curves for CCMs.
Table 1.
Chemical compositions and physical properties of raw materials.
Table 1.
Chemical compositions and physical properties of raw materials.
| Materials |
Chemical composition (%) |
LOI 1 (%) |
SSA 2 (m2/kg) |
| SiO2
|
Al2O3
|
Fe2O3
|
CaO |
MgO |
SO3
|
K2O |
Na2O |
MgO |
| PC |
20.84 |
4.68 |
3.56 |
63.43 |
3.29 |
2.30 |
— |
0.55 |
— |
1.48 |
358 |
| MTs |
67.75 |
13.84 |
2.71 |
2.75 |
1.14 |
2.24 |
5.45 |
1.77 |
1.14 |
2.01 |
367 |
| FA |
52.70 |
25.80 |
9.70 |
3.70 |
1.20 |
0.20 |
1.16 |
0.79 |
0.88 |
4.20 |
434 |
| SL |
31.96 |
14.33 |
0.49 |
36.42 |
6.65 |
2.50 |
0.56 |
0.43 |
6.65 |
— |
483 |
Table 2.
Main technical indexes of MTs.
Table 2.
Main technical indexes of MTs.
| Materials |
Standard consistency (%) |
f-Cao |
Setting time (min) |
Activity index (%) |
Water demand ratio (%) |
| Initial |
Final |
7 d |
28 d |
| MTs |
32.5 |
Eligible |
386 |
540 |
75 |
69 |
109 |
Table 3.
Mixture proportions.
Table 3.
Mixture proportions.
| Sample |
Mass fraction (%) |
w/b |
| PC |
MTs |
FA |
SL |
Water |
| PC |
100 |
0 |
— |
— |
40 |
0.4 |
| MTs5
|
95 |
5 |
— |
— |
40 |
0.4 |
| MTs15
|
85 |
15 |
— |
— |
40 |
0.4 |
| MTs25
|
75 |
25 |
— |
— |
40 |
0.4 |
| MTs35
|
65 |
35 |
— |
— |
40 |
0.4 |
| FA15
|
85 |
— |
15 |
— |
40 |
0.4 |
| SL15
|
85 |
— |
— |
15 |
40 |
0.4 |
Table 4.
Influence of MTs content on the acceleration period of CCMs.
Table 4.
Influence of MTs content on the acceleration period of CCMs.
| Sample |
t0 (h) |
t1 (h) |
(t1-t0) (h) |
V(mW/g) |
| PC |
1.07 |
11.72 |
10.65 |
2.776 3 |
| MTs5
|
1.45 |
11.45 |
10.00 |
2.851 8 |
| MTs15
|
2.50 |
11.22 |
8.72 |
2.813 6 |
| MTs25
|
3.15 |
11.77 |
8.62 |
2.680 1 |
| MTs35
|
3.72 |
12.31 |
8.59 |
2.489 5 |
Table 5.
Relative percentage of hydration heat of CCMs (%).
Table 5.
Relative percentage of hydration heat of CCMs (%).
| Sample |
3 h |
6 h |
12 h |
24 h |
48 h |
72 h |
96 h |
120 h |
| PC |
100 |
100 |
100 |
100 |
100 |
100 |
100 |
100 |
| MTs5
|
89 |
88 |
97 |
98 |
96 |
96 |
96 |
96 |
| MTs15
|
94 |
82 |
90 |
93 |
88 |
87 |
89 |
91 |
| MTs25
|
94 |
70 |
77 |
86 |
80 |
81 |
83 |
85 |
| MTs35
|
83 |
61 |
64 |
74 |
71 |
73 |
76 |
78 |
Table 6.
Influence of admixture types on the acceleration period of CCMs.
Table 6.
Influence of admixture types on the acceleration period of CCMs.
| Sample |
t0 (h) |
t1 (h) |
(t1-t0) (h) |
V (mW/g) |
| PC |
1.07 |
11.72 |
10.65 |
2.776 3 |
| MTs15
|
2.50 |
11.22 |
8.72 |
2.813 6 |
| FA15
|
1.33 |
12.77 |
11.44 |
2.328 5 |
| SL15
|
1.33 |
11.73 |
10.40 |
2.441 9 |
Table 7.
Relative percentage of hydration heat of CCMs (%).
Table 7.
Relative percentage of hydration heat of CCMs (%).
| Sample |
3 h |
6 h |
12 h |
24 h |
48 h |
72 h |
96 h |
120 h |
| PC |
100 |
100 |
100 |
100 |
100 |
100 |
100 |
100 |
| MTs15
|
94 |
82 |
90 |
93 |
88 |
87 |
89 |
91 |
| FA15
|
139 |
109 |
93 |
93 |
93 |
92 |
92 |
93 |
| SL15
|
139 |
115 |
99 |
96 |
94 |
94 |
95 |
96 |
Table 8.
Knudsen formulas of CCMs.
Table 8.
Knudsen formulas of CCMs.
| Sample |
Knudsen formula |
Qmax (J/g) |
t50 (h) |
| PC |
1/Q=0.002 827+0.083 70/(t-t0) |
353.73 |
29.61 |
| MTs5
|
1/Q=0.002 928+0.089 04/(t-t0) |
341.53 |
30.41 |
| MTs15
|
1/Q=0.002 948+0.119 85/(t-t0) |
339.21 |
40.65 |
| MTs25
|
1/Q=0.003 033+0.143 69/(t-t0) |
329.71 |
47.38 |
| MTs35
|
1/Q=0.003 270+0.165 03/(t-t0) |
305.81 |
50.47 |
| FA15
|
1/Q=0.003 094+0.102 27/(t-t0) |
323.21 |
33.05 |
| SL15
|
1/Q=0.002 835+0.114 00/(t-t0) |
352.73 |
40.21 |
Table 9.
Hydration kinetic parameters of CCMs.
Table 9.
Hydration kinetic parameters of CCMs.
| Sample |
n |
K1′ |
K2′ |
K3′ |
α1
|
α2
|
α2-α1
|
| PC |
1.831 70 |
0.042 68 |
0.010 26 |
0.001 63 |
0.133 |
0.220 |
0.087 |
| MTs5
|
1.881 52 |
0.044 87 |
0.010 69 |
0.001 53 |
0.130 |
0.199 |
0.069 |
| MTs15
|
1.860 04 |
0.045 61 |
0.010 32 |
0.001 15 |
0.116 |
0.158 |
0.042 |
| MTs25
|
1.949 23 |
0.045 73 |
0.010 09 |
0.001 02 |
0.111 |
0.144 |
0.033 |
| MTs35
|
2.047 24 |
0.046 34 |
0.010 01 |
0.000 99 |
0.107 |
0.141 |
0.034 |
| FA15
|
1.878 14 |
0.041 04 |
0.009 57 |
0.001 30 |
0.124 |
0.190 |
0.066 |
| SL15
|
1.810 73 |
0.040 21 |
0.008 97 |
0.001 13 |
0.111 |
0.177 |
0.066 |
|
Disclaimer/Publisher’s Note: The statements, opinions and data contained in all publications are solely those of the individual author(s) and contributor(s) and not of MDPI and/or the editor(s). MDPI and/or the editor(s) disclaim responsibility for any injury to people or property resulting from any ideas, methods, instructions or products referred to in the content. |
© 2023 by the authors. Licensee MDPI, Basel, Switzerland. This article is an open access article distributed under the terms and conditions of the Creative Commons Attribution (CC BY) license (http://creativecommons.org/licenses/by/4.0/).
