3.1. Microstructure of the Alloys
The X-ray diffraction patterns of the arc-melted Co-Cr-Re-Ta-Ti-C alloys after annealing at 1200°C for 24 hours and air cooling are shown in
Figure 1. All the alloys have three face-centered cubic (FCC) phases and one hexagonal close-packed (HCP) phase. A tetragonal phase is also detected in alloys Re-10 and Re-15.
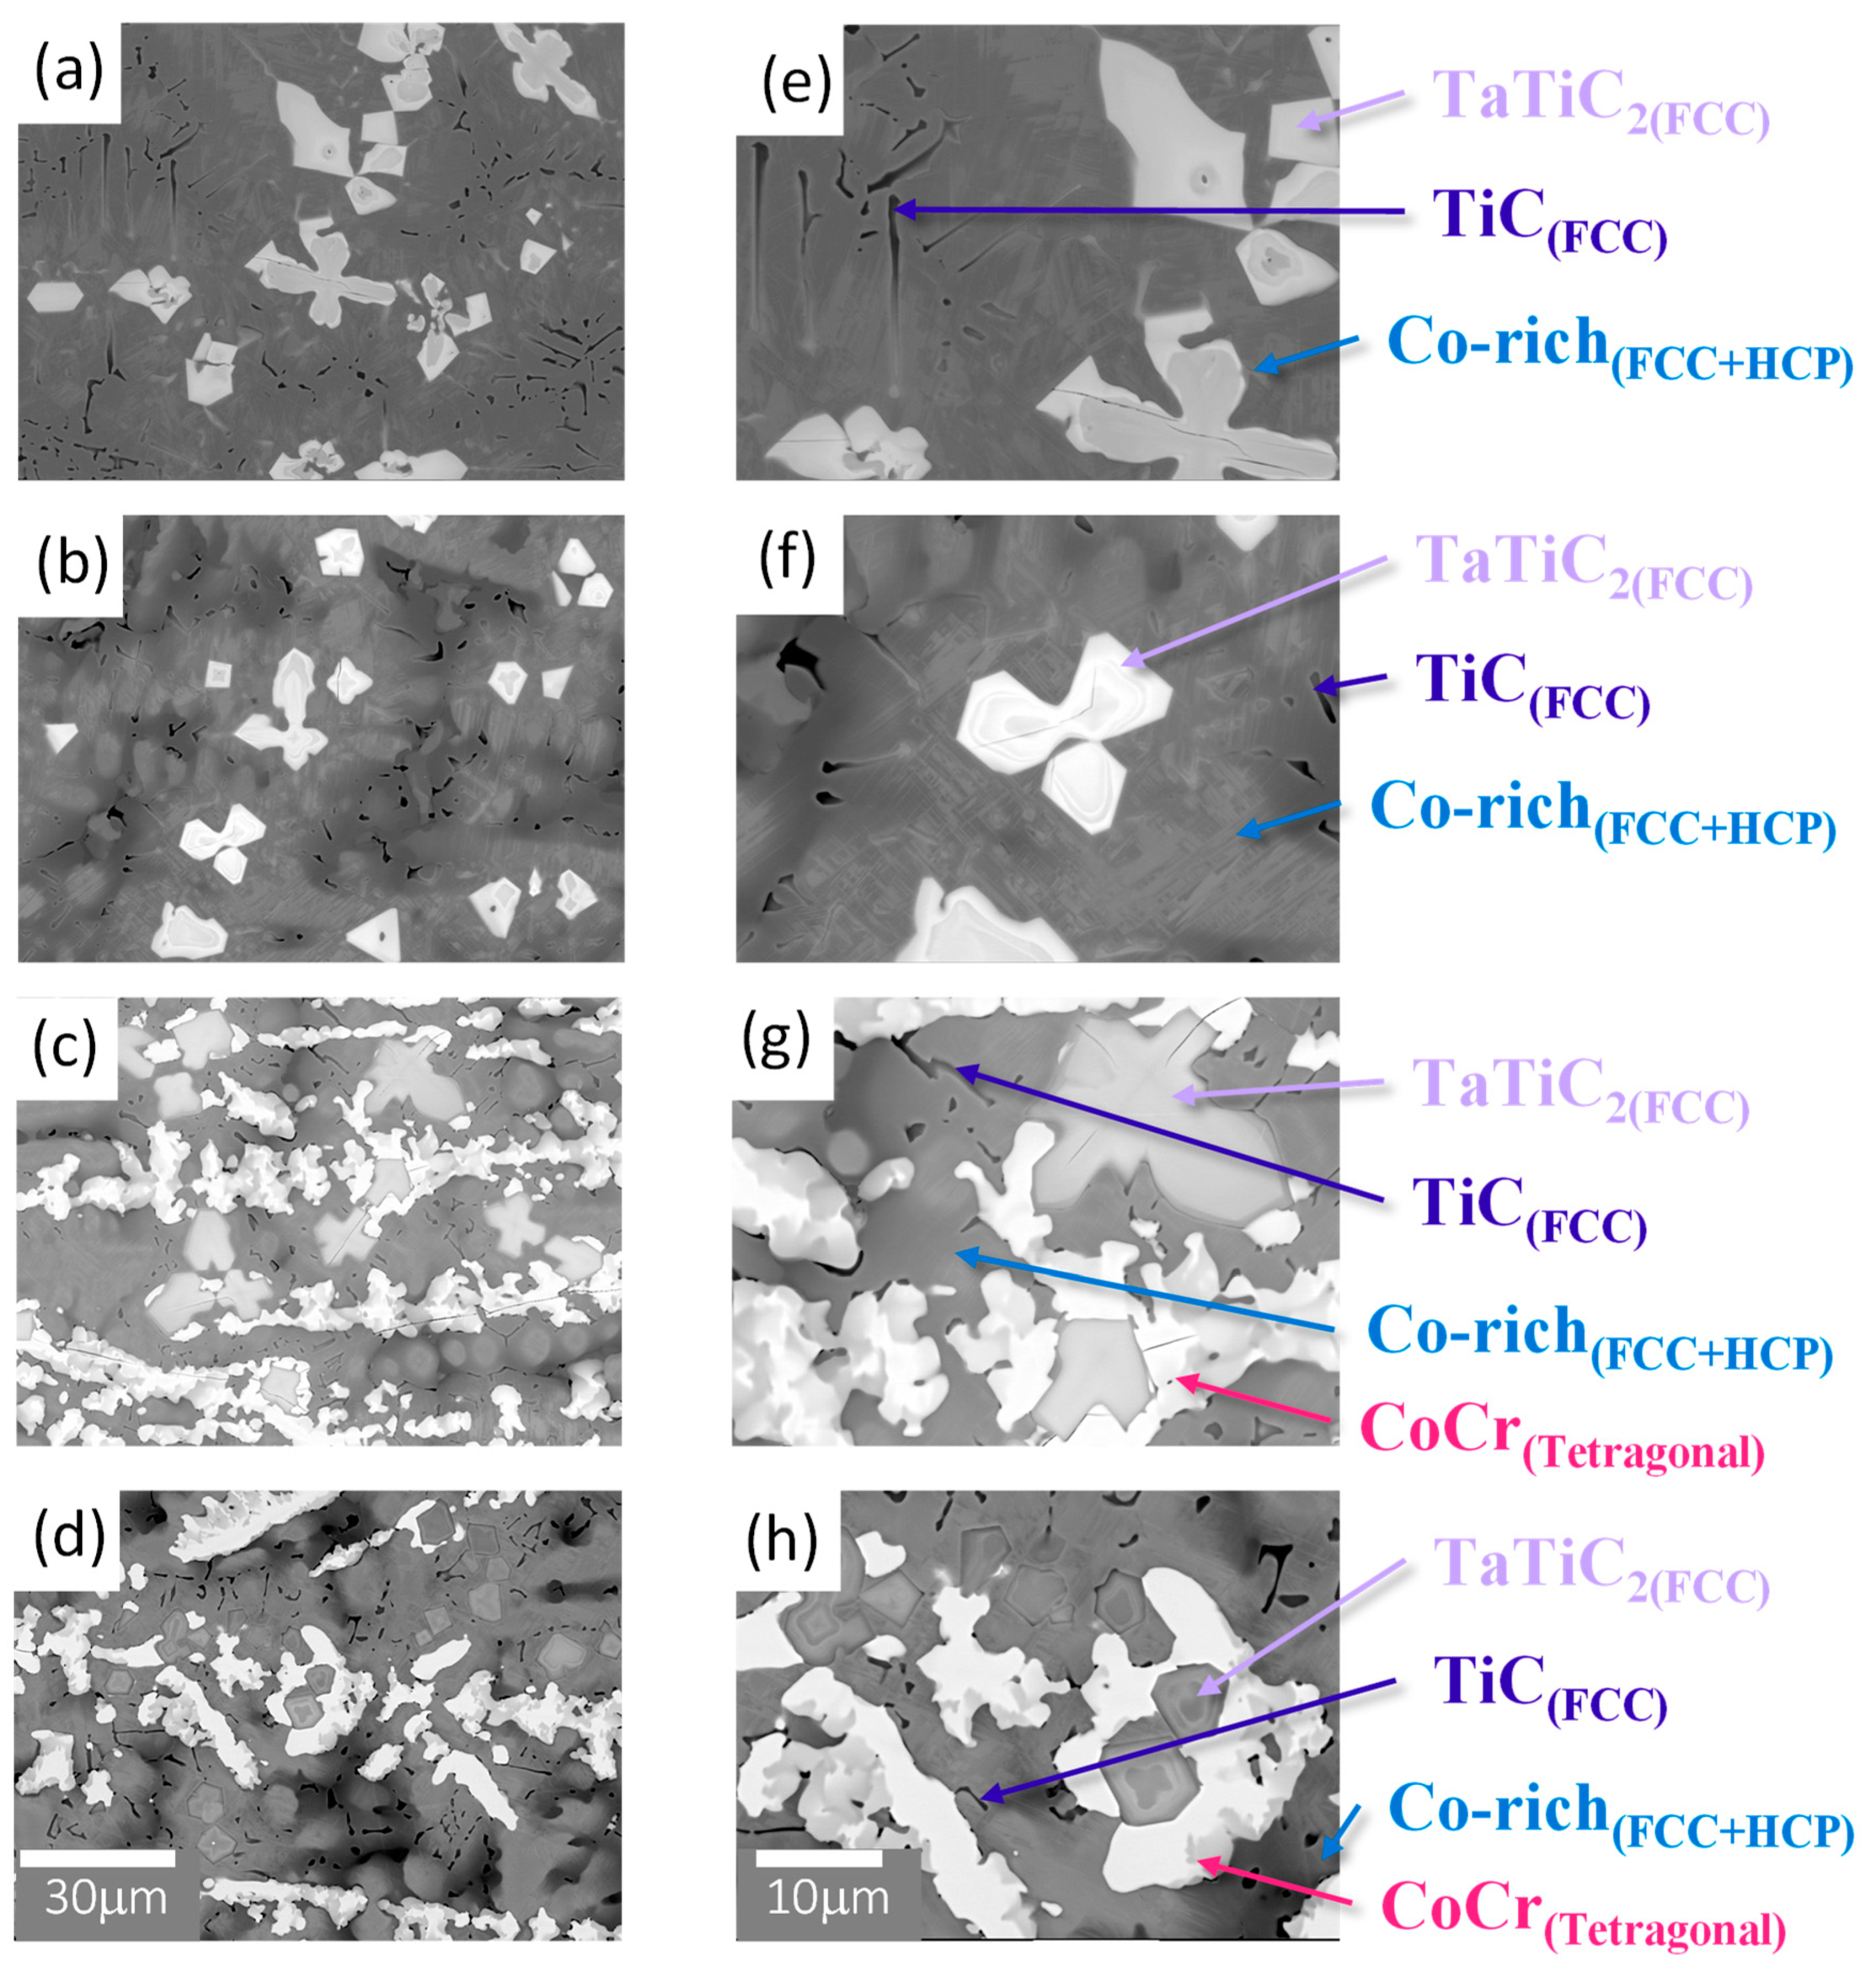
Figure 2 provides BSE images of the microstructures, and
Table 2 summarizes the corresponding EDS analysis results, respectively. All the cast alloys exhibit dendritic microstructures after annealing at 1200°C. The microstructure of alloys Re-0 and Re-5
(Figure 2(a), (b), (e), (f)) consists of two Co-rich phases (darker region) forming the matrix of the alloy, large star-shaped (Ta, Ti)-rich carbides (grey region), and Ti-rich carbides (black region). The shape of the (Ta, Ti)-rich carbides appears to be due to the agglomerate of several carbides, and the size of the carbides decreases as the Re content increases. More isolated carbides are observed in Re-5. In alloys Re-10 and Re-15, the distribution of the carbides changes so that they are arranged in a row. Also, increasing the Re content from Re-5 to Re-15 (
Figure 2(b)-(d), (f)-(h)) causes a decrease in the volume fraction of Co FCC and HCP phases and the formation of an additional CoCr-rich tetragonal phase. Through XRD, EDS, and BSE characterization, the matrix of the material was identified as a mixture of Co (HCP) and Co (FCC) phases. (Ta, Ti)-rich carbides were identified as TaTiC
2 (FCC, a=4.387Å) with the observed presence of TiC (FCC, 4.328 Å) alone. The tetragonal phase present in the Re-10 and Re-15 alloys was identified as the CoCr-rich sigma phase.
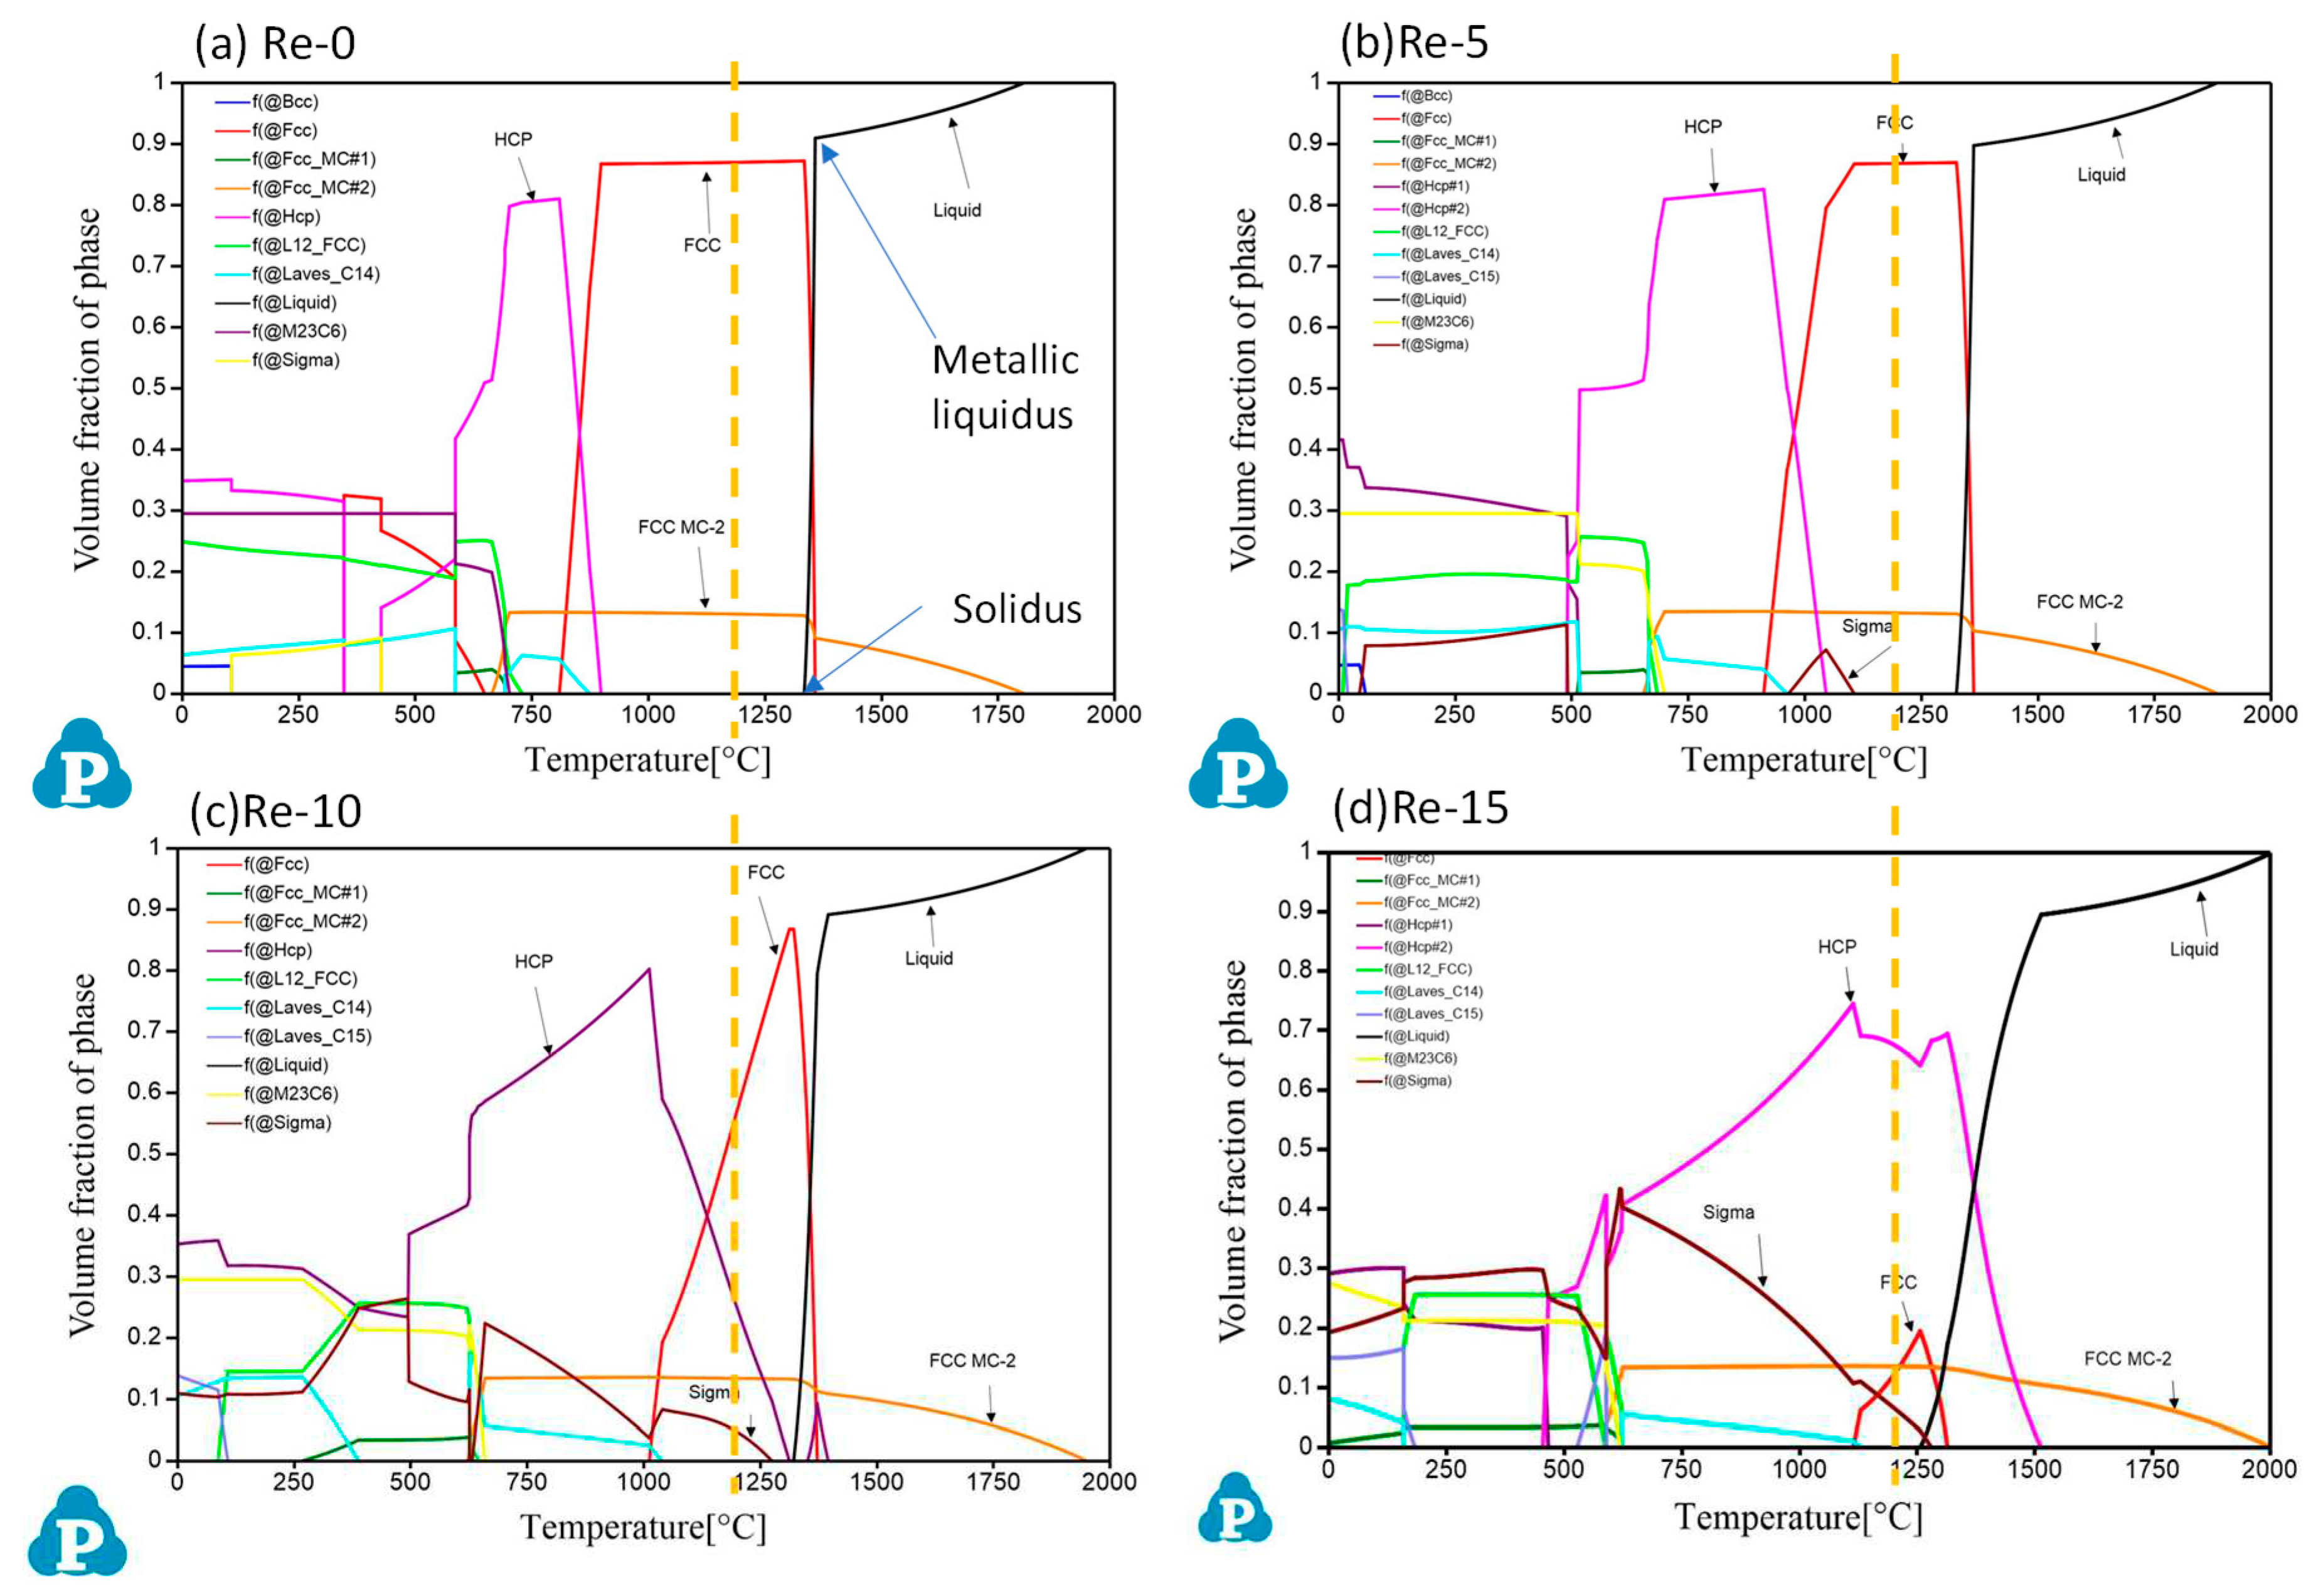
The experimental results for the microstructure and the composition of each phase in the Co-Cr-Re-Ta-Ti-C alloys were compared with the thermodynamic phase simulation, as shown in
Figure 3. The predicted phase compositions at 1200°C generally agreed with the experimental results, although there were some differences. The alloys Re-0 and Re-5 were mainly composed of the FCC phase with an additional FCC-MC phase. The main FCC phase is likely to correspond to the Co-rich FCC phase, and the FCC-MC2 corresponds to the TaTiC
2 (FCC) phase.
On the other hand, the HCP phase observed in all the alloys, as shown in
Figure 2 and
Table 2, does not appear in the predicted phase diagrams for Re-0 and Re-5 at 1200°C. From the simulations, this phase is predicted to form at 898.2°C for Re-0 and at 1045.3°C for Re-5, respectively. Therefore, the formation of the HCP phase in Re-0 and Re-5 may have occurred during the air-cooling process after the heat treatment, which could explain its presence confirmed by the microstructural characterization as well as its predicted formation at lower temperatures. The presence of the phase was also expected for Re-10 and Re-15, corresponding to the observed CoCr-rich
σ phase (tetragonal). The volume fraction of the
σ phase is expected to increase significantly with the addition of Re, reaching around 10% in the alloy Re-15, which corresponds to the observations on the BSE images (
Figure 2(c), (d), (g), (h)). According to the phase predictions, the volume fraction of TaTiC
2 remained constant across the range of alloys from Re-0 to Re-15. This finding is consistent with the microstructural observations made using the BSE mode (
Figure 2). However, in the predictions, it was found that increasing the Re content of the alloys increases the temperature at which the Co-rich FCC phase forms and decreases the volume fraction of the HCP phase. Further observations are needed to confirm the trend of phase formation with temperature in the Co-Cr-Re-Ta-Ti-C system. It should be noted that the thermodynamic database (PanNi-2020) used in this study is optimized for Ni-based alloys. Nevertheless, these results appear to be consistent with observations for samples heat treated at 1200°C, and predictive tools such as Pandat show promise for optimizing the composition and microstructure of complex alloys in the future.
3.2. Evolution of Melting Temperatures
In addition to predicting equilibrium phase compositions as a function of temperature, the diagrams also provide information on the temperatures at which phase transformations occur. Therefore, the calculation of phase diagram software can be used to estimate the melting temperatures of Co-Cr-Ta-Ti-C alloys. From the calculation shown in
Figure 3, the solidus temperature decreases slightly with increasing Re addition up to 10 at%; 1334.1°C for Re-0, 1324.8°C for Re-5 and 1321.2°C for Re-10, respectively. Then the 15 at% Re addition is predicted to drastically reduce the solidus temperature to 1255.9°C.
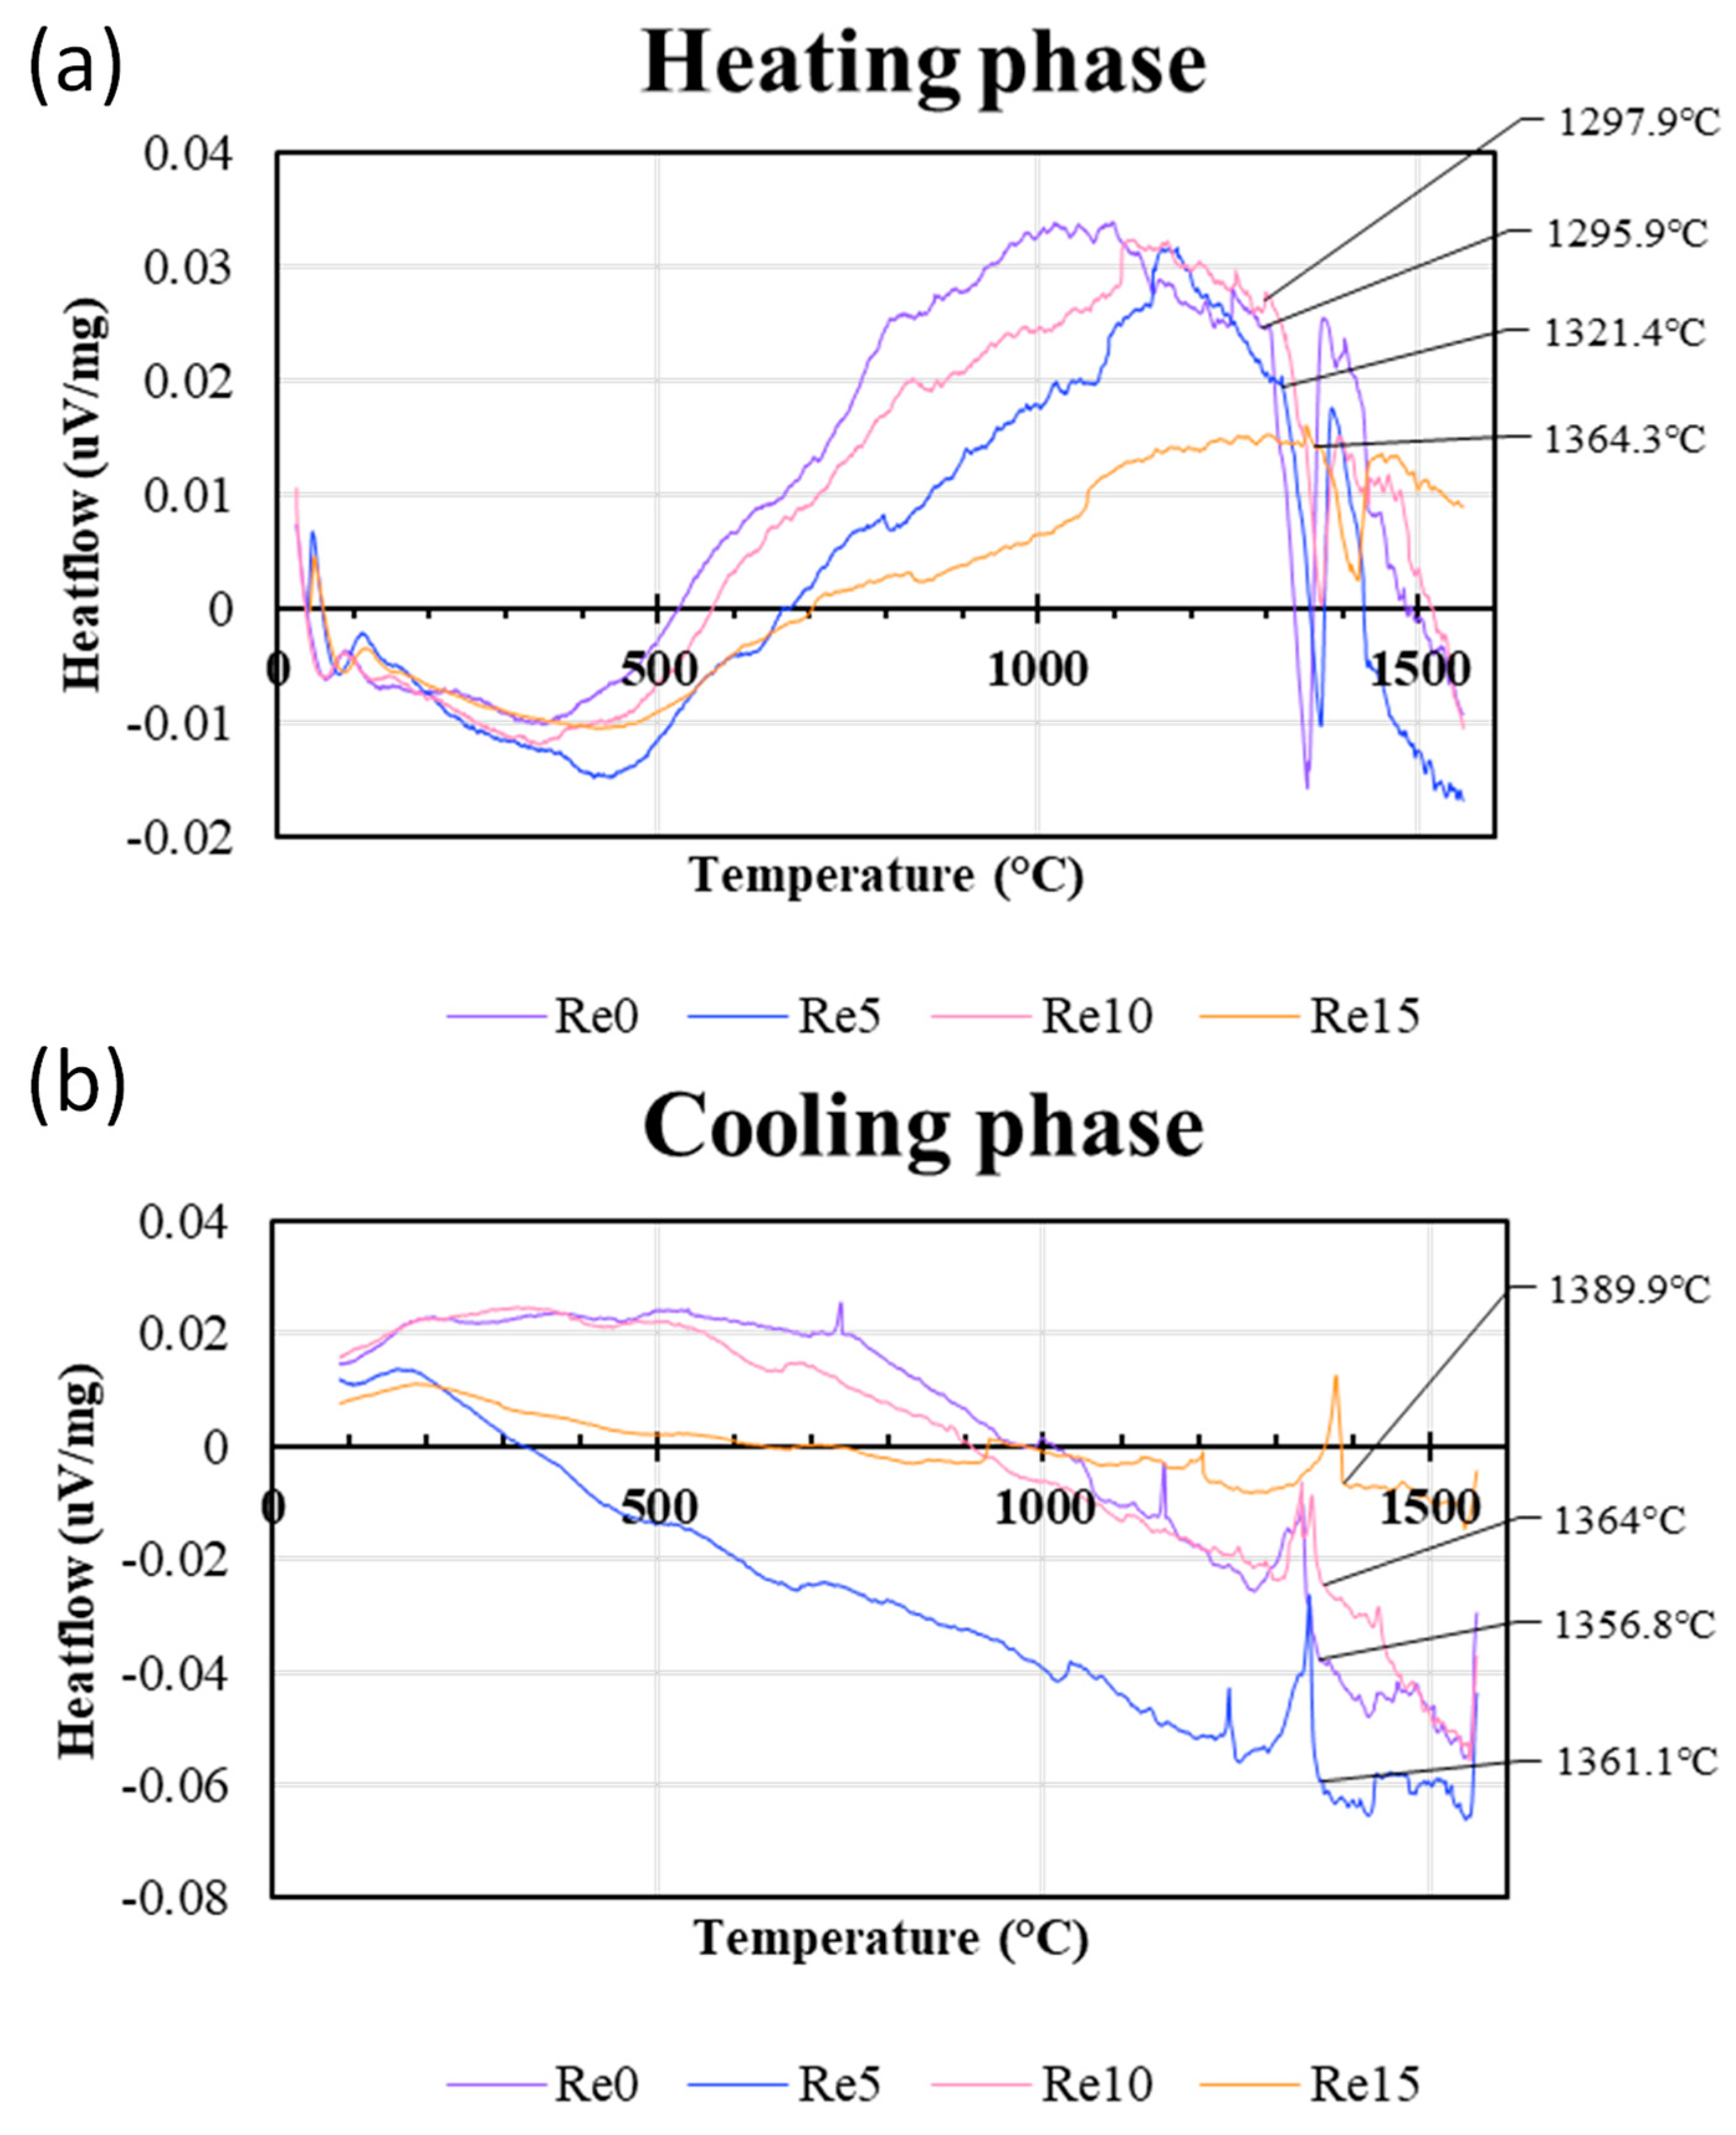
Figure 4 shows the DTA heat flow curves of the Co-Cr-Re-Ta-Ti-C alloys obtained from (a) the heating phase from room temperature to 1550°C and (b) the cooling phase from 1550°C to room temperature, respectively. As the sample temperature rises and melting starts, the temperature rise of the sample stops and the heat flow from the reference to the sample increases. Therefore, the endothermic reaction of the sample, such as melting, is shown as a negative slope in the heat flow curve. When melting stops, the heat flow curve quickly returns to the baseline.
Figure 3.
Predicted phase diagrams of (a)Re-0, (b)Re-5, (c)Re-10 and (d)Re-15 derived from Pandat 2020 software with Pan-2020 database. Dashed lines indicate the phase composition at 1200°C.
Figure 3.
Predicted phase diagrams of (a)Re-0, (b)Re-5, (c)Re-10 and (d)Re-15 derived from Pandat 2020 software with Pan-2020 database. Dashed lines indicate the phase composition at 1200°C.
In contrast, the exothermic change of the sample results in positive heat flow from the sample to the reference, and is therefore shown as a positive peak in the heat flow curve [
27]. These changes in the heat flow curves can be used to determine the transition temperatures and the reaction temperatures of the samples.
The beginning of the endothermic peak during the heating stage can be used to estimate the temperature at which melting begins in the Co-Cr-Re-Ta-Ti-C samples, which could be assigned as “solidus temperature”. The results show that the solidus points of Re-0, Re-5 and Re-10 are 1295.9°C, 1321.4°C, and 1297.9°C, respectively, suggesting that up to the 10 at% addition of Re does not drastically change the solidus temperature of the alloys investigated, which agreed well with the Pandat predictions. However, the addition of 15 at% Re significantly increased the solidus temperature (1364.3°C).
On the other hand, the onset of the exothermic peak during the cooling phase, derived from the DTA measurement, can be considered as the temperature at which the samples begin to solidify. In the calculated phase diagrams in
Figure 3, it corresponds to the point where the rapid increase in the volume fraction of the liquid phase abruptly stops, as indicated by the arrow in
Figure 3(a). Above this point, all metallic phases melt completely. Hence, the point is referred to as the "metallic liquidus point" in the present study. In the DTA analysis, Re-0 for 1356.8°C, Re-5 for 1361.1°C and Re-10 for 1364°C were assigned as the metallic liquidus points. Again, there is no significant difference between 0 and 10 at% Re. Further addition of Re (15 at%) increased the liquidus temperature to 1389.9°C.
Figure 5(a) compares the solidus temperatures measured using DTA with the predicted values shown in
Figure 3 to assess the reliability of the prediction software and database. The results from Re-0 to Re-10 show reasonable agreement between the experimental and predicted values, with differences of 38.2°C, 3.4°C and 23.3°C, respectively. The result for sample Re-15, which has the highest content of Re (15 at%), shows a significant discrepancy, with the predicted temperature being lower than any of the other samples and differing from the experimental results by 108.4°C. Regarding the "metallic liquidus" temperature at which metallic phases are completely melted, the trend is similar for both experimental and predicted results, with the melting temperature increasing with increasing addition of Re
(Figure 5(b)). It is noteworthy that there is excellent agreement for Re-0 and Re-5 within 1°C of the deviations. However, the difference becomes much larger with increasing Re content; the predicted temperatures are 31.5°C higher than the experimental results for Re-10 and 123.4°C higher for Re-15.
Figure 4.
DTA heat flow curves of CoCrReTaTiC alloys: (a) from room temperature to 1550°C, (b) from 1550°C to room temperature.
Figure 4.
DTA heat flow curves of CoCrReTaTiC alloys: (a) from room temperature to 1550°C, (b) from 1550°C to room temperature.
The comparison showed generally good agreement up to 10 at% Re addition, whereas for Re-15 there was a large gap between the calculated predictions and the experimental results. In particular, the metallic liquidus temperature was estimated to be higher and the solidus temperature was estimated to be lower. In the calculation, the initial solidification of the metallic phase in Re-15 is predicted to be the Re-rich HCP phase, and the lower solidus point is due to the predicted occurrence of eutectic reactions. On the other hand, the microstructural analysis and DTA measurement did not confirm the possible eutectic reactions, suggesting that the Pan-Ni database is not suitable for predicting the phases of the Co-Cr-Ta-Ti-Re-C alloy system when the Re content exceeds 10 at%.
Nevertheless, excellent agreement between Pandat predictions and experimental results was obtained for Re-0 and Re-5, confirming the usefulness of the simulation tool for phase prediction.
Further experiments in the Co-Cr-Ta-Ti-Re-C alloy system could help to improve the accuracy of the predictions, especially for alloys with higher alloying additions such as Ta, Ti and Re.
Figure 5.
Comparison of melting temperatures experimentally determined by DTA and predicted by Pandat software: (a)solidus temperature and (b)metallic liquidus temperature.
Figure 5.
Comparison of melting temperatures experimentally determined by DTA and predicted by Pandat software: (a)solidus temperature and (b)metallic liquidus temperature.
3.3. Oxidation Resistance at 1200 °C
Figure 6(a) shows the morphological appearance of the samples after 20 hours of air exposure at 1200°C, along with the spalled oxides left on the Al
2O
3 plate (
Figure 6(b)). The photographs show a blue halo on the alumina plate, indicating that blue oxides, such as Cr-rich oxide, were formed, evaporated and deposited on the alumina plate. It is also likely that Co-rich oxides were melted or spalled and deposited. The alloys, Re-0, Re-5, and Re-10 have similar amounts of spalled oxide in the form of a powder that has spalled from the samples. On the other hand, alloy Re-15 shows a greater amount of spalled oxides in both powder and solid forms. In order to semi-quantitatively compare the oxidation behavior of the samples, the mass change per surface area,,
, was estimated, where the surface area “S” is defined as
, and the results are summarized in
Figure 6(c). Note that the sample mass does not include the spalled oxides.
Figure 6(c) suggests that Re-15 has lost a significant amount of surface oxide through evaporation or spalling, indicating poor oxidation resistance.
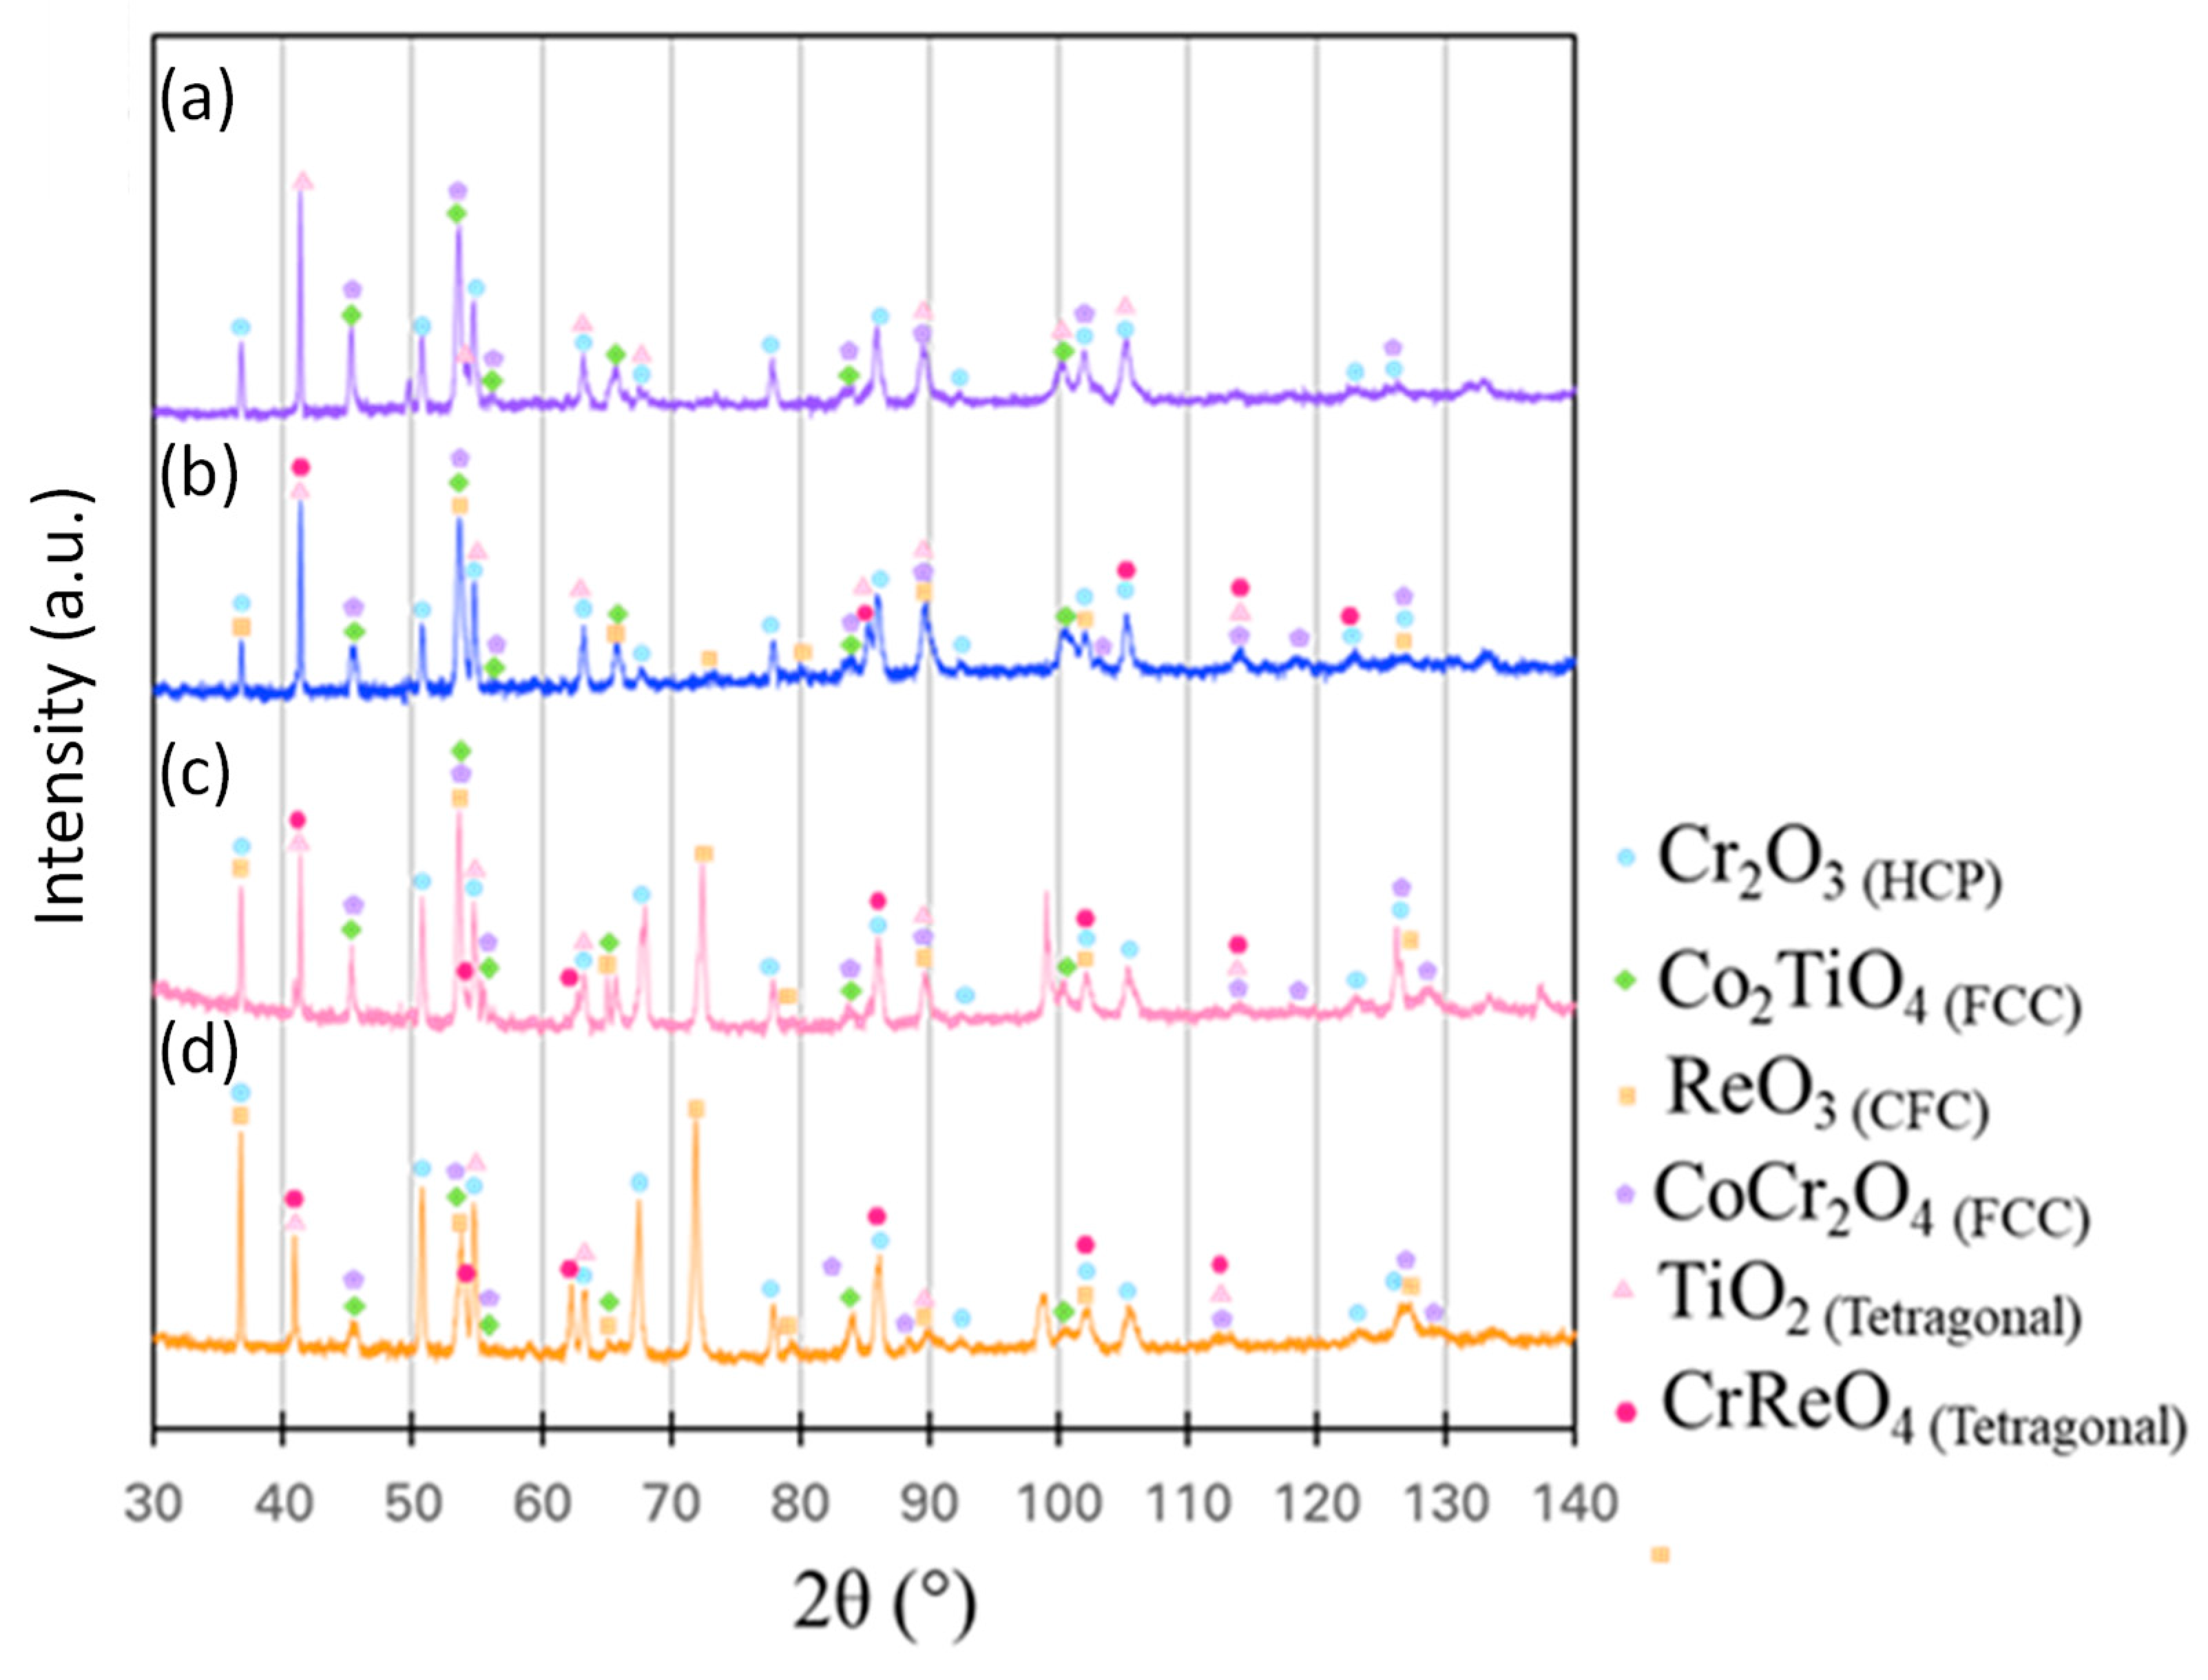
Figure 7 shows XRD profiles taken from the top surface of the alloys after 20 hours of oxidation at 1200°C. All the alloys show the presence of two FCC oxide phases, one HCP oxide phase, and one tetragonal oxide phase. The addition of 5 at% Re contributes to the formation of two additional oxide phases: a Cr and Re-rich tetragonal phase and a Re-rich cubic-centered oxide. The peak intensity of the Re-rich oxide appears to increase at 37.05° (corresponding to the (200) diffraction), 72.93° (corresponding to the (321) diffraction), and 127.94° (corresponding to the (440) diffraction). To further identify the oxides formed, cross-sectional analyses were performed using BSE and EDS and are summarized in
Figure 8. It should be noted that these images were taken from the top surface of the samples placed on the Al
2O
3 plate (see
Figure 6(a)).
Figure 6.
(a) Appearances of the alloys oxidized at 1200°C for 20h followed by air cooling, (b) oxides left from the alumina plate, (c) mass changes of the alloys per exposed surface area.
Figure 6.
(a) Appearances of the alloys oxidized at 1200°C for 20h followed by air cooling, (b) oxides left from the alumina plate, (c) mass changes of the alloys per exposed surface area.
Figure 7.
XRD profiles of the surfaces of samples after 20 h of air oxidation at 1200°C. (a) Re-0, (b) Re-5, (c) Re-10 and (d)Re-15. .
Figure 7.
XRD profiles of the surfaces of samples after 20 h of air oxidation at 1200°C. (a) Re-0, (b) Re-5, (c) Re-10 and (d)Re-15. .
The presence of Cr
2O
3 (shown as the green area in the elemental mapping in
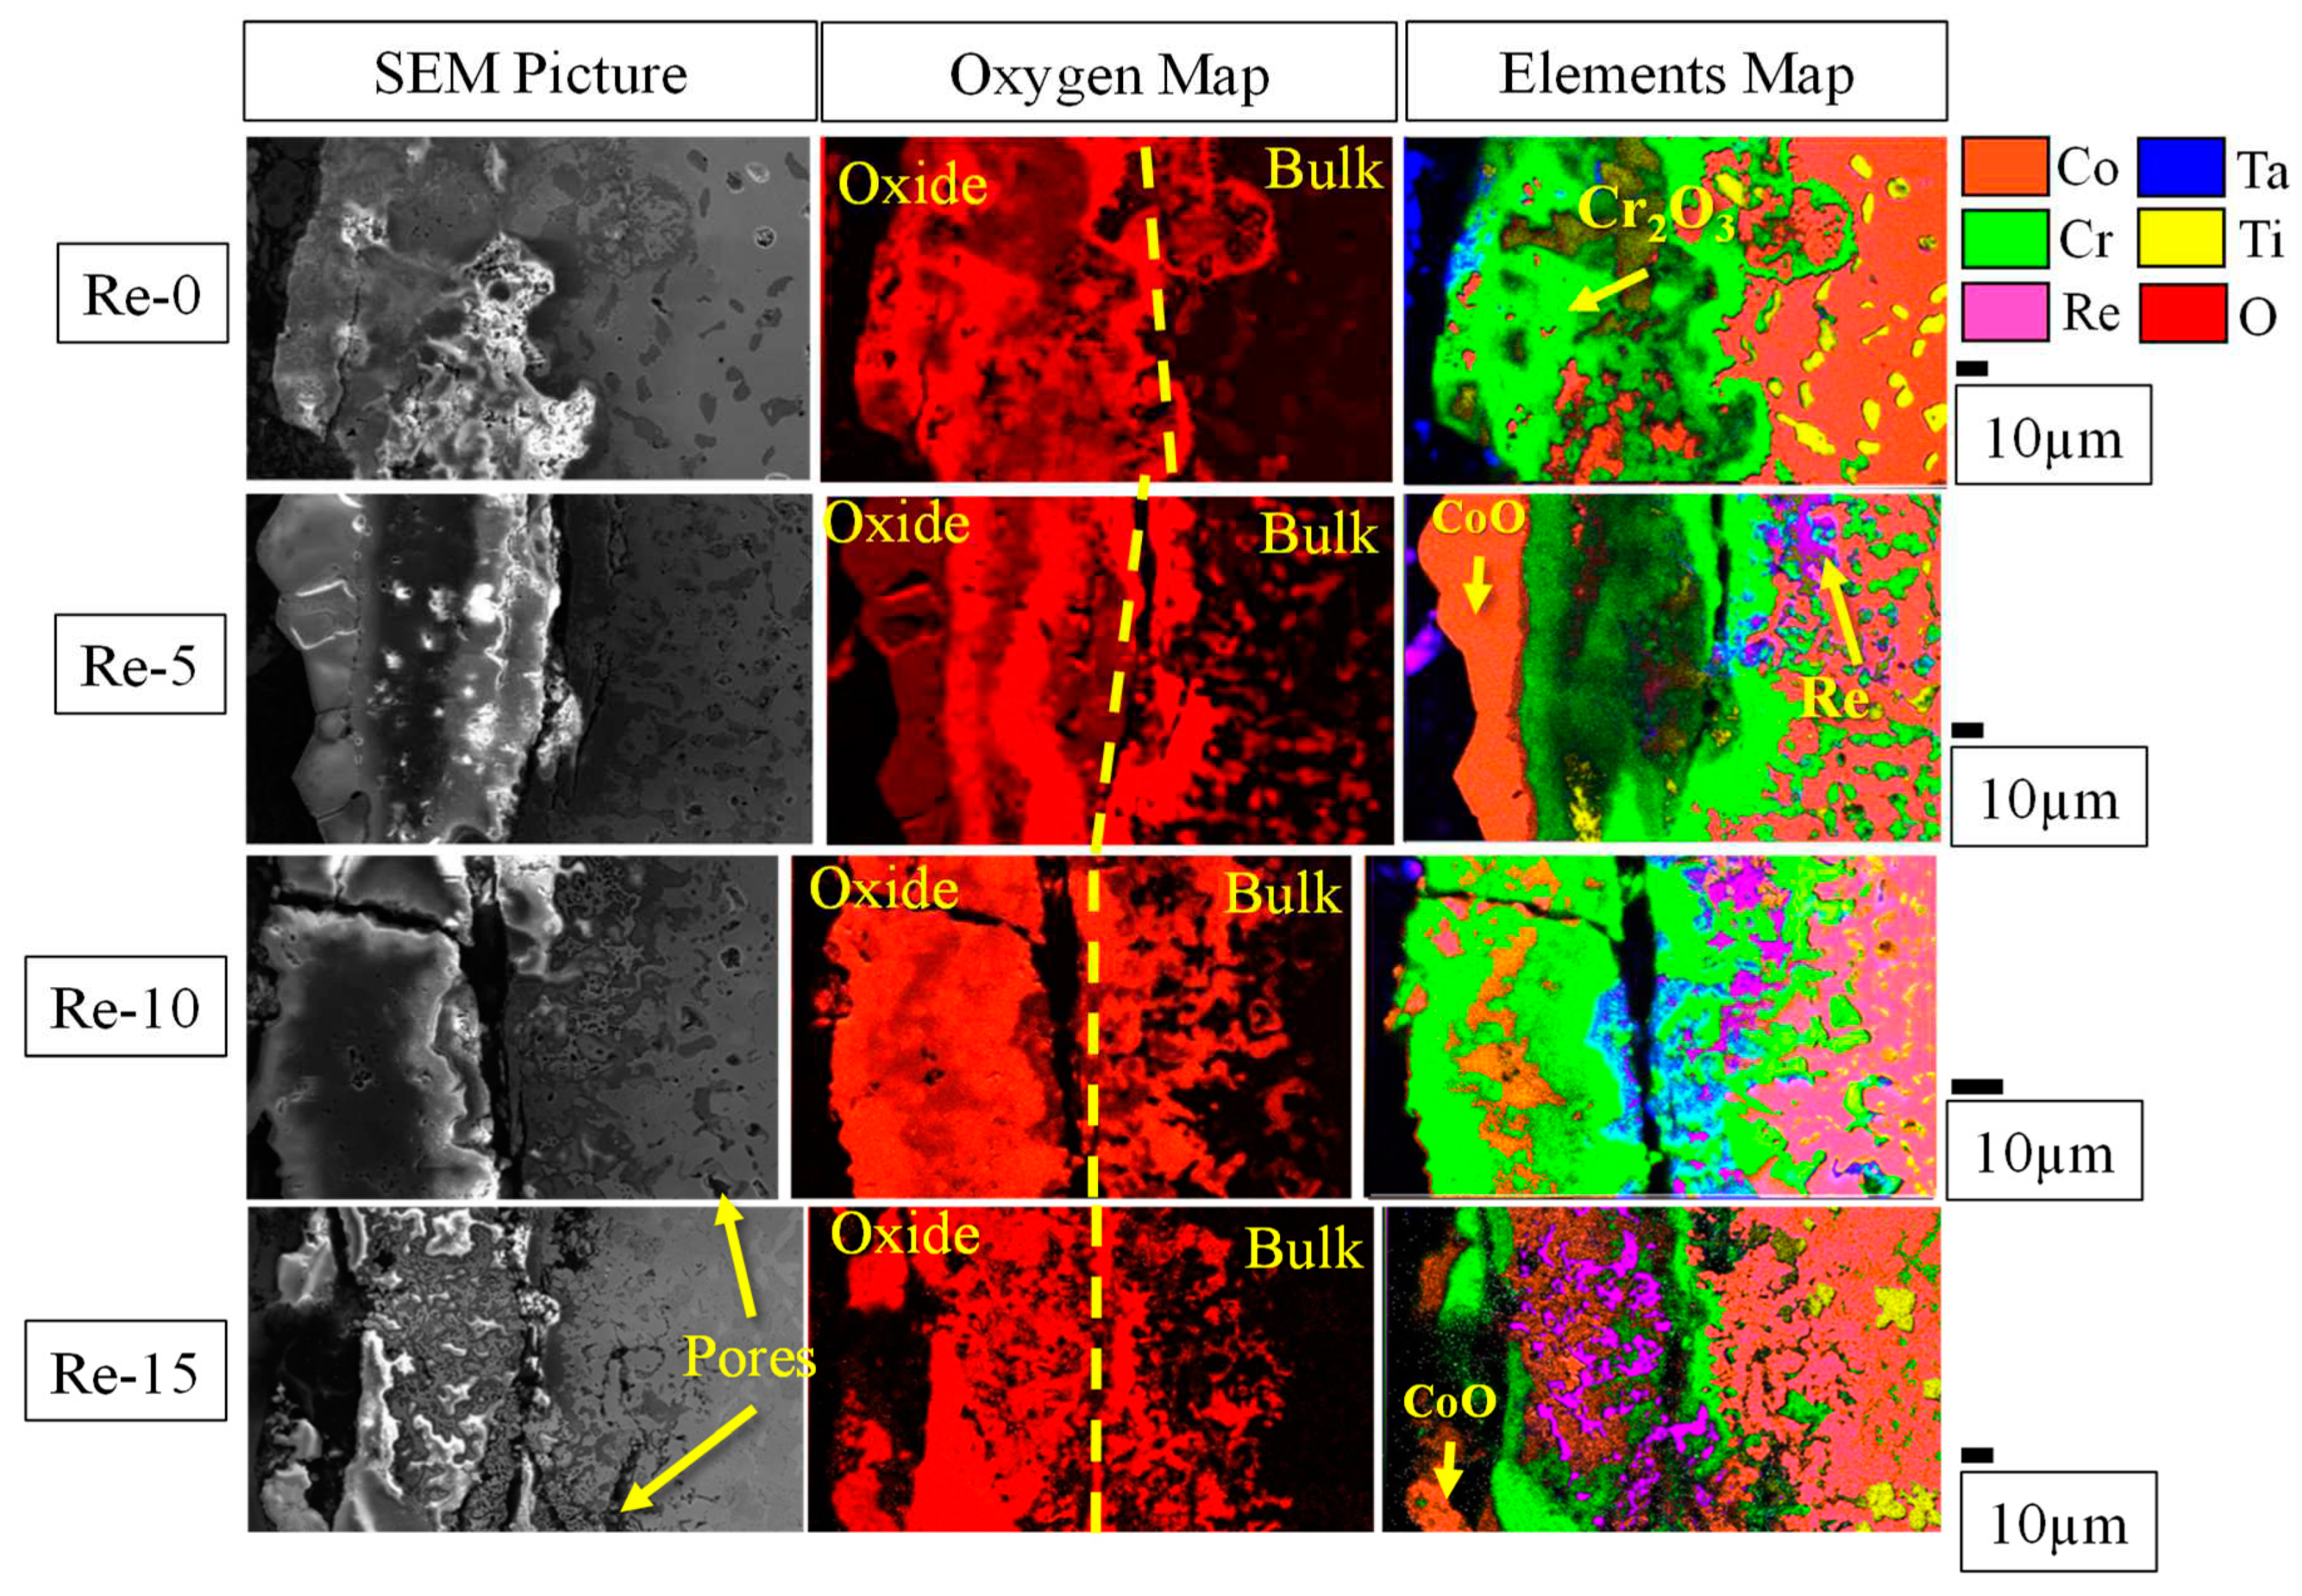
Figure 8) is observed in all alloys, but its volume fraction decreases drastically in Re-15. In addition, internal oxidation seems to be promoted with increasing Re-content, indicating reduced protection against oxidation at 1200°C. For Re-5 and higher, the presence of CoO (shown in orange in
Figure 8) is observed. This oxide is present above the Cr
2O
3 layer for Re-5, but is mixed with Cr
2O
3 by Re-10. In Re-15, the Co oxide is present both on the top surface and in the Cr, Re and Co mixed oxide layer. As mentioned earlier, the formation of Co oxide is not favorable due to its porous nature and poor oxidation resistance. The formation of porous oxides does little to reduce the oxygen partial pressure beneath this layer, thus suppressing the formation of a continuous protective Cr
2O
3 layer.
The presence of Re appears to facilitate the oxidation of other elements, leading to accelerated internal oxidation and the formation of pores on the surface of the alloys. The Re oxide is volatile [20, 21] and therefore easily evaporates during heat exposure, so the presence of Re oxides (shown in purple with the oxygen enrichment in
Figure 8) is not easily observed. In addition, the continuous evaporation of Re oxide promotes pore formation, thereby suppressing the formation of dense and continuous surface oxide layers, resulting in accelerated oxidation of other elements. The thinner Cr
2O
3 layer observed in Re-15 could be explained by the accelerated formation and evaporation of non-continuous Cr
2O
3 due to the high rate of Re evaporation. The accelerated oxidation of other elements, such as Co, Ti and Ta, also promotes the spallation of their oxides, as shown in
Figure 6(b). Thus, it is concluded that Re-10 and Re-15 suffer from the rapid formation of volatile oxides and their evaporation, together with the formation of other oxides and their spallation, resulting in significant mass loss by the oxidation test. On the other hand, the mass change of Re-5 is the smallest among the alloys studied. However, by comparing the cross-sectional microstructure between Re-0 and Re-5, the thickness of the oxidized region is greater in Re-5, where internal oxidation is also observed. These results suggest that Re-0 and Re-5 have almost identical mass loss caused by vaporization and spallation of oxides, but the remaining oxidized region is larger in Re-5, concluding that 5at% Re addition may not necessarily improve oxidation resistance in this alloy system.
In this study, the addition of Re to the Co-Cr-Ta-Ti-C alloys did not modify the melting temperatures or oxidation resistance. In fact, excessive addition (15at%) drastically worsened the oxidation resistance. However, Re is still an attractive element because it is expected to improve the mechanical properties. [
15,
16]
One of the solutions to improve the oxidation resistance is to design alloys that could form CrTaO
4, as this complex and protective oxide layer has been shown to be stable and effective up to 1200°C [
14], whereas no CrTaO
4 was observed in all the alloys investigated in this study. Optimization of the Co-Cr-Ti-Ta-C alloy composition with the small addition of Re, using thermodynamic calculation software, would help to develop new alloys with the good combination of mechanical properties and oxidation resistance, which should be investigated in the future.
Figure 8.
Cross-sectional micrographs of alloys after 20 h of oxidation at 1200°C and corresponding oxygen and elements mapping by EDS.
Figure 8.
Cross-sectional micrographs of alloys after 20 h of oxidation at 1200°C and corresponding oxygen and elements mapping by EDS.
