Submitted:
18 November 2023
Posted:
20 November 2023
You are already at the latest version
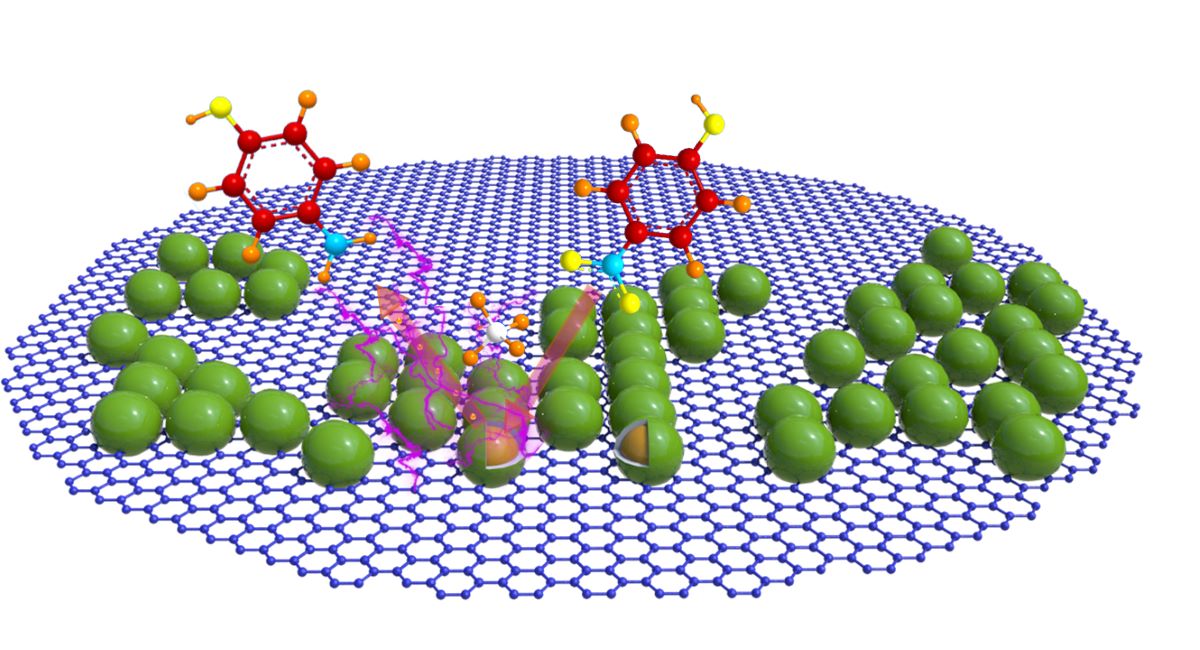
Abstract
Keywords:
1. Introduction
2. Experimental section
3. Results and discussion
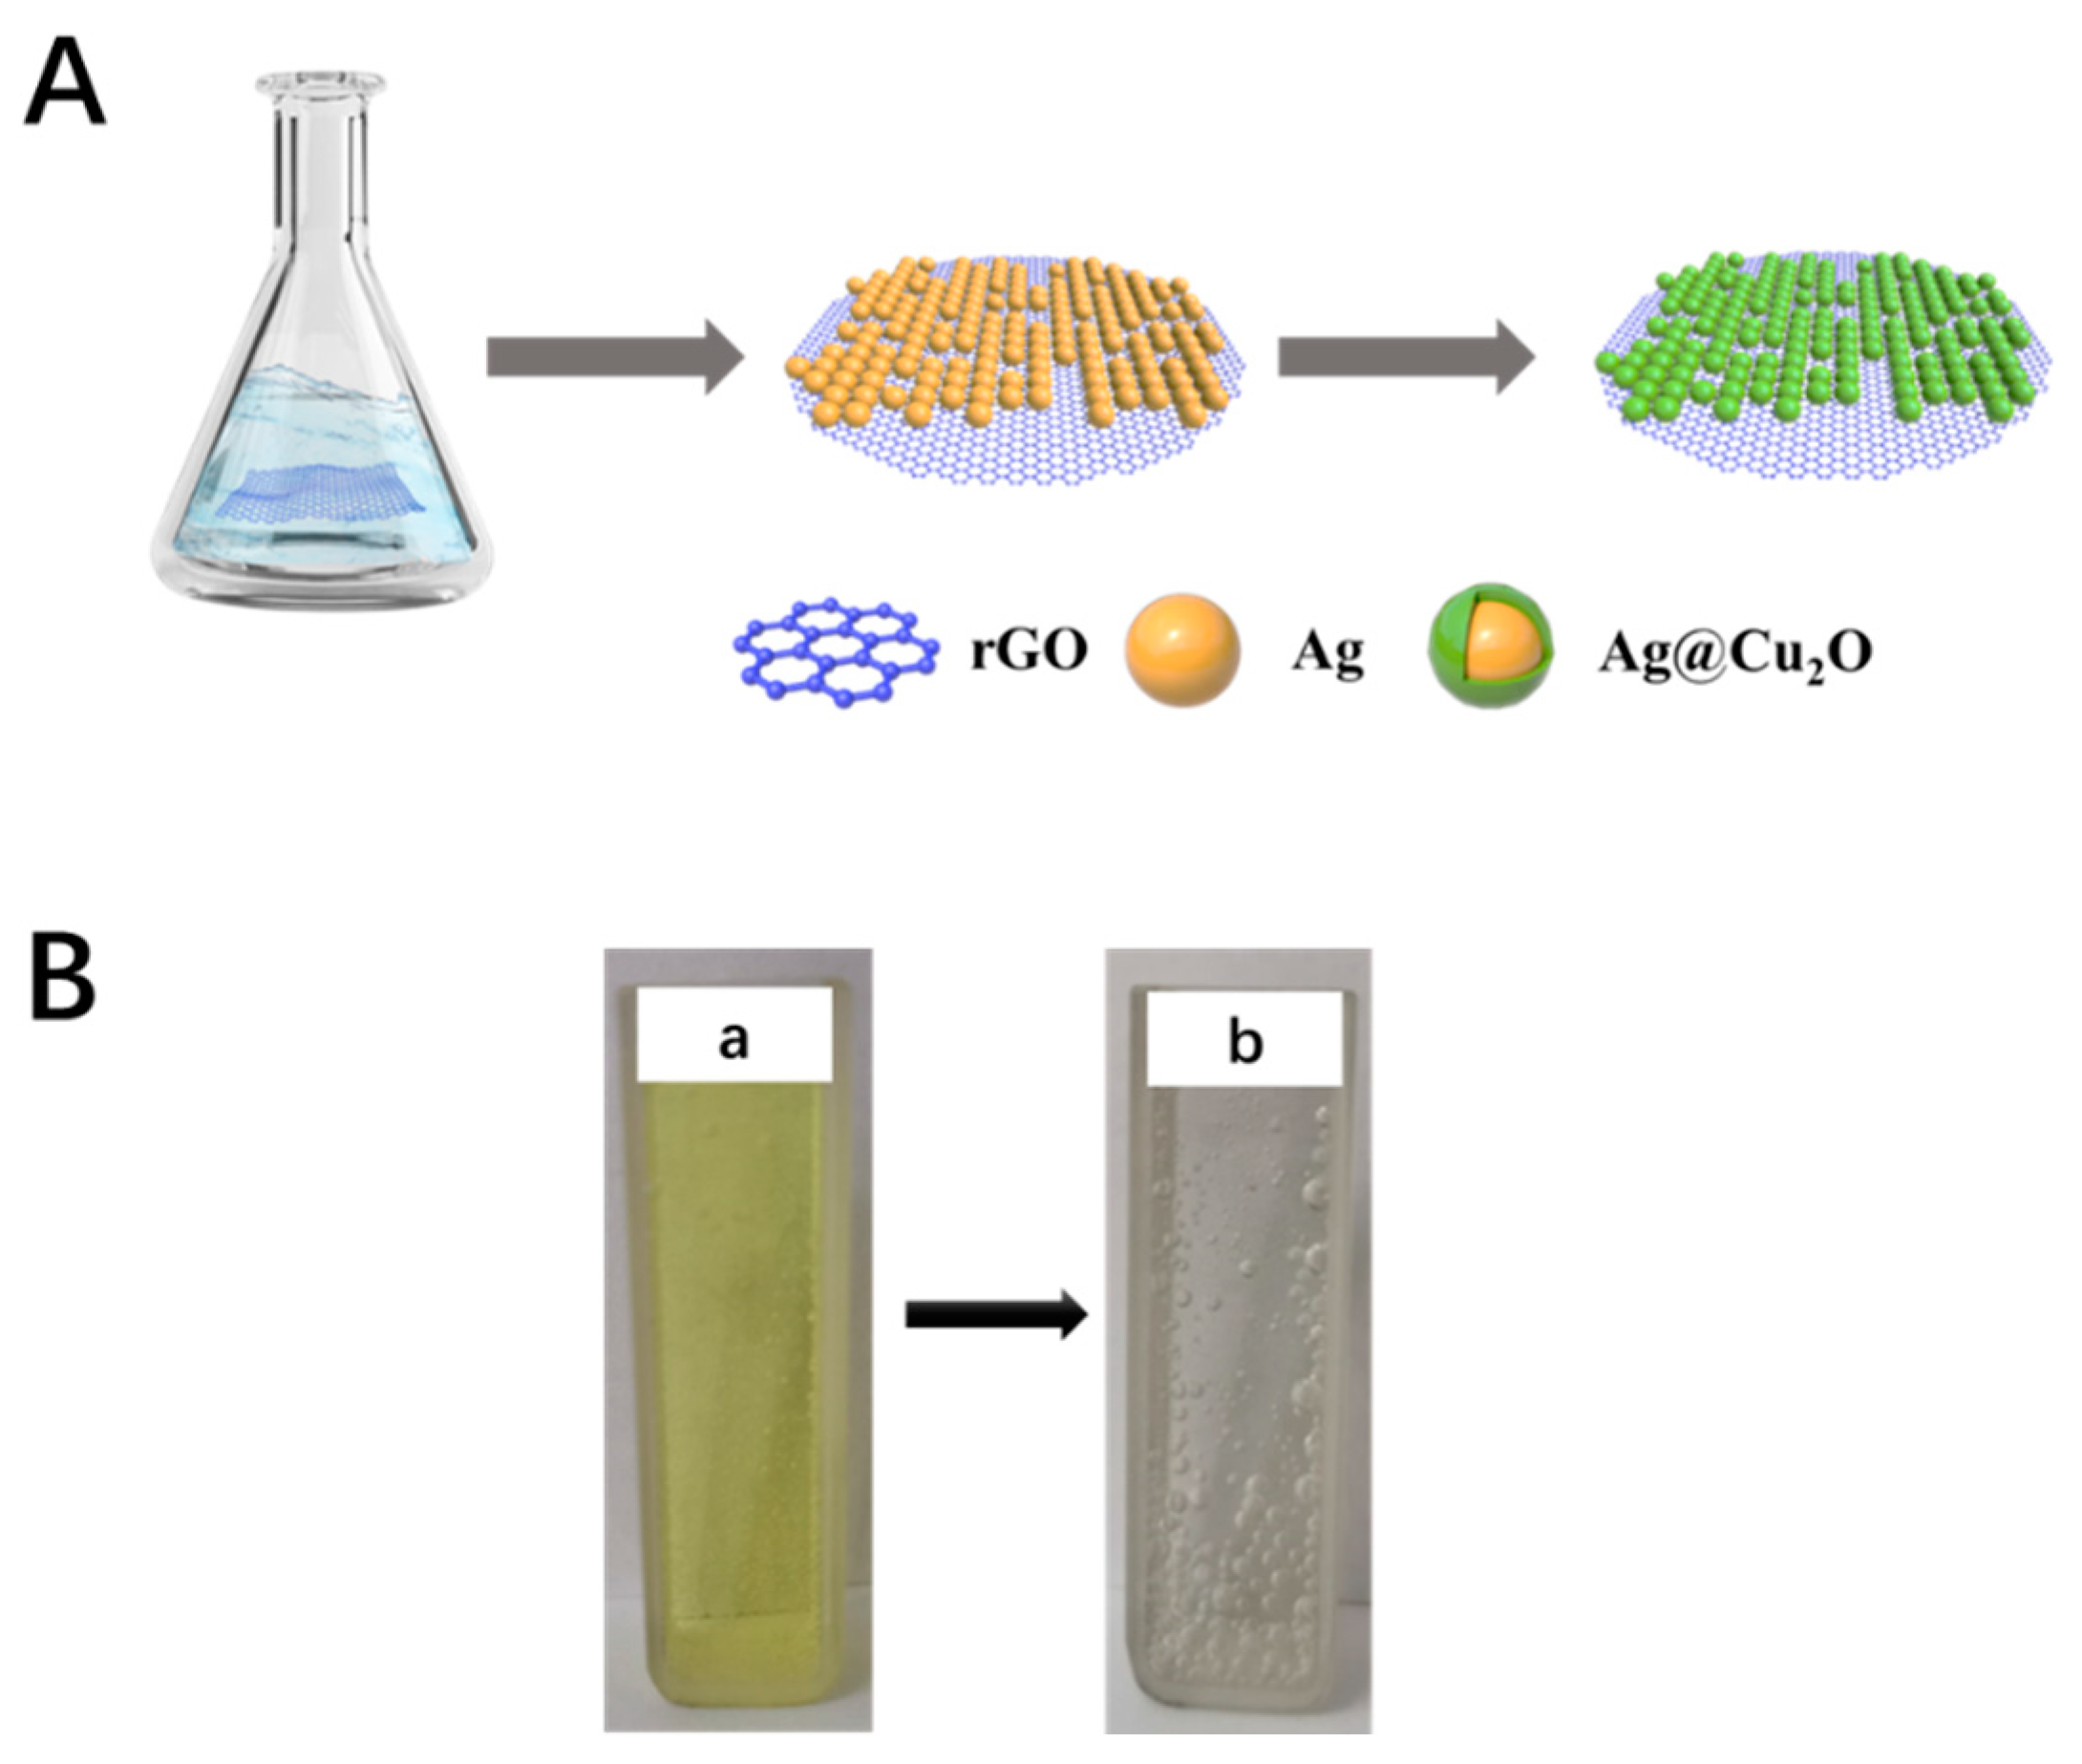
3.1. Morphological characterization of the ACRN
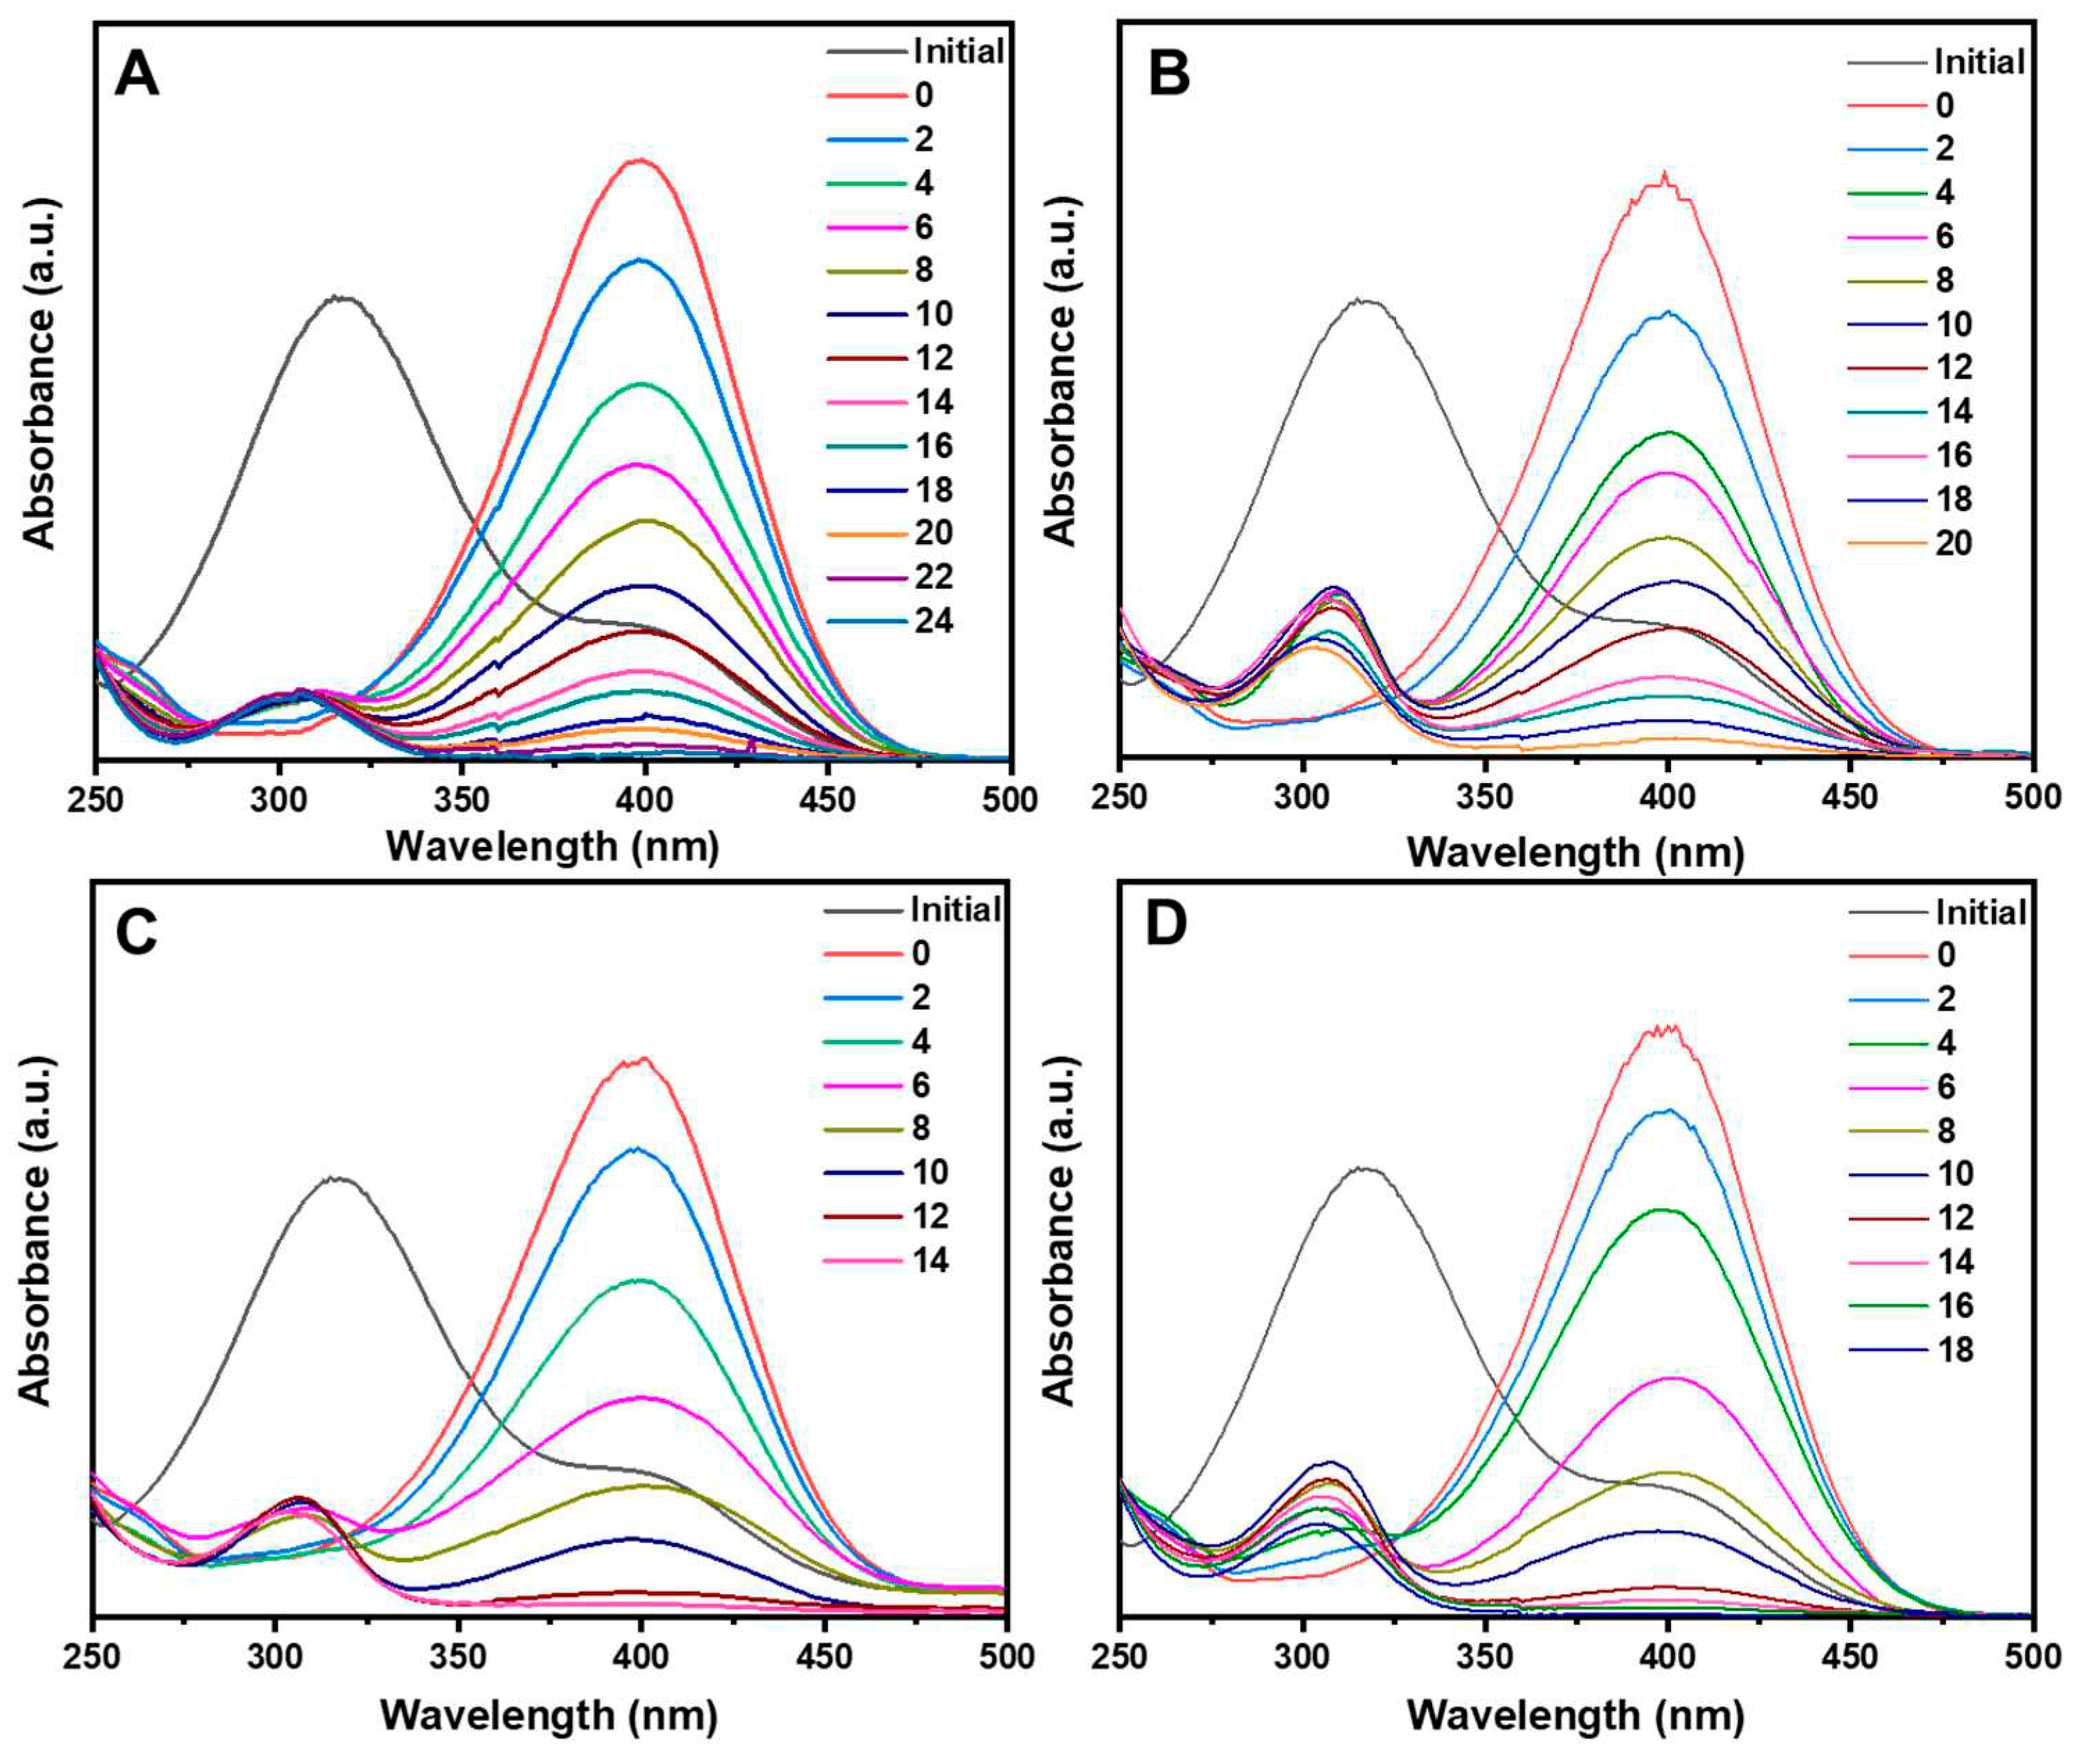
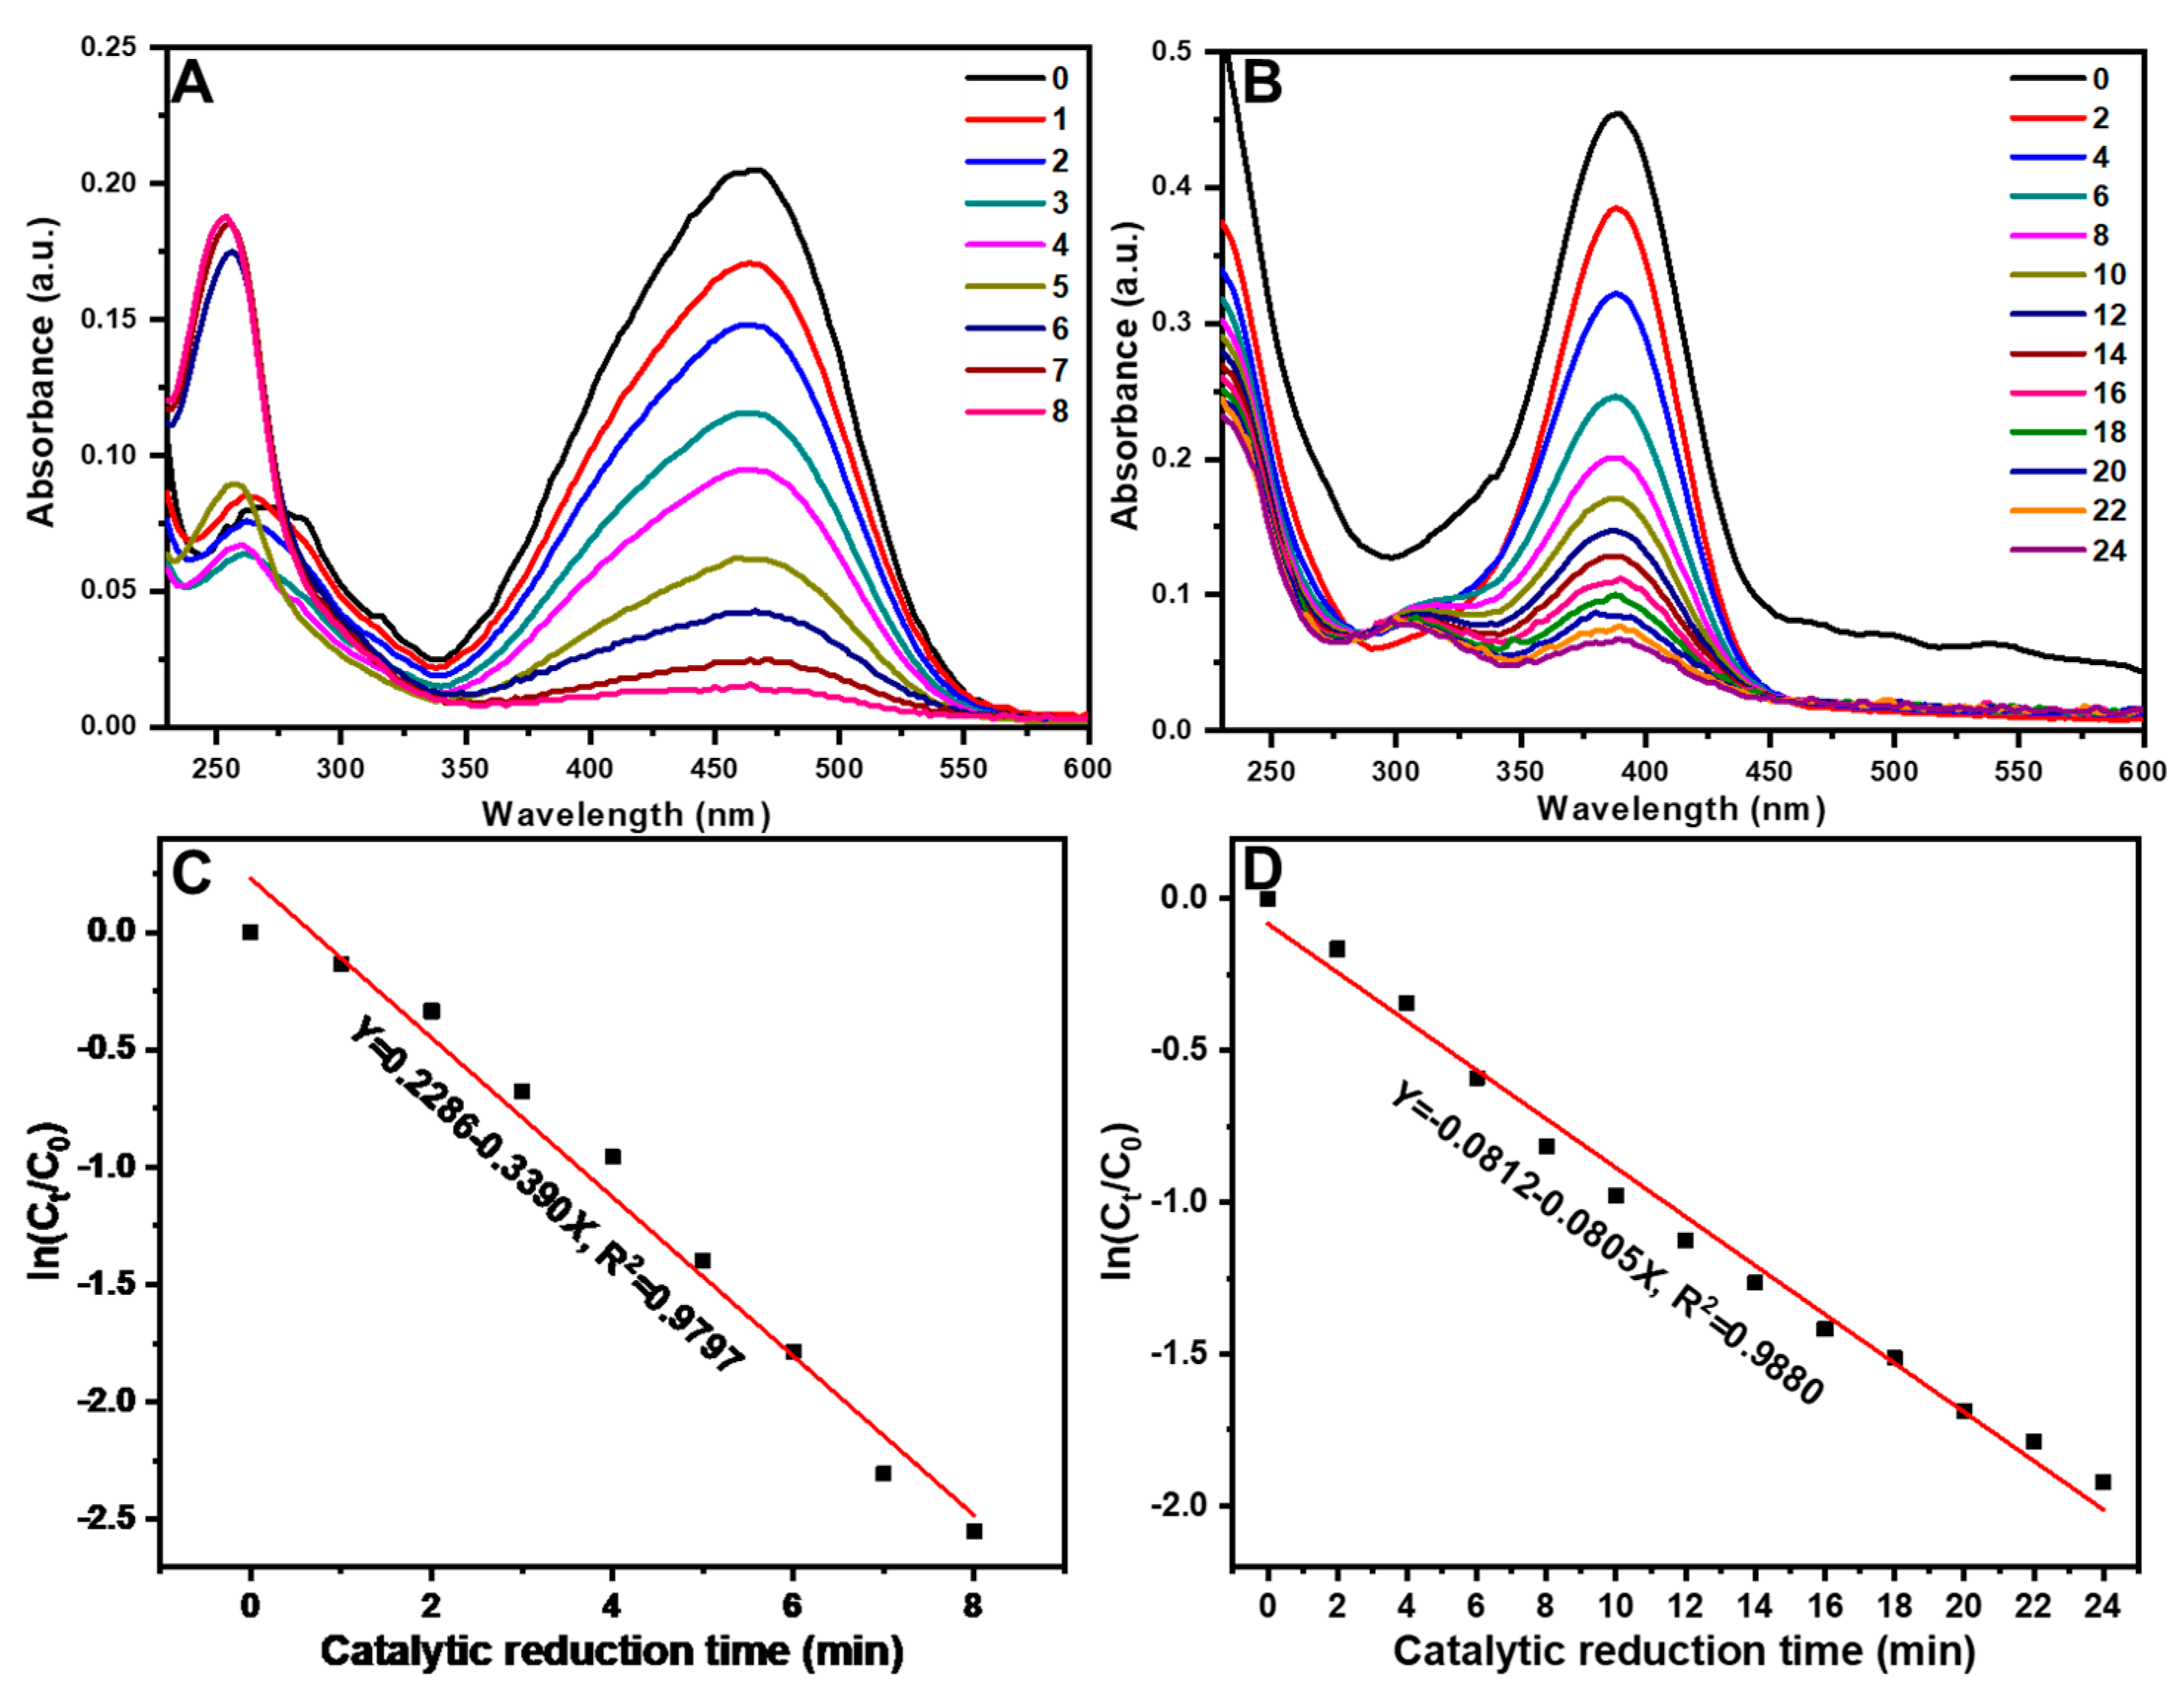
3.2. Catalytic performance analysis
4. Conclusions
Supplementary Materials
Author Contributions
Funding
Conflicts of Interest
References
- Lellis, B.; Fávaro-Polonio, C.Z.; Pamphile, J.A.; Polonio, J.C. Effects of Textile Dyes on Health and the Environment and Bioremediation Potential of Living Organisms. Biotechnol. Res. Innov. 2019, 3, 275–290. [Google Scholar] [CrossRef]
- Hassan, M.M.; Carr, C.M. A Critical Review on Recent Advancements of the Removal of Reactive Dyes from Adsorbents, Dyehouse Effluent by Ion-Exchange. Chemosphere 2018, 209, 201–219. [Google Scholar] [CrossRef]
- Corma, A.; Serna, P. Chemoselective hydrogenation of nitro compounds with supported gold catalysts. Science 2006, 313, 332–334. [Google Scholar] [CrossRef]
- Sekler, M.S.; Levi, Y.; Polyak, B.; Novoa, A.; Dunlop, P.S.M.; Byrne, J.A.; Marks, R.S. Monitoring genotoxicity during the photocatalytic degradation of p-nitrophenol. J. Appl. Toxicol. 2004, 24, 395–400. [Google Scholar] [CrossRef]
- Song, J.J.; Huang, Z.F.; Pan, L.; Li, K.; Zhang, X.W.; Wang, L.; Zou, J.J. Review on selective hydrogenation of nitroarene by catalytic, photocatalytic and electrocatalytic reactions. Appl. Catal. B-Environ. 2018, 227, 386–408. [Google Scholar] [CrossRef]
- Eichenbaum, G.; Johnson, M.; Kirkland, D.; O’Neill, P.; Stellar, S.; Bielawne, J.; DeWire, R.; Areia, D.; Bryant, S.; Weiner, S.; Desai-Krieger, D.; Guzzie-Peck, P.; Evans, D.C.; Tonelli, A. Assessment of the genotoxic and carcinogenic risks of pnitrophenol when it is present as an impurity in a drug product. Regul. Toxicol. Pharmacol. 2009, 55, 33–42. [Google Scholar] [CrossRef]
- Liu, R.; Mahurin, S.M.; Li, C.; Unocic, R.R.; Idrobo, J.C.; Gao, H.; Pennycook, S.J.; Dai, S. ; Dopamine as a Carbon Source: The Controlled Synthesis of Hollow Carbon Spheres and Yolk-Structured Carbon Nanocomposites. Angew. Chem. Int. Ed. 2011, 50, 6799–6802. [Google Scholar] [CrossRef] [PubMed]
- Zhou, M.; Wei, X.; Zhang, X.; Gao, X.; Wang, X.; Wu, W.D.; Selomulya, C.; Wu, Z. Uniform mesoporous carbon hollow microspheres imparted with surface-enriched gold nanoparticles enable fast flow adsorption and catalytic reduction of nitrophenols. J. Colloid Interface Sci. 2019, 537, 112–122. [Google Scholar] [CrossRef] [PubMed]
- Ghiat, I.; Saadi, A.; Bachari, K.; Coville, N. J.; Boudjemaa, A. Catalytic reduction of 4-nitrophenol to 4-aminophenol over Ni/SiO2 catalyst made from reduced SiO2@NiPhy. Res. Chem. Intermediat. 2023, 49, 4349–4365. [Google Scholar] [CrossRef]
- Huang, S.C.; You, Z.X.; Jhang, S.M.; Lin, C.Y. Facile electrochemical preparation of NiFeP submicron-spheres as an efficient electrocatalyst for the electrochemical hydrogenation of 4-nitrophenol at neutral pH. J. Environ.l Chem. Eng. 2022, 10, 108882. [Google Scholar] [CrossRef]
- Suchomel, P.; Kvitek, L.; Prucek, R.; Panacek, A.; Halder, A.; Vajda, S.; Zboril, R. Simple size-controlled synthesis of Au nanoparticles and their size-dependent catalytic activity. Sci. Rep. 2018, 8, 4589. [Google Scholar] [CrossRef] [PubMed]
- Chen, X.; Cai, Z.; Chen, X.; Oyama, M. AuPd bimetallic nanoparticles decorated on graphene nanosheets: Their green synthesis, growth mechanism and high catalytic ability in 4-nitrophenol reduction. J. Mater. Chem. A 2014, 2, 5668–5674. [Google Scholar] [CrossRef]
- Teimouri, M.; Khosravi-Nejad, F.; Attar, F.; Saboury, A.A.; Kostova, I.; Benelli, G.; Falahati, M. Gold nanoparticles fabrication by plant extracts: Synthesis, characterization, degradation of 4-nitrophenol from industrial wastewater, and insecticidal activity—A review. J. Clean. Prod. 2018, 184, 740–753. [Google Scholar] [CrossRef]
- Feng, L.; Gao, G.; Huang, P.; Wang, K.; Wang, X.; Luo, T.; Zhang, C. Optical properties and catalytic activity of bimetallic gold-silver nanoparticles. Nano Biomed. Eng. 2010, 2, 258–267. [Google Scholar] [CrossRef]
- Gregory, J.W.; Gong, Y.; Han, Y.; Huband, S.; Walton, R.I.; Hessel, V.; Rebrov, E.V. Au/TiO2 coatings for photocatalytic reduction of 4-nitrophenol to 4-aminophenol with green light. Catal. Today 2023, 418, 114145. [Google Scholar] [CrossRef]
- Shang, Z.; Yang, Z.; Xiao, Y.; Wang, X. Ordered mesoporous Ag/CeO2 nanocrystalline via silica-templated solution combustion for enhanced photocatalytic performance. Colloid. Surface. A 2020, 604, 125301. [Google Scholar] [CrossRef]
- Shaik, M.R.; Adil, S.F.; Kuniyil, M.; Sharif, M.; Al-Warthan, A.; Siddiqui, M.R.H.; Ali, M. I.; Tahir, M.N.; Khan, M. Facile Sonochemical Preparation of Au-ZrO2 Nanocatalyst for the Catalytic Reduction of 4-Nitrophenol. Appl. Sci. 2020, 10, 503. [Google Scholar] [CrossRef]
- Ðurasović, I.; Štefanić, G.; Dražić, G.; Peter, R.; Klencsár, Z.; Marciuš, M.; Jurkin, T.; Ivanda, M.; Stichleutner, S.; Gotić, M. Microwave-Assisted Synthesis of Pt/SnO2 for the Catalytic Reduction of 4-Nitrophenol to 4-Aminophenol. Nanomaterials 2023, 13, 2481. [Google Scholar] [CrossRef]
- Li, F.; Liu, Y.; Ma, T.; Xu, D.; Li, X.; Gong, G. Catalysis of the hydro-dechlorination of 4-chlorophenol and the reduction of 4-nitrophenol by Pd/Fe3O4@C. New J. Chem. 2015, 39, 6474–6481. [Google Scholar] [CrossRef]
- Chen, L.; Liu, M.; Zhao, Y.; Kou, Q.; Wang, Y.; Liu, Y.; Zhang, Y.; Yang, J.; Jung, Y.M. Enhanced catalyst activity by decorating of Au on Ag@Cu2O nanoshell. Appl. Surf. Sci. 2018, 435, 72–78. [Google Scholar] [CrossRef]
- Chen, L.; Guo, S.; Dong, L.; Zhang, F.; Gao, R.; Liu, Y.; Wang, Y.; Zhang, Y. SERS effect on the presence and absence of rGO for Ag@Cu2O core-shell. Mat. Sci. Semicon. Proc. 2019, 91, 290–295. [Google Scholar] [CrossRef]
- Xu, L.; Zhang, F.; Song, X.; Yin, Z.; Bu, Y. Construction of reduced graphene oxide-supported Ag-Cu2O composites with hierarchical structures for enhanced photocatalytic activities and recyclability. J. Mater. Chem. A 2015, 3, 5923–5933. [Google Scholar] [CrossRef]
- Novoselov, K.S.; Geim, A.K.; Morozov, S.V. Electric field effect in atomically thin carbon films. Science 2004, 306, 666–669. [Google Scholar] [CrossRef] [PubMed]
- Yury, G. Transition metal carbides go 2D Nature Nanotechnology. Nat. Mater. 2015, 14, 1079–1080. [Google Scholar]
- Guo, S.J.; Dong, S.J. Graphene nanosheet: synthesis, molecular engineering, thin film, hybrids, and energy and analytical applications, Chem. Soc. Rev. 2011, 40, 2644–2672. [Google Scholar] [CrossRef] [PubMed]
- Huang, X.; Qi, X.Y.; Boey, F.; Zhang, H. Graphene-based composites. Chem. Soc. Rev. 2012, 41, 666–686. [Google Scholar] [CrossRef] [PubMed]
- Xiong, X.; Li, L.; Chen, J.; Zhang, S.; Wang, L.; Dou, S. Facile synthesis of highly efficient one-dimensional plasmonic photocatalysts through Ag@Cu2O core-shell hetero-nanowires. ACS Appl. Mater. Interfaces 2014, 6, 15716–15725. [Google Scholar] [CrossRef]
- Guo, S.; Wang, Y.; Zhang, F.; Gao, R.; Liu, M.; Dong, L.; Liu, Y.; Zhang, Y. Chen, L. In Situ Synthesis of Ag@Cu2O-rGO Architecture for Strong Light-Matter Interactions. Nanomaterials 2018, 8, 444. [Google Scholar] [CrossRef]
- Lu, Q.; Wei, Z.; Li, C.; Ma, J.; Li, L. Photocatalytic degradation of methyl orange by noble metal Ag modified semiconductor Zn2SnO4. Mat. Sci. Semicon. Proc. 2022, 138, 106290. [Google Scholar] [CrossRef]
- Kayser, E.G.; Burlinson, N.E. Migration of explosives in soil: analysis of rdx, tnt, and tetryl from a 14c lysimeter study. J. Energy. Mater. 1988, 6, 45–71. [Google Scholar] [CrossRef]
Disclaimer/Publisher’s Note: The statements, opinions and data contained in all publications are solely those of the individual author(s) and contributor(s) and not of MDPI and/or the editor(s). MDPI and/or the editor(s) disclaim responsibility for any injury to people or property resulting from any ideas, methods, instructions or products referred to in the content. |
© 2023 by the authors. Licensee MDPI, Basel, Switzerland. This article is an open access article distributed under the terms and conditions of the Creative Commons Attribution (CC BY) license (http://creativecommons.org/licenses/by/4.0/).


