
Submitted:
29 November 2023
Posted:
30 November 2023
You are already at the latest version
Abstract
The sustainable management of water scarcity is a global crucial issue. Germany has es- tablished efficient water management systems, but the agricultural sector still struggles with water scarcity as the demand surpasses the available water supply. The primary aim is to establish a framework for making water accessible for irrigation and additional use on households through the effective utilization of recycled water from wastewater treatment facilities. The research inquiries are focused on evaluating the changes in the agricultural irrigation model in CROPWAT, determining the spatial distribution of zonal severity, estimating the capacity of urban roof catchments, and evaluating the reduction volume of efficient water required from the existing wastewater treatment plant supply. According to the findings, the annual amount of water required for agriculture in the designated study location is approximately 2.9 million m3. Although there is no initial need for irrigation water, yet the demand for irrigation water increases during the development, active growth, and mature stages of maize, winter wheat, and wine grapes, reaching around 189mm, 225mm, and 62mm, respectively. According to our observation, the annual water supply in Weinstadt is around 4 million m3. On the other hand, the amount of water calculated from urban roof rainfall is estimated 0.8 million m3, which is considered valuable from an economic standpoint. This economically efficient volume of water would reduce the current treated water supply passes an opportunity for enhanced agricultural irrigation
Keywords:
Water Scarcity
; Irrigation water
; Roof Catchment
; CROPWAT
; Germany
1. Introduction
Water scarcity is growing as a concerning issue in many regions which makes water a vital resource that must be managed sustainably. The United Nations Sustainable Development Goal 6 “Clean Water and Sanitation” is dedicated to water and aims to significantly increase global water recycling and safe reuse by 2030. In 2012, the European Union recognized the potentiality of water reuse as a solution to the problems of water scarcity and drought [1].
Germany is one of the countries in Europe with a high-water availability compared to other European countries surrounded by is surrounded by oceans and seas with numerous rivers and lakes running through it. Agriculture still has greater effects on water bodies through substance emissions and alterations to their physical structure. The use of agricultural fertilizers leads to excessive nutrient discharges into water bodies and contributes significantly to nitrate pollution and over-enrichment of nutrients (eutrophication) in rivers, lakes, and seas [2]. Due to this reason, Germany and other EU countries have taken outstanding advances in managing their hydraulic resources to meet the need of agriculture, industrial, and tourism sectors, as well as the needs of a rising population.
From June 2023 onwards, treated wastewater would be used for irrigation purposes and excess water would be supplied to the households. On this regard, a new regulation on minimum water requirements will be imposed to encourage water use in agricultural irrigation and reduce the water scarcity brought by climate change in the European Union and enable the deployment of water reclamation while promoting the circular economy, protecting the safety of human health and the environment as well [3].
Germany has several large-scale water treatment plants that provide clean and safe drinking water to its residents. Undoubtedly, traditional wastewater treatment systems have improved the quality of life in urban areas and lowered environmental stress [4]. For better reusability of water, the most considerable concern is to know the potentiality of wastewater treatment plant and also consider the urban roof water harvesting for how it added economic value to the water users[5]. Nevertheless, with the potential for recycling wastewater and the nutrients it contains, the goal of improving sustainable resource management in wastewater treatment has become increasingly important [4].
Different prior research provided a detailed study on water availability, highlighting the depiction of irrigation water requirements, urban water harvesting, and the potential of wastewater treatment plants in assessing water stress scenarios. For addressing the water scarcity issue, a GIS-based study was conducted to determine the potential volume of treated wastewater and afterwards water quality standardized for suitable irrigation [6]. Jia et al. [7] focused that the application of GIS techniques to assess the potential of wastewater reclaim in different land use scenarios in the urban areas of Beijing. Ramirez et al. [8] employed the water-energy-food Nexus approach to analyze the impact of capturing, treating, and repurposing wastewater for irrigation. Jaramillo and Restrepo [9] represented a discussion on positive and negative impacts of using treated wastewater and proposed “end of ripe” conventional solutions so that the irrigation purposes can be improved. To address this concern, Moseki et al. [10] utilized the CROPWAT model to determine the reference evapotranspiration rate (ETo), actual evapotranspiration (ETc), irrigation water requirements (IWR), and the effect of irrigation on yield. According to the study of Bilibio and Hensel [11], water scarcity situations in Germany were analyzed using the FAO-CROPWAT model to calculate effective precipitation, crop evapotranspiration, actual evapotranspiration, and water deficit from 2014 to 2016. Consequently, Surendran et al. [12] studied crop water requirement of different paddy variety by using CROPWAT model to estimate the climatic water balance and proposed projected water future demand for irrigation, industrial and domestic purposes. The crucial factor in designing irrigation systems is usually determining the effective rainfall to assess the amount of water that should be supplied through irrigation. Bokke and Shoro [13] compared various rainfall models using small-scale weather data and found that the USDA-SC method resulted in the lowest net irrigation water requirements in water-scarce regions, whereas the dependable rain method resulted in the highest net irrigation water requirements in water-sufficient region.
After estimation of IWR in CROPWAT some of the research articles demonstrated the geo-spatial distribution and some research took remote sensing techniques for analyzing the crop water demand. Feng et al. [14] applied spatial distribution techniques for planning and managing maize cultivation at various stages of development on irrigated farmlands. Al-Najar [15] demonstrated the Gaza Strip spatial distribution results of irrigation water needs for Citrus, Almonds, Date palm, and Grapes based on data from 8 weather stations. Bhardwaj et al. [16] observed the LULC analysis for evapotranspiration differentiation form the district level collected data. But Adamala et al. [17] assessed NDVI and LULC for calculation of crop evapotranspiration. Actual evapotranspiration (ETc) of wheat crop was estimated using the crop coefficient (Kc) that has relationship with the NDVI outcomes maps and the reference evapotranspiration (ETo). Machine Learning and Multicriteria Analysis used for the modeling and evaluation of reference evapotranspiration. The study of Kadkhodazadeh et al. [18] employed 6 machine learning techniques named multiple linear regression (MLR), multiple non-linear regression (MNLR), multivariate adaptive regression splines (MARS), model tree M5 (M5), random forest (RF) and least-squares boost (LSBoost). In urban areas, roofs are often the primary choice for collecting rainwater. Farreny et al. [19] established guidelines for selecting roofs that would optimize the amount and quality of collected rainwater on four types of roofs: clay tiles, metal sheet, polycarbonate plastic, and flat gravel. Maqsoom et al. [20] examined a Building Information Modeling (BIM) based approach considering the water scarcity that created a 3D building model based on the average roof area and population. The water demand in the nearby city of Ludwigsburg of this proposed study area was evaluated using a method that can precisely predict the pressure on local water resources in Germany on a single building level and can also be scaled to a regional level while maintaining detail [21].
Therefore, the primary goal of this research is to create a context for the availability of water for irrigation and household use, estimating the potential of water recycling from wastewater treatment plants. Thus, it is necessary to gather the required factors, environmental derivers, and workflow for building wastewater reuse framework to fulfill the goals. The main research questions are as follows:
- What is the extent of agriculture irrigation water requirement (IWR) varied according to agro-climate variable in CROPWAT model in different crop life stages?
- How is the definition of urban roof catchment surface can yield the volume of water retaining capacity in each roof type?
- How to economically compensate the agriculture irrigation and current water supply from WWTP (wastewater treatment plant) by urban roof catchment harvesting capacity?
The following section has detailed the calculation of water requirements, including the collection and preparation of data, the use of the CROPWAT model to determine irrigation water requirements, the calculation of urban water requirements, and the estimation of economic value.
2. Materials and Methods
This research consists of several phases of water requirements calculation Figure A1. 1st phase described the datasets collection, preparation, and data types. 2nd phase described the data processing in CROPWAT and spatial integration for agriculture water requirements. In the 3rd phase represented urban water requirements analysis. 4th phase showed the estimation of economic value and visualizations.
2.1 Study Area
The study area is Weinstadt, a town in Baden Würrtemberg, Germany. Weinstadt means "wine city" is located in the Rems-Murr region with an area of 31.7 sq. km. As suggested by its name, Weinstadt is well renowned for its wineries and vineyards. By focusing on the biggest wine grapes production area in the south region and considering the other agriculture crop plantation such as maize, winter wheat etc., the rate of irrigation water usages has already soared and indeed of irrigation water has been required more. Since the goal of this study is to use additional water needed for irrigation in the form of recycled water from the local WWTP, if possible, the local wastewater treatment plant should also be considered. That’s why Weinstadt was chosen as the research area Figure 1.
2.2. Datasets
The most important complexity of this research is the collection and processing of different kinds of datasets. As this research is fully focused on the water requirements issue of Weinstadt Municipality of Baden-Württemberg, the authority of city planning office has provided the datasets containing urban point clouds, digital elevation model, digital landuse model, digital terrain model, true orthophotos, building level of details (LOD2)- City gml 2.0 (a file format for virtual 3D city model), ALKIS 2500 land parcel group datasets (ALKIS stands for Liegenschaftskatasterinformationssystem which contains the information about real state cadastre), WWTP yearly water yield and topographic maps. It is possible to set up predefined weather stations of Germany by using ClimWat 2.0 weather stations datasets. But those stations are very far away from each other. However, availability of the historic 30 years dataset and nearby distance of 5 cities are selected for manual weather stations for which the spatial analysis are being carried off. The main climate indicators are considered minimum and maximum temperatures, precipitations, humidity, average sunshine hours and wind speed for the city of Karlsruhe, Fellbach, Heilbronn, Aalen and Tübingen. Whereas temperature, humidity, rainfall, and sunshine hours are collected from the Climate-Data.org (https://en.climate-data.org/). Here all data sets are rendered from the European Centre for Medium-Range Weather Forecasts (ECMWF) data. These historic monthly climatic variables such as temperature, humidity, precipitation is collected between 1991 to 2021. Yet, sunshine hours are recorded from 1999-2019. Though the historic monthly wind speed was not available in the previous site, this dataset is collected from the Weatherspark.com (https://weatherspark.com/) for same previous cities. Waste Water Treatment Plant (Klärwerk Weinstadt) is one of the biggest water purification plants in the Stuttgart region. This WWTP has a yearly average volume of water 4000,000 m3 retreated. In Weinstadt three agricultural crops i.e. winter wheat, wine grapes and maize are frequently practiced but other crop plantation is less practiced. According to the soil map BGR geoportal (https://www.bgr.bund.de/) of Germany, Stuttgart lies in the region of brown soil with sandy clay rocks. Rinaldi et al. [22] proposed that red wine production is better on Loam Soils. So, Medium soil texture like loam soil is considered for agriculture water requirement calculation for this research.
2.3. Determination of Agriculture Water Requirements
2.3.1. Reference Evapotranspiration
The amount of solar radiation that reaches the topsoil surface is the key factor affecting how much moisture evaporates from cropped soil. When the crop is very young, soil evaporation accounts for the majority of water loss, but after the crop is mature and completely covers the soil and transpiration takes over as the primary mechanism [23]. CROPWAT Model calculates the crop water requirements and developed the irrigation schedule which will help to proper simulation of water supply. So, CROPWAT windows used the FAO Penman-Monteith method for reference evapotranspiration and radiation with the help of measured weather data [equation 1] [14,24].
Where, ETo = Reference evapotranspiration; Rn = Net Radiation (MJ/m2/day); G = Soil heat flux density (MJ/m2/day); T = Mean daily air temperature at 2 m height (°C); u2 = Wind speed at 2 m height (m/s); (es – ea) = Vapor pressure deficit of the air (kPa); ∆ = Slope of the vapor pressure (kPa °C-1); γ = Psychometric constant (kPa °C-1)
2.3.2. Effective Rainfall
The crops may receive this water from irrigation, rainfall, or a mix of irrigation and precipitation. Though there is some rainfall, but not enough to meet the crop’s water demands. Effective rainfall is the portion of precipitation that is retained in the soil profile and aids in crop development [24]. In this study, dependable rain (FAO/AGLW Formula) method is employed [equation 2] because Bokke and Shoro [13] is proposed that dependable rain method is preferable for the water sufficient area and implemented for small scale irrigation as well.
Where, P = Precipitation; Peff = Effective Precipitation in in mm/month
2.3.3. Irrigation Water Requirement (IWR)
The irrigation water requirement (IWR) is the quantity of water required to meet the crop’s water needs following any significant rainfall, for a disease-free crop growing in substantial fields with distortive soil and water conditions and with sufficient nutrients [25]. So, the final irrigation water requirement is performed by calculating reference evapotranspiration (ETo), actual evapotranspiration (ETc). Afterwards, ETc combined with the decade of crop lifecycle for final estimation of irrigation water requirement of every life stage of crop. This process is a sequential workflow in CROPWAT. [Equation 3] used to determine the actual evapotranspiration, and it is represented by the rate of ETc in mm/day.
Where, ETc = Crop water requirements; Kc = Crop coefficient; ETo = Reference evapotranspiration
2.3.3. Spatial Distribution of Agricultural Water Requirements
The spatial distribution of winter wheat, wine grapes and maize are performed in two stages. Mostly used methods that build and maintain digital elevation model (DEM-replicates the terrain surface of earth landscape[26]), use the Inverse Distance Weighted (IDW) approach which demonstrated in this research for the spatial distribution of crop irrigation water requirements (IWR). the IDW sittings for this study are output cell size 5m, power 2, search radius “variable”, and cell size projection method is also selected as preserve resolution. The whole process is performed in the ArcGIS Pro mapping environment. In the first stage, DEM and GIS assisted method is deployed to calculate the spatial distribution of ETo, ETc, effective rainfall [14]. Again, with the same interpolation settings, IDW performed based on monthly water requirement for crop cultivation stage like initial, development, middle, late and whole crop growth water. Standard symbology followed the highest values in red color; medium values identified in yellow color and lowest values are in deep sky-blue with the 10 classes considered for proper IWR visualization. In the second stage, it is very certain that knowing of specific agriculture area is for each crop. According to the test ALKIS dataset of Baden-Württemberg clearly defined the ground space and cultivable lands are considered as Agricultural lands. So, agriculture area for winter wheat and maize are considered green open spaces and current cultivation lands. But separately, there is the indication of wine garden areas. In line with the cultivation practices, it is expected that 70% areas are defined as the winter wheats area because this crop has the mass production and one of the major crops in Germany than maize. On the contrary, 30% of the area is covered by maize. This estimated area defines the spatial distribution of irrigation water demand with the calculated IWR from CROPWAT model.
2.3.4. Agriculture Water Requirements Zonal Model
The zonal model is made to describe which area has more water required and accordingly less water required area for agriculture irrigation. ArcGIS model builder tool is used for this water variability processing in different zones of Weinstadt Figure A2. The primary variable is the land parcel of the agriculture area of cultivation land and wine grounds. From the entire irrigation water requirements (IWR) interpolation obtained the crop water requirements values which would be necessary to extract for analysis. Afterwards, data normalization was performed for getting the dataset value of water requirement in a simplified form of 0 to 5 scale [Equation 4]. Moreover, 0 is the lower water required area and continuously, 5 indicated the higher water required area. So, a weighted parameter index utilized between winter wheat area and maize area because same area chosen for the both crops so that all the corps water requirement has lies in specific percentile in between 100%[27]. Finally merged all the outputs corresponding to land parcels with the purpose of effectively symbolizing the vulnerable zonal area of Weinstadt according to the zonal severity of water required situations.
Where, Zi = Normalized attribute; X = Value attribute; Xmin = Minimum of value attribute; Xmax = Maximum of value attribute; SR = Severity scale ranges (0 to 5); Weighted index (cultivable lands) = 70% *[Winter Wheat] + 30% *[Maize]
2.4. Urban Roof Water Harvesting
2.4.1. Roof Type Definition
For this analysis, monthly average rainfall datasets were used as the primary water source. Urban roof water harvesting technique is taken under the building information management (BIM) process. In the building level of details dataset, ten types of roofs are identified. The roof types are basically defined by the roof code(standardized roof id by Open Geospatial Consortium) that each roof has Figure 2 [28]. These datasets are processed in ArcGIS pro workspace. Actually, data interoperability plugin is used by using the quick import tools which can read the 3D building surface and can be also worked in attribute table.
2.4.2. Urban Water Catchment Area
Roof area is the major element to roof water harvesting in every roof type. However, some buildings have flats, and some have slopped roofs. To calculate the slopped area, in this study used the slopped area calculation by area calculator tool in FME Workbench and write as the .csv format to be joined with CityGML 2.0 building id. Therefore, the following Figure 3 and Figure 4 shows the FME workbench working schema.
2.4.3. Roof Runoff Coefficient
Roof runoff coefficient (RC) is the vital factor to calculate the roof water harvesting volume. The runoff coefficient is a dimensionless figure that calculates the amount of rainfall that actually becomes runoff after accounting for leakage, spills, soaking of the catchment surface, and evaporation losses. To ensure that water collection is as effective as possible, RC must be considered while choosing roof types that have only been evaluated form the CityGML datasets and additional roofs type i.e., green roofs are not taken under analysis. The runoff coefficient is divided into two types. One, slopping roofs which can be concrete/asphalt, metal and aluminium. Two, Flat roof with bituminous, gravel and level cement. In Weinstadt area, most of the flat roofs are covered with gravel and sloped roofs are made with concrete/asphalt. Table 1 has the description of runoff coefficient.
2.4.4. Catchment Water Volume
Urban roof catchment water volume calculation is the method which will serve the water shortage situations and have economic benefits as well [28]. For this progression, monthly average rainfall, surface catchment area and the run runoff coefficient area had the relationship to operate for main water volume calculation [Equation 5.
Where, P = Average precipitation (mm); A = Roof catchment area (m2); RC = Runoff Coefficient
2.5. Economic Value Assessment
To summarize the final analysis, an economic value assessment has been made which is the important socio-economic factors in the research. This value assessment is similar to the beneficial part for the municipality which is done on the basis of reduction for current water supply so that the deducted amount of water can be used for future extreme situations. This process was made by subtracting between the current volume of water supply from the wastewater treatment plant and calculated harvested water from different roof types. The following [Equation 6] shows the economic value estimation.
Where, EV = Economic Value; Ws = Water supply from WWTP; Whp = Harvested water potential
2.6. Visualization Workflow
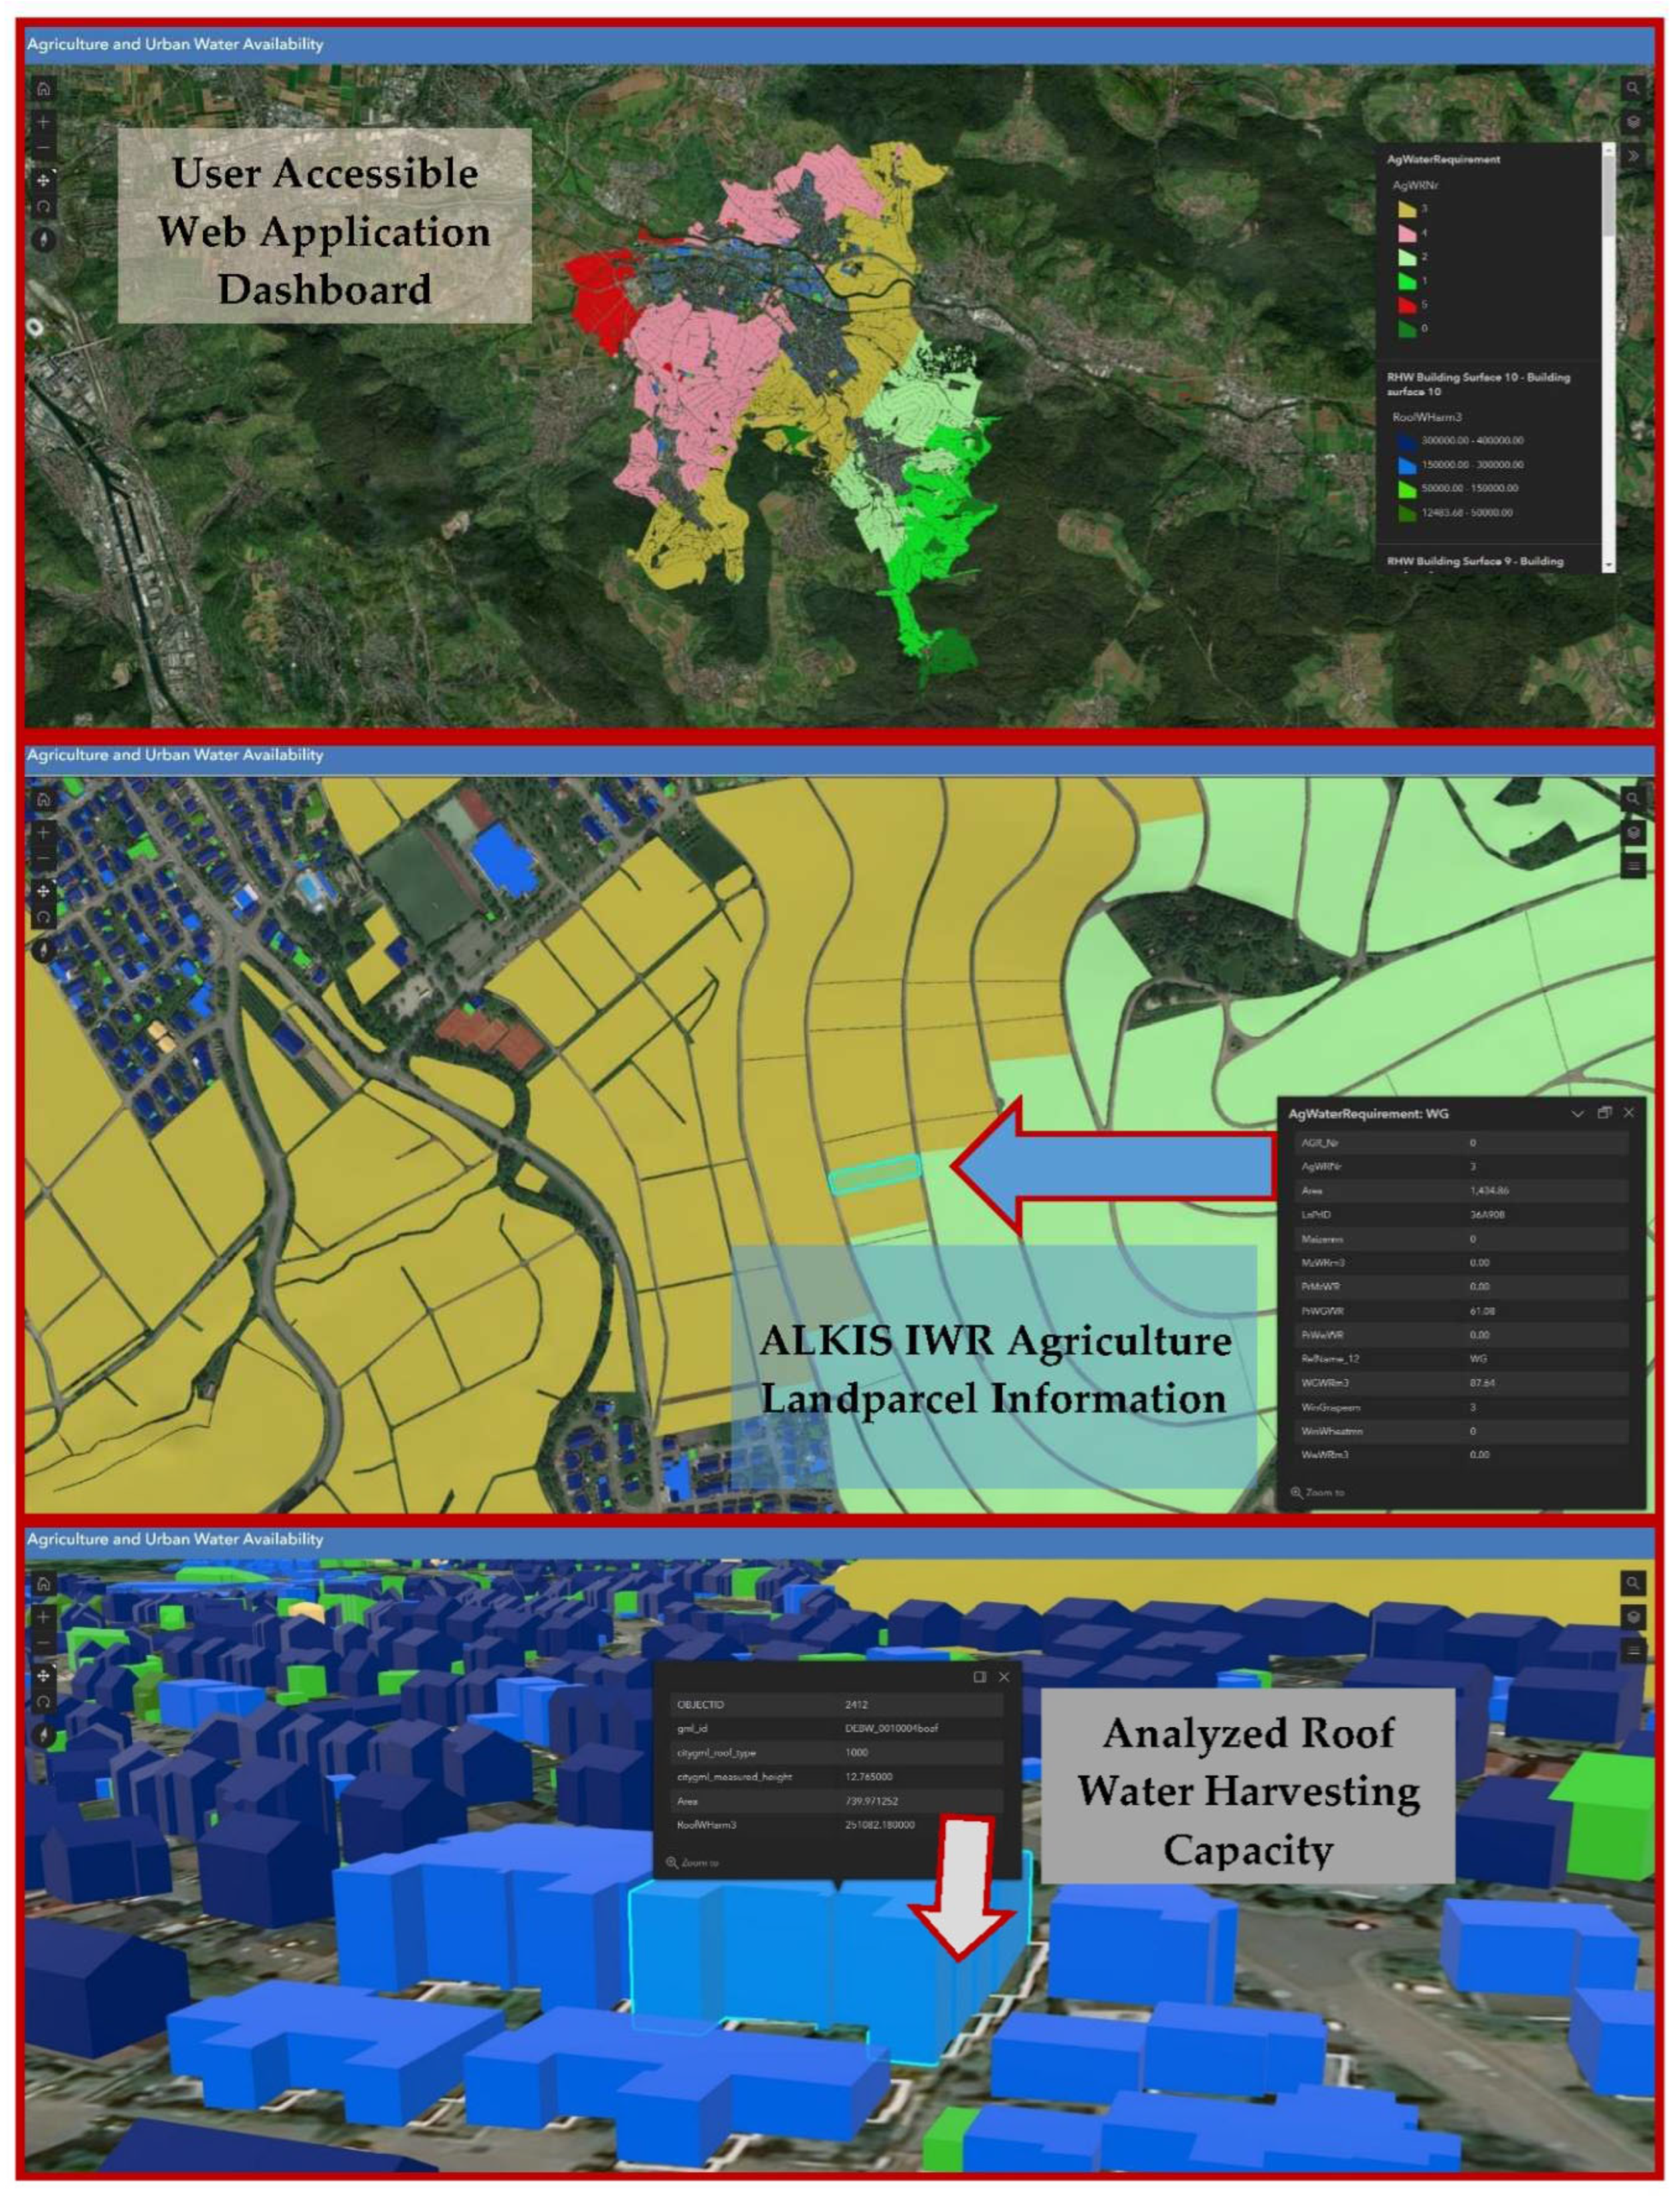
Visualization is very vital to show the outcomes from the agriculture and urban water demand. All the layers are used in the analysis are in 2D and 3D formats. So, ArcGIS visualization API is an appropriate platform where all 2D & 3D layers deployed as contents. ESRI shapefiles are generally uploaded. But cityGML 3D building objects are converted into scene layer packages (.slpk) file formats with the purpose of it is readable to ArcGIS online application. An application dashboard is customized with viewer controls, layer appearance and legends. All the parcels of 2D layers of agriculture water demand and 3D buildings of rainfall harvesting showed the pop-up tables constructed on their attribute values Figure 4 and Figure A2.
3. Agricultural Water Requirement Analysis
Initially the described results showed the agricultural IWR analysis for CROPWAT model development outputs and several stages of crop development in various stages. The following stage is the urban roof water harvesting in the perspective of monthly rainfall. Afterwards there was included a description of how economic values were added by considering the present water supply.
3.1. Agriculture Water Requirements
3.1.1. Spatial Distribution of Calculated CROPWAT Model Parameters
The spatial distribution in Weinstadt for water deficit parameters, i.e., ETo (reference evapotranspiration), effective rainfall and ETc (actual evapotranspiration) by which the IWR is defined. The spatial distribution considered the empirical distributions of calculated CROPWAT model parameters. After performing the DEM based calculations of spatial distribution procession, the ranges of reference evapotranspiration values lie between 1.780 to 1.788 Figure 5a. The highest value for crop water requirements (actual evapotranspiration) is 1109.98 mm and the lowest value is 1104.9mm Figure 5b. The effective rainfall value that is calculated from CROPWAT model for Weinstadt ranged between 419.93 mm to 429.66mm yearly Figure 5c.
3.1.1. Irrigation Water Requirements (IWR) for Maize
Weinstadt Irrigation water demand for the maize is estimated from the CROPWAT model. Figure 6 showed the clipped IWR values of Maize on active growth stage, development stage, mature stage, and whole stages after the spatially distributed from 5 cities. Initially, no irrigation water was required in the month of May. The variation of irrigation water requirements in development stage is very less Figure 6a. The average IWR value is 27.6mm in June. In the active growth stage of maize, the irrigation water variation is very smaller amount in the month of July Figure 6b. Among the 10 classes of the maize active growth stage, higher and lower values range between 113.291 mm to 115.205 mm. In the mature stage (started mid of August and ended in September), the total values ranged between 47.09 mm to 48.30 mm Figure 6c. Eventually, a total of 187.78 mm to 191.3 mm water is required for the maize in Weinstadt Figure 6d.
3.1.2. Irrigation Water Requirements (IWR) for Wine Grapes
Spatial distribution of wine grapes IWR has three stages namely- active growth stage, mature stage, and whole period (cultivation to harvesting) which is shown in Figure 7. Primarily, no water is required in initial and development stages from August to 1st week of February. Because enough water stayed at the ground surface. In active growth stage started from mid-term of February and lasts upto the late mid-term of June. On that period the volume of irrigation water requirement lies between 39.57 mm to 41.67 mm Figure 7a. In mature stage (late of June to July), the ranges of IWR are 21.17 mm to 22.09 mm Figure 7b. So, the total irrigation required water for wine grapes in Weinstadt is about 59.37 mm 62.47 mm Figure 7c.
3.1.3. Irrigation Water Requirements (IWR) for Winter Wheat
The total ranching period of winter wheat is an entire year of time which started in September and lasts upto August. The spatial distribution of winter wheat irrigation water requirement is taken under the four stages i.e., initial, development, active growth and fully matured stage that is shown in Figure 8. In the initial stage (beginning of September) and early stage of development (till the end of February), no water is needed for irrigation because of availability of enough precipitation. Therefore, the IWR in late development stage ranged between 23.16 mm to 27.03 mm form march to mid-term of April Figure 8a. The active growth started immediately after the development stage, which lasted till July and the value of IWR rages between 150.65 mm to 153.32 mm Figure 8b. The mature stage irrigation water requirements values are lies between 48.88 mm to 50 mm in the month of July and August Figure 8c. Finally in the whole period of winter wheat cultivation, the total value of IWR ranges between 221.03 mm to 225.60 mm for Weinstadt Figure 8d.
3.1.4. Agriculture Irrigation Water Requirements
Figure 9 has portrayed the varied stages of IWR for maize, wine grape and winter wheat. Though there was no initial IWR but only wine grapes had no IWR in the development stage and all the 3 crops have higher water requirements in mature stages. In fact, winter wheat and maize required more water compared to wine grapes. The final mature stage has much less amount of water required for all crops.
3.1.4. Zonal Severity for IWR
Figure 10a–c showed the zonal severity which generally described the required water of irrigation with spatial merging with CROPWAT model outputs. The western part Endersbach of Weinstadt has extremely high irrigation water needed for crop cultivation. But western parts of Grossherppach and Struempfelbach has moderate IWR severity. Although the eastern part of Struempfelbach, Beutelsbach, Schnait have medium and lower irrigation water requirements. Because the eastern parts have forest area that’s why irrigation water requirement is very marginal.
By focusing on the zonal severity area, the total volume of required water has been calculated Table 2. So, maize total area assumed here 3,750,000 sq. meter and calculated IWR 708,750 m3. Similarly, winter wheat is having area of 8,750,000 sq. meter with total required water yearly 195,3875 m3. Wine grapes has 286,324 m3 of required water for the area 4,700,000 sq. meter. Definitively, the total volume of agriculture water required 2,948,949 m3 in Weinstadt municipality.
3.2. Urban Rainfall Water Harvesting
The urban water harvesting from rainfall is mainly carried out by calculation of roof area. There are other factors i.e., runoff coefficient, average rainfall. Figure 11 showed the monthly chart and detailed harvested water volume from different roof types. In flat roof yearly rainwater harvested is one of highest roof types where the value is about 251082.18 m3. The pent roof has a harvested water volume of 57,572.51 m3. But pitched roof type collected the highest volume 389,530.87 m3 water. The roof types like hipped, half-hipped, shed, mixed and miscellaneous have retained the volume of water 12,483.68 m3; 3,653.06 m3; 6,130.78 m3; 2,2268.99 m3 and 121,148.78 m3. In contrast, manshard and pyramid roof type has very little amount of rainwater harvested (214.76 m3 & 53. 43 m3). Eventually total amount of 864139.07 m3 harvested in different roof types in Weinstadt.
Figure 12 showed the different building groups based on higher to lower water harvesting capacity. Roof category- half hipper, mansard, pyramid and shed (3300, 3400, 3500 and 3800) has very lower rainwater harvesting capacity because they are very less in numbers and in areas as well Figure 12a. But Roof type like pent, hipped, mixed and other types (2100, 3200, 5000, 9999) has the more water harvesting category Figure 12b,c. But the highest group for rainwater harvesting roof types are the pitched roof (3100) Figure 12e. Those buildings have pitched roofs are in residential areas as well as greater in areas. However, the flat roof types (1000) also have more capacity compared to other roofs but no other than pitched roofs Figure 12d.
3.3. Economic Impact for Water Efficiency
In this research, economic value addition is taken under to estimate the potential reduced water that would be saved or used for future use purposes. Though this measured amount of water is not possible to calculate in the factual currency value because some factors including water quality, ecological value and sustainable management etc. are also interrelated. However, the output of total yearly rainfall water harvested from different roof types is about 864,139 m3. But the total supply chain volume is about 3,831,806 m3 in the year 2022. After comparison between the datasets, the reduced usage amount of potential water is about 2,967,667 m3. So, from this perspective, the rainfall water harvested amount can be potential water amount of economic values calculated for Weinstadt Municipality. Figure 13 and Table A1 showed the total monthly variability of different economic value induced parameters i.e., urban catchment water volume, WWTP water volume and economic valued water. All the three parameters are correlated to each other. However, the month of April has the highest rainfall as well as the urban roof harvested water quantity is higher in 2022, the precipitation and water supply from the wastewater treatment plant is also greater. That’s why the potential reduced water volume is also higher. Simultaneously, the other months- September, October, November have a higher water supply from wastewater treatment plant but September to February has higher declining amount of water would be saved because of urban rainfall water harvesting.
4. Discussion
The agricultural irrigation water demand is very important to partially estimate the current water scarcity situation. To calculate the exact irrigation water requirement in the selected study area Weinstadt, empirical CROPWAT model is employed for different crop types. In the processing of stages, the reference evapotranspiration, effective rainfall, crop water requirements and final irrigation water requirements are measured for every specific crop Figure 5. Afterward, with the results of IWR for specific crops like winter wheat, maize and wine grapes has been spatially distributed by implementing DEM based approach (IDW) with the closest weather station datasets Figure 6, Figure 7 and Figure 8]. In this way the Agricultural water volume is calculated which is spatially modeled for zonal suitability by defining the multicriteria evaluation Figure 10. In this research, there is another objective describing the assessments of roof ability to retain water depending on the kinds of roofs achieved regarding the urban rainfall water harvesting. The most valuable element for this stage is to understand the CityGML roof categories and to calculate the roof exact area weather its slopped or flats. By knowing the various roof runoff coefficients, a very effective volume of harvested water calculated according to the different roof groups. Among all the roof categories, the residential areas have enormous quantities of runoff catchments and the larger areas calculated as well as the higher harvested volume of water identified Figure 12. Water scarcity can be eradicated by reliability of the economic analysis using urban rainfall harvesting. In addition, an economic a water economic value estimation by differentiating between the yearly current water supply to the municipality and measured harvested rainwater. The is best way to analyze the water supply assessment potentiality of wastewater treatment plant.
4.1. Comparative Overview with Related Research
Numerous researchers have obtained the agricultural water requirement, urban rainwater availability and economic values in a visualization platform separately. But this is very unusual to find out related research that is combined with all the above-mentioned 3 outputs. So, this study was carried out to overcome the real-life urban agriculture problem by doing similar, which helps to increase the potentiality of water use in an efficient way. The following Table 3 is the optimal description of water availability analysis with the other methodologies and outputs.
4.2. Influence on Agriculture and Urban Water Demand
From the modeling outcomes of CROPWAT and spatial distribution, it is understood that a huge amount of cubic meter water needed to irrigate in Weinstadt agriculture area. Most of the agricultural lands are in medium high to severe water required regions. Extremely severe and other classes of lands are very less in percentage. But still every land parcel has water demand. So, the Figure 14 showed the consequences of IWR Zonal severity. Most of the irrigation water sources in Germany are the natural sources. The main source of irrigation water is ground water. In Germany, approximately 77% of the irrigation water utilized is blue water (the proportion of irrigation water that is attributed to the imported agricultural crops) [2]. While 11% come from surface water and the public or private supply networks, spring water makes up the majority [31]. The amount of groundwater or water from rivers and lakes utilized in the production of a product is referred to as blue water. In the production of agricultural crops, this refers to the amount of extra irrigation that is used [2]. Between 80 and 150 millimeters (mm) or 425 and 800 million cubic meters (m3) of irrigation water are used annually [32]. According to the federal statistics office of Germany, 364 billion m3 water supplied including irrigation water from 1961 to 2020. Beyond this huge amount of water supply nationally, the present demand of irrigation water is estimated in this study. If the percentage of blue water supply assumed static confronting the irrigation demand, the harvested urban water can repay the rest of the amount or be used for future used when the water supply would be very low. Hence, with the calculated reduced potential amount of water will be distributed in urban areas. The rest of the economically valued water will be helped to recharge the ground water in the summer seasons. The outcomes of this study not only improve the subsequent water resources but also explicate the climate change impacts on water resource management.
5. Conclusions
To conclude, this research of agriculture and urban water availability is very significant for the whole regional system. All the three objectives are analyzed in a very scientific way to evaluate the ultimate benefit of encountering future water stress situations as a pilot study for all over Germany.
The agriculture water demand simulation in CROPWAT model evaluation showed that the irrigation water demand is very high in Weinstadt municipality all the year round 2022. The comparative parameter study of five weather stations like reference evapotranspiration, effective rainfall, crop water requirements and irrigation water requirements are very higher in the south-western region surrounding the study areas. In addition to, the results from spatial distribution between the crop studies are varied considerably based on their showing to harvesting periods. Wine Grapes needed a very lower amount of irrigation water because of elevated terrain cultivation and substantial amounts of water owing to the grounds. Regional temperatures are also one of the major factors which is suitable for wine yards in the study regions and due to this water evaporated much less in amounts than groundwater recharges. With regards, winter wheat has the highest irrigation water required crop and maize has the medium conditions in both of their active growth stages. The zonal severity of the IWR is also very effective for this region, because this analysis distinguishes the environmental effects. The western part of the study area is more like the urban regions, that’s why water demands in agricultural lands are very severe. Sequentially when the IWR severity had directed to eastern parts of the Weinstadt, lower sensitive areas are observed due to having the green areas edges with.
Another objective signifies the urban water potentiality calculation so that it can be compared with present sources of water supply reductions. By focusing on this idea, there are ten types of CityGML building model roof types observed. In this study, the primary source of urban water harvesting is considered rainfall. The calculated amount of harvested water has the variation. The pitched and flat roofs have the most harvested capacity linked to other types of roofs have medium or less harvesting capacity. This harvested volume of water is potential water which reduced the present supply volume from the WWTPs. This study referred to it as the economic value for the IWR. In addition to the outcomes from analysis, water framework development has been proposed for the municipality and users to be followed. Instead of doing so, a visualization application is developed so that the total idea of protecting future scarcity induced water availability disseminated easily to the user levels in a very interactive manner. Apart from these above-mentioned analyses, there are many crucial factors to be taken care of in the future such as database management and decision clarification. These are as follows:
- ◾
- A comparative analysis can be done using various methods in the CROPWAT model. In the depth of effective rainfall, other methods would be checked in CROPWAT models for the water sufficient region like Germany.
- ◾
- The snowfall water harvesting could add the more reduced amount of water which will improv the more proficient amount of potential economic water values.
- ◾
- The proper survey data on degree of sloping, roof materials and roof covering can have huge impacts on the urban water availability potentials.
Author Contributions
Sourav Karmaker: Conceptualization, Methodology, Visualizations, Writing- Original draft preparation; Sanchalita Bandyopadhyay: Conceptualization, Methodology, Analysis-article reviewed; Sonja Bauer: Conceptualization, Methodology, Analysis-article reviewed and Supervision.
Funding
This research received no external funding
Data Availability Statement
Not applicable
Acknowledgments
The work presented in this paper was developed in the master thesis project by Sourav Karmaker at Stuttgart University of Applied Sciences (HFT Stuttgart), Germany. The authors expressed their sincere gratitude to Weinstadt Town Planning Department and Klärwerk Weinstadt authority for providing the geodatasets and supporting this project.
Conflicts of Interest
Not applicable
Appendix A

Table A1.
Potential economic impact estimation.
| Months | Water Harvested in Urban Catchment m3 (Whp) | Water Supply from WWTP m3 (Ws) | Potential Reduced Water Use m3 (Ws-Whp) |
| January | 49,848 | 333,498 | 283,650 |
| February | 56,194 | 317,338 | 261,144 |
| March | 24,116 | 245,590 | 221,474 |
| April | 130,734 | 420,263 | 289,529 |
| May | 52,386 | 306,882 | 254,496 |
| June | 84,695 | 316,109 | 231,414 |
| July | 48,924 | 262,998 | 214,074 |
| August | 36,001 | 226,786 | 190,785 |
| September | 116,657 | 344,760 | 228,103 |
| October | 107,195 | 366,121 | 258,926 |
| November | 77,771 | 340,372 | 262,601 |
| December | 79,618 | 324,506 | 244,888 |
| Total | 864,139 | 3,831,806 | 2,967,667 |
Figure A1.
Proposed conceptual IWR framework.
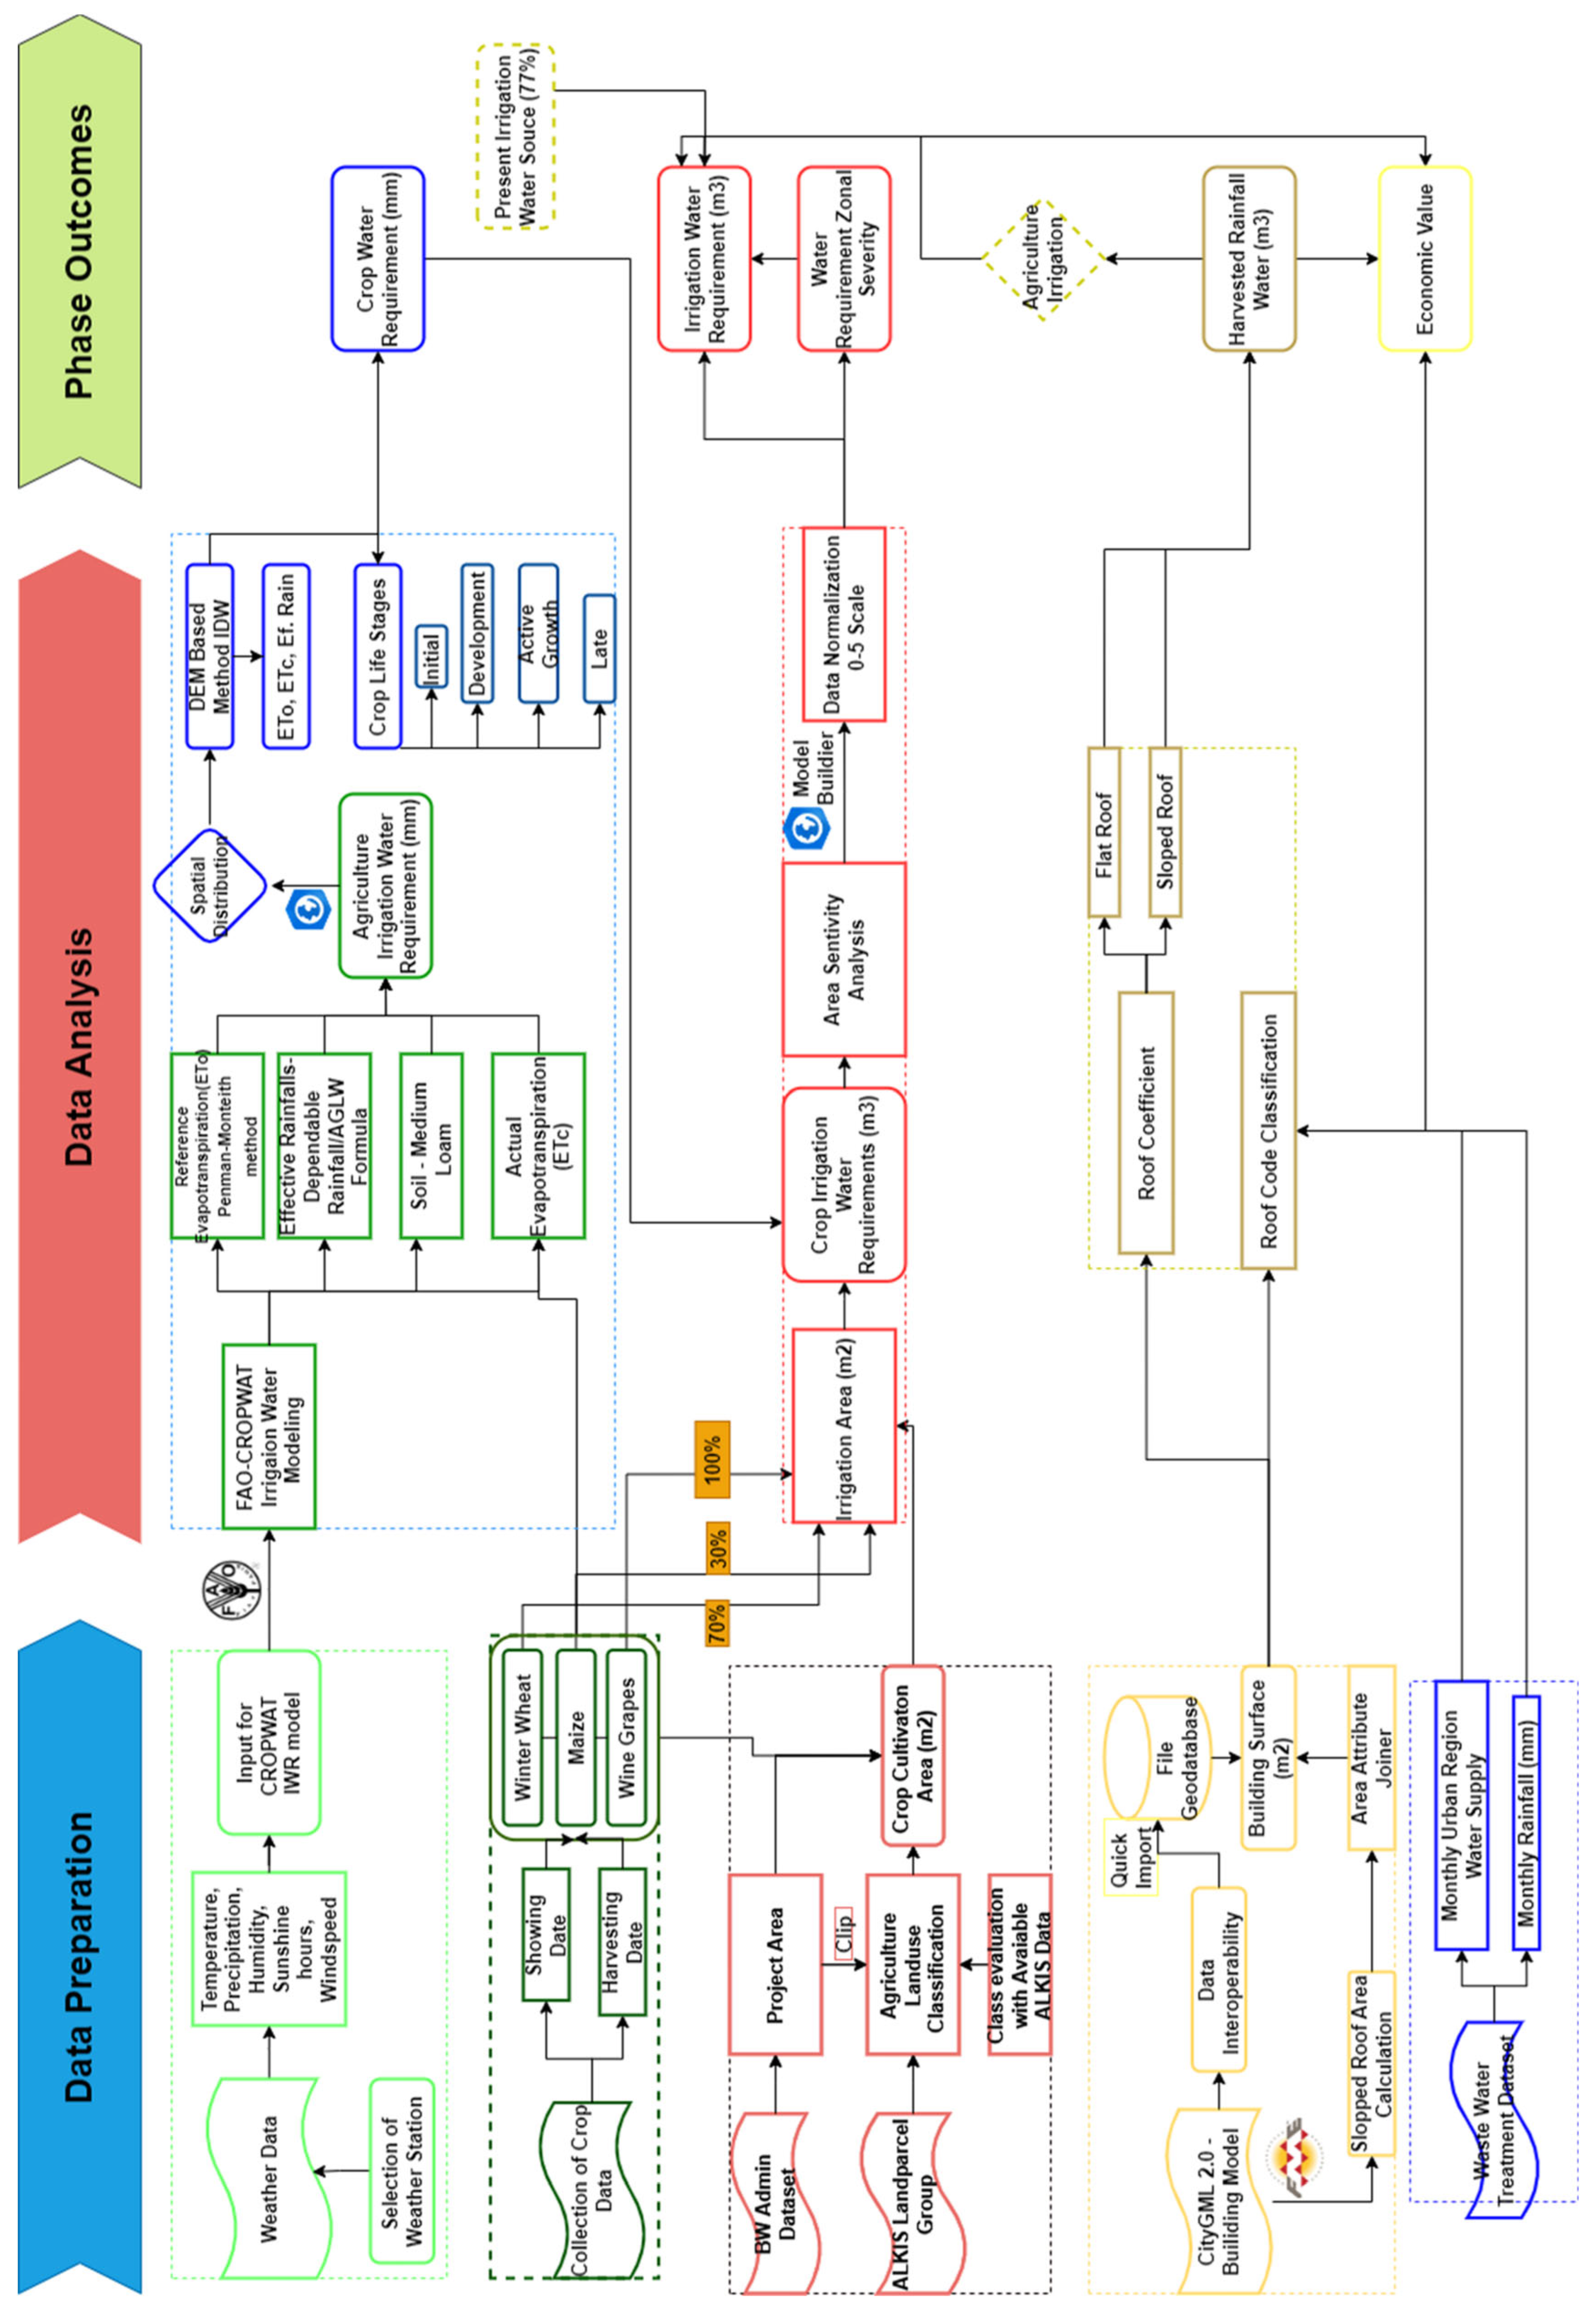
Figure A2.
Agriculture water requirement zonal severity model.
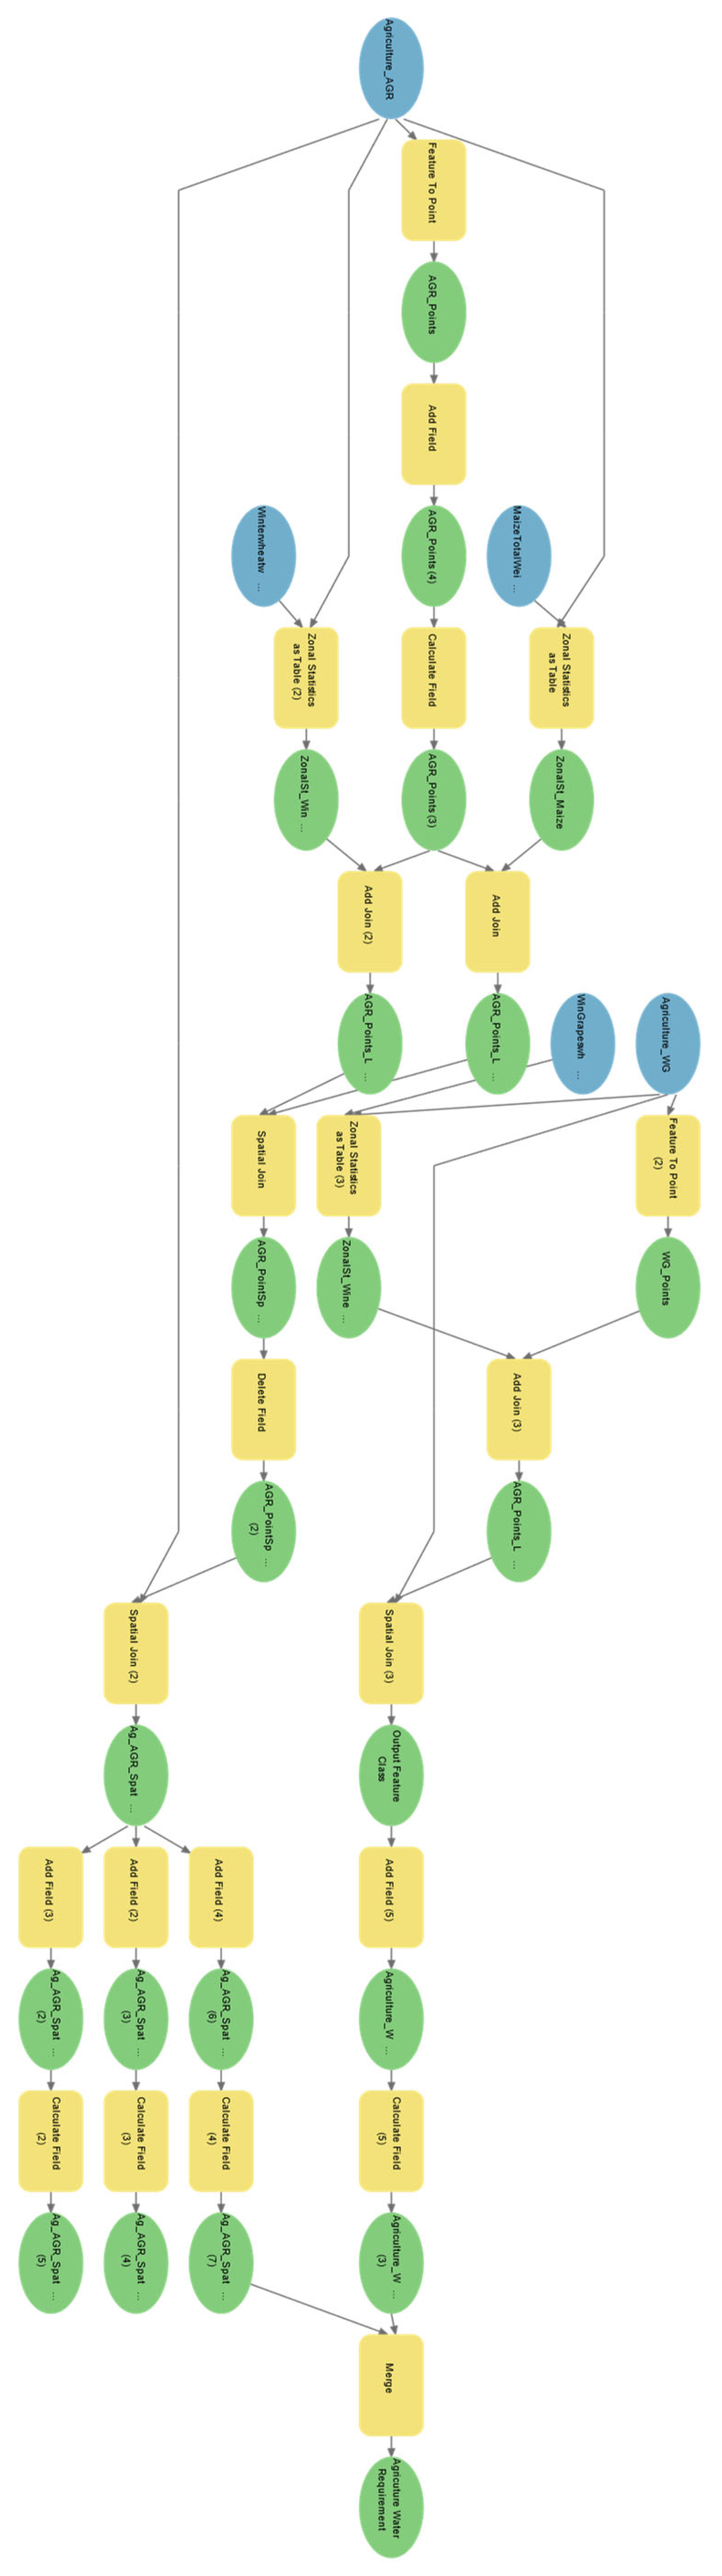
Figure A3.
User Accessible Web Application
References
- Helmecke, M.; Fries, E.; Schulte, C. Regulating water reuse for agricultural irrigation: risks related to organic micro-contaminants. Environ Sci Eur. 2020, 32, 4. [Google Scholar] [CrossRef]
- Stoll, J. Water Resource Management in Germany [Internet]. Umweltbundesamt; 2018. Available online: https://www.umweltbundesamt.de/publikationen/water-resource-management-in-germany (accessed on 03 February 2023).
- Schiller, A. Umweltbundesamt. 2021. New EU Regulation on Minimum Requirements for Water Reuse. Available online: https://www.umweltbundesamt.de/en/topics/water/water-resource-management/water-reuse/new-eu-regulation-on-minimum-requirements-for-water (accessed on 26 September 2022).
- Maaß, O.; Grundmann, P. Governing Transactions and Interdependences between Linked Value Chains in a Circular Economy: The Case of Wastewater Reuse in Braunschweig (Germany). Sustainability 2018, 10, 1125. [Google Scholar] [CrossRef]
- Inter3. Wasserwiederverwendung in Deutschland ermöglichen [Internet]. Available online: https://www.inter3.de/aktuelles/meldungen (accessed on 06 September 2022).
- Barbagallo, S.; Cirelli, G.L.; Consoli, S.; Licciardello, F.; Marzo, A.; Toscano, A. Analysis of treated wastewater reuse potential for irrigation in Sicily. Water Sci Technol. 2012, 65, 2024–2033. [Google Scholar] [CrossRef] [PubMed]
- Jia, H.; Guo, R.; Xin, K.; Wang, J. Research on wastewater reuse planning in Beijing central region. Water Sci Technol. 2005, 51, 195–202. [Google Scholar] [CrossRef] [PubMed]
- Ramirez, C.; Almulla, Y.; Fuso Nerini, F. Reusing wastewater for agricultural irrigation: a water-energy-food Nexus assessment in the North Western Sahara Aquifer System. Environ Res Lett. 2021, 16, 044052. [Google Scholar] [CrossRef]
- Jaramillo, M.; Restrepo, I. Wastewater Reuse in Agriculture: A Review about Its Limitations and Benefits. Sustainability 2017, 9, 1734. [Google Scholar] [CrossRef]
- Moseki, O.; Murray-Hudson, M.; Kashe, K. Crop water and irrigation requirements of Jatropha curcas L. in semi-arid conditions of Botswana: applying the CROPWAT model. Agric Water Manag. 2019, 225, 105754. [Google Scholar] [CrossRef]
- Bilibio, C.; Hensel, O. The Water Deficit of Evapotranspiration Covers on Potash Tailing Piles Using CropWat. Agric Eng Int CIGR J 2021, 23. Available online: https://cigrjournal.org/index.php/Ejounral.
- Surendran, U.; Sushanth, C.M.; Mammen, G.; Joseph, E.J. Modelling the Crop Water Requirement Using FAO-CROPWAT and Assessment of Water Resources for Sustainable Water Resource Management: A Case Study in Palakkad District of Humid Tropical Kerala, India. Aquat Procedia. 2015, 4, 1211–1219. [Google Scholar] [CrossRef]
- Bokke, A.S.; Shoro, K.E. Impact of effective rainfall on net irrigation water requirement: The case of Ethiopia. Water Sci. 2020, 34, 155–163. [Google Scholar] [CrossRef]
- Feng, Z.; Liu, D.; Zhang, Y. Water requirements and irrigation scheduling of spring maize using GIS and CropWat model in Beijing-Tianjin-Hebei region. Chin Geogr Sci. 2007, 17, 56–63. [Google Scholar] [CrossRef]
- Al-Najar, H. The integration of FAO-CropWat Model and GIS Techniques for Estimating Irrigation Water Requirement and Its Application in the Gaza Strip. Nat Resour. 2011, 02, 146–154. [Google Scholar] [CrossRef]
- Bhardwaj, R.K.; Sharma, S.; Kumar, D. Impact of LULC Dynamics on Evapotranspiration using GIS : Case Study of Uttarakhand. J Mater Environ Sci. 2022, 13, 631–639. [Google Scholar]
- Adamala, S.; Rajwade, Y.A.; Krishna Reddy, Y.V. Estimation of wheat crop evapotranspiration using NDVI vegetation index. J Appl Nat Sci. 2016, 8. [Google Scholar] [CrossRef]
- Kadkhodazadeh, M.; Valikhan Anaraki, M.; Morshed-Bozorgdel, A.; Farzin, S. A New Methodology for Reference Evapotranspiration Prediction and Uncertainty Analysis under Climate Change Conditions Based on Machine Learning, Multi Criteria Decision Making and Monte Carlo Methods. Sustainability 2022, 14, 2601. [Google Scholar] [CrossRef]
- Farreny, R.; Morales-Pinzón, T.; Guisasola, A.; Tayà, C.; Rieradevall, J.; Gabarrell, X. Roof selection for rainwater harvesting: Quantity and quality assessments in Spain. Water Res. 2011, 45, 3245–3254. [Google Scholar] [CrossRef] [PubMed]
- Maqsoom, A.; Aslam, B.; Ismail, S.; Thaheem, M.J.; Ullah, F.; Zahoor, H.; et al. Assessing Rainwater Harvesting Potential in Urban Areas: A Building Information Modelling (BIM) Approach. Sustainability 2021, 13, 12583. [Google Scholar] [CrossRef]
- Bao, K.; Padsala, R.; Thrän, D.; Schröter, B. Urban Water Demand Simulation in Residential and Non-Residential Buildings Based on a CityGML Data Model. ISPRS Int J Geo-Inf. 2020, 9, 642. [Google Scholar] [CrossRef]
- Rinaldi, S.; Bonamente, E.; Scrucca, F.; Merico, M.; Asdrubali, F.; Cotana, F. Water and Carbon Footprint of Wine: Methodology Review and Application to a Case Study. Sustainability 2016, 8, 621. [Google Scholar] [CrossRef]
- Choudhary, D. Methods of Evapotranspiration. 2018. Available online: http://rgdoi.net/10.13140/RG.2.2.14533.76007 (accessed on 23 January 2023).
- Solangi, G.S.; Shah, S.A.; Alharbi, R.S.; Panhwar, S.; Keerio, H.A.; Kim, T.W.; et al. Investigation of Irrigation Water Requirements for Major Crops Using CROPWAT Model Based on Climate Data. Water 2022, 14, 2578. [Google Scholar] [CrossRef]
- Alemayehu, Y.A.; Steyn, J.M.; Annandale, J.G. FAO-type crop factor determination for irrigation scheduling of hot pepper ( Capsicum annuum L.) cultivars. South Afr J Plant Soil. 2009, 26, 186–194. [Google Scholar] [CrossRef]
- Lakshmi, S.E.; Yarrakula, K. Review and critical analysis on digital elevation models. Geofizika 2019, 35, 129–157. [Google Scholar] [CrossRef]
- Rabbi, S.E.; Shant, R.; Karmakar, S.; Habib, A.; Kropp, J.P. Regional mapping of climate variability index and identifying socio-economic factors influencing farmer’s perception in Bangladesh. Environ Dev Sustain. 2021, 23, 11050–11066. [Google Scholar] [CrossRef]
- Repository.de. Index of /schemas/adv/citygml/Codelisten/ [Internet]. Available online: https://repository.gdi-de.org/schemas/adv/citygml/Codelisten/ (accessed on 25 January 2023).
- Ugai, T. Evaluation of Sustainable Roof from Various Aspects and Benefits of Agriculture Roofing in Urban Core. Procedia - Soc Behav Sci. 2016, 216, 850–860. [Google Scholar] [CrossRef]
- Anane, M.; Bouziri, L.; Limam, A.; Jellali, S. Ranking suitable sites for irrigation with reclaimed water in the Nabeul-Hammamet region (Tunisia) using GIS and AHP-multicriteria decision analysis. Resour Conserv Recycl. 2012, 65, 36–46. [Google Scholar] [CrossRef]
- Schoenwiese, G. Umweltbundesamt. 2021. WW-R-1: Water use index. Available online: https://www.umweltbundesamt.de/en/topics/climate-energy/climate-impacts-adaptation/impacts-of-climate-change/monitoring-report-2019/indicators-of-climate-change-impacts-adaptation/cluster-water-regime-water-managementmarine-coastal/ww-r-1-water-use-index (accessed on 20 September 2022).
- icid.org. icid.org. Germany, Federal Republic of - icid.org. Available online: https://www.icid.org/i_d_germany.pdf (accessed on 03 February 2023).
Figure 1.
Research area-Weinstadt, Baden-Württemberg.
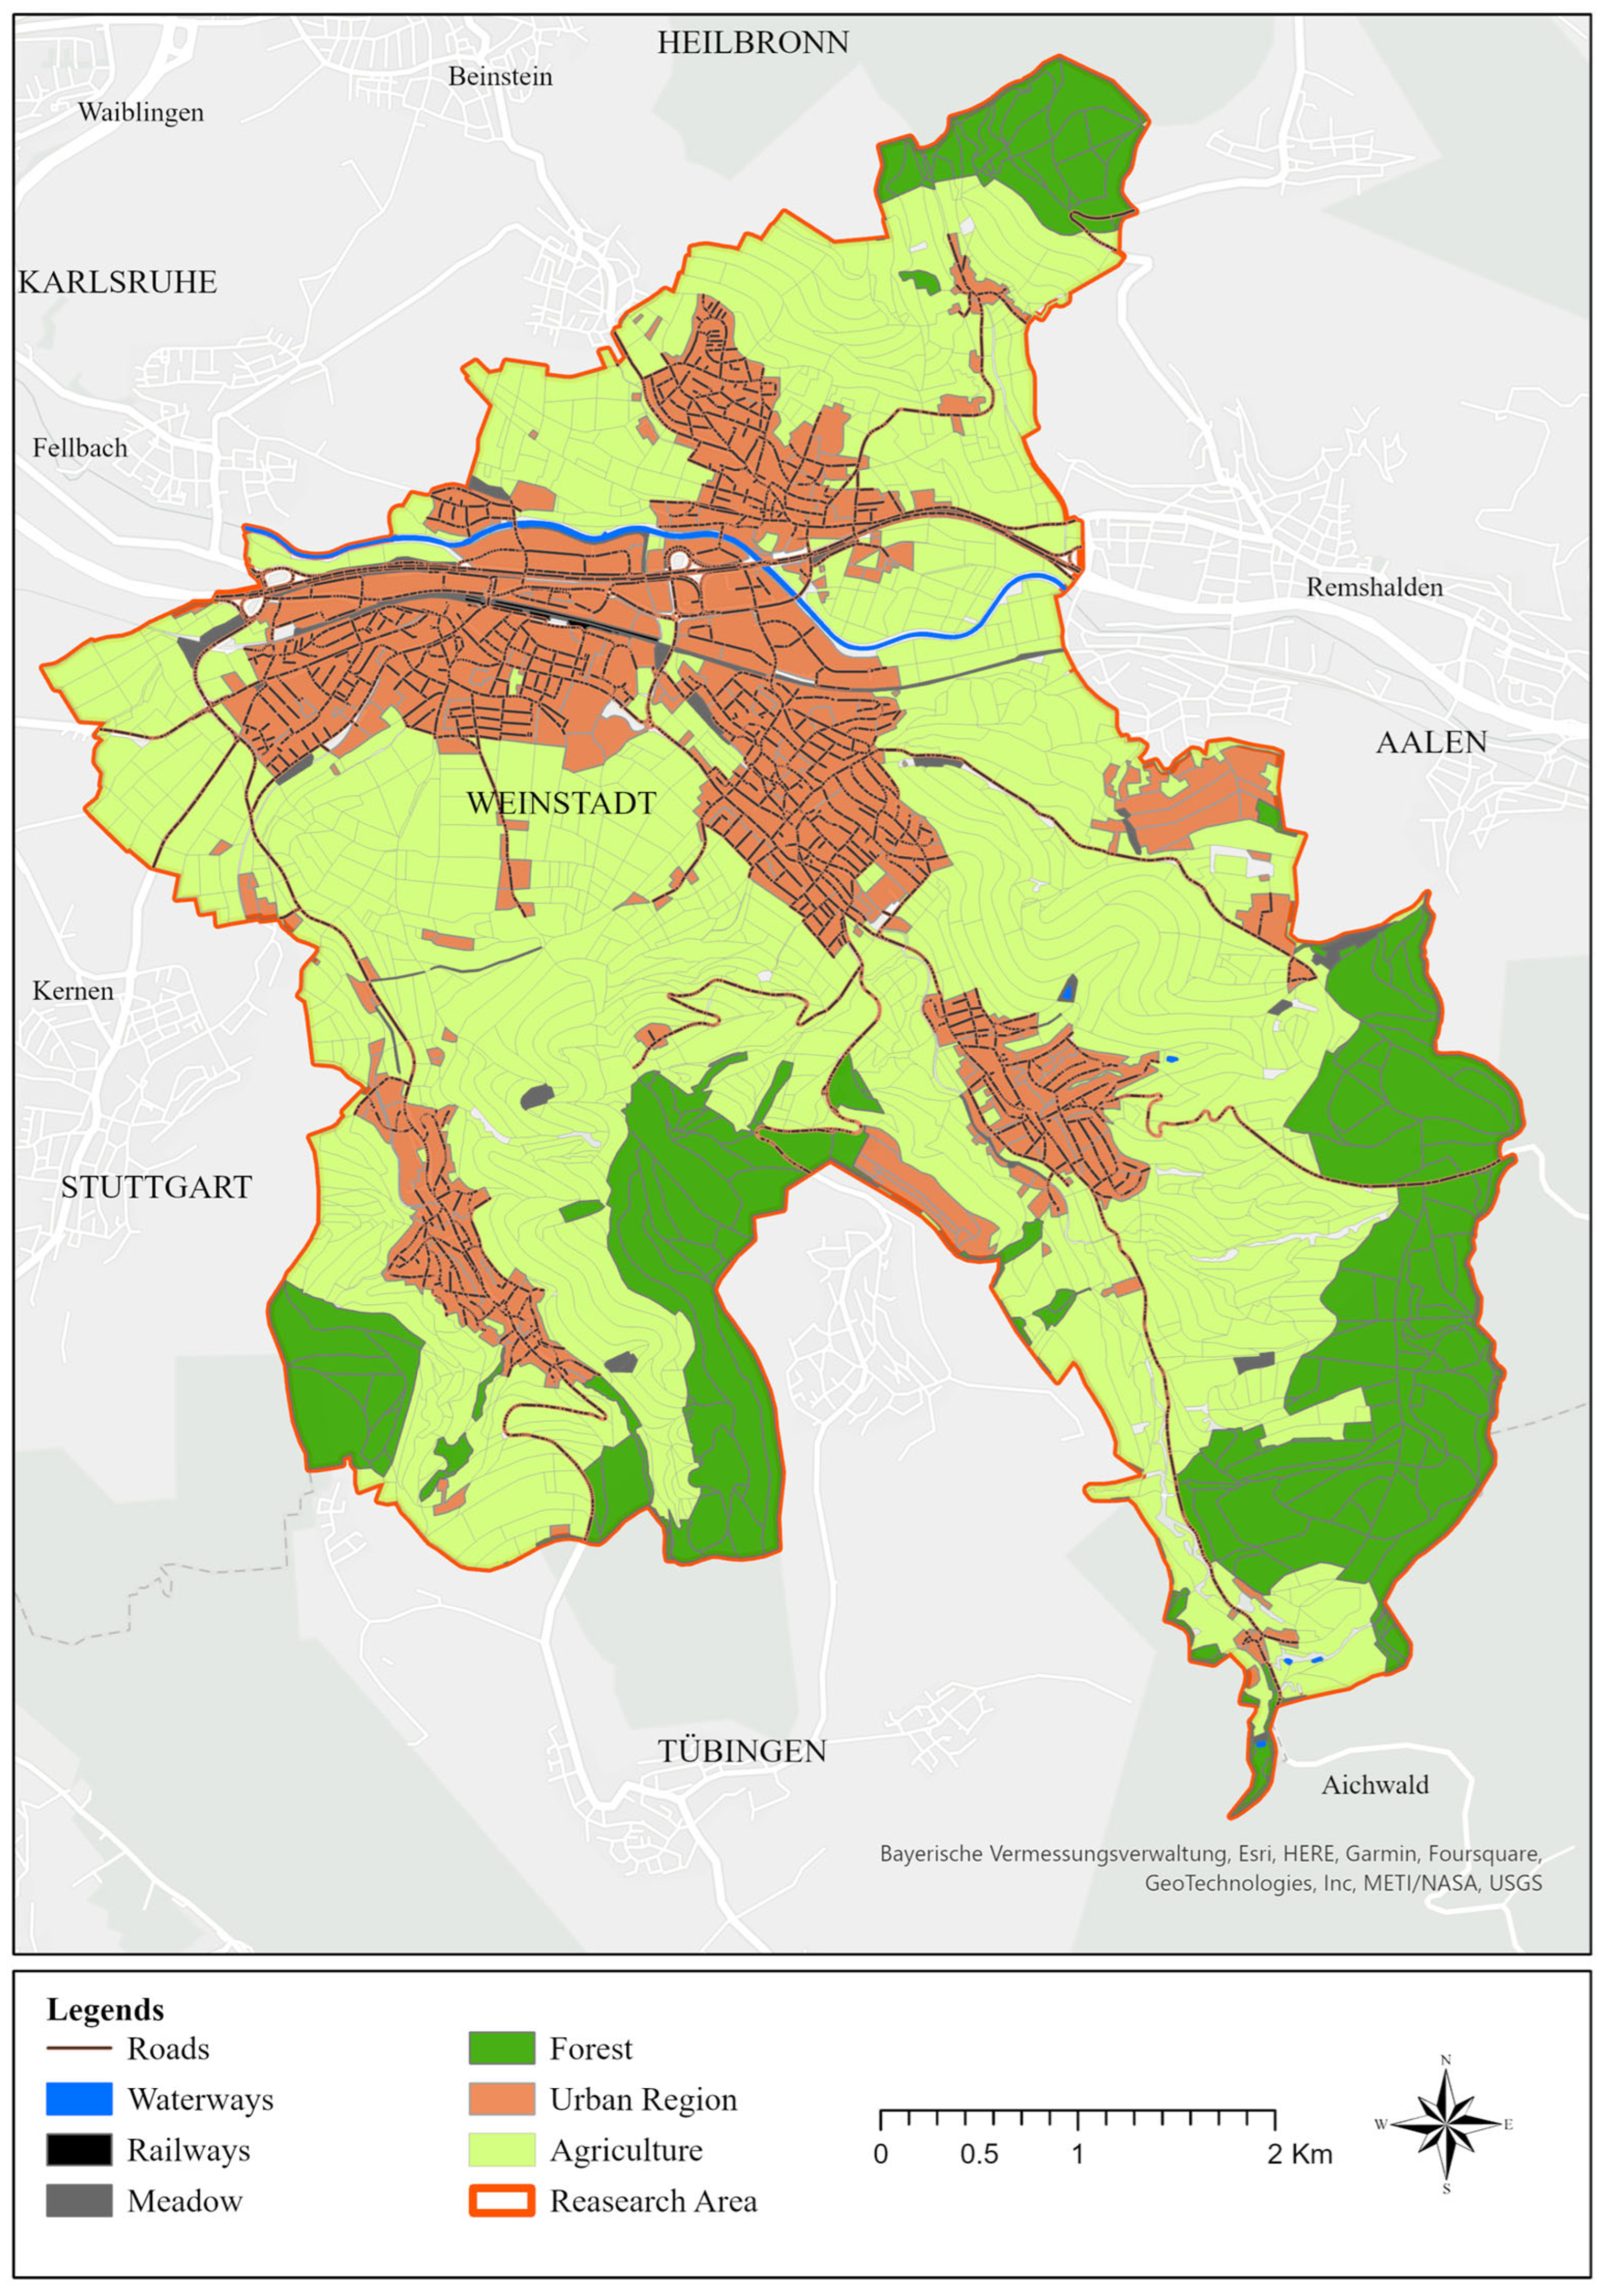
Figure 2.
Percentage of building roof type.
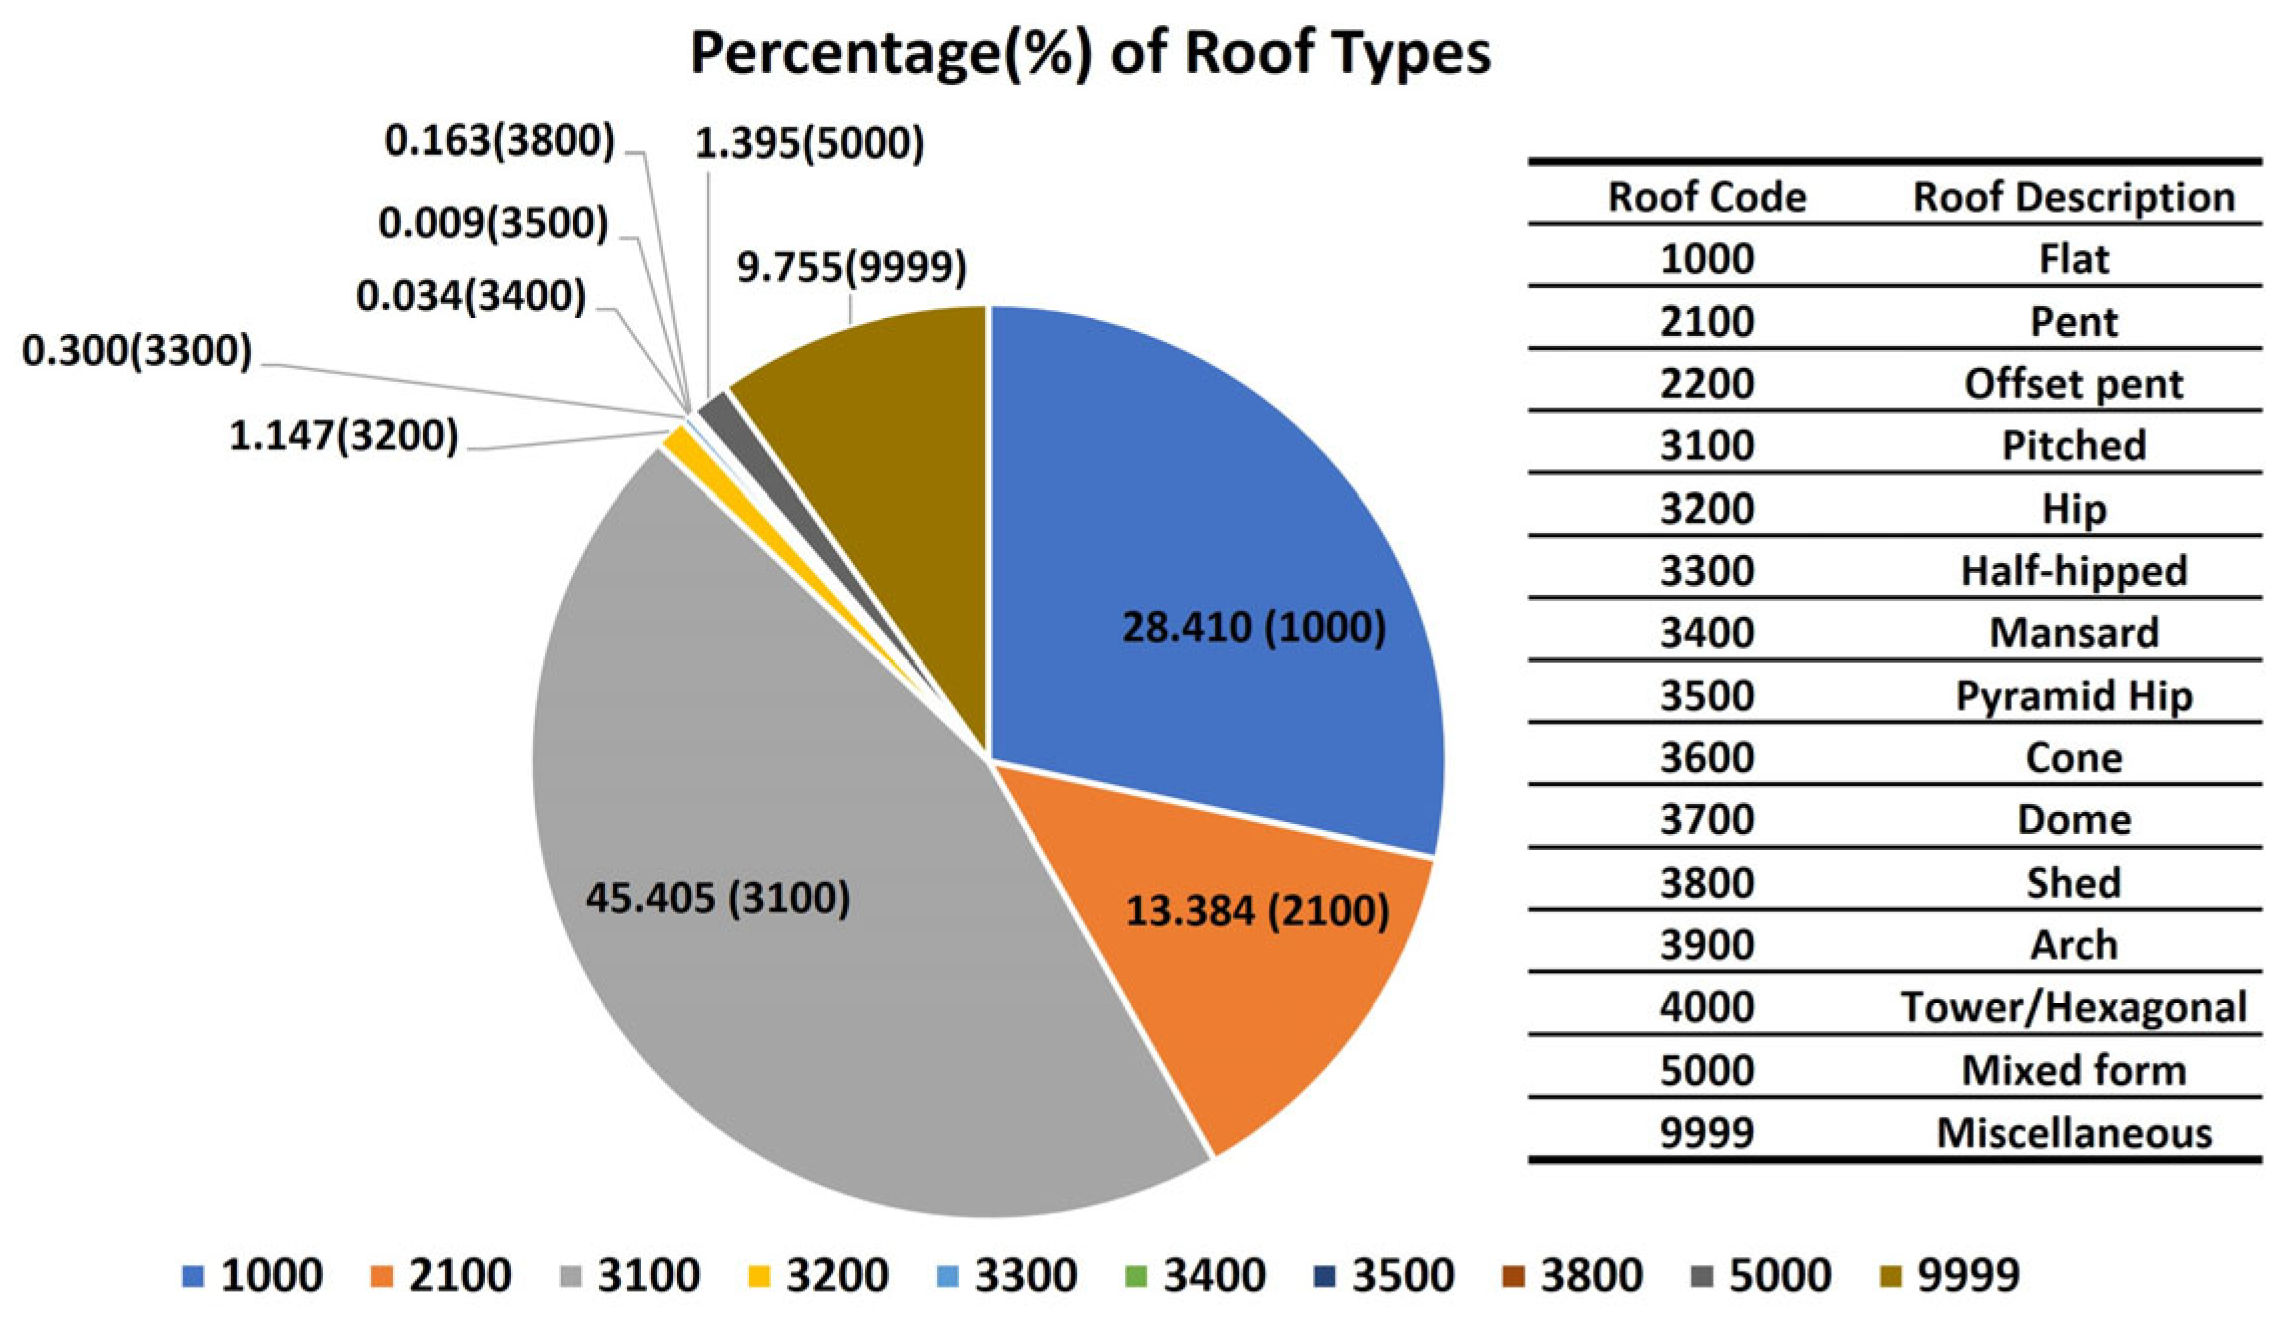
Figure 3.
FME Workbench Workflow for slopped area calculation.
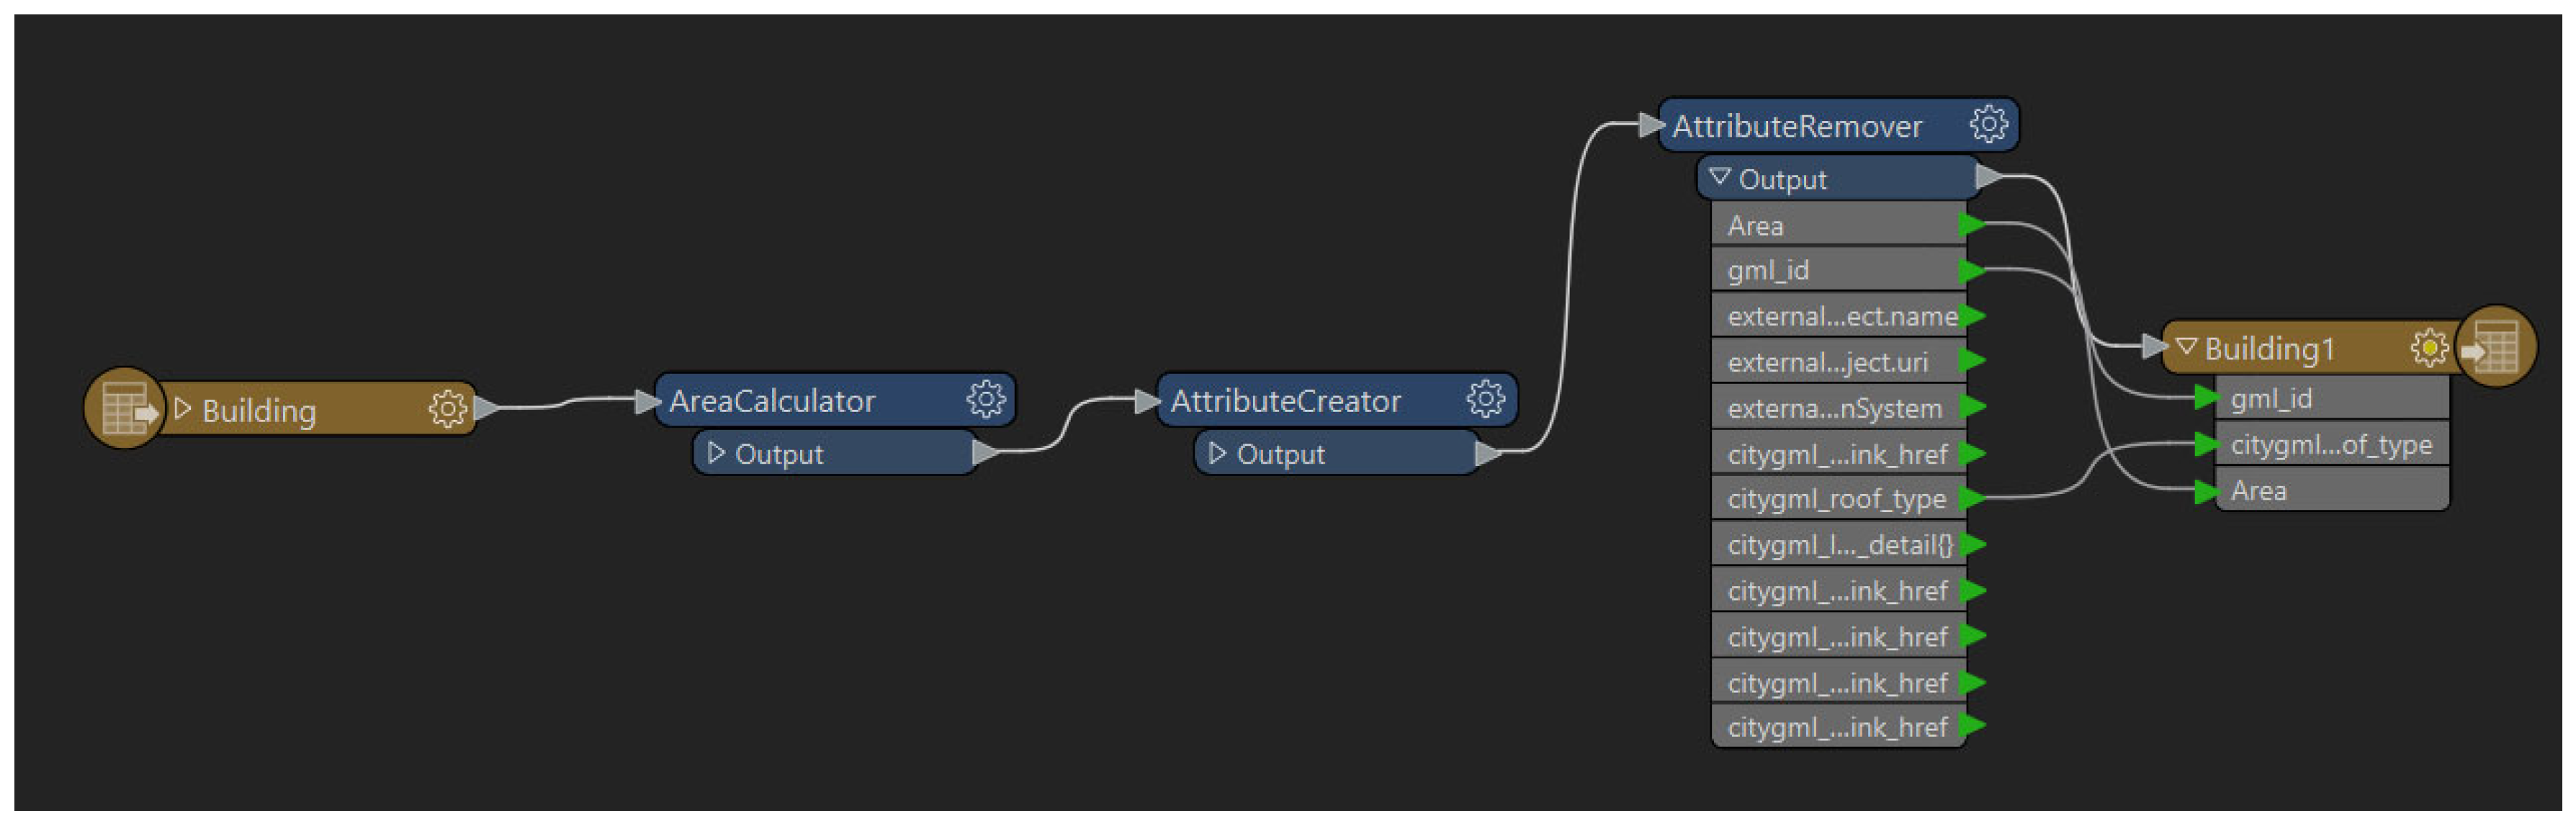
Figure 4.
Visualization workflow for all Geo-spatial layers.
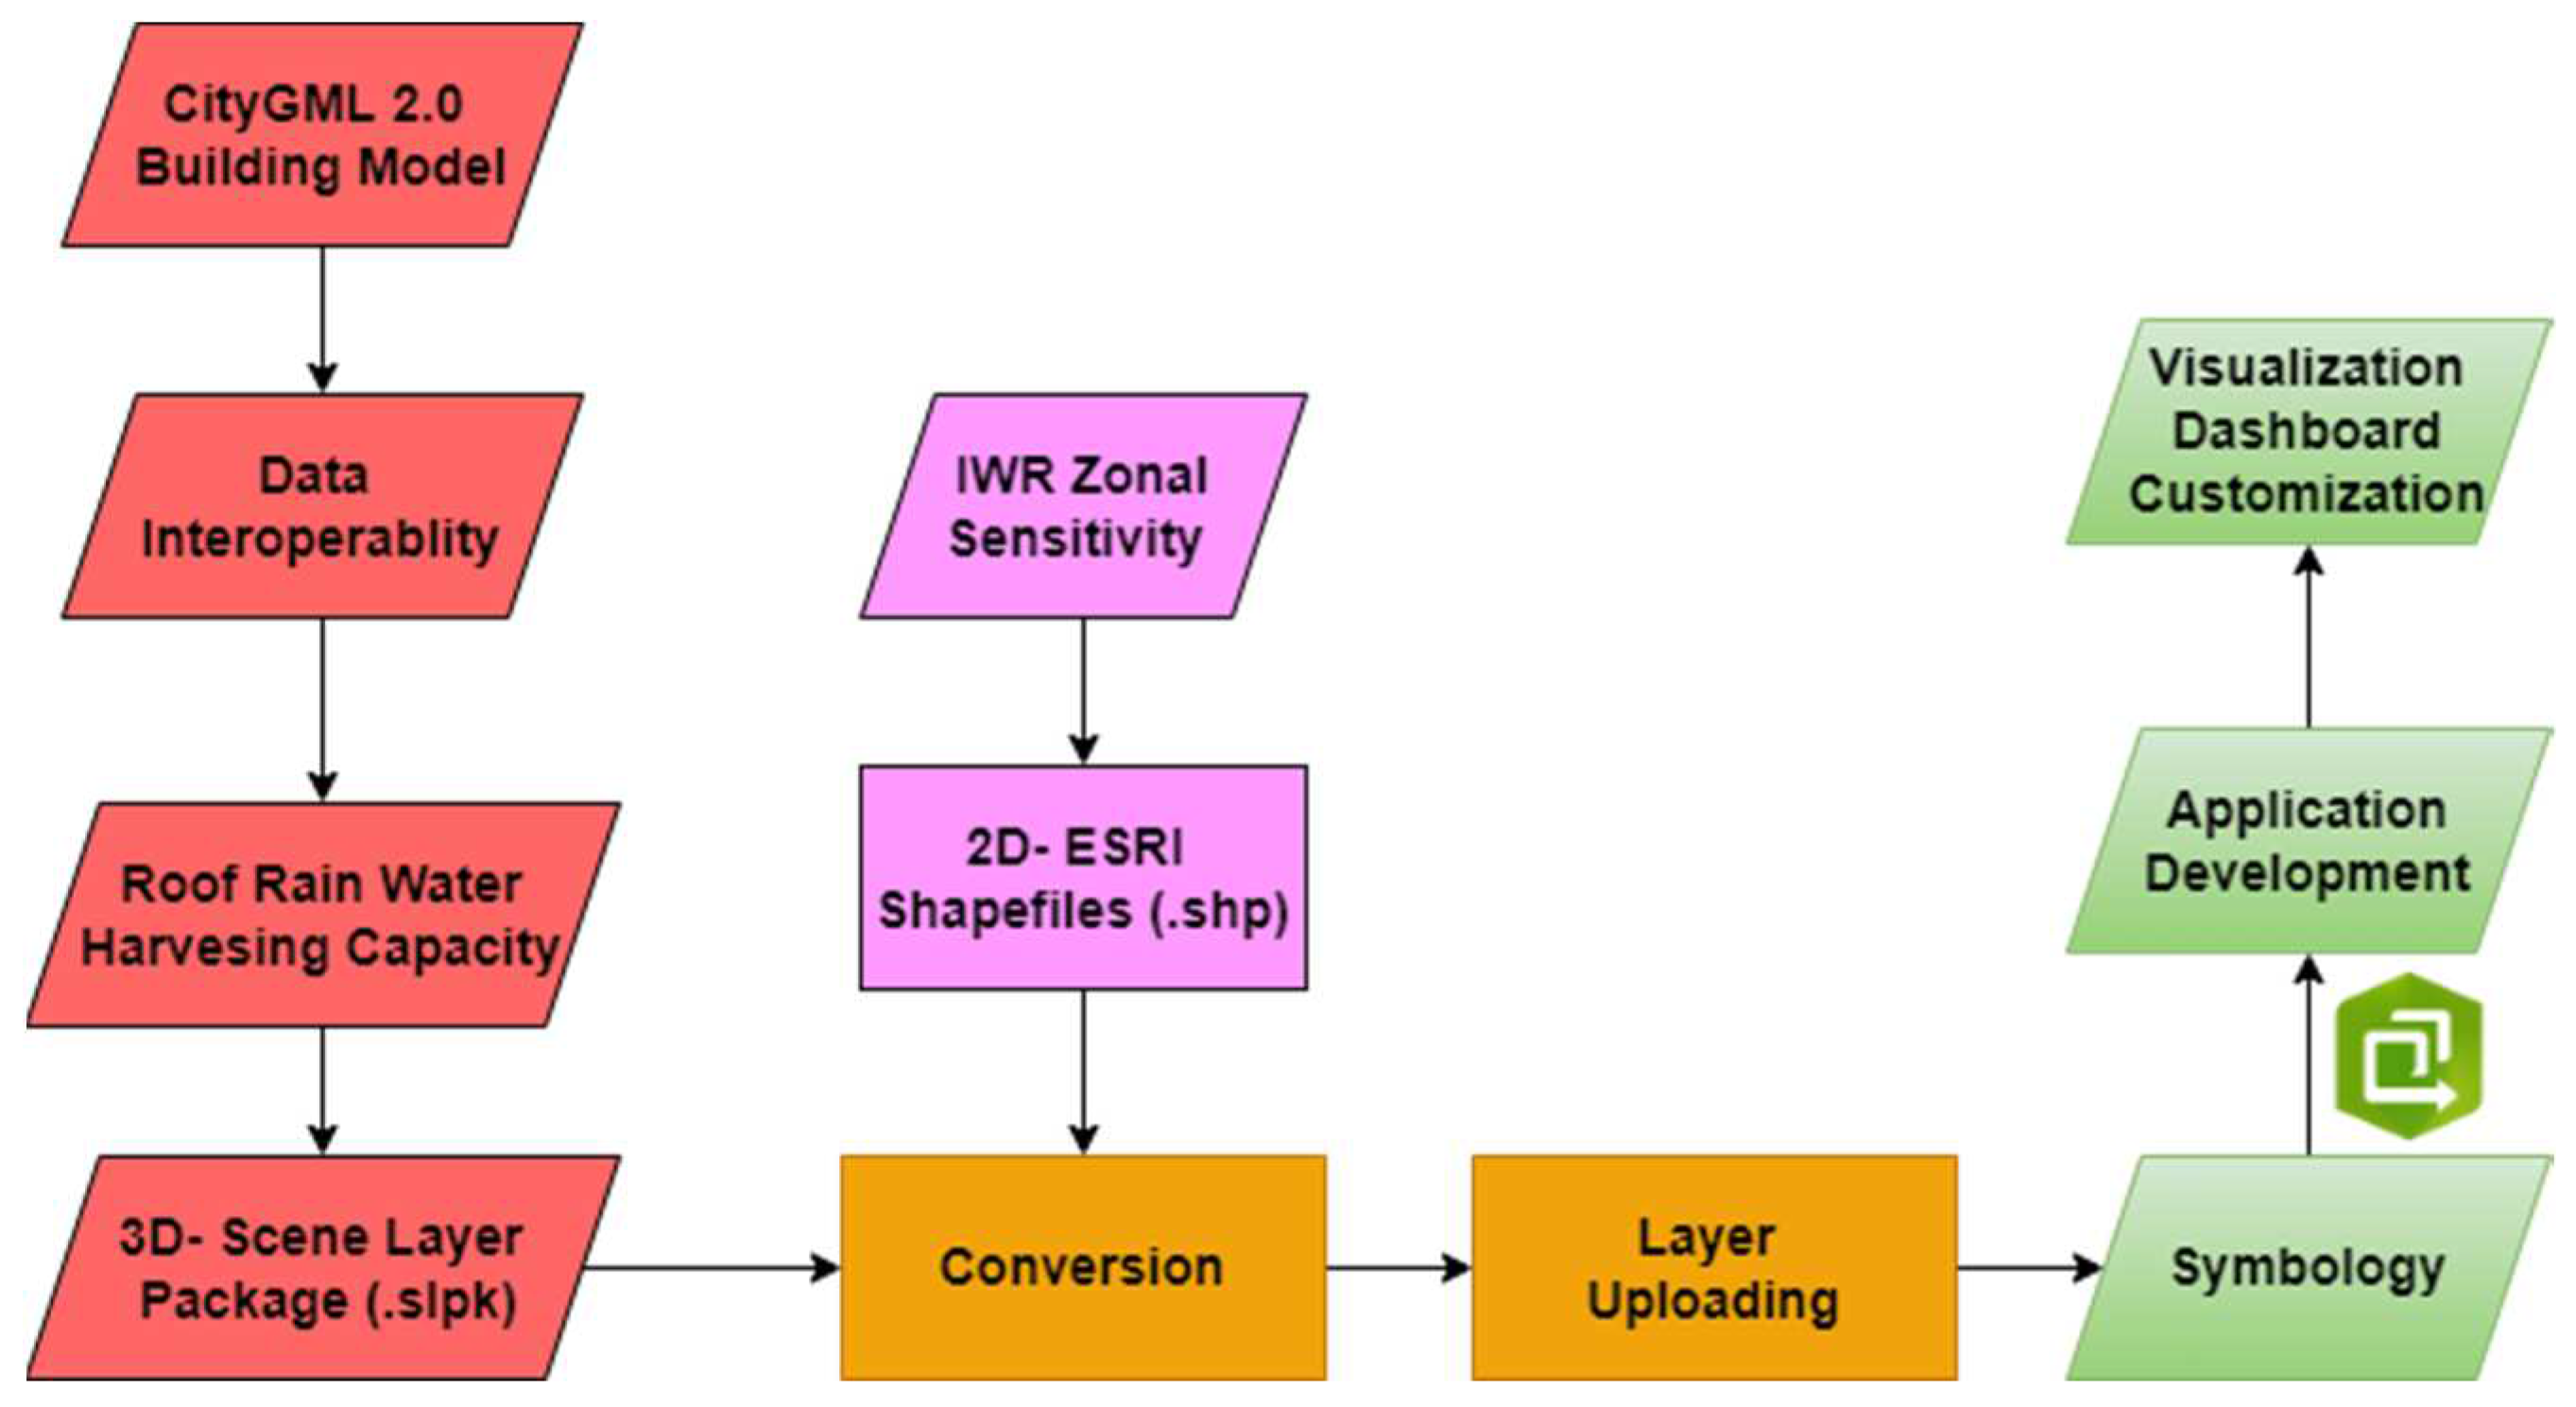
Figure 5.
Spatial Distribution of (a) reference evapotranspiration; (b) crop water requirements & (c) effective rainfall in Weinstadt municipality.
Figure 5.
Spatial Distribution of (a) reference evapotranspiration; (b) crop water requirements & (c) effective rainfall in Weinstadt municipality.
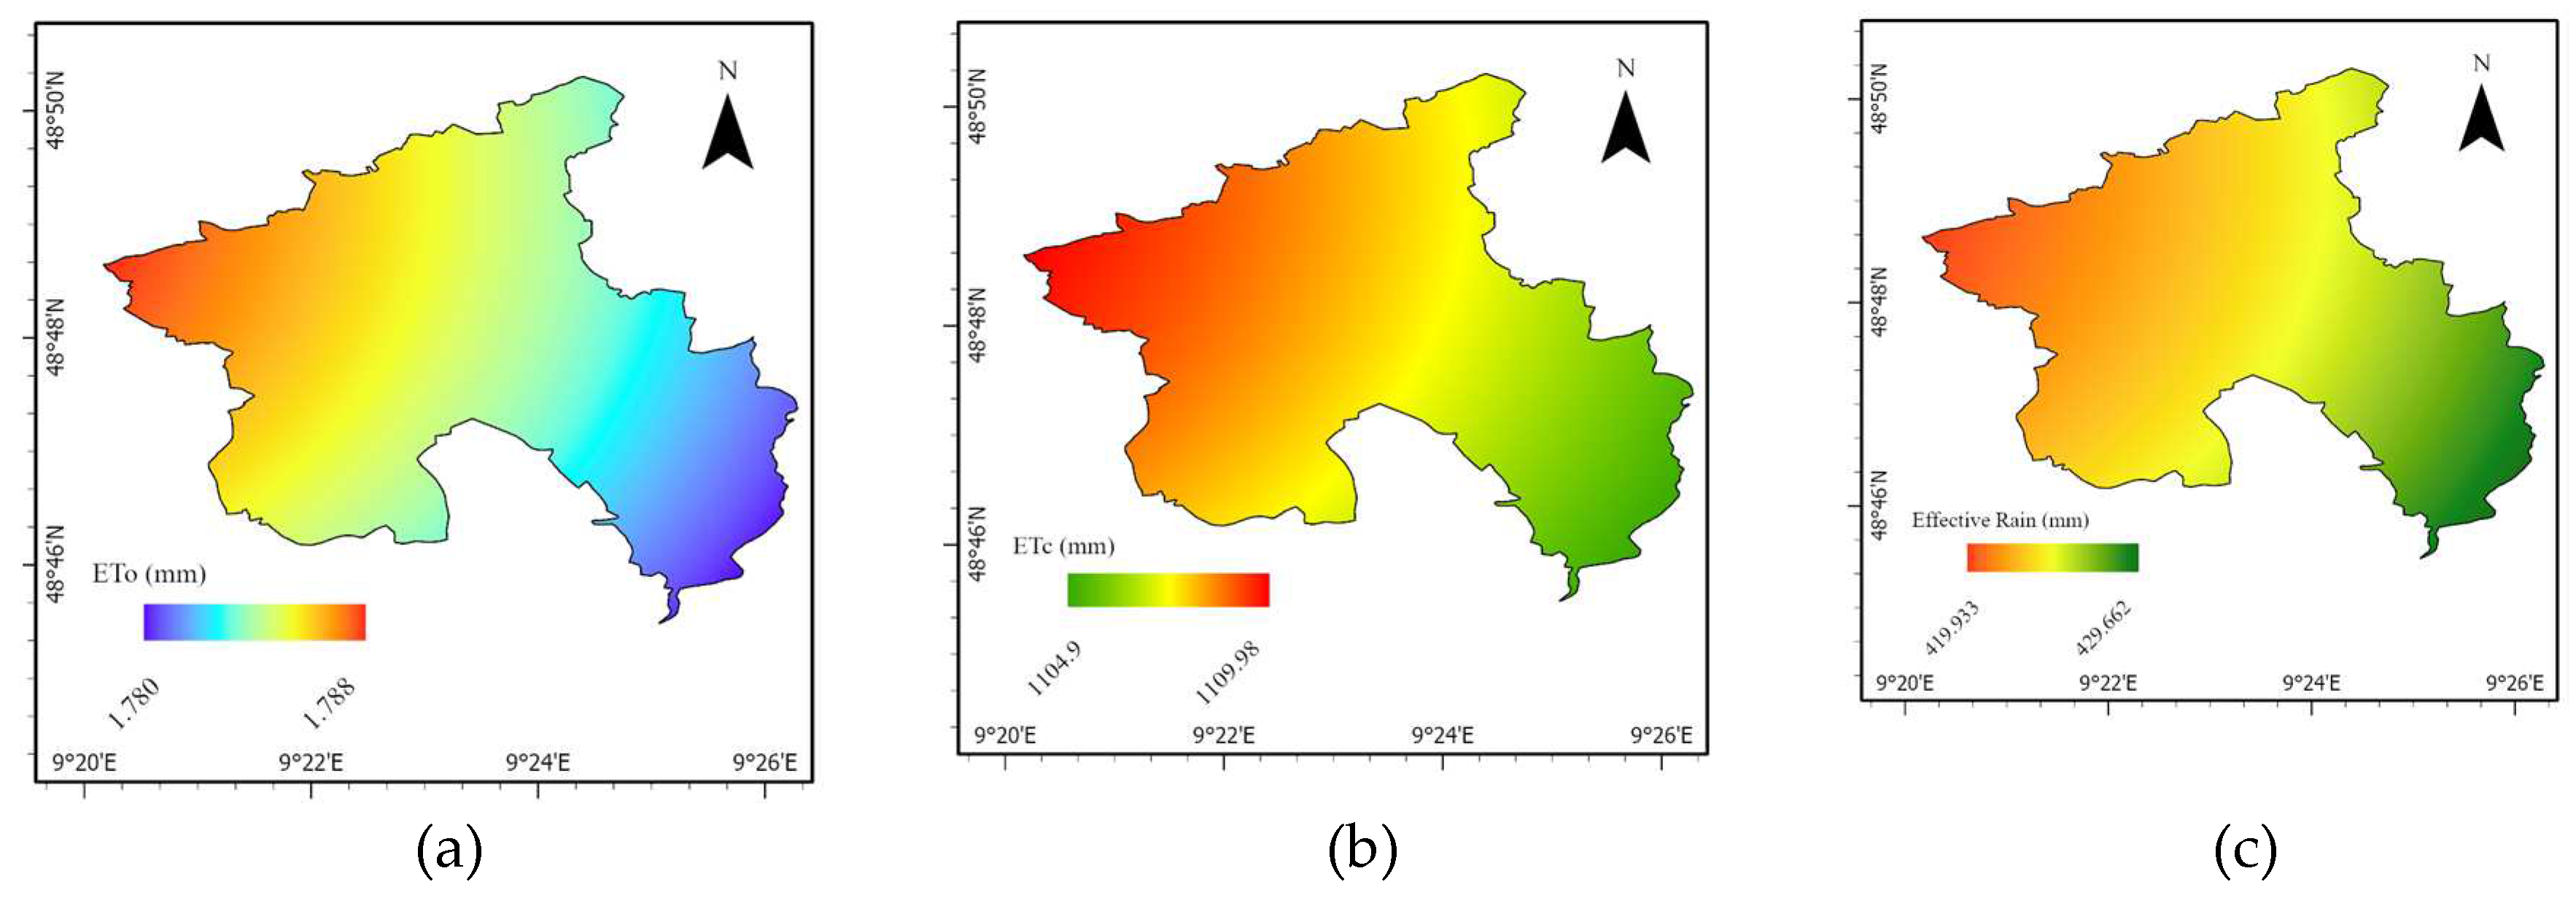
Figure 6.
Spatial distribution of maize IWR- (a) development stage; (b) active growth stage; (c) mature stage; (d) total water requirements.
Figure 6.
Spatial distribution of maize IWR- (a) development stage; (b) active growth stage; (c) mature stage; (d) total water requirements.
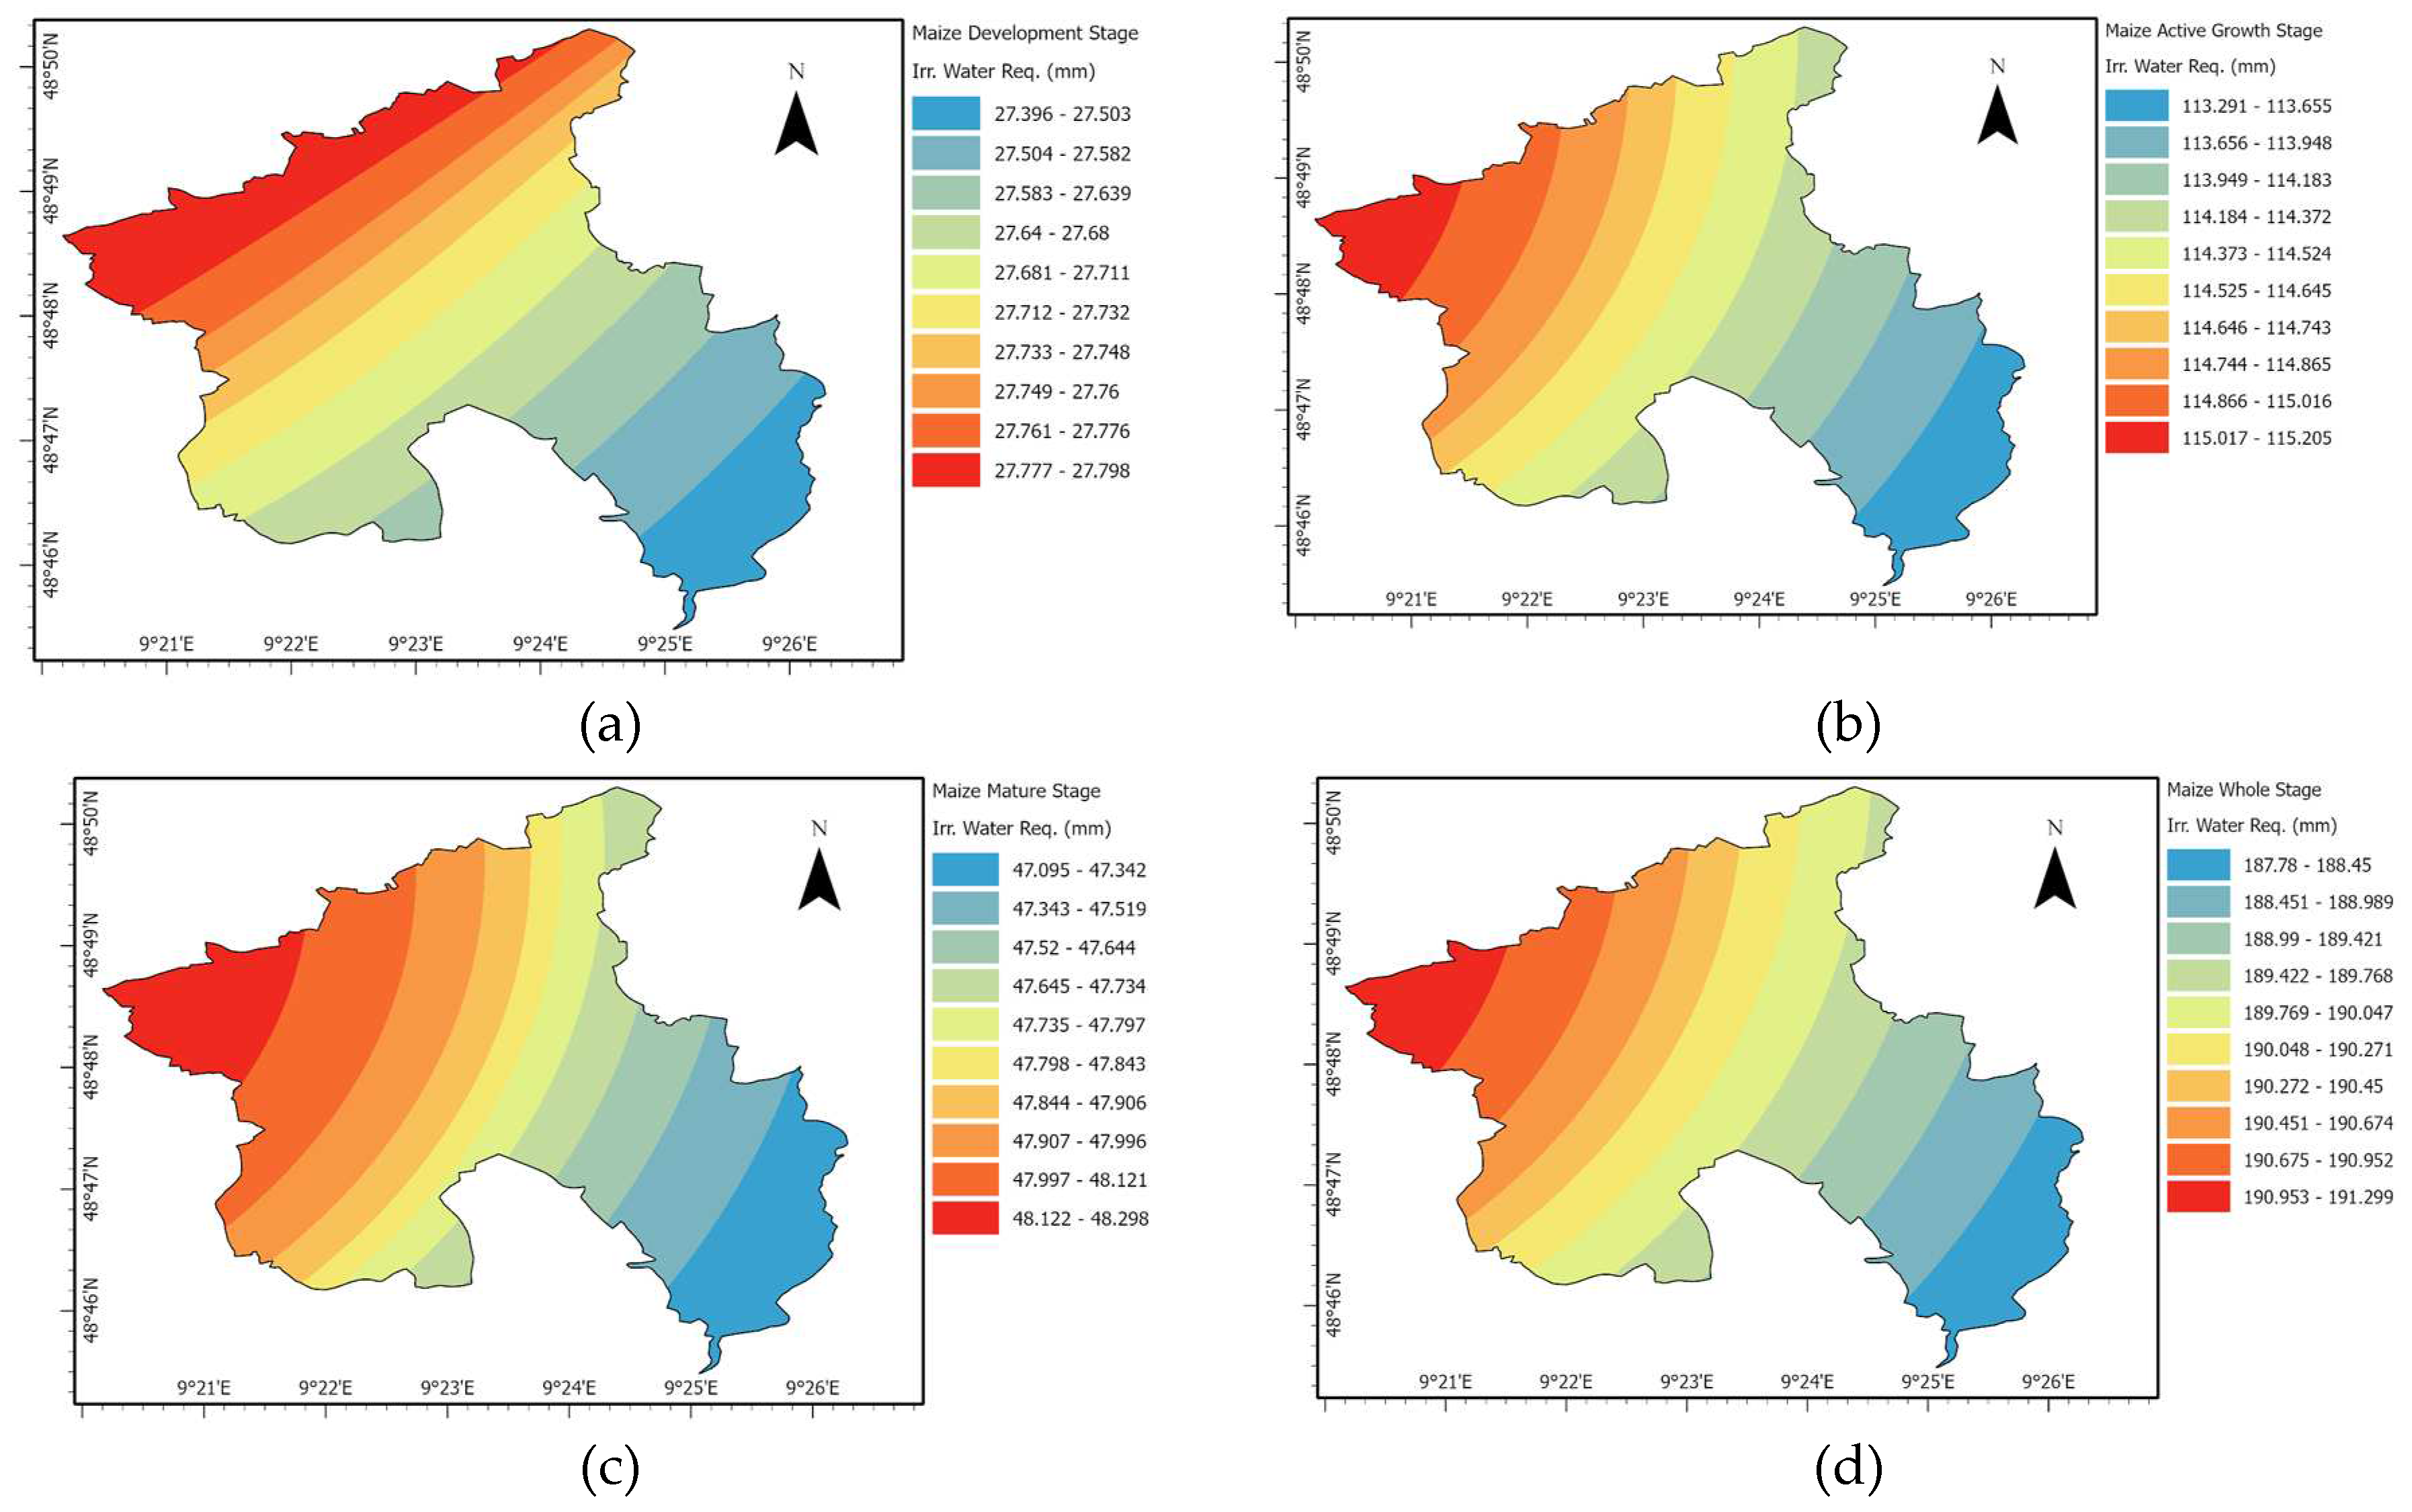
Figure 7.
Spatial distribution of wine grapes IWR- (a) active growth stage; (b) mature stage; (c) total water requirements.
Figure 7.
Spatial distribution of wine grapes IWR- (a) active growth stage; (b) mature stage; (c) total water requirements.
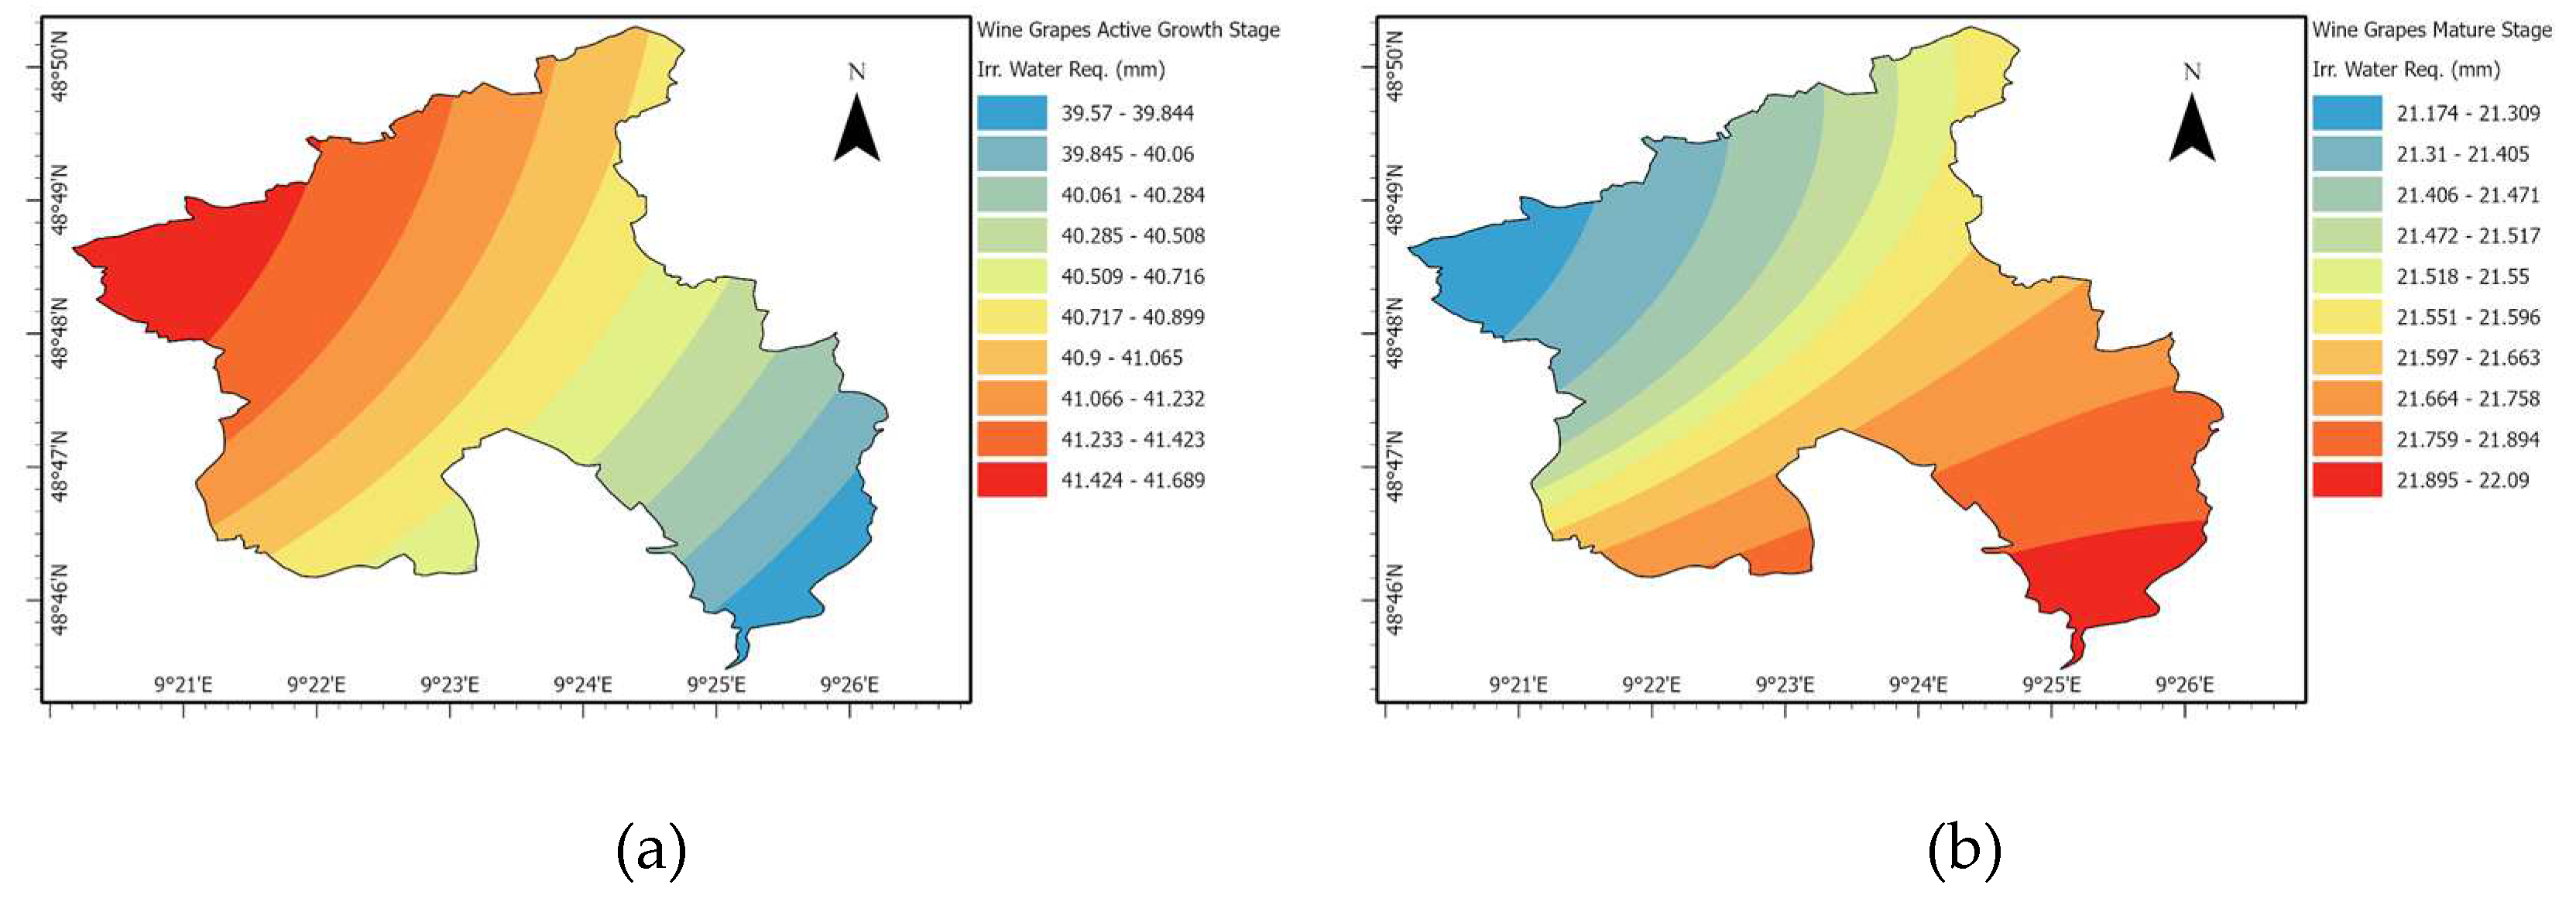
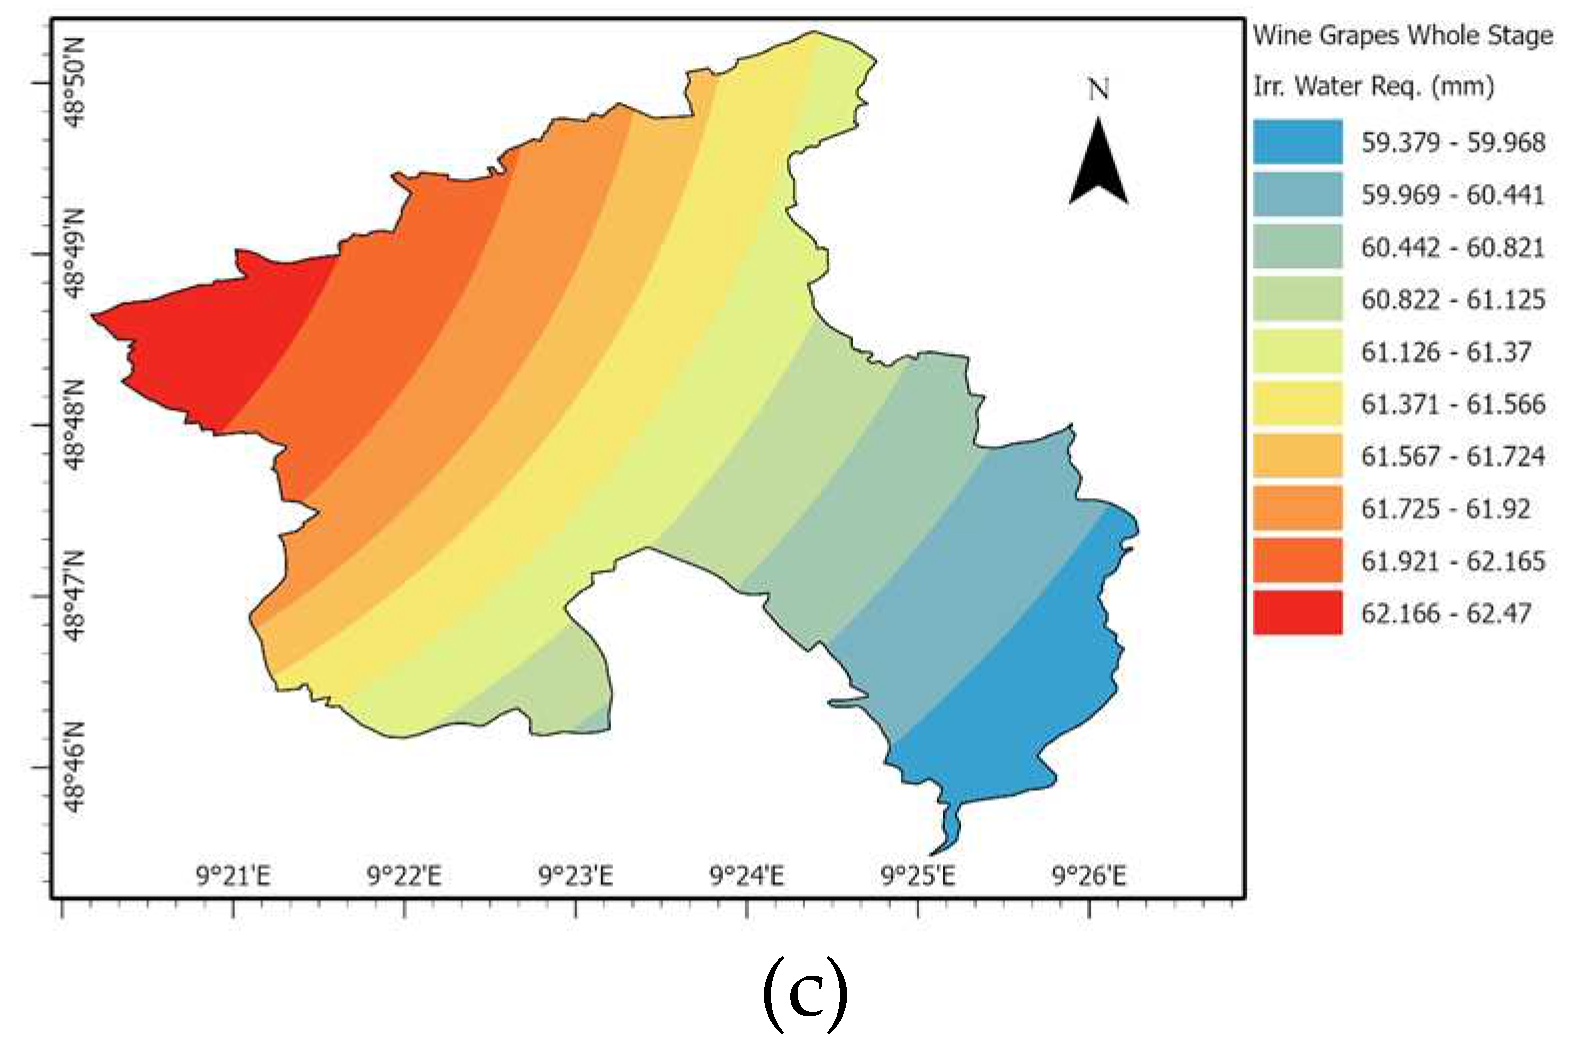
Figure 8.
Spatial distribution of winter wheat IWR- (a) development stage; (b) active growth; (c) mature stage; (d) total water requirements.
Figure 8.
Spatial distribution of winter wheat IWR- (a) development stage; (b) active growth; (c) mature stage; (d) total water requirements.
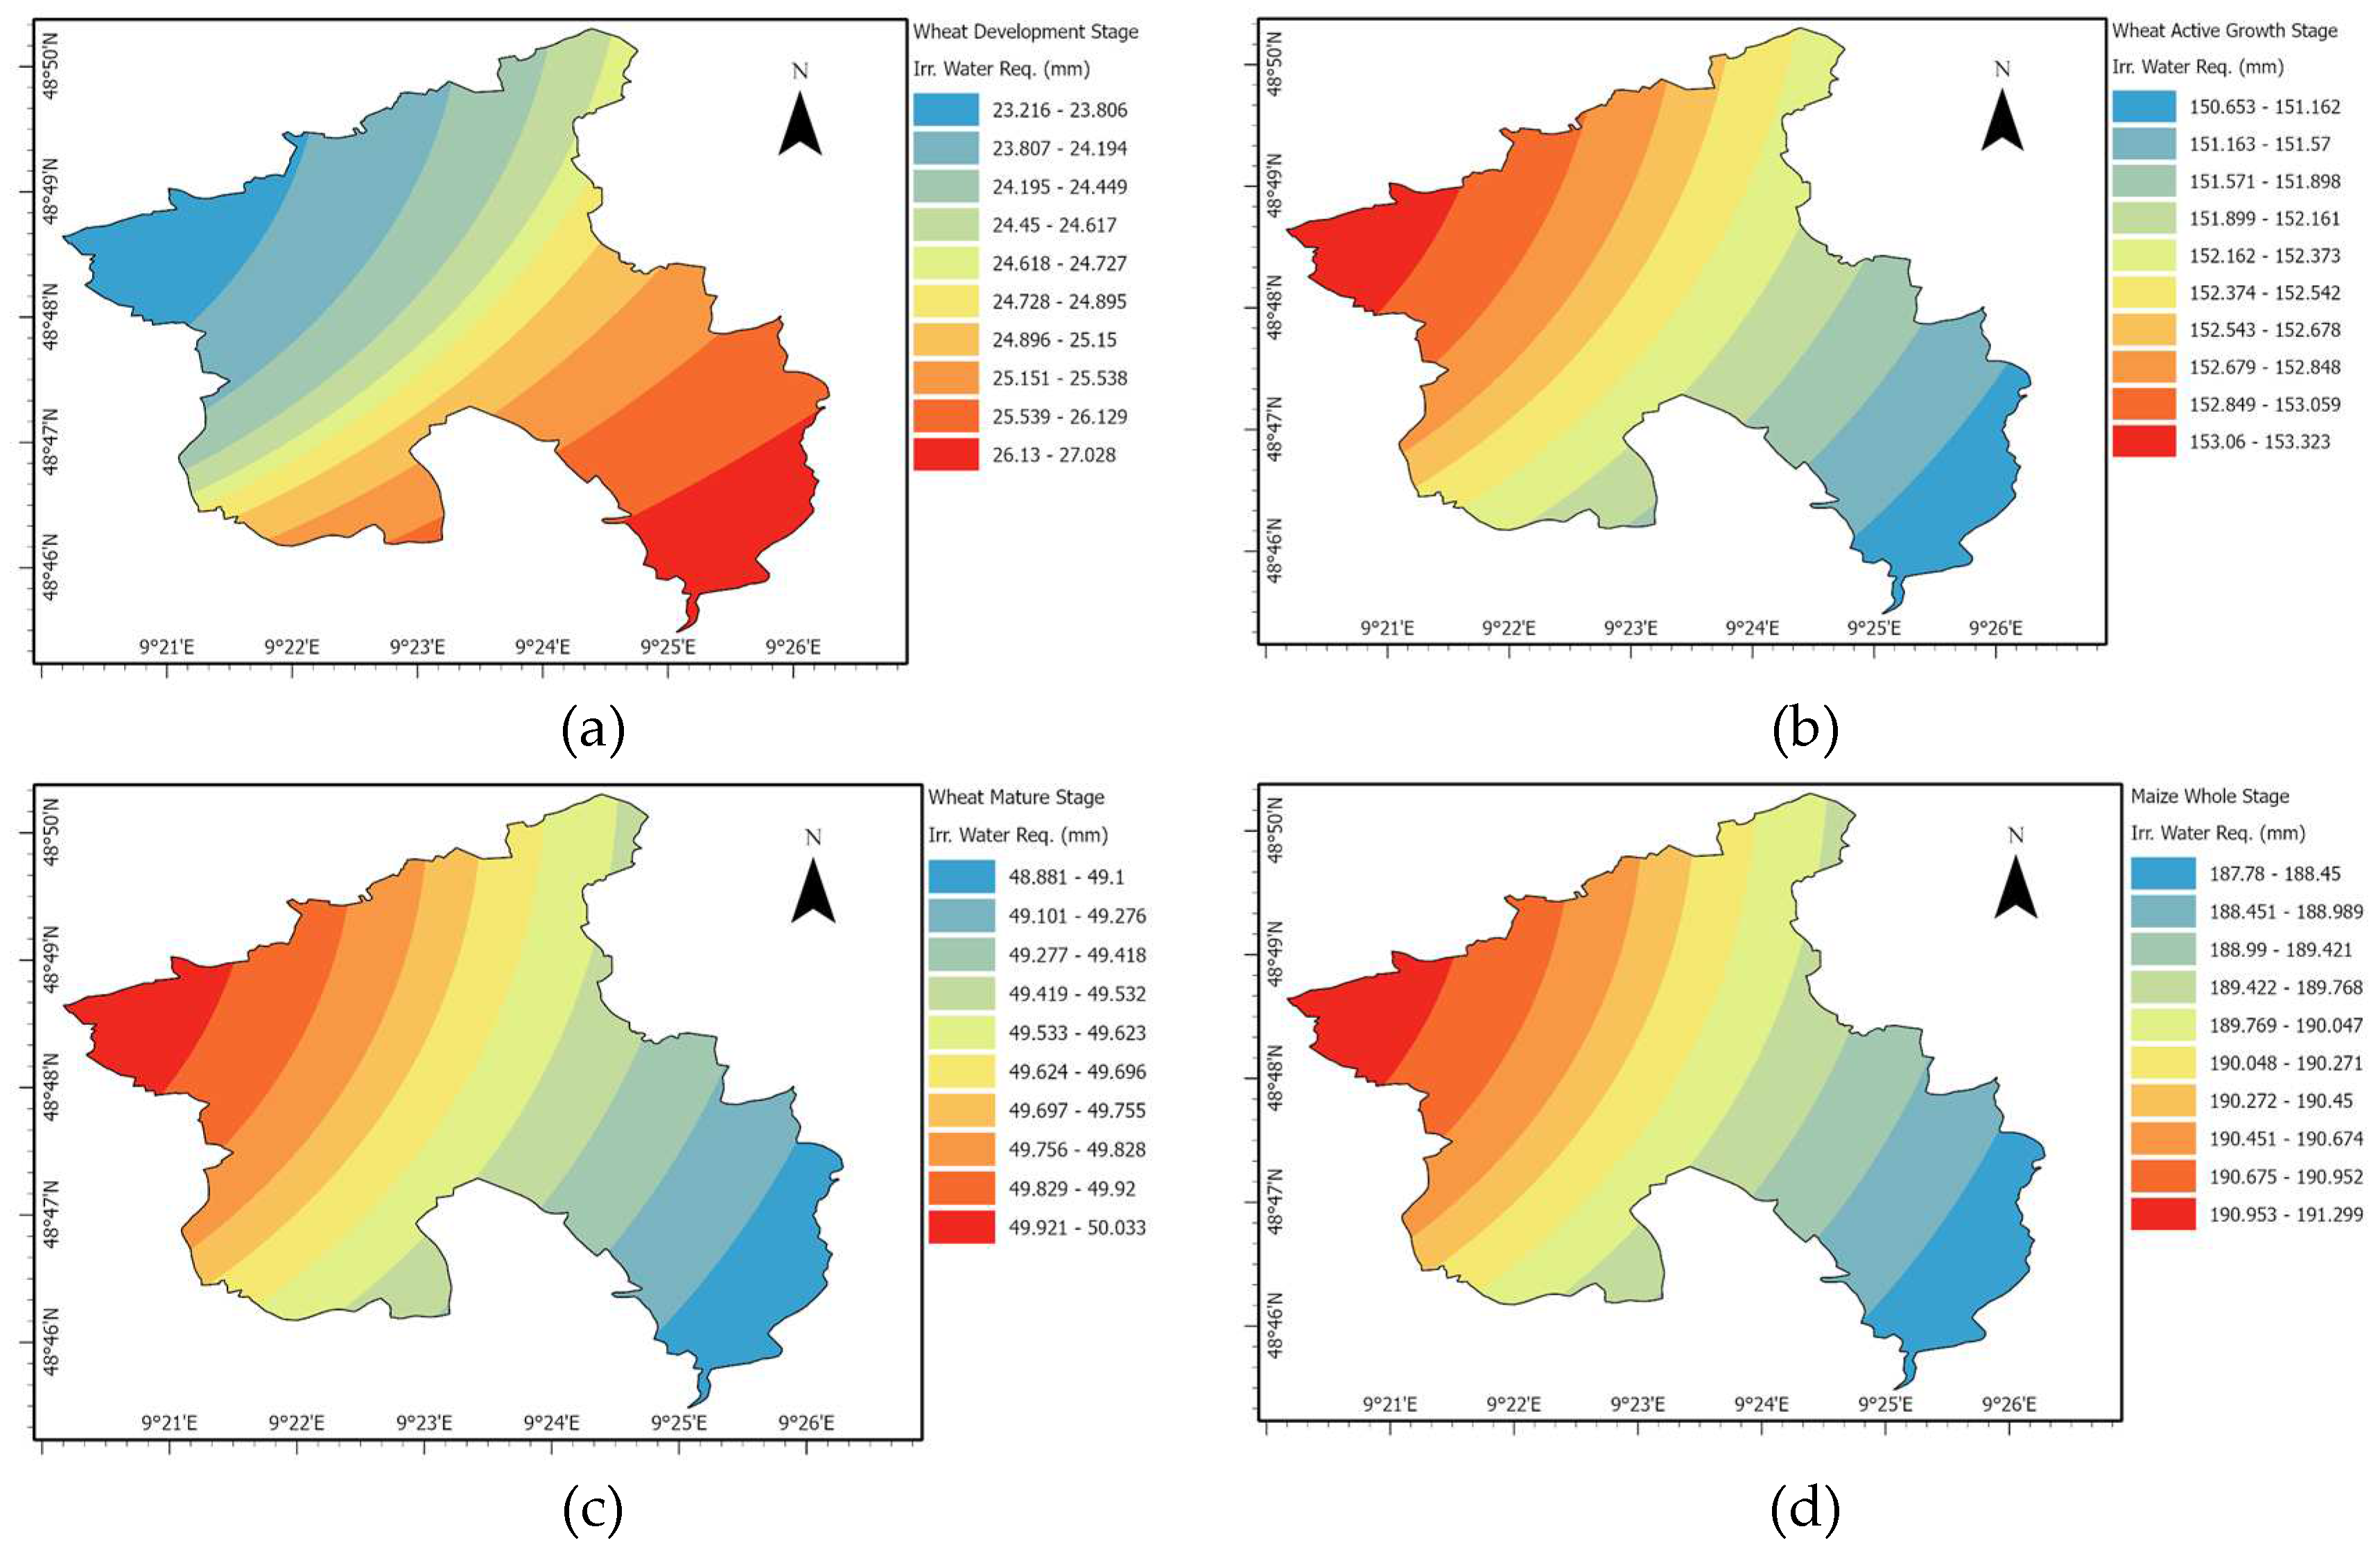
Figure 9.
Agriculture water requirement from CROPWAT model- variation of irrigation water requirement in crop lifecycle.
Figure 9.
Agriculture water requirement from CROPWAT model- variation of irrigation water requirement in crop lifecycle.
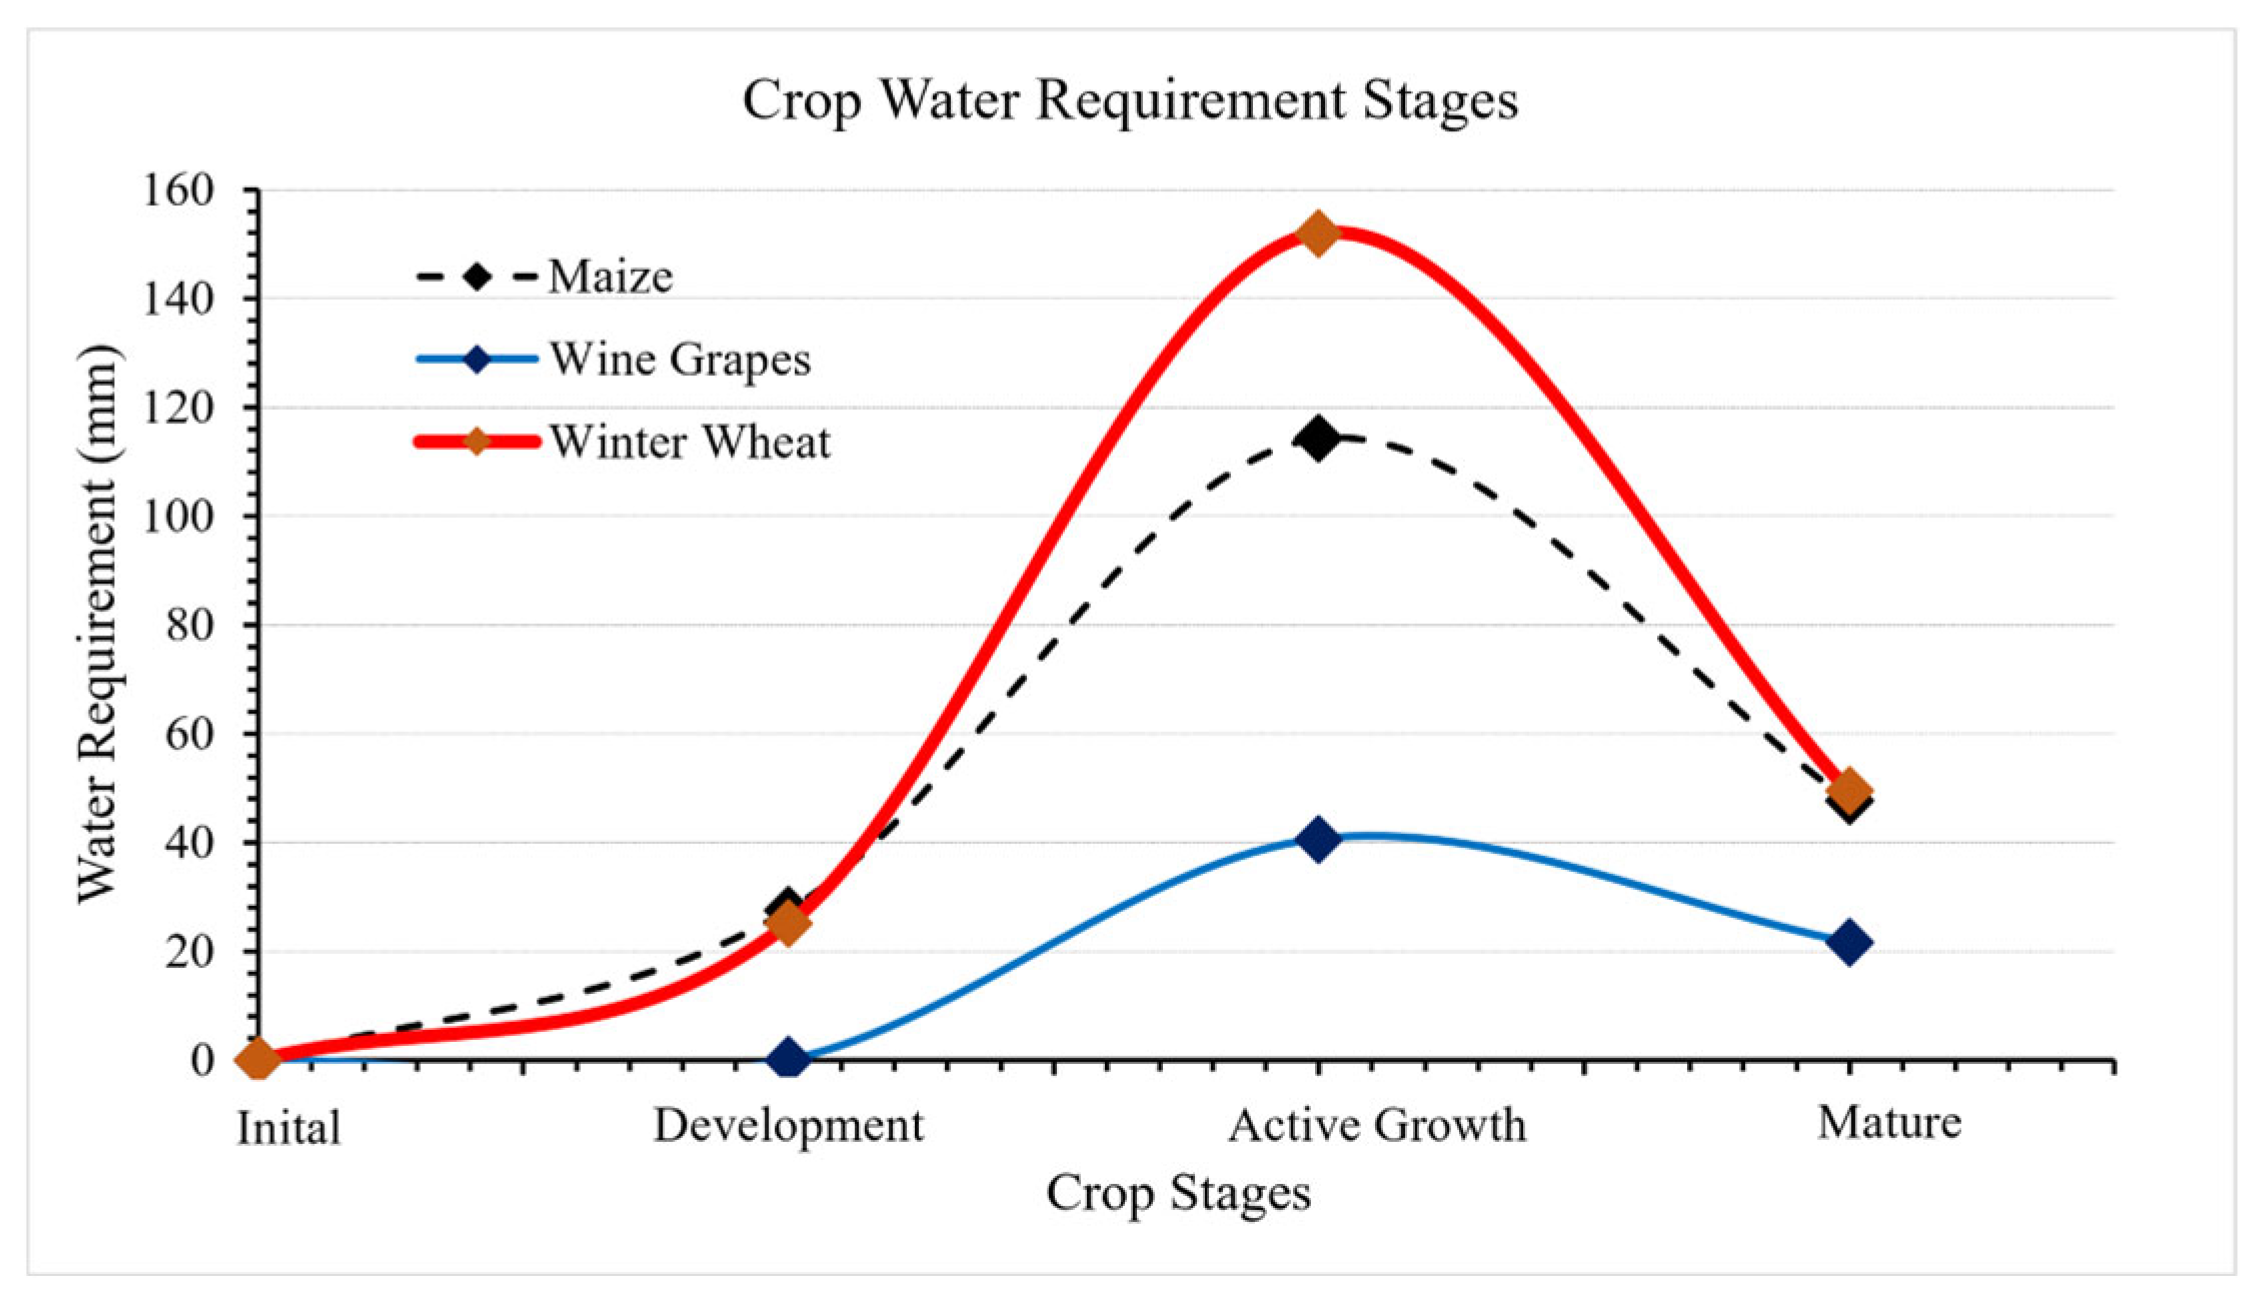
Figure 10.
Zonal IWR severity- (a) cultivated lands for maize and winter wheat; (b) wine orchards & (c) final agriculture IWR zonal severity .
Figure 10.
Zonal IWR severity- (a) cultivated lands for maize and winter wheat; (b) wine orchards & (c) final agriculture IWR zonal severity .
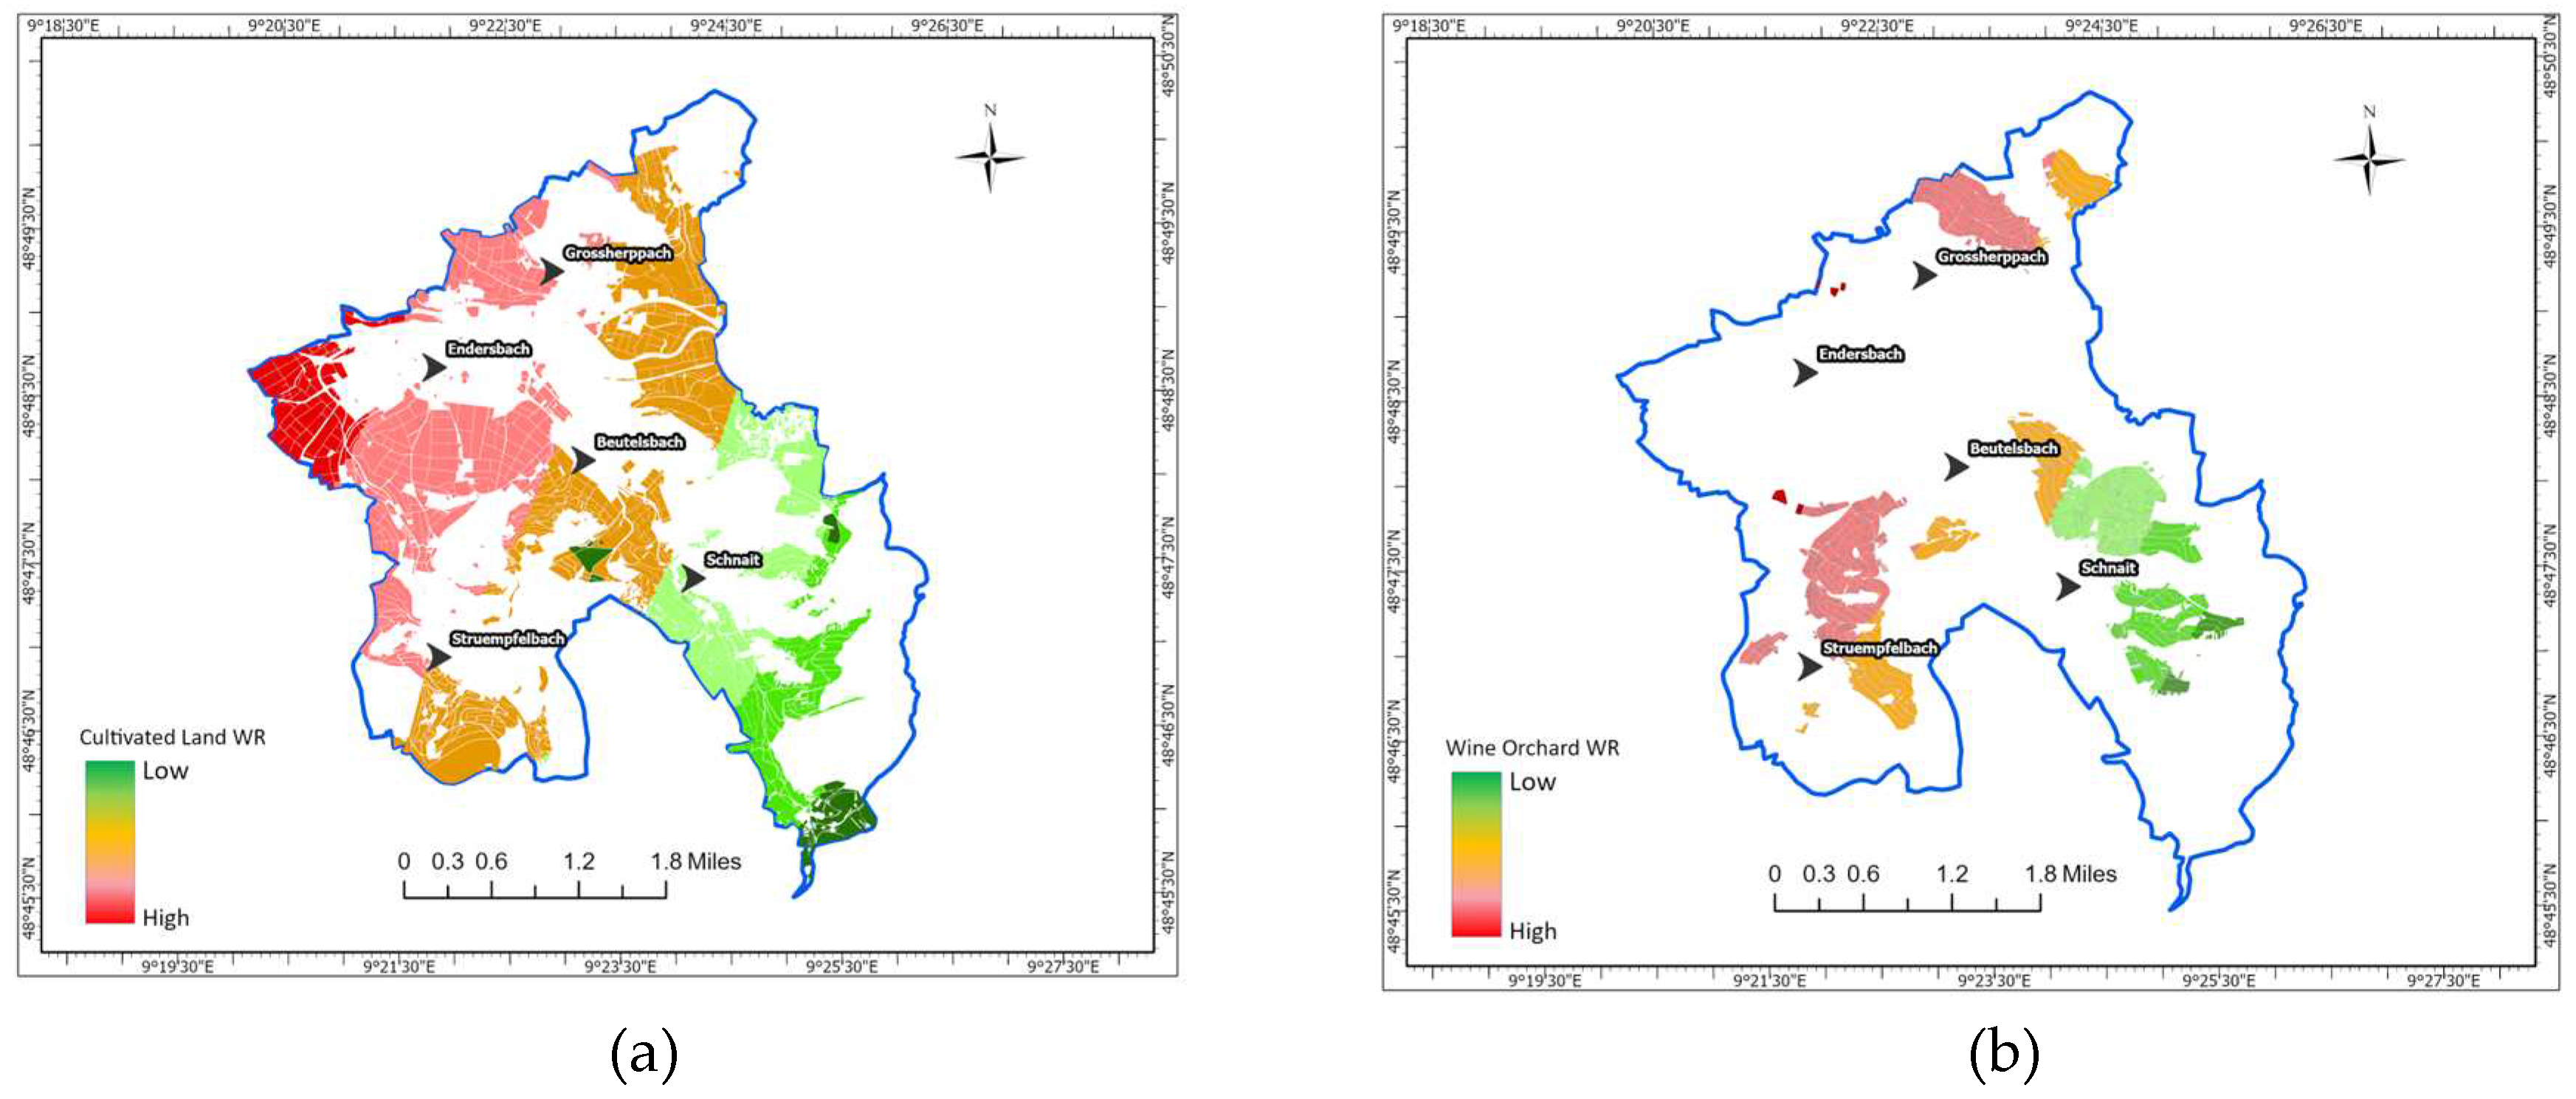
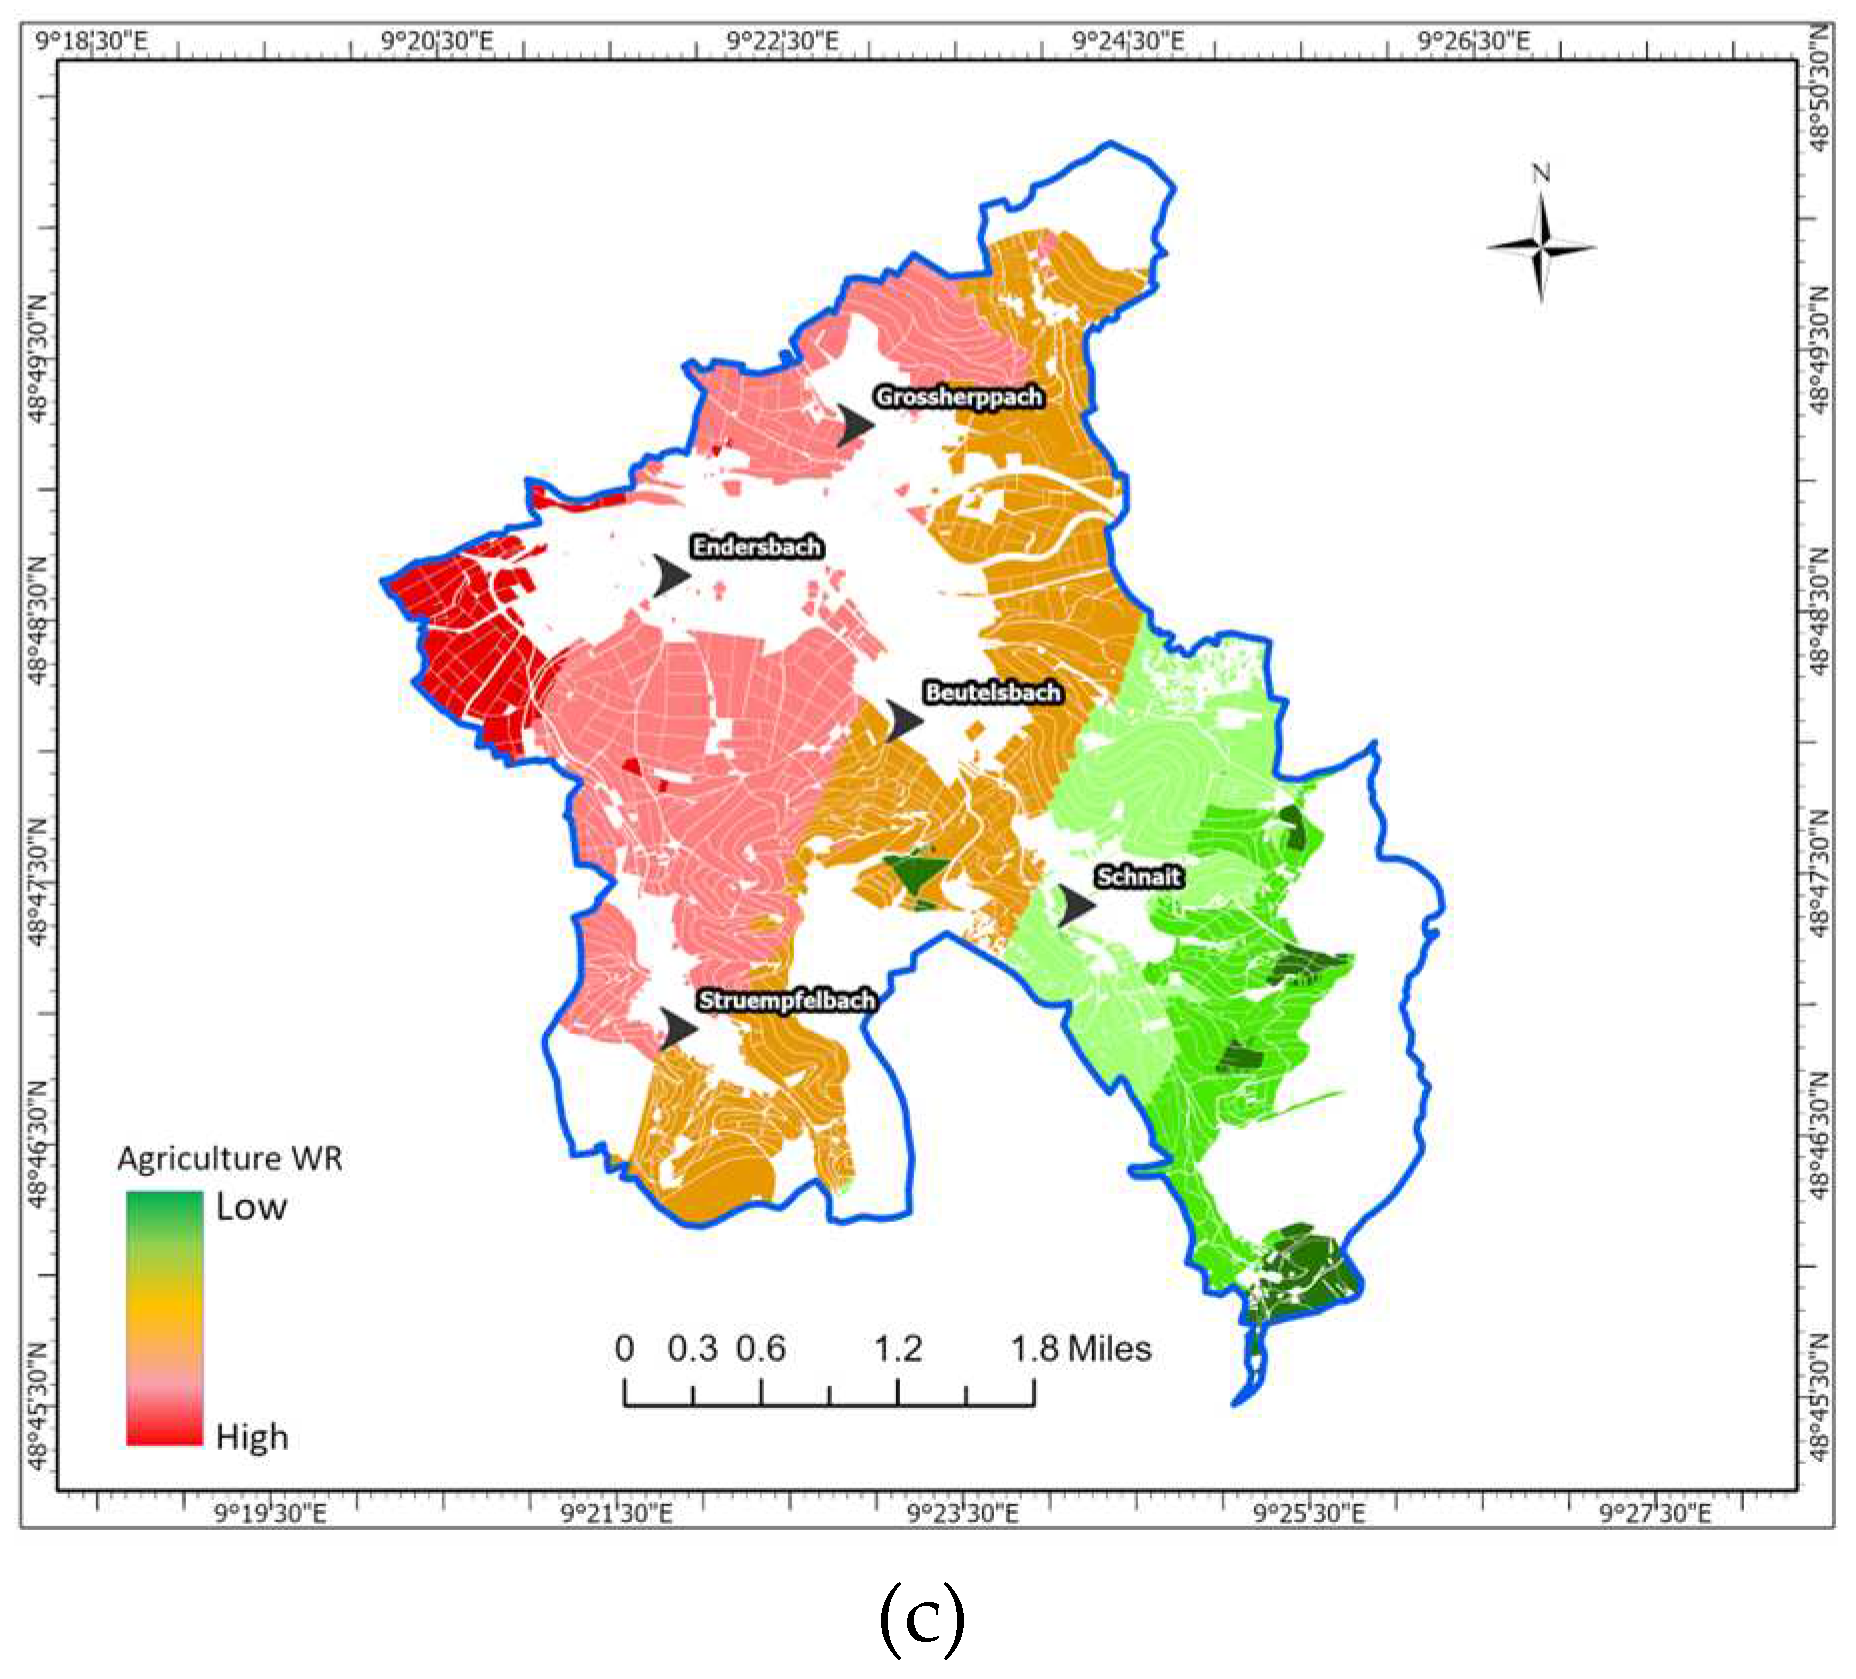
Figure 11.
Volume of harvested water in different roof types- (a) flat roof; (b) pent roof; (c) pitched roof; (d) hip roof; (e) half-Hipped roof; (f) mansard roof; (g) pyramid roof; (h) shed roof; (i) mixed form roof; (j) Miscellaneous roof.
Figure 11.
Volume of harvested water in different roof types- (a) flat roof; (b) pent roof; (c) pitched roof; (d) hip roof; (e) half-Hipped roof; (f) mansard roof; (g) pyramid roof; (h) shed roof; (i) mixed form roof; (j) Miscellaneous roof.
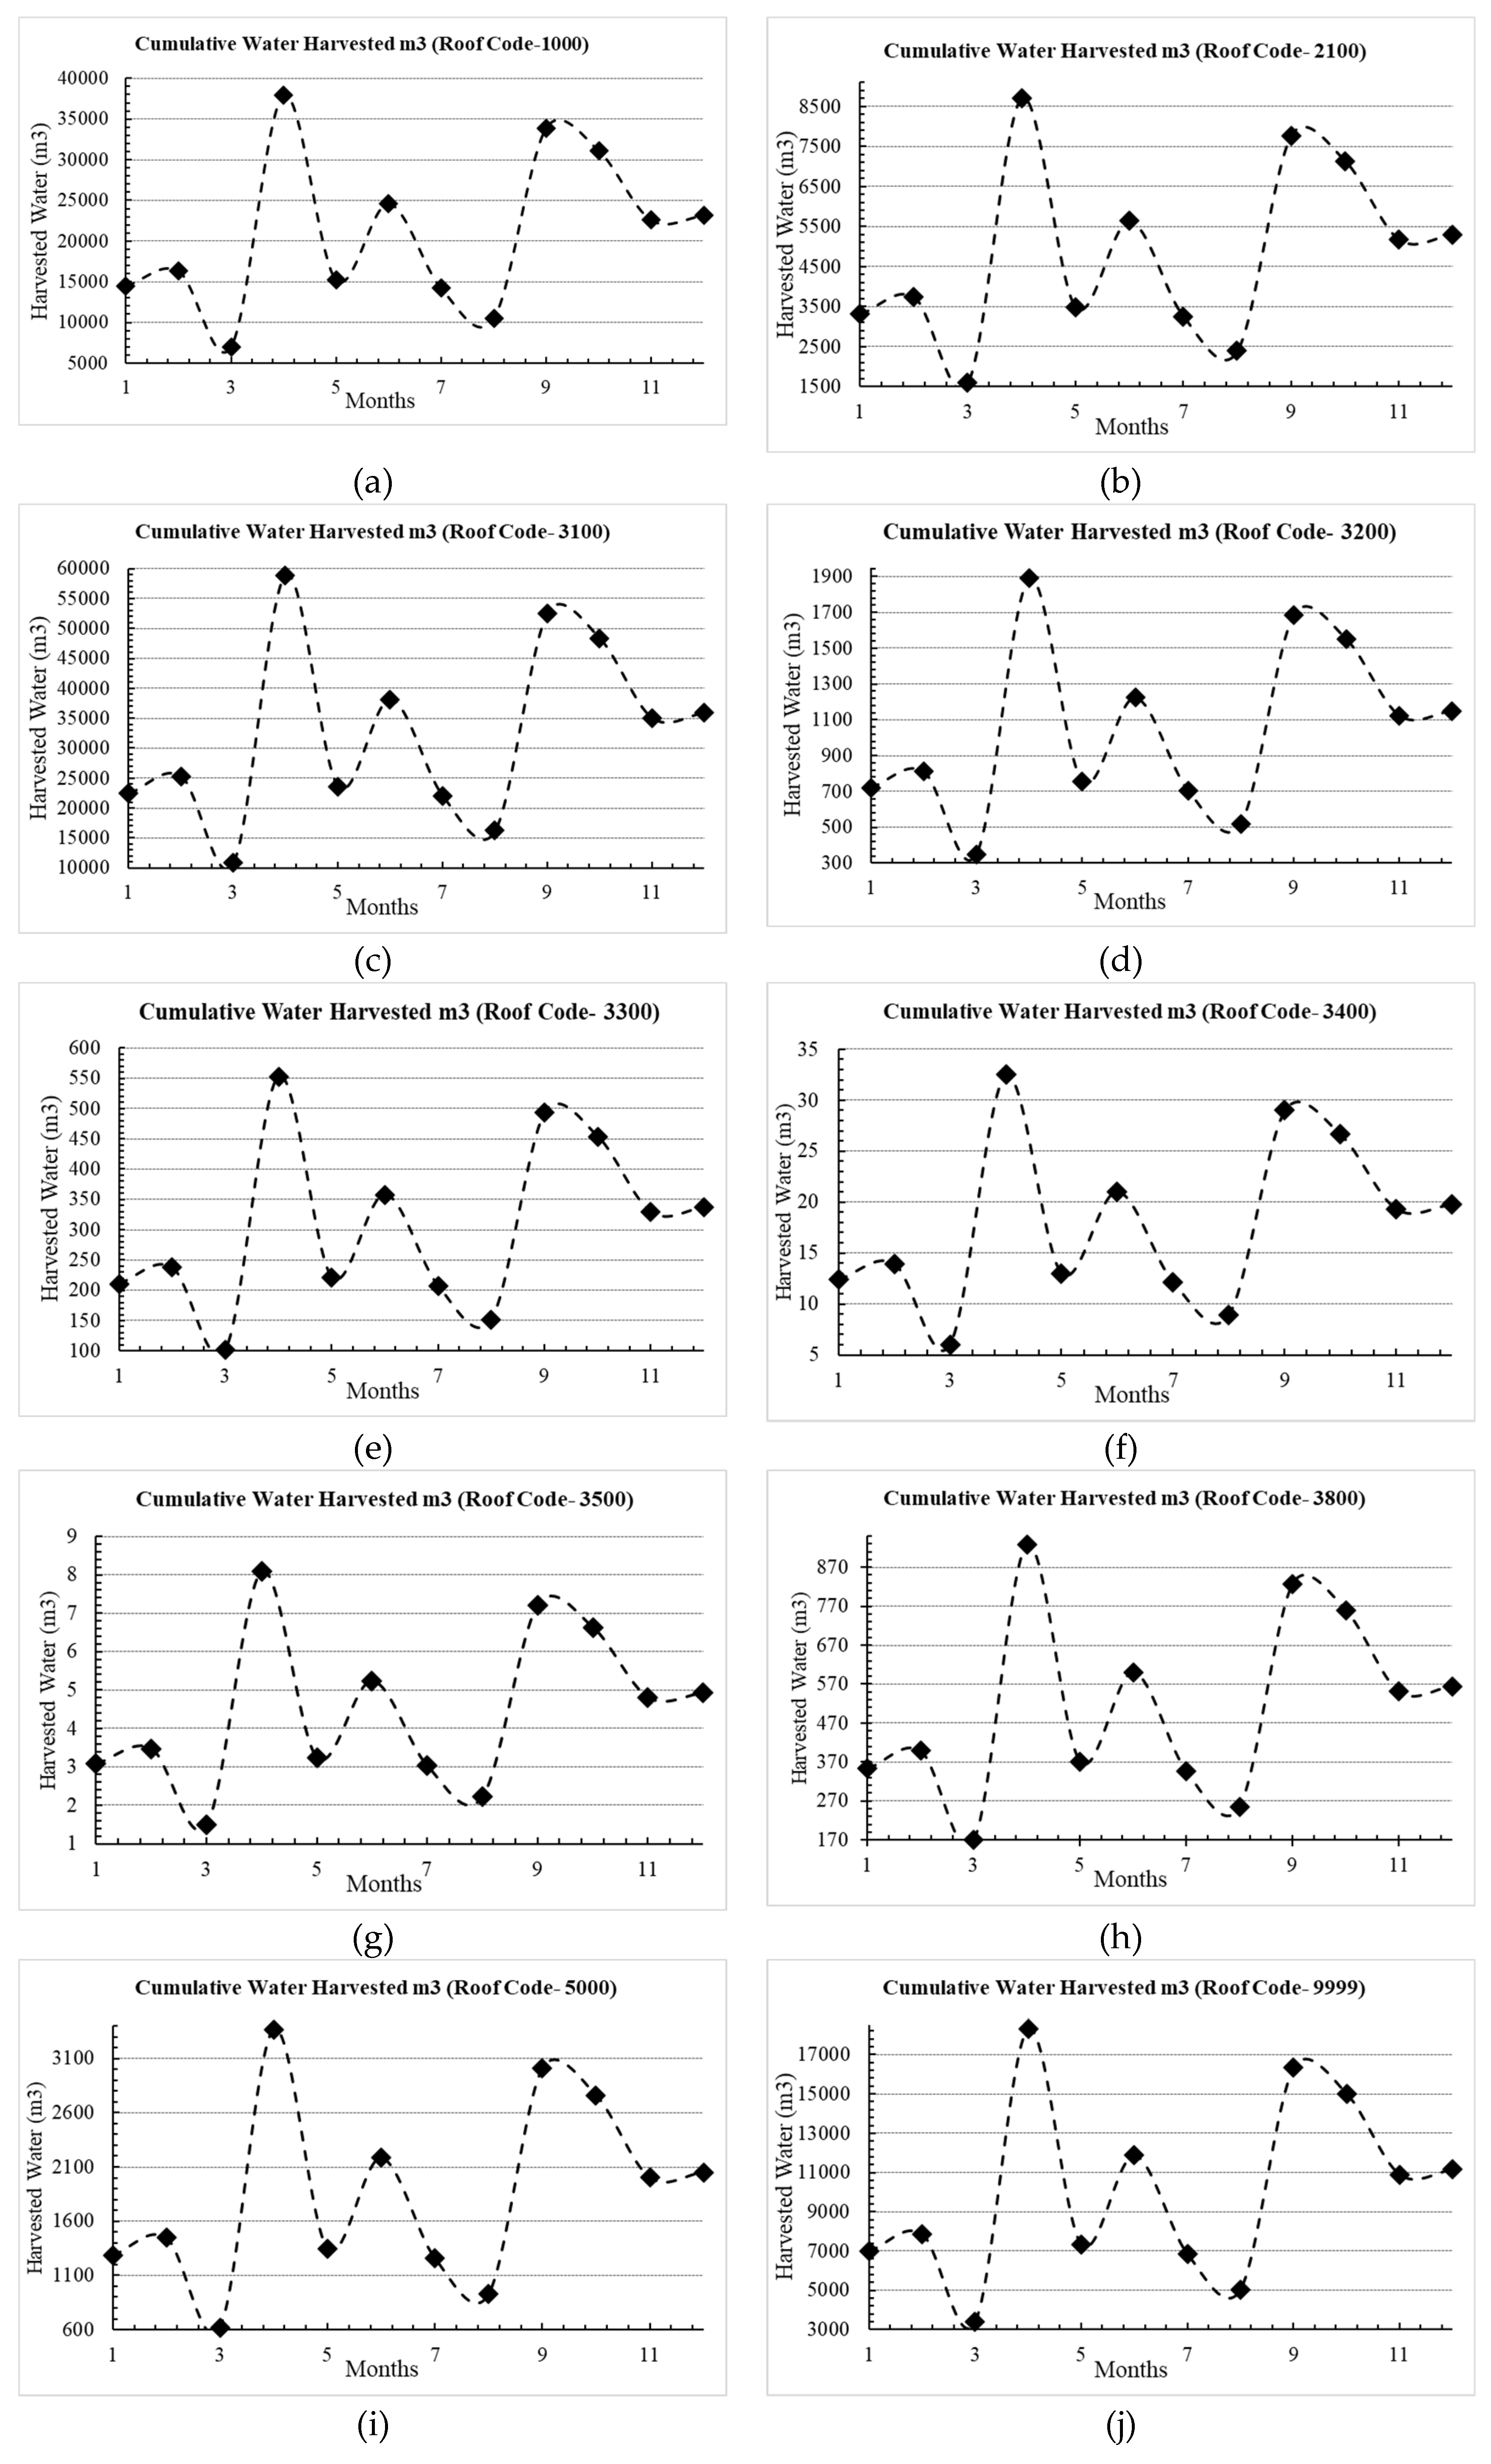
Figure 12.
Symbology of roof types with their rainfall water harvesting capacity- (a) very less water harvesting group; (b) less water harvesting group; (c) moderate water harvesting group; (d) high water Harvesting group; (e) extremely high-water harvesting group. (Source of Basemap: Esri Web Map)
Figure 12.
Symbology of roof types with their rainfall water harvesting capacity- (a) very less water harvesting group; (b) less water harvesting group; (c) moderate water harvesting group; (d) high water Harvesting group; (e) extremely high-water harvesting group. (Source of Basemap: Esri Web Map)
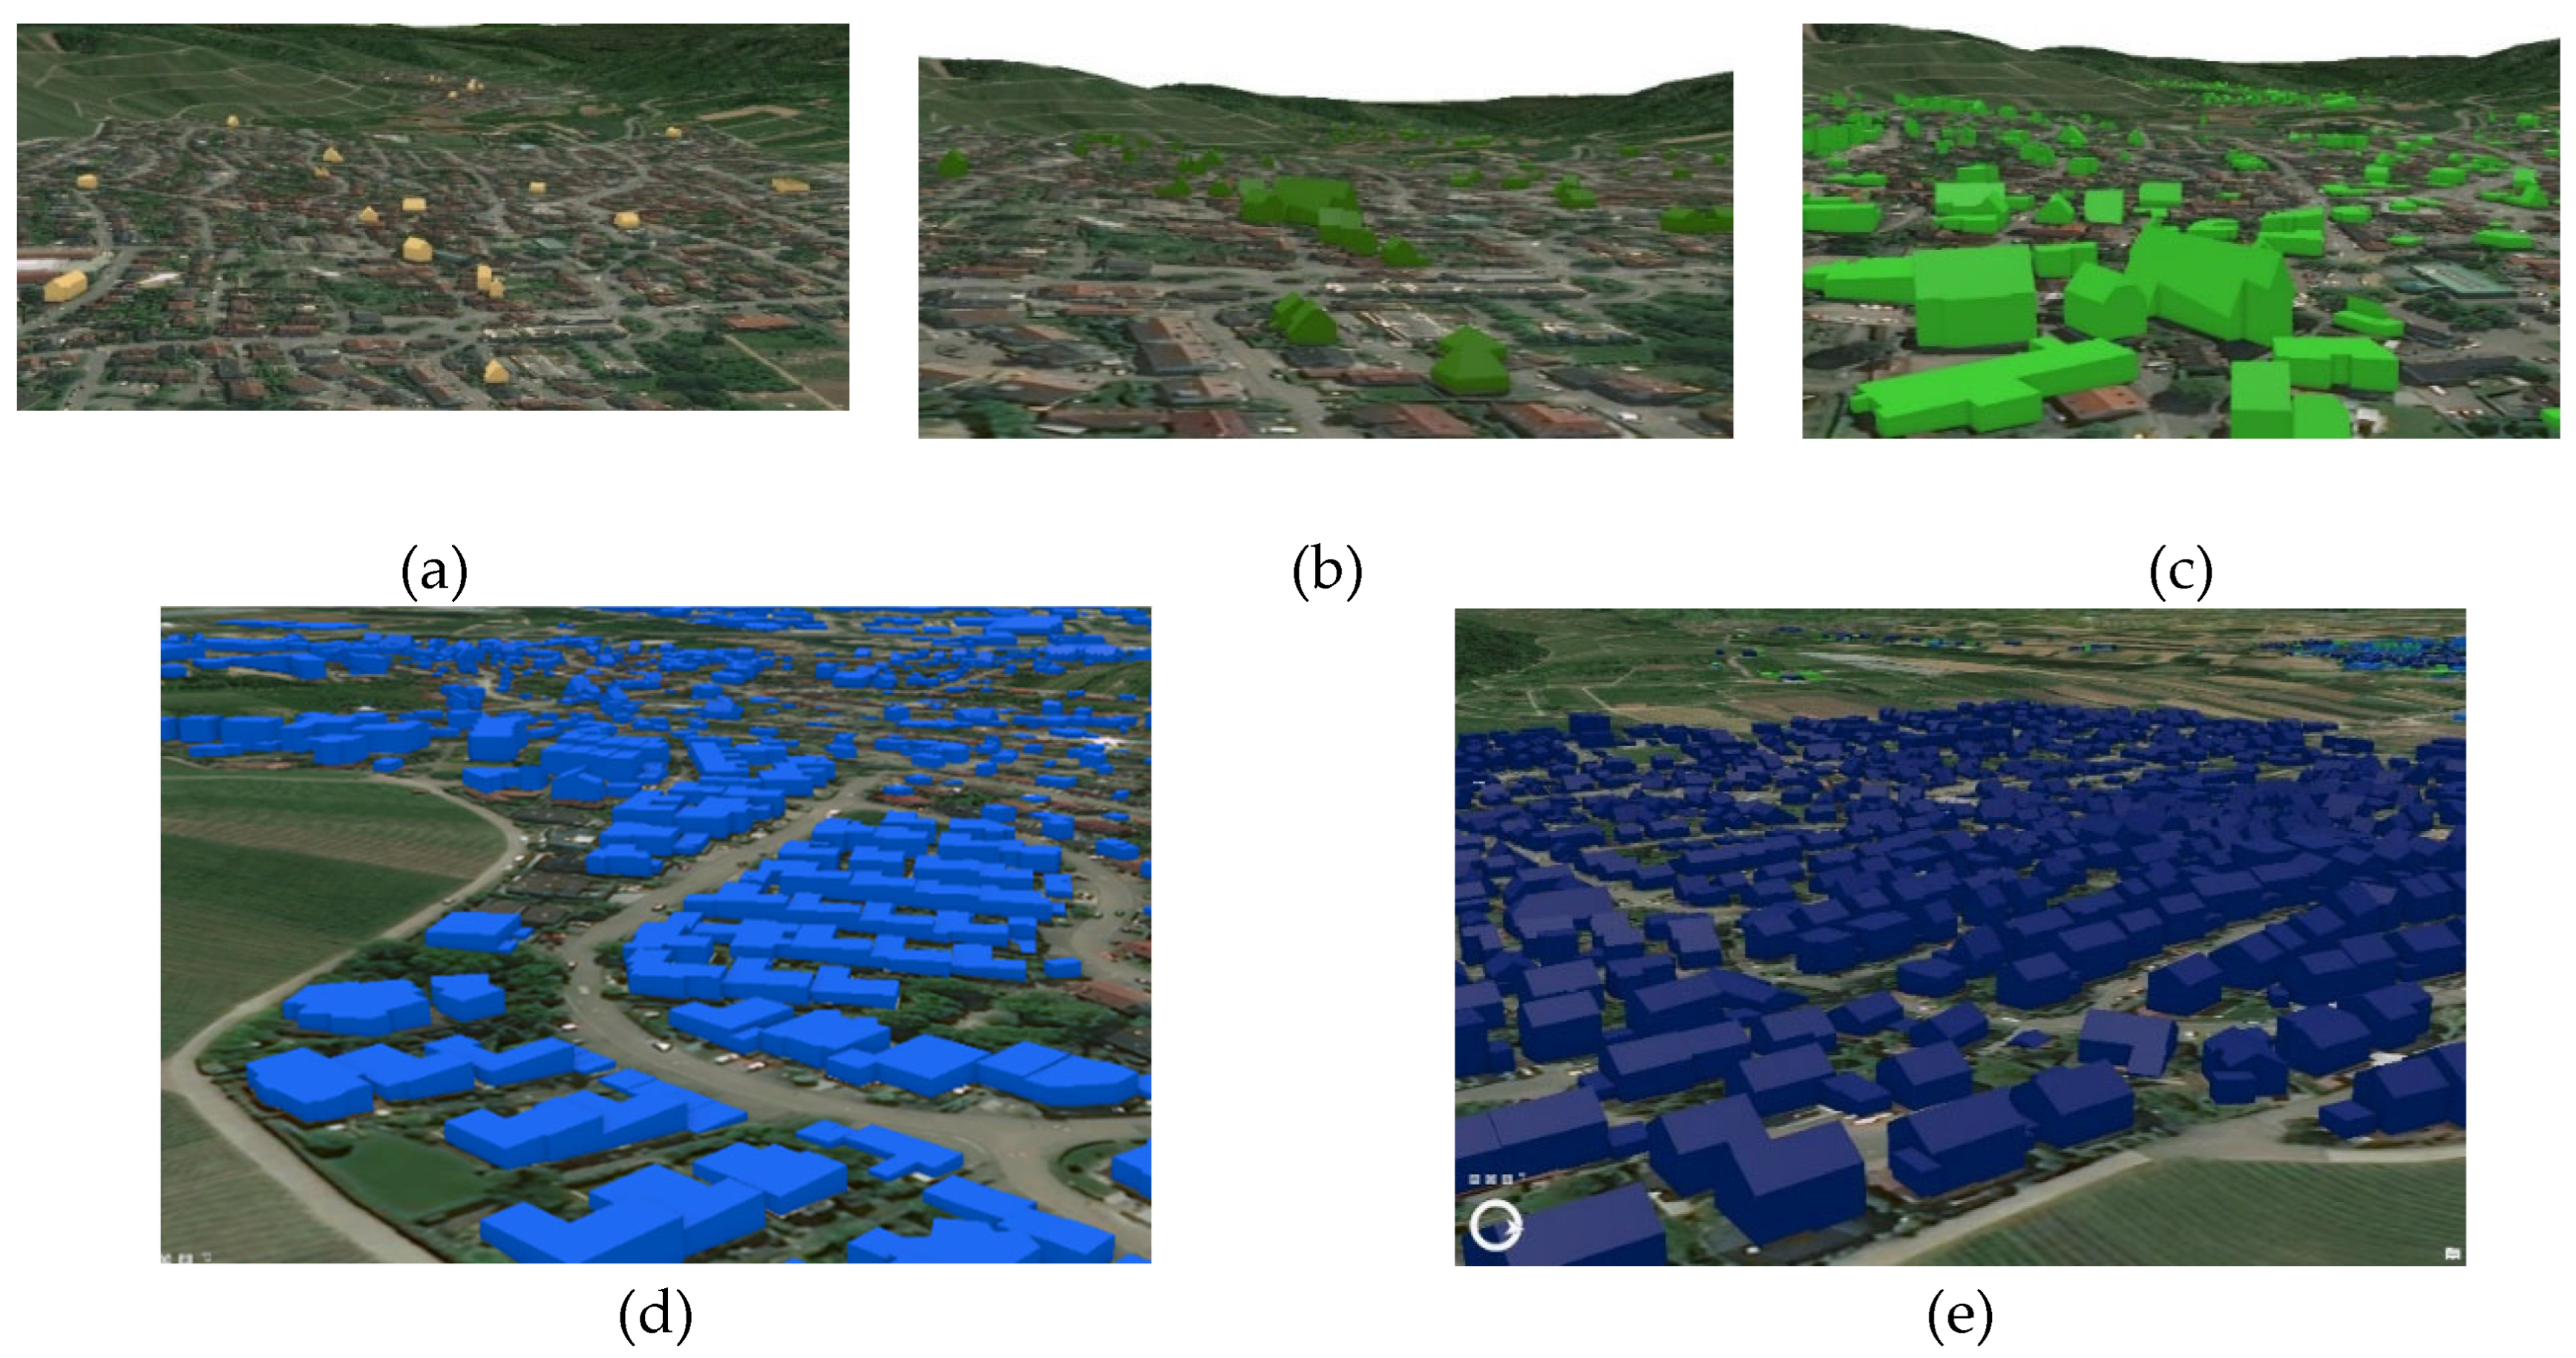
Figure 13.
Potential economic irrigation water value.
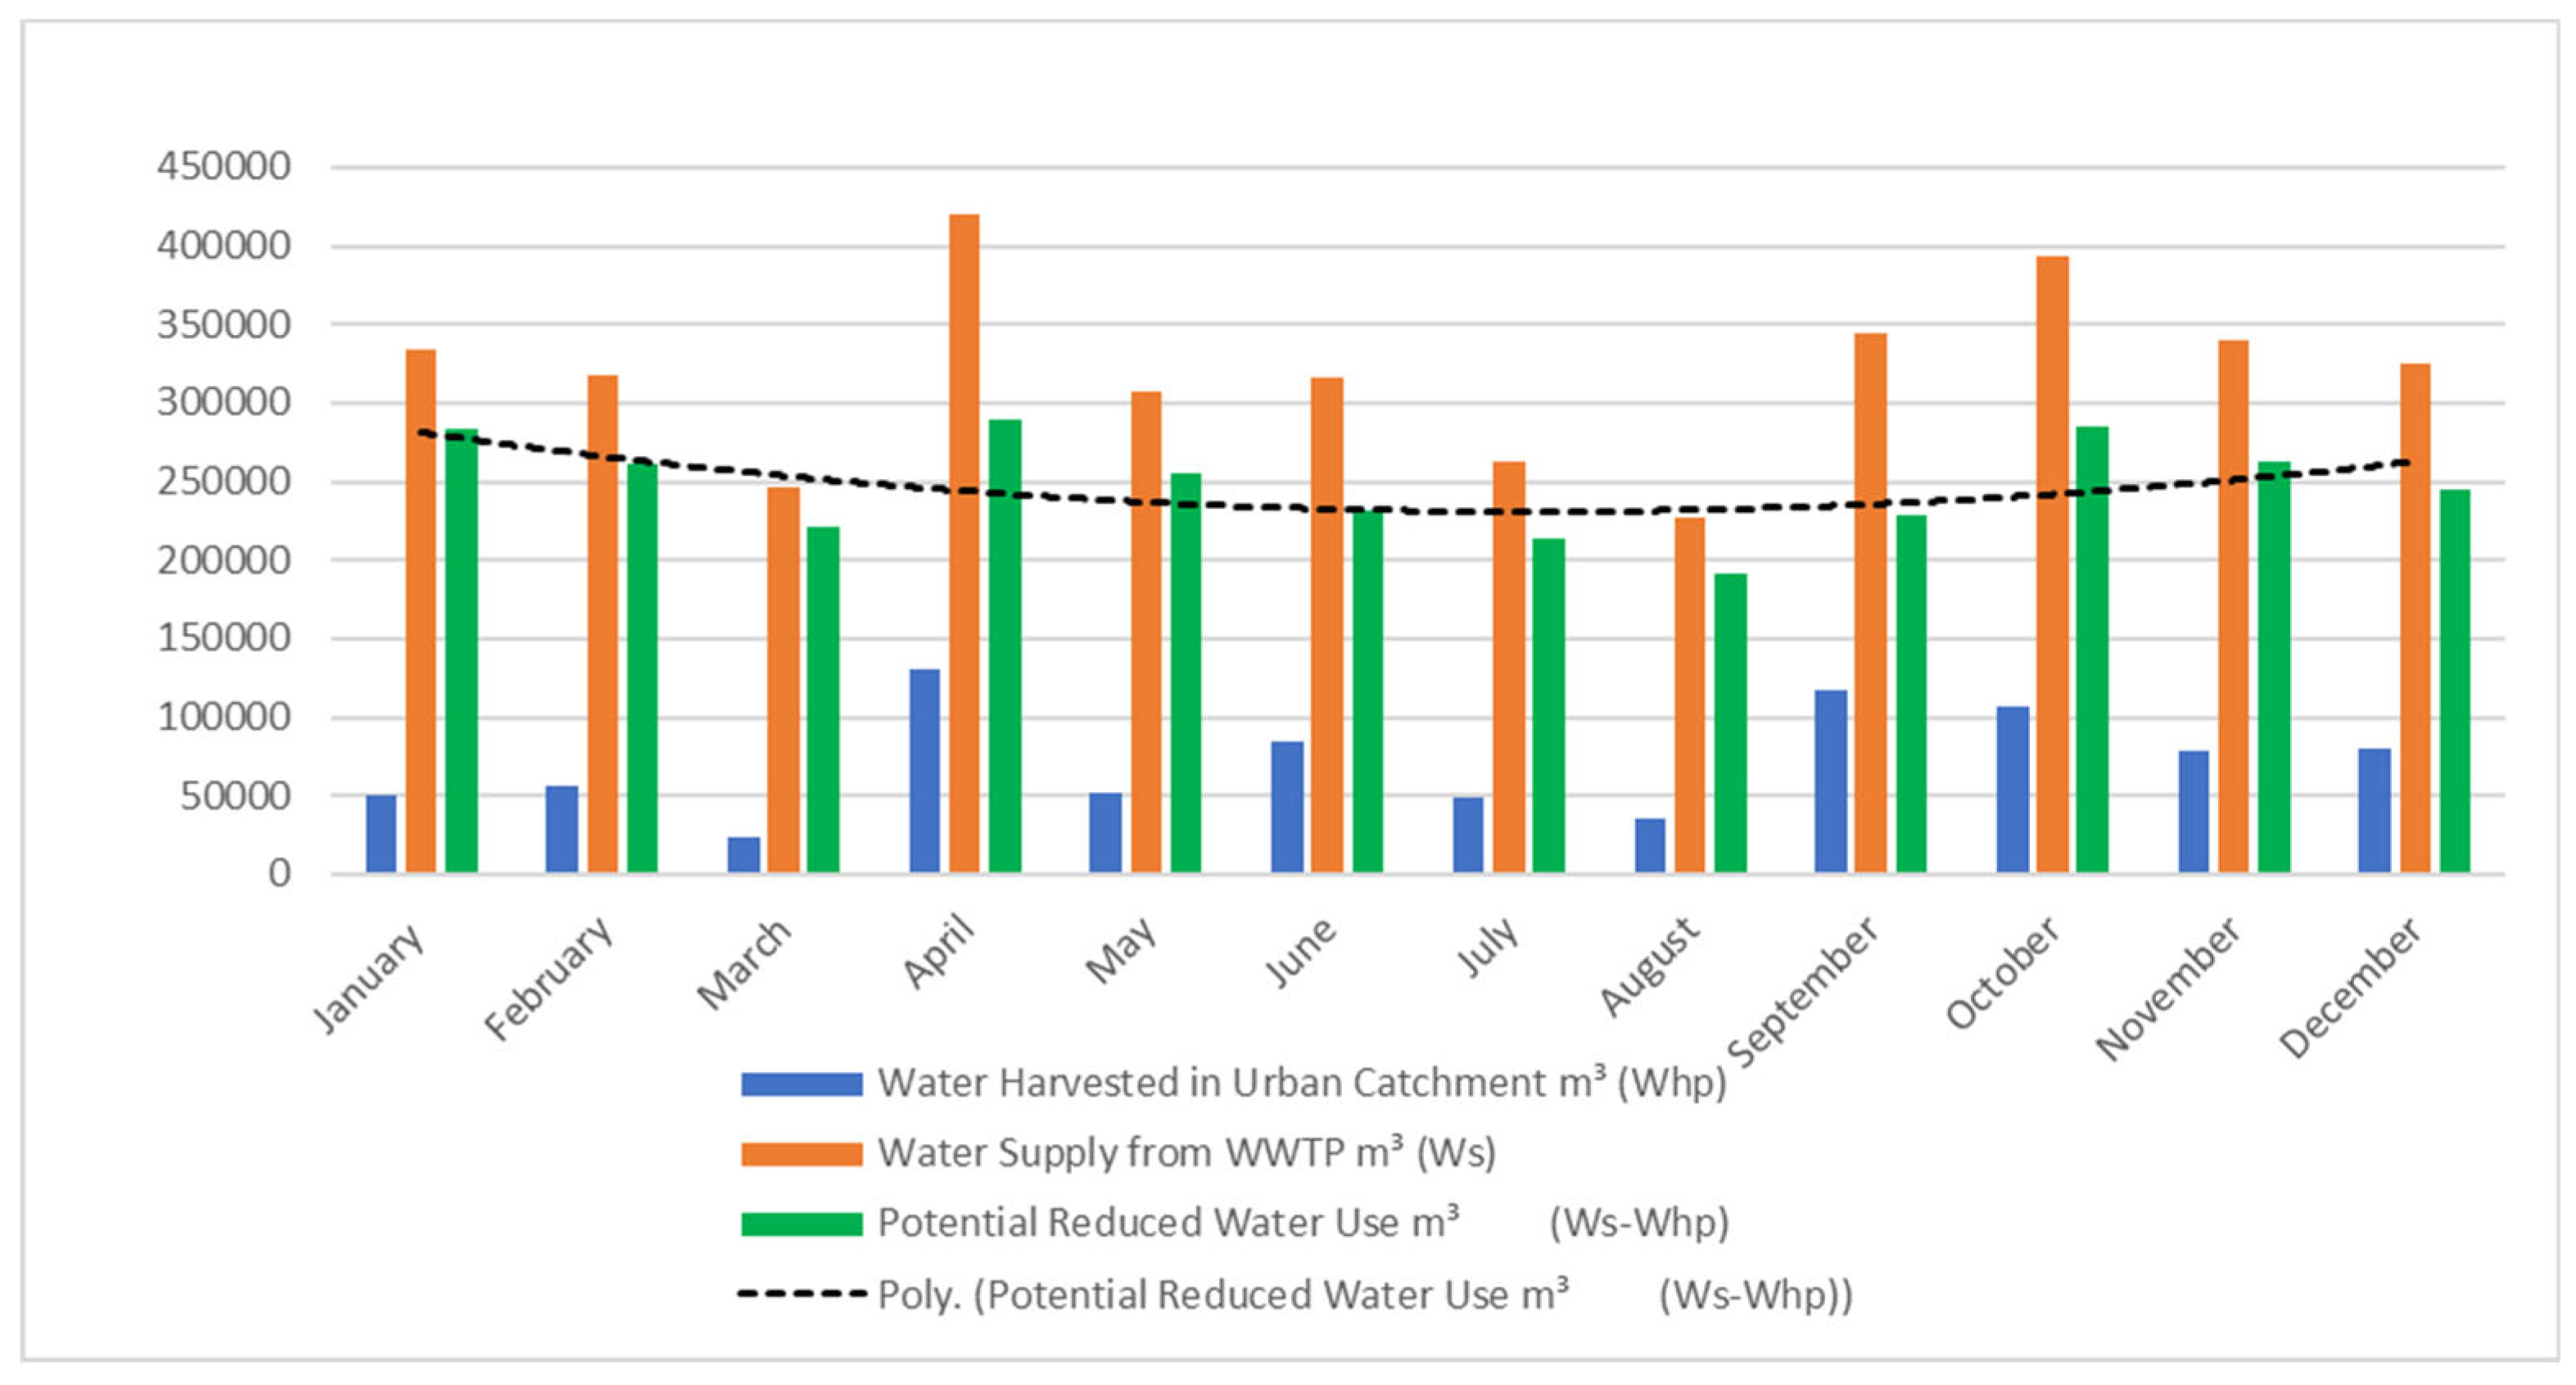
Figure 14.
Percentile of zonal agriculture land sensitivity.
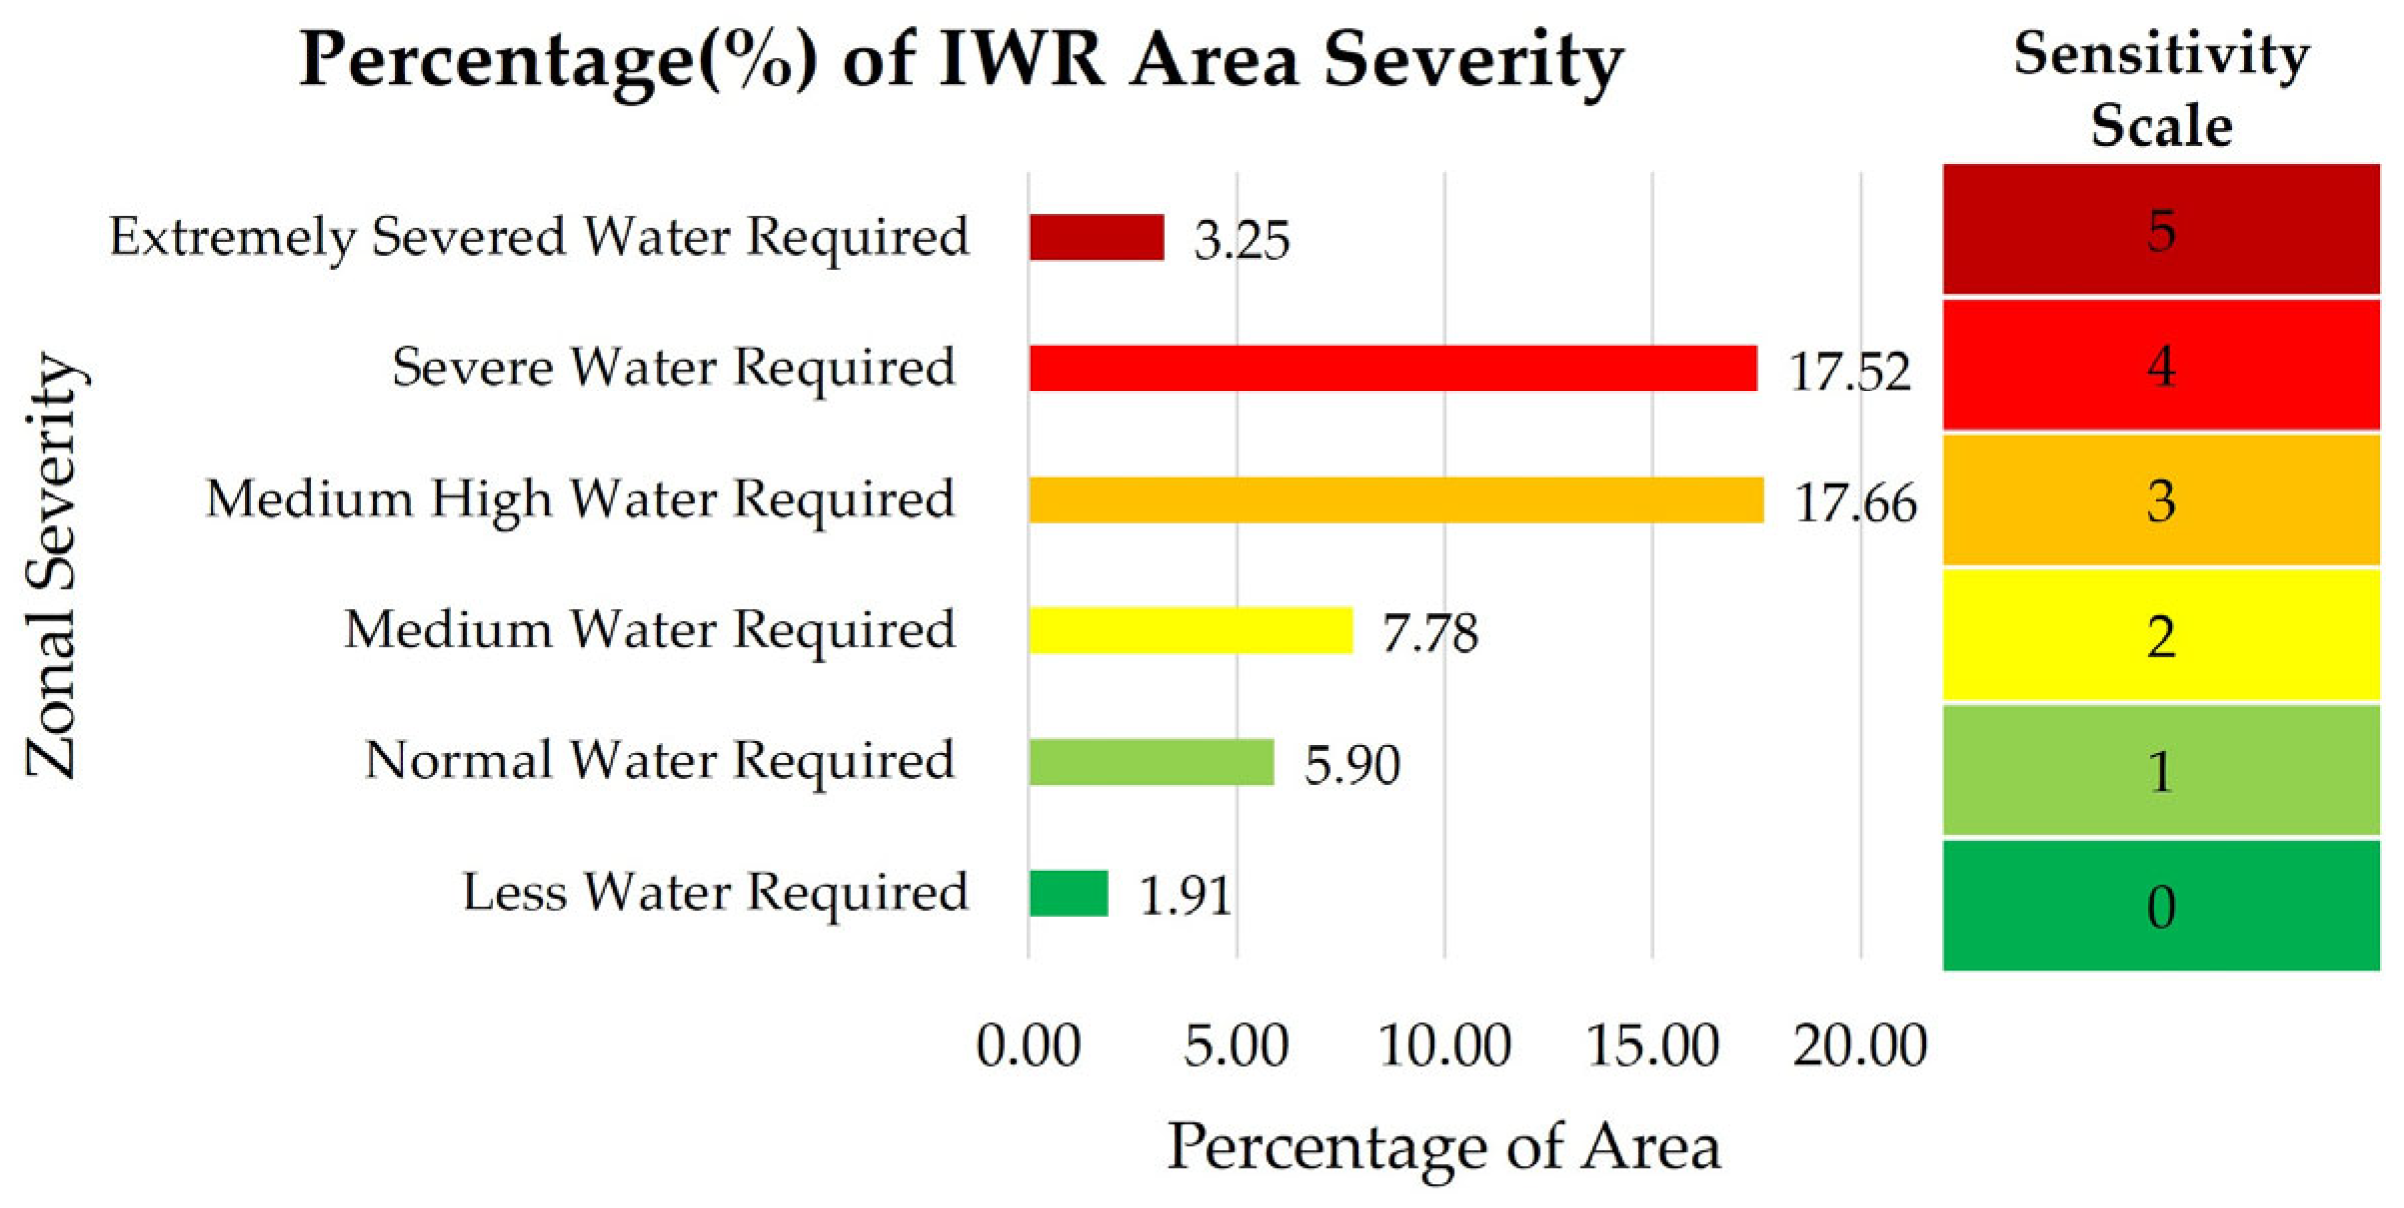
Table 1.
Runoff Co-efficient (Source: [29]).
Table 1.
Runoff Co-efficient (Source: [29]).
| Roof | RC | Reference | |
| Slopping Roof | Concrete/asphalt | 0.9 | (Lancaster, 2006) |
| Metal | 0.95 | (Lancaster, 2006) | |
| 0.81-0.84 | (Liaw & Tsai, 2004) | ||
| Aluminium | 0.7 | (Ward et al., 2010) | |
| Flat Roof | Bituminous | 0.7 | (Ward et al., 2010) |
| Gravel | 0.8-0.85 | (Lancaster, 2006) | |
| Level Cement | 0.81 | (Liaw and Tsai, 2004) |
Table 2.
Volume of total required water in agricultural field of Weinstadt.
| Crop Name | Area (m2) |
Potential Irrigation Water Requirement (mm) | Total Water Requirement (m3) |
| Maize | 3,750,000 | 189.00 | 708,750 |
| Winter Wheat | 8,750,000 | 223.3 | 195,3875 |
| Wine Grapes | 4,700,000 | 60.92 | 286,324 |
| Total | 2948949 | ||
Table 3.
Parameters and outputs comparison with previous research.
| References | Datasets & Time Frame | Methodological Philosophy | Research Methods |
Findings | Study Regions |
| [30] | Wastewater treatment plant nominal flow rate, soil textures and depth, Land use, DEM; TimePeriod:2009/2010 (Landsat TM imagery), 2000 (Google Earth data and Land use map) |
Analytical Hierarchical Process for Geospatial integration | Study area characterization by classification, standardizing the sub criteria, Sensitivity analysis and cross validation | 31% of the aquifer is fitting for irrigation, GIS sensitivity ranking cases 1-5. | Tunisia |
| [24] | Agro Climatic Data, Crop data showing and harvesting; Time Period: 2017-2021 (Agroclimatic data) |
Irrigation water requirement (IWR) and irrigation scheduling for cultivated crops | CROPWAT Model for calculation of Eto and effective rainfalls, calculation of evapotranspiration | IWR: 3108.0 mm-Sugarcane, 1768.5 mm- banana, 1655.7 mm- cotton, 402.5 mm - wheat | Pakistan |
| [12] | Ago-Ecological datasets, Crop data; Time Periods: Not defined |
Total water requirement in various agro-ecological zone in order to estimate ground water balance | CROPWAT Model 8.0 used to calculation of Evapotranspiration | Net irrigation requirement: Peddy: 442 to 1483 mm; Water demand: 1146 Mm3 | India |
| [15] | CROPWAT stations dataset and crops data; Time Period: Not defined |
Irrigation water Requirement estimation for spatial modeling | CROPWAT Model for crop water requirement and Water qualitative measurements | IWR: 763 mm/year-Citrus, 722mm/year-Almonds, 1083 mm/year-Date palm, 591 mm/year-Grapes. | Palestinian |
| [14] | Meteorological Data; Time Period: 1961 to 2001 |
Spatial distribution of crop water requirement | CROPWAT model for irrigation water requirement and irrigation scheduling, DEM based methods | Spatial Distribution of ETc of spring maize 324.57-500.55 mm; Water deficit Ratio upto 40% | China |
| [20] | Daily Rainfall, 2D & 3D model of Building; Time Period: January 2014 – December 2018 (Daily Rainfall) |
Rainwater harvesting assessment through Building Information Modeling (BIM) | Calculation of potential roofing catchment size, rainwater harvesting potential and fixing of tank capacity | Collected harvested rainfall water volume: 8,190 L/yr to 103,300 L/yr | Pakistan |
| [21] | CityGML building Models; Time Period: Not defined |
Urban water demand assessment | Implementation of water analysis workflow of SimStadt, log-log model for Water demand assessment | Industrial water demand: 397 to 579 m3 and Predicted precipitation: 248 mm by 2030 | Germany |
| Our Proposed Methodology | Climate Dataset, Waster water treatment Plant water supply volume, ALKIS Maps Time Period: 1991- 2021 (Temperature, Humidity, Rainfall),1991-2019(Sunshine Hours), 2022 (Wind speed), 2021-2022 (WWTP supply), 2021 (ALKIS maps) |
Agriculture water demand assessment by using the potentiality of urban rainwater harvesting and wastewater treatment plant supply | Employment of CROPWAT Model for IWR, Zonal severity analysis, Urban roof catchment area measurement, economic value. | IWR estimation: 189 mm-maize, 22 3mm- winter wheat, 60.92 mm for wine grapes, Spatial Volume of IWR 2948949 m3/yearly. Sensitivity phases 0-5. Rainfall water harvested volume: 864139.075 m3/yearly | Germany |
Disclaimer/Publisher’s Note: The statements, opinions and data contained in all publications are solely those of the individual author(s) and contributor(s) and not of MDPI and/or the editor(s). MDPI and/or the editor(s) disclaim responsibility for any injury to people or property resulting from any ideas, methods, instructions or products referred to in the content. |
© 2023 by the authors. Licensee MDPI, Basel, Switzerland. This article is an open access article distributed under the terms and conditions of the Creative Commons Attribution (CC BY) license (http://creativecommons.org/licenses/by/4.0/).
Copyright: This open access article is published under a Creative Commons CC BY 4.0 license, which permit the free download, distribution, and reuse, provided that the author and preprint are cited in any reuse.


