1. Introduction
The realm of renewable energy in Poland, particularly within the domain of photovoltaics (PV), is experiencing a notable surge. Diverse elements are driving the progress of PV technology in the country, paralleling trends across various European Union (EU) member nations [1,3]. Poland, like its counterparts, has set ambitious targets for integrating renewables into its energy matrix, igniting substantial interest and investments in solar energy and PV advancements. To galvanize the growth of these initiatives, the government has strategically implemented an array of support mechanisms including feed-in tariffs, auctions, and subsidies, specifically tailored to nurture renewable energy ventures, especially in the PV sector. As a participant in EU programs dedicated to renewable energy adoption, Poland is harnessing financial aids that expedite the transition to sustainable energy sources, further catalyzing PV projects nationwide.
Remarkably, the cost of PV technology has been progressively diminishing, enhancing the economic viability of solar energy. This reduction in costs has amplified the allure of solar investments for both financial backers and consumers, aligning with the broader goal of diminishing reliance on imported fossil fuels. Noteworthy emphasis has been placed on bolstering domestic renewable energy capacities, exemplified by the focus on solar power. The resilience and security of Poland’s energy landscape have been augmented as PV technology diversifies the energy portfolio. An impressive milestone achieved between 2019 and 2022 involved the establishment of over one million PV micro-installations, predominantly targeting individual households. These micro-installations are thoughtfully customized to harmonize with distinct energy consumption patterns over varying timespans, complying meticulously with Poland’s regulatory guidelines for prosumers.
The core objective of this investigation revolves around assessing the viability and precision of PV energy production calculations tailored to Poland’s conditions. Researchers have identified existing energy production estimation methods as potentially flawed due to inadequacies in accounting for geographical features, local conditions, wind dynamics, and the inherent characteristics of PV panels. In this pursuit, Deep Neural Network (DNN) methodologies take the forefront, particularly focusing on hybrid architectures that incorporate Long Short-Term Memory (LSTM) elements [2,4,5,6]. These advanced models are poised to revolutionize energy pricing predictions, providing a more accurate and effective framework for this evaluation.
2. Materials and Methods
2.1. DNN model architecture
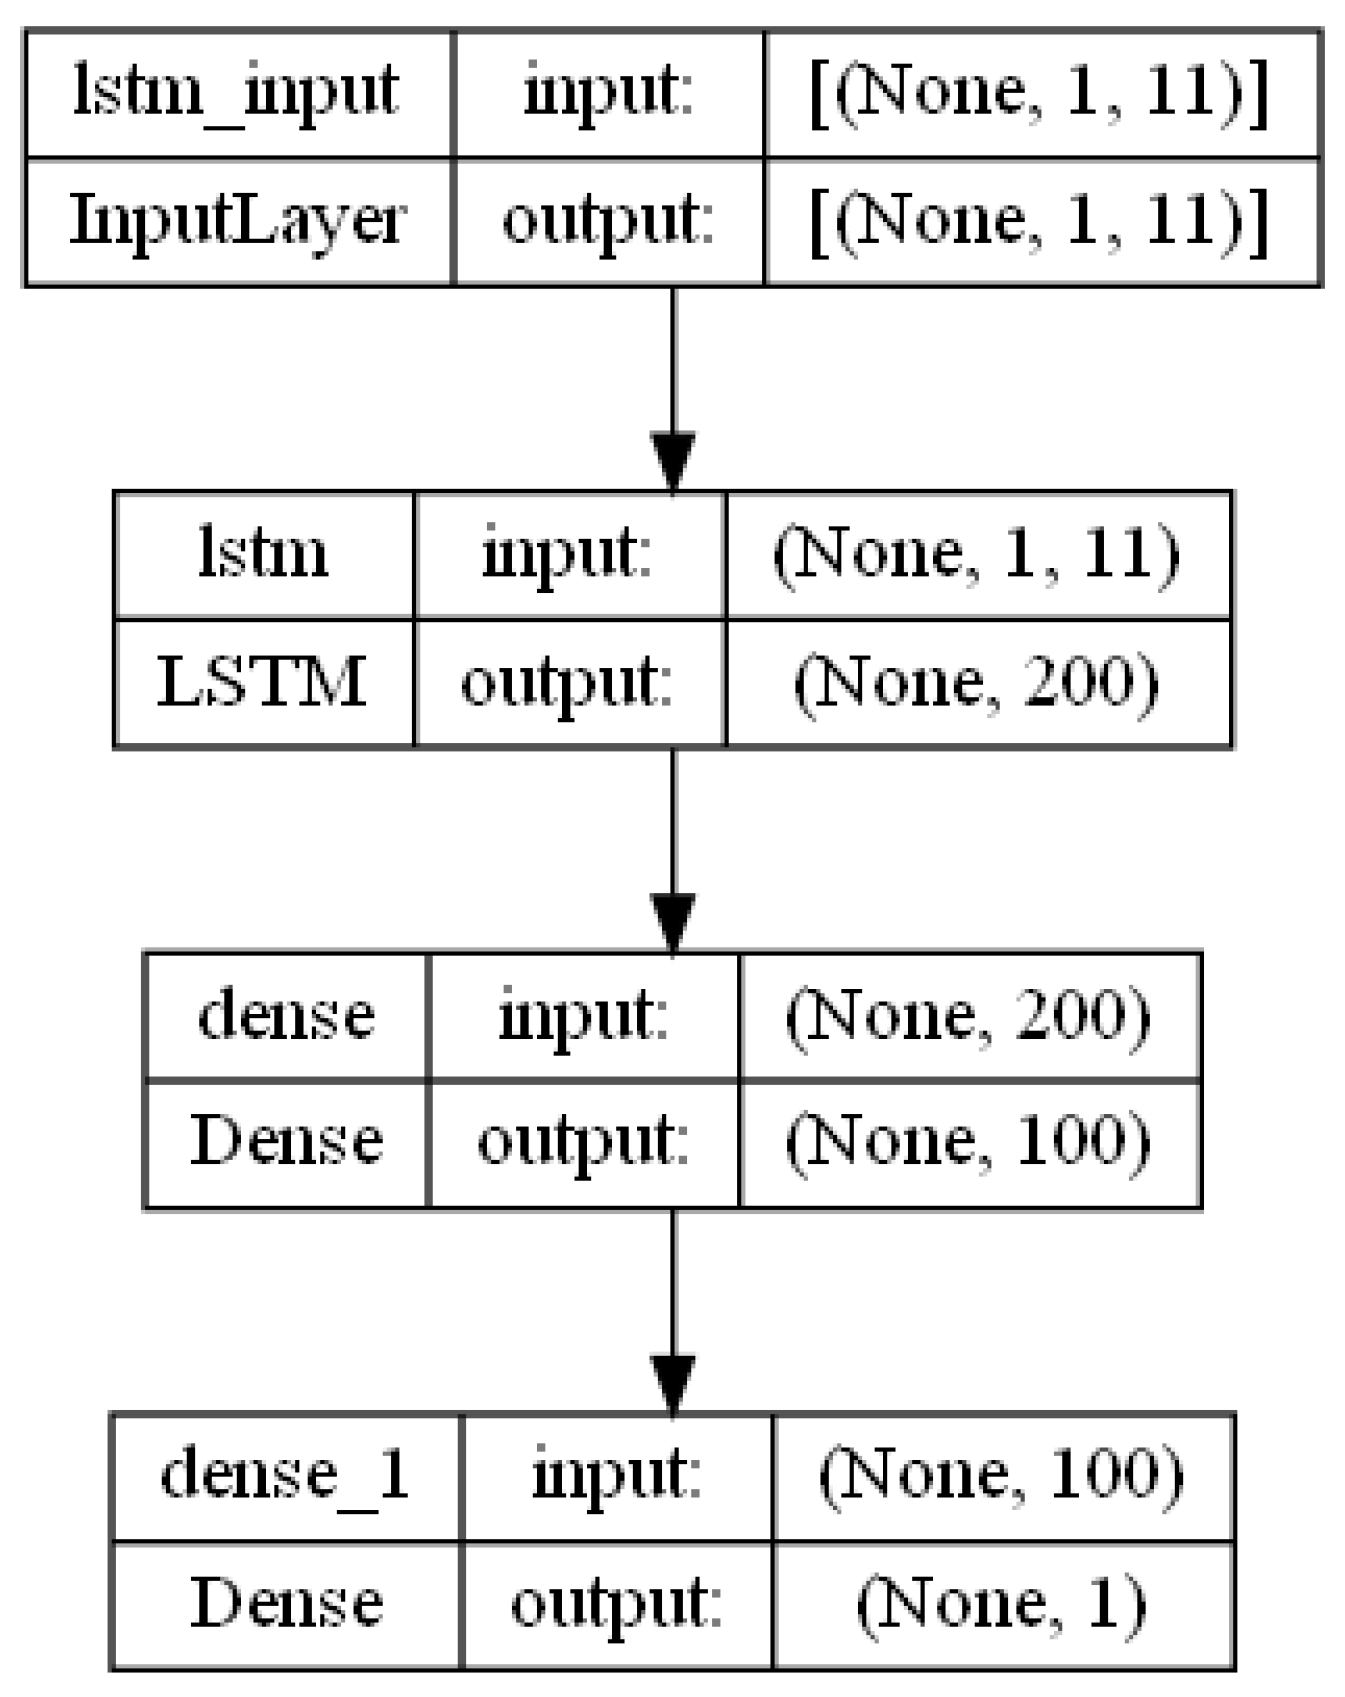
A hybrid DNN-LSTM model combines the strengths of deep neural networks (DNNs) and Long Short-Term Memory (LSTM) networks to tackle complex problems involving sequential data. In the described model, we integrate the capabilities of DNNs for capturing high-level patterns from data with the sequence modeling capabilities of LSTMs. This combination is particularly useful when you want to handle both the inherent sequential nature and intricate relationships in the data. Below architecture were presented.
Figure 1.
MultiLSTM DNN model architecture.
Figure 1.
MultiLSTM DNN model architecture.
The first layer is an LSTM (Long Short-Term Memory) layer. In this model, the LSTM layer has 200 units (also referred to as cells or neurons). The activation function used within each LSTM unit is Rectified Linear Unit (ReLU), which introduces non-linearity to the network. Following the LSTM layer is a dense fully connected layer. This layer contains 100 units and employs the ReLU activation function. The purpose of this layer is to learn higher-level features and patterns from the output of the LSTM layer. It adds a level of non-linearity and abstraction to the model’s representation. The final layer is the output layer and produces the final predictions of the model.
2.2. Prepared Dataset
The dataset created based on published data from the PSE (Polish Power Company) for predicting the market price of electricity contains various parameters related to electricity pricing and deviations. These parameters are crucial for building a predictive model for electricity price forecasting. Each parameter contributes to the model’s ability to capture the intricate dynamics of the electricity market.
Here’s a description of the dataset and its parameters:
CRO+ (Deviation Settlement Price - Higher Demand): The deviation settlement price determined on day n-1 for information purposes when the National Power System (NPS) demand is higher by 5% than assumed in the NPS work plan.
CRO- (Deviation Settlement Price - Lower Demand): The deviation settlement price determined on day n-1 for information purposes when the NPS demand is lower by 5% than assumed in the Key Schedule (KS) work plan.
CRO (Deviation Settlement Price): The general deviation settlement price determined on day n-1 for deviations from the expected demand levels.
CROs (Settlement Price of Sales Deviation): The settlement price associated with the sales deviation, reflecting the financial impact of deviations from planned sales levels.
CROz (Purchase Variance Settlement Price): The settlement price related to the purchase variance, indicating the financial consequences of deviations from planned purchase levels.
CEBPRw (Weighted Average Price of Planned Forced Balancing Energy Received): The weighted average price of the planned forced balancing energy received, which is part of the balancing mechanism to ensure stability in the power system.
CEBPPw (Weighted Average Price of Planned Forced Balancing Energy Delivered): The weighted average price of the planned forced balancing energy delivered, also contributing to maintaining the power system’s stability.
CEBPR (Weighted Average Price of Planned Balancing Energy Received): The weighted average price of the planned balancing energy received, reflecting the cost of maintaining a balanced power supply-demand relationship.
CEBPP (Weighted Average Price of Planned Balancing Energy Delivered): The weighted average price of the planned balancing energy delivered, representing the compensation for supplying balancing energy to the grid.
The dataset is likely organized with time series data starting from the beginning of 2020 till July 2023, where each parameter’s values are recorded over an hourly period. The historical values of these parameters, along with the corresponding electricity market prices, form the basis for training and evaluating predictive models, such as the hybrid DNN LSTM model described earlier. For ensuring that dataset is ready for model training there was few steps before usage such as handling missing values, normalization, and possibly feature engineering. The richness and complexity of the parameters in this dataset provide a solid foundation for developing accurate electricity price prediction models tailored to the microinstallation context.
2.3. Innovative Grid-Connected and Autonomous Energy Management via DNN Projected Pricing
The notion of employing "grid-linked" and "off-grid" management grounded in the insights of a Deep Neural Network (DNN) predictive model for energy costs revolves around the astute management and enhancement of energy consumption, taking into account the ever-fluctuating electricity prices prevalent in the energy market.
The central components of this pioneering system include:
DNN LSTM-Based Energy Price Prediction Model At the heart of this initiative lies a Deep Neural Network (DNN) powered by Long Short-Term Memory (LSTM) architecture. This advanced machine learning model is capable of being trained to forecast forthcoming energy prices by dissecting historical data and deciphering the intricate trends governing energy market pricing. By assimilating diverse input parameters expounded upon in the preceding section, this model generates predictions of impending energy prices, pivotal for informed decision-making.
Grid-Linked Subsystem The grid-linked control facet concentrates on judiciously orchestrating energy consumption within an edifice or establishment interlinked with the primary electricity grid. Contextualized within the framework of energy price prediction, grid-linked control entails the calibration of energy utilization by the facility’s systems (ranging from HVAC and lighting to appliances) in accordance with the anticipated energy price fluctuations. The ultimate objective is to amplify energy consumption during phases of subdued pricing, while curtailing consumption during peak-cost periods.
Autonomous Off-Grid Subsystem The autonomous off-grid control predominantly applies to scenarios where an edifice or facility functions autonomously, disengaged from the principal electricity grid. Frequently, such setups harness renewable energy resources (such as solar panels) and energy reservoir systems (like batteries). In this scenario, the energy price projections sourced from the DNN model serve as a compass for discerning when to stockpile surplus energy from sustainable sources and when to deploy accumulated energy in consonance with price projections. This optimization guarantees that the facility trims energy expenses, all while sustaining a dependable power supply.
Fusion of DNN Model Projections The DNN model’s prognostications wield a pivotal role within both grid-linked and off-grid control paradigms. For grid-linked control, these predictions underpin determinations pertaining to the optimal transfer of energy-intensive operations to non-peak hours. For off-grid control, these predictions underlie the orchestration of energy reservoir system charging and discharging, impeccably aligned with projected price oscillations.
Implementation of Intelligent Residence Infrastructure The practical realization of grid-linked and off-grid control predicated on energy price predictions often entails a measure of automation. Intelligent energy management frameworks can be tailored to obtain real-time price updates from the DNN model and subsequently effectuate automated adjustments in energy consumption or reservoir operations. This synergy can be realized through a constellation of Internet of Things (IoT) devices, interconnected appliances, and energy management software.
It is imperative to acknowledge that the efficacy of such a system pivots on the precision of the DNN model’s predictions, the nimbleness of the control systems, and the adaptability of the facility’s energy consumption and storage competencies. Furthermore, real-world execution might necessitate tackling hurdles such as system latency, hardware compatibility, and user predilections.
In summation, this concept embodies a progressive strategy for optimizing energy utilization and expenditure, particularly within the context of an increasingly dynamic and price-conscious energy domain.
3. Results
3.1. Accuracy of Designed DNN Model
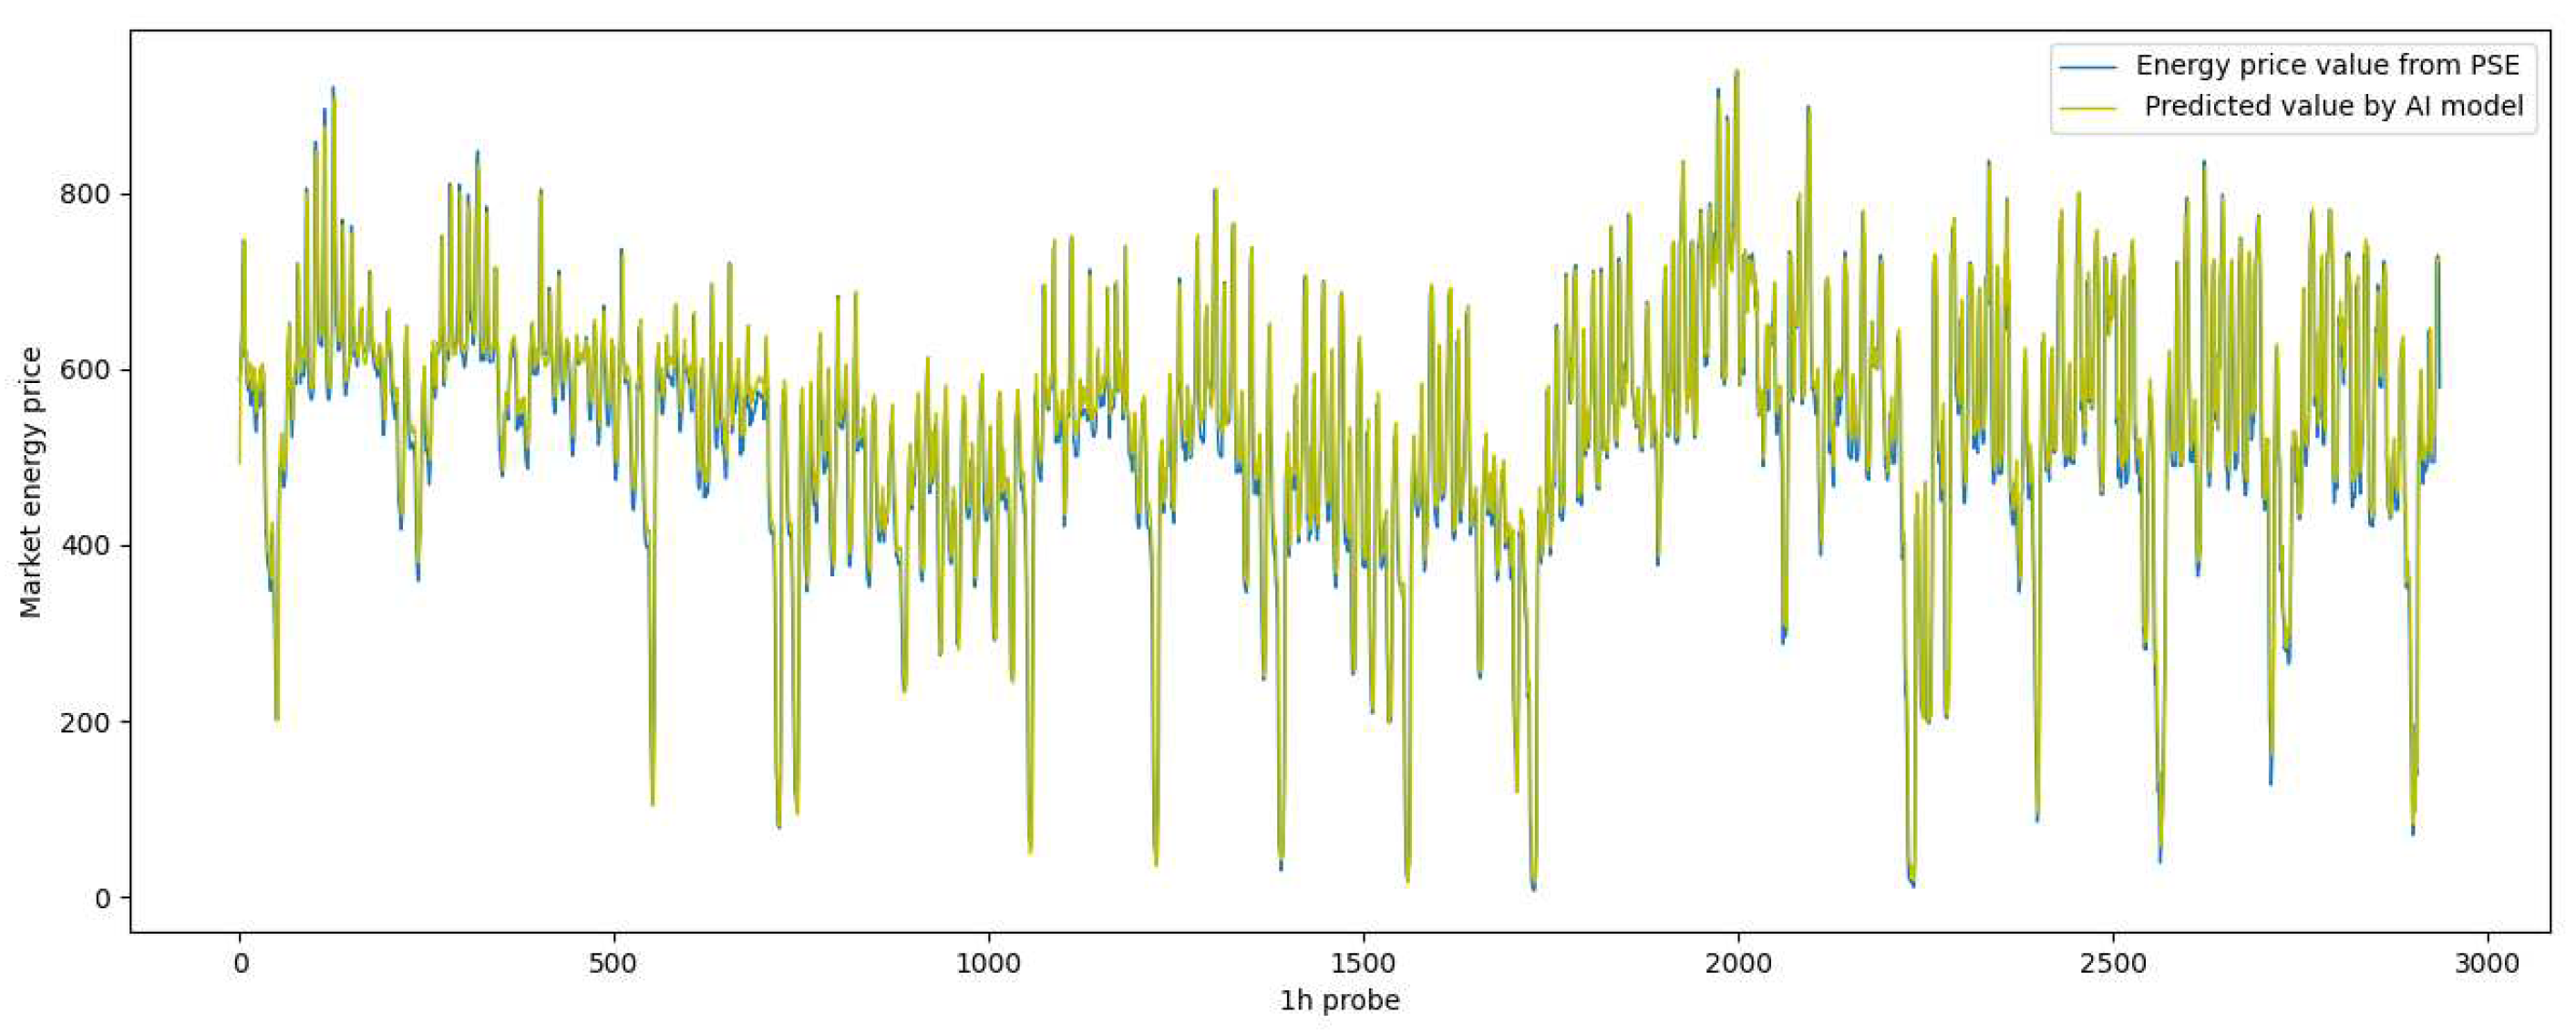
Below we present our comparison between values reported by RCE simulations from PSE and our DNN model.
Figure 2.
MultiLSTM price prediction results.
Figure 2.
MultiLSTM price prediction results.
Table 1.
Metrics MultiLSTM.
Table 1.
Metrics MultiLSTM.
| MAE: 35.863 |
NMAE: 0.038 |
MPL: 17.931 |
| MAPE: 0.088 |
MSE: 2492.210 |
| EVS: 0.887 |
R2: 0.876 |
RMSE: 49.922 |
The results provided by the Deep Neural Network (DNN) model are as follows:
MAE (Mean Absolute Error): The average absolute difference between predicted values and actual values is 35.86. This metric quantifies the magnitude of errors without considering their direction.
NMAE (Normalized Mean Absolute Error): The normalized version of MAE is 0.0382. It represents MAE as a fraction of the range of the actual values, allowing for better comparison across different datasets
MPL (Mean Percentage Error): The mean percentage difference between predicted and actual values is 17.93%. This metric expresses errors as a percentage of the actual values, providing insight into the relative magnitude of errors.
MAPE (Mean Absolute Percentage Error): The average percentage difference between predicted and actual values is 0.0886%. This metric provides the average magnitude of percentage errors, offering an understanding of the overall accuracy of predictions.
MSE (Mean Squared Error): The average of the squared differences between predicted and actual values is 2492.21. It penalizes larger errors more heavily than smaller ones.
MEAE (Mean Error Absolute Error): The average absolute difference between the predicted mean and the actual mean is 25.13. This metric indicates the overall bias in the predictions.
EVS (Explained Variance Score): The proportion of variance in the dependent variable that the model explains is 0.8877. It assesses the goodness of fit of the model, where higher values indicate better fit.
R2 (Coefficient of Determination): The coefficient indicating the proportion of the variance in the dependent variable that is predictable from the independent variables is 0.8770. This metric measures the proportion of the variability in the dependent variable that is explained by the model.
RMSE (Root Mean Squared Error): The square root of the average of the squared differences between predicted and actual values is 49.92. This metric provides a similar measure as MSE but is in the same unit as the original data, making it more interpretable.
3.2. Proposed Offgrid Subsystem
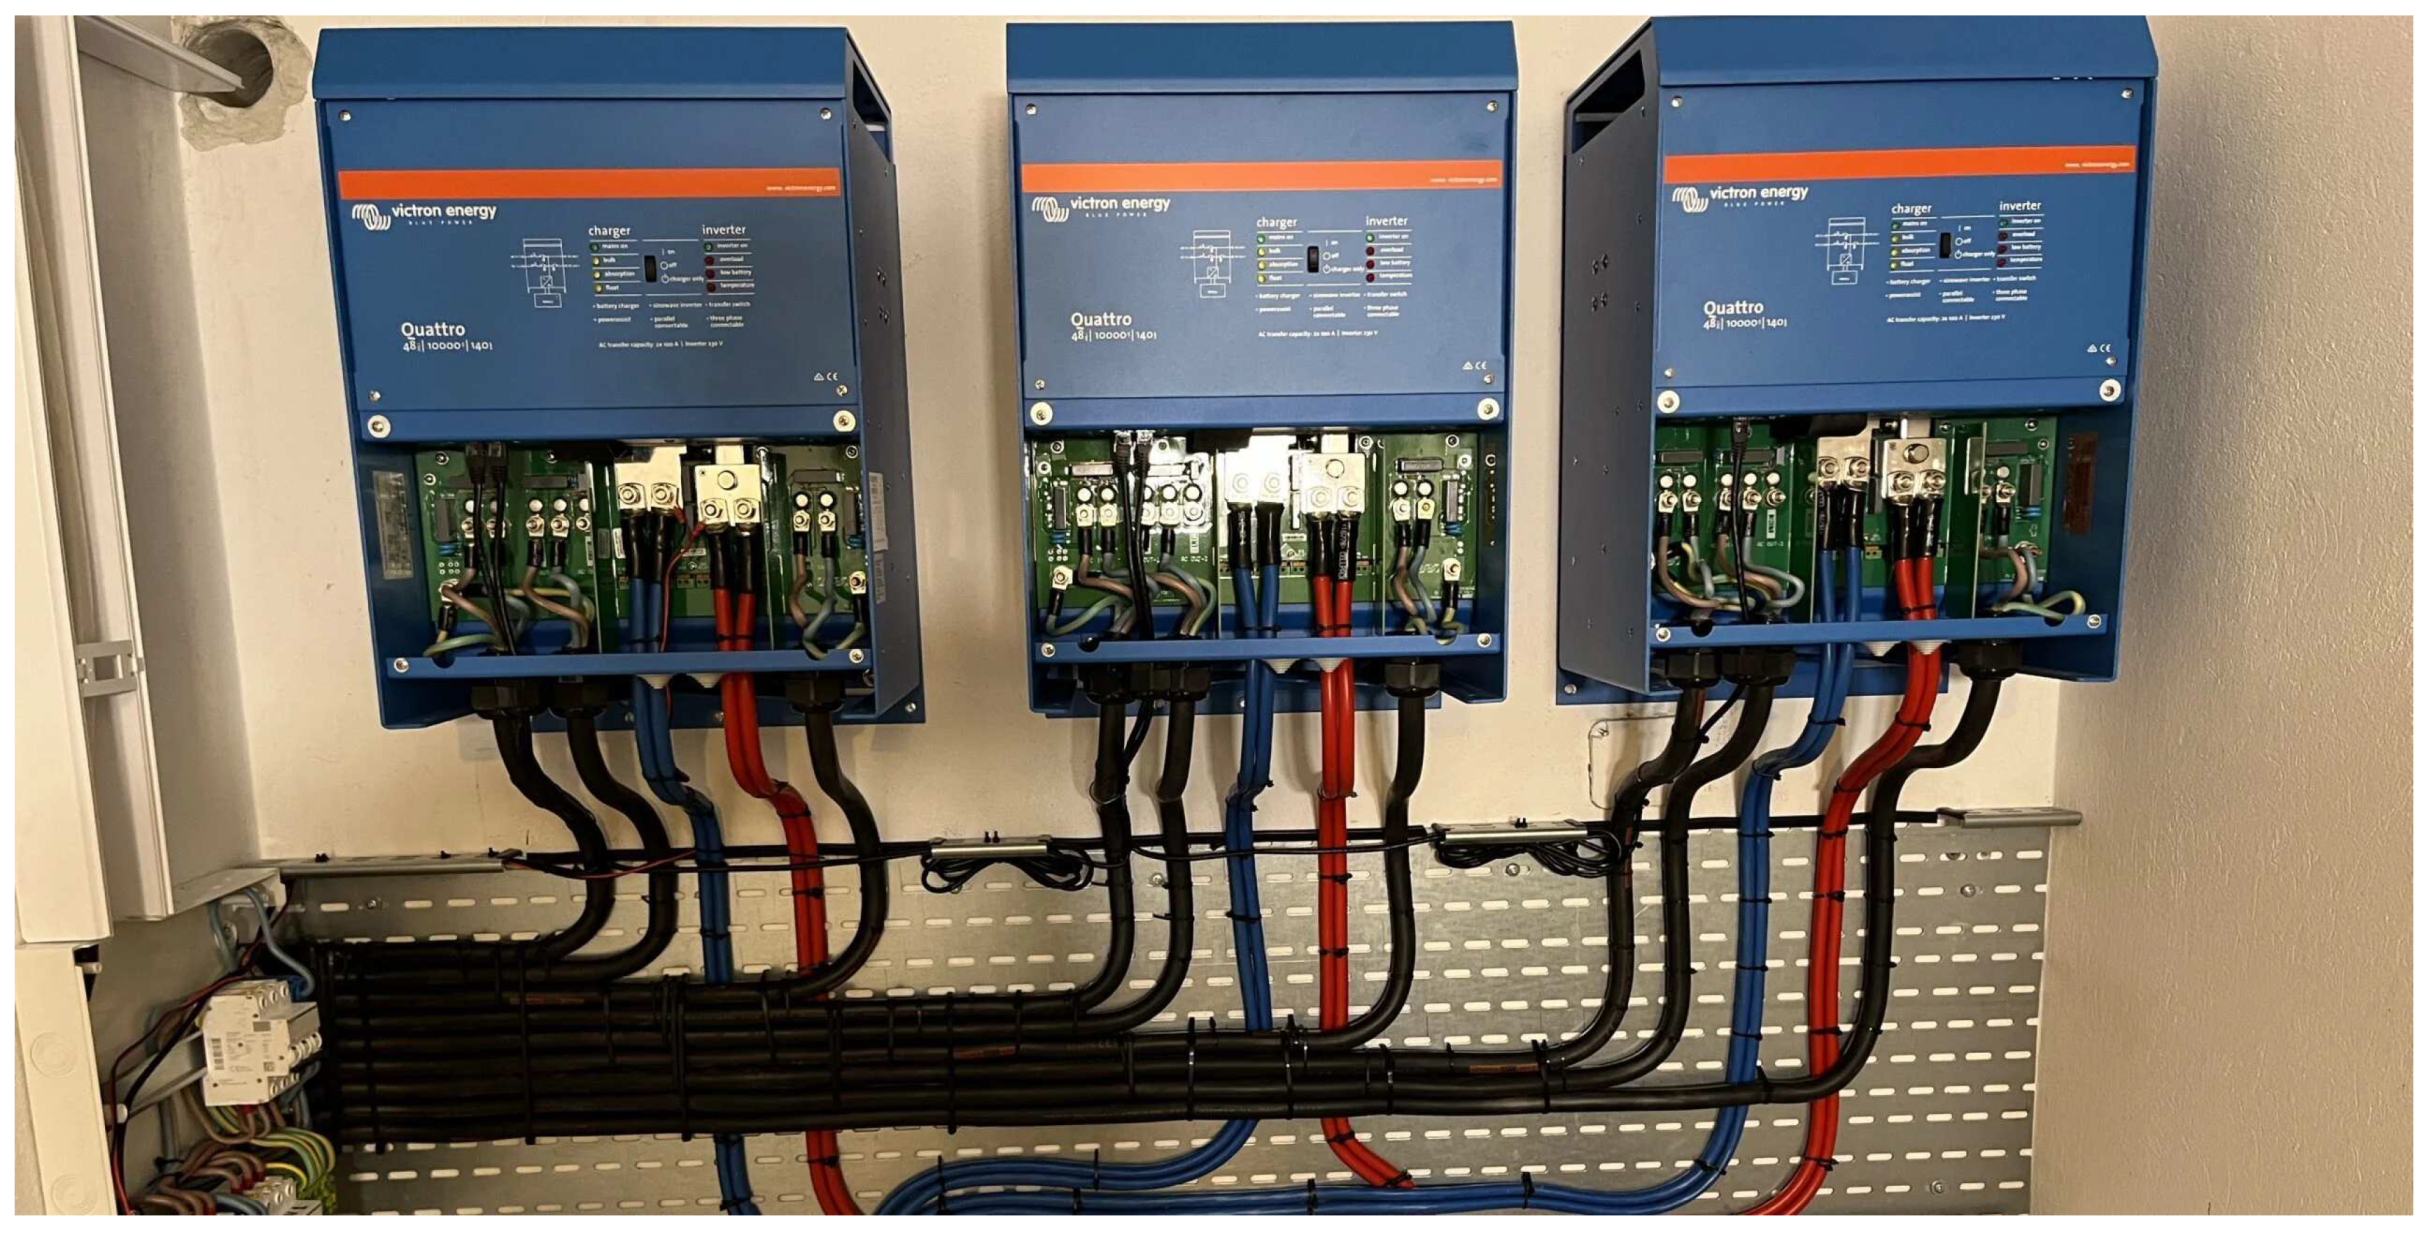
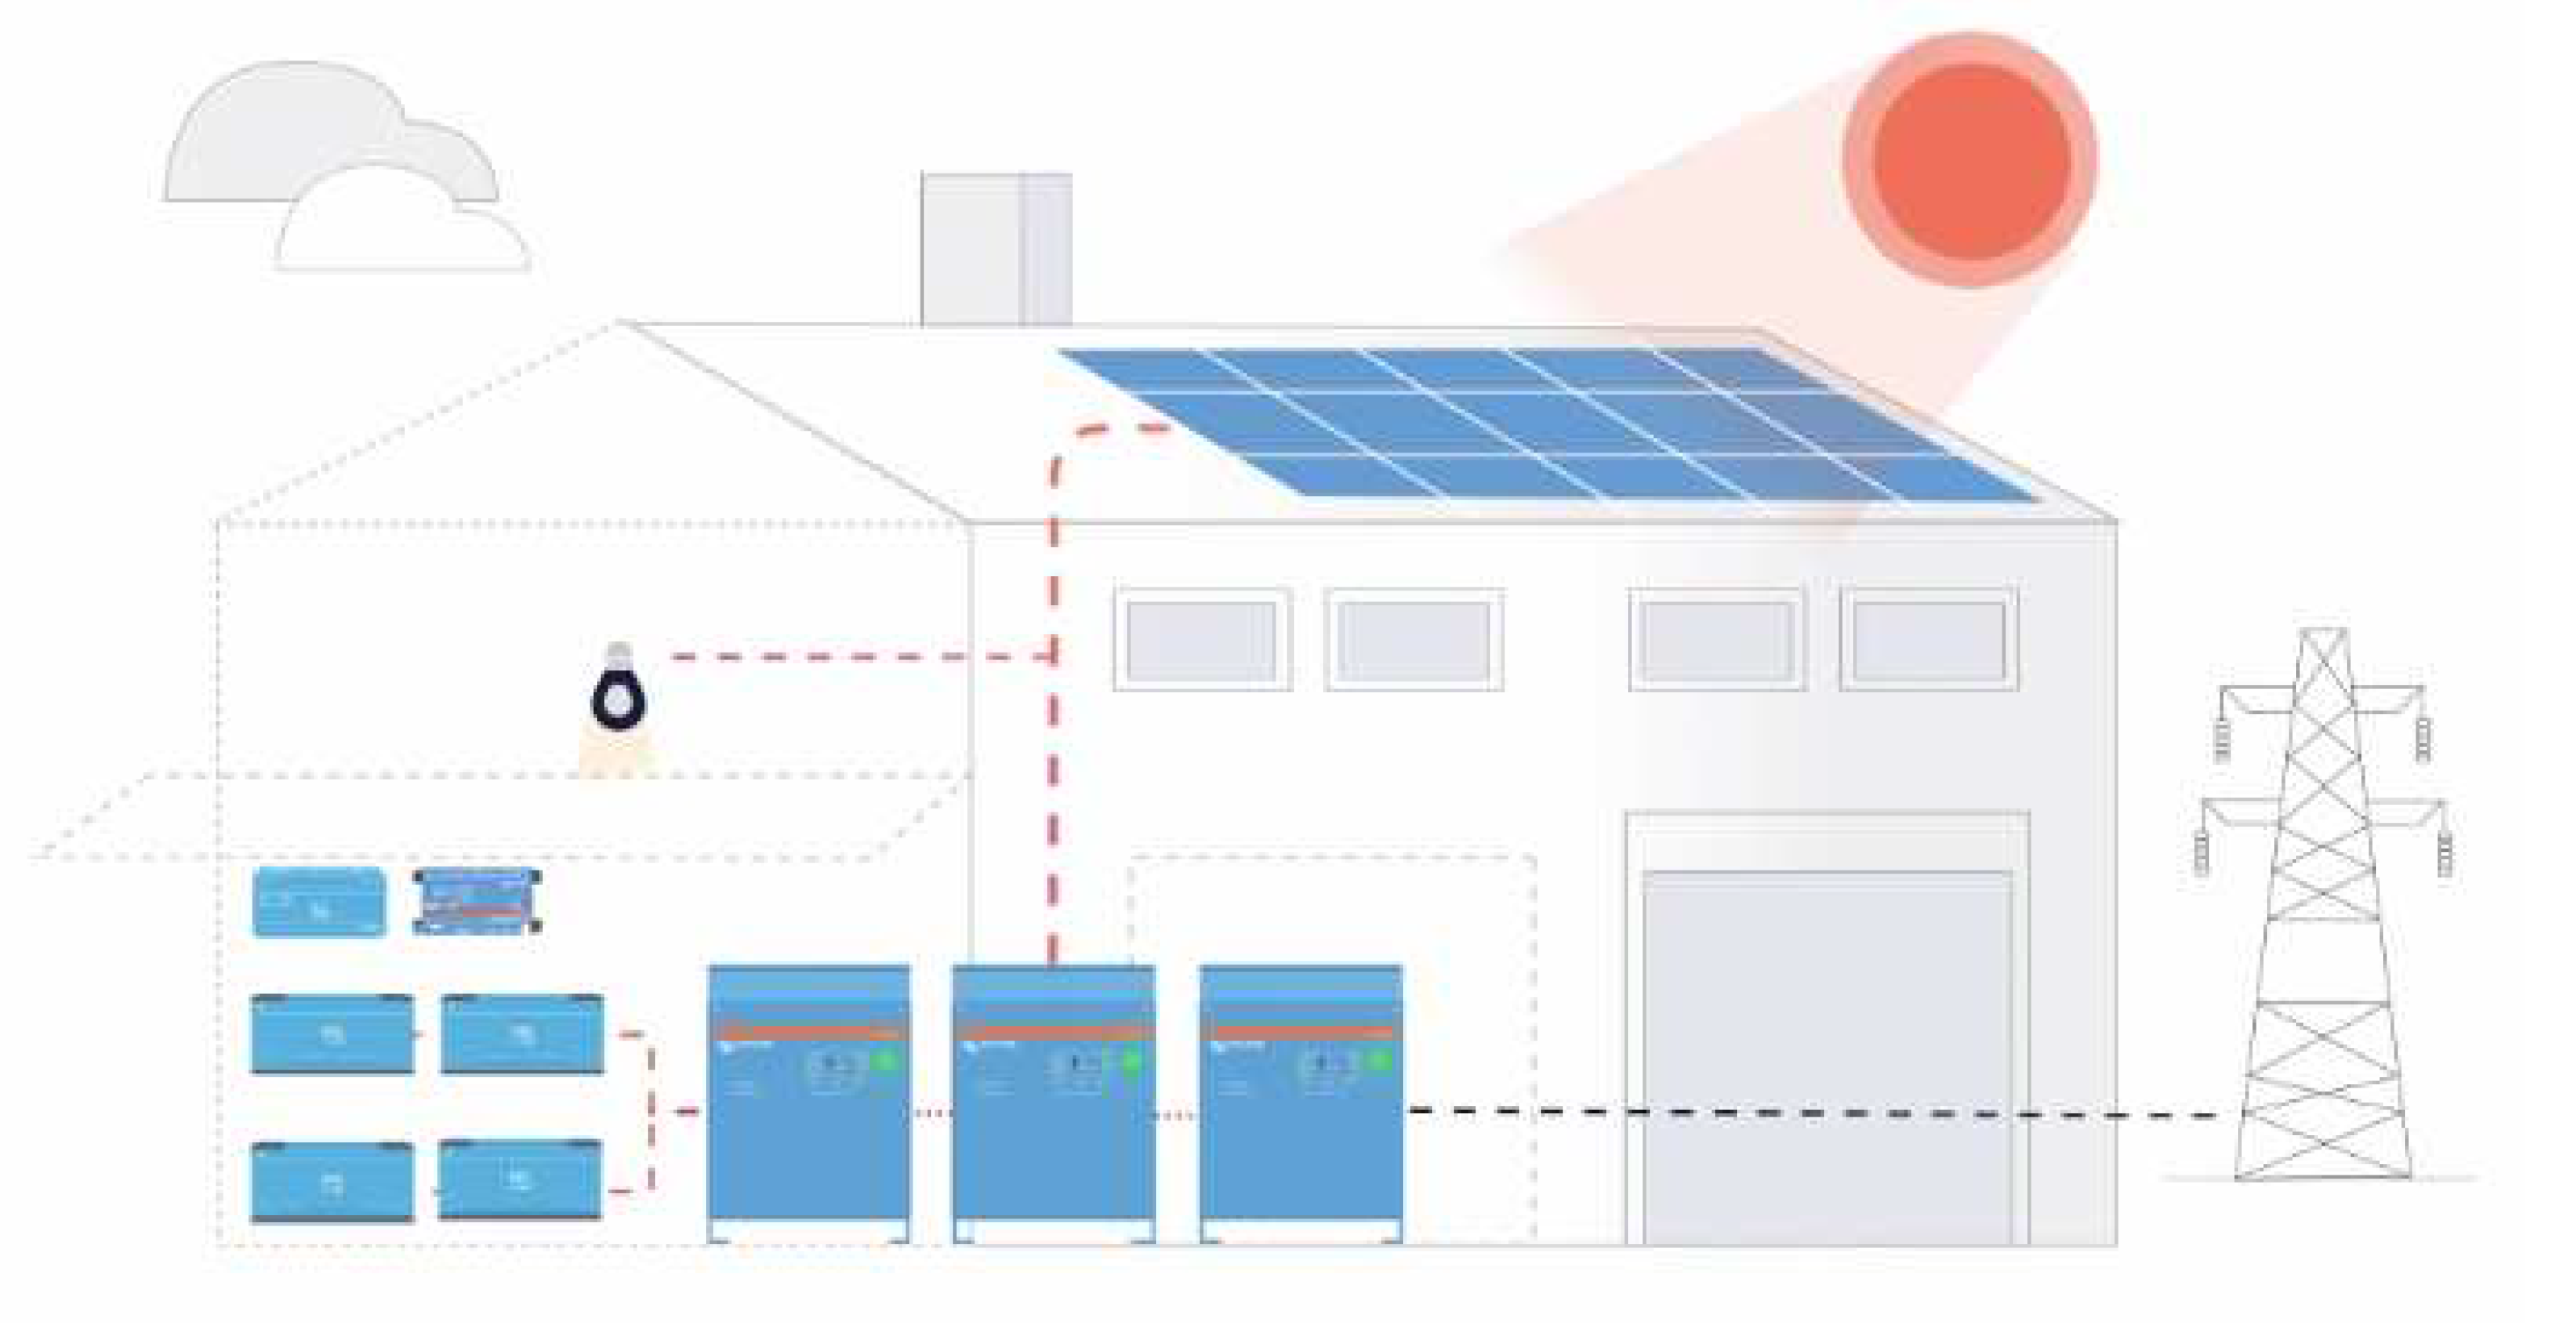
A proposed off-grid energy system is a combination of advanced engineering and self-reliance. The backbone of this autonomous power grid is a set of three powerful Victron Quattro inverters, each with an impressive 15 kW of power. Their presence symbolizes the key role they play in orchestrating the conversion of stored DC battery energy into usable AC power, covering a spectrum of energy needs.
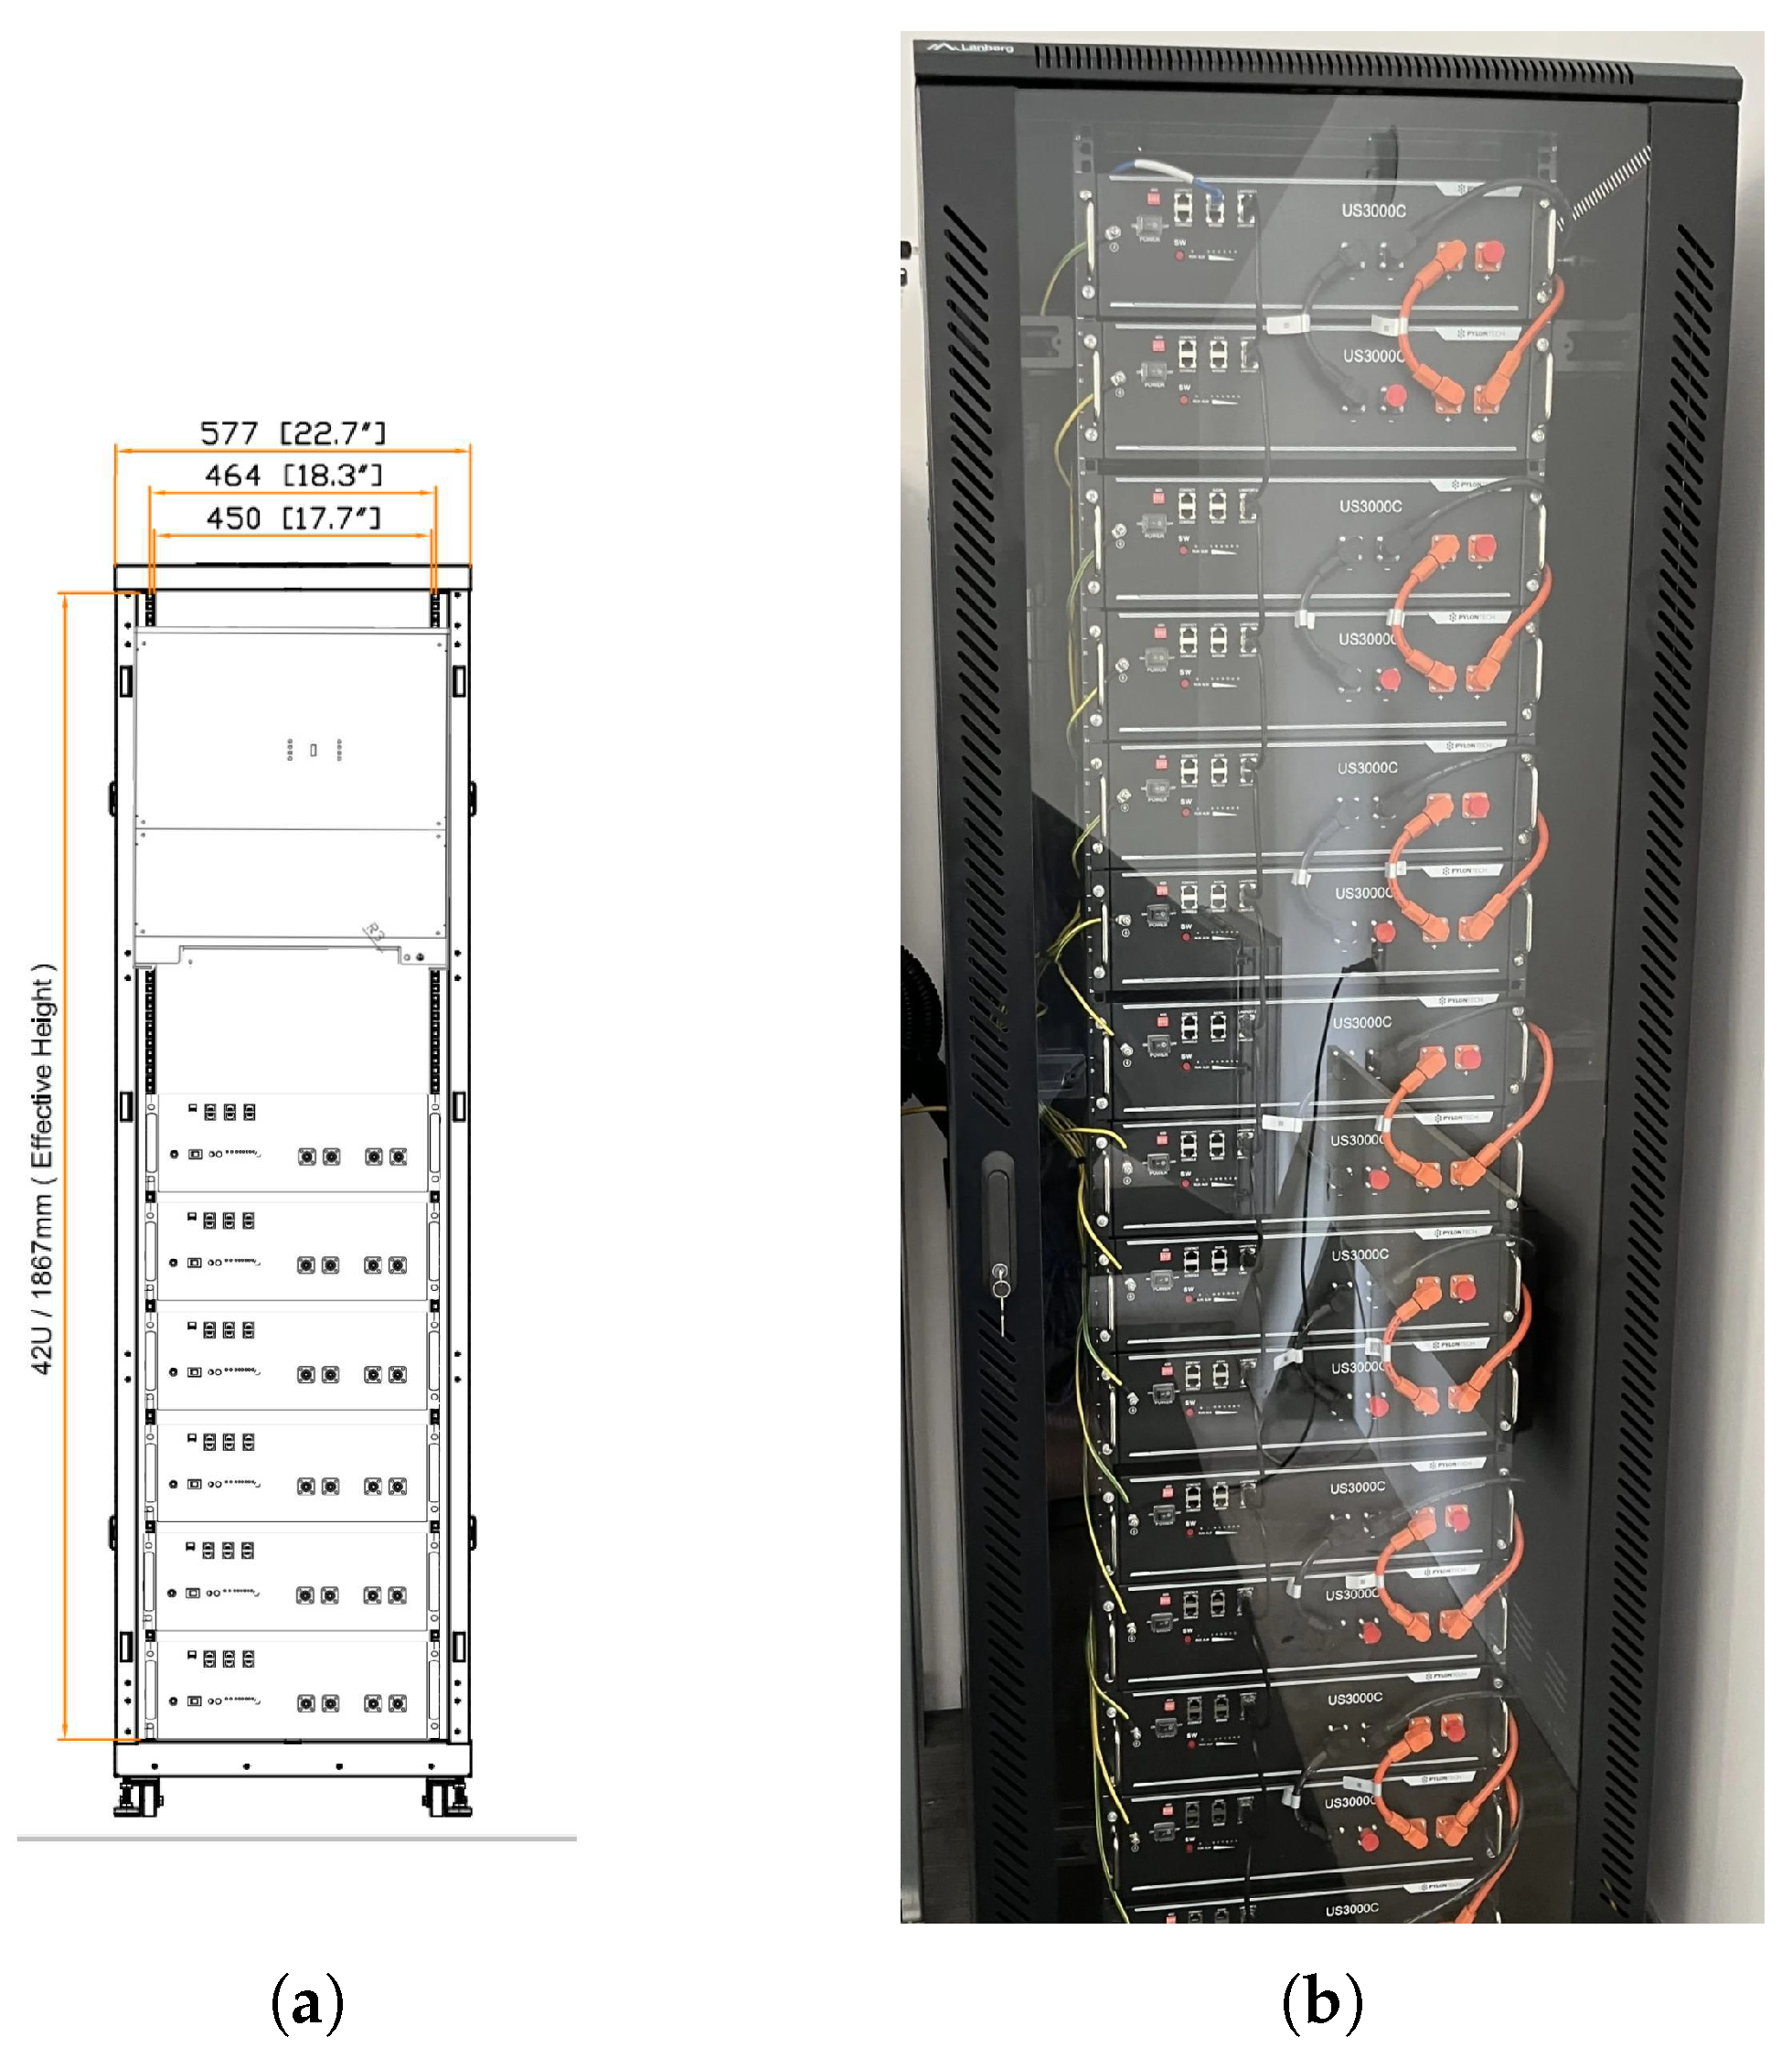
A precisely arranged set of 16 Pylontech batteries deployed in a safe and well-ventilated area acts as an energy store. Through a careful combination of series and parallel connections, these batteries combine to form a powerful energy storage system. Their combined capacity can provide a sustainable power supply, ensuring system resilience in times when external energy sources are scarce.
Figure 4.
Example of batteries and inverter installation. a) one-phase installation including one inverter and 6 batteries. b) separate batteries mounted in rack (source
https://enerp.pl).
Figure 4.
Example of batteries and inverter installation. a) one-phase installation including one inverter and 6 batteries. b) separate batteries mounted in rack (source
https://enerp.pl).
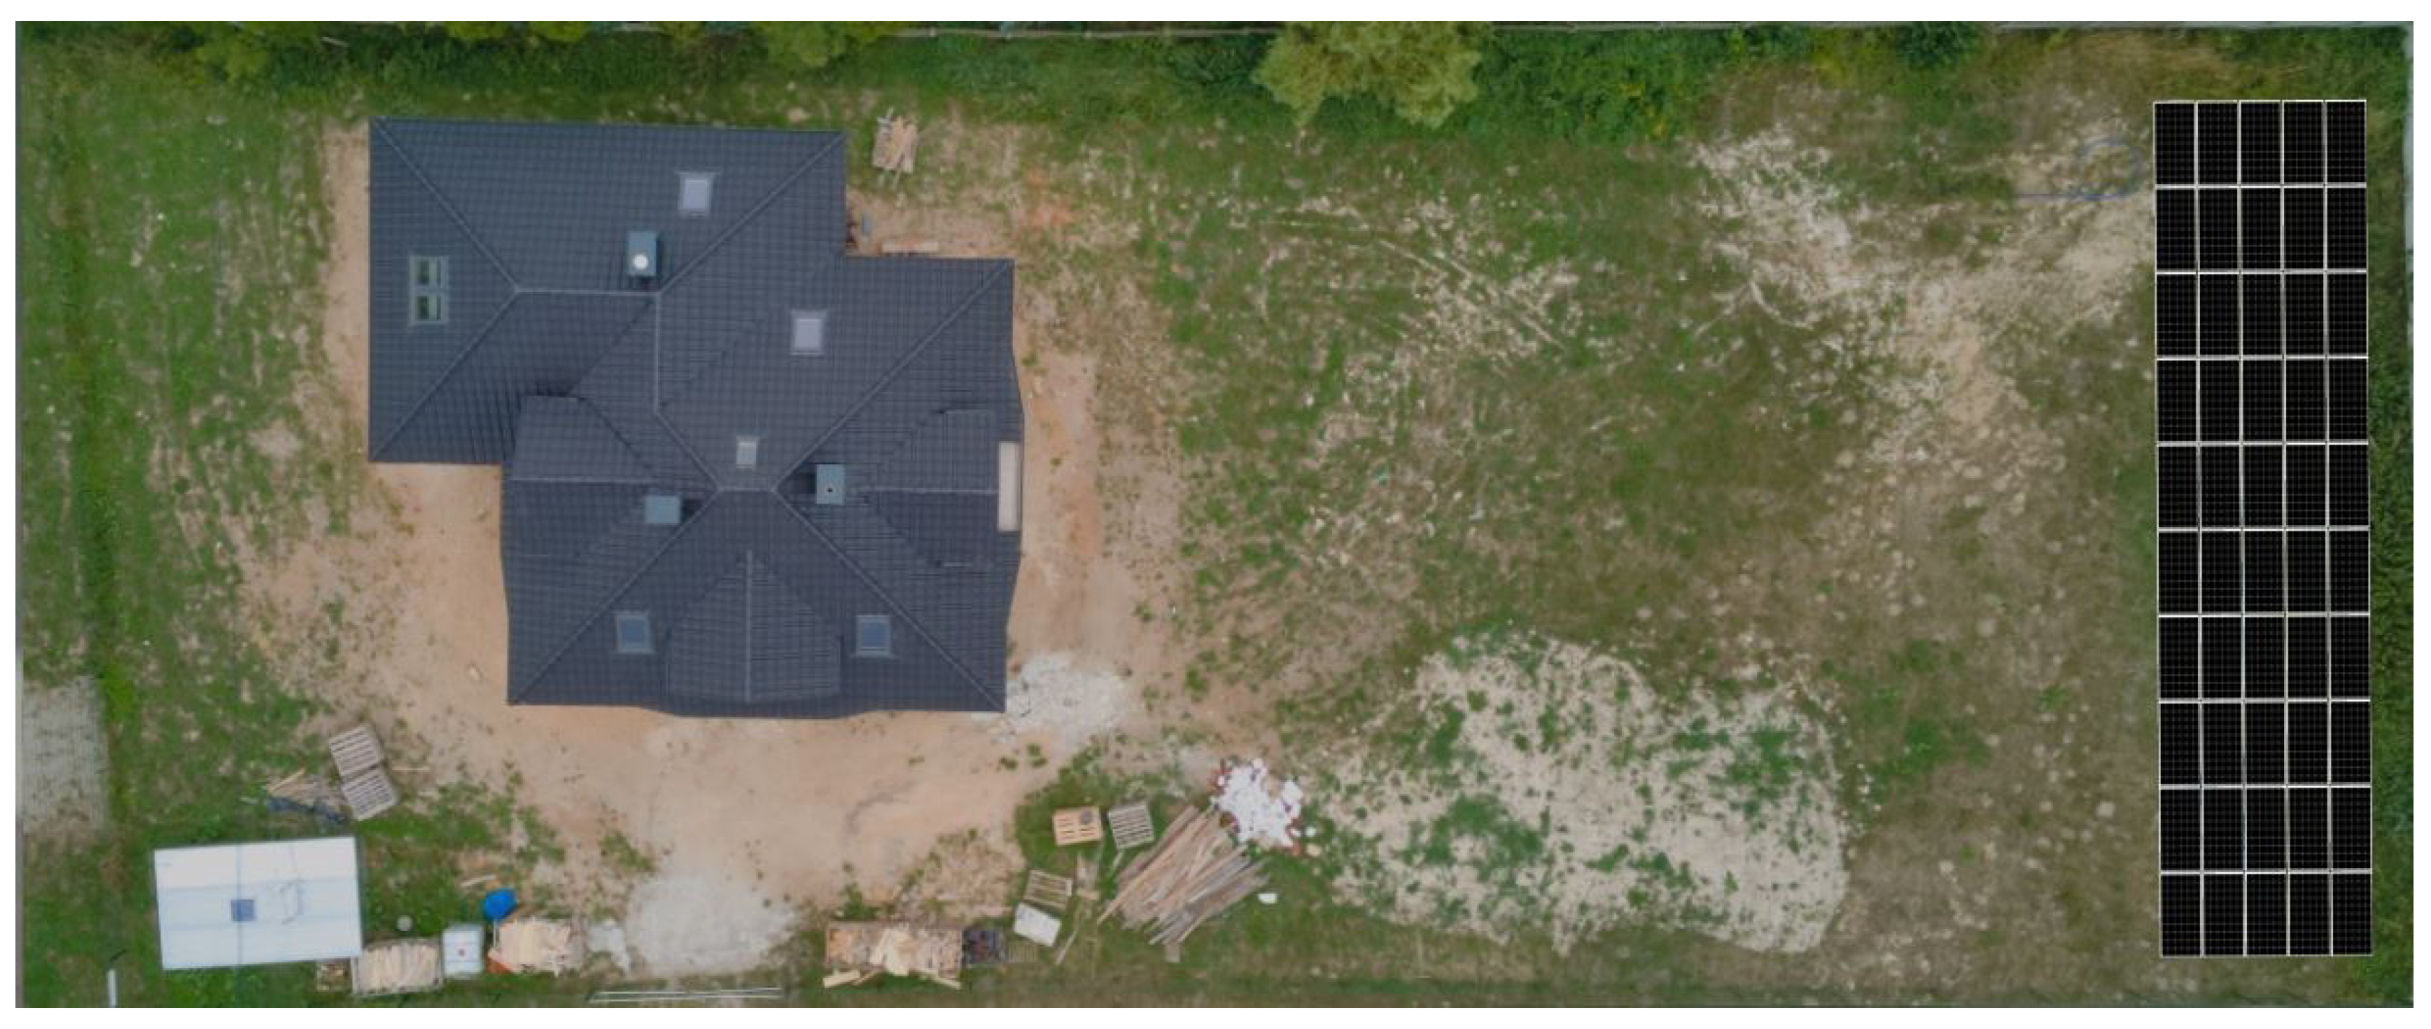
A array of solar panels with a total capacity of 25 kWp. Their calculated orientation maximizes solar exposure by collecting photons with remarkable efficiency. Directing the DC power output, the grid-connected 25kW SolarEdge inverter takes over the power conversion function. It balances domestic consumption demand by seamlessly exporting surplus energy back to the grid, in line with net billing regulations.
Figure 6.
PV panels installation.
Figure 6.
PV panels installation.
Cerbo GX control unit integrates disparate components into a cohesive whole. This controller is responsible for remote accessibility and control, offering a window into the system’s dynamic performance. Controlling a device like Cerberus GX using an external API to switch between on-grid and off-grid modes based on deep neural network (DNN) energy price forecasting results involves several steps. For controlling a device we propose to use the VRM (Victron Remote Management) API for switching between on-grid and off-grid modes.
4. Discussion
The holistic architecture of the designed DNN exhibits a commendable capability to generate remarkably precise predictions. This assertion finds its basis in the discernibly low levels of error metrics such as Mean Absolute Error (MAE), Normalized Mean Absolute Error (NMAE), and Mean Absolute Percentage Error (MAPE). Additionally, the DNN garners remarkable scores in terms of prediction quality, as evidenced by the elevated values of Explained Variance Score (EVS) and the coefficient of determination (R2). These credentials collectively underscore the potential usability of the model in practical applications.
However, it is essential to underscore that the effectiveness of such a system hinges upon several pivotal factors. Foremost among these is the degree of precision embedded within the predictions furnished by the DNN model. Equally critical is the agility of the control systems orchestrating the model’s functioning. Moreover, the adaptability of the facility’s energy consumption and storage proficiencies plays a nontrivial role in the overall efficacy of the system. This intricate interplay of components necessitates a holistic approach to ensure optimal performance.
Looking beyond the theoretical construct, the real-world implementation of this concept is bound to encounter its own set of challenges. Among these, the issue of system latency takes prominence, warranting a robust strategy to mitigate any undue delays in prediction and response. The facet of hardware compatibility also emerges as a potential hurdle, demanding meticulous attention to ensure seamless integration. Additionally, accommodating diverse user preferences and predispositions adds a layer of complexity that must be accounted for during the system’s deployment.
In the grand scheme of things, this innovative concept encapsulates a forward-looking approach to revolutionize the landscape of energy utilization and expenditure. Its significance is particularly pronounced within the framework of an energy domain characterized by escalating dynamism and an ever-heightening emphasis on cost-consciousness. By navigating the intricate web of challenges and intricacies, this concept stands poised to contribute significantly to the ongoing pursuit of energy optimization, offering a beacon of promise for a more sustainable and efficient future.
References
- Golebiewski D.; Barszcz T.; Skrodzka W.; Wojnicki I.; Bielecki A.; A New Approach to Risk Management in the Power Industry Based on Systems Theory. Energies 15 (23), 9003, (2022). [CrossRef]
- Bilski J.; Rutkowski L.; Smolag J.; Tao D.: A novel method for speed training acceleration of recurrent neural networks. Inf. Sci. 553: 266-279 (2021). [CrossRef]
- Wąs, K.; Radoń, J.; Sadłowska-Sałęga, A.; Thermal Comfort—Case Study in a Lightweight Passive House Energies, 15(13), 4687, (2022). [CrossRef]
- Bo W.; Xiaokang W.; Ning W.; Zahra J.; Navid M.; Mahyar A.; Machine learning optimization model for reducing the electricity loads in residential energy forecasting. Sustainable Computing: Informatics and Systems (2023). 38. [CrossRef]
- Huanjian M.; Lijuan X.; Zahra J.; Navid M.; Mahyar A.; Reducing the consumption of household systems using hybrid deep learning techniques. Sustainable Computing: Informatics and Systems (2023). 38. [CrossRef]
- Pikus M, Wąs J. Using Deep Neural Network Methods for Forecasting Energy Productivity Based on Comparison of Simulation and DNN Results for Central Poland—Swietokrzyskie Voivodeship. Energies. 16(18):6632. [CrossRef]
|
Disclaimer/Publisher’s Note: The statements, opinions and data contained in all publications are solely those of the individual author(s) and contributor(s) and not of MDPI and/or the editor(s). MDPI and/or the editor(s) disclaim responsibility for any injury to people or property resulting from any ideas, methods, instructions or products referred to in the content. |
© 2023 by the authors. Licensee MDPI, Basel, Switzerland. This article is an open access article distributed under the terms and conditions of the Creative Commons Attribution (CC BY) license (http://creativecommons.org/licenses/by/4.0/).
