Submitted:
20 November 2023
Posted:
21 November 2023
You are already at the latest version
Abstract
Keywords:
1. Introduction
2. Materials and methods
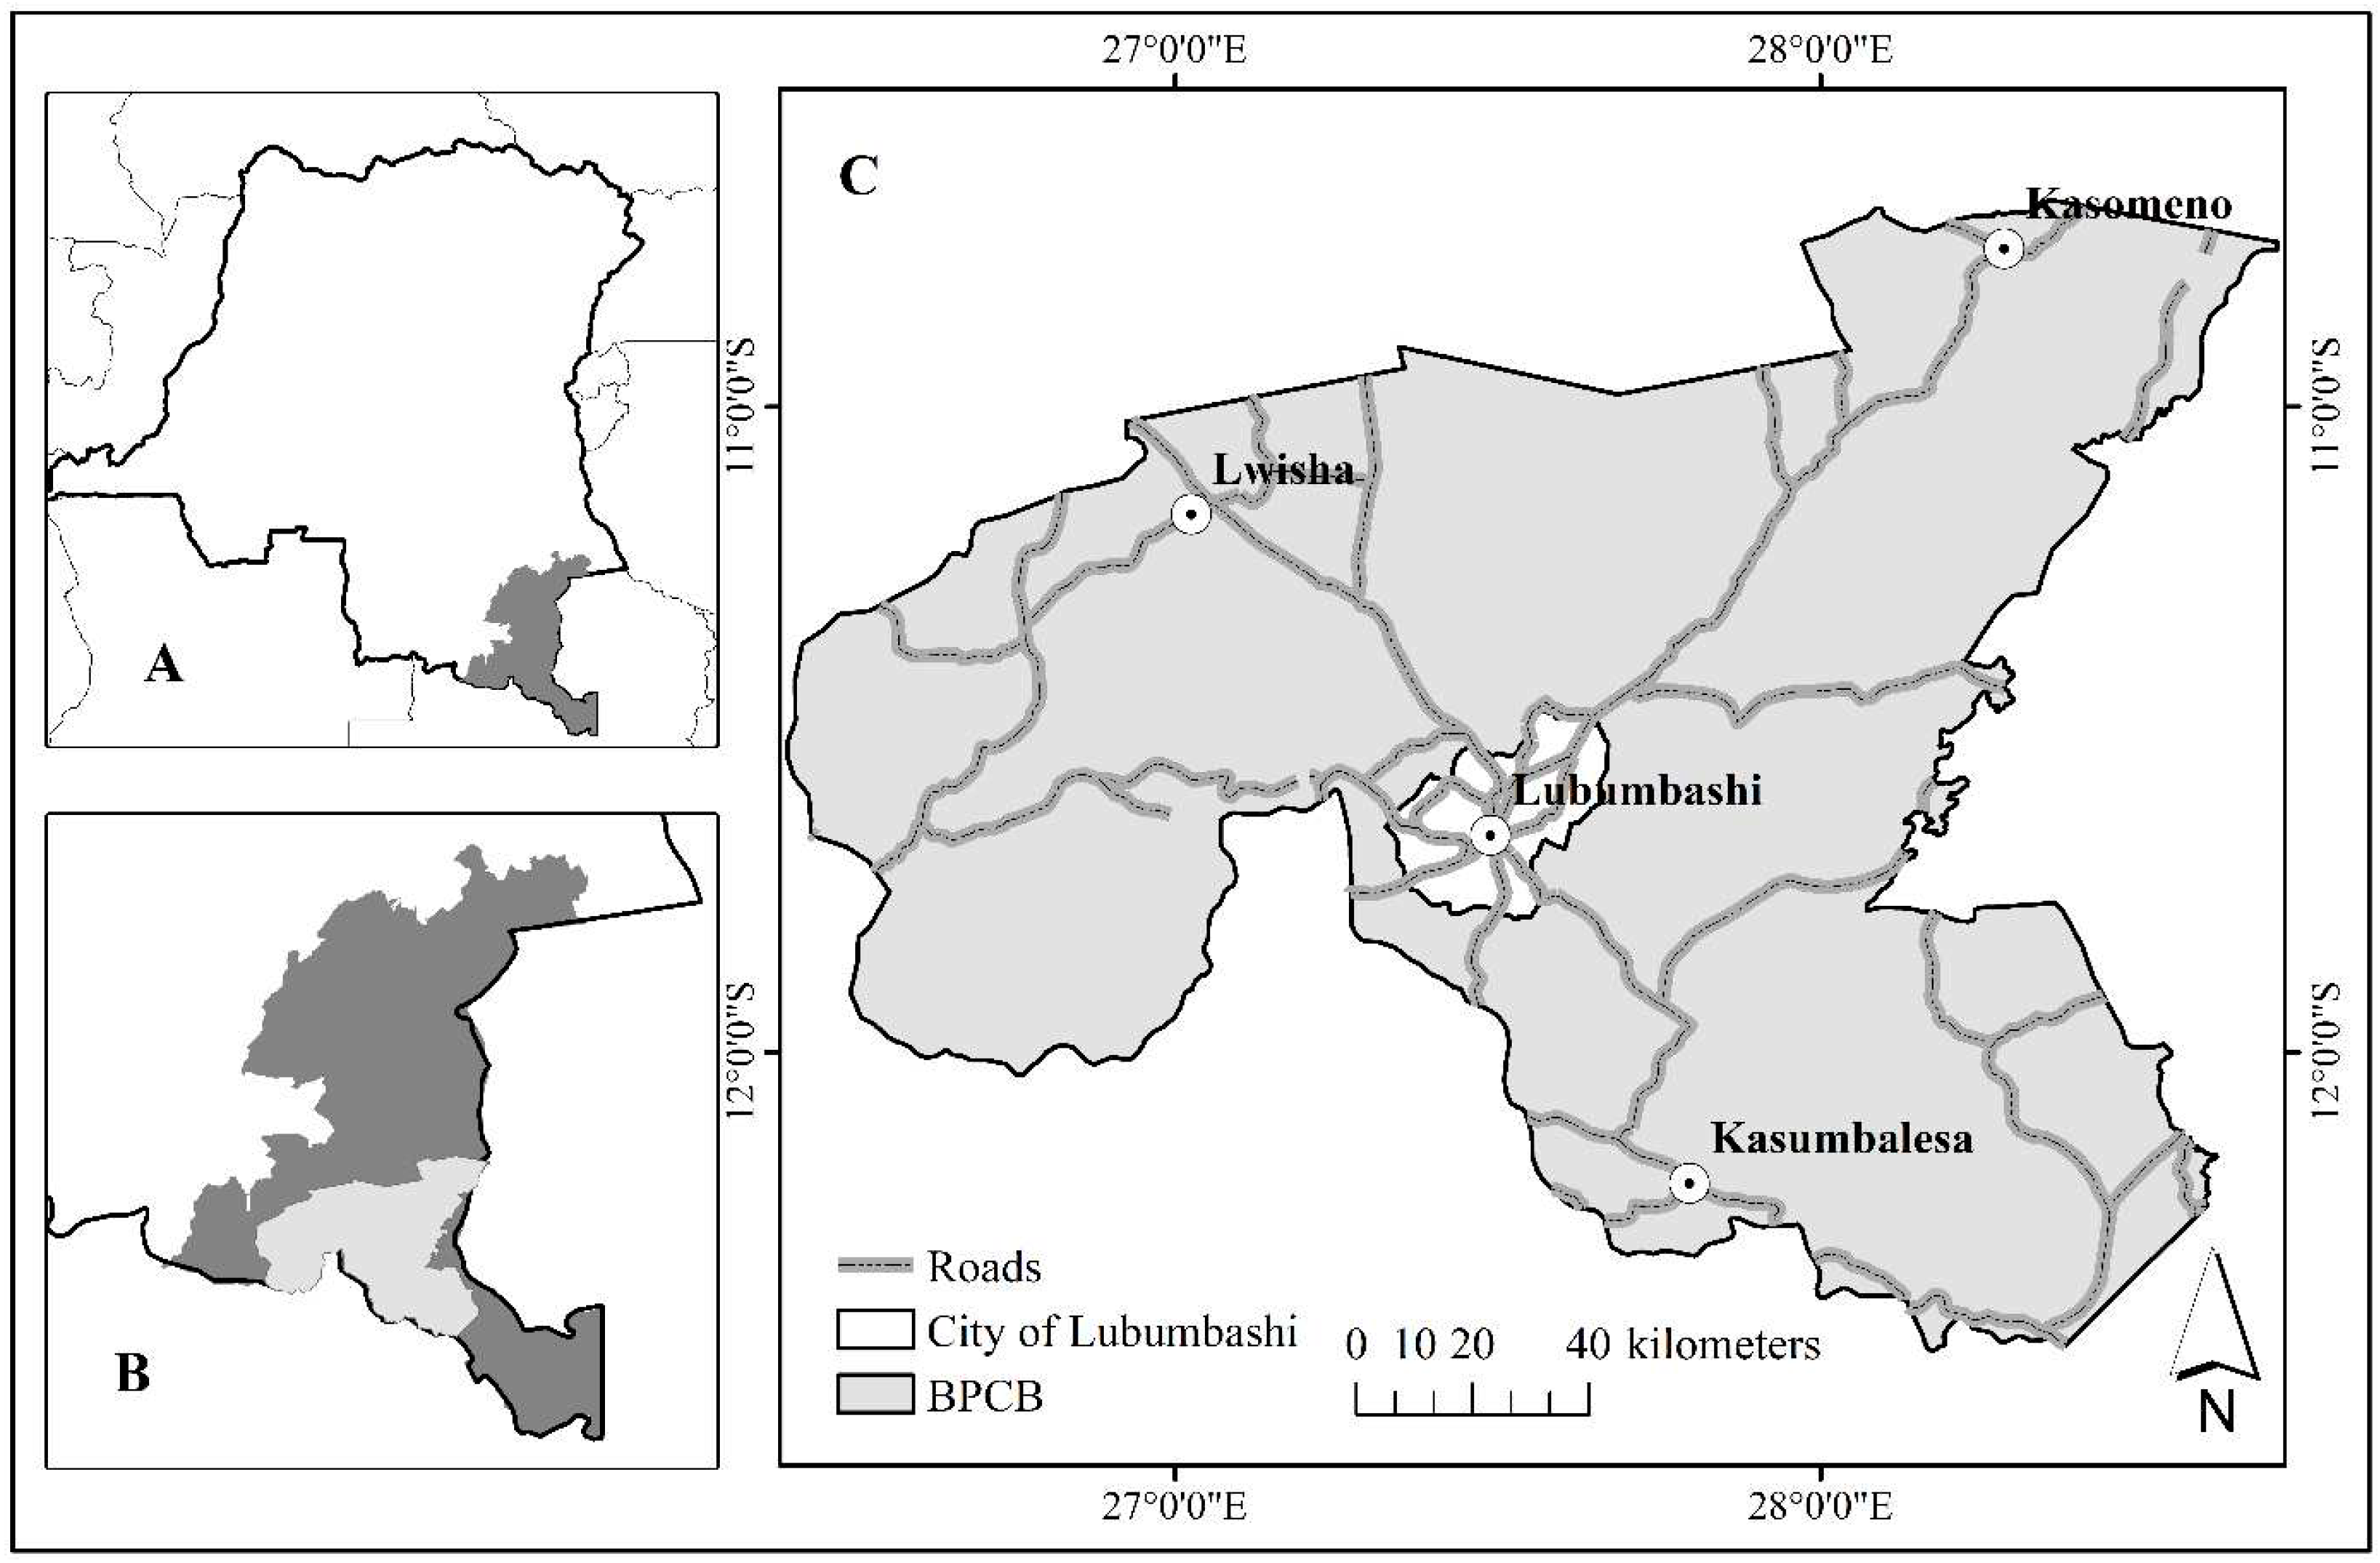
2.1. Biophysical description of the study area
2.2. Methods
2.2.1. Data
2.2.2. Pre-processing of Landsat images
2.2.3. Landsat image classification and validation
2.4. Analysis of vegetation fires in the LCPB
2.4.1. Distribution and destructive power
2.4.2. Quantifying the spatio-temporal dynamics of burnt areas and assessing their impact
2.4.3. Determination of the impact of the road network and dwellings on the spread of fires in the LCPB
3. Results
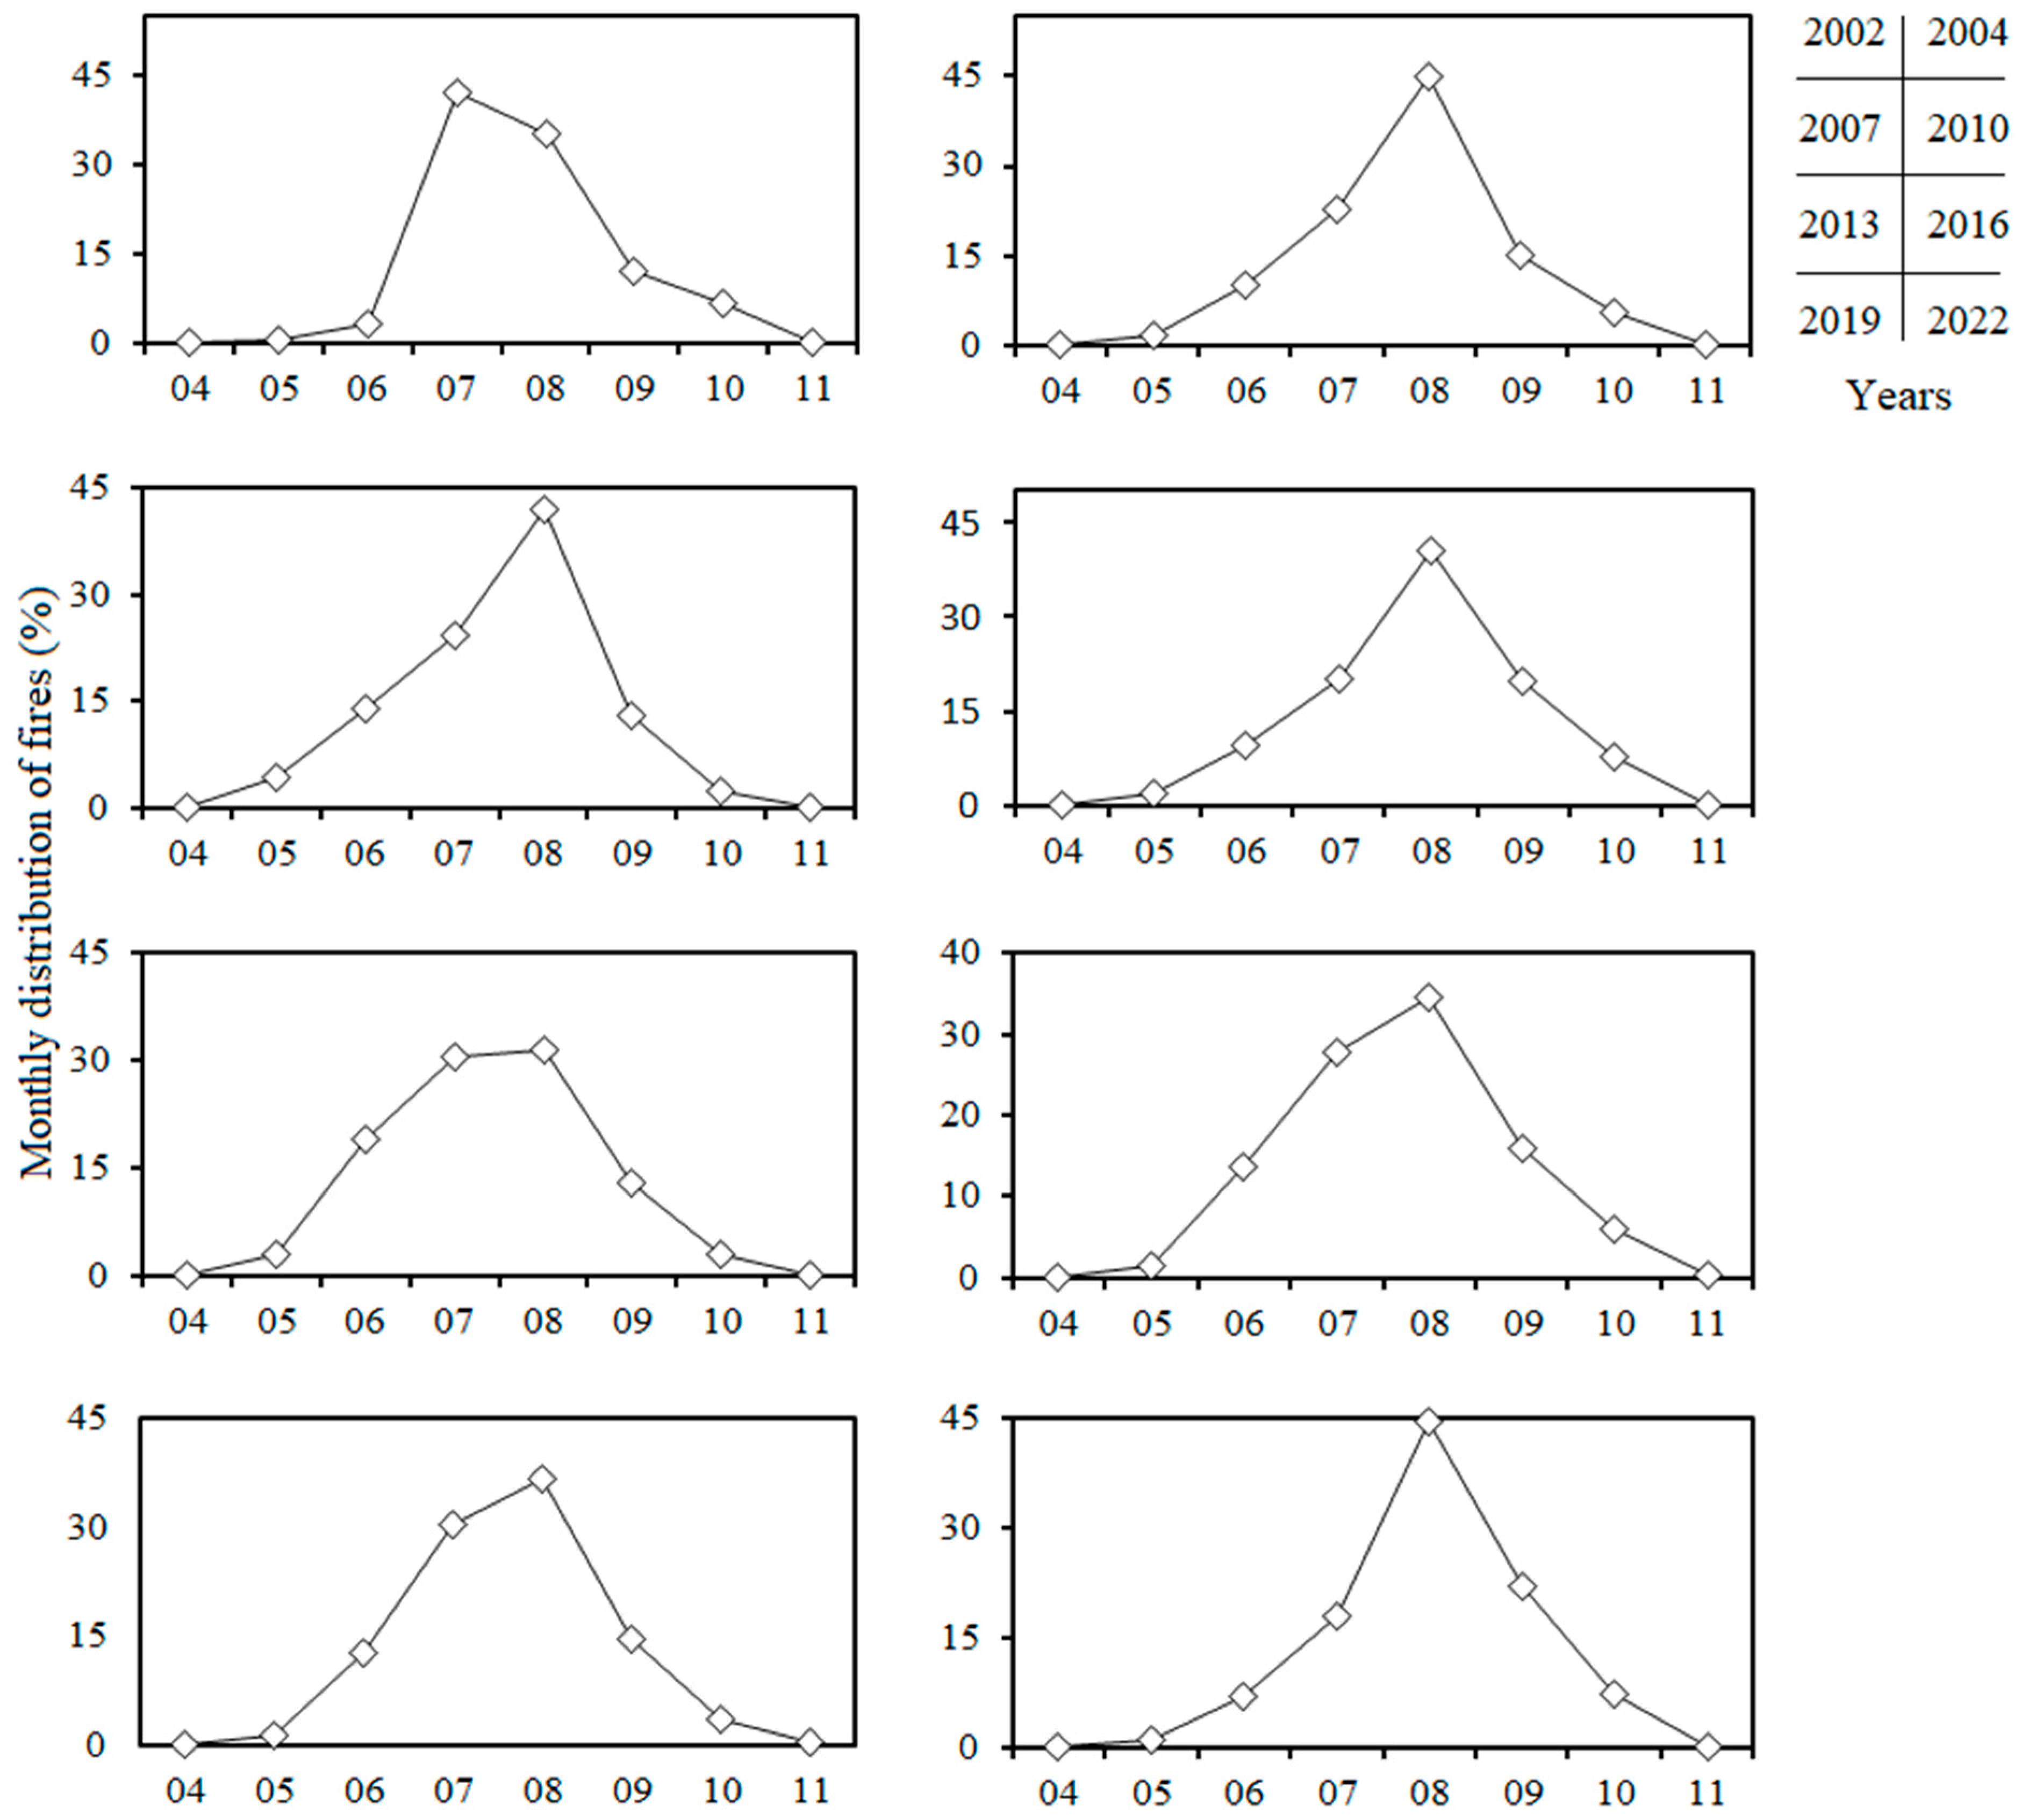
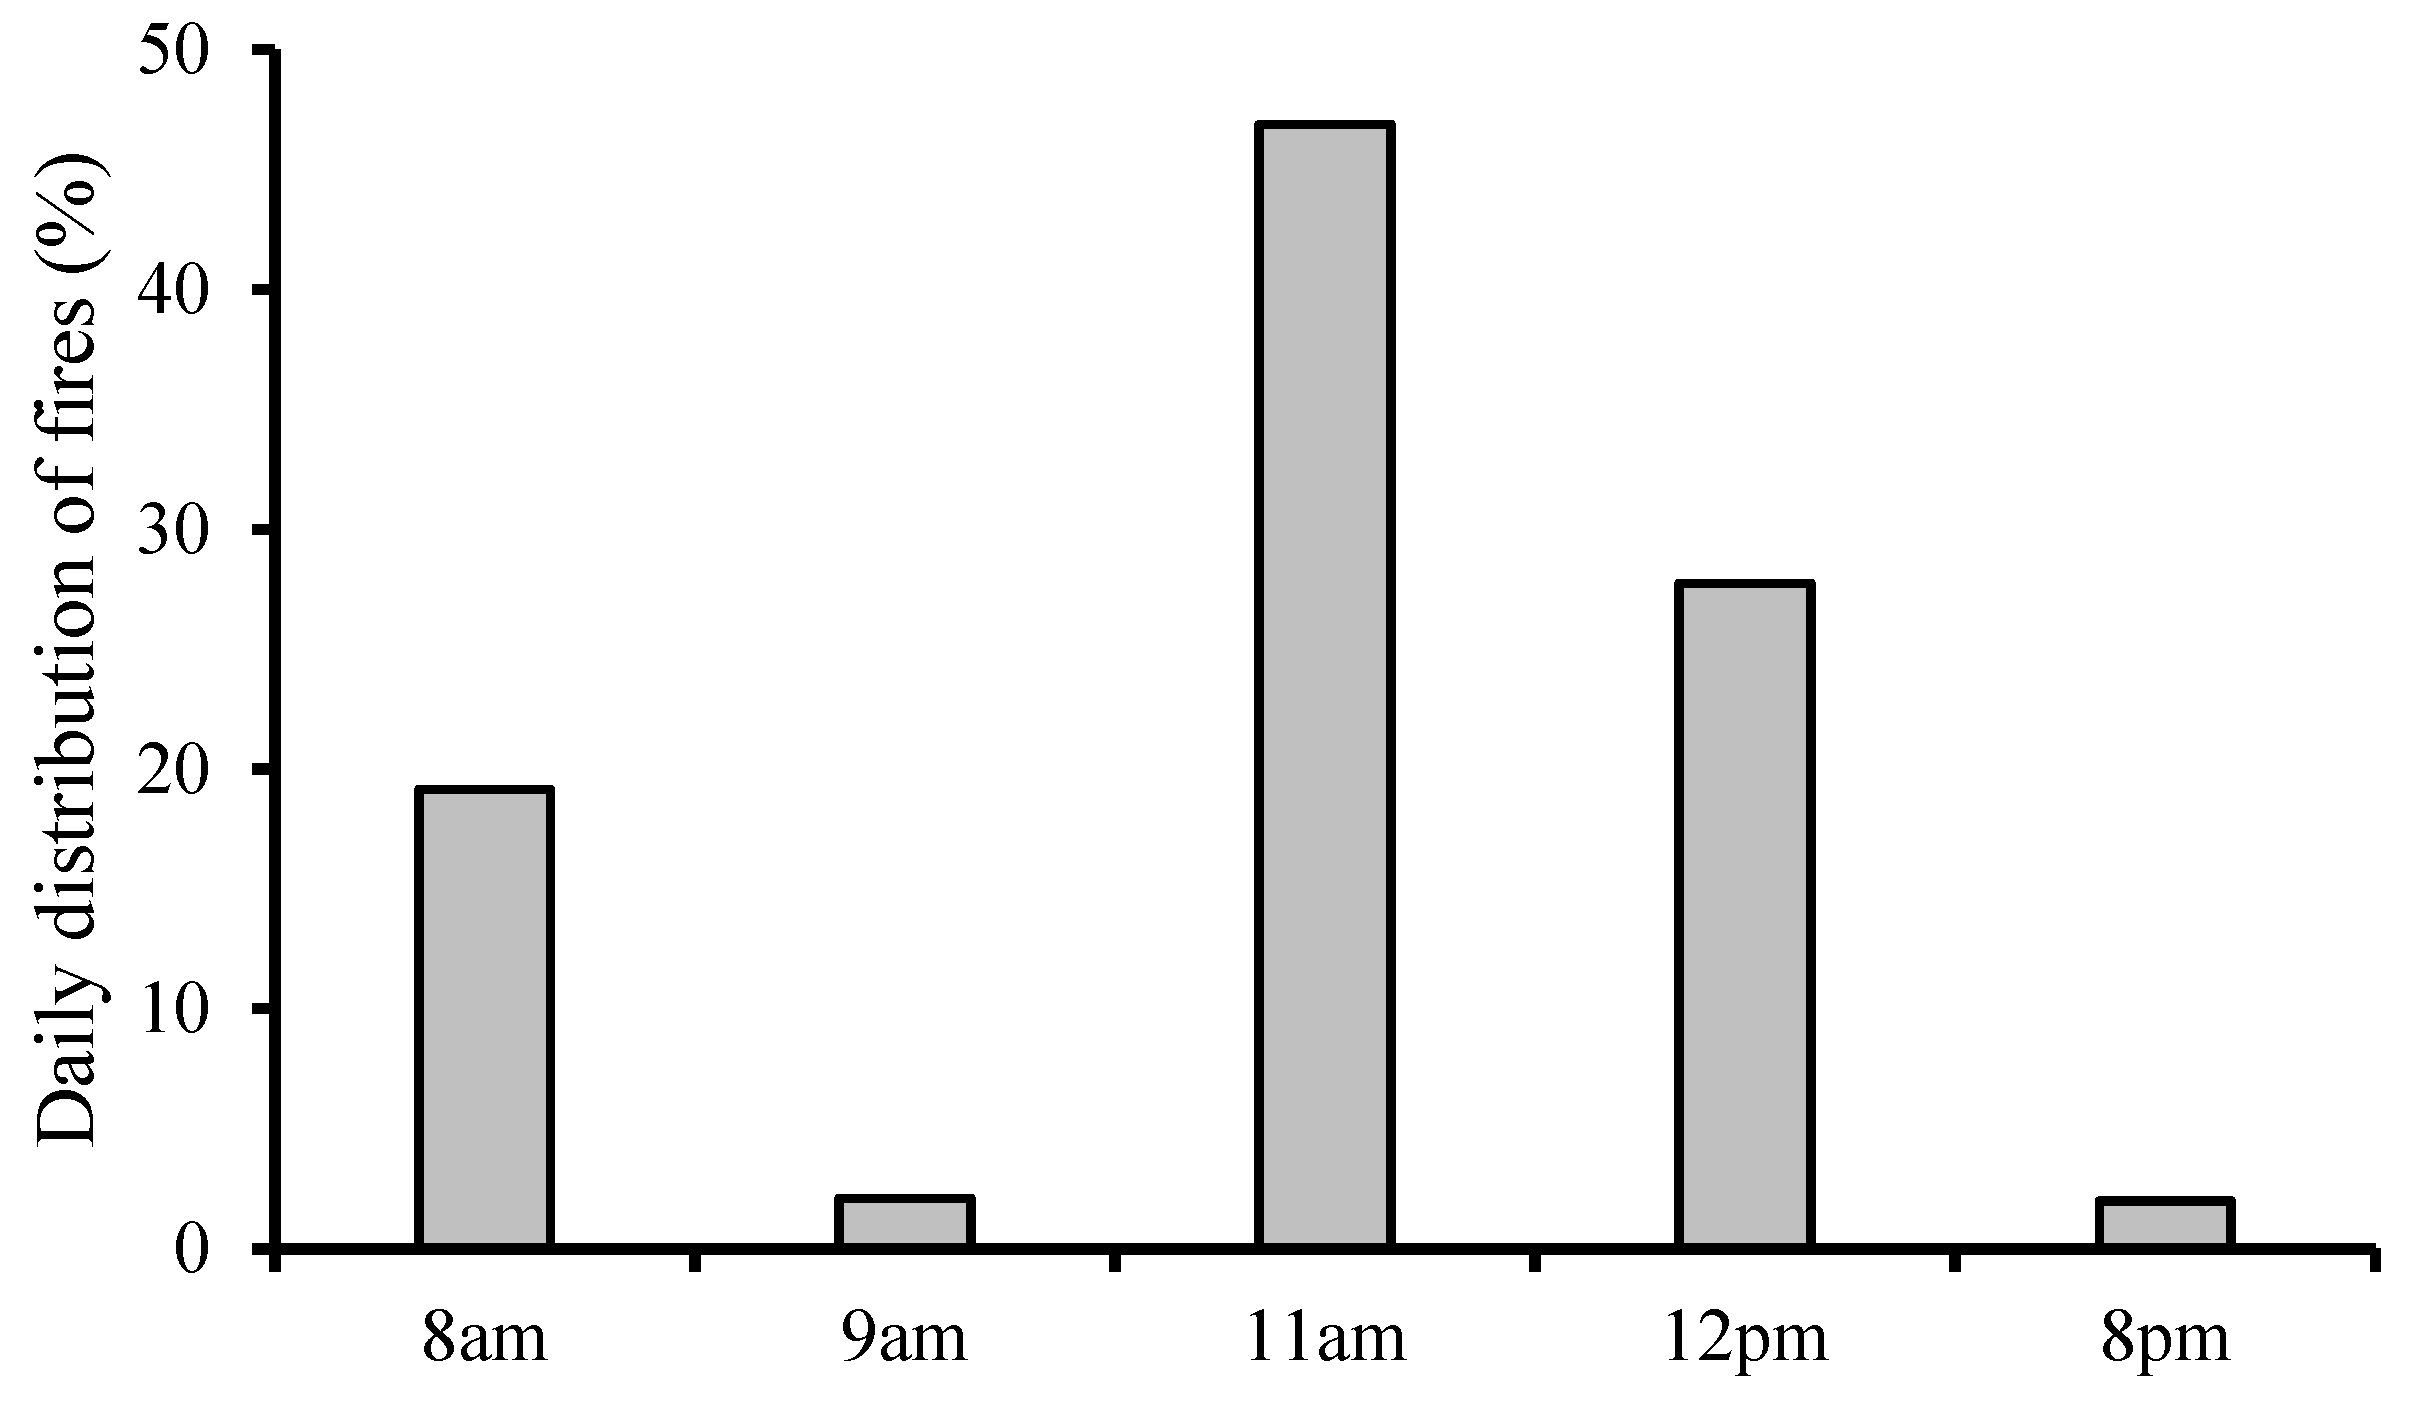
3.1. Analysis of the distribution of fires and the destructive power of fires in the study area between 2002 and 2022
3.2. Spatio-temporal dynamics of bushfires in the LCPB: quantification of the number of fires and the area burnt in land occupations
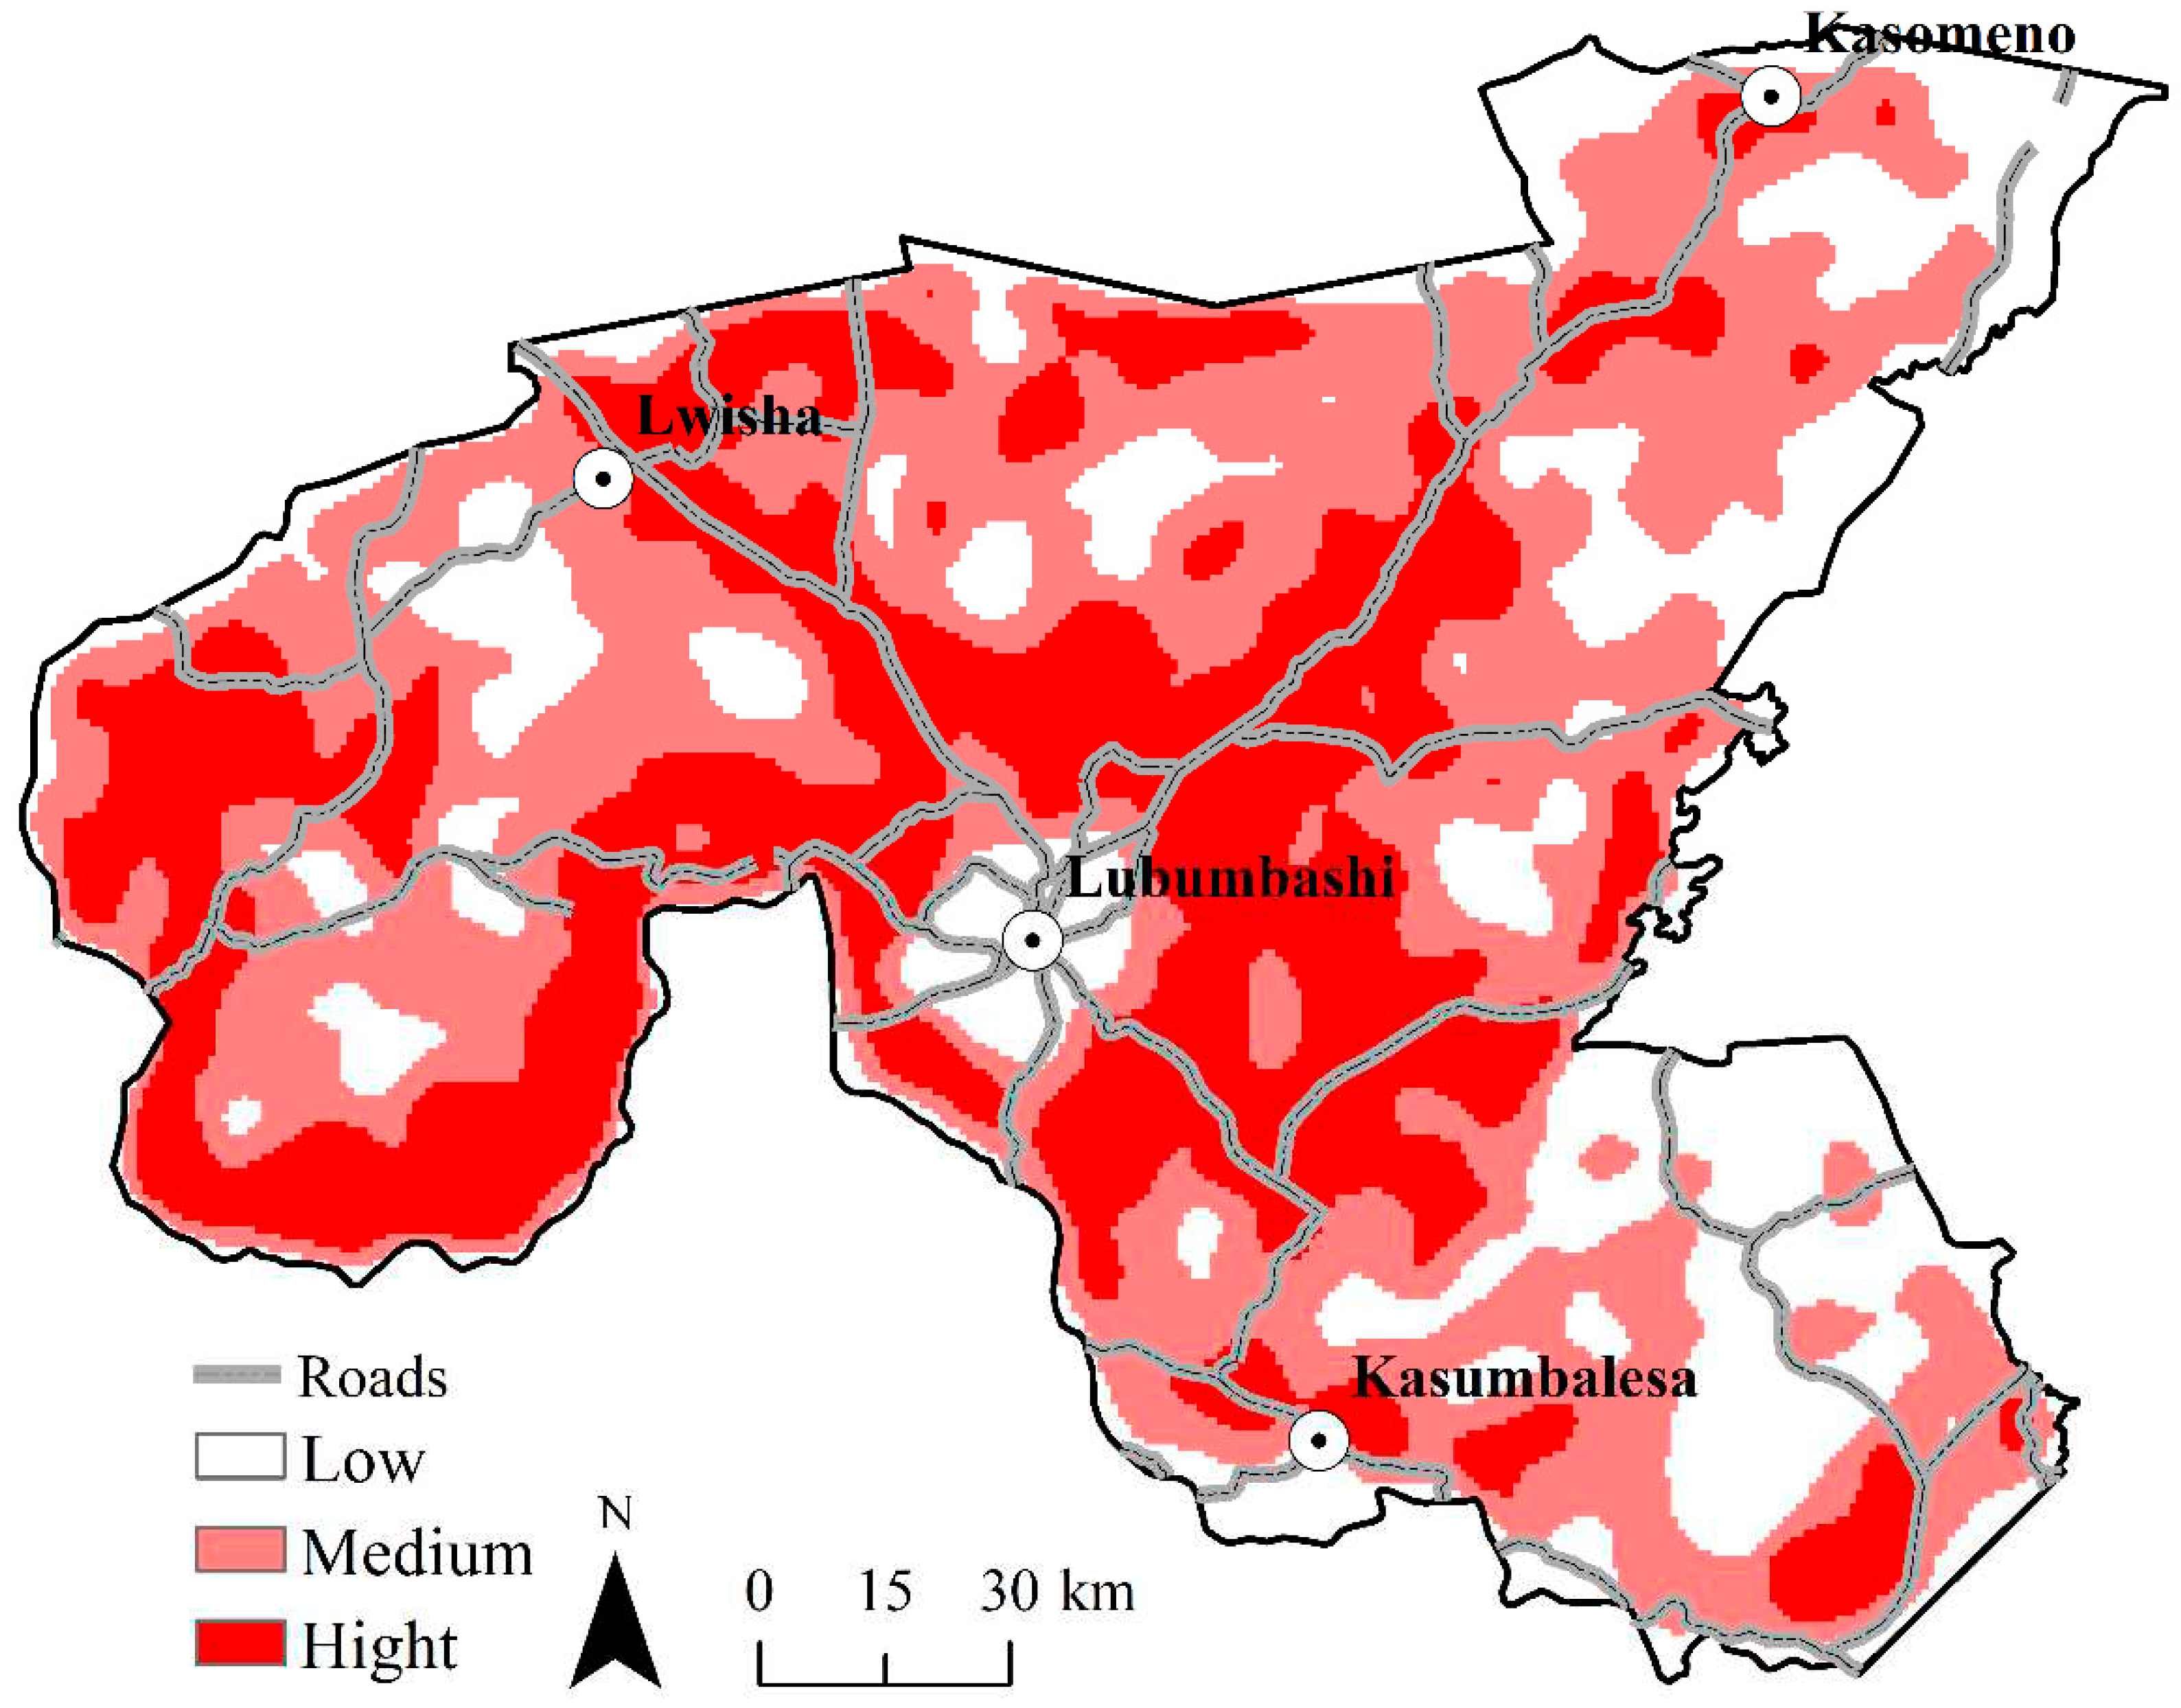
3.3. Impact of roads and dwellings on the spread of fires in the LCPB
4. Discussion
4.1. Methodology
4.2. Characterisation of bushfire dynamics and their impact on miombo in the LCPB region
4.3. Implications for combating wildfire and preserving the biodiversity of the miombo in the LCPB
5. Conclusion
Author Contributions
Funding
Data Availability Statement
Conflicts of Interest
References
- Harris, N.L.; Gibbs, D.A.; Baccini, A. et al. Global maps of twenty-first century forest carbon fluxes. Nat. Clim. Chang 2021, 11, 234–240. [CrossRef]
- Friedlingstein, P.; O'sullivan, M.; Jones, M. W.; Andrew, R. M.; Hauck, J.; Olsen, A.; ... & Zaehle, S. Global carbon budget 2020. Earth System Science Data Discussions 2020, 1-3.
- Baccini, A.; Walker, W.; Carvalho, L.; Farina, M.; Sulla-Menashe, D.; Houghton, R.A. Tropical forests are a net carbon source based on aboveground measurements of gain and loss. Science 2017, 358, 230–234. [CrossRef]
- Defourny, J.-P.; Delhage, C.; Kibambe, L.J.-P. Analyse Quantitative des Causes de la Déforestation et de la Dégradation des Forêts en République Démocratique du Congo; Rapport Final; FAO: Kinshasa, Democratic Republic of the Congo, 2011.
- Gillet, P.; Vermeulen, C.; Feintrenie, L.; Dessart, H. Quelles sont les causes de la déforestation dans le bassin du Congo? Synthèse bibliographique et étude des cas. Biotechnol. Agron. Société Et Environ. 2016, 20, 183–194. [CrossRef]
- Seaman, D.J.I., Voigt, M.; Bocedi, G.; et al. Orangutan movement and population dynamics across human-modified landscapes: implications of policy and management. Landscape Ecol 2021 , 36 , 2957–2975. [CrossRef]
- Bauer, H.; Packer, C.; Funston, P.F.; Henschel, P.; & Nowell, K. Panthera leo (errata version published in 2017). The IUCN Red List of Threatened Species 2016: e.T15951A115130419. [CrossRef]
- FAO. (2020). Global Forest Resources Assessment 2020. Available online: https://www.fao.org/forest-resources-assessment/2020/en/ (accessed on 14 July 2023).
- Agbeshie, A. A.; Abugre, S.; Atta-Darkwa, T.; & Awuah, R. A review of the effects of forest fire on soil properties. Journal of Forestry Research 2022, 33(5), 1419-1441. [CrossRef]
- Global Forest Resource Assessment. Available online: https://www.fao.org/forest-resources-assessment/2020/en/ (accessed on 02 Septembre 2023).
- Eba’a Atyi, R.; Hiol Hiol, F.; Lescuyer, G.; Mayaux, P.; Defourny, P.; Bayol, N.; Nasi, R. Les forêts du Bassin du Congo: état des Forêts; CIFOR: Bogor, Indonésie, 2021.
- Curtis, P.G.; Slay, C.M.; Harris, N.L.; Tyukavina, A.; Hansen, M.C. Classifying drivers of global forest loss. Science 2018, 361, 1108–1111. [CrossRef]
- Hansen, M. C.; Potapov, P. V.; Moore, R.; Hancher, M.; Turubanova, S. A.; Tyukavina, A.; ... & Kommareddy, A. High-resolution global maps of 21st-century forest cover change. Science 2013, 342, 850-853.
- Böhrkircher, L.; Leuchner, M.; Bayro Kaiser, F.; Reicher, C. Problems of Deforestation and Its Drivers. In: Priority-Zone Mapping for Reforestation. SpringerBriefs in Geography. Springer , Cham 2023. [CrossRef]
- Bowman, D.M.J.S.; O’Brien, J.A.; Goldammer, J.G. Pyrogeography and the global quest for sustainable fire management. Annu. Rev. Environ. Resour. 2013, 38, 57–80. [CrossRef]
- Krebs, P.; Pezzatti, G.B.; Mazzoleni, S.; Talbot, L.M.; Conedera, M. Fire regime: History and definition of a key concept in disturbance ecology. Theory Biosci. 2010, 129, 53–69. [CrossRef]
- Stone, G.D. Keeping the home fires burning: the changed nature of householding in the Kofyar homeland. Human Ecology 1998, 26, 239–265. [CrossRef]
- Forman R.T.T. Horizontal processes, roads, suburbs. societal objectives, and landscape ecology. In landscape ecological analysis: issues and applications (eds. Klopatek J.M & Gardner R.H.); Springer-Verlag, New York, 1999; pp. 35-53.
- Kana, C.E., Etouna, J.E. Apport de Trois Méthodes de Détection des Surfaces Brûlées par Imagerie Landsat ETM+ : Application au Contact Forêt - Savane du Cameroun. Cybergeo 2006. [CrossRef]
- Eva, H.; Grégoire, J.M.; Mayaux, P.; Chevallier D. Suivi des feux de végétation dans les aires protégées d’Afrique sub-saharienne, 2003. [CrossRef]
- Tyukavina, A.; Hansen, M.C.; Potapov, P.V.; Stehman, S.V.; Smith-Rodriguez, K.; Okpa, C.; Aguilar, R. Types and rates of forest disturbance in Brazilian Legal Amazon, 2000–2013. Sci. Adv. 2017, 3, e1601047. [CrossRef]
- Hislop, S.; Haywood, A.; Jones, S.; Soto-Berelov, M.; Skidmore, A.; Nguyen, T.H. A satellite data driven approach to monitoring and reporting fire disturbance and recovery across boreal and temperate forests. Int. J. Appl. Earth Obs. Geoinf. 2020, 87, 102034. [CrossRef]
- Vancutsem, C.; Achard, F.; Pekel, J.F.; Vieilledent, G.; Carboni, S.; Simonetti, D.; Nasi, R. Long-term (1990–2019) monitoring of forest cover changes in the humid tropics. Sci. Adv. 2021, 7, eabe1603. [CrossRef] [PubMed]
- Potapov, P.V.; Turubanova, S.A.; Hansen, M.C.; Adusei, B.; Broich, M.; Altstt, A.; Mane, L.; Justice, C.O. Quantifyng forest cover loss in Democratic Republic of the Congo, 2000–2010, with Landsat ETM+data. Remote Sens. Environ. 2012, 122, 106–116. [CrossRef]
- Mwitwa, J.; German, L.; Muimba-Kankolongo, A.; & Puntodewo, A. Governance and sustainability challenges in landscapes shaped by mining: mining forestry linkages and impacts in the Copper Belt of Zambia and the DR Congo. Forest Policy and Economics 2012, 25, 19–30. [CrossRef]
- Useni Sikuzani, Y.; Boisson, S.; Cabala Kaleba, S.; Nkuku Khonde, C.; Malaisse, F.; Halleux, J.M.; Munyemba Kankumbi, F. Dynamique de l’occupation du sol autour des sites miniers le long du gradient urbain-rural de la ville de Lubumbashi, RD Congo. Biotechnol. Agron. Société Environ. 2020, 24. [CrossRef]
- Kaleba, S.C.; Sikuzani, Y.U.; Yamba, A.M.; Kankumbi, F.M.; Bogaert, J. Activités anthropiques et dynamique des écosystèmes forestiers dans les zones territoriales de l’Arc Cuprifère Katangais (RD Congo). Tropicultura 2022, 40, 27. [CrossRef]
- Useni Sikuzani, Y.; Khoji Muteya, H.; Langunu, S.; Gerardy, A.; Bogaert, J. Amplification of anthropogenic pressure heavily hampers natural ecosystems regeneration within the savanization halo around Lubumbashi city (Democratic Republic of Congo). Int. J. Env. Sci. Nat. Res. 2019, 17, 555958. [CrossRef]
- Khoji, M.H.; N’Tambwe, N.D.-D.; Malaisse, F.; Waselin, S.; Sambiéni, K.R.; Cabala, K.S.; Munyemba, K.F.; Bastin, J.-F.; Bogaert, J.; Useni, S.Y. Quantification and Simulation of Landscape Anthropization around the Mining Agglomerations of Southeastern Katanga (DR Congo) between 1979 and 2090. Land 2022, 11, 850. [CrossRef]
- White, F. La Végétation de L’afrique: Mémoire Accompagné de la Carte de la Végétation de l’Afrique; ORSTOM-UNESCO: Paris, France, 1983; 384p.
- Malaisse, F. How to Live and Survive in Zambezian Open Forest (Miombo Ecoregion); Presses Agronomiques de Gembloux: Gembloux, Belgium, 2010.
- Campbell, B.M.; Angelsen, A.; Cunningham, A.; Katerere, Y.; Sitoe, A.; Wunder, S. Miombo Woodlands–Opportunities and Barriers to Sustainable Forest Management; CIFOR: Bogor, Indonesia, 2007; p. 41.
- Muteya, H.K.; Nghonda, D.-d.N.; Kalenda, F.M.; Strammer, H.; Kankumbi, F.M.; Malaisse, F.; Bastin, J.-F.; Sikuzani, Y.U.; Bogaert, J. Mapping and Quantification of Miombo Deforestation in the Lubumbashi Charcoal Production Basin (DR Congo): Spatial Extent and Changes between 1990 and 2022. Land 2023, 12, 1852. [CrossRef]
- Johnson, L.; Smith, A.; & Brown, P. Influences of Anthropogenic Activities on Landscape Dynamics in the Miombo Woodlands. Journal of Environmental Management 2020, 265, 110569.
- Sikuzani, Y.U.; Mukenza, M.M.; Malaisse, F.; Kaseya, P.K.; Bogaert, J. The Spatiotemporal Changing Dynamics of Miombo Deforestation and Illegal Human Activities for Forest Fire in Kundelungu National Park, Democratic Republic of the Congo. Fire 2023, 6, 174. [CrossRef]
- Kabulu, D.J.-P.; Vranken, I.; Bastin, J.-F.; Malaisse, F.; Nyembwe, N.S.; Useni, S.Y.; Ngongo, L.M.; Bogaert, J. Approvisionnement En Charbon de Bois Des Ménages Lushois: Quantités, Alternatives et Conséquences. In Anthropisation des Paysages Katangais; Bogaert, J., Colinet, G., Mahy, G., Eds.; Presses Universitaires de Liège: Liège, Belgique, 2018; pp. 297–311.
- Bogaert, J.; Barima, Y. S. S.; Ji, J.; Jiang, H.; Bamba, I.; Iyongo, W. M. L.; Mama, A.; Nyssen, E.; Dahdouh-Guebas, F.; & Koedam N. A methodological framework to quantify anthropogenic effects on landscape pattern. In Hong S.-K., Wu J., Kim J-E. & NakagoshiN. (Eds). Landscape ecology in Asian cultures. Part 2, Springer, Verlag, New York, ., 2011; pp 141-167.
- Devineau, J.L.; Fournier, A.; Nignan, S. Savanna fire regimes assessment with MODIS fire data: Their relationship to land cover and plant species distribution in western Burkina Faso (West Africa). J. Arid Environ 2010, 74, 1092–1101. [CrossRef]
- Giglio, L.; Descloitres, J.; Justice, C.O.; Kaufma, Y. An enhanced contextual fire detection algorithm for MODIS. Remote Sens. Environ 2003. 87, 273–282. [CrossRef]
- Lemenkova, P.; Debeir, O. R Libraries for Remote Sensing Data Classification by K-Means Clustering and NDVI Computation in Congo River Basin, DRC. Appl. Sci. 2022, 12, 12554. [CrossRef]
- Bogaert, J.; André, M. L’écologie du paysage: Une discipline unificatrice. Tropicultura 2013, 31, 1–2.
- Saley, A. Utilisation des nouvelles techniques de cartographie pour l’étude de la dynamique de l’occupation du sol dans la commune rurale de Namaro, CRESA, Niamey, 2006 ; 82p.
- Koua, K. A. N.; Bamba I.; Barima, Y. S. S.; Kouakou, A. T. M.; Kouakou, K. A.; & Sangne Y. C. Echelle spatiale et dynamique de la forêt classée du Haut-Sassandra (Centre-Ouest de la Côte d’Ivoire) en période de conflits. Revue Environnement et Biodiversité-PASRES 2017, 2, 54- 68.
- Mama, A.; Sinsin, B.; De Cannière, C.; Bogaert, J. Anthropisation et dynamique des paysages en zone soudanienne au nord du Bénin. Tropicultura 2013, 31, 78–88.
- Kottek, M.; Grieser, J.; Beck, C.; Rudolf, B.; Rubel, F. World Map of the Köppen-Geiger Climate Classification Updated. Meteorol. Z. 2006, 15, 259–263. [CrossRef]
- Assani, A.A. Analyse de la variabilité temporelle des précipitations (1916-1996) à Lubumbashi (Congo-Kinshasa) en relation avec certains indicateurs de la circulation atmosphériques (oscillation australe) et océanique (El Nino/La Nina). Sécheresse 1999, 10, 245-252.
- Leblanc, M.; & Malaisse F. Lubumbashi, un écosystème urbain tropical. Lubumbashi, RDC : Centre International de Sémiologie, Université Nationale du Zaïre, 1978.
- Baert, G.; van Ranst, E.; Ngongo, M.L.; Kasongo, E.L.; Verdoodt, A.; Mujinya, B.B.; Mukalay, J.M. Guide des Sols en République Démocratique du Congo, Tome II: Description et Données Physico-Chimiques de Profils Types; Ecole Technique Salama-Don Bosco: Lubumbashi, Congo, 2009; ISBN 978-90-76769-98-1.
- Munyemba, K.F.; Bogaert, J. Anthropisation et Dynamique Spatiotemporelle de l’occupation Du Sol Dans La Région de Lubumbashi Entre 1956 et 2009. E Rev. UNILU 2014, 1, 1–23.
- Mukenza, M.M.; Muteya, H.K.; Nghonda, D.-D.N.; Sambiéni, K.R.; Malaisse, F.; Kaleba, S.C.; Bogaert, J.; Sikuzani, Y.U. Uncontrolled Exploitation of Pterocarpus tinctorius Welw. And Associated Landscape Dynamics in the Kasenga Territory: Case of the Rural Area of Kasomeno (DR Congo). Land 2022, 11, 1541. [CrossRef]
- Dibwe, M.D. Lubumbashi, Ville Industrielle Attractive et Repulsive (1910–2008); Los Restos de la Pobreza Urbana: Madrid, Spain, 2009.
- Useni, S.Y.; Cabala, K.S.; Nkuku, K.C.; Amisi, M.Y.; Malaisse, F.; Bogaert, J.; Munyemba, K.F. Vingt-cinq ans de monitoring de la dynamique spatiale des espaces verts en réponse à l’urbanisation dans les communes de la ville de Lubumbashi (Haut-Katanga, R.D. Congo). Tropicultura 2017, 35, 300–311.
- Gorelick, N.; Hancher, M.; Dixon, M.; Ilyushchenko, S.; Thau, D.; Moore, R. Google Earth Engine: Planetary-Scale Geospatial Analysis for Everyone. Remote Sens. Environ. 2017, 202, 18–27. [CrossRef]
- Palumbo, I.; Grégoire, J-M.; Simonetti, D.; Punga, M. Spatio-temporal distribution of fire activity in protected areas of SubSaharan Africa derived from MODIS data. Procedia Environmental Sciences 2011, 7, 26-31. [CrossRef]
- Nkwunonwo, U.C. Land use/Land cover mapping of the Lagos Metropolis of Nigeria using 2012 SLC-off Landsat ETM+ Satellite Images. Int. J. Sci. Eng. Res. 2013, 4, 1217–1223.
- Barima, Y.S.S.; Barbier, N.; Bamba, I.; Traore, D.; Lejoly, J.; Bogaert, J. Dynamique paysagère en milieu de transition ivoirienne. Bois Trop. 2009, 299, 15–25. [CrossRef]
- Phan, T.N.; Kuch, V.; Lehnert, L.W. Land Cover Classification Using Google Earth Engine and Random Forest Classifier—The Role of Image Composition. Remote Sens. 2020, 12, 2411. [CrossRef]
- Breiman, L. Random Forests. Mach. Learn. 2001, 45, 5–32. [CrossRef]
- Olofsson, P.; Foody, G.M.; Herold, M.; Stehman, S.V.; Woodcock, C.E.; Wulder, M.A. Good Practices for Estimating Area and Assessing Accuracy of Land Change. Remote Sens. Environ. 2014, 148, 42–57. [CrossRef]
- Giglio, L.; van der Werf, G.R.; Randerson, J.T.; Collatz, G.J.; Kasibhatla, P. Estimation of burned area using MODIS active fire observations. Atmos. Chem. Phys. 2006, 6, 957–974. [CrossRef]
- Diggle, P. A Kernel method for smoothing point process data. Appl. Stat 1985, 34, 138. [CrossRef]
- Müller, D., Suess, S., 2011. Can the MODIS active fire hotspots be used to monitor vegetation fires in the Lao PDR?. Deutsche Gesellschaft für Internationale Zusammenarbeit (GIZ) Climate Protection through Avoided Deforestation (CliPAD) Programme, 50 p.
- Boschetti, L.; Roy, D.; Hoffmann, A.A.; Humber, M. MODIS Collection 5 Burned Area Product-MCD45. User’s Guide Ver 2009, 2, 1–2.
- Dahan, K.S.; N’da, H.D.; Kaudjhis, C.A. Dynamique spatiotemporelle des feux de 2001 à 2019 et dégradation du couvert végétal en zone de contact forêt-savane, Département de Toumodi, Centre de la Côte d’Ivoire. Afr. Sci. 2021, 19, 94–113.
- Fornacca, D.; Ren, G.; Xiao, W. Performance of three MODIS fire products (MCD45A1, MCD64A1, MCD14ML), and ESA Fire_CCI in a mountainous area of Northwest Yunnan, China, characterized by frequent small fires. Remote Sens. 2017, 9, 1131. [CrossRef]
- N’tambwe Nghonda, D.-d.; Muteya, H.K.; Kashiki, B.K.W.N.; Sambiéni, K.R.; Malaisse, F.; Sikuzani, Y.U.; Kalenga, W.M.; Bogaert, J. Towards an Inclusive Approach to Forest Management: Highlight of the Perception and Participation of Local Communities in the Management of miombo Woodlands around Lubumbashi (Haut-Katanga, D.R. Congo). Forests 2023, 14, 687. [CrossRef]
- Bamba, I.; Yedmel, M.S.; Bogaert, J. Effets des routes et des villes sur la forêt dense dans la province orientale de la République Démocratique du Congo. Eur. J. Sci. Res. 2010, 43, 417–429.
- Cabala, K.S.; Useni, S.Y.; Sambieni, K.R.; Bogaert, J.; Munyemba, K.F. Dynamique des écosystèmes forestiers de l’Arc Cuprifère Katangais en République Démocratique du Congo. Causes, Transformations spatiales et ampleur. Tropicultura 2017, 35, 192–202.
- Caillault, S.; Ballouche, A.; Delahaye, D. Organisation spatio-temporelle des feux de brousse. Approche comparative au Burkina Faso. In: Proceedings of the Actes des Neuvièmes Rencontres de Théo Quant. Besançon 2010.ISSN 1769-6895.
- Giglio, L.; Schroeder, W.; Hall, J.; Justice, C.; MODIS Collection 6 Active Fire Product User’s Guide Revision, B. NASA. 2018. Available online: https://www.earthdata.nasa.gov/s3fspublic/imported/MODIS_C6_Fire_User_Guide_B.pdf (accessed on 25 July 2023).
- Cizungu, N.C.; Tshibasu, E.; Lutete, E.; Mushagalusa, C.A.; Mugumaarhahama, Y.; Ganza, D.; Bogaert, J. Fire risk assessment, spatiotemporal clustering and hotspot analysis in the Luki biosphere reserve region, western DR Congo. Trees For. People 2021, 5, 100104. [CrossRef]
- Fusco, J. Analyse des dynamiques spatio-temporelles des systèmes de peuplement dans un contexte d'incertitude. Application à l'archéologie spatiale (Doctoral dissertation, UMR 7300 ESPACE (Université Nice Sophia-Antipolis) 2016; UMR 7264 CEPAM (Université Nice Sophia-Antipolis).
- Ricotta, C.; Bajocco, S.; Guglietta D.; Conodera, M. Assensing the influence of roads on five inition: does land cover matter? Fire 2018, 1 , 24. [CrossRef]
- Gueguim, C. D.; Tchamba, N. M.; & Fotso, C. R. Dynamique spatio-temporelle des feux de brousse dans le Parc National du Mbam et Djerem (Cameroun). International Journal of Biological and Chemical Sciences 2018, 12, 728-748. [CrossRef]
- Guiot, J.; Mazurek, H.; Curt, T.; Raimbault, P.; Collange, L.; & Thomas, S. Marseille et l'environnement: bilan, qualité et enjeux: le développement durable d'une grande ville littorale face au changement climatique. Presses universitaires de Provence.
- Mouillot, F.; Dupuy, J. L.; & Barbero, R. Feux de végétation: Comprendre leur diversité et leur évolution. Feux de végétation, 2022 ; 1-136.
- Colin, P.Y.; Marielle, J.; Mariel, A. La prévention : éviter tout départ de feu, Protection des forêts contre l’incendie, Cahier FAO Conservation n 36, 2001 ; 61-6.
- Lutete, E.L.; Lubini, C.; Kibambe, L.; Ngomba, M.N.; Luya, Y.W.; Lumbuenamo, R.S. Impacts of bush fires on biodiversity of Sudanian and Zambezian savanna of the Democratic Republic of Congo – case study on three protected areas: Upemba, Kundelungu and Garamba National Parks, and Bombo-Lumene hunting domain from 2000 to 2014. Int. J. Adv. Res. 2016. 4, 2073–2081.
- Elias, N., Didier, M. Caractérisation et organisation spatio-temporelle des feux actifs au Burundi de 2001 à 2016 sur base des données MODIS 17. Bull. sci. environ. biodivers. 2019, 3, 16-31.
- De Wasseige, C.; De Marken, P.; Bayol, N.; Hiol, F.; Mayaux, P.; Desclée, B.; Nasi, R.; Billand, A.; Defourny, P.; Eba Atyi, R. Les Forêts du Bassin du Congo: Etats des Forêts 2010; Office de publication de l’Union Européenne: Luxembourg, 2012; p. 276.
- Opha, PD. Linking fire and climate: interactions with land use, vegetation, and soil. Current Opinion in Environmental Sustainability 2009, 1, 161-169.
- Kana, EC.; Etouna, JE. Apport de trois méthodes de détection des surfaces brûlées par imagerie Landsat ETM+ : application au contact forêt- savane du Cameroun. Cybergeo, European Journal of Geography 2006. https://cybergeo.revues.org/2711.
- Afelu, B.; & Kokou, K. Paramètres physiques d’évaluation du comportement des feux de végétation au Togo. International Journal of Biological and Chemical Sciences 2015, 9(4), 2091-2105.
- Watson, F.G.; Becker, M.S.; Milanzi, J.; Nyirenda, M. Human encroachment into protected area networks in Zambia: Implications for large carnivore conservation. Reg. Environ. Chang. 2014, 15, 415–429. [CrossRef]
- Melo, P.; Sparacino, J.; Argibay, D.; Sousa Júnior, V.; Barros, R.; Espindola, G. Assessing Wildfire Regimes in Indigenous Lands of the Brazilian Savannah-Like Cerrado. Fire 2021, 4, 34. [CrossRef]
- Mbemba, C.; Karsenty, A.; & Ringuet, S. Impacts of Land Use Changes on Vegetation Fires in the Miombo Woodlands of Central Africa. International Journal of Wildland Fire 2019, 28, 335-346.
- Timothy, J.; George, L. W.; Sarah, V.; & Azharul, A. Managing Fire and Biodiversity in the Wildland Urban Interface: A Role for Green Firebreaks. Fire 2018, 1, 3. [CrossRef]
- Schmidt, I.B.; Eloy, L. Fire regime in the Brazilian Savanna: Recent changes, policy and management. Flora 2020, 268, 151613. [CrossRef]
- Arbonnier, M.; Gueye, B. Vers une Stratégie de Gestion des Feux de Brousse dans la Zone D’intervention de Wula-Nafaa: Régions de Tambacounda, Kolda et Sedhiou; USAID, 2010; 121p. Available online: https://agritrop.cirad.fr/558795/ (accessed on 1 March 2023).
- Mishra, B.; Gyawali, B.R.; Paudel, K.P. et al. Adoption of Sustainable Agriculture Practices among Farmers in Kentucky, USA. Environmental Management 62, 1060–1072 (2018). [CrossRef]
- Gebska, M.; Grontkowska, A.; Swiderek, W.; & Golebiewska, B. Farmer awareness and implementation of sustainable agriculture practices in different types of farms in Poland. Sustainability 2020, 12, 8022.
- Brito, B.; Barreto, P. Enforcement against illegal logging in the Brazilian Amazon. In Compliance and Enforcement in Environmental Law; Edward Elgar Publishing: Cheltenham, UK, 2011.
- Goncalves, M.P.; Panjer, M.; Greenberg, T.S.; Magrath, W.B. Justice for Forests. Improving Criminal Justice Efforts to Combat Illegal Logging; The World Bank: Washington, DC, USA, 2012.
- Ghali, R., Jmal, M., Souidene Mseddi, W., Attia, R. (2020). Recent Advances in Fire Detection and Monitoring Systems: A Review. In: Bouhlel, M., Rovetta, S. (eds) Proceedings of the 8th International Conference on Sciences of Electronics, Technologies of Information and Telecommunications (SETIT’18), Vol.1. SETIT 2018. Smart Innovation, Systems and Technologies, vol 146. Springer, Cham. [CrossRef]
- Wang, J., Weng, H., Yan, Y., & Li, C. (2021, August). Modelling and Simulation Analysis of Drones Allocation for Bushfires. In Journal of Physics: Conference Series (Vol. 1995, No. 1, p. 012001). IOP Publishing.
- Landscape. Available online: https://www.landscape.sa.gov.au/mr/publications/bushfire-prevention-bushfire-management-zones (accessed on 12 October 2023).
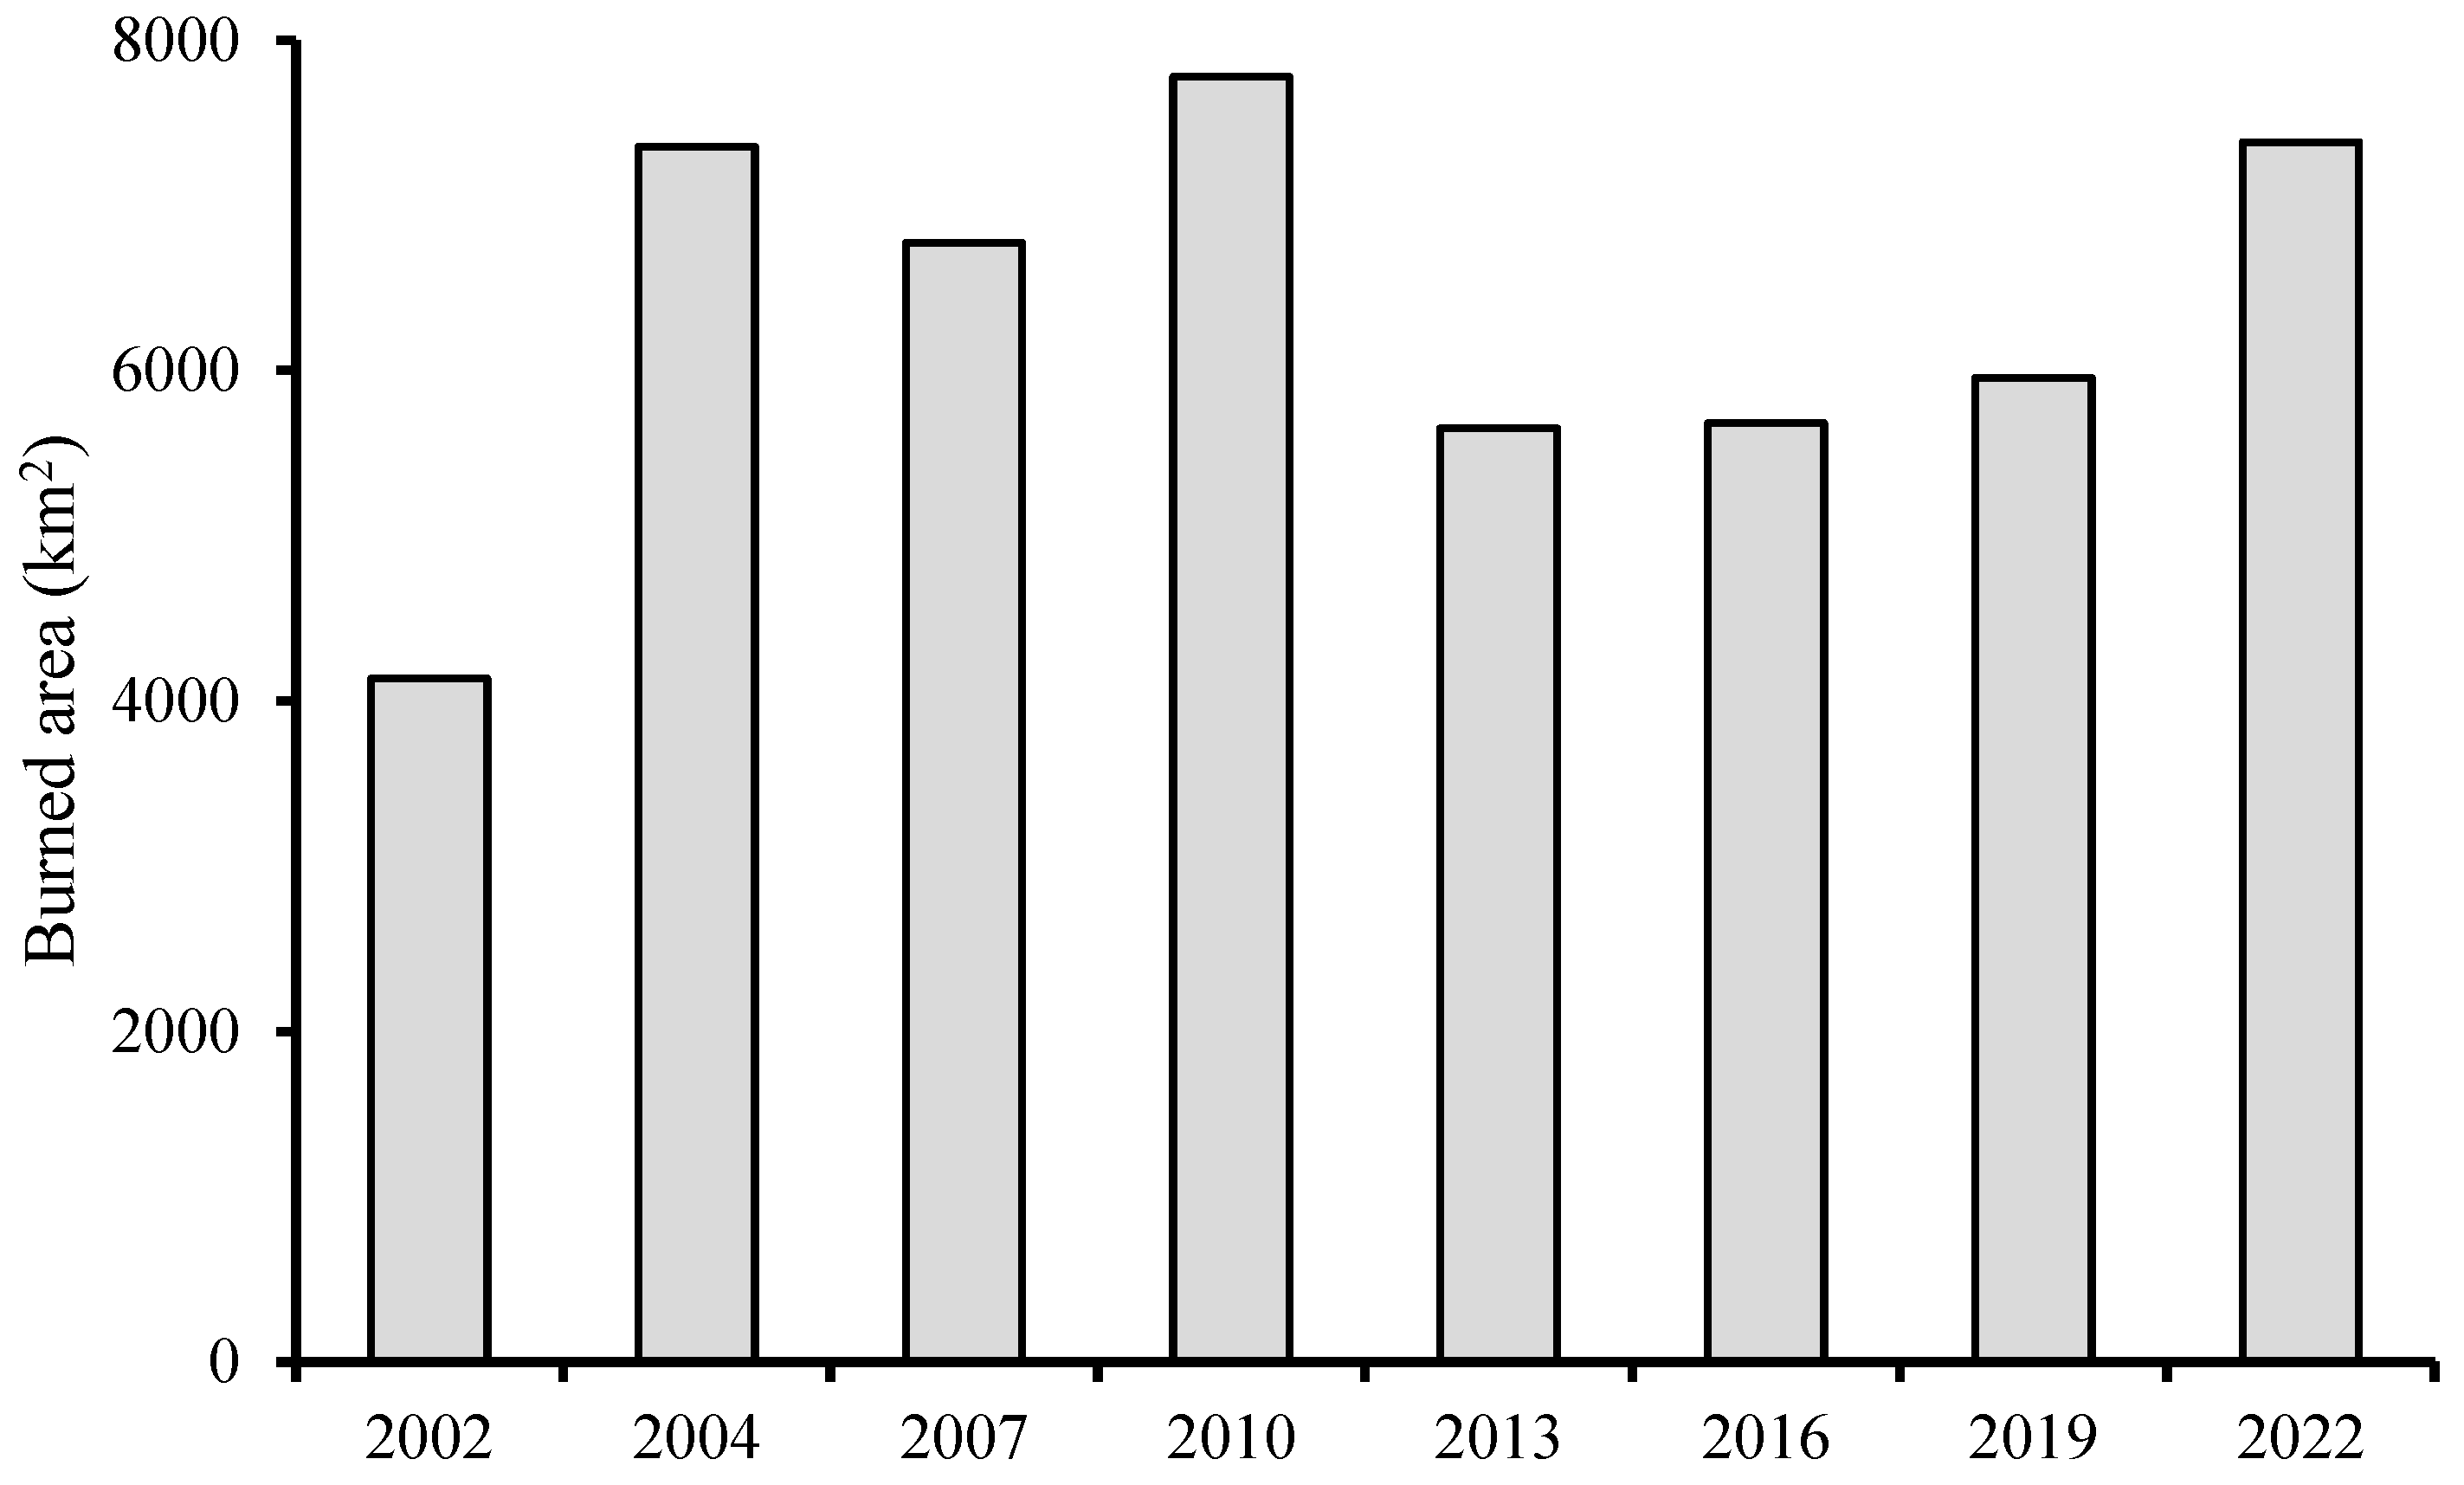
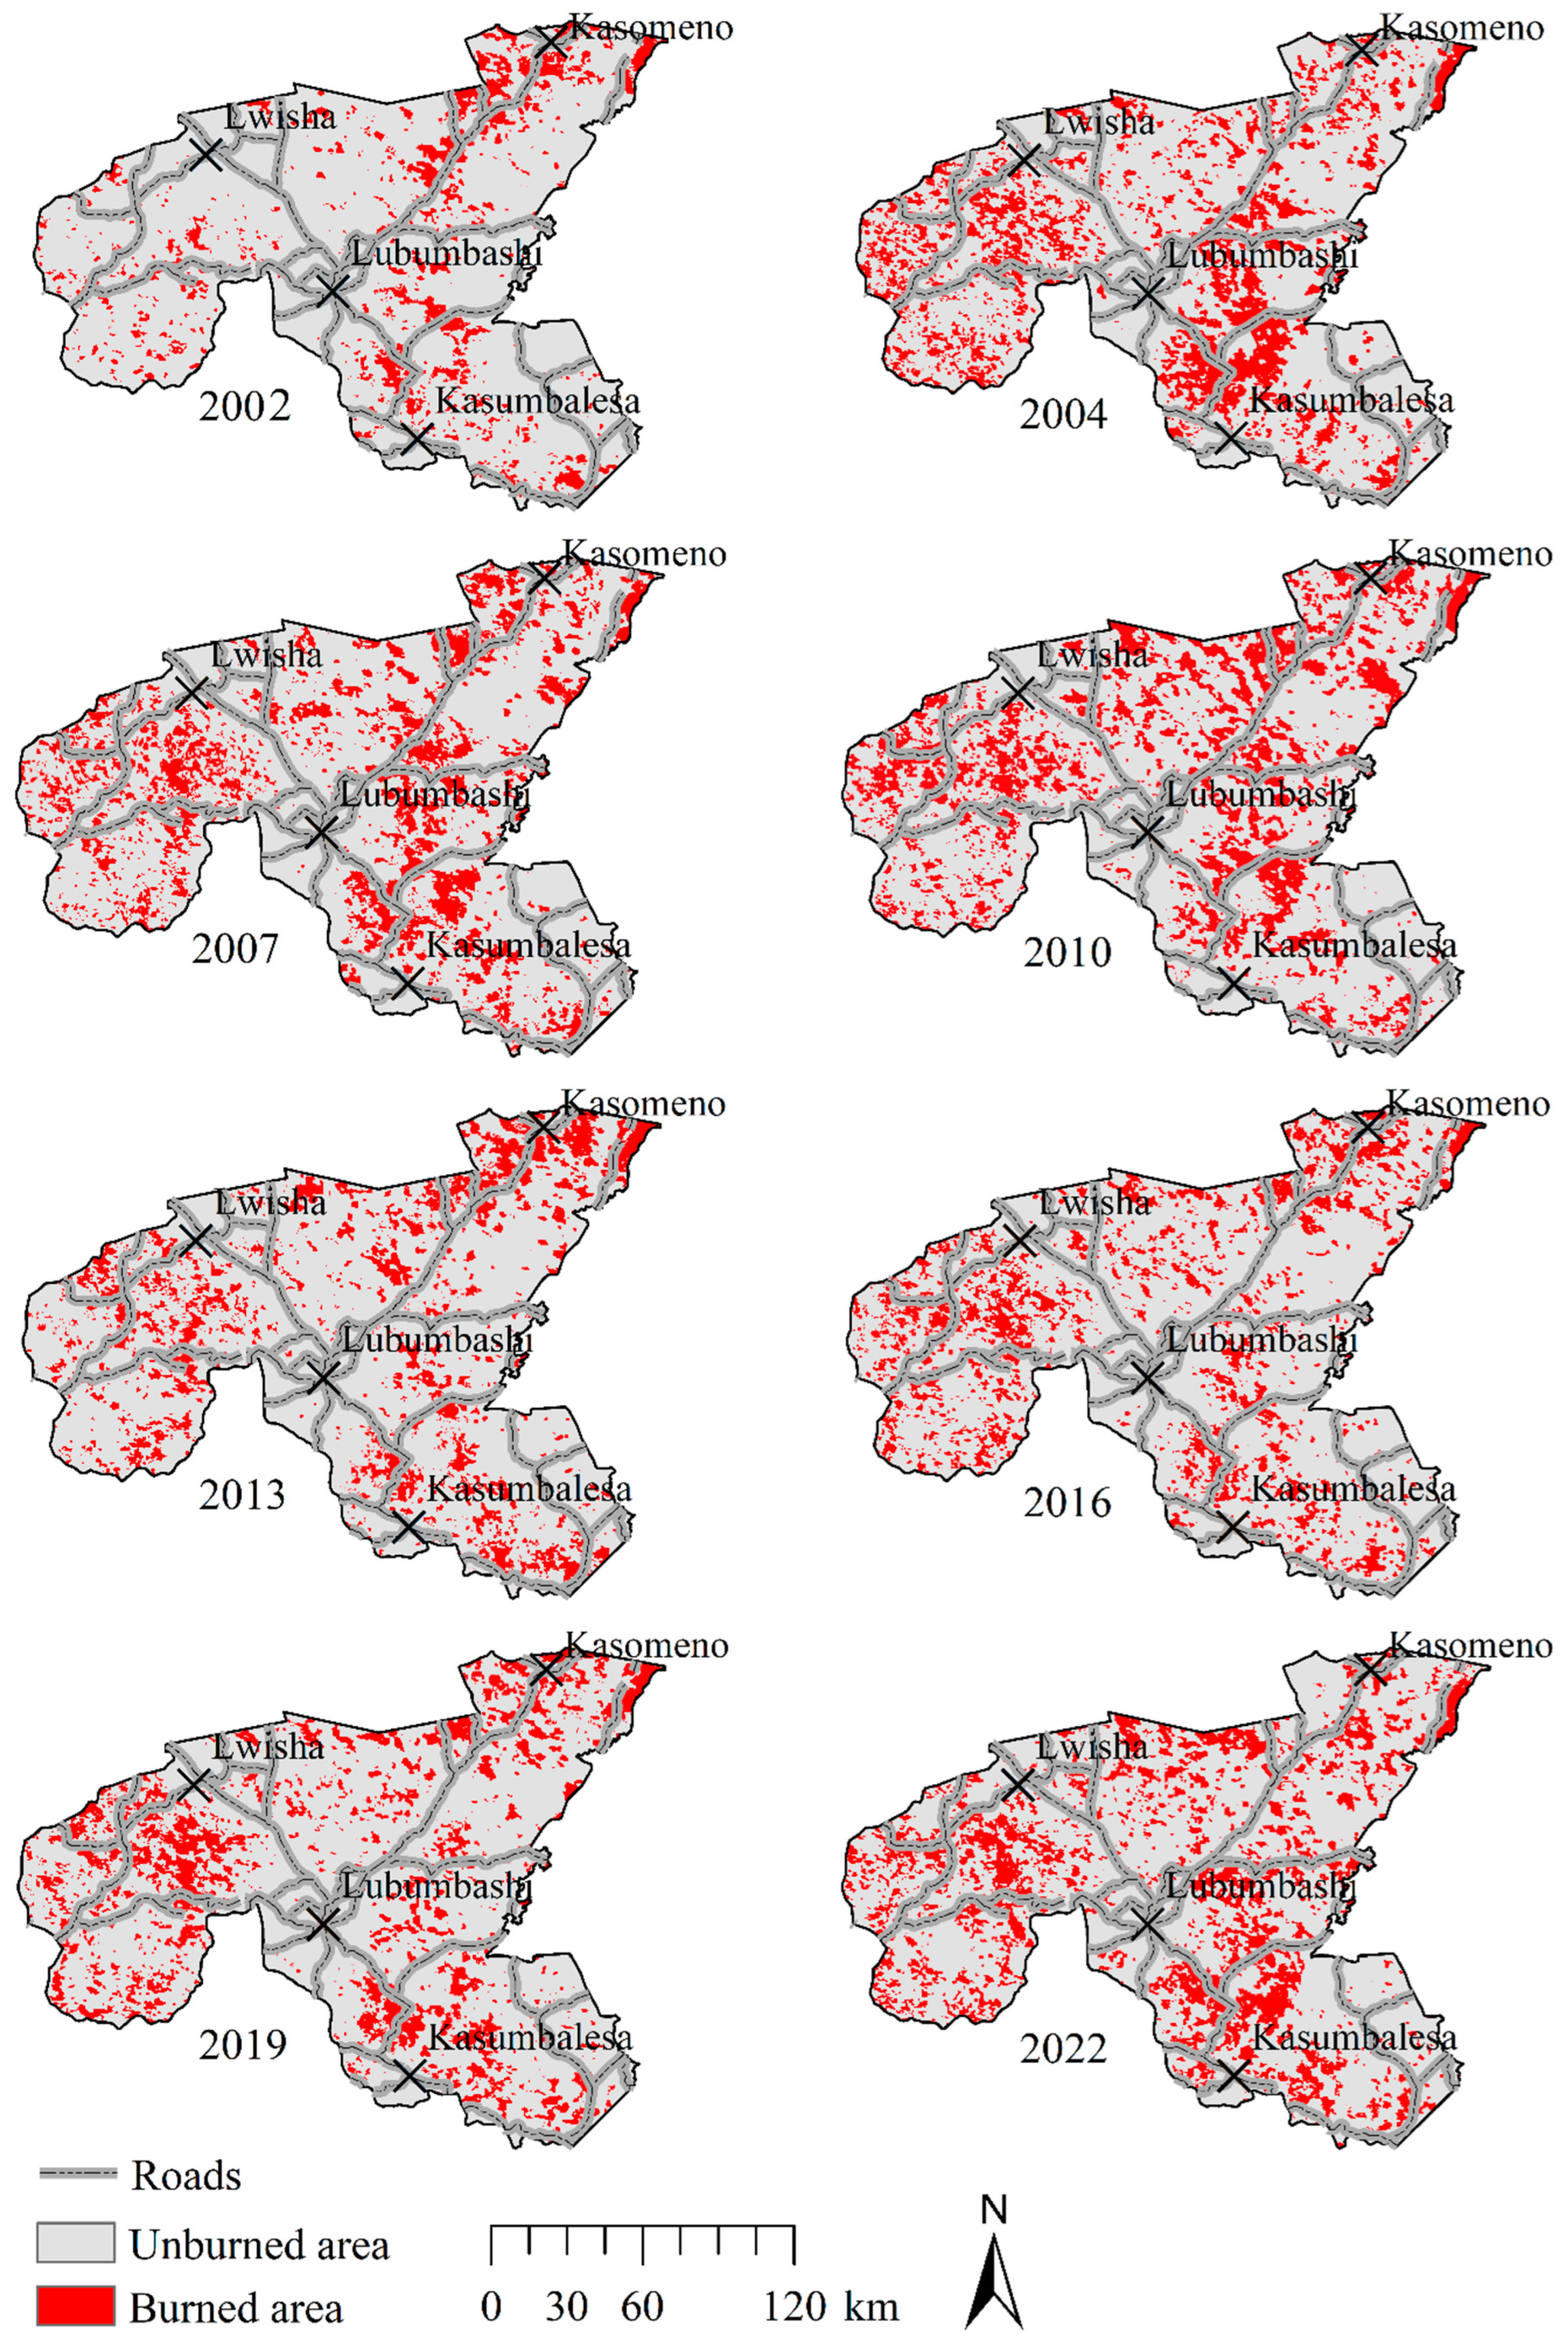

| Land use classes | Description | Number of training zones (polygons) |
| Forests | Natural land cover: miombo forest, with patches of dense dry forest and gallery forest | 55 |
| Savannah | Generally anthropogenic land cover: characterised by a low density of trees and a predominance of herbaceous cover. It is more often replaced by bare land in the dry season, after the end of the vegetation period. | 50 |
| Field | This class of anthropogenic land cover is made up of agricultural land after harvesting, abandoned agricultural land or land occupied by annual and off-season crops. | 45 |
| Other land cover | The bare land/building complex, bodies of water and unclassified areas | 50 |
| 2002-2004 | FR Stable | SV Stable | FD Stable | BBS Stable | OT Stable | FR Loss | SV Gain | FD Gain | BBS Gain |
| Accuracy measure | |||||||||
| PA [%] | 96.59 | 91.78 | 100.00 | 96.12 | 99.07 | 100.00 | 100.00 | 98.10 | 94.62 |
| UA [%] | 96.59 | 98.05 | 95.41 | 97.06 | 100.00 | 98.04 | 98.02 | 94.50 | 91.67 |
| Overall accuracy [%] | 96.74 | ||||||||
| Stratified estimators of area ± CI [% of total map area] | |||||||||
| Area [%] | 18.06 | 19.30 | 9.16 | 9.07 | 9.43 | 8.81 | 8.72 | 9.25 | 8.19 |
| 95% CI | 0.64 | 0.80 | 0.38 | 0.45 | 0.17 | 0.24 | 0.24 | 0.48 | 0.61 |
| 2004-2007 | FR Stable | SV Stable | FD Stable | BBS Stable | OT Stable | FR Loss | SV Gain | FD Gain | OT Gain |
| Accuracy measure | |||||||||
| PA [%] | 94.34 | 93.98 | 99.01 | 100.00 | 100.00 | 100.00 | 95.88 | 100.00 | 100.00 |
| UA [%] | 99.01 | 98.54 | 99.01 | 99.03 | 96.08 | 96.30 | 89.42 | 97.98 | 98.25 |
| Overall accuracy [%] | 97.37 | ||||||||
| Stratified estimators of area ± CI [% of total map area] | |||||||||
| Area [%] | 18.23 | 18.14 | 8.76 | 9.12 | 9.29 | 9.20 | 8.94 | 8.67 | 9.65 |
| 95% CI | 0.00 | 0.42 | 0.30 | 0.35 | 0.00 | 0.17 | 0.17 | 0.38 | 0.54 |
| 2007-2010 | FR Stable | SV Stable | FD Stable | BBS Stable | OT Stable | FR Loss | SV Gain | FD Gain | OT Gain |
| Accuracy measure | |||||||||
| PA [%] | 100 | 98.0488 | 100 | 98.0583 | 100 | 99.0385 | 100 | 98.9796 | 93.578 |
| UA [%] | 100 | 99.0148 | 97.0588 | 98.0583 | 100 | 100 | 99.0196 | 96.0396 | 97.1429 |
| Overall accuracy [%] | 98.67 | ||||||||
| Stratified estimators of area ± CI [% of total map area] | |||||||||
| Area [%] | 18.15 | 18.15 | 8.46 | 9.25 | 8.63 | 8.99 | 8.63 | 8.02 | 9.96 |
| 95% CI | 0.45 | 0.46 | 0.47 | 0.30 | 0.34 | 0.00 | 0.38 | 0.24 | 0.34 |
| 2010-2013 | FR Stable | SV Stable | FD Stable | BBS Stable | OT Stable | FR Loss | SV Gain | FD Gain | OT Gain |
| Accuracy measure | |||||||||
| PA [%] | 98.06 | 96.60 | 100.00 | 97.14 | 100.00 | 100.00 | 98.98 | 97.80 | 97.35 |
| UA [%] | 98.54 | 100.00 | 92.31 | 100.00 | 96.08 | 100.00 | 96.04 | 100.00 | 99.10 |
| Overall accuracy [%] | 98.21 | ||||||||
| Stratified estimators of area ± CI [% of total map area] | |||||||||
| Area [%] | 18.32 | 17.96 | 9.30 | 9.21 | 8.66 | 9.21 | 9.21 | 8.94 | 9.21 |
| 95% CI | 0.25 | 0.47 | 0.30 | 0.25 | 0.18 | 0.25 | 0.31 | 0.31 | 0.31 |
| 2013-2016 | FR Stable | SV Stable | FD Stable | BBS Stable | OT Stable | FR Loss | SV Gain | FD Gain | OT Gain |
| Accuracy measure | |||||||||
| PA [%] | 100.00 | 98.49 | 100.00 | 99.02 | 100.00 | 98.04 | 98.04 | 97.98 | 97.06 |
| UA [%] | 99.02 | 98.00 | 97.17 | 99.02 | 98.97 | 100.00 | 99.01 | 98.98 | 100.00 |
| Overall accuracy [%] | 98.83 | ||||||||
| Stratified estimators of area ± CI [% of total map area] | |||||||||
| Area [%] | 18.32 | 17.96 | 9.30 | 9.21 | 8.66 | 9.21 | 9.21 | 8.94 | 9.21 |
| 95% CI | 0.25 | 0.47 | 0.30 | 0.25 | 0.18 | 0.25 | 0.31 | 0.31 | 0.31 |
| 2016-2019 | FR Stable | SV Stable | FD Stable | BBS Stable | OT Stable | FR Loss | SV Gain | FD Gain | OT Gain |
| Accuracy measure | |||||||||
| PA [%] | 100.00 | 94.42 | 98.99 | 100.00 | 100.00 | 98.11 | 98.10 | 100.00 | 100.00 |
| UA [%] | 99.01 | 100.00 | 98.00 | 97.09 | 98.06 | 99.05 | 99.04 | 98.99 | 95.10 |
| Overall accuracy [%] | 98.48 | ||||||||
| Stratified estimators of area ± CI [% of total map area] | |||||||||
| Area [%] | 17.84 | 19.18 | 8.83 | 8.92 | 9.01 | 9.46 | 9.37 | 8.74 | 8.65 |
| 95% CI | 0.25 | 0.60 | 0.30 | 0.30 | 0.25 | 0.30 | 0.30 | 0.17 | 0.38 |
| 2019-2022 | FR Stable | SV Stable | FD Stable | BBS Stable | OT Stable | FR Loss | SV Gain | FD Gain | OT Gain |
| Accuracy measure | |||||||||
| PA [%] | 100.00 | 99.03 | 100.00 | 98.04 | 100.00 | 100.00 | 100.00 | 100.00 | 98.08 |
| UA [%] | 100.00 | 100.00 | 99.00 | 100.00 | 98.02 | 100.00 | 100.00 | 99.06 | 98.08 |
| Overall accuracy [%] | 99.47 | ||||||||
| Stratified estimators of area ± CI [% of total map area] | |||||||||
| Area [%] | 18.47 | 18.38 | 8.83 | 9.10 | 8.83 | 9.19 | 9.19 | 9.37 | 9.28 |
| 95% CI | 0.00 | 0.25 | 0.17 | 0.25 | 0.25 | 0.00 | 0.00 | 0.17 | 0.35 |
| Radiative power (%) | |||
| Low to very low | Moderate | Strong | |
| 2002 (n=7254) | 76 | 15 | 9 |
| 2004 (n=10824) | 74 | 17 | 9 |
| 2007 (n=10646) | 74 | 17 | 9 |
| 2010 (n=12207) | 72 | 18 | 10 |
| 2013 (n=11722) | 73 | 18 | 9 |
| 2016 (n=12152) | 76 | 16 | 8 |
| 2019 (n=12714) | 77 | 16 | 7 |
| 2022 (n=12373) | 75 | 17 | 8 |
| Land cover | Number of fires by land cover | |||||||
| 2002 | 2004 | 2007 | 2010 | 2013 | 2016 | 2019 | 2022 | |
| Forest | 4213 | 5726 | 5482 | 5217 | 4609 | 4350 | 3449 | 3091 |
| Savannah | 3001 | 5043 | 5081 | 6856 | 6917 | 7555 | 8874 | 8994 |
| Field | 15 | 19 | 32 | 32 | 55 | 106 | 107 | 182 |
| Total | 7229 | 10788 | 10595 | 12105 | 11581 | 12011 | 12430 | 12267 |
| Land cover | Area burnt by land cover (km2) | |||||||
| 2002 | 2004 | 2007 | 2010 | 2013 | 2016 | 2019 | 2022 | |
| Forest | 2196.59 | 4028.41 | 3621.72 | 3144.00 | 2866.46 | 2606.80 | 2199.42 | 1718.54 |
| Savannah | 1195.07 | 2117.75 | 2008.94 | 3377.28 | 1819.79 | 2234.82 | 2735.77 | 4352.35 |
| Field | 4.71 | 16.05 | 19.59 | 12.84 | 18.12 | 1819.79 | 30.51 | 113.03 |
| Total | 3396.37 | 6162.21 | 5650.25 | 6534.12 | 4704.37 | 6661.41 | 4965.7 | 6183.92 |
Disclaimer/Publisher’s Note: The statements, opinions and data contained in all publications are solely those of the individual author(s) and contributor(s) and not of MDPI and/or the editor(s). MDPI and/or the editor(s) disclaim responsibility for any injury to people or property resulting from any ideas, methods, instructions or products referred to in the content. |
© 2023 by the authors. Licensee MDPI, Basel, Switzerland. This article is an open access article distributed under the terms and conditions of the Creative Commons Attribution (CC BY) license (http://creativecommons.org/licenses/by/4.0/).


