1. Introduction
For many years, sheets made of difficult-to-deform alloys has been widely used in the aviation industry [
1,
2]. In addition to conventional methods, electromagnetic forming methods [
3] and those using flexible tools [
4,
5] are used. This is dictated by the need to produce many elements with different geometries in strictly limited quantities. Aircraft design involves the use of many components that must meet detailed standard requirements regarding dimensional accuracy and strength [
6]. The most common types of sheet metal that are formed by processes using elastomeric materials are aluminium [
7,
8] and aluminium alloys [
9]. However, difficult-to-deform materials such as high-strength steels [
10], titanium alloys [
11] or Ni-based superalloys [
12,
13] can be successfully formed. The use of this type of alloy to form processes with elastomeric materials causes many problems. The main limitation is the alloy’s inability to form at elevated temperatures owing to the limits of the elastomer's temperature resistance [
14,
15]. Moreover, obtaining drawpiece profiles with small edge rounding radii is also difficult owing to the springback phenomenon [
16,
17] and the limited formability of sheet metal [
18].
The dies for sheet metal forming (SMF) using flexible punches can be made of various materials such as steel, aluminium, wood or plastics. The die material is selected based on the designer's experience, the properties it is required to meet and economic factors. Dies made of aluminium are used most often in industry as tools for processes using elastomeric materials for stamping [
19]. This is due to a very good strength-to-weight ratio, which is very important because in most cases the dies are placed manually in the press working area. However, conventional steel dies are characterised by high wear resistance and mechanical strength. They are used to produce elements that are produced in mass production due to the high cost of making the tool [
20].
Elastomeric materials belong to the group of cross-linked amorphous polymers, which can deform by up to 600%. They also show good shape memory properties [
21,
22]. The basic materials included in the group of elastomers include natural rubber, synthetic rubbers, silicones and polyurethanes [
23,
24,
25]. The flexible material chosen most often for SMF tools is polyurethane. It is highly resistant to wear and is thermally stable. Furthermore, it is resistant to contact with chemicals. An important aspect is that polyurethane has viscoelastic properties [
26]. This causes it to behave like an incompressible liquid during SMF, and when parts are formed in a closed container, the elastomeric material exerts uniform pressure on the sheet metal. Although elastomeric materials are widely used in the SMF process, their usefulness in this process remains insufficiently researched [
27,
28,
29]. In many studies [
24,
30,
31], the aim of which was to analyse SMF processes using flexible punches, a significant advantage of polyurethane over other materials was proven.
The literature also contains publications related directly to the simulation of plastic forming processes in which elastomeric materials are used [
32,
33,
34,
35,
36,
37]. The authors of these publications focused on numerical modelling of rubber forming [
33,
36], the flanging process [
37] and stamping using a flexible punch [
32,
34,
35]. The results presented in these publications confirm the possibility of obtaining results very close to those determined experimentally. Some authors, however, focused on determining the properties of the process or drawpiece. Ramezani et al. [
23] presented results on the springback of sheet metal during forming with the use of flexible tools, while Ali et al. [
38] referred to the friction conditions occurring during the forming process. Elastomeric tools have found wide application in the rubber-pad process for forming microchannels [
39,
40], embossing [
41,
42], and patterning of thin metallic plates [
43].
In this work, the selection of Inconel-type nickel alloy sheets as materials intended for plastic forming tests using polyurethane punch was dictated by their high strength and slowness in cold forming with metallic tools, while Inconel alloys are used widely in the aviation industry to produce components mounted in aircraft engines. Giving the appropriate shape to products made of high-strength sheet metal means that the elastomeric material is operated on under high contact pressure, which is necessary to form components from these materials. Previous reports, in the form of both scientific publications and the written experiences of aviation company employees, conclude that there are no clearly defined guidelines regarding the type and properties of elastomeric materials used for SMF for difficult-to-form materials. This gap became the motivation to conduct the research presented in this article. The aim of the research was to determine the influence of the hardness and properties of polyurethane punch on the formability of Inconel 625 alloy sheets. Polyurethane inserts with a Shore A (ShA) hardness of 50, 60, 70, 80 and 90 were used for forming. A specially fabricated Cr123M steel die made it possible to assess the impact of the state of stress in the formed component on the quality of the drawpieces produced using the Guerin process [
28].
3. Results and Discussion
3.1. Mechanical Properties of Sheet Metals
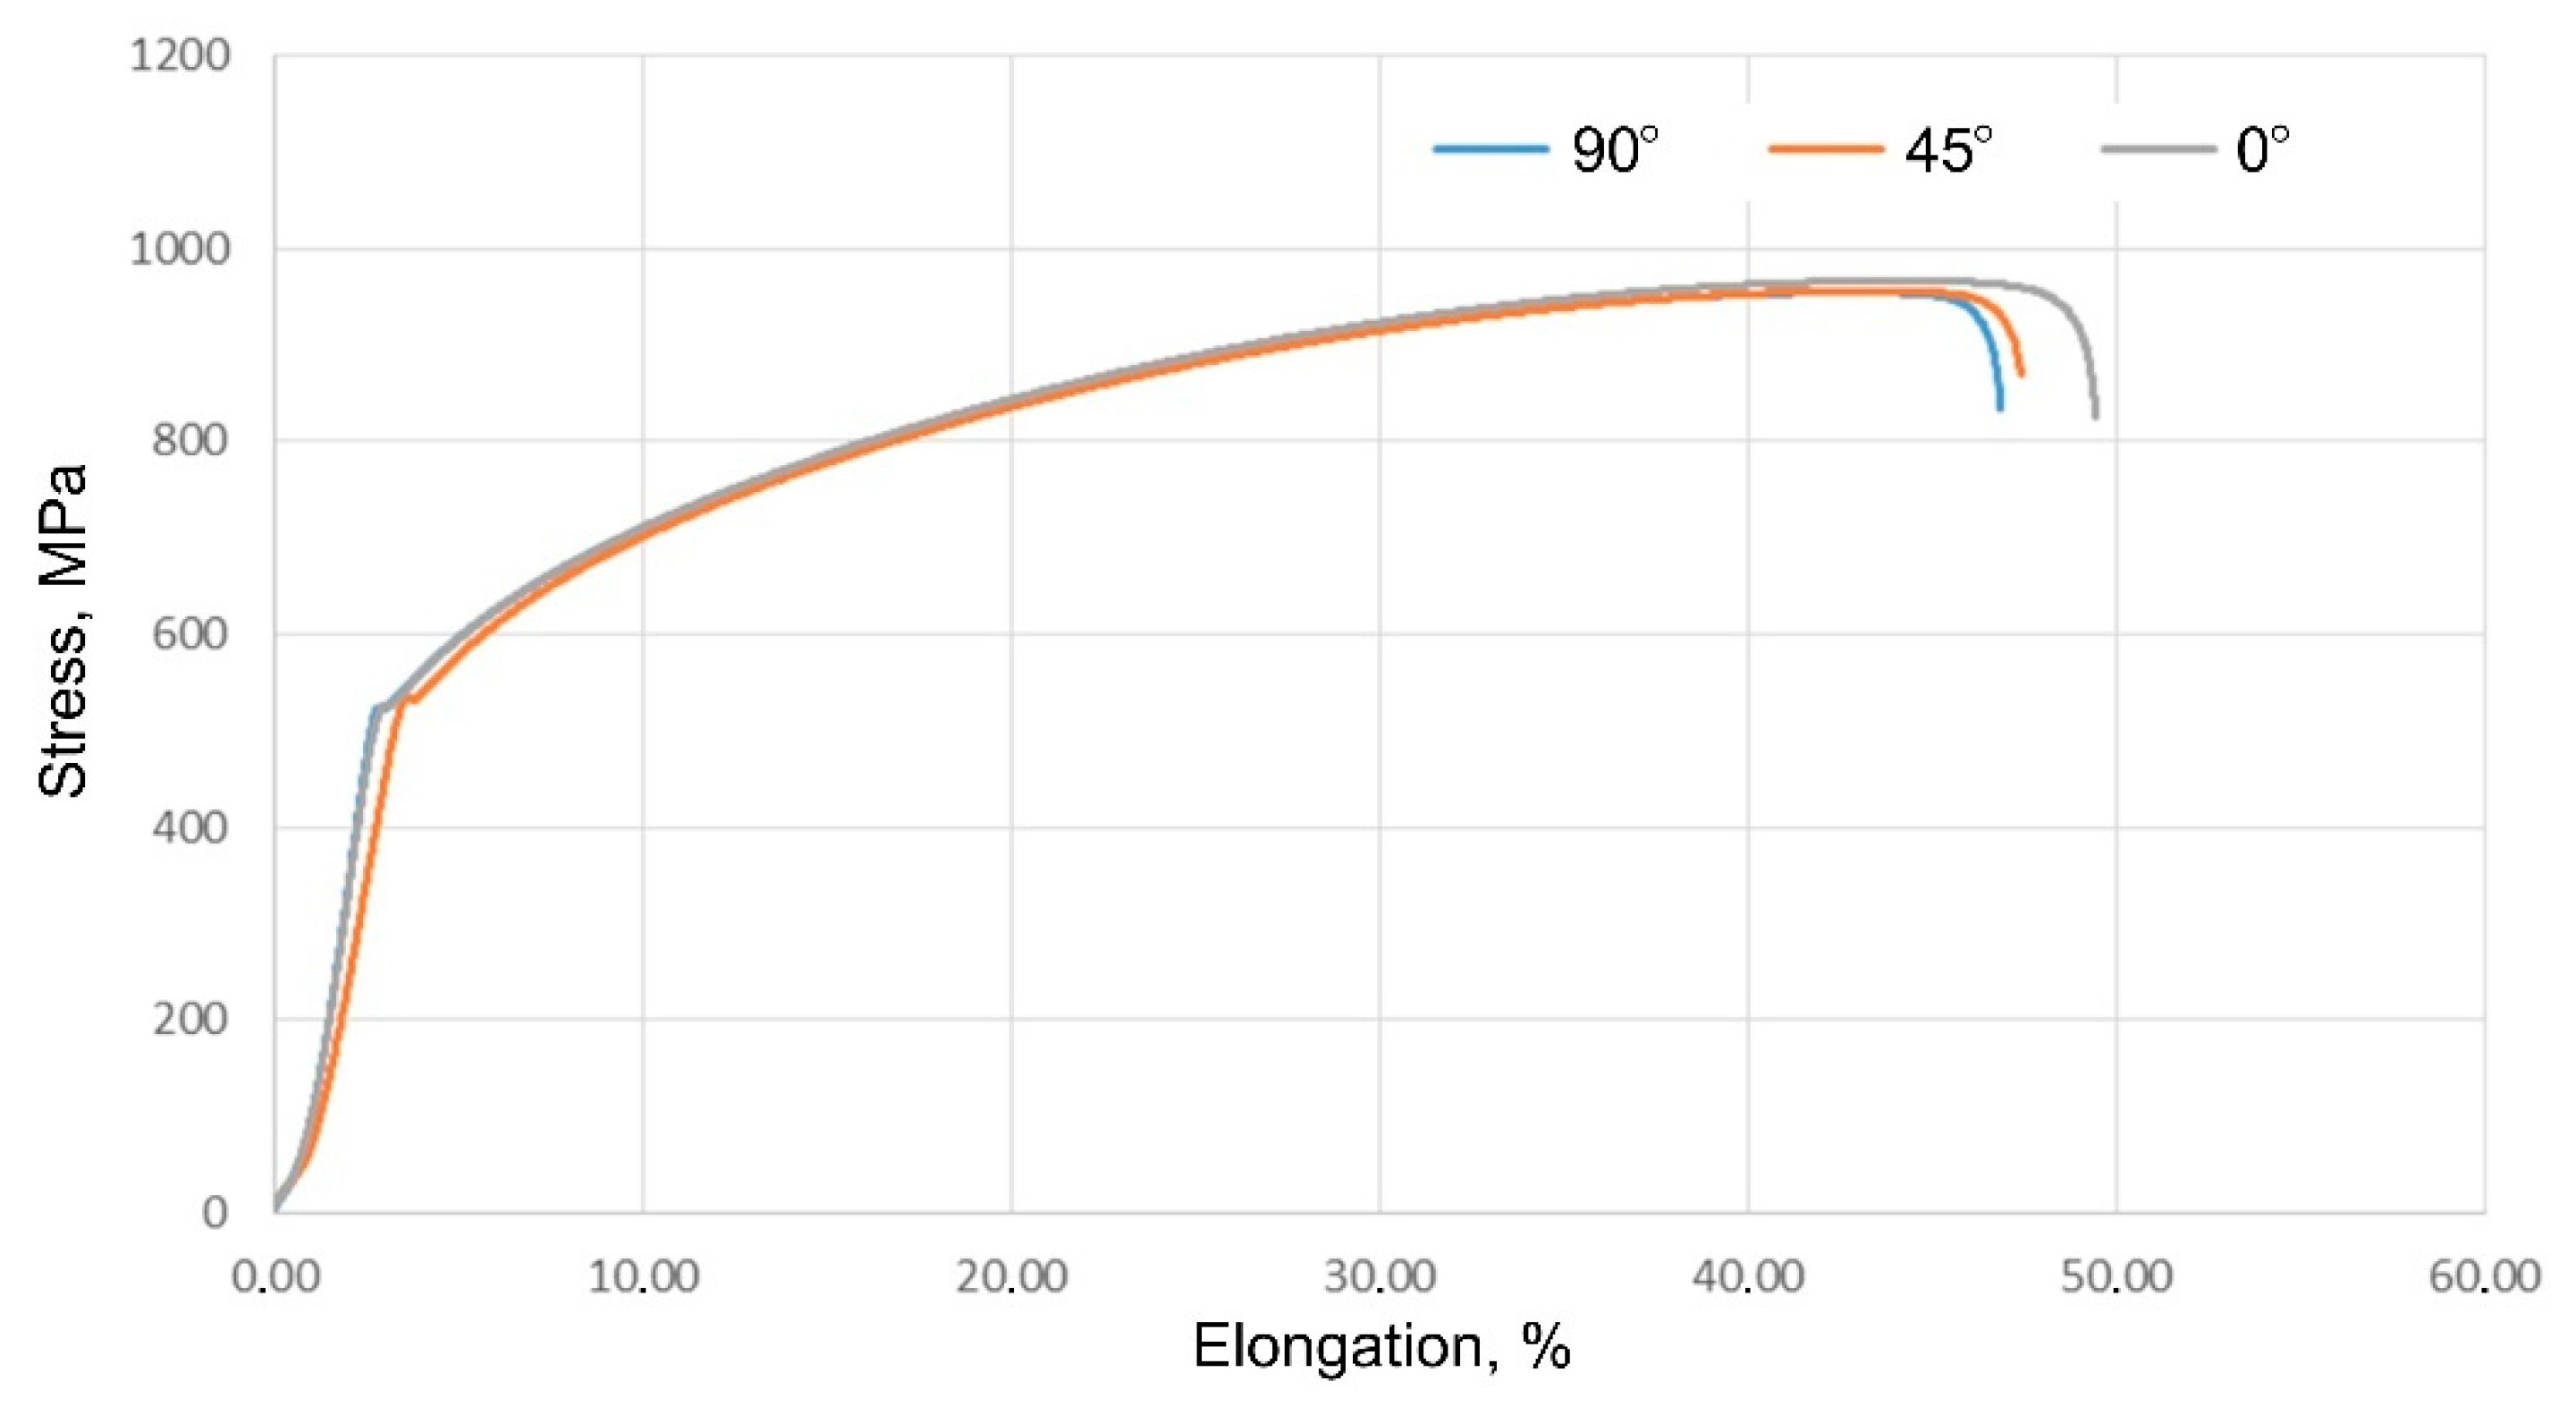
Figure 15 shows the tensile curves of Inconel 625 sheets.
The results include three data series, for samples cut at 0°, 45° and 90° angles to the rolling direction of the sheet. A summary of the results of the basic mechanical parameters and anisotropy coefficients is presented in
Table 3 and
Table 4, respectively.
The results were averaged from three replicates. Those obtained during the tensile test do not show significant differences depending on the orientation of the samples. The highest value of ultimate tensile strength (966.1 MPa) was obtained for a sample oriented parallel to the direction of sheet rolling. The difference in results depending on the direction of sampling is 11.7 MPa for tensile strength, 10.9 MPa for yield stress and 2.6% for elongation.
3.2. Mechanical Properties of Polyurethane Materials
The nominal hardness of the tested materials was verified by performing five measurements for each type of polyurethane used. The results of individual measurements and the average hardness are presented in
Table 5.
In the case of materials with nominal hardness of 50, 80 and 90 ShA, the results indicate slight differences depending on the measurement location, not exceeding 2 ShA, which means that the hardness of the polyurethane materials is uniform. The average value differs significantly for materials with a nominal hardness of 70 ShA and is close to a hardness of 60 ShA.
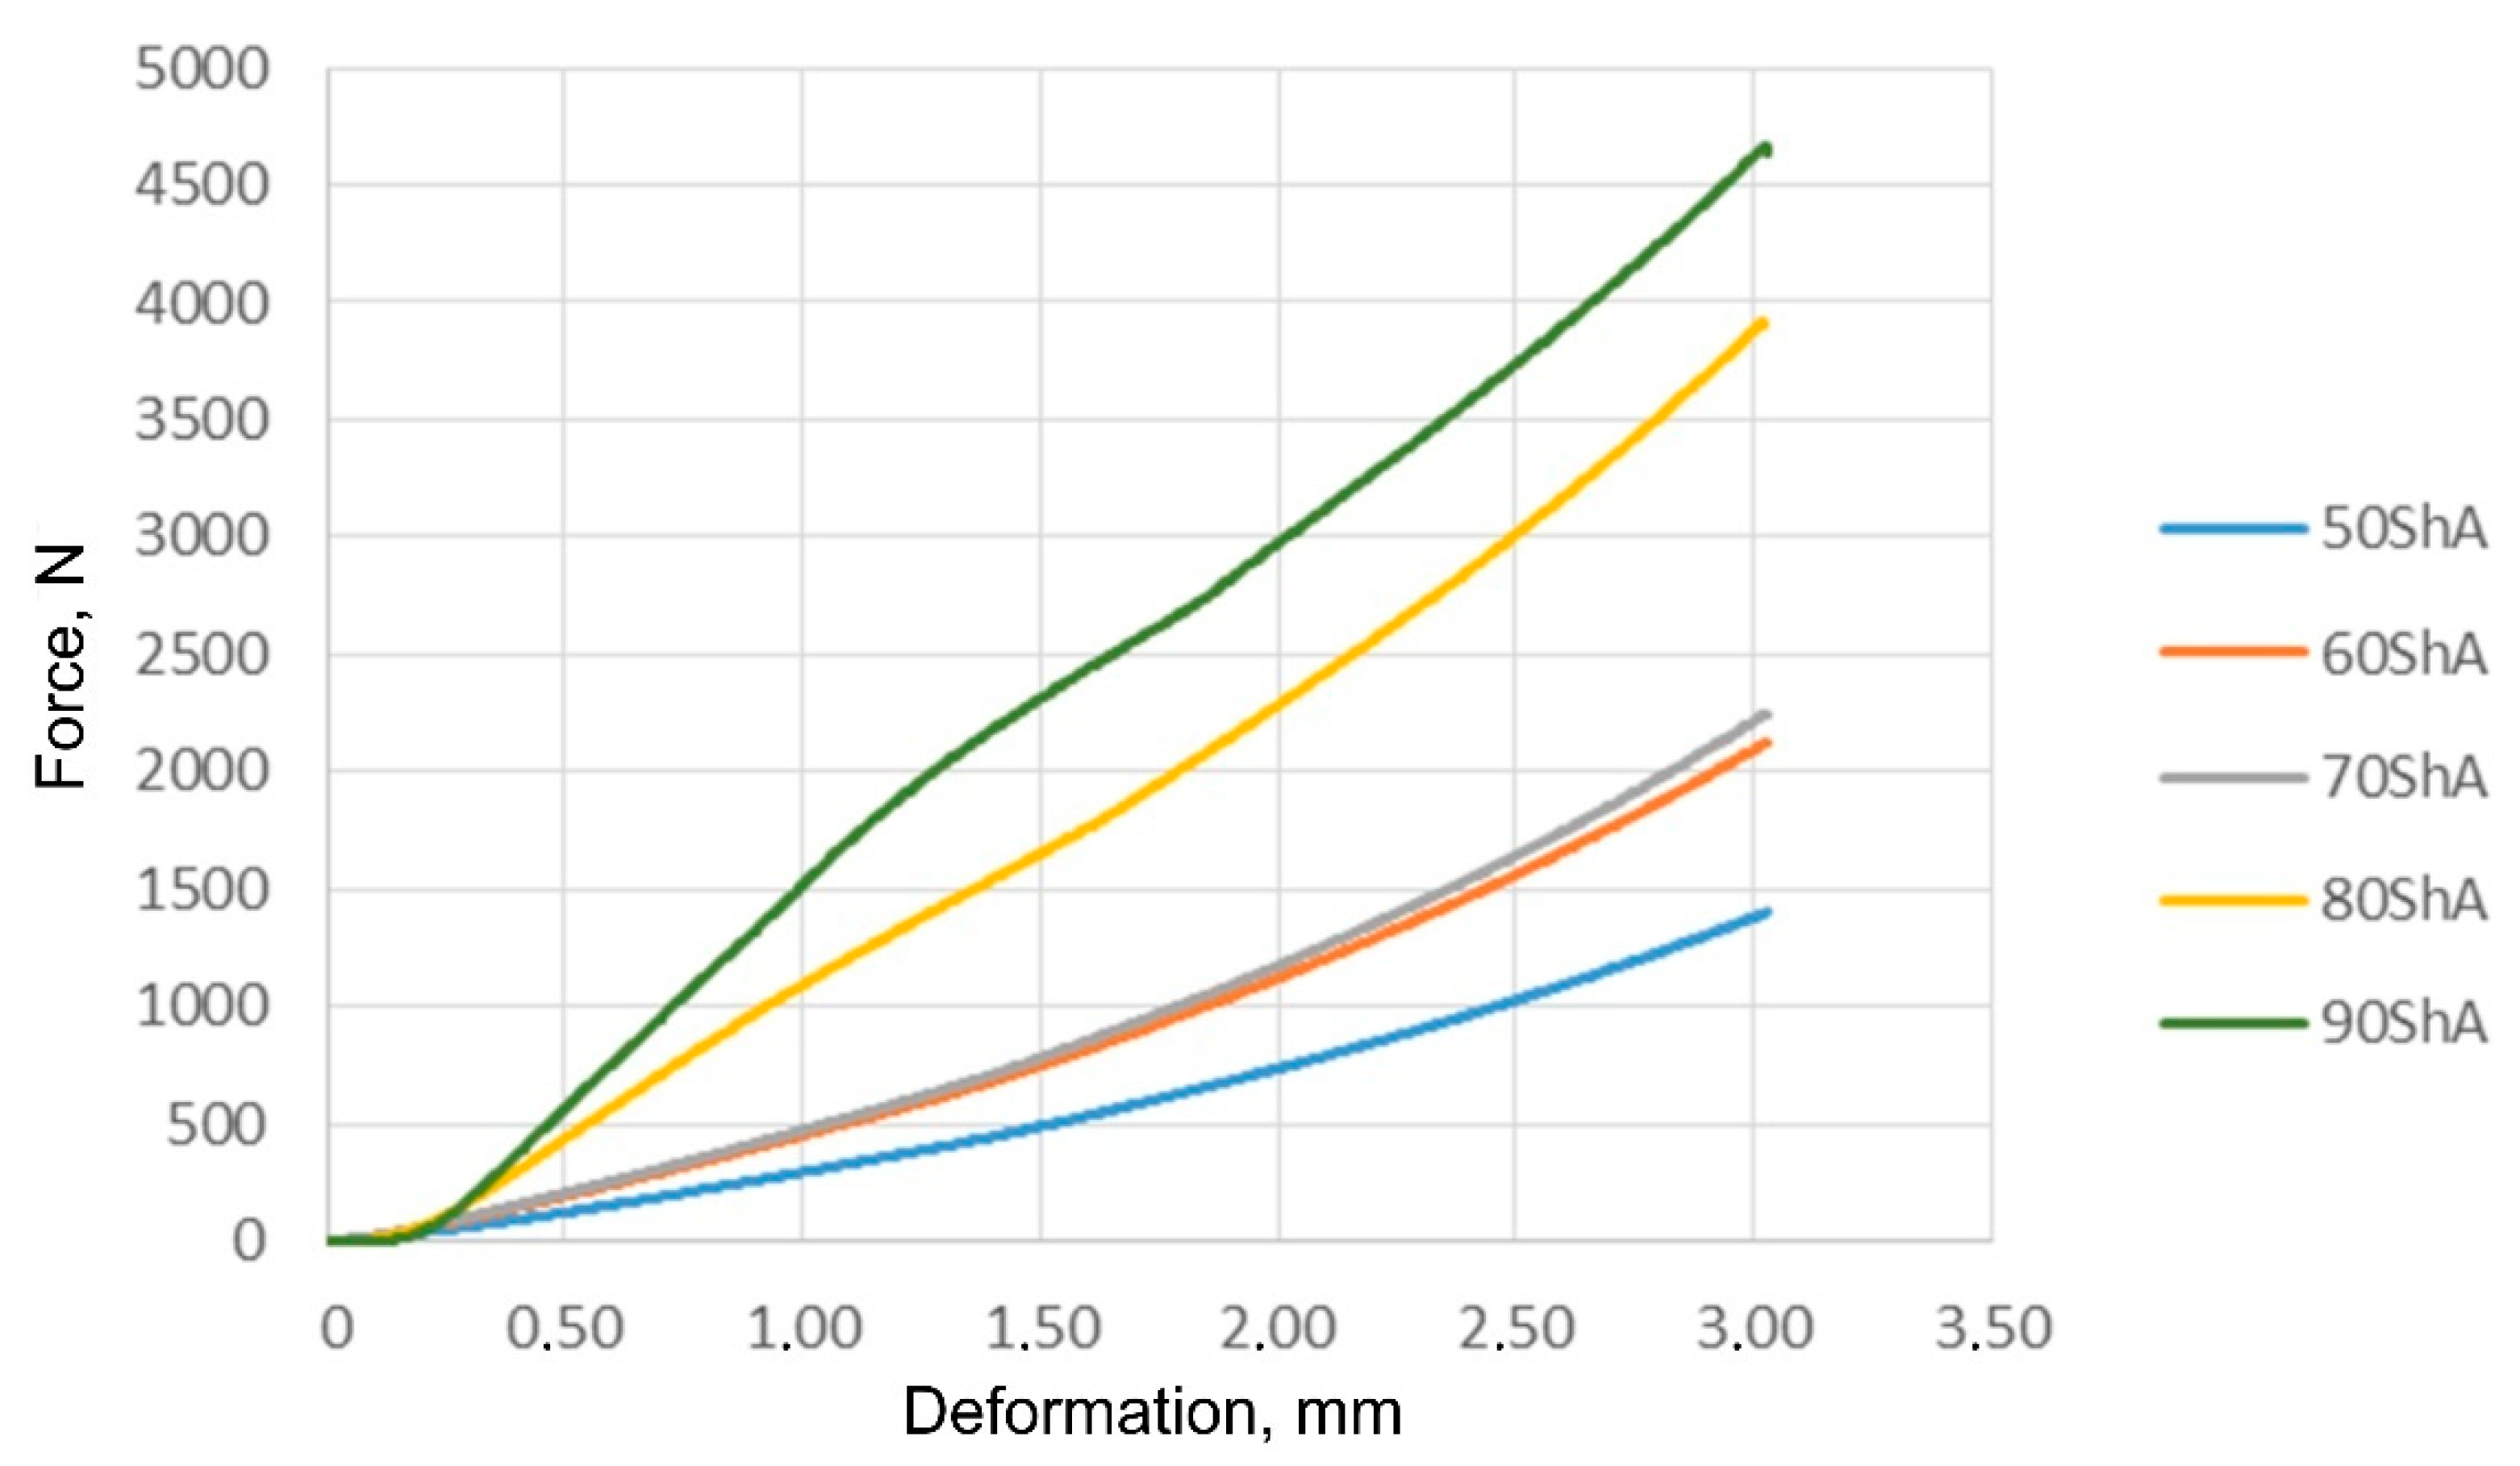
Figure 16 shows the results of compression measurements for all tested polyurethane materials.
These results were used to determine the material constants in the Mooney–Rivlin material model. The compression results show trends in increasing compressive strength with increasing hardness of the elastomeric material. For samples with a nominal hardness of 60 ShA and 70 ShA, there is a slight difference in the results obtained from the uniaxial compression test.
3.3. Wear Resistance
Forming sheets made of difficult-to-deform alloys using elastomeric materials of much lower hardness results in intensified wear [
23,
45]. Therefore, determining the quantitative wear of the friction pair is a key to establishing optimal conditions for the forming process.
Table 6 shows the wear results of polyurethane and Inconel 625 nickel alloy samples.
A common feature of the tested polyurethanes was the deformation of their surface in contact with the sample, resulting from the applied force FN = 50 N. The value of this deformation influenced the size of the tribological contact surface in the friction node. Polyurethanes, constituting a countersample, were an element of the friction node in which mass losses were observed. However, some samples made of nickel alloy were characterised by an increase in mass resulting from the transfer of the countersample material. For the tested polyurethanes, the COF ranges between 0.263 and 0.622. The polyurethane with a hardness of 90 ShA is characterised by the lowest average value of the COF. The obtained result of 0.263 is a quite high COF in relation to other polymer materials.
3.4. Results of Numerical Simulations of the Forming Process
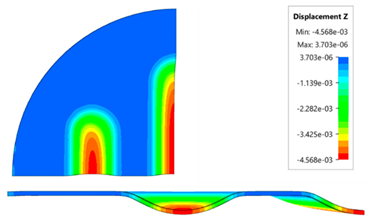
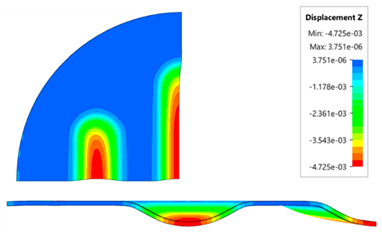
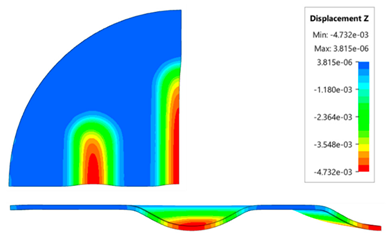
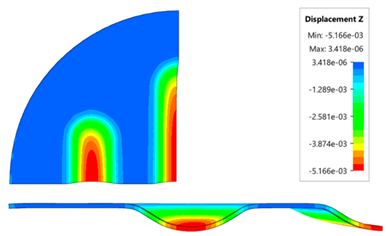
During the simulation, a forming force of 400 kN was applied to the surface of the polyurethane punch.
Figure 17 shows the deformation of the drawpiece in subsequent stages of simulation.
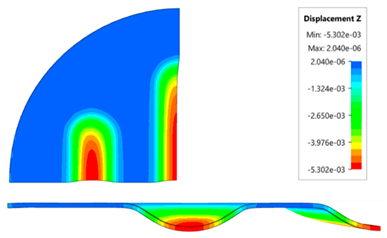
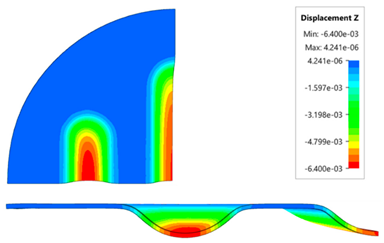
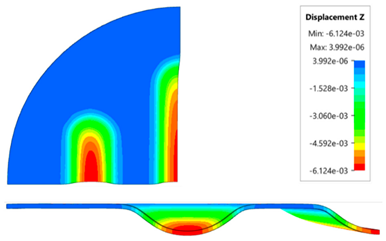
Table 7 presents the simulation results of all variants of polyurethane insert systems.
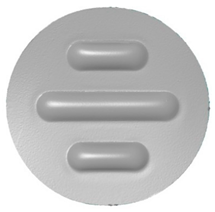
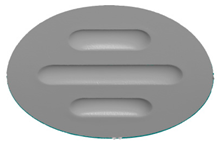
The results presented in this table are presented in the form of perpendicular and transverse views, which allows easier assessment of the obtained forming effects. A separate column contains the maximum measured depth of emboss, which was the main parameter analysed when comparing the tested configurations of polyurethane inserts. The forming depth was chosen as the most important result of numerical computations owing to the easily verified value obtained in numerical modelling, with the results determined during experimental tests. The highest values of sheet metal deformation in the emboss zone (6.124 and 6.4 mm) were obtained for hybrid configurations of the polyurethane inserts with varying hardness. It was found that polyurethane inserts of lower hardness in contact with the surface of the sheet being deformed provide greater degrees of sheet metal deformation in the embosses.
Figure 18 compares the maximum depth of emboss for individual polyurethane hardness variants.
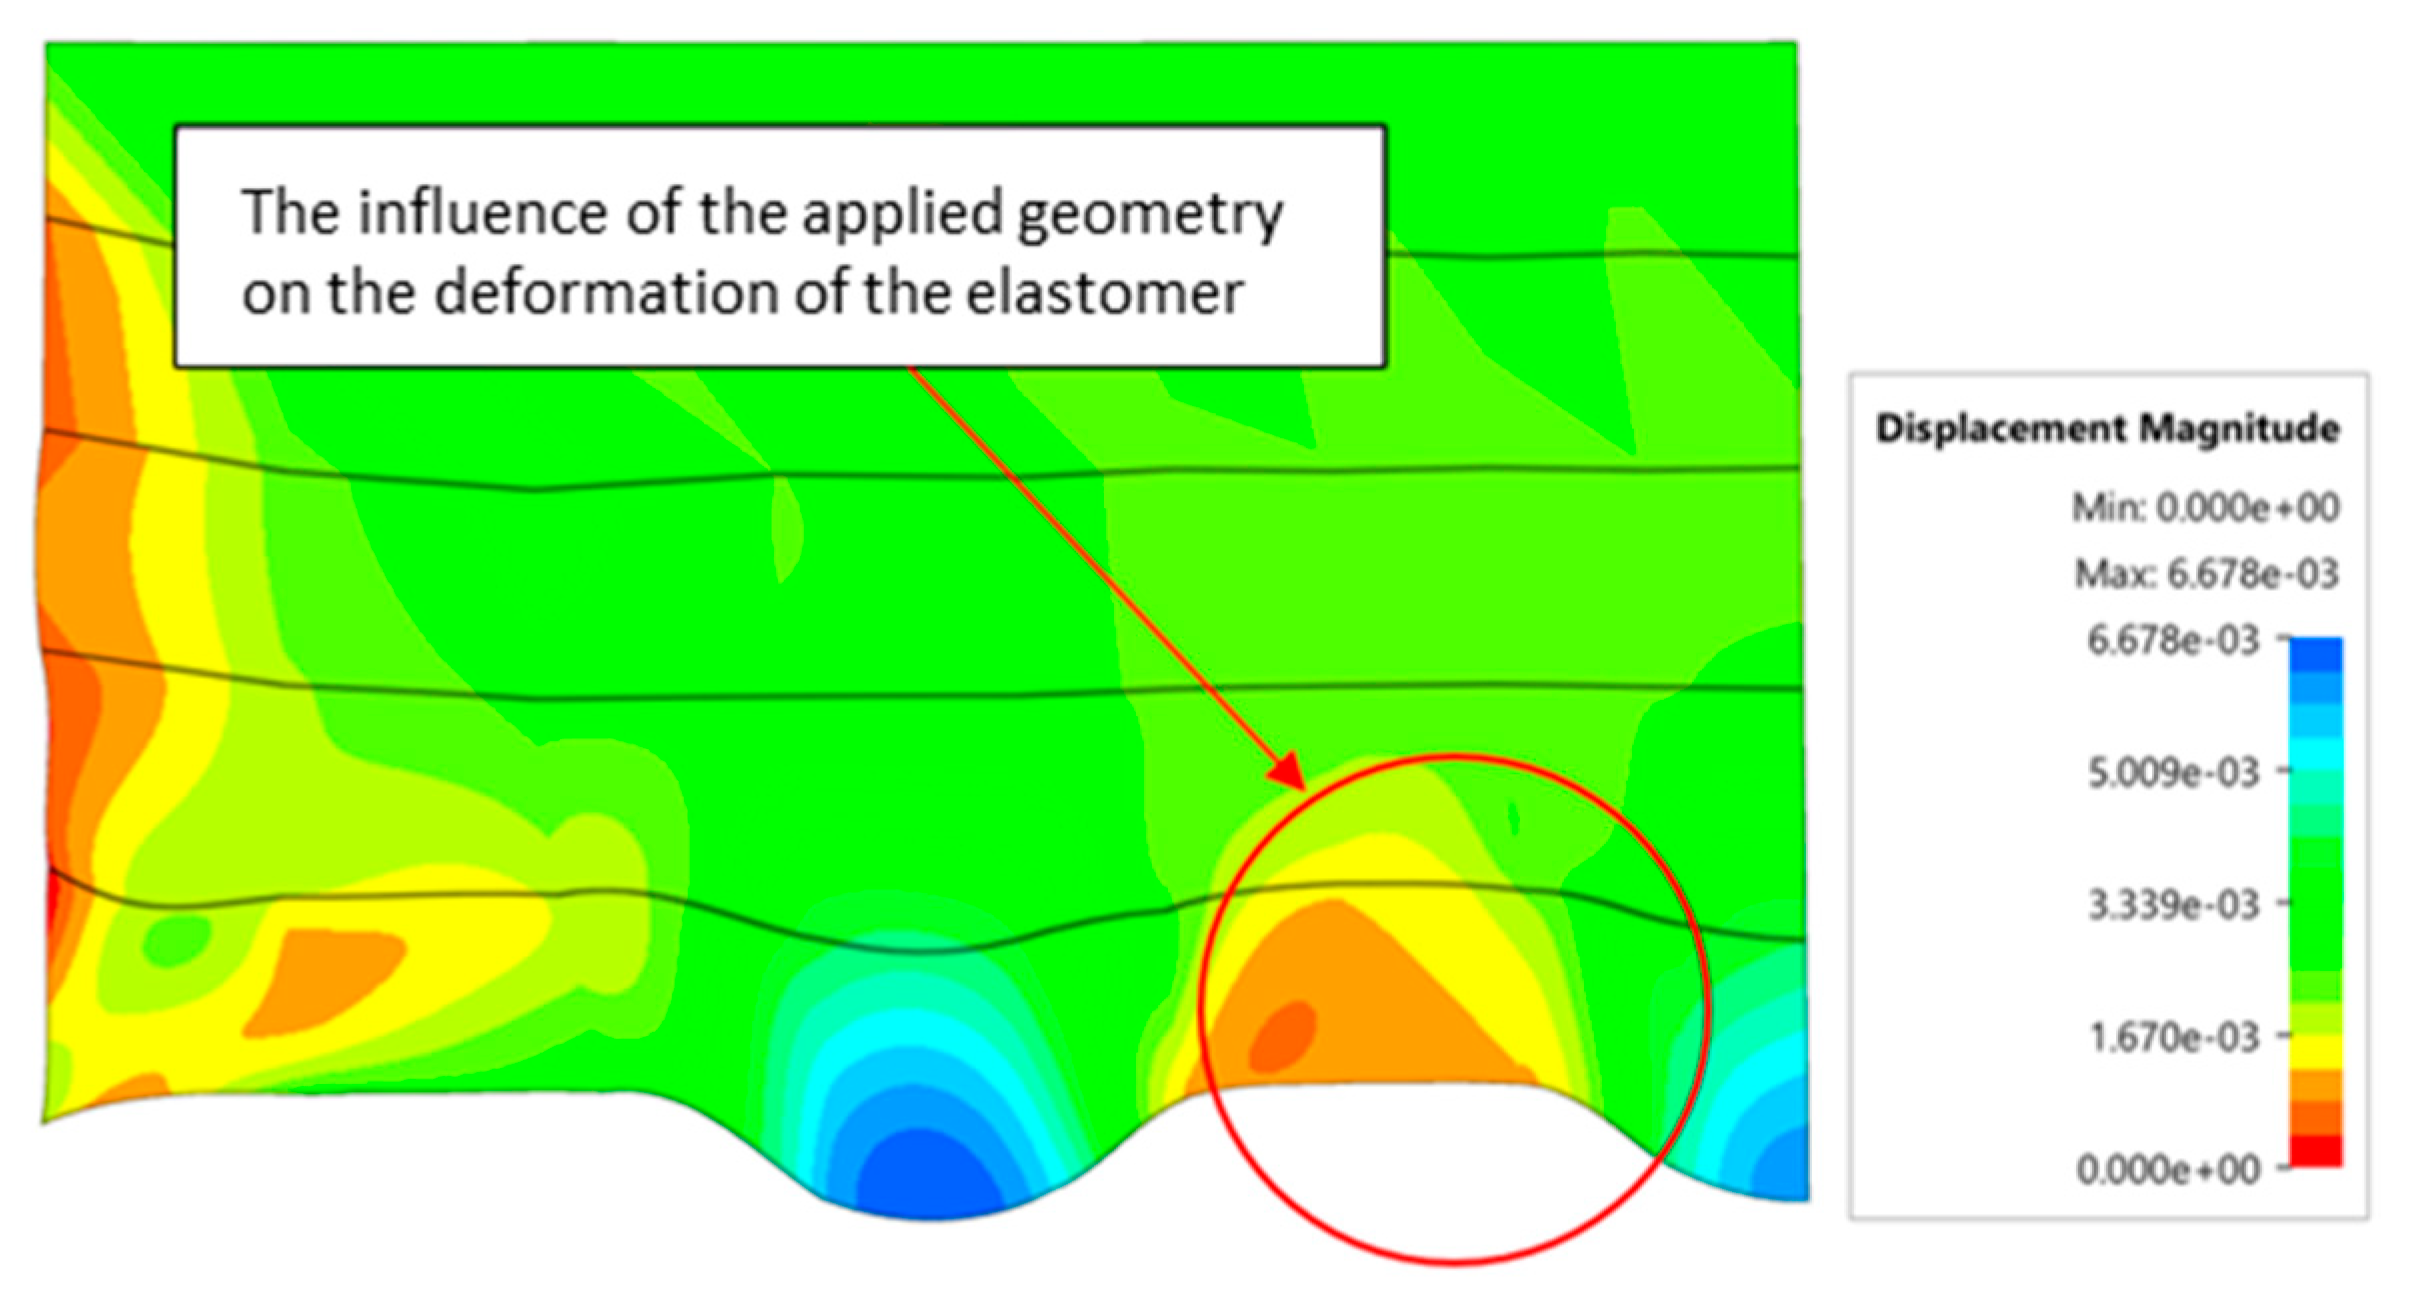
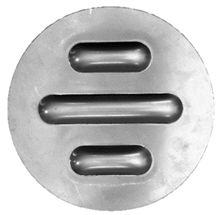
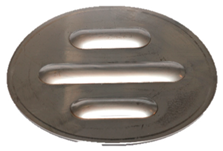
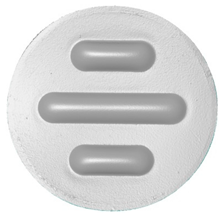
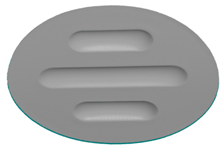
The shape of the die was developed to compare the sheet metal forming process using a geometry in which the formed element has three separate areas, formed at the same time. The distance between the embosses was selected so that the deformation of the elastomeric material occurred at several independent areas, close to each other. This arrangement was intended to determine the influence of individual embosses on the overall deformation of the elastomeric material. In tests using 5-layer inserts with the same hardness, an increase in the hardness of a polyurethane insert ensures a greater degree of material deformation in the embosses (
Figure 18). The results presented in
Figure 19 show the influence of the die geometry on the deformation of the elastomeric material.
The deepest embosses were achieved for configurations containing layered polyurethane inserts with a hardness of 2 × 50 ShA + 3 × 90 ShA. The values obtained using these configurations were 6.4 mm for the combination of two layers with a hardness of 50 ShA placed directly above the surface of the workpiece and three layers with a hardness of 90 ShA placed above inserts with a hardness of 50 ShA. For the variant with a changed arrangement of inserts, a value of 6.124 mm was obtained (
Table 7). The least favourable result, which was 4.568 mm, was obtained for the polyurethane tool, which comprised five inserts with a hardness of 50 ShA. The difference between the result obtained for the best and worst combination is 1.832 mm. The use of a configuration of 2 × 50 ShA + 3 × 90 ShA allows for a 40.1% greater stamping depth than the combination containing five inserts with a hardness of 50 ShA.
Numerical simulations were also performed for the forming force, which had been increased to 1,000 kN. Despite such high force, no significant differences were observed to depend on the hardness of the polyurethane inserts.
Figure 20 presents a summary of sheet metal deformations during forming with polyurethane inserts with a hardness of between 50 and 90 ShA at a pressure of 1,000 kN.
Owing to the lack of clear differences in the simulation results with a forming force of 1,000 kN, it was decided to use the results obtained with a forming force of 400 kN for experimental verification. For inserts of the same hardness, the smallest depth of emboss was obtained for inserts with a hardness of 50 ShA (
Figure 18). However, for inserts comprising layers with varying hardness, the greatest depth of emboss was provided by inserts with the configuration 2 × 50 ShA + 3 × 90 ShA (
Figure 18).
3.5. Results of Experimental Tests of the Forming Process
Table 8 presents a summary of the results obtained by forming drawpieces on a hydraulic press with a pressure of 1,000 kN, depending on the arrangement and hardness of the polyurethane inserts.
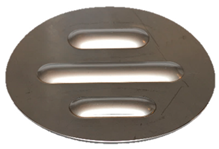
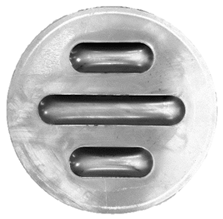
This table includes photos of the samples, a 3D scan view and the measured maximum forming depth for each variant. The difference in forming depth for the analysed configuration variants of polyurethane inserts was 0.14 mm. For the variant containing five inserts with a hardness of 50 ShA, the maximum forming depth was 5.81 mm, and for the configuration 2 × 50 ShA and 3 × 90 ShA, it was equal to 5.95 mm (
Table 8).
In the case of the results presented in
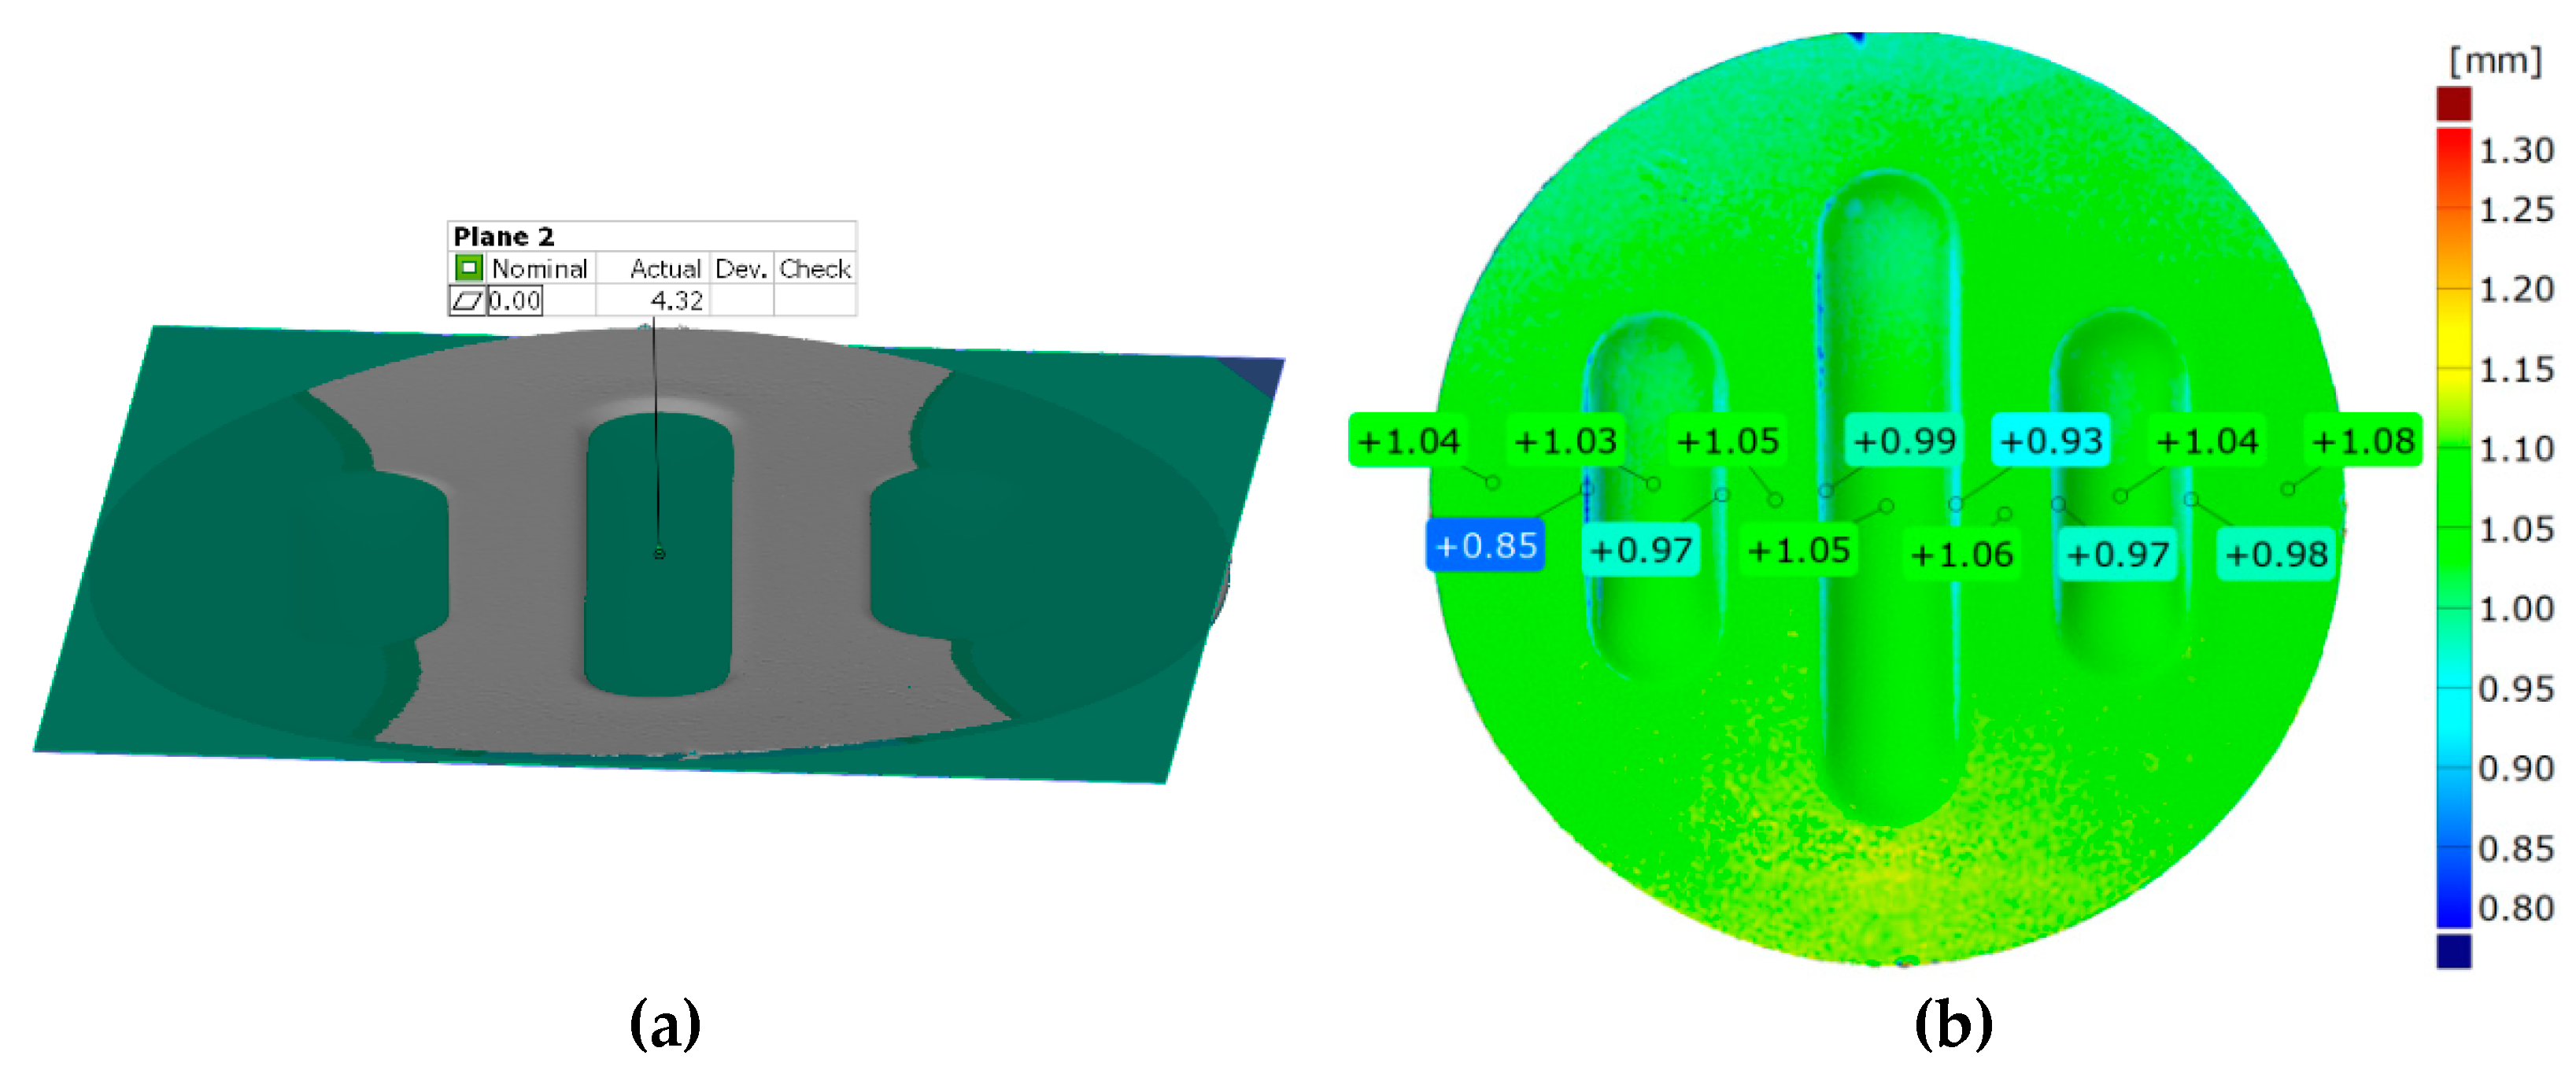
Figure 21, a configuration containing five inserts with a hardness of 50 ShA was used, which in numerical analyses showed the worst ability to form an element made of the Inconel 625 alloy.
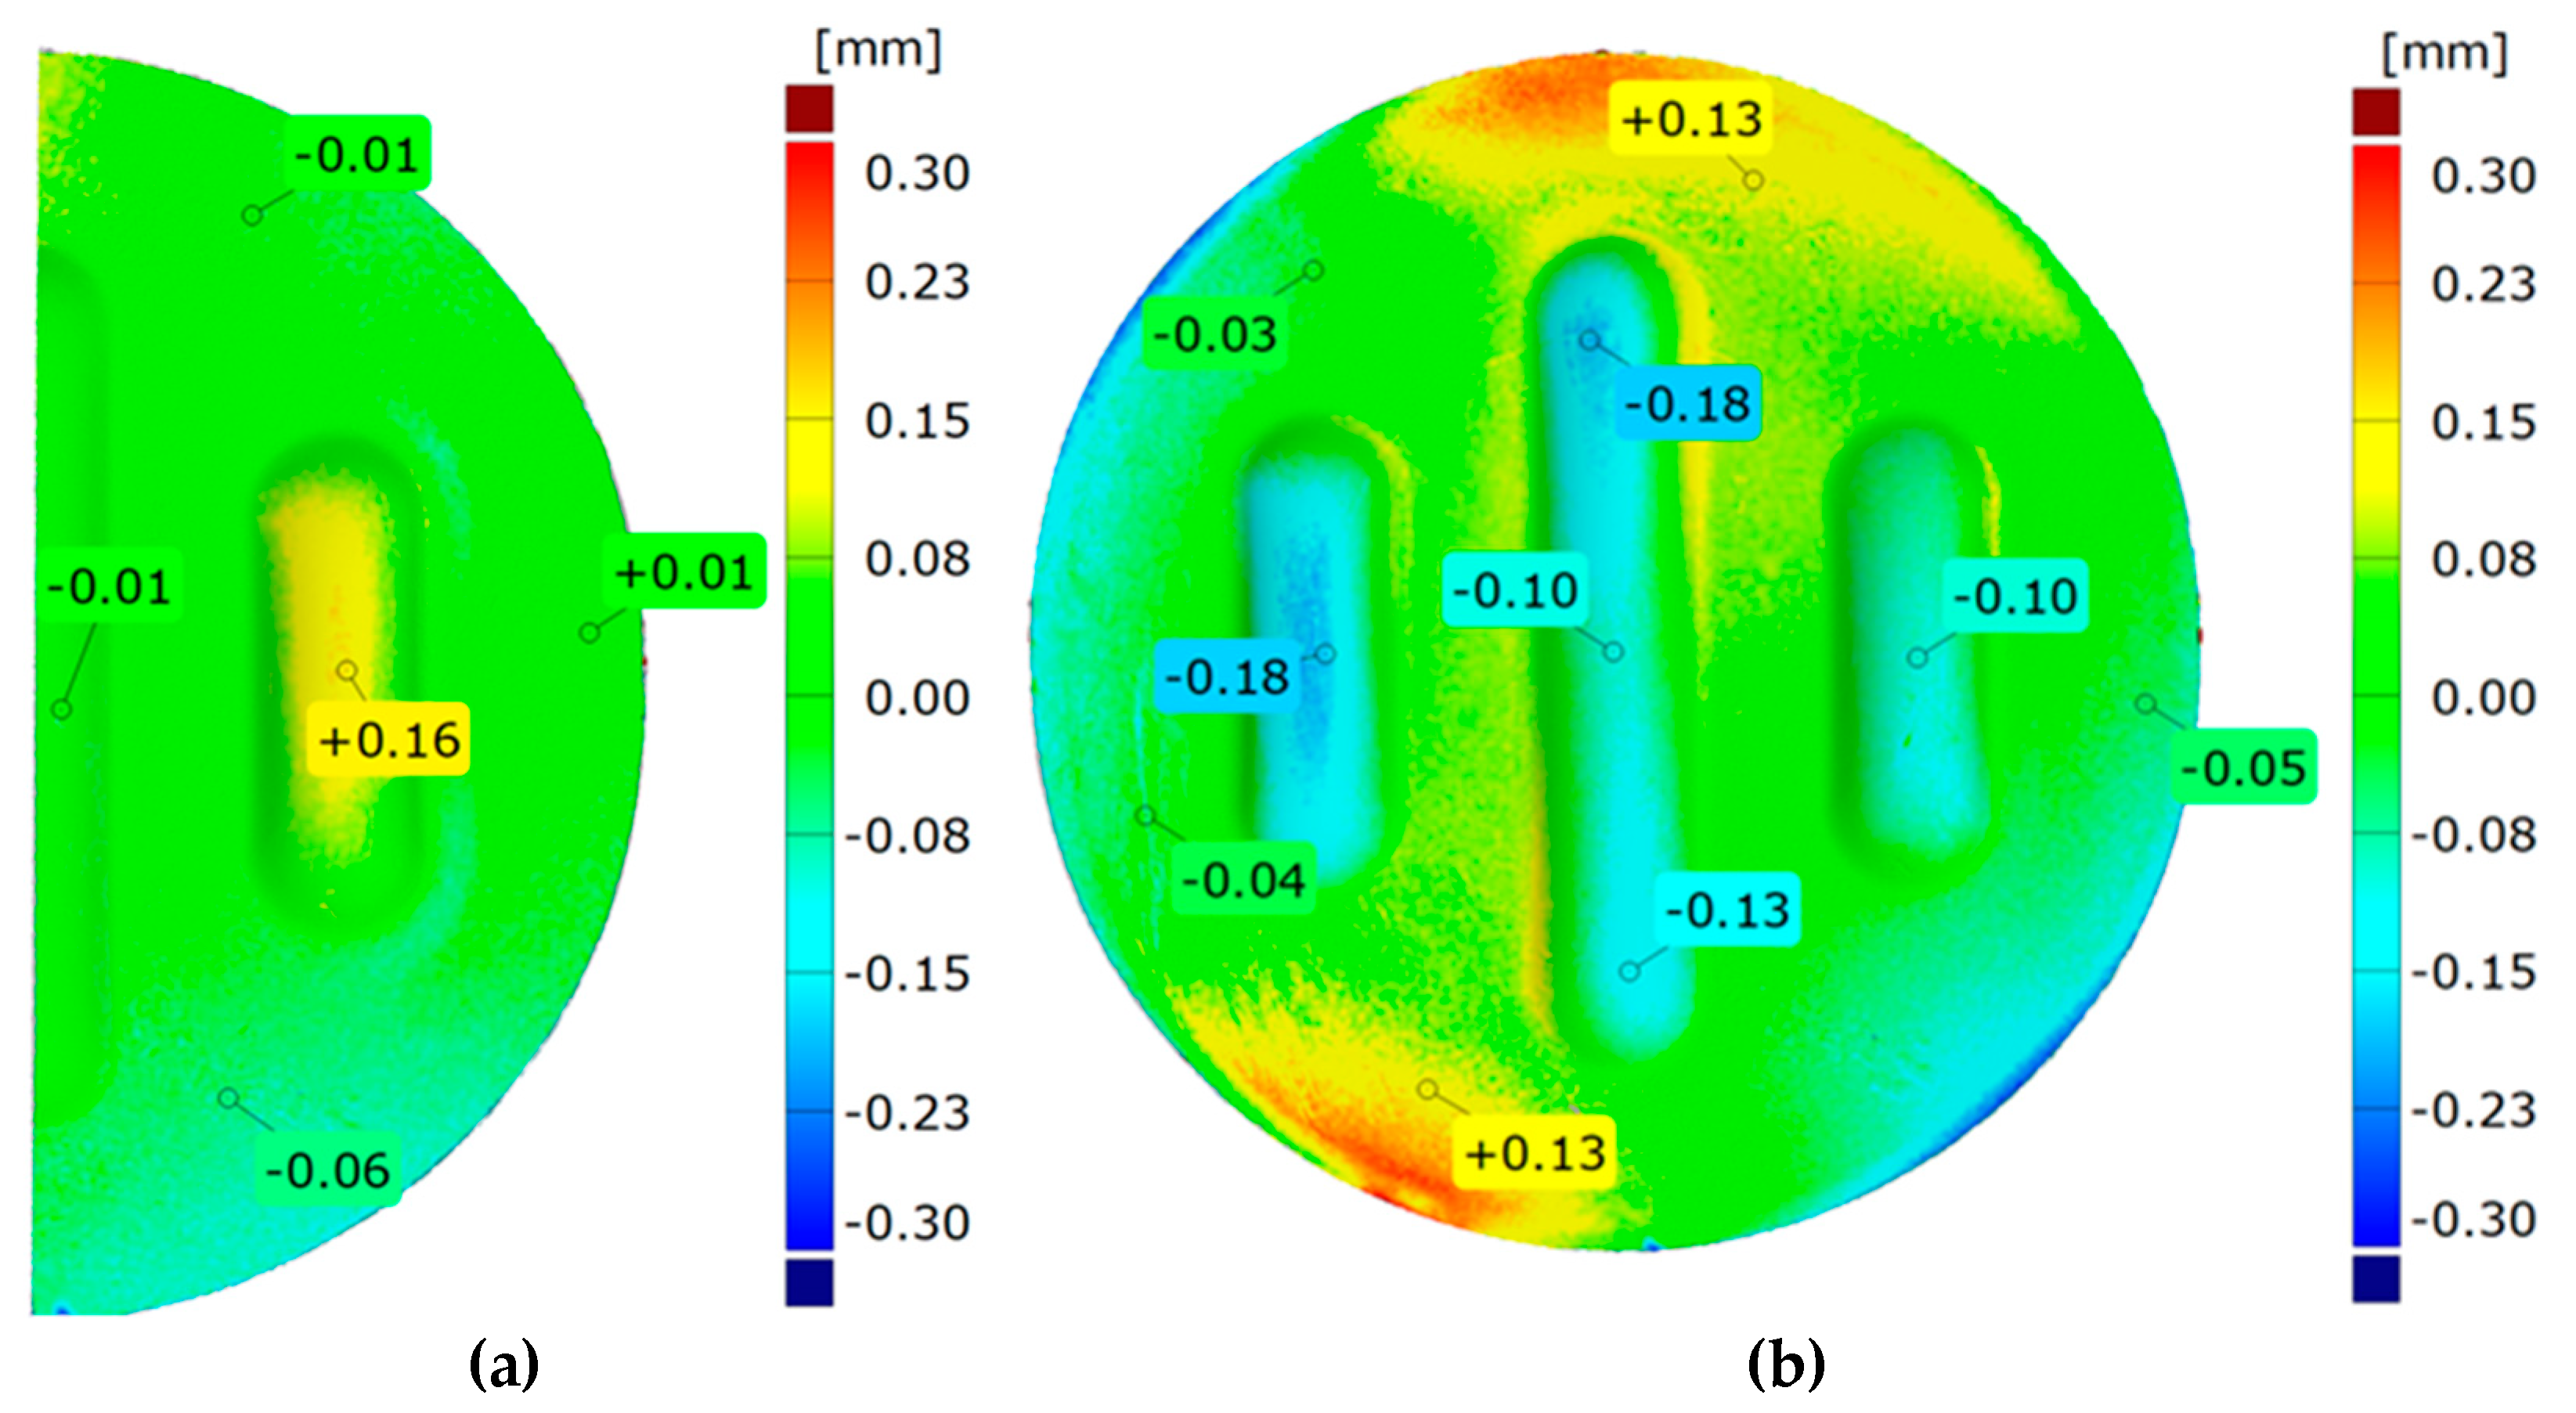
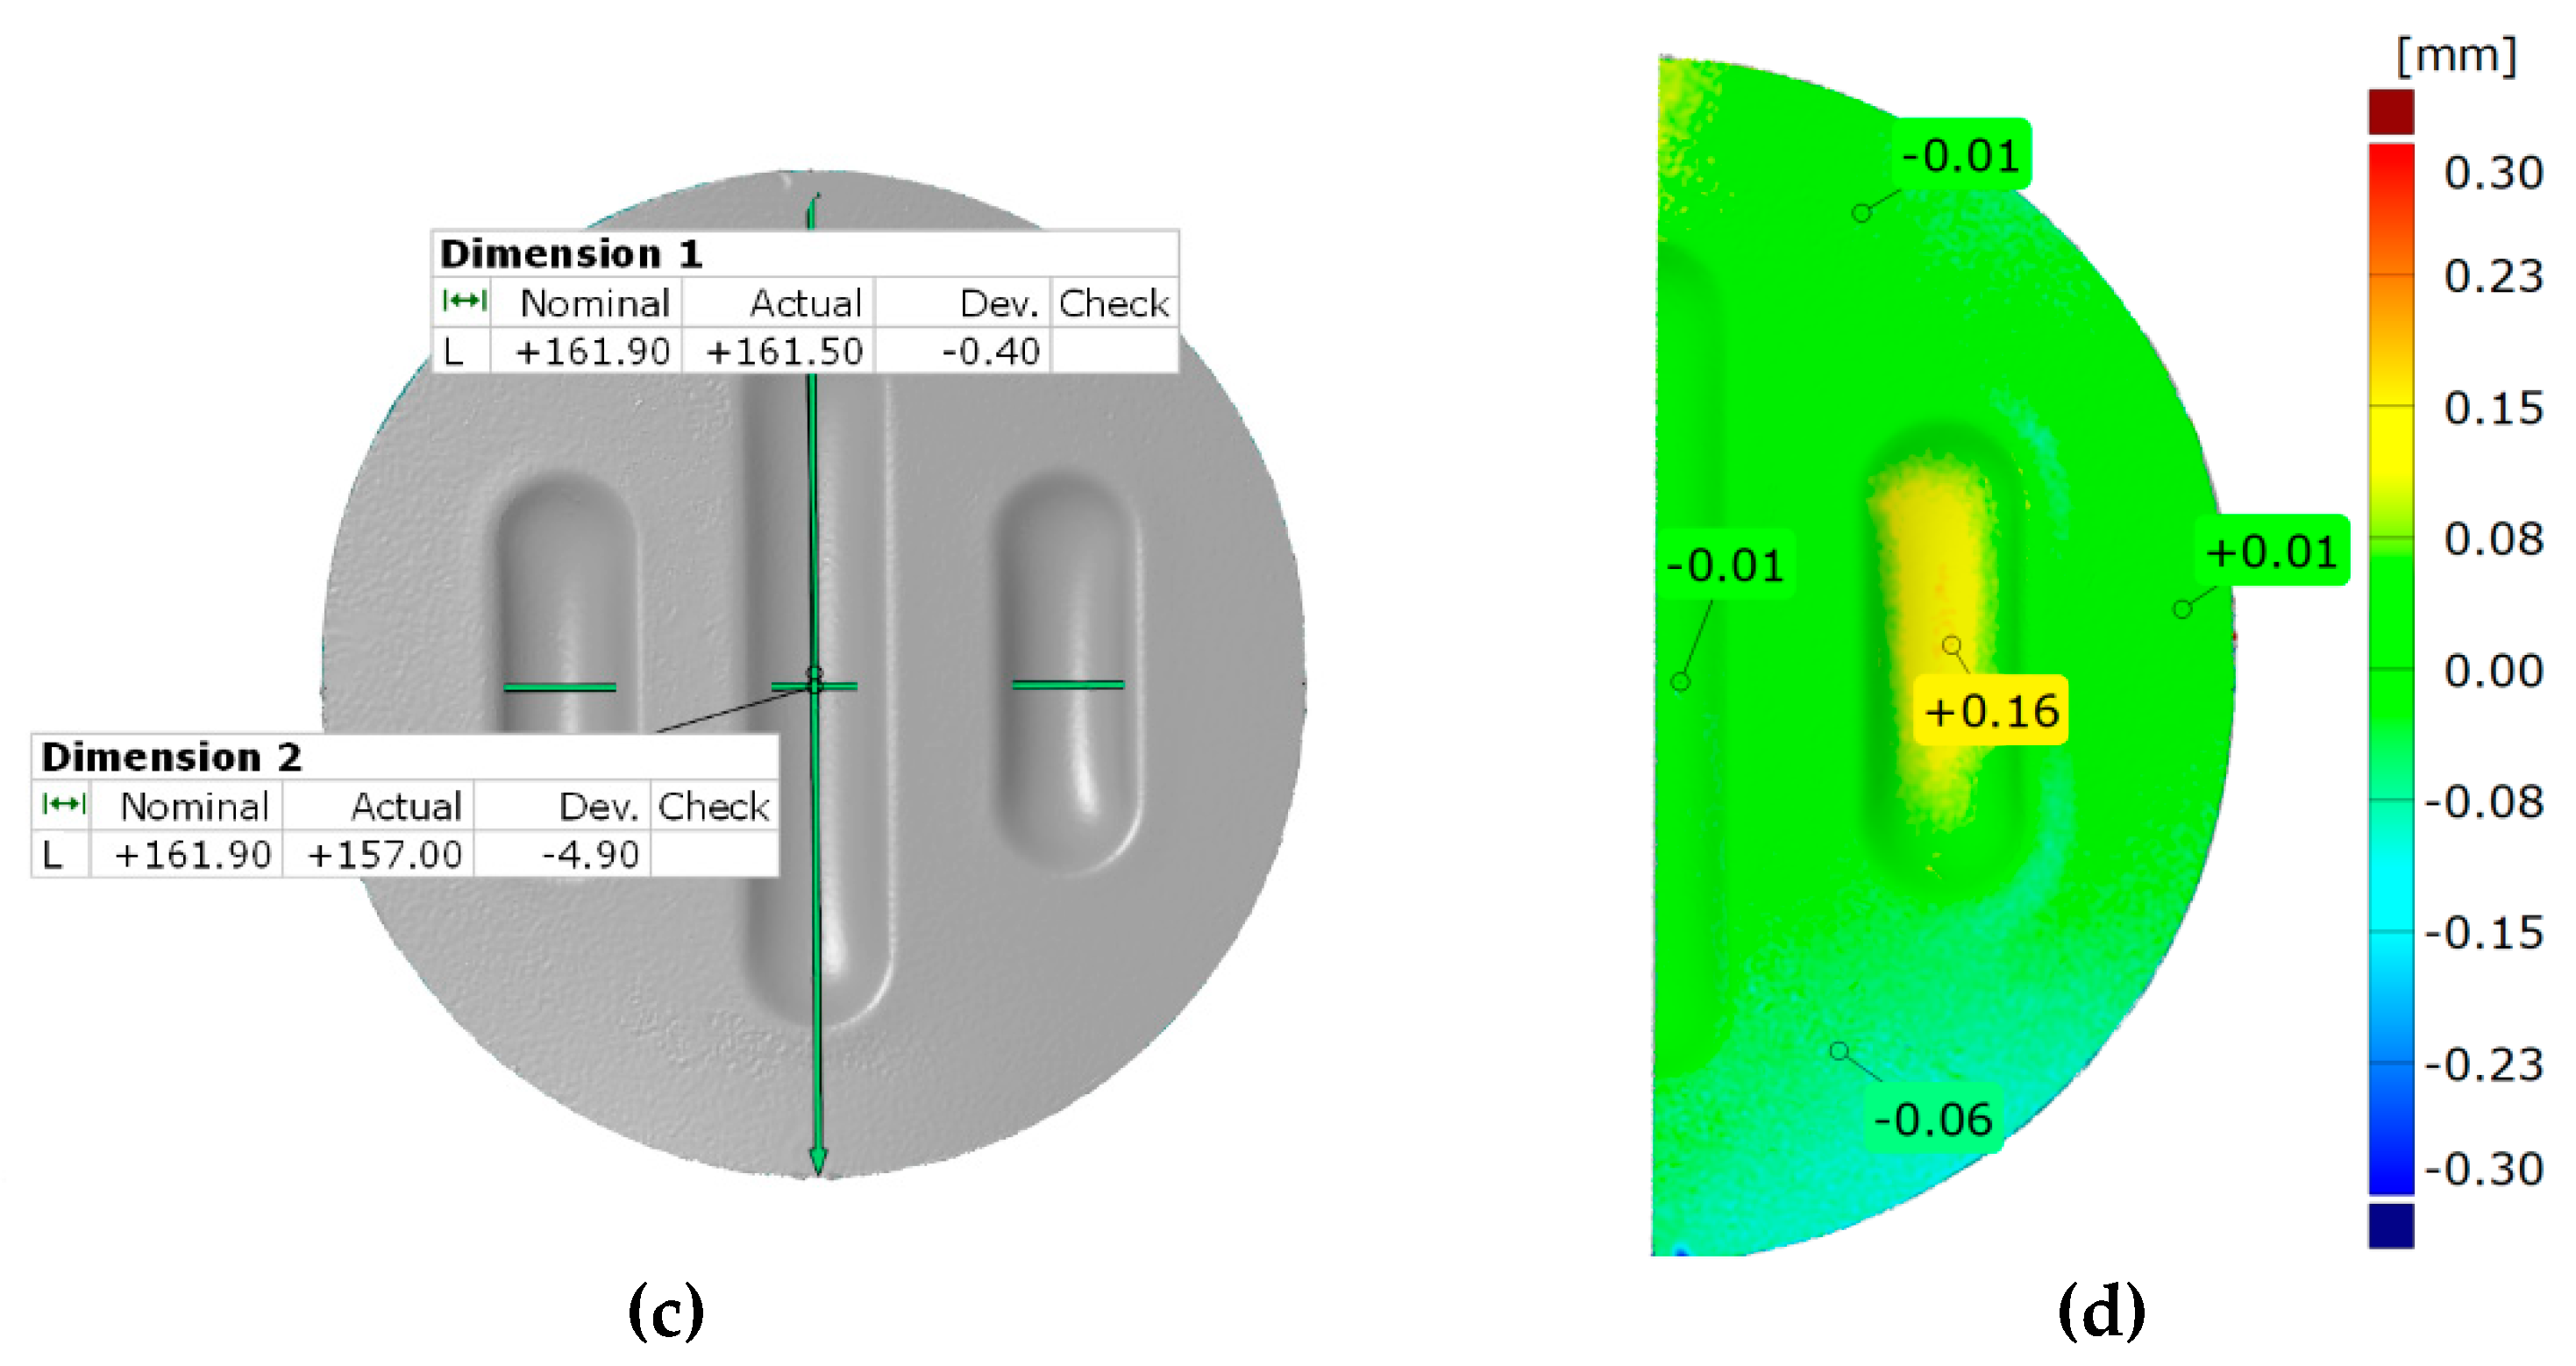
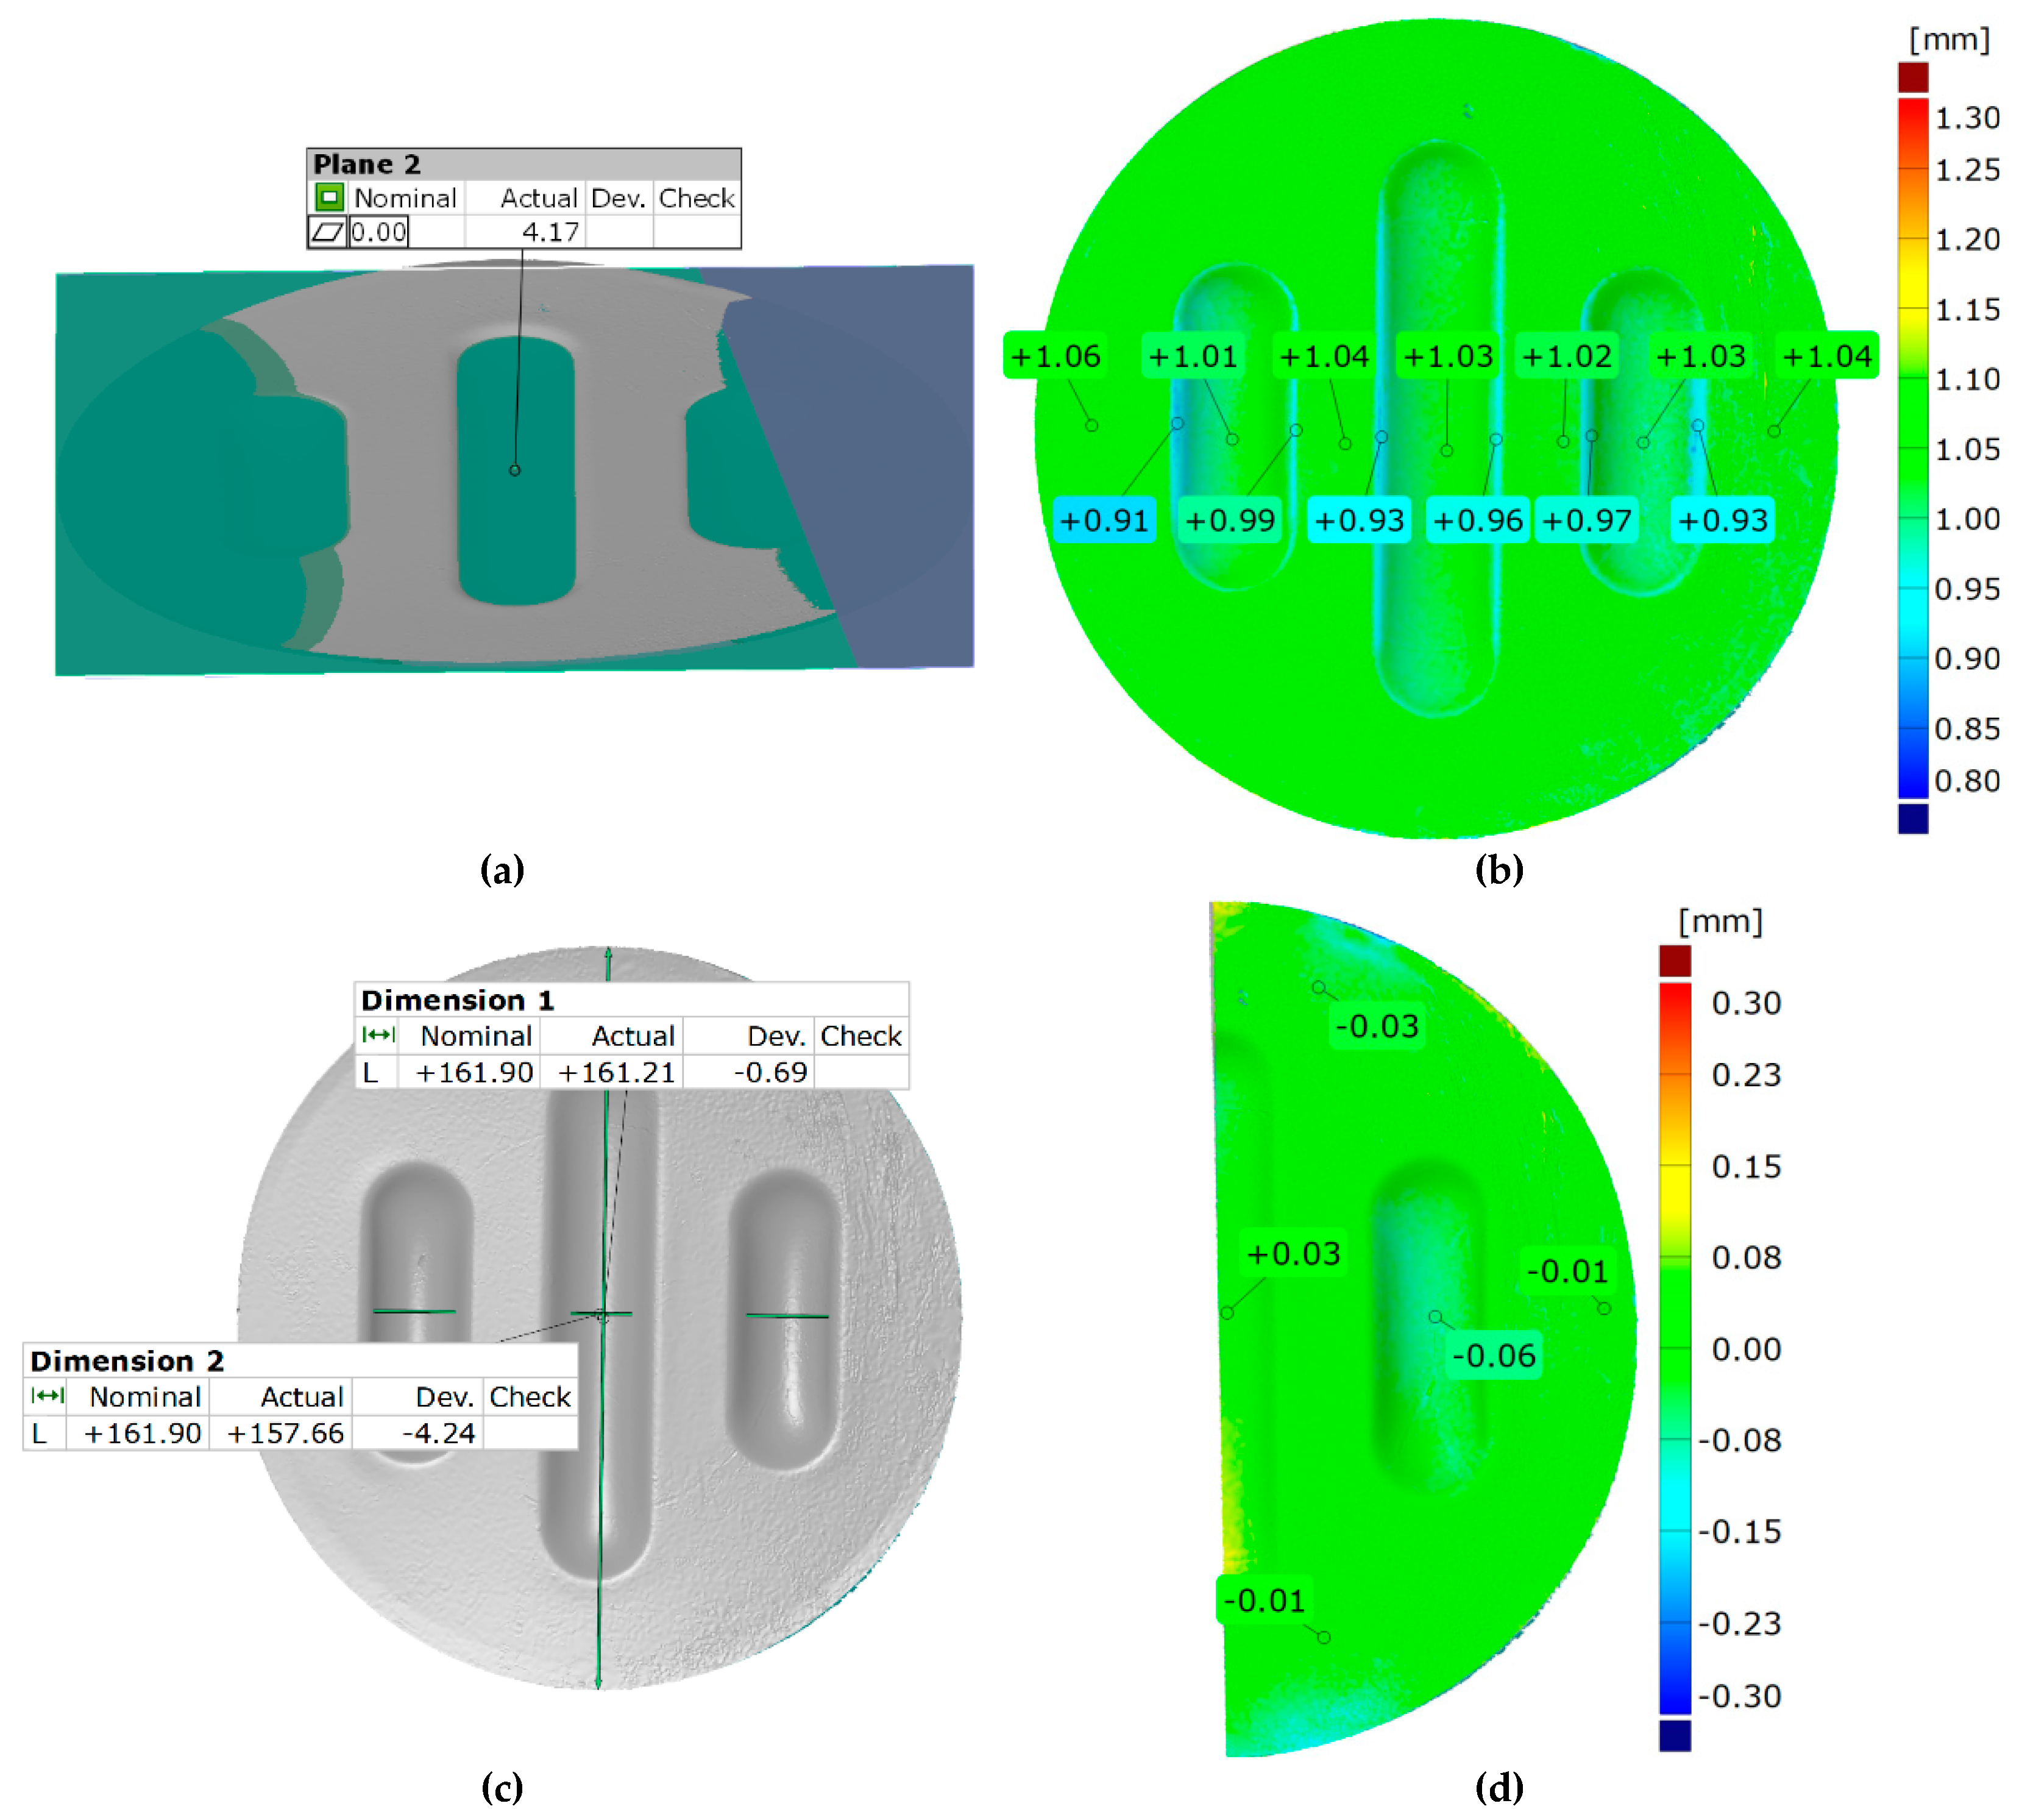
Figure 22 shows the results for the same forming conditions, but using a configuration containing two inserts with a hardness of 50 ShA and three inserts with a hardness of 90 ShA. In numerical calculations this variant showed the best ability to form an element. In the case of surface flatness, there was a difference of 0.15 mm for both variants considered. For the 5 × 50 ShA variant, the surface flatness was 4.32 mm, and for the 2 × 50 ShA + 3 × 90 ShA configuration, it was 4.17 mm. In the case of the five inserts with hardness of 50 ShA, there is a uniform thickness distribution.
The difference between the maximum and minimum value is 0.2 mm, which gives a maximum wall thinning of 19%. In the case of the 2 × 50 ShA + 3 × 90 ShA configuration, the thinning is smaller. The minimum wall thickness value is 0.91 mm, which gives a wall thinning of 14%. The change in the diameter of the formed workpiece in the case of the 5 × 50 ShA system was –0.4 mm longitudinally in the direction of the formed embosses and –4.9 mm in the transverse direction. These values for the 2 × 50 ShA + 3 × 90 ShA configuration were –0.69 mm and –4.24 mm, respectively. For the 5 × 50 ShA system, clear differences in the uniformity of formation can be observed. There is a difference of 0.16 mm between the right and left sides of the formed drawpiece in the smaller emboss. For the 2 × 50 ShA + 3 × 90 ShA configuration, much greater uniformity of formation can be observed, with a maximum difference of 0.06 mm.
Figure 23 shows a tabular summary of the measurement results of drawpieces.
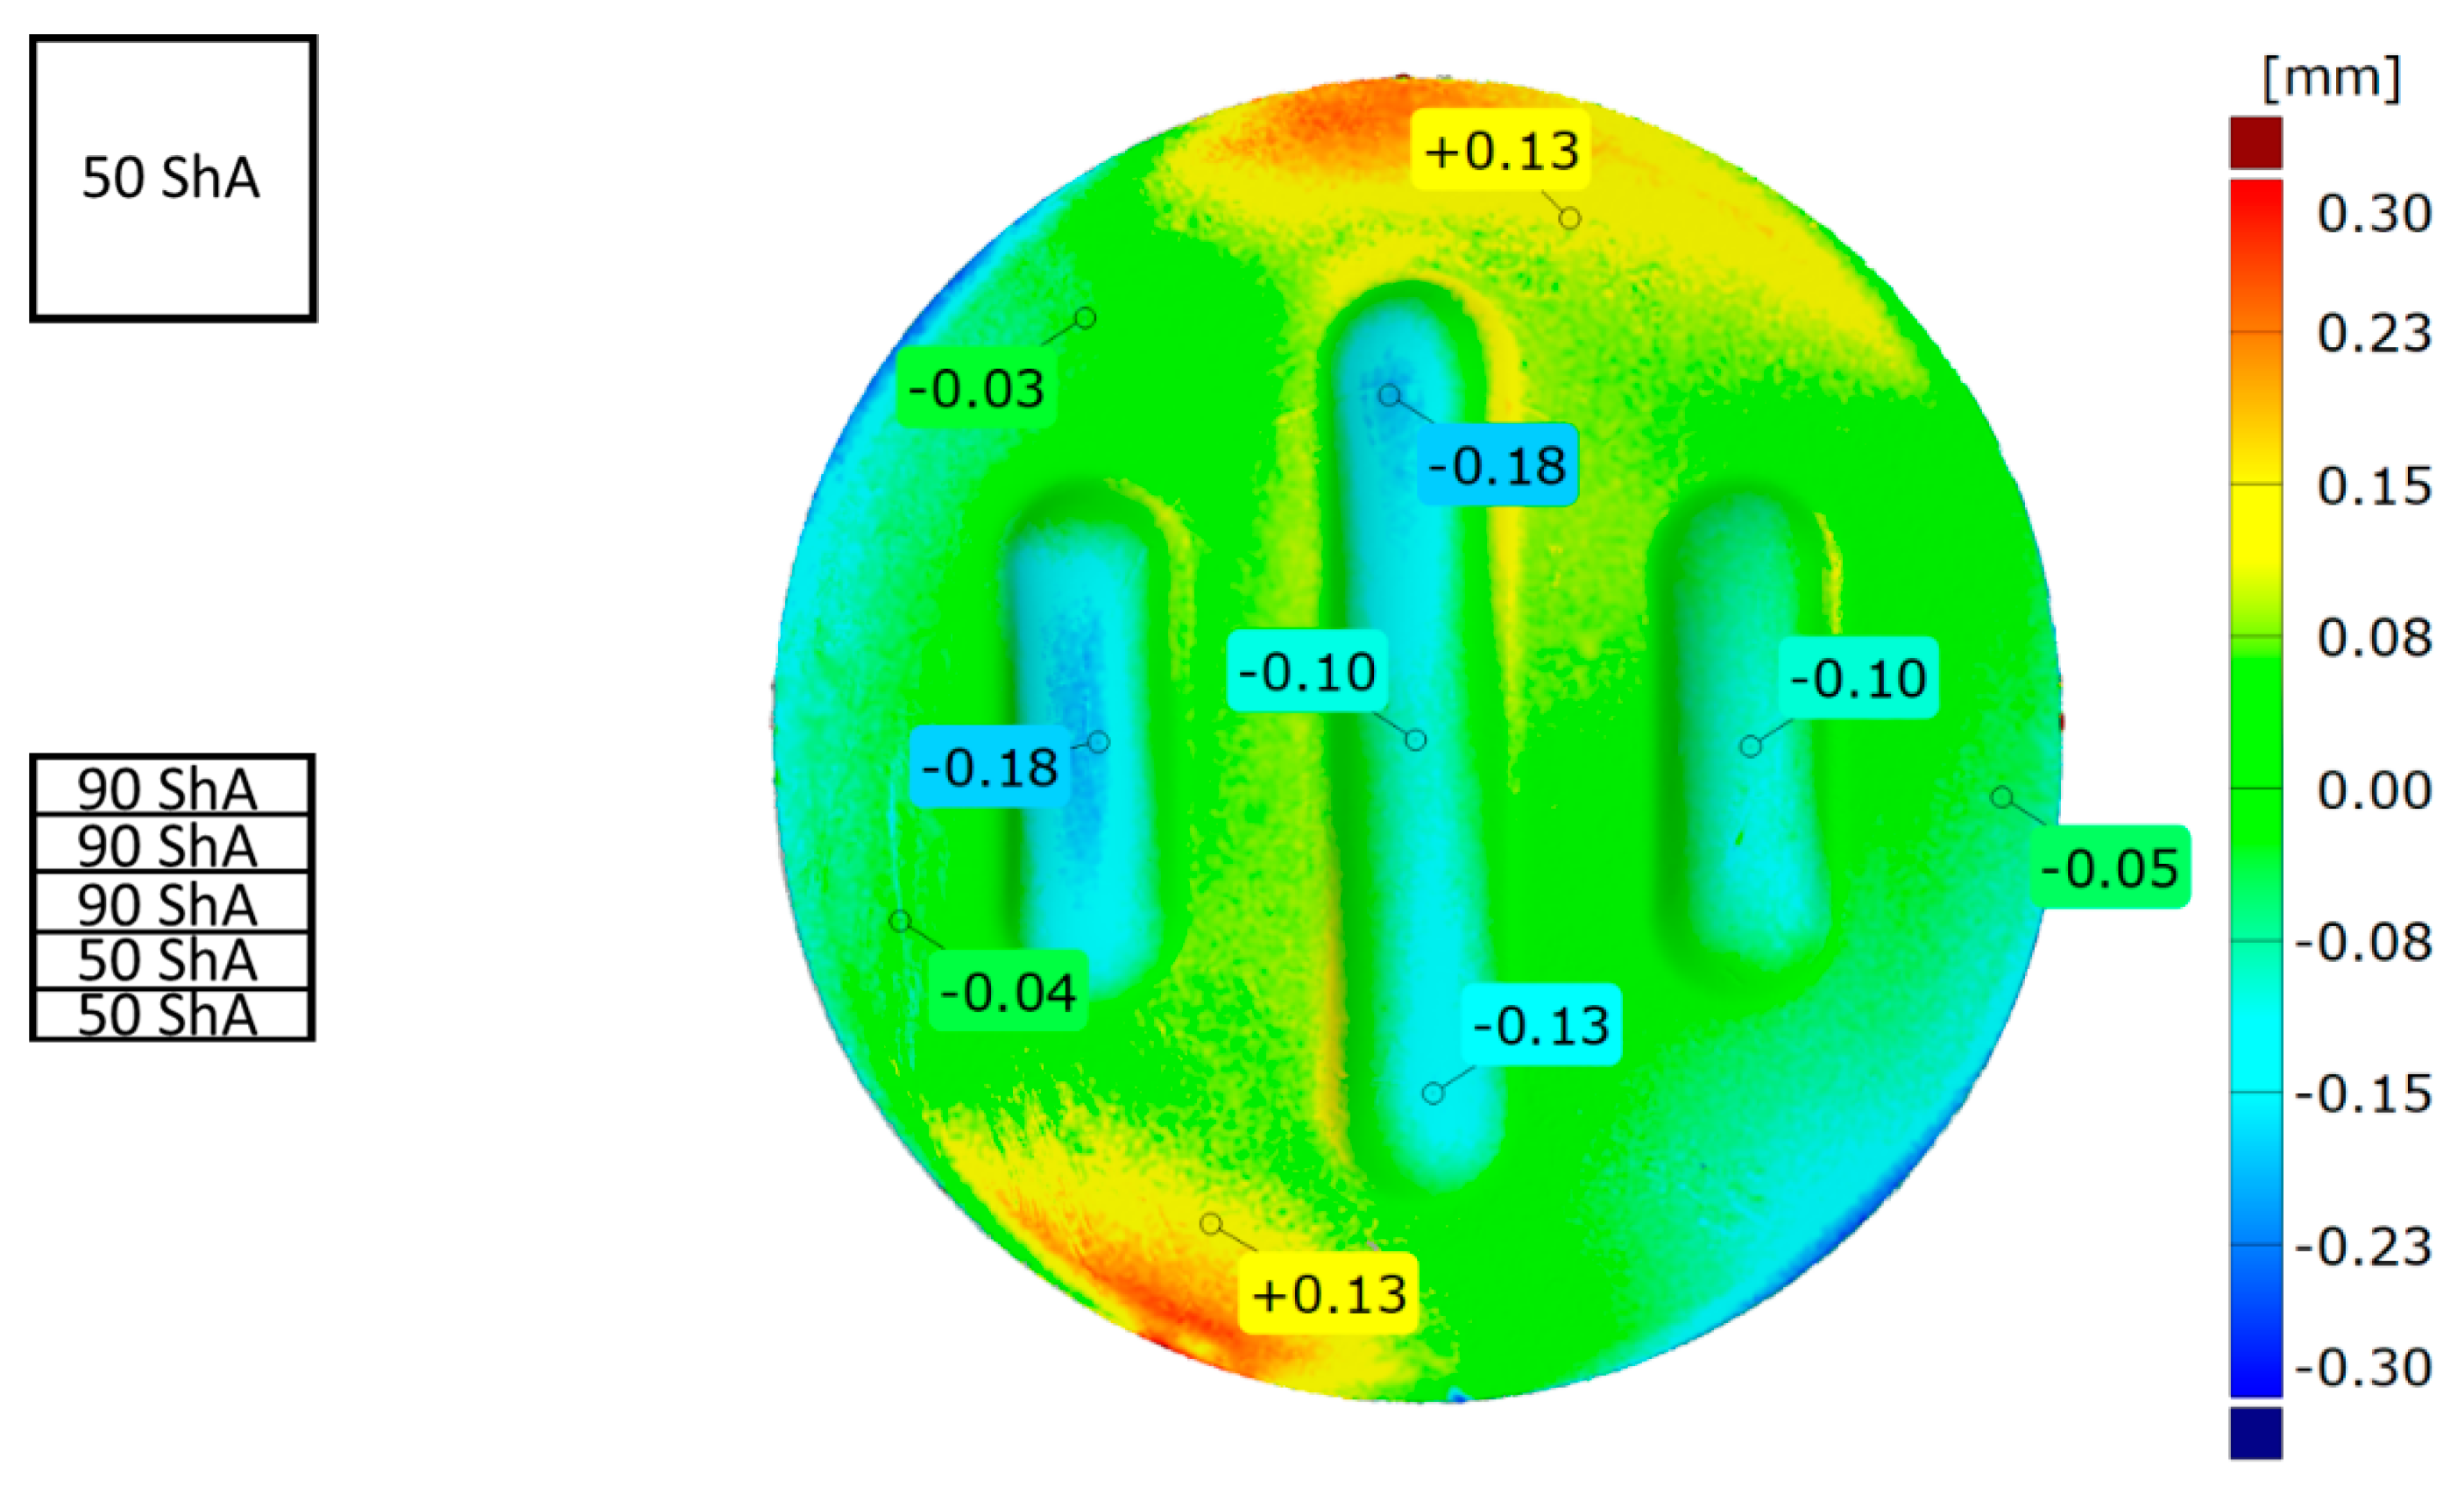
Figure 24 shows a comparison of 3D scans of measured drawpieces obtained by using two different configurations of polyurethane inserts.
The results confirm deeper formation of embosses for the 2 × 50 ShA + 3 × 90 ShA configuration of polymeric inserts. The differences range from –0.18 mm to 0.13 mm on the surface of the embosses. Analysing the results of the combinations of inserts, it is possible to conclude that there is a significant difference in the quality of the obtained element depending on the hardness of the elastomeric material used. The results obtained during numerical simulations were also confirmed experimentally and for all measured values of geometric parameters the 2 × 50 ShA + 3 × 90 ShA configuration was more favourable.
Author Contributions
Conceptualization, K.Ż. and M.B.; methodology, K.Ż., M.B. and M.H.; software, M.B., M.H., S.P. and Ł.K.; validation, K.Ż., M.B. and M.H.; investigation, K.Ż., M.B., M.H., S.P., Ł.K., T.T., and V.N.; data curation, K.Ż., M.B., S.P., Ł.K., T.T. and V.N; writing—original draft preparation, K.Ż. and M.B.; writing—review and editing, K.Ż., M.B., T.T. and V.N.; visualization, K.Ż., M.B., S.P., Ł.K. and T.T. All authors have read and agreed to the published version of the manuscript.
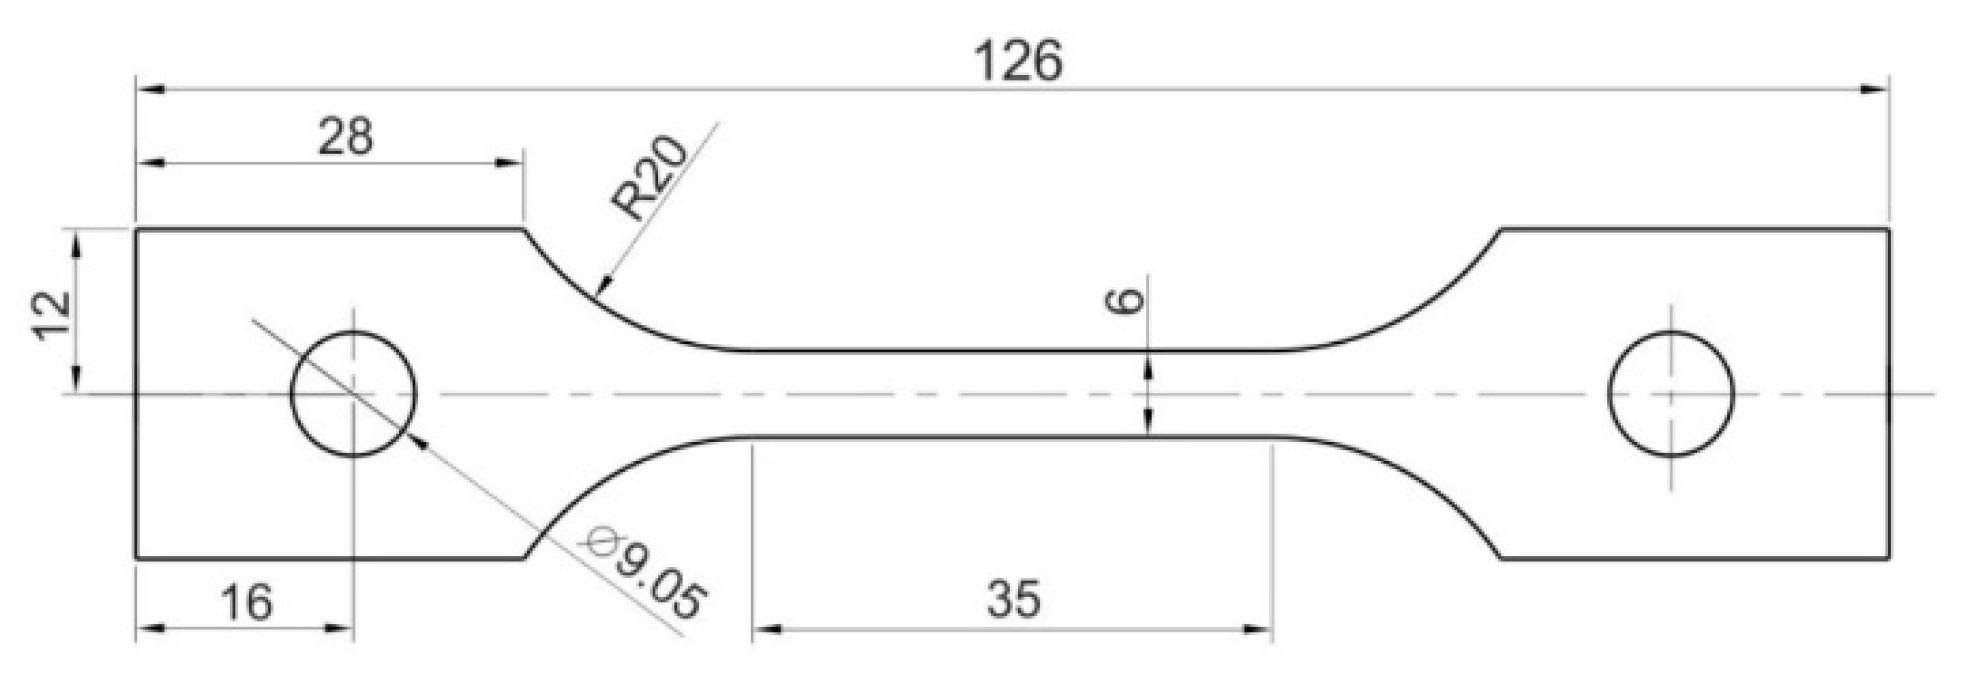
Figure 1.
Dimensions of uniaxial tensile test specimens.
Figure 1.
Dimensions of uniaxial tensile test specimens.
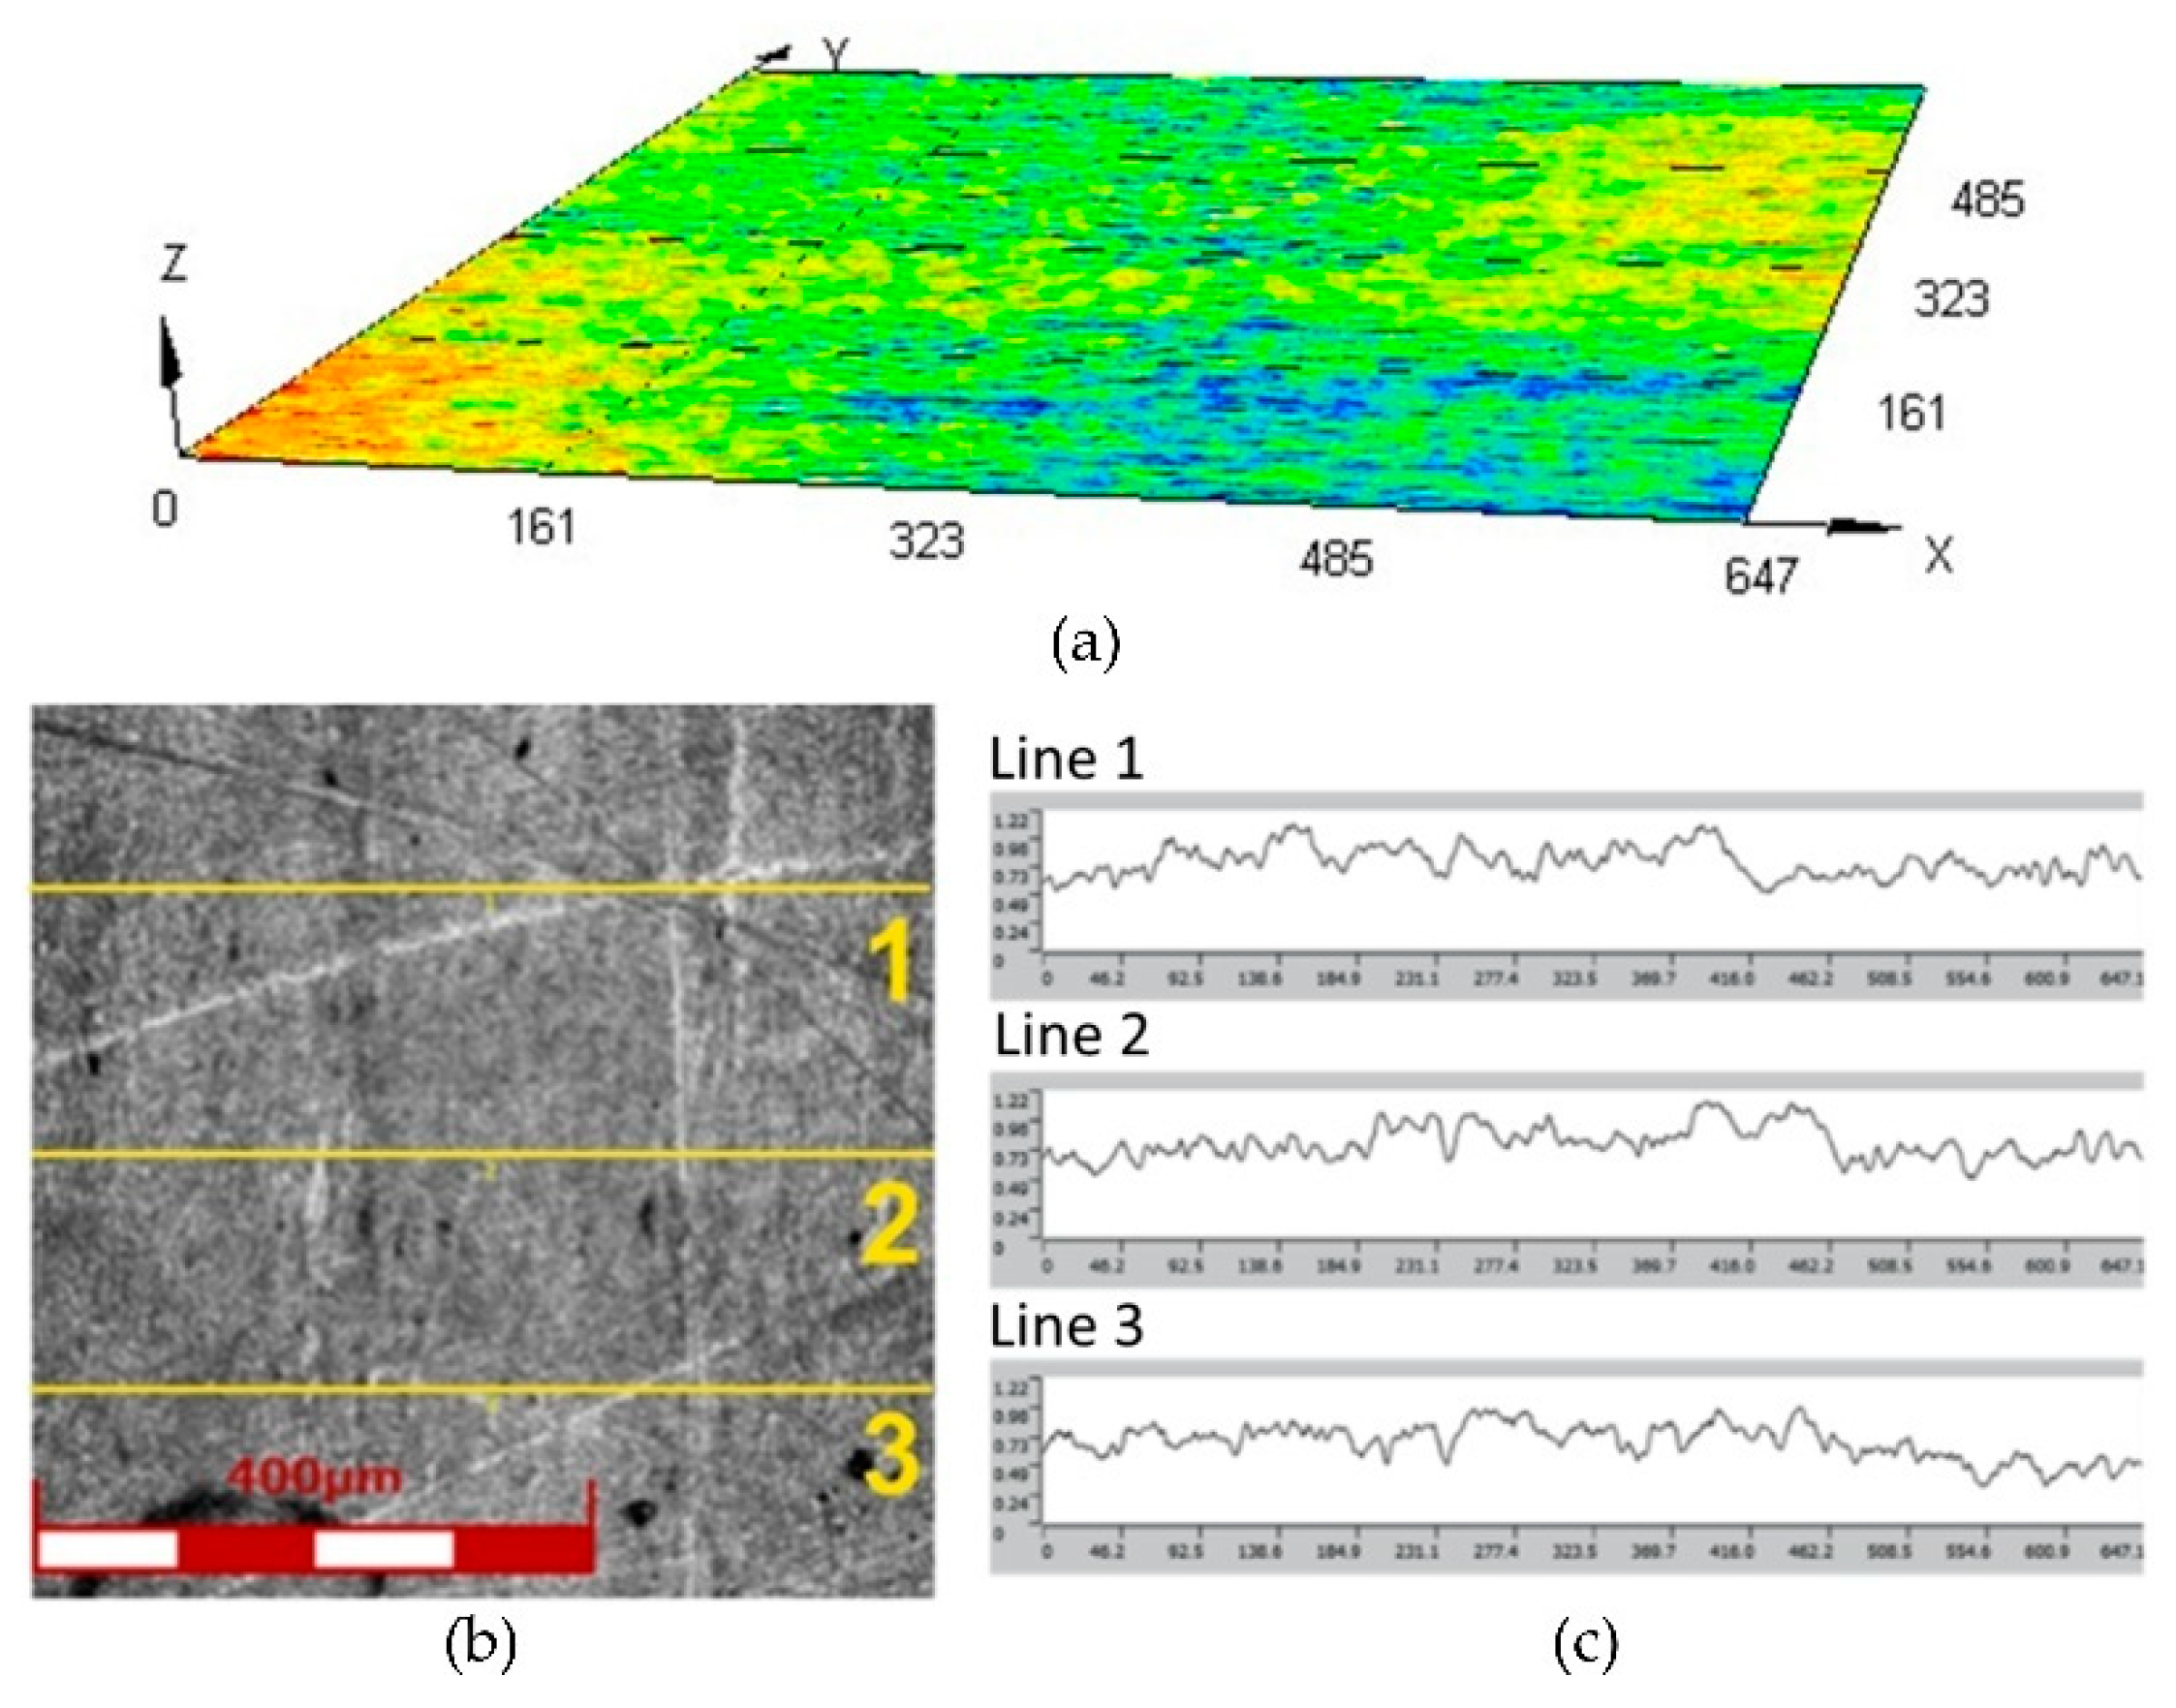
Figure 2.
(a) surface topography, (b) view of surface of the Inconel 625 sheet metal and (c) linear surface roughness profiles used to determine average value of surface roughness parameters.
Figure 2.
(a) surface topography, (b) view of surface of the Inconel 625 sheet metal and (c) linear surface roughness profiles used to determine average value of surface roughness parameters.
Figure 3.
(a) principle of operation of the T-05 tester and (b) geometry and dimensions of the polyurethane countersample.
Figure 3.
(a) principle of operation of the T-05 tester and (b) geometry and dimensions of the polyurethane countersample.
Figure 4.
(a) Simulated shape of the sample during the compression test, and (b) fit of the experimental compression curve with the simulation results.
Figure 4.
(a) Simulated shape of the sample during the compression test, and (b) fit of the experimental compression curve with the simulation results.
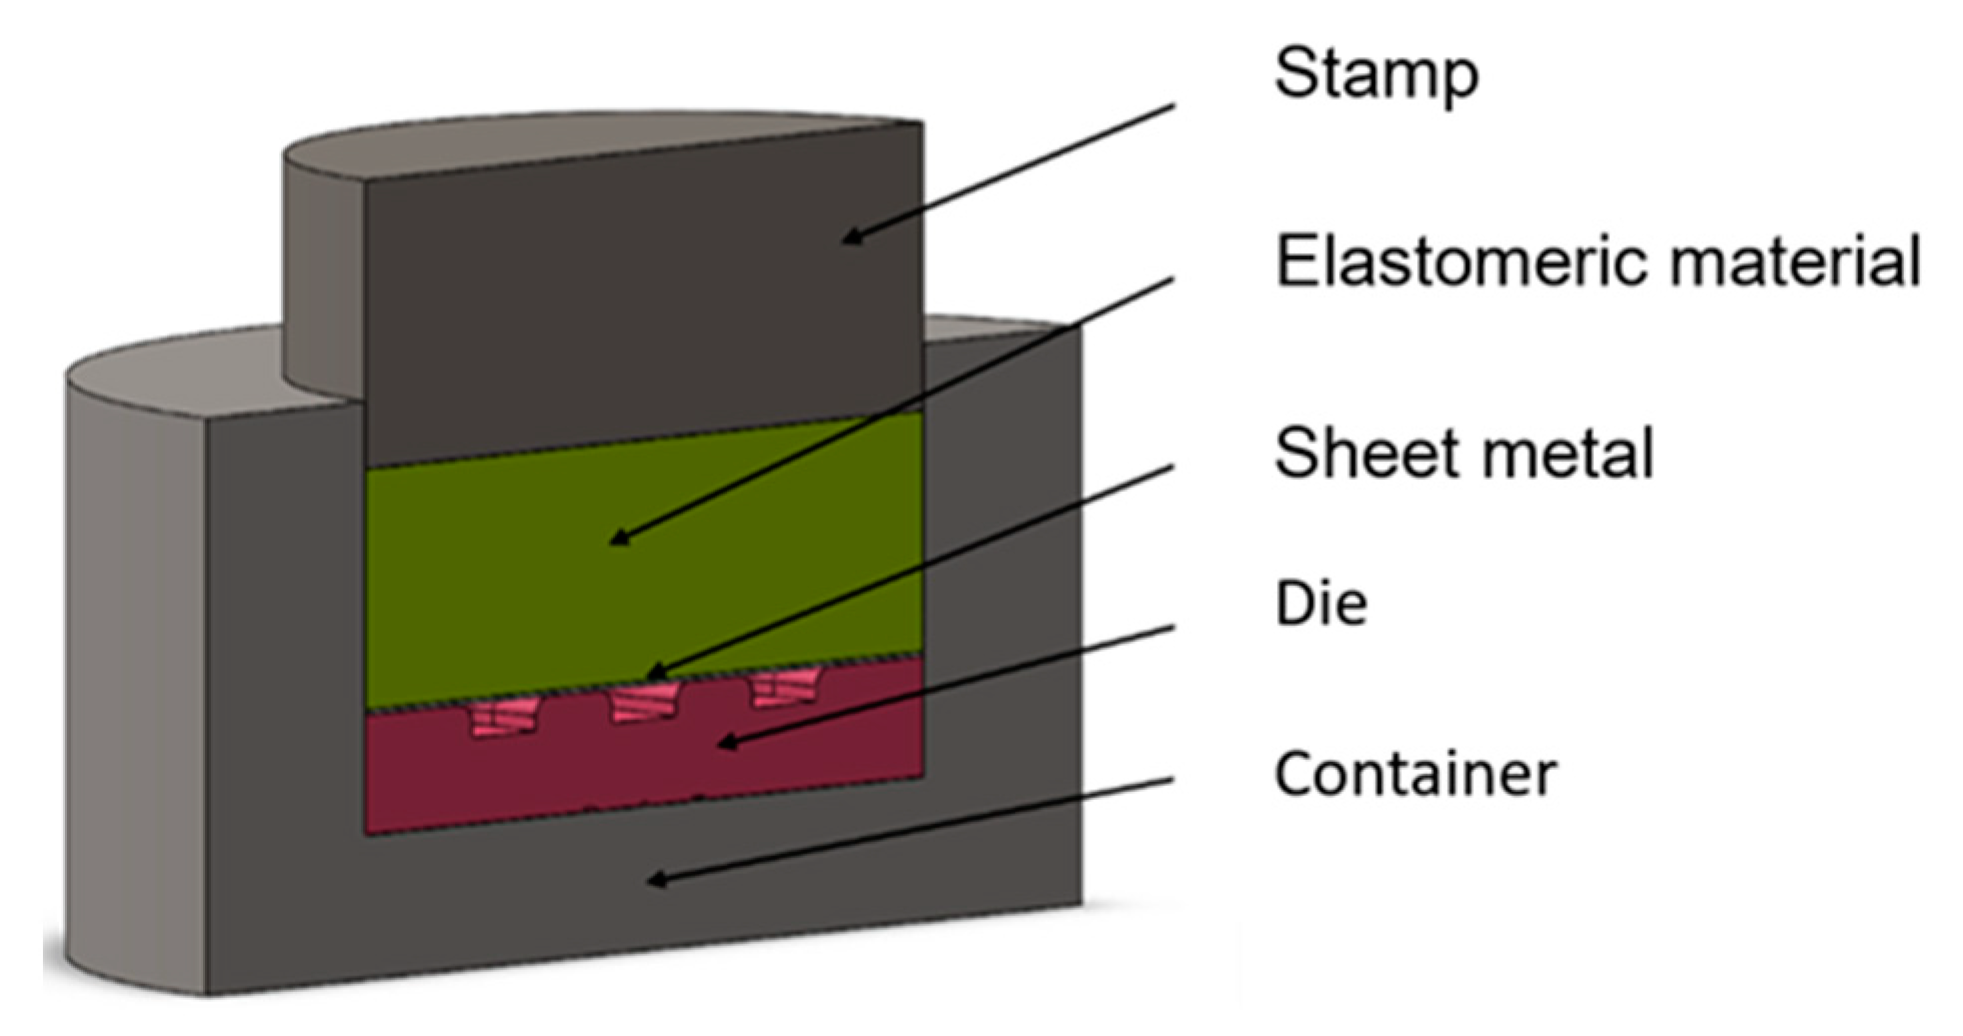
Figure 5.
Cross-section of a 3D model of a stamping die used for numerical simulations.
Figure 5.
Cross-section of a 3D model of a stamping die used for numerical simulations.
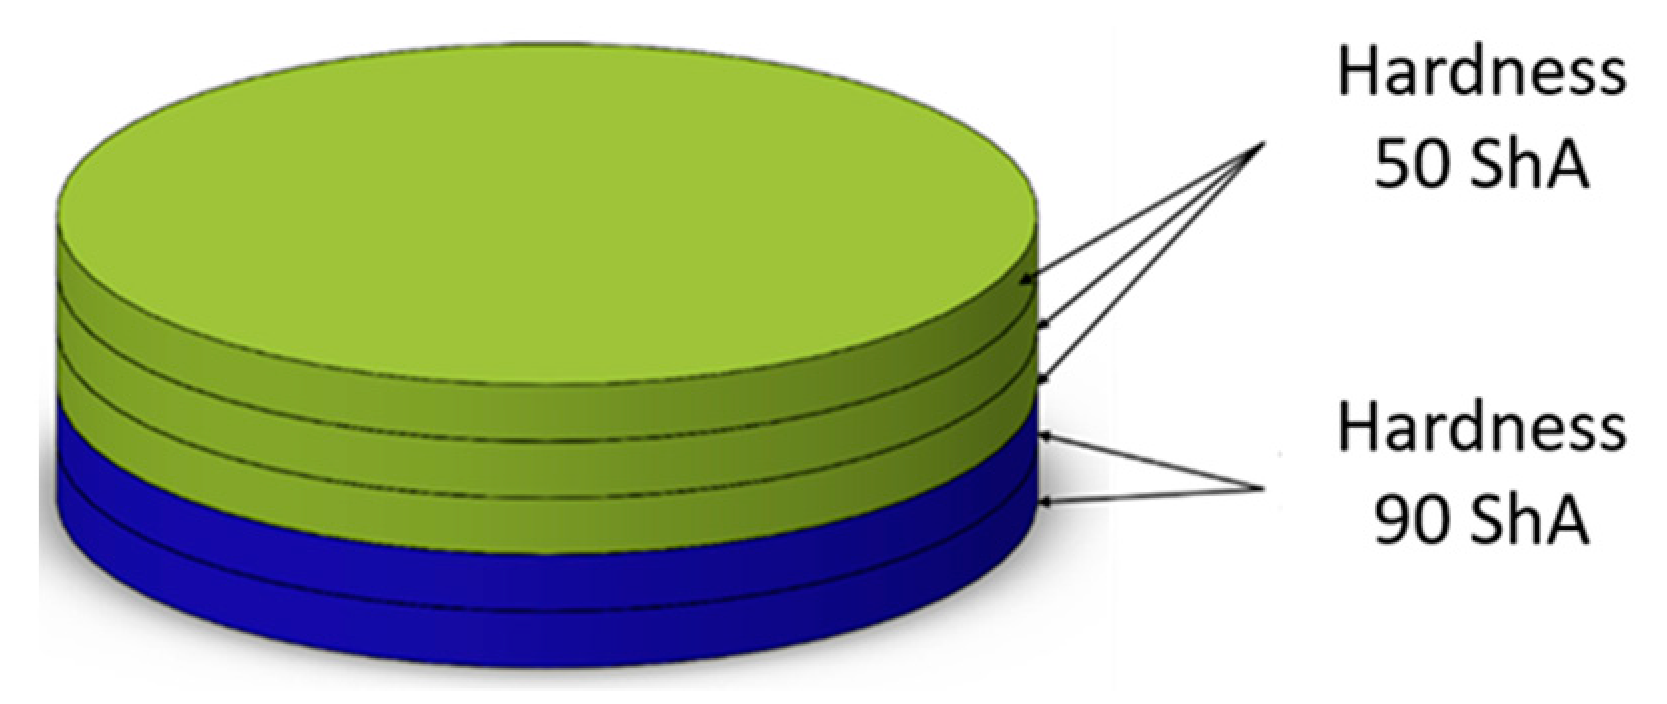
Figure 6.
Polyurethane punch configuration with five layers of inserts of different hardness (3×50 ShA + 2×90 ShA).
Figure 6.
Polyurethane punch configuration with five layers of inserts of different hardness (3×50 ShA + 2×90 ShA).
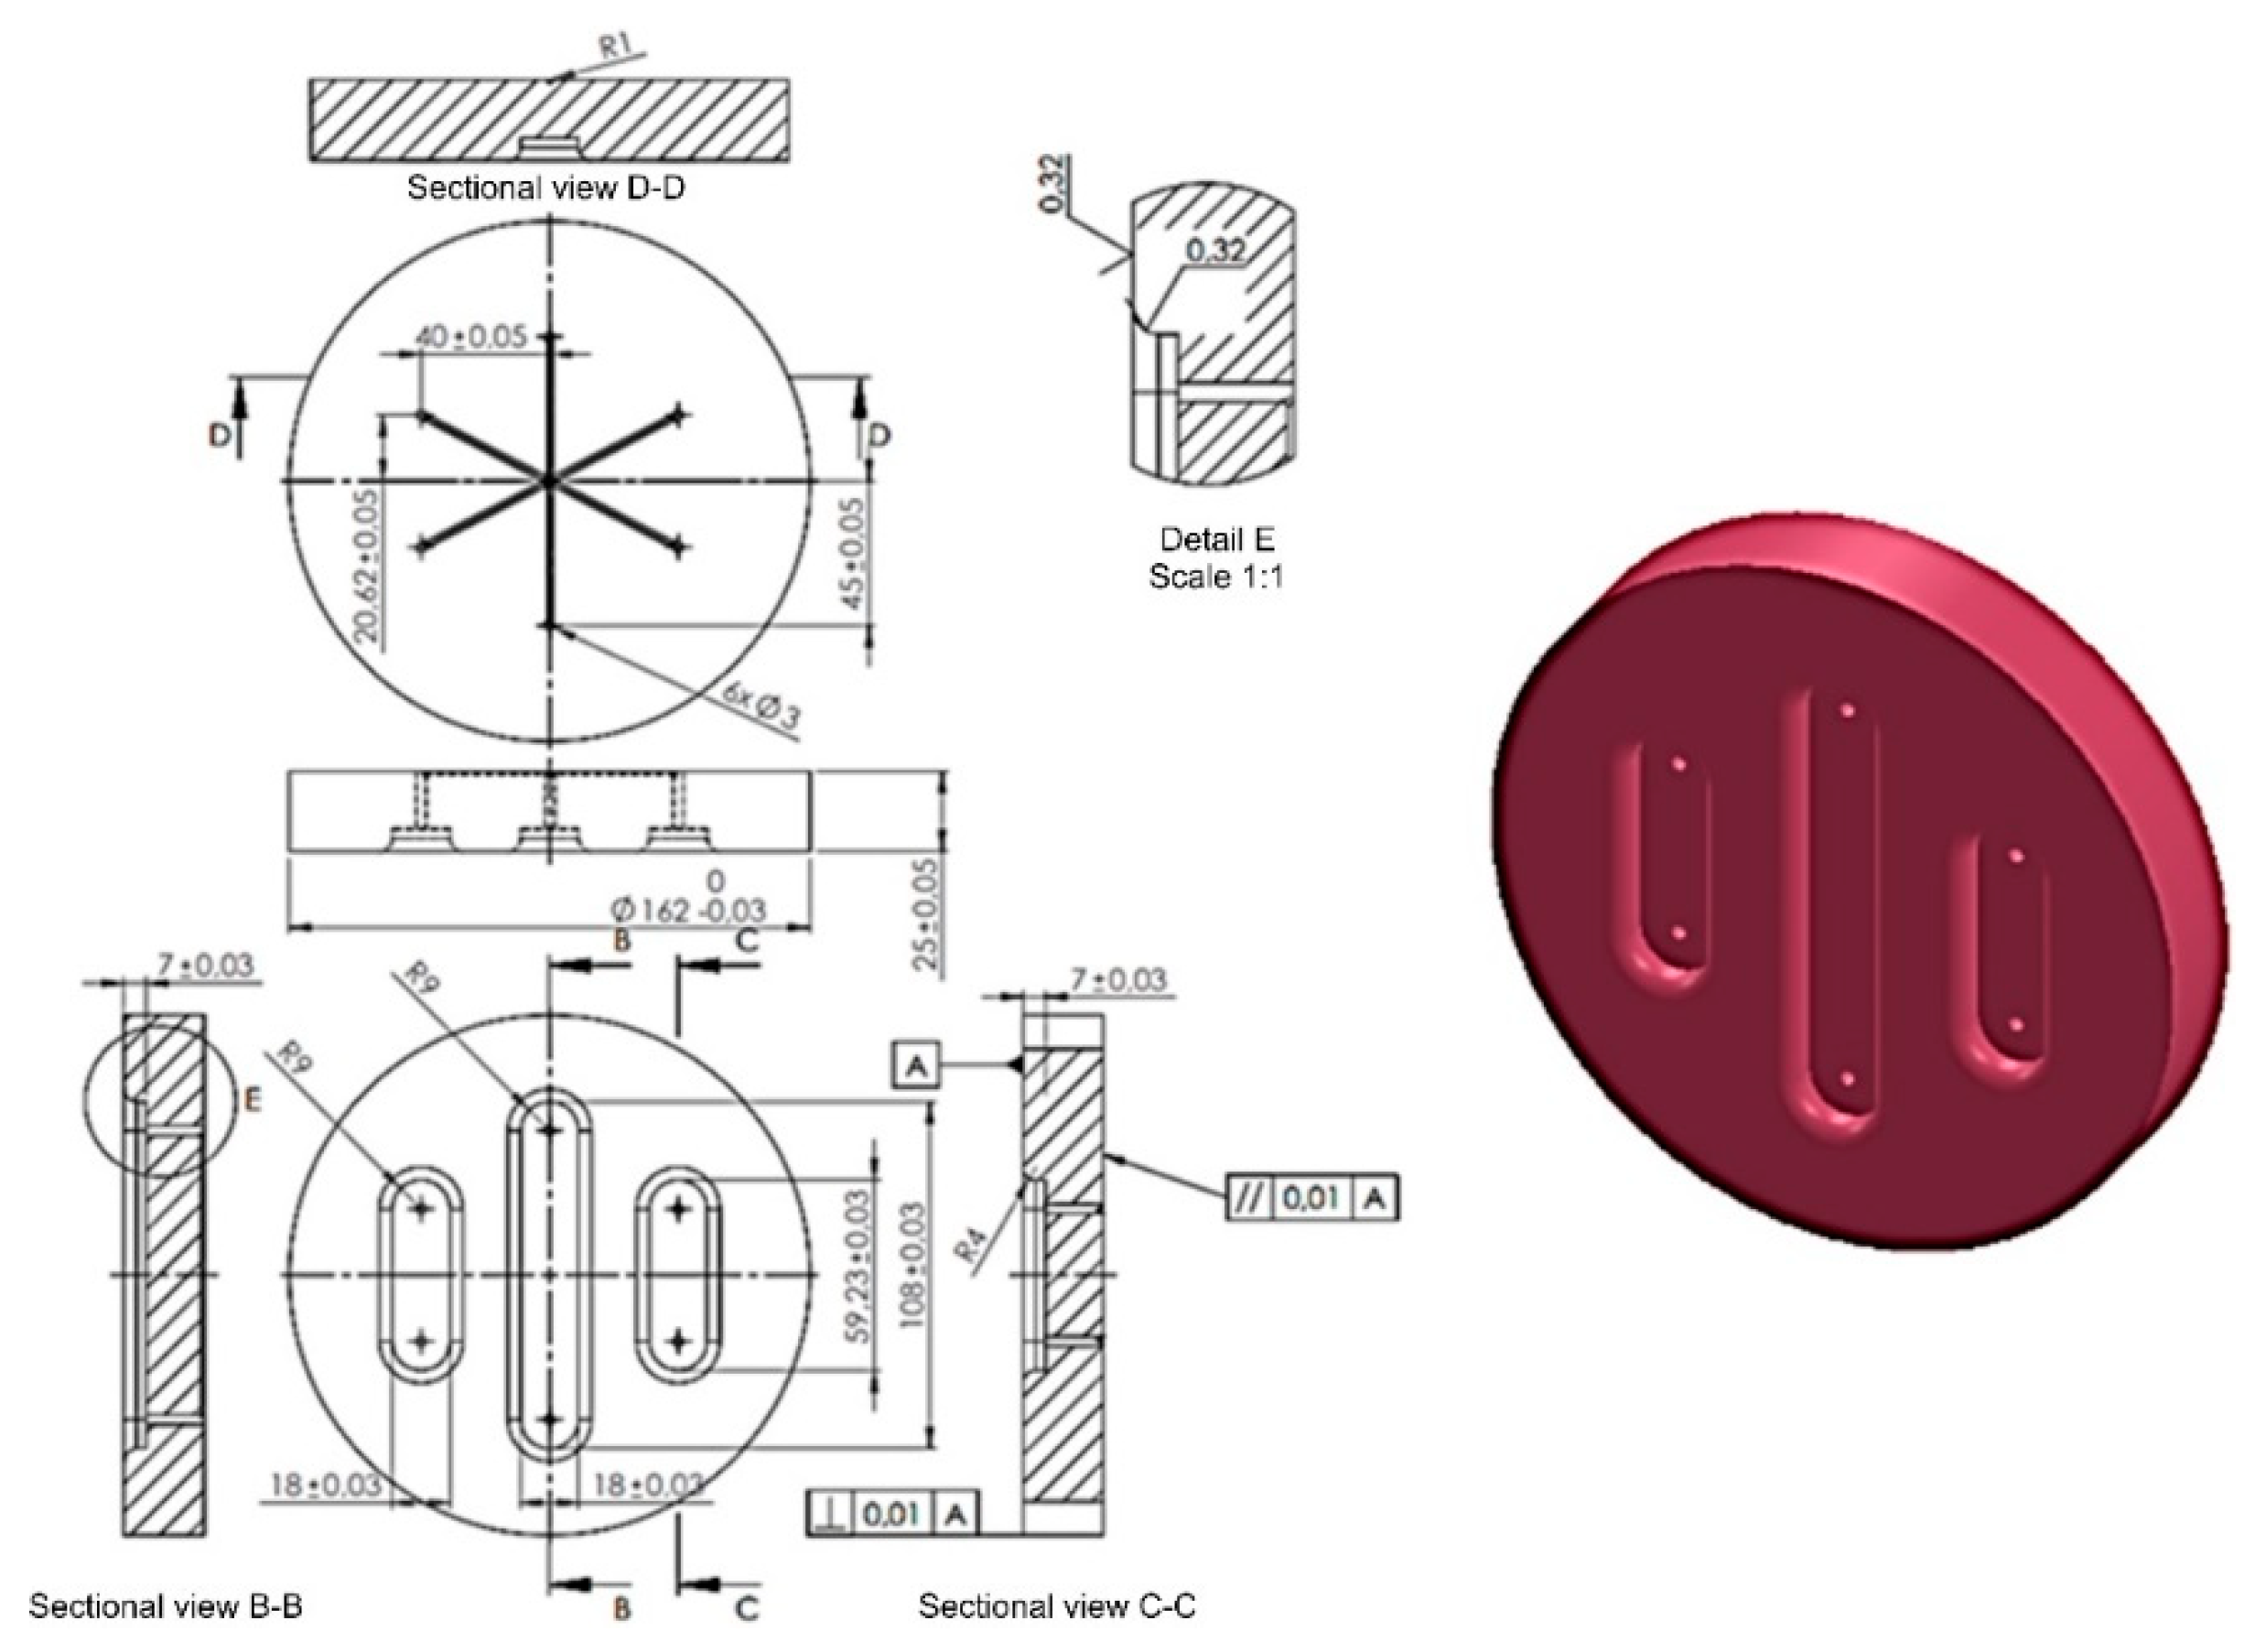
Figure 7.
Shape and dimensions of the die used to form Inconel 625 sheet metals.
Figure 7.
Shape and dimensions of the die used to form Inconel 625 sheet metals.
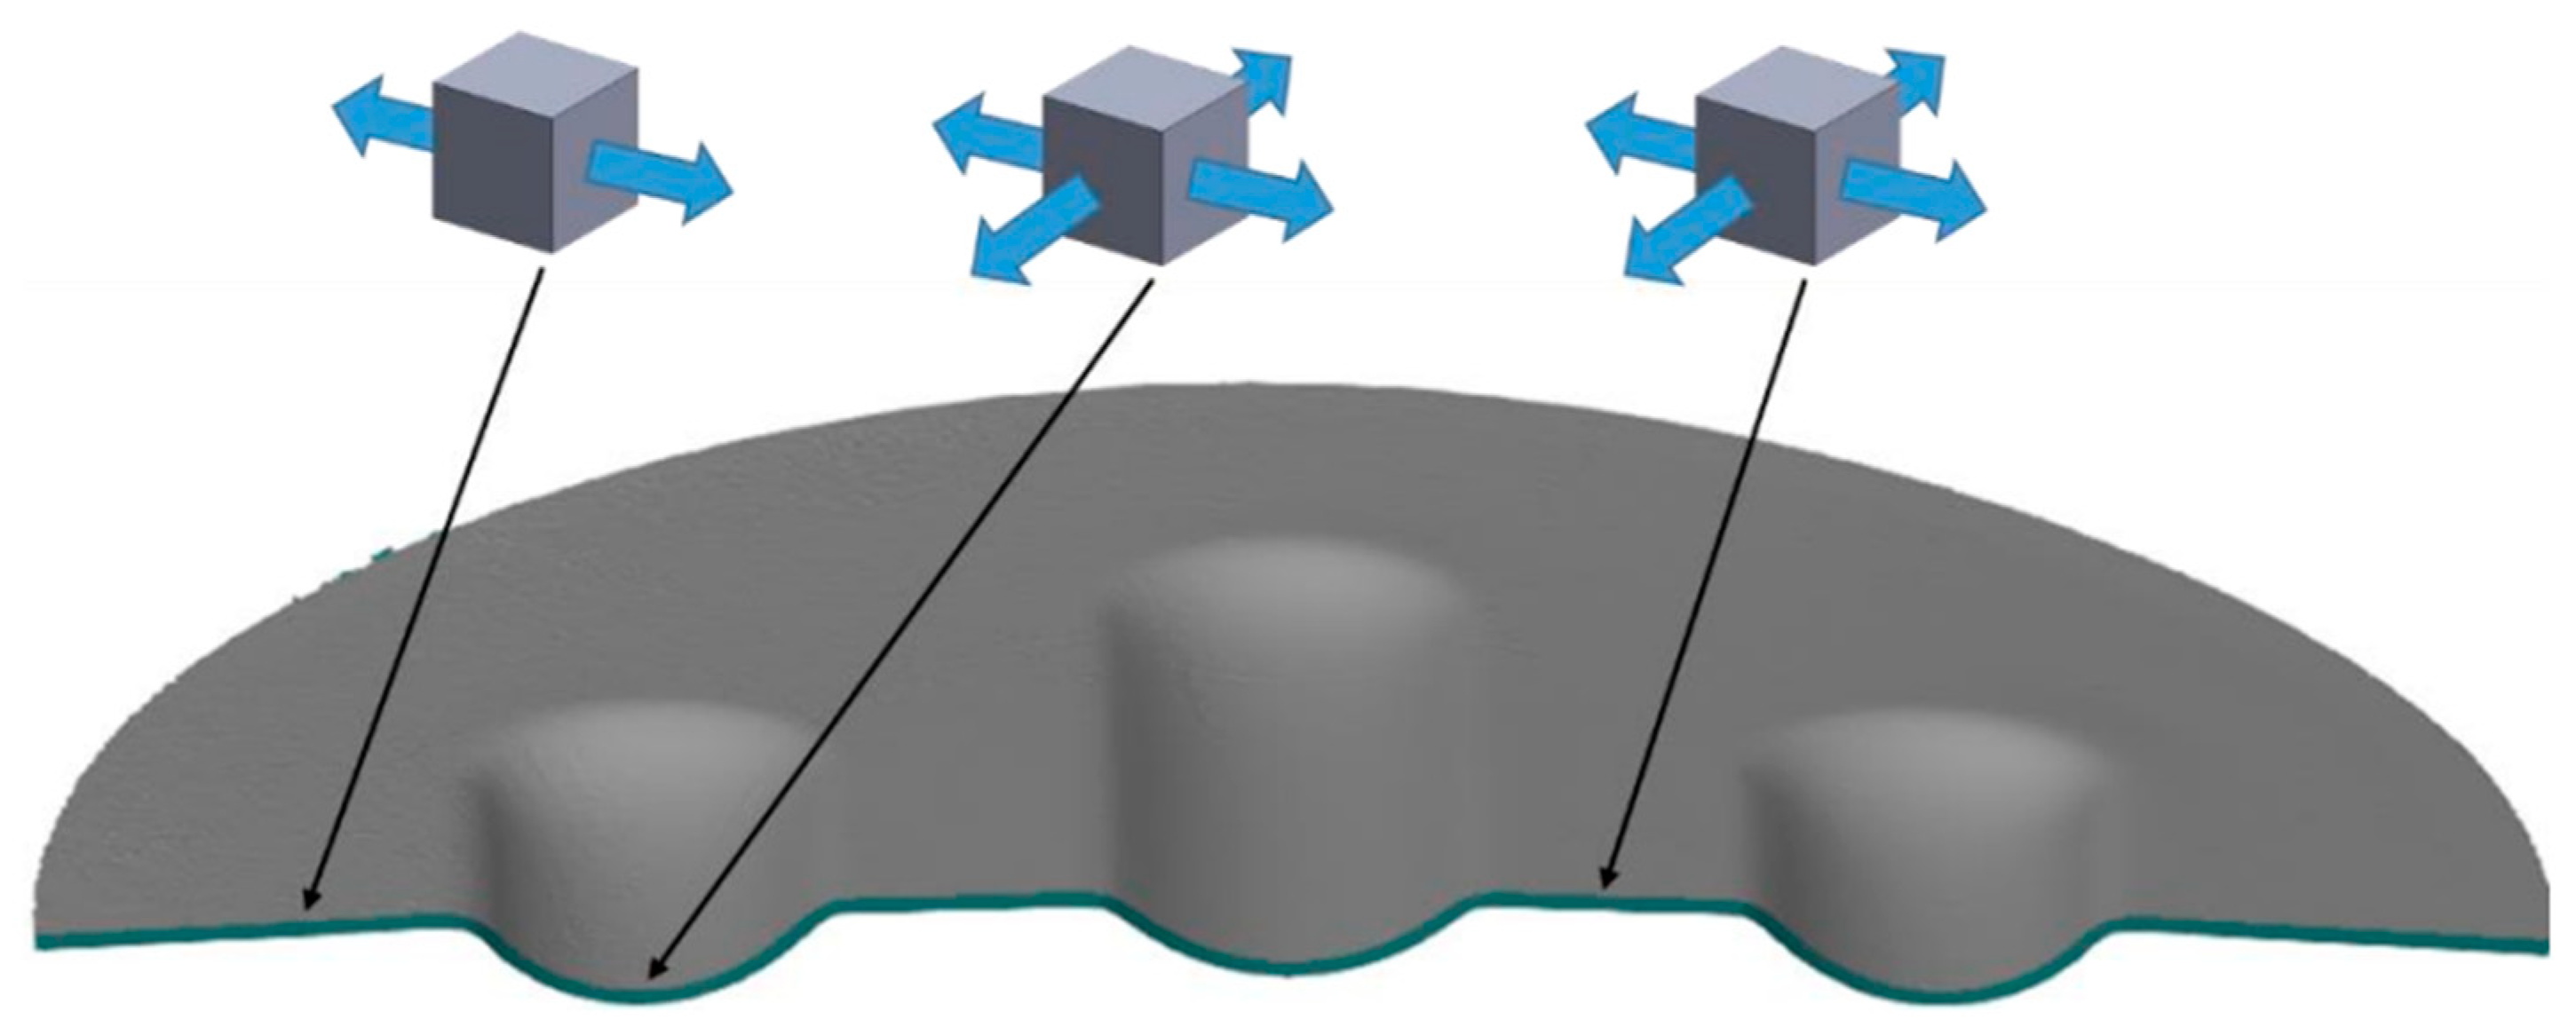
Figure 8.
Cross-section of a formed element with marked stress states in selected areas.
Figure 8.
Cross-section of a formed element with marked stress states in selected areas.
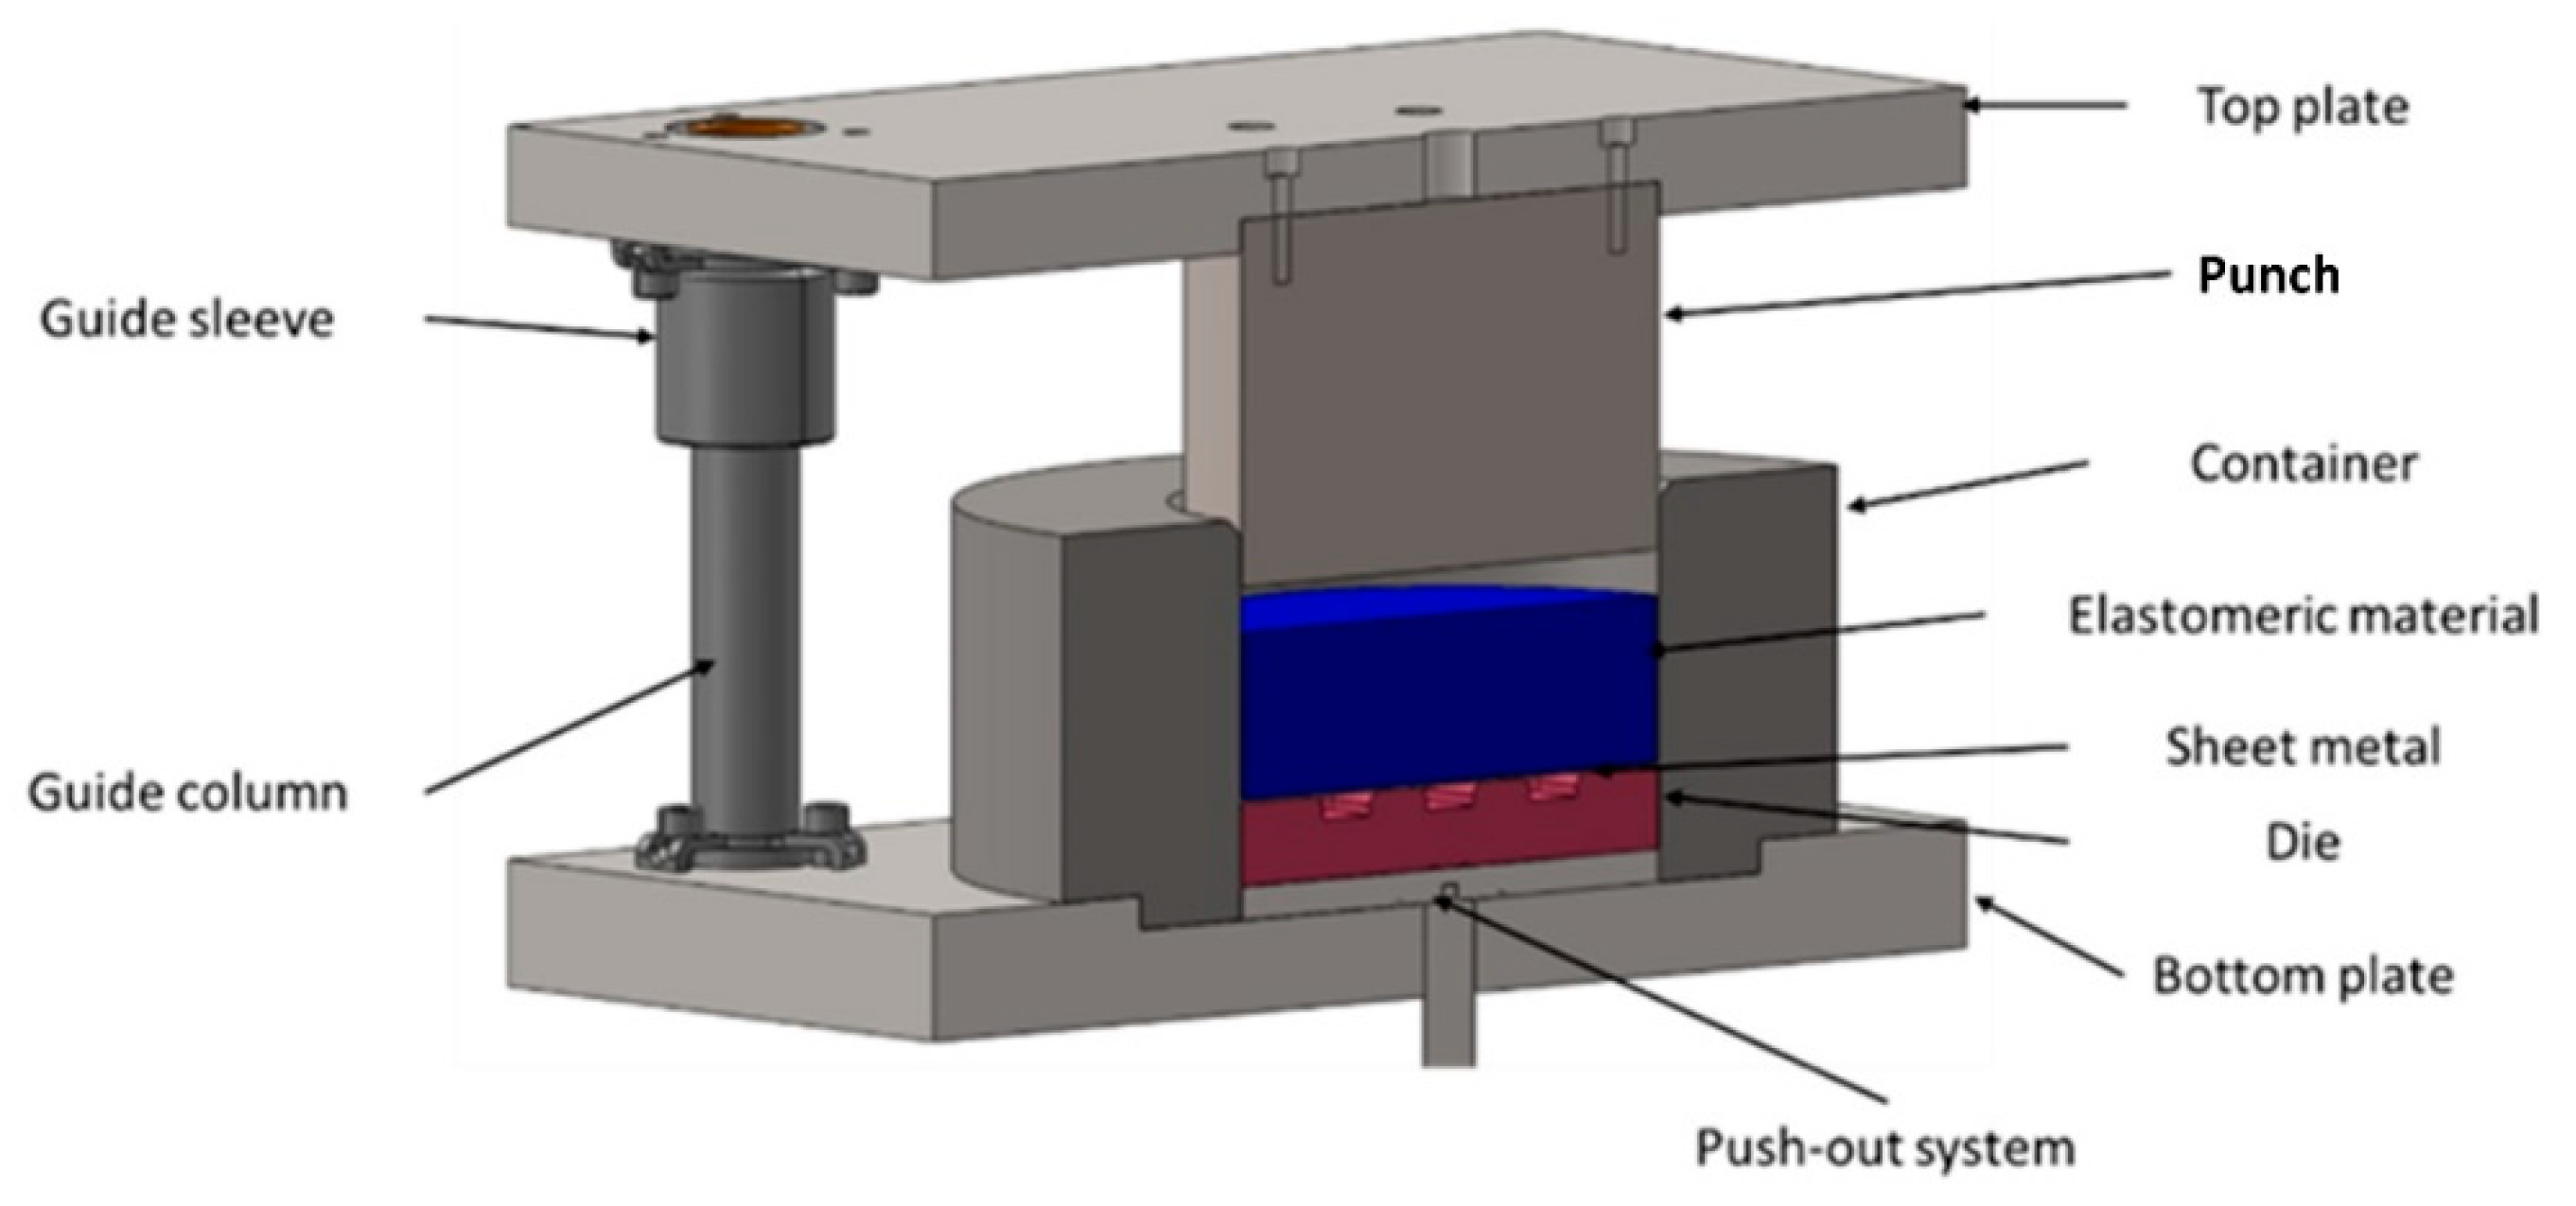
Figure 9.
3D model of the stamping die.
Figure 9.
3D model of the stamping die.
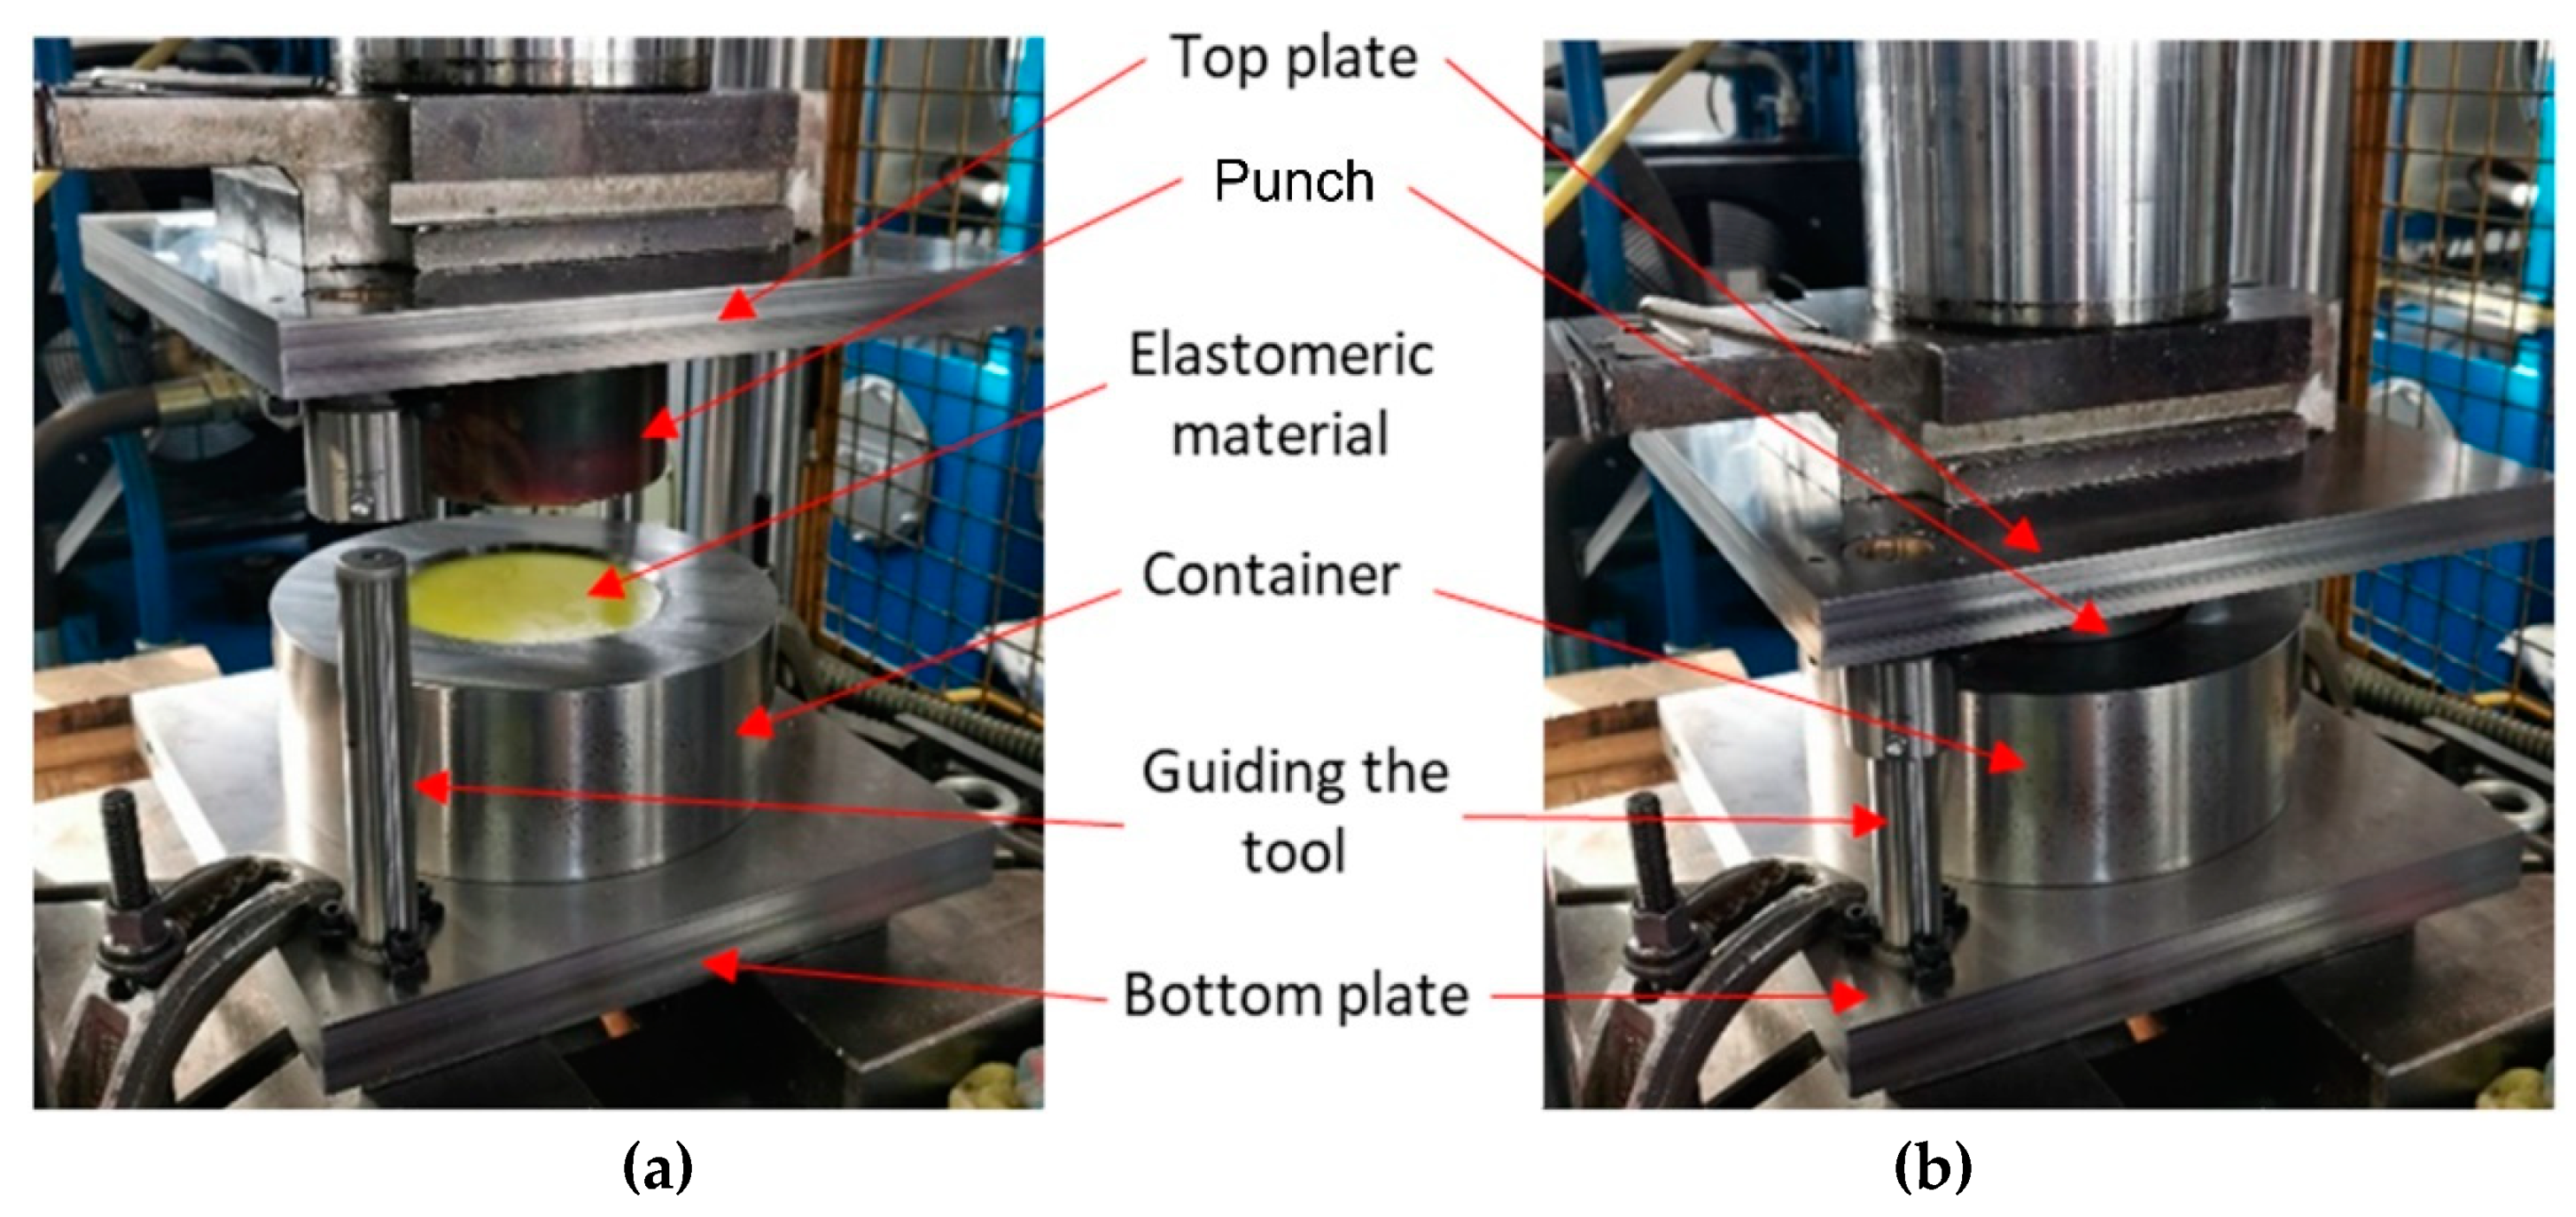
Figure 10.
Stamping die (a) mounted on a press and (b) during forming.
Figure 10.
Stamping die (a) mounted on a press and (b) during forming.
Figure 11.
The 3D scan of the drawpiece from different perspectives.
Figure 11.
The 3D scan of the drawpiece from different perspectives.
Figure 12.
Example result of the surface flatness measurement.
Figure 12.
Example result of the surface flatness measurement.
Figure 13.
Example result of measuring (a) the thickness of the drawpiece and (b) the change in drawpiece diameter after the forming process.
Figure 13.
Example result of measuring (a) the thickness of the drawpiece and (b) the change in drawpiece diameter after the forming process.
Figure 14.
Example results for (a) the strain uniformity and (b) the difference in forming depth.
Figure 14.
Example results for (a) the strain uniformity and (b) the difference in forming depth.
Figure 15.
Tensile curves of samples made of Inconel 625 sheet.
Figure 15.
Tensile curves of samples made of Inconel 625 sheet.
Figure 16.
Results of the uniaxial compression test of polyurethane samples.
Figure 16.
Results of the uniaxial compression test of polyurethane samples.
Figure 17.
Subsequent stages of forming the element for a) 20%, b) 40%, c) 60% and d) 90% of simulation time.
Figure 17.
Subsequent stages of forming the element for a) 20%, b) 40%, c) 60% and d) 90% of simulation time.
Figure 18.
The influence of the hardness of polyurethane inserts on forming depth.
Figure 18.
The influence of the hardness of polyurethane inserts on forming depth.
Figure 19.
The influence of die geometry on the deformation of the polyurethane punch consisting of five layers of different hardness 2×50 ShA + 3×90 ShA.
Figure 19.
The influence of die geometry on the deformation of the polyurethane punch consisting of five layers of different hardness 2×50 ShA + 3×90 ShA.
Figure 20.
Comparison of the geometry of drawpieces obtained using polyurethane inserts with a hardness of 50 ShA and 90 ShA using a forming force of 1,000 kN.
Figure 20.
Comparison of the geometry of drawpieces obtained using polyurethane inserts with a hardness of 50 ShA and 90 ShA using a forming force of 1,000 kN.
Figure 21.
Results of measuring the geometry of the drawpieces formed using five inserts with a hardness of 50 ShA: (a) surface flatness, (b) thickness, (c) changes in the diameter of the workpiece, (d) uniformity of forming.
Figure 21.
Results of measuring the geometry of the drawpieces formed using five inserts with a hardness of 50 ShA: (a) surface flatness, (b) thickness, (c) changes in the diameter of the workpiece, (d) uniformity of forming.
Figure 22.
Results of measuring the geometry of the drawpieces formed using two inserts with a hardness of 50 ShA and three inserts with a hardness of 90 ShA: (a) surface flatness, (b) thickness, (c) changes in the diameter of the workpiece, (d) uniformity of forming.
Figure 22.
Results of measuring the geometry of the drawpieces formed using two inserts with a hardness of 50 ShA and three inserts with a hardness of 90 ShA: (a) surface flatness, (b) thickness, (c) changes in the diameter of the workpiece, (d) uniformity of forming.
Figure 23.
Summary of measurement results of the geometry of drawpieces made of Inconel 625 sheet metal.
Figure 23.
Summary of measurement results of the geometry of drawpieces made of Inconel 625 sheet metal.
Figure 24.
Comparison of the drawpieces formed using two different configurations of polyurethane inserts: 5×50 ShA and 2×50 ShA + 3×90 ShA.
Figure 24.
Comparison of the drawpieces formed using two different configurations of polyurethane inserts: 5×50 ShA and 2×50 ShA + 3×90 ShA.
Table 1.
Surface roughness parameters of polyurethane inserts.
Table 1.
Surface roughness parameters of polyurethane inserts.
Average value of the
surface roughness parameter |
Hardness of the polyurethane insert |
| 50 ShA |
60 ShA |
70 ShA |
80 ShA |
90 ShA |
| Ra, μm |
0.337 μm |
0.191 μm |
0.204 μm |
1.228 μm |
0.894 μm |
| Rz, μm |
2.536 μm |
1.244 μm |
1.517 μm |
7.918 μm |
5.493 μm |
Table 2.
Material coefficients for polyurethane samples with varying hardness.
Table 2.
Material coefficients for polyurethane samples with varying hardness.
| Hardness of polyurethane sample |
Coefficient K, Pa |
Coefficient C1, Pa |
Coefficient C2, Pa |
| 50 ShA |
4.0 × 10⁹
|
0.3 × 10⁶
|
0.15 × 10⁹
|
| 60 ShA |
4.1 × 10⁹
|
0.59 × 10⁶
|
0.19 × 10⁶
|
| 70 ShA |
4.2 × 10⁹
|
0.6 × 10⁶
|
0.2 × 10⁶
|
| 80 ShA |
4.8 × 10⁹
|
1.6 × 10⁶
|
0.11 × 10⁶
|
| 90 ShA |
4.8 × 10⁹
|
2.1 × 10⁶
|
0.1 × 10⁶
|
Table 3.
Results of the basic mechanical parameters of Inconel 625 sheet.
Table 3.
Results of the basic mechanical parameters of Inconel 625 sheet.
| Sample orientation |
Ultimate tensile stress Rm, MPa |
Yield stress Rp0,2, MPa |
Elongation A, % |
| 0° |
966.1 |
526.5 |
49.4 |
| 45° |
955.9 |
532.5 |
47.4 |
| 90° |
954.4 |
521.6 |
46.8 |
Table 4.
Anisotropy coefficients of Inconel 625 sheet.
Table 4.
Anisotropy coefficients of Inconel 625 sheet.
| Coefficient of normal anisotropy |
Coefficient of planar anisotropy |
| 1.22 |
–0.64 |
Table 5.
Results of the hardness measurements of polyurethane samples.
Table 5.
Results of the hardness measurements of polyurethane samples.
| Nominal hardness, ShA |
Number of measurement |
Measured average hardness, ShA |
| 1 |
2 |
3 |
4 |
5 |
| 50 |
50 |
50 |
51 |
51 |
52 |
50.7 |
| 60 |
62 |
61 |
62 |
62 |
64 |
61.8 |
| 70 |
64 |
66 |
63 |
63 |
66 |
65.3 |
| 80 |
78 |
79 |
78 |
80 |
81 |
79.3 |
| 90 |
89 |
89 |
88 |
90 |
90 |
89.3 |
Table 6.
Wear parameters and COF of polyurethane countersamples and Inconel 625 sample.
Table 6.
Wear parameters and COF of polyurethane countersamples and Inconel 625 sample.
| Parameter |
Hardness of polyurethane countersample |
| 50 ShA |
60 ShA |
70 ShA |
80 ShA |
90 ShA |
| Weight loss of polyurethane countersample Δmcs, % |
0.4031 |
0.1448 |
0.1956 |
0.0116 |
0.0762 |
| Weight loss of Inconel 625 sample Δms, % |
0.1958 |
–0.041 |
0.2483 |
–0.063 |
–0.0328 |
| Average COF |
0.465 |
0.526 |
0.622 |
0.545 |
0.263 |
Table 7.
Results of the maximum depth of emboss in the Inconel 625 alloy sheet for individual variants of the polyurethane inserts.
Table 8.
Summary of the results of forming drawpieces with a pressure of 1000 kN.
