Submitted:
18 November 2023
Posted:
22 November 2023
You are already at the latest version
Abstract
Keywords:
1. Introduction
2. Methods
2.1. The optimal operation of DHN to provide heat (day-ahead scheduling)
2.2. The operation of DHN in the balancing markets (balancing stage)
2.2.1. Market background
2.2.2. Energy analysis
2.2.3. Economic analysis
2.3. Case Study DHN
3. Results
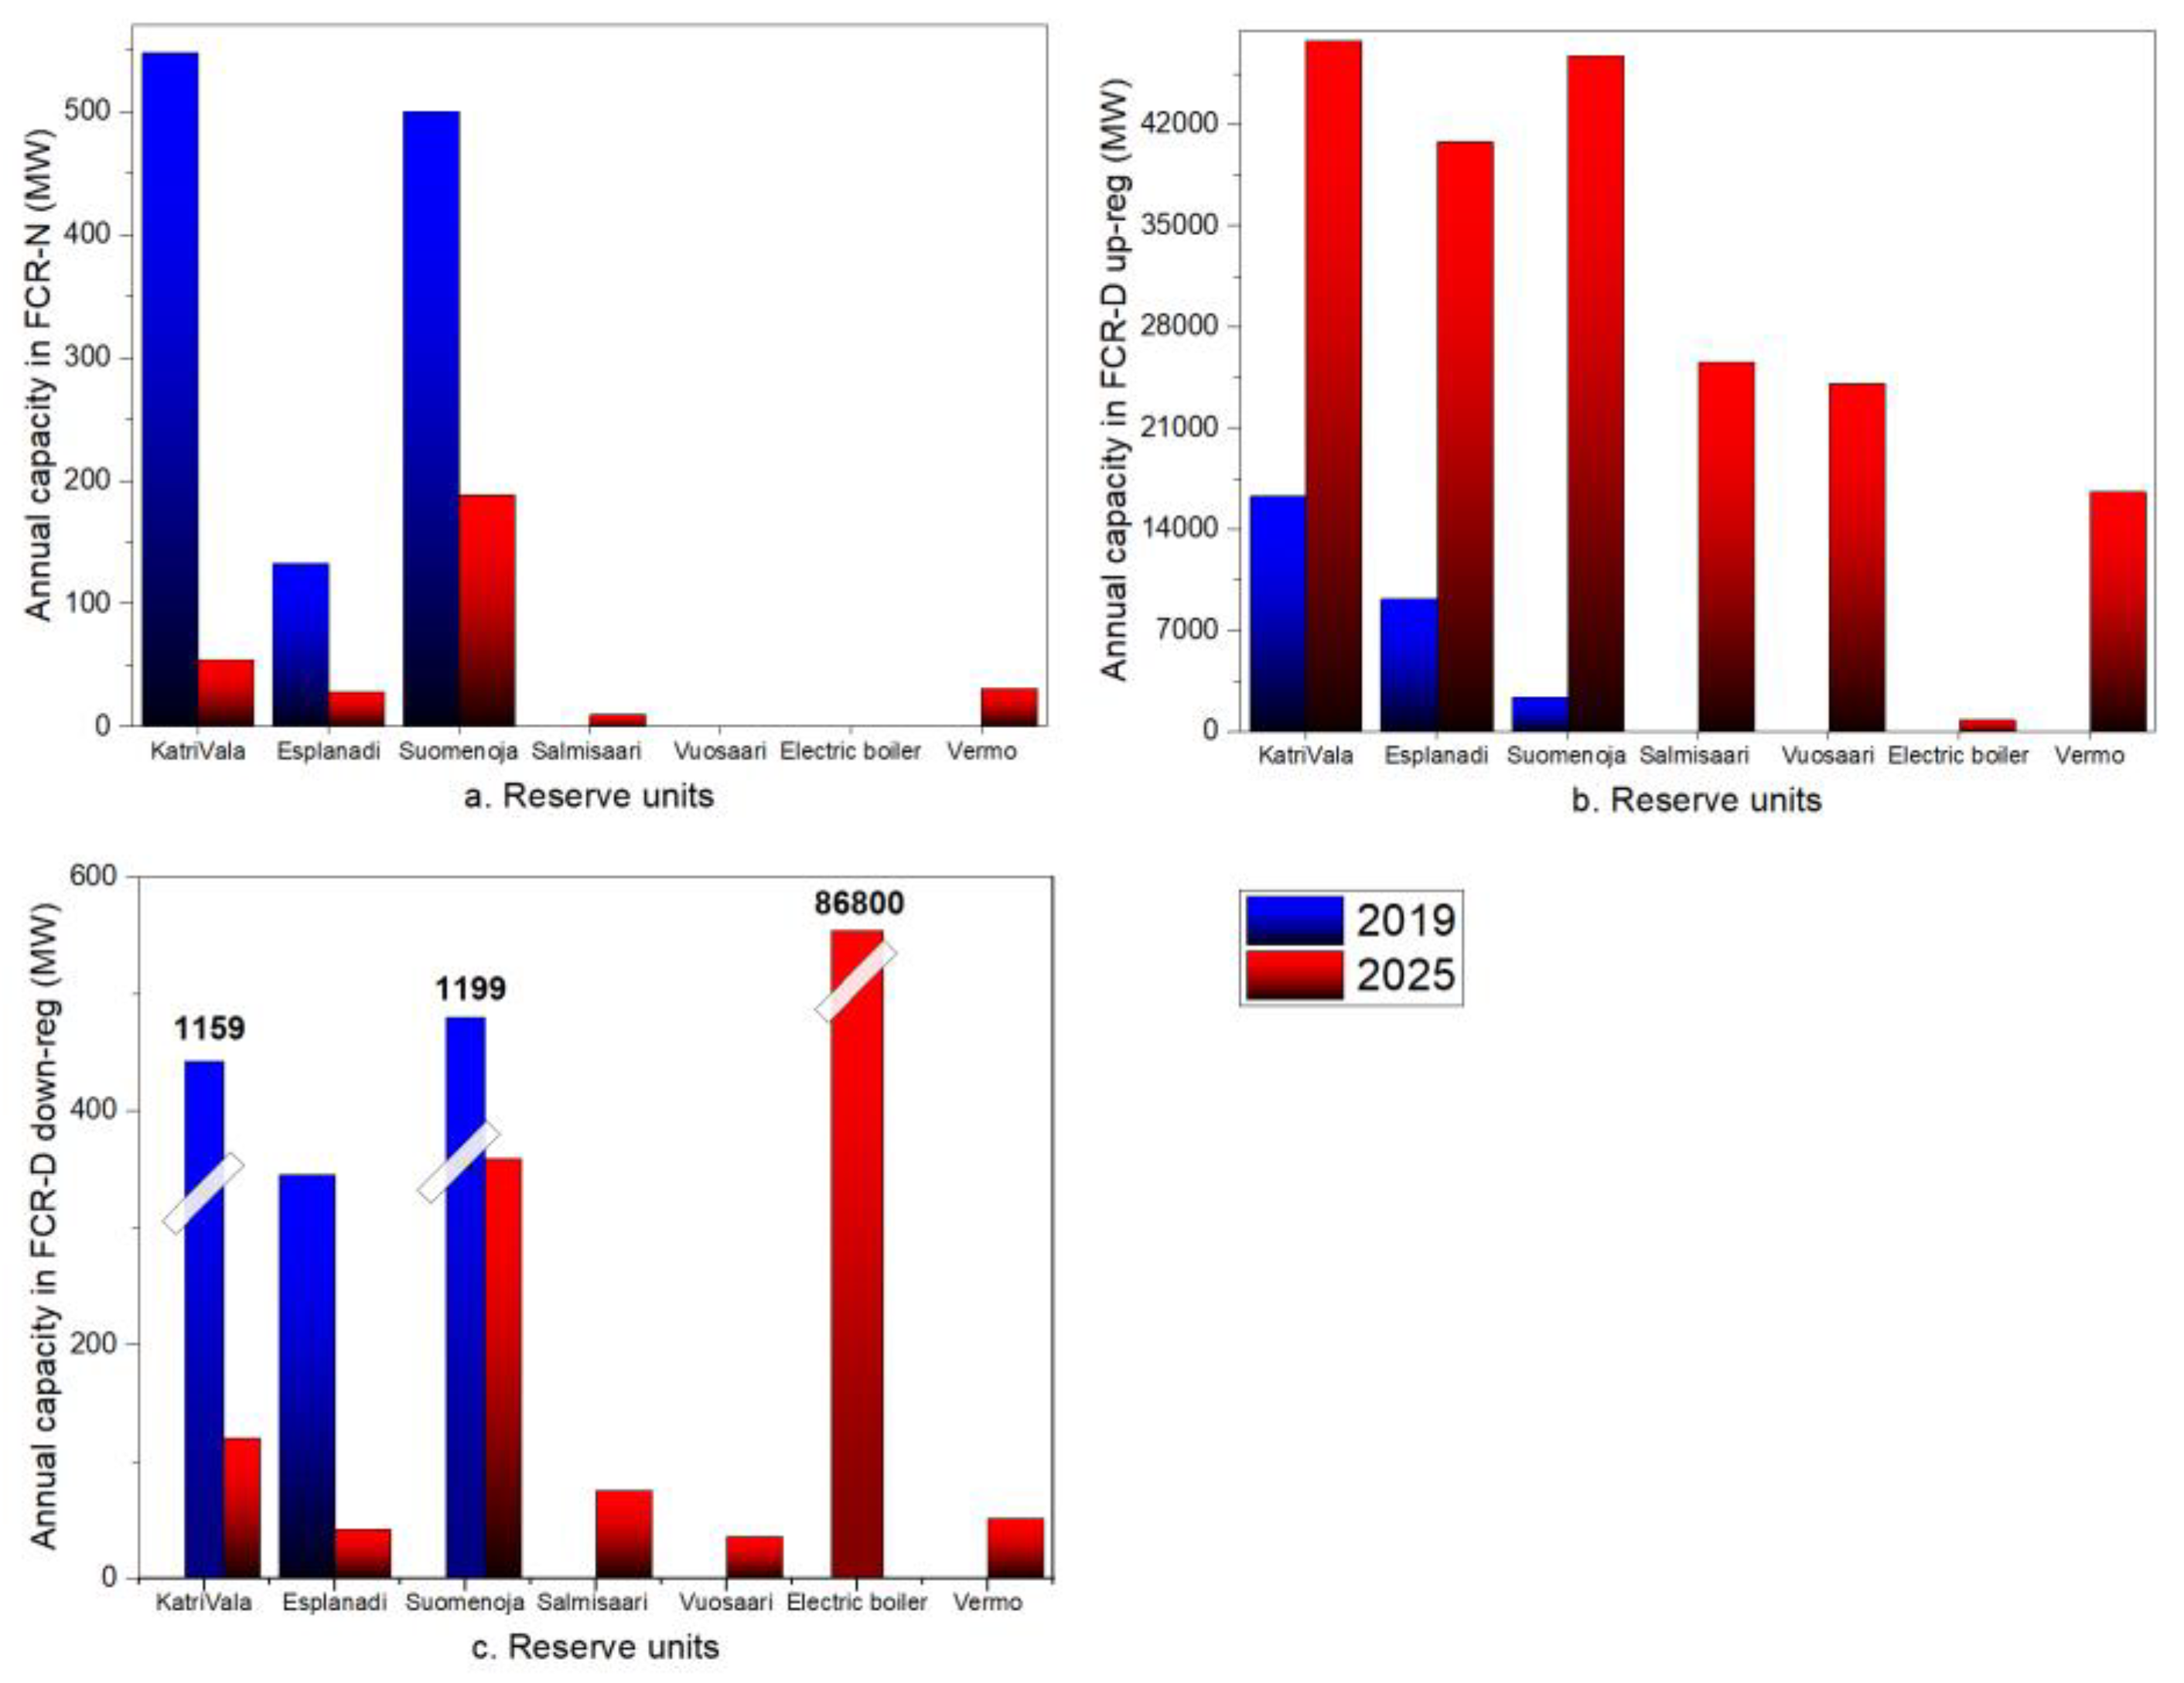
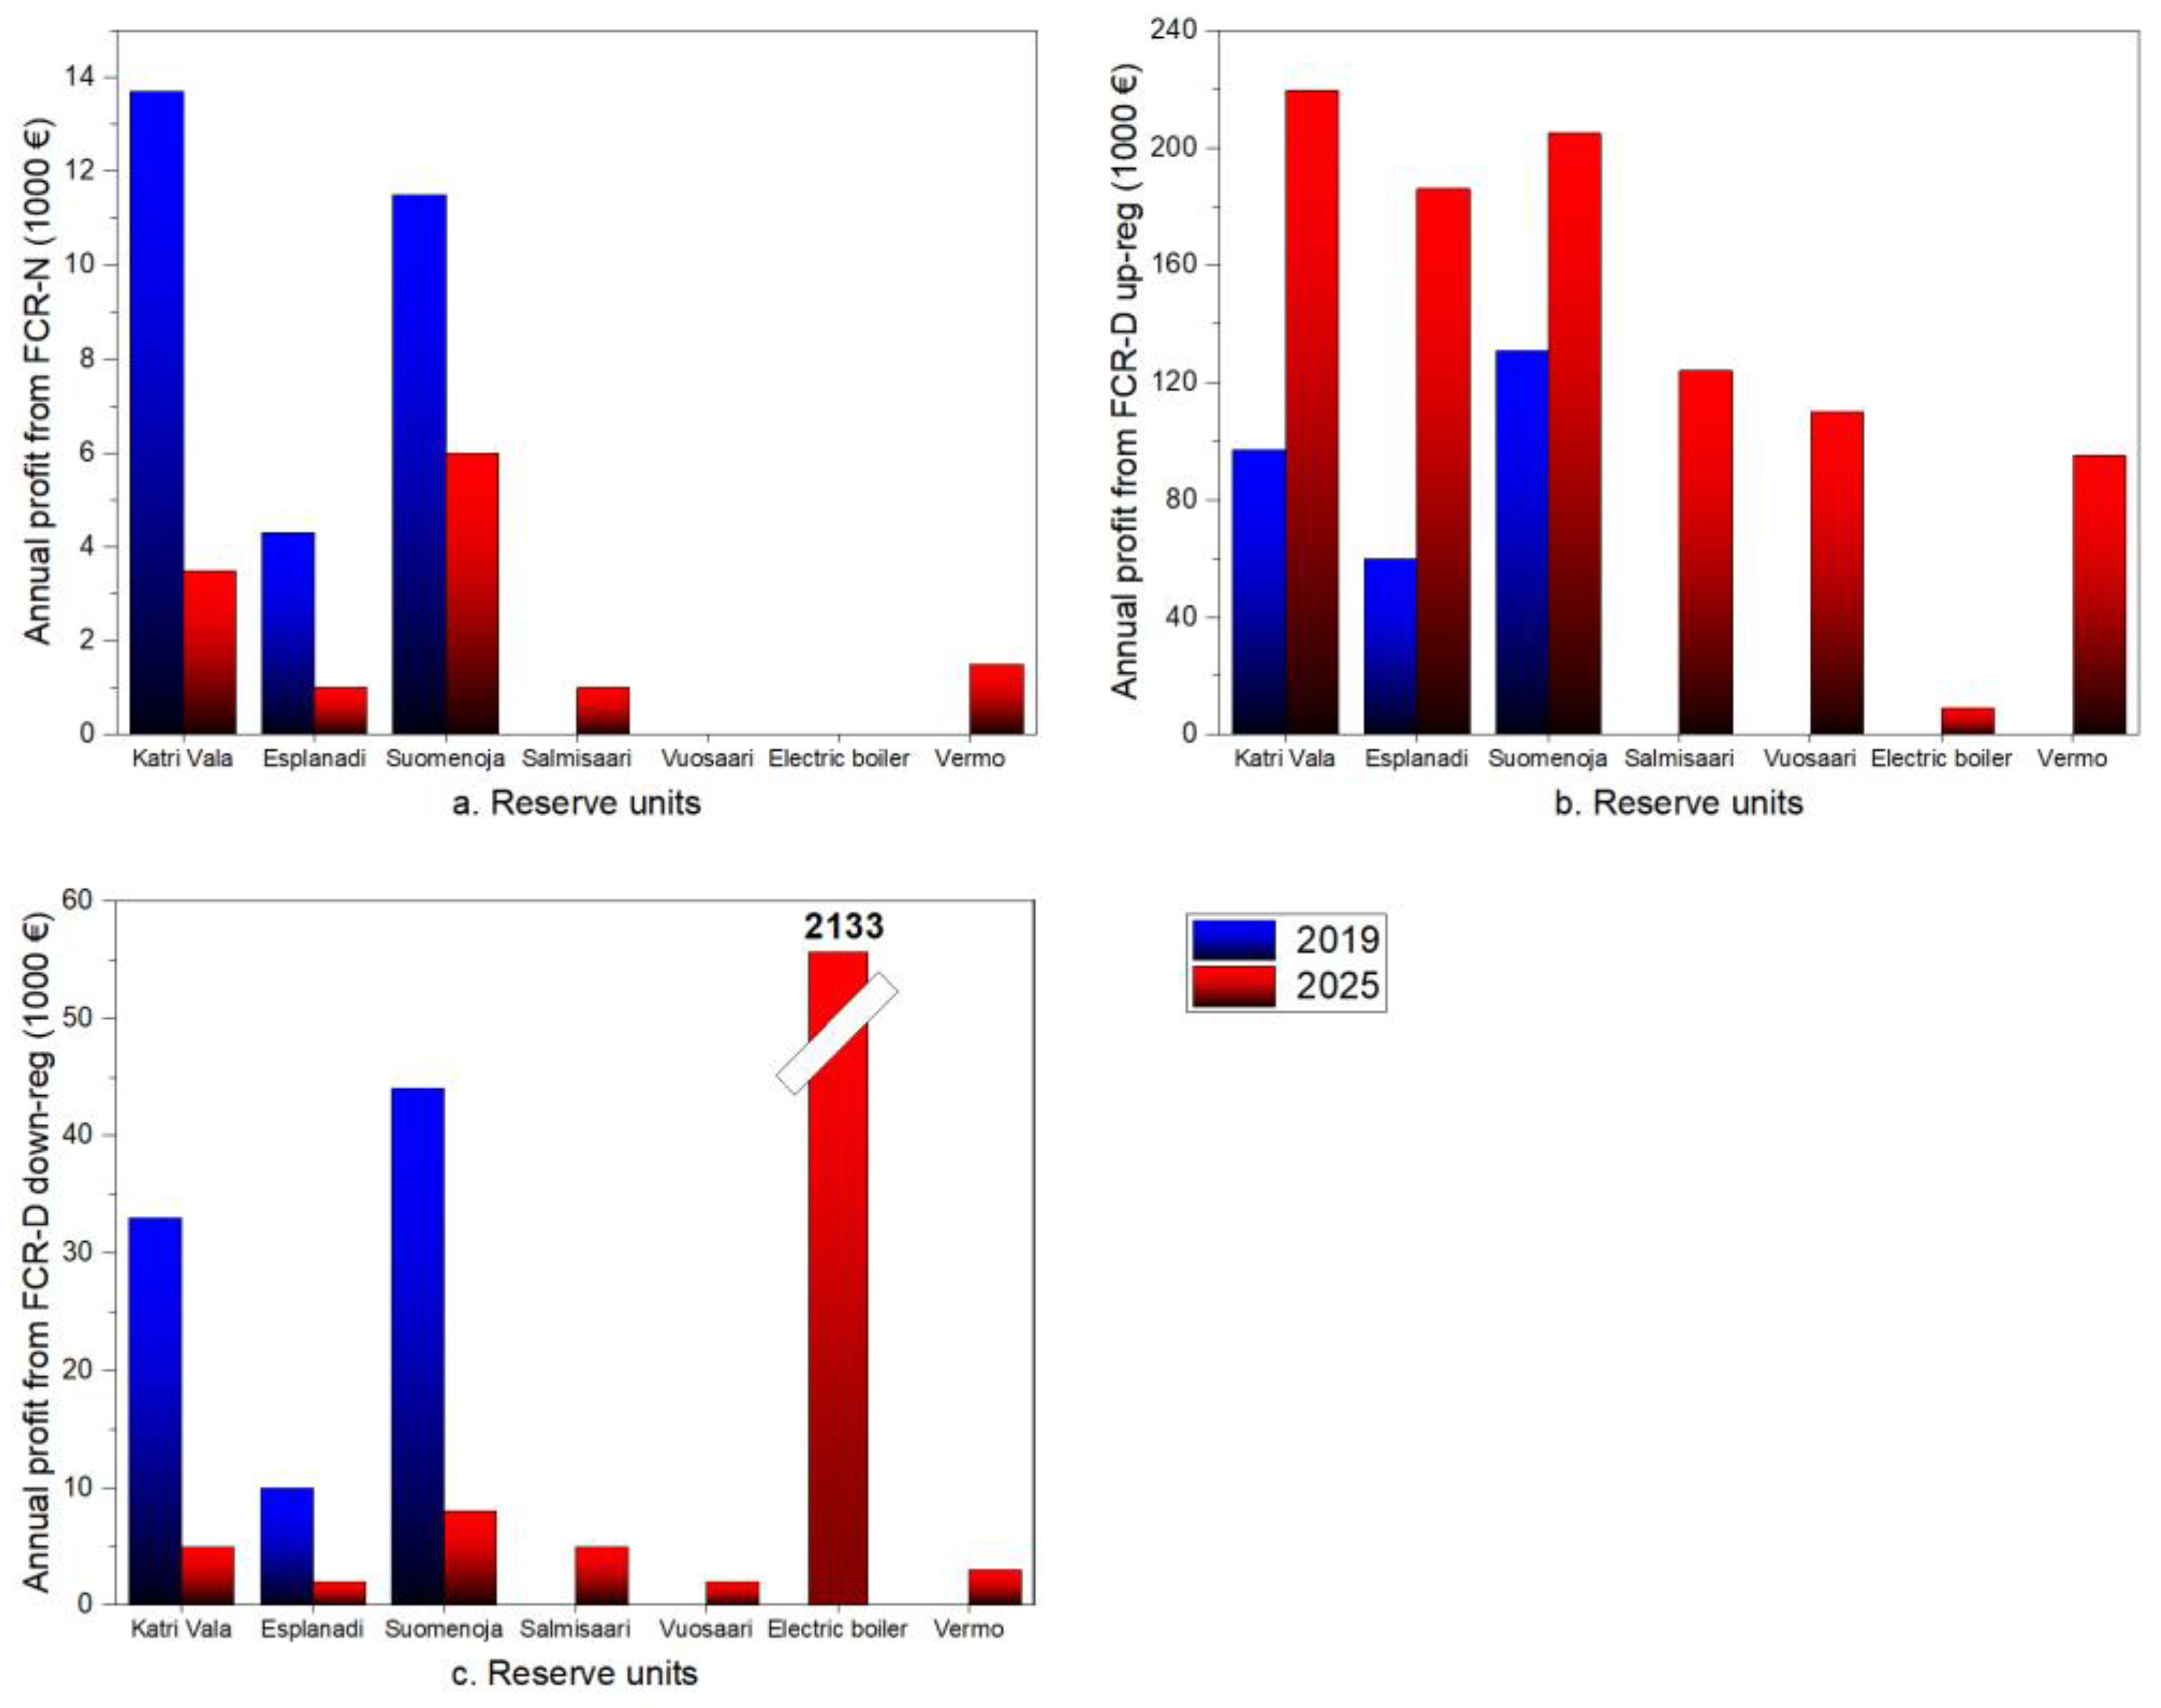
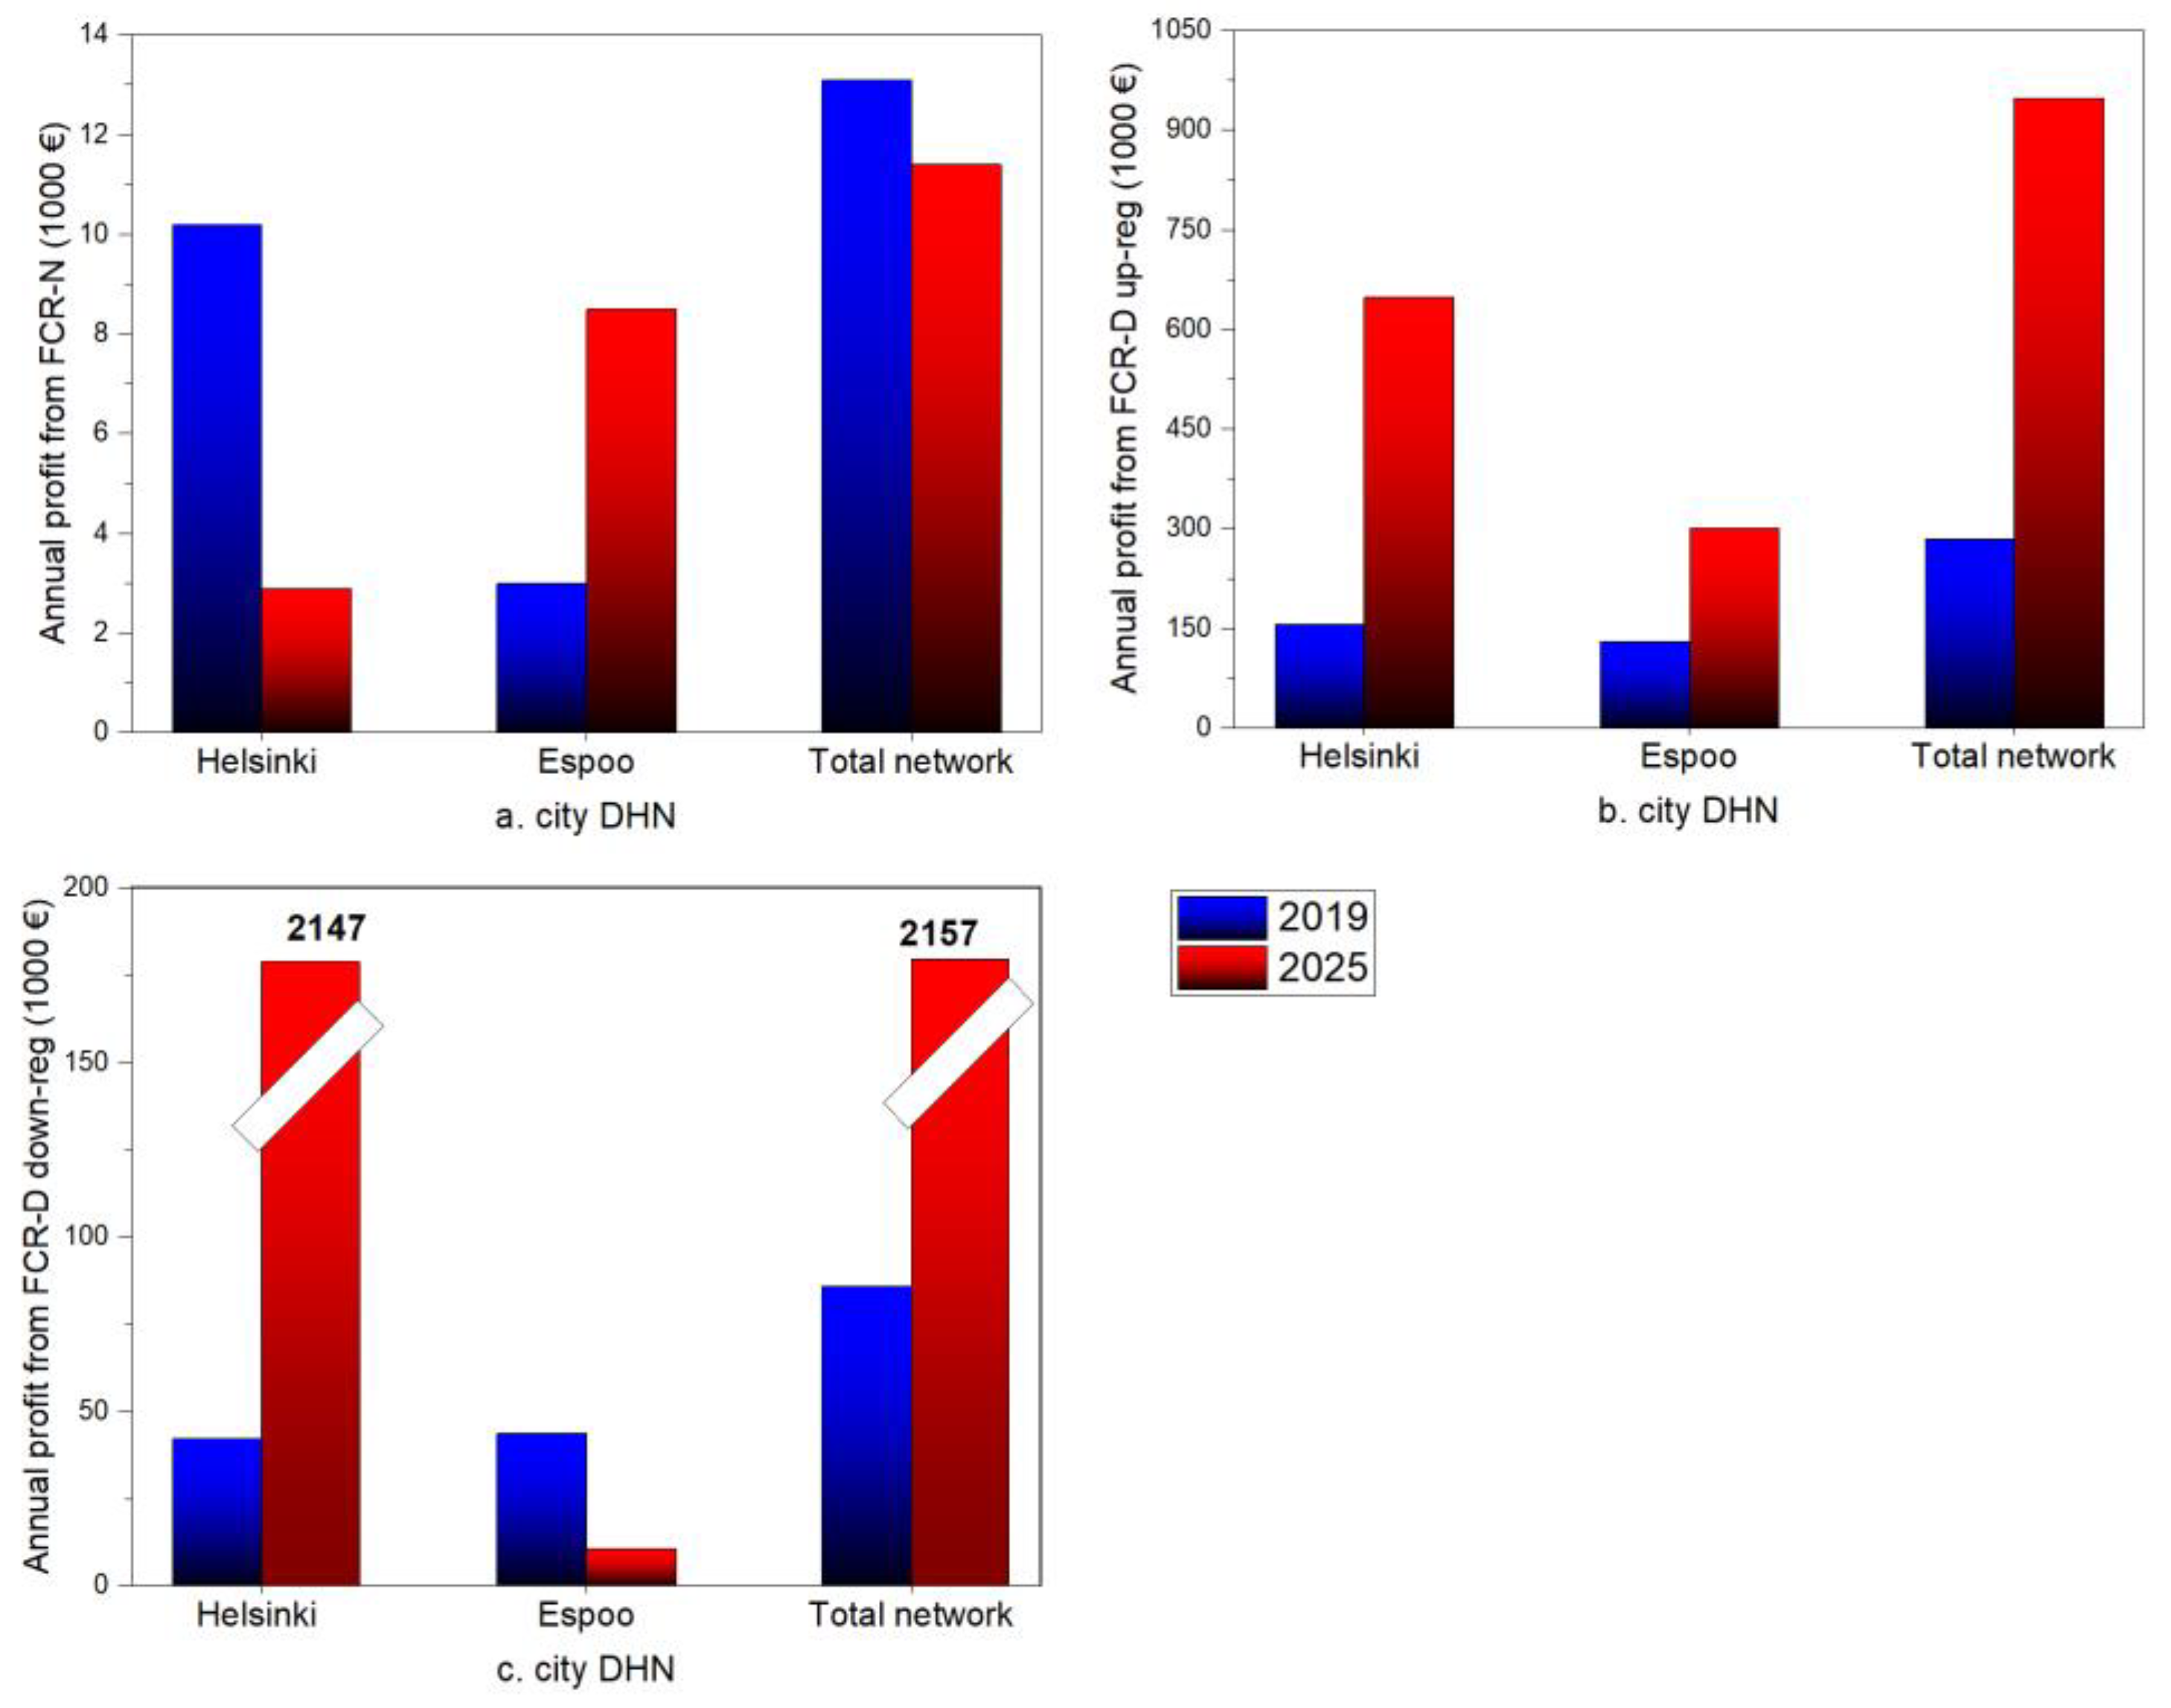
4. Conclusions
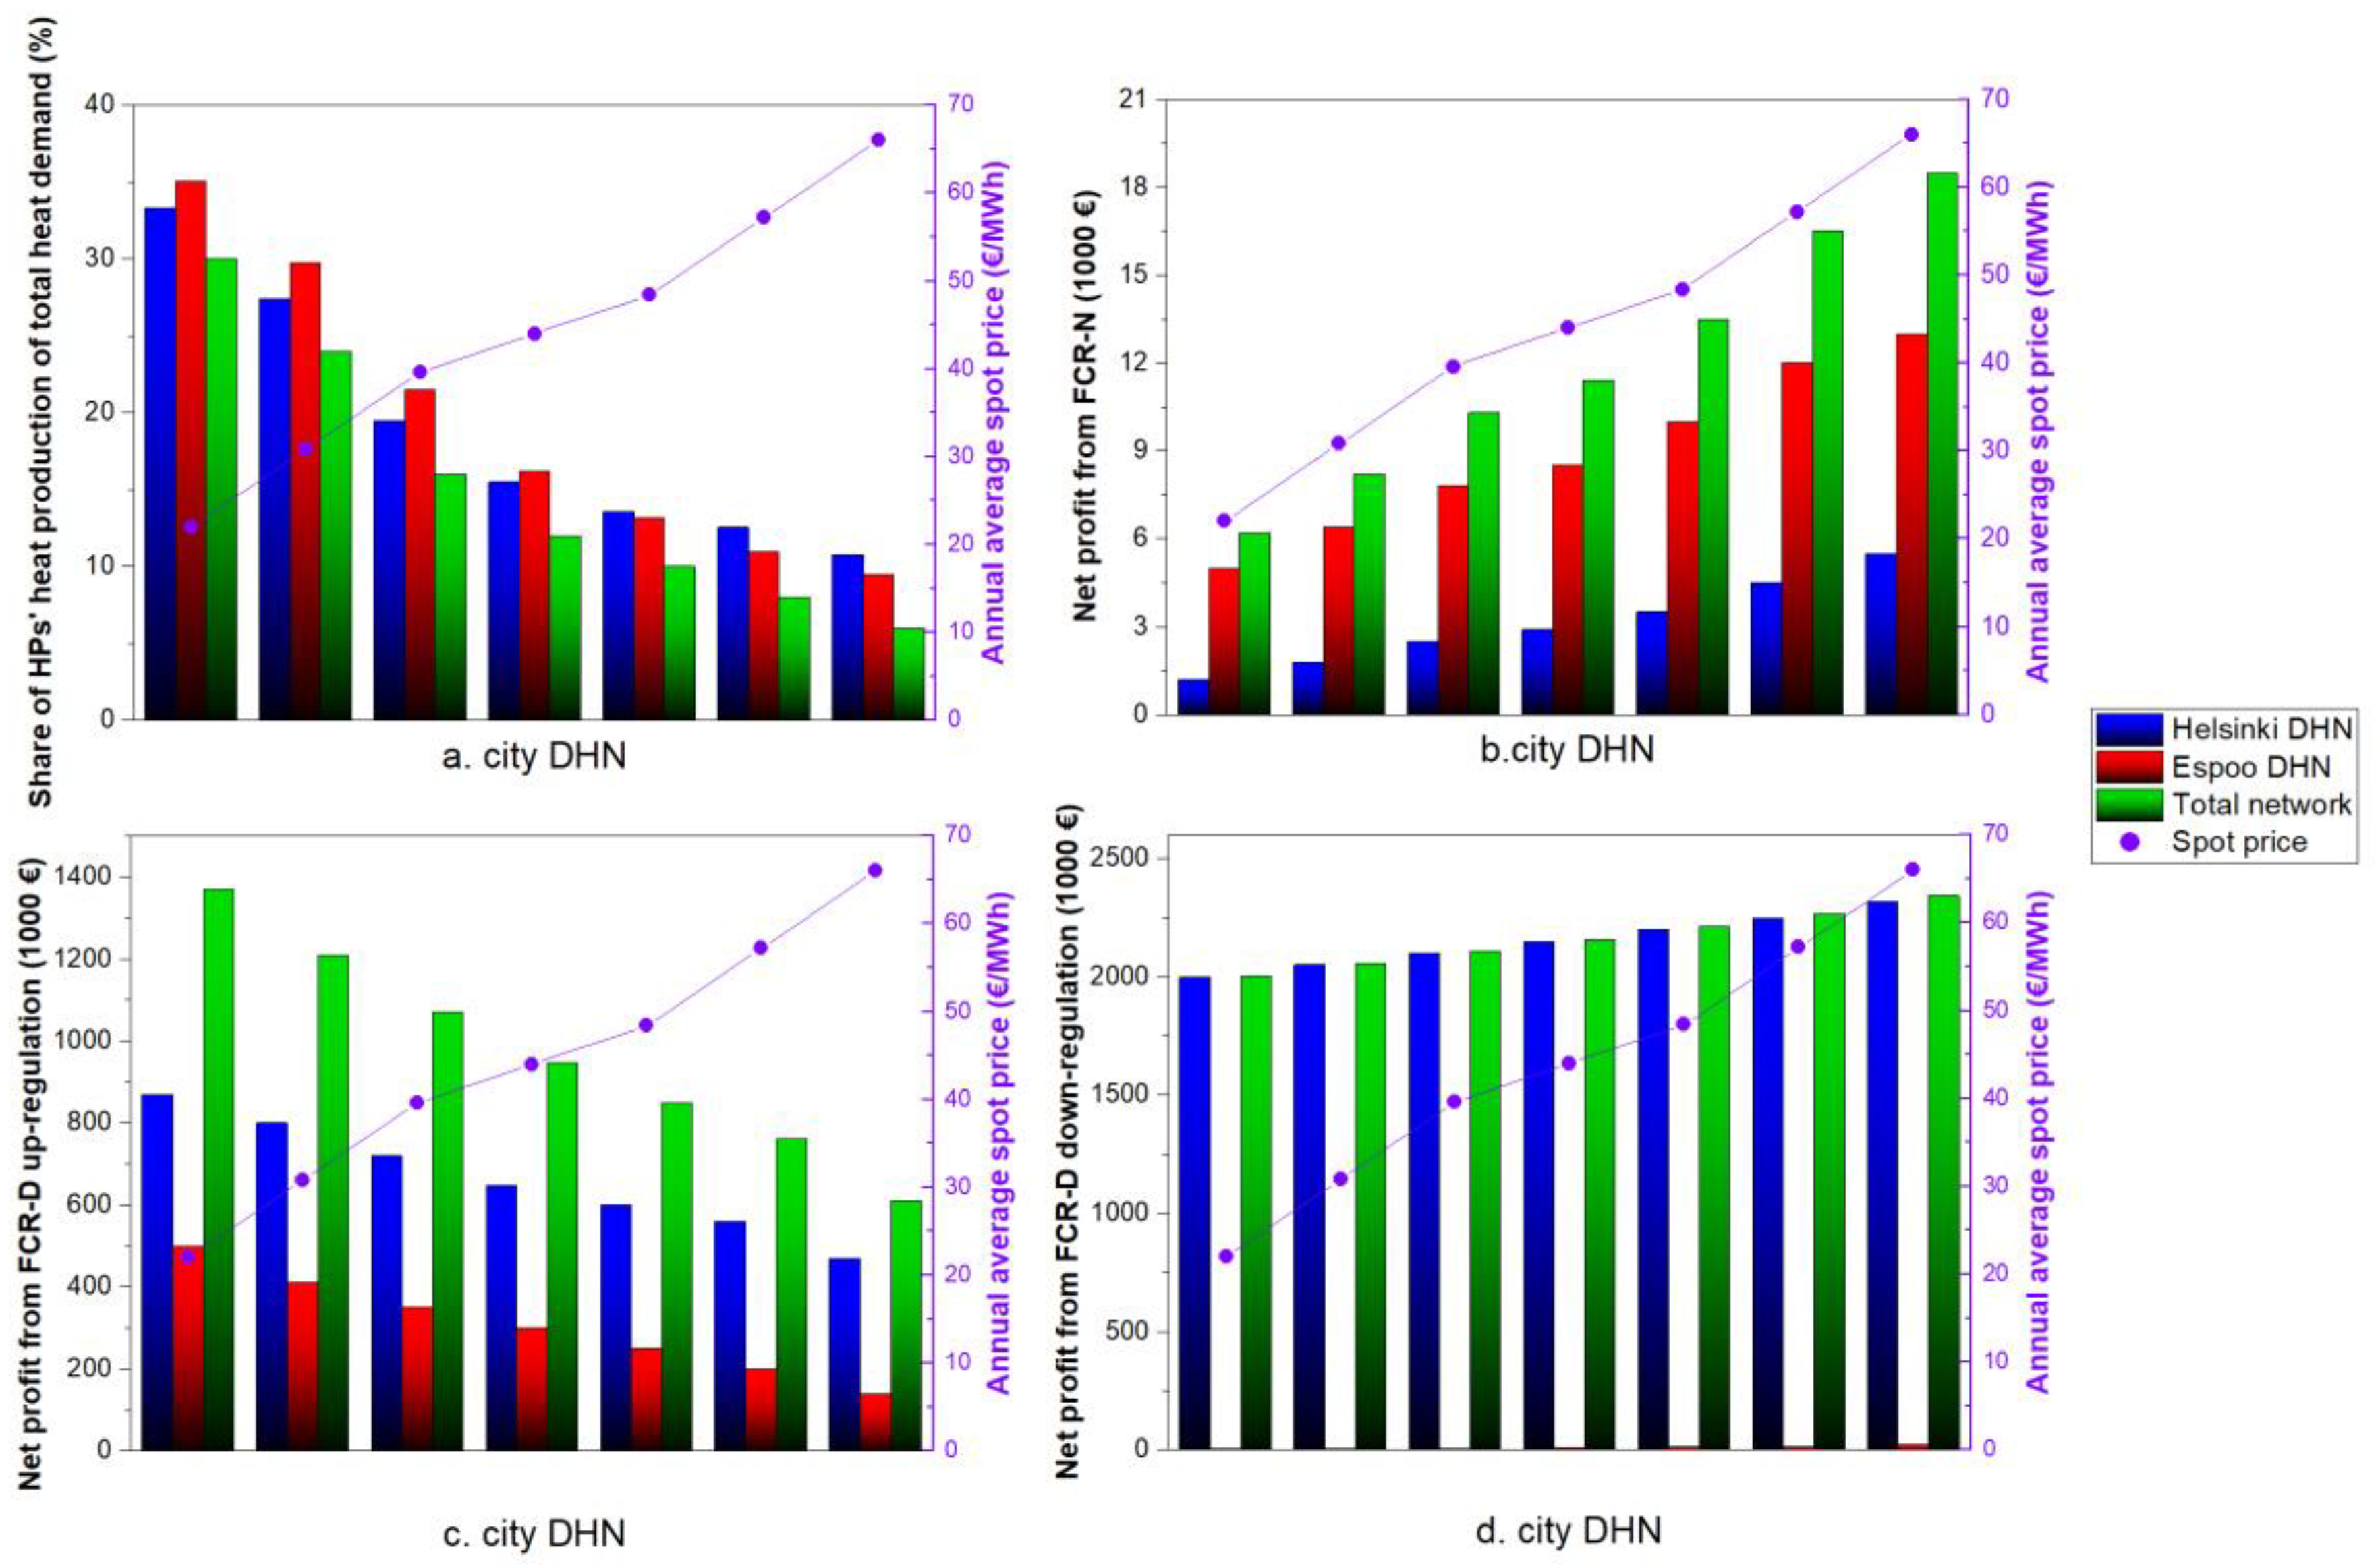
- Among the studied markets, the FCR-D up-regulation market is expected to be the most profitable balancing market for large HPs. In total, HPs’ achievable net profit could be 285,000 € and 940,000 € in the analyzed cases of 2019 and 2025 DHNs from this market. In both cases studied, the FCR-N market was the least profitable for HPs and electric boilers.
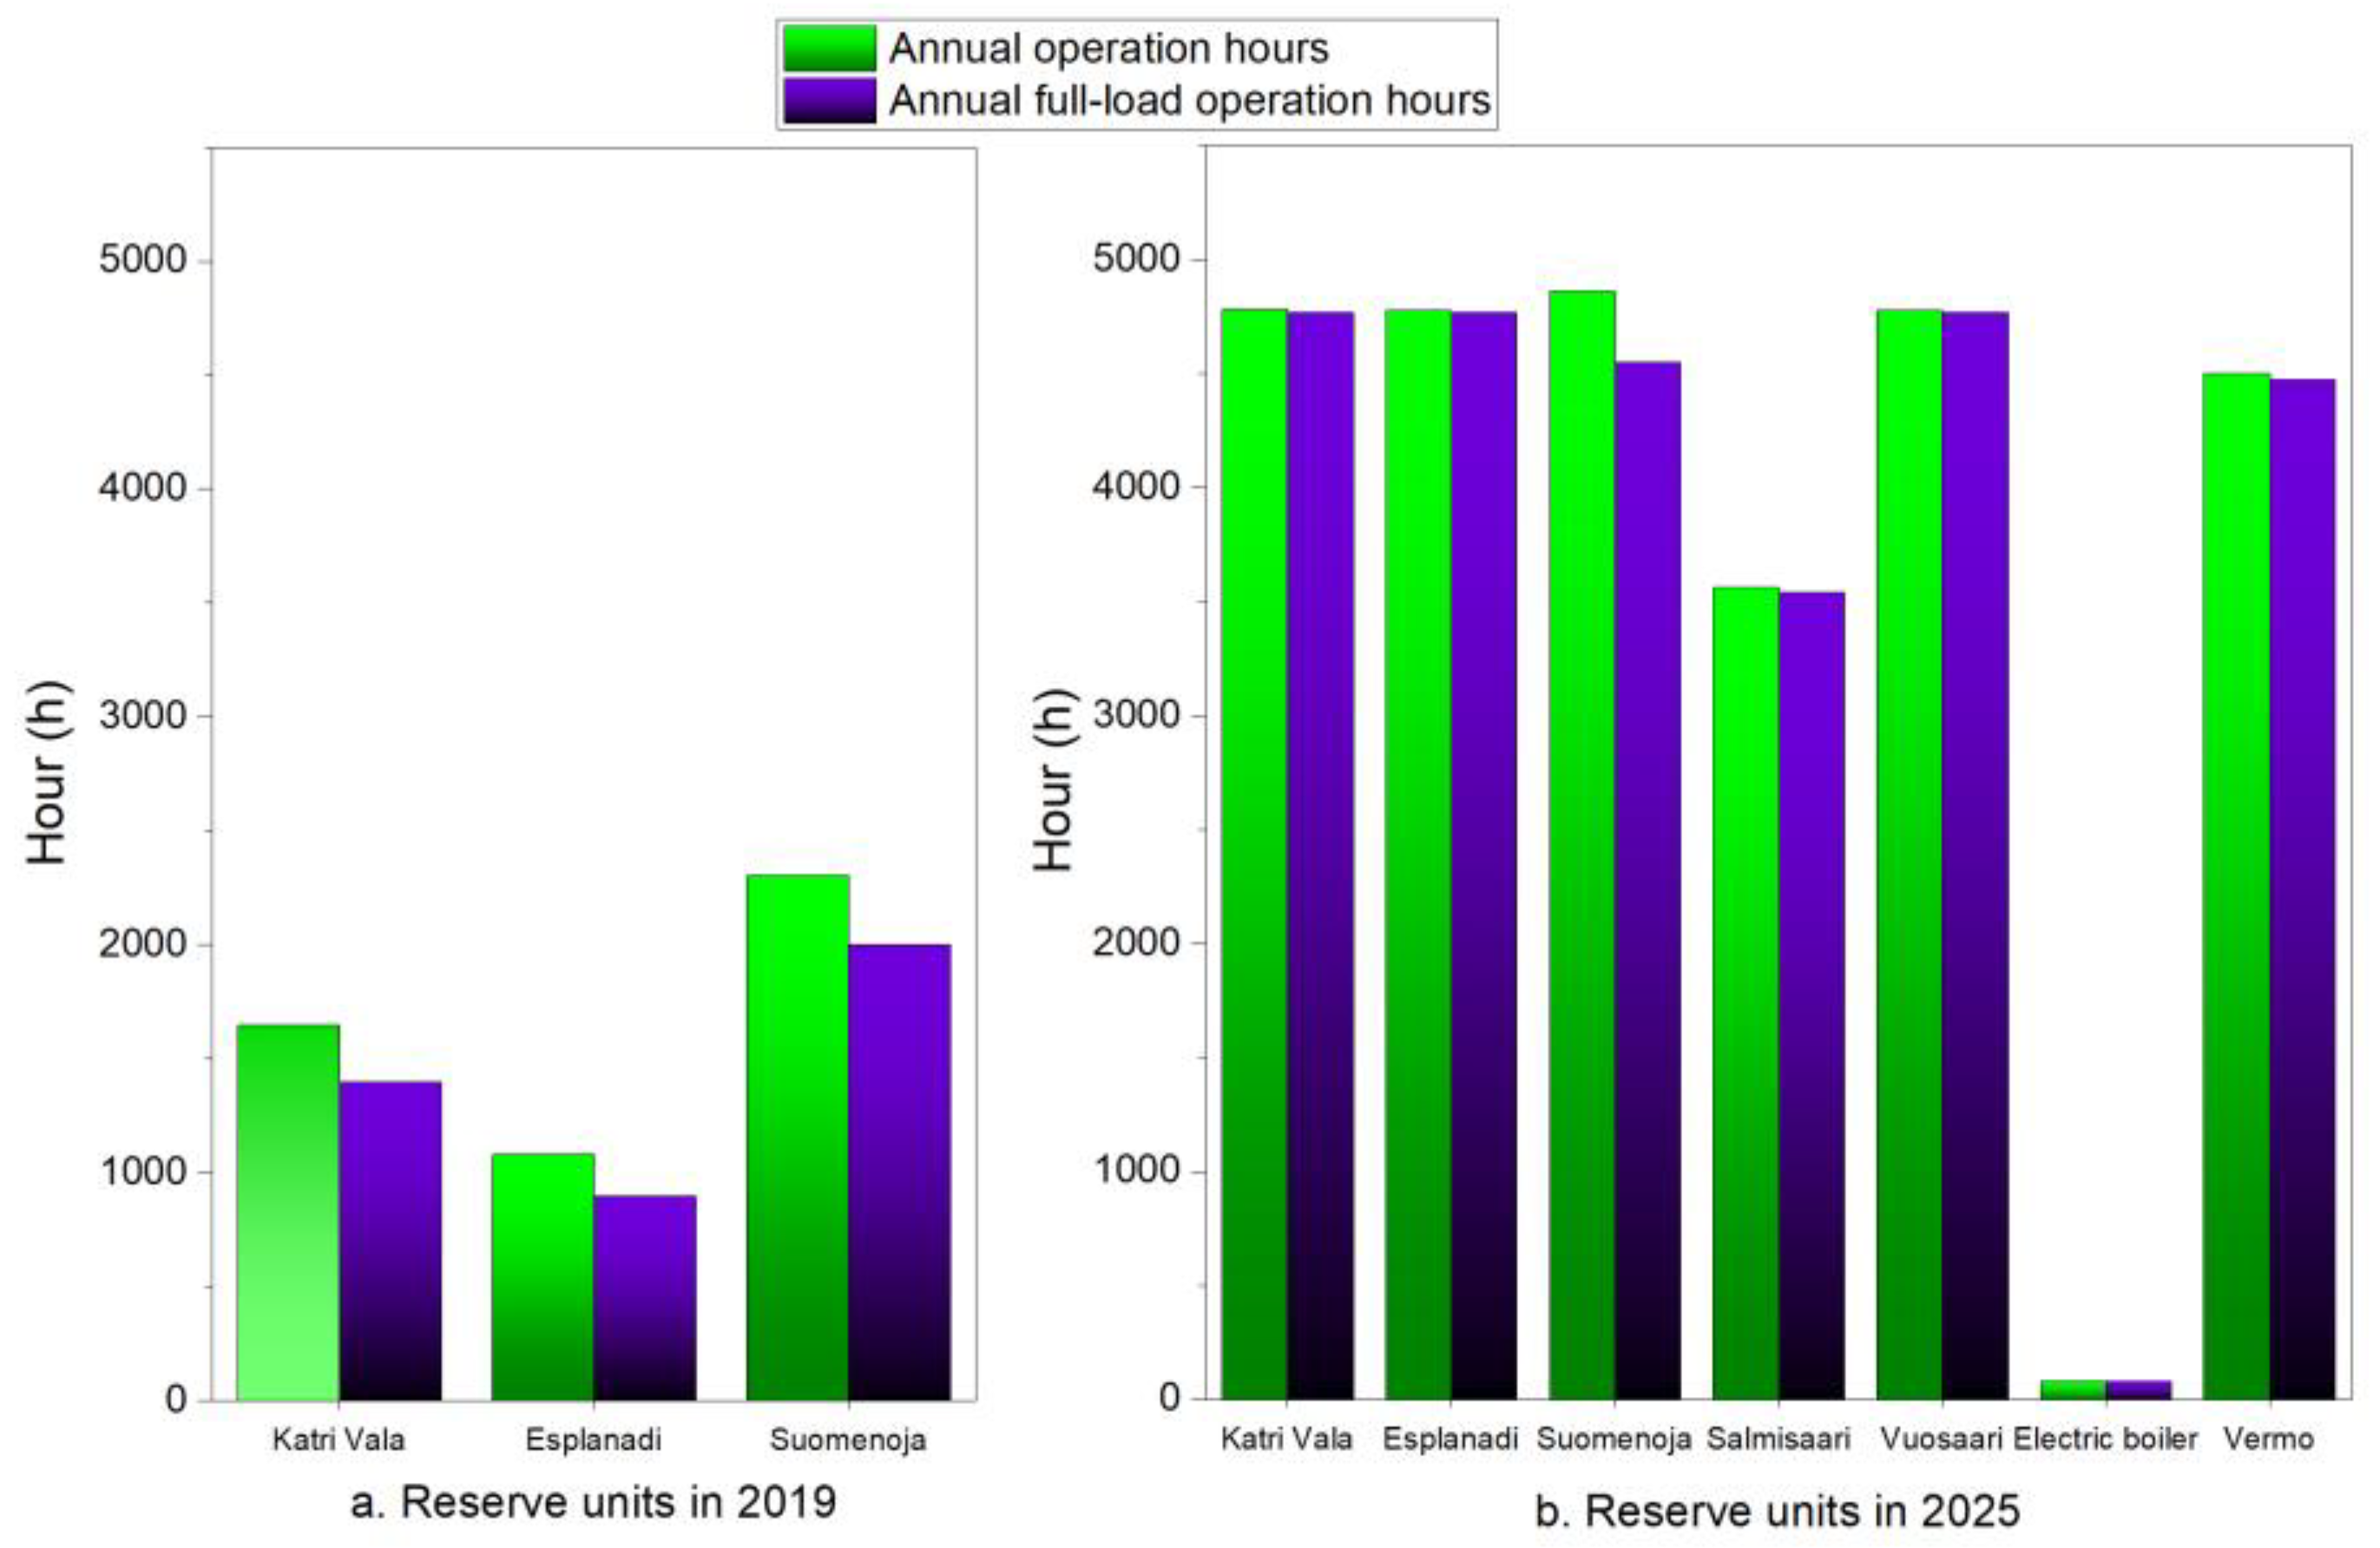
- Electric boilers, which have recently been introduced into Finnish DH systems, are being used during very low or negative day-ahead electricity prices. While the electric boiler in the case study DHN would be in operation only 1% of hours of 2025 in the day-ahead scheduling, it could provide a net profit of nearly 2.2 million € for the Helsinki DH system from FCR-D down-regulation market, yielding the largest individual benefits from the ancillary services markets studied.
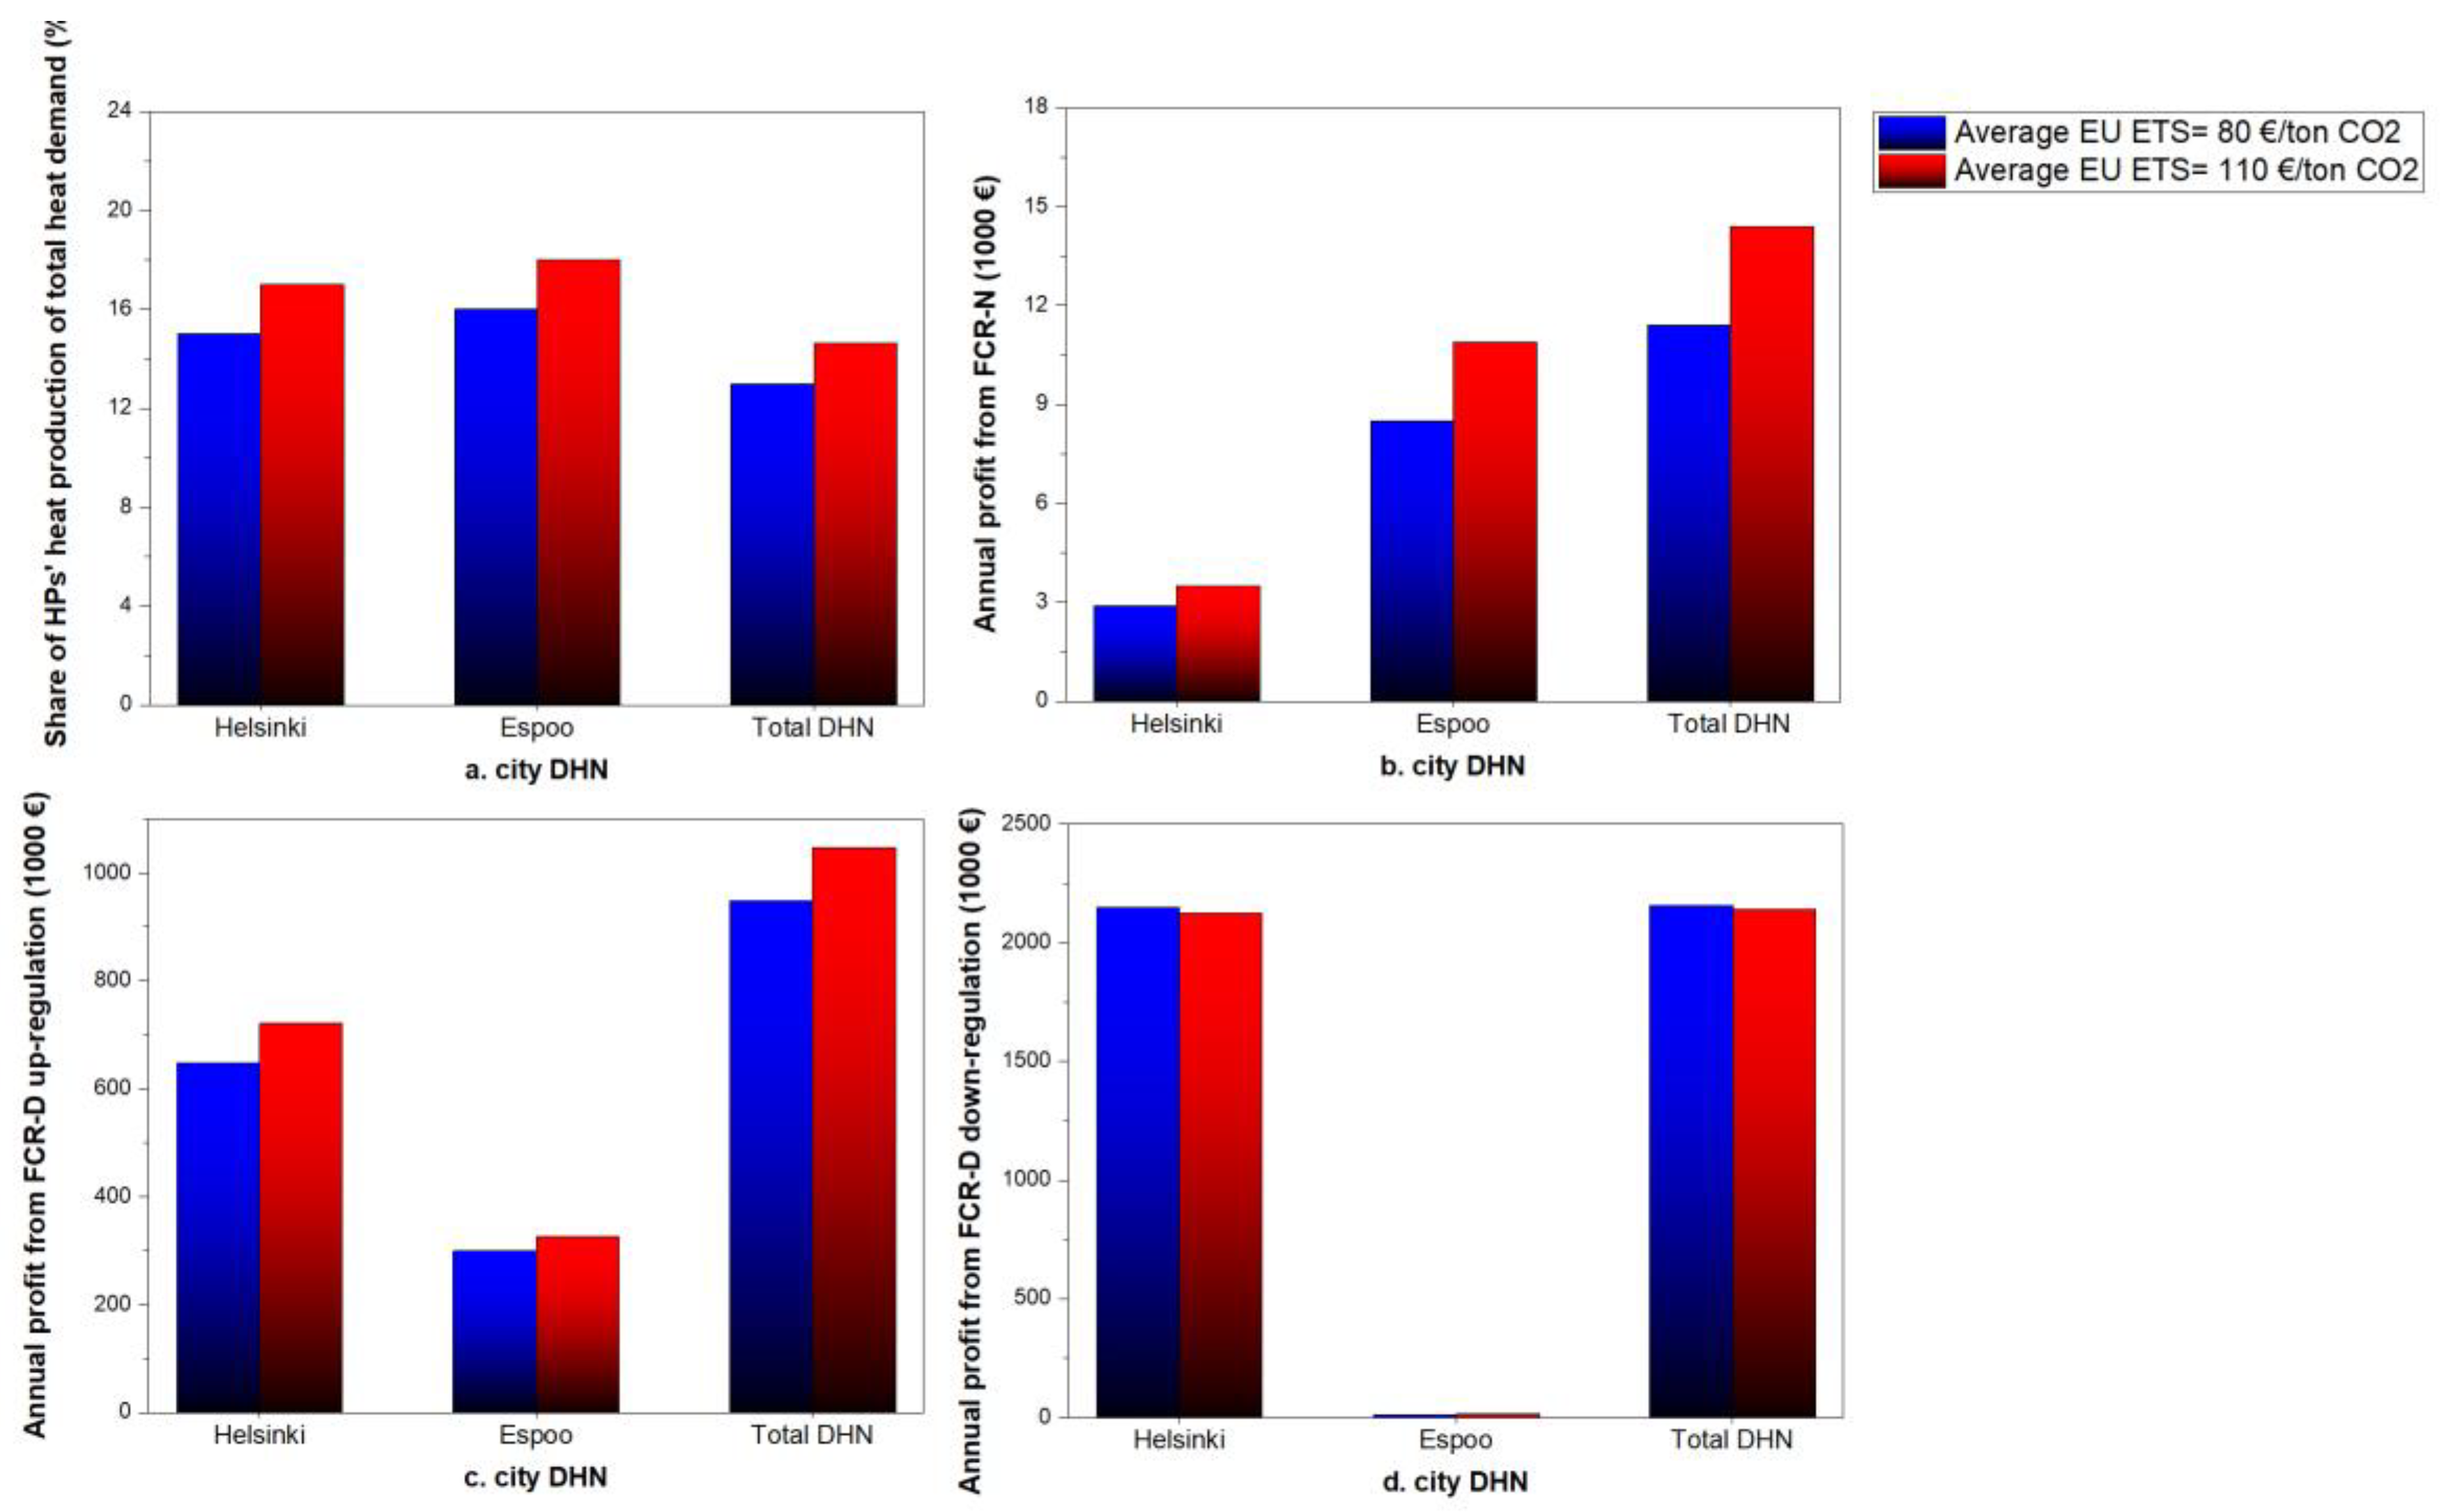
- Higher CO2 emission allowance prices (EU ETS prices) increase the net profit from FCR-N and FCR-D up-regulation markets. Considering the increasing trend of CO2 emission allowance prices in recent years, an increasing profit from these markets is expected in the upcoming years. The profit from FCR-D down-regulation market was found to decrease marginally with higher ETS prices.
Author Contributions
Funding
Conflicts of Interest
| Nomenclature | |||
| Indices | Abbreviations | ||
| Time | aFRR | Automatic frequency restoration reserve | |
| COP | Coefficient of performance | ||
| Parameters | CHP | Combined heat and power unit | |
| Measured frequency (HZ) | DHN | District heating network | |
| FCR-N Capacity Hourly Market Prices | EU ETS | European union emission trading system | |
| FCR-D Capacity Hourly Market Prices | FCR | Frequency containment reserve | |
| Down-Regulation Balancing Market Price | FCR-N | Frequency containment reserve for normal operation | |
| Up-Regulation Balancing Market Price | FCR-D | Frequency containment reserve for disturbances | |
| Electricity spot prices | FFR | Fast frequency reserve | |
| FLH | Full-load hour | ||
| Variables | HOB | Heat-only boiler | |
| Current setting of a reserve unit | HP | Heat pump | |
| Maximum electrical capacity | mFRR | Manual frequency restoration reserve | |
| Minimum electrical capacity | O&M | Operation and maintenance cost (€) | |
| Maintained capacity in FCR-N market | P2H | Power-to-heat | |
| Maintained capacity in FCR-D up-regulation market | TSO | Transmission system operator | |
| Maintained capacity in FCR-D down-regulation market | |||
| Maintained capacity in day-ahead market | |||
| Activated FCR-N capacity during 15-minute block | |||
| Activated down-ward capacity during 15-minute block | |||
| Activated up-ward capacity during 15-minute block | |||
Appendix A
| Parameter | Value (€/MWh) | |
|---|---|---|
| Fuel tax [44,45] | ||
| Coal | HOB | 29.2 |
| CHP | 21.5 | |
| Natural gas (NG) | HOB | 20.6 |
| CHP | 13.0 | |
| Light fuel oil (LFO) | - | 27.5 |
| Heavy fuel oil (HFO) | - | 24.5 |
| Fuel cost [34] | ||
| Coal | 7.8* | |
| NG | 23.2 * | |
| HFO | 54.1 * | |
| LFO | 76.2 * | |
| Bio-oil | 67.0 | |
| Wood pellet | 46.7 | |
| Forest chips | 22.2 | |
| Waste | -7.95 | |
| Electricity costs | ||
| Electricity spot price [31] | 44.0 ** | |
| Distribution cost | Helsinki [38] | 32.80 |
| Espoo [46] | 31.40 | |
| Electricity tax [44] | 6.9 | |
| CO2 price [47] (€/tonCO2) | 25 (2019) / 80 (2025) *** |
| Unit | Fuel | Thermal output (MW) |
|---|---|---|
| Existing | ||
| HOB | LFO | 136 |
| HOB | HFO | 873 |
| HOB | Coal | 170 |
| HOB | NG | 912 |
| HOB | Wood pellet | 92 |
| HP Katri Vala | Wastewater | 105 |
| HP Esplanadi | Wastewater | 22 |
| Hanasaari CHP | Mix (coal and biomass) | 420 |
| Salmisaari CHP | Mix (coal and biomass) | 300 |
| Vuosaari CHPs | NG | 587 |
| Thermal storage | - | 45000 m3 * |
| To be decommissioned by 2025 | ||
| HOB | Coal | 170 |
| Salmisaari CHP | Coal | 300 |
| Hanasaari CHP | Coal | 420 |
| To be deployed/expanded after 2019 | ||
| Vuosaari HOB | Biomass | 260 |
| Salmisaari HOB | Wood pellet | 150 |
| HP Salmisaari | Ambient air | 20 |
| HP Vuosaari | Sea water | 13 |
| HP Katri Vala | Wastewater | 155 |
| Electric boiler | Electricity | 280 |
| Thermal storage | - | 260000 m3 |
| Unit | Fuel | Thermal output (MW) |
| Existing | ||
| Suomenoja HPs (3, 4) | Wastewater | 70 |
| Vermo HOB | Bio-oil | 35 |
| Kivenlahti HOB | Wood pellets | 90 |
| HOB | LFO | 85 |
| HOB | NG | 456 |
| HOB | Coal | 80 |
| Thermal storage | - | 18000 m3 |
| Suomenoja 1 CHP | Coal | 160 |
| Suomenoja 2 CHP | NG | 214 |
| Suomenoja 6 CHP | NG | 80 |
| To be decommissioned by 2025 | ||
| Suomenoja 1 CHP | Coal | 160 |
| To be deployed/expanded after 2019 | ||
| Vermo HP | Ambient air | 11 |
| Kivenlahti HOB | Woodchips | 52 |
| Espoo Datacenter | Datacenter | 100 |
| Unit | Fuel | Thermal output (MW) |
| Existing | ||
| HOB | NG | 427 |
| HOB | LFO | 92 |
| Martinlaakso 1 CHP | Wood chips | 100 |
| Jätevoimala CHP waste | Waste | 140 |
| Martinlaakso 2 CHP | Wood chips | 135 |
| Martinlaakso 4 CHP | NG | 90 |
| To be deployed/ expanded after 2019 | ||
| Thermal storage | - | 1,000,000 m3 |
| Martinlaakso CHP | Wood chips | 22.5 |
| HOB | Waste | 64 |
| Fuel consumption (GWh) | Helsinki DHN | Espoo DHN | Vantaa DHN | |||
|---|---|---|---|---|---|---|
| Real situation | Simulation | Real situation | Simulation | Real situation | Simulation | |
| Coal | 6500 | 5500 | 2042 | 1800 | 60, | 850 |
| Natural Gas | 5000 | 6800 | 729 | 1300 | 245 | 350 |
| Oil | 106 | 0 | 4.6 | 1.0 | 1.5 | 0.9 |
| Bio | 226 | 350 | 244 | 150 | 533 | 680 |
| Waste | 0 | 0 | 0 | 0 | 1120 | 1137 |
| Electricity | 133.6 | 95 | 180 | 55 | 0 | 0 |
| Total | 11965 | 12745 | 3200 | 3306 | 2500 | 2247 |
References
- United Nations, Climate Change: The Paris Agreement | UNFCCC n.d. https://unfccc.int/process-and-meetings/the-paris-agreement/the-paris-agreement (accessed June 22, 2021).
- European Climate Law n.d. https://ec.europa.eu/clima/eu-action/european-green-deal/european-climate-law_en (accessed December 4, 2021).
- Finland’s Integrated Energy and Climate Plan. työ- ja elinkeinoministeriö; 2019.
- Cramton P. Electricity market design. Oxf Rev Econ Policy 2017;33:589–612. [CrossRef]
- van der Veen RAC, Hakvoort RA. The electricity balancing market: Exploring the design challenge. Util Policy 2016;43:186–94. [CrossRef]
- Nuclear power to the reserve market - ePressi n.d. https://www.epressi.com/tiedotteet/energia/ydinvoima-mukaan-reservimarkkinoille.html (accessed May 15, 2023).
- Hae Tuulivoima reservimarkkinoille -pilottiin 16.1.2023 mennessä - ePressi n.d. https://www.epressi.com/tiedotteet/energia/hae-tuulivoima-reservimarkkinoille-pilottiin-16.1.2023-mennessa.html (accessed May 15, 2023).
- Fingrid-Reserves and balancing power n.d. https://www.fingrid.fi/en/electricity-market/reserves_and_balancing/ (accessed December 5, 2021).
- Pudjianto D, Djapic P, Aunedi M, Gan CK, Strbac G, Huang S, et al. Smart control for minimizing distribution network reinforcement cost due to electrification. Energy Policy 2013;52:76–84. [CrossRef]
- Baeten B, Rogiers F, Helsen L. Reduction of heat pump induced peak electricity use and required generation capacity through thermal energy storage and demand response. Appl Energy 2017;195:184–95. [CrossRef]
- Vanhoudt D, Geysen D, Claessens B, Leemans F, Jespers L, van Bael J. An actively controlled residential heat pump: Potential on peak shaving and maximization of self-consumption of renewable energy. Renew Energy 2014;63:531–43. [CrossRef]
- Cooper SJG, Hammond GP, McManus MC, Rogers JG. Impact on energy requirements and emissions of heat pumps and micro-cogenerators participating in demand side management. Appl Therm Eng 2014;71:872–81. [CrossRef]
- Melsas R, Rosin A, Drovtar I. Value Stream Mapping for Evaluation of Load Scheduling Possibilities in a District Heating Plant. Transactions on Environment and Electrical Engineering 2016;1:62–7. [CrossRef]
- Meesenburg W, Ommen T, Elmegaard B. Dynamic exergoeconomic analysis of a heat pump system used for ancillary services in an integrated energy system. Energy 2018;152:154–65. [CrossRef]
- Terreros O, Spreitzhofer J, Basciotti D, Schmidt RR, Esterl T, Pober M, et al. Electricity market options for heat pumps in rural district heating networks in Austria. Energy 2020;196:116875. [CrossRef]
- Javanshir N, Hiltunen P, Syri S. Is Electrified Low-Carbon District Heating Able to Manage Electricity Price Shocks? International Conference on the European Energy Market, EEM 2022;2022-September. [CrossRef]
- Javanshir N, Syri S, Teräsvirta A, Olkkonen V. Abandoning peat in a city district heat system with wind power, heat pumps, and heat storage. Energy Reports 2022;8:3051–62. [CrossRef]
- Finnish energy. District heating statistics n.d. https://energia.fi/en/newsroom/publications/district_heating_statistics.html#material-view (accessed February 18, 2022).
- Power plants | Helen n.d. https://www.helen.fi/en/company/energy/energy-production/power-plants (accessed February 1, 2023).
- Tomita K, Ito M, Hayashi Y, Yagi T, Tsukada T. Electricity Adjustment by Aggregation Control of Multiple District Heating and Cooling Systems. Energy Procedia 2018;149:317–26. [CrossRef]
- Boldrini A, Jiménez Navarro JP, Crijns-Graus WHJ, van den Broek MA. The role of district heating systems to provide balancing services in the European Union. Renewable and Sustainable Energy Reviews 2022;154:111853. [CrossRef]
- Javanshir N, Syri S, Tervo S, Rosin A. Operation of district heat network in electricity and balancing markets with the power-to-heat sector coupling. Energy 2023;266:126423. [CrossRef]
- Wang J, You S, Zong Y, Traeholt C, Zhou Y, Mu S. Optimal dispatch of combined heat and power plant in integrated energy system: A state of the art review and case study of Copenhagen. Energy Procedia 2019;158:2794–9. [CrossRef]
- Haakana J, Tikka V, Lassila J, Partanen J. Methodology to analyze combined heat and power plant operation considering electricity reserve market opportunities. Energy 2017;127:408–18. [CrossRef]
- Fingrid n.d. https://www.fingridlehti.fi/en/finland-switching-to-15-minute-imbalance-settlement/#e2892316 (accessed February 21, 2023).
- Jaakamo N. Impact of the 15-Minute Imbalance Settlement Period and Electricity Storage on an Independent Wind Power Producer 2020.
- Nordpool. Day-Ahead Prices n.d. https://www.nordpoolgroup.com/Market-data1/#/nordic/table (accessed April 12, 2021).
- eSett in Brief | Nordic Imbalance Settlement | eSett n.d. https://www.esett.com/about/esett-in-brief/ (accessed February 21, 2023).
- eSett’s 15 min ISP Commissioning Plan has been published - eSett n.d. https://www.esett.com/news/esetts-15-min-isp-commissioning-plan-has-been-published/ (accessed February 21, 2023).
- Energy Year 2022 - Electricity - Energiateollisuus n.d. https://energia.fi/en/newsroom/publications/energy_year_2022_-_electricity.html#material-view (accessed May 16, 2023).
- Nordpool, Day-ahead market n.d. https://www.nordpoolgroup.com/the-power-market/Day-ahead-market/ (accessed December 4, 2021).
- EMD International A/S, EnergyPRO n.d. https://www.emd.dk/energypro/ (accessed March 23, 2020).
- Østergaard PA, Andersen AN, Sorknæs P. The business-economic energy system modelling tool energyPRO. Energy 2022;257:124792. [CrossRef]
- Statistics Finland- Energy prices n.d. https://www.stat.fi/til/ehi/kuv_en.html (accessed March 23, 2022).
- EU Emissions Trading System (EU ETS) | Climate Action n.d. https://ec.europa.eu/clima/policies/ets_en (accessed March 23, 2021).
- Finnish Meteorological Institute. Weather Data n.d. https://en.ilmatieteenlaitos.fi/ (accessed April 12, 2021).
- Patronen J, Kaura E, Torvestad C. Nordic heating and cooling. Nordic Council of Ministers; 2017. [CrossRef]
- Su Y, Hiltunen P, Syri S, Khatiwada D. Decarbonization strategies of Helsinki metropolitan area district heat companies. Renewable and Sustainable Energy Reviews 2022;160:112274. [CrossRef]
- Energinet Elsystemansvar A/S Document type 2019.
- Technology Data. Danish Energy Agency 2016. https://ens.dk/en/our-services/projections-and-models/technology-data (accessed April 12, 2021).
- Nordpool-Intraday market n.d. https://www.nordpoolgroup.com/the-power-market/Intraday-market/ (accessed December 5, 2021).
- Fortum n.d. https://www.fortum.com/files/fortum-sustainability-2020/download (accessed March 23, 2022).
- Vantaan Energia n.d. https://www.vantaanenergia.fi/ (accessed February 1, 2023).
- Tax rates on electricity and fuels - vero.fi n.d. https://www.vero.fi/en/businesses-and-corporations/taxes-and-charges/excise-taxation/sahkovero/Tax-rates-on-electricity-and-certain-fuels/ (accessed March 23, 2022).
- Electricity production and in combined production of heat and electricity - vero.fi n.d. https://www.vero.fi/en/businesses-and-corporations/taxes-and-charges/excise-taxation/excise-duty-refunds/electricity-production-and-in-combined-production-of-heat-and-electricity/ (accessed April 12, 2022).
- Caruna Oy-Network service and connection fee rates for the high-voltage distribution network n.d.
- Carbon Price Viewer - Ember n.d. https://ember-climate.org/data/carbon-price-viewer/ (accessed June 13, 2021).
- Espoo Clean Heat | Fortum n.d. https://www.fortum.com/products-and-services/heating-cooling/espoo-clean-heat (accessed February 1, 2023).

| Up-Regulation | No Regulations | Down-Regulation | |
| Up-regulation price | 80 | 70 | 90 |
| Day-ahead price | 70 | 70 | 90 |
| Down-regulation price | 70 | 70 | 60 |
| Purchase/sales price for imbalance energy | 80 | 70 | 60 |
| Unit | Heat source | COP 2019/2025 |
Electrical capacity (MW) 2019/2025 |
|---|---|---|---|
| Helsinki | |||
| Katri Vala HP | Waste heat | 2.4 / 2.3 | 43 / 67 |
| Salmisaari HP | Ambient air | - / 2.1 | 0 / 8 |
| Vuosaari HP | Sea water | - / 2.3 | 0 / 5.5 |
| Esplanadi HP | Waste heat | 2.2 / 2.3 | 9.8 / 9.8 |
| Electric Boiler | - | 99 % | 0 / 280 |
| Espoo | |||
| Suomenoja 3 and 4 HPs | Wastewater | 2.5 / 2.2 | 18/30 |
| Vermo HP | Air | - / 2.0 | 0 / 4.5 |
Disclaimer/Publisher’s Note: The statements, opinions and data contained in all publications are solely those of the individual author(s) and contributor(s) and not of MDPI and/or the editor(s). MDPI and/or the editor(s) disclaim responsibility for any injury to people or property resulting from any ideas, methods, instructions or products referred to in the content. |
© 2023 by the authors. Licensee MDPI, Basel, Switzerland. This article is an open access article distributed under the terms and conditions of the Creative Commons Attribution (CC BY) license (http://creativecommons.org/licenses/by/4.0/).


