Submitted:
20 November 2023
Posted:
22 November 2023
You are already at the latest version
Abstract
Keywords:
1. Introduction
2. Experiment
2.1. Materials
2.2. Preparation of AELS
2.3. Adsorption Experiment
3. Result Discussion
3.1. Synthesis and Structural Analysis of AELS
3.1.1. Analysis of AELS Orthogonal Experiments
| Experimental sequence number |
Temperature (℃) |
Time (h) |
DETA quality (g) |
HCHO quality (mL) |
Removal rate % |
|---|---|---|---|---|---|
| 1 | 55 | 2 | 3 | 1.5 | 40 |
| 2 | 55 | 3 | 6 | 2.5 | 52 |
| 3 | 55 | 4 | 9 | 3.5 | 25 |
| 4 | 55 | 5 | 12 | 4.5 | 43 |
| 5 | 65 | 2 | 6 | 3.5 | 81 |
| 6 | 65 | 3 | 3 | 4.5 | 90 |
| 7 | 65 | 4 | 12 | 1.5 | 38 |
| 8 | 65 | 5 | 9 | 2.5 | 38 |
| 9 | 75 | 2 | 9 | 4.5 | 31 |
| 10 | 75 | 3 | 12 | 3.5 | 34 |
| 11 | 75 | 4 | 3 | 2.5 | 97 |
| 12 | 75 | 5 | 6 | 1.5 | 49 |
| 13 | 85 | 2 | 12 | 2.5 | 55 |
| 14 | 85 | 3 | 9 | 1.5 | 23 |
| 15 | 85 | 4 | 6 | 4.5 | 91 |
| 16 | 85 | 5 | 3 | 3.5 | 94 |
| K1 | 160 | 207 | 321 | 150 | |
| K2 | 247 | 199 | 273 | 242 | |
| K3 | 211 | 251 | 117 | 234 | |
| K4 | 263 | 224 | 170 | 255 | |
| k1 | 40 | 51.75 | 80.25 | 37.5 | |
| k2 | 61.75 | 49.75 | 68.25 | 60.5 | |
| k3 | 52.75 | 62.75 | 29.25 | 58.5 | |
| k4 | 65.75 | 56 | 42.5 | 63.75 | |
| R | 25.75 | 13 | 51 | 26.25 | |
| Factor primary and secondary order | C> D > A >B | ||||
| Optimal level | A4 | B3 | C1 | D4 | |
| Optimal combination | A4B3C1D4 | ||||
3.1.2. Sample Characterization

| Mass loss of 5% at temperature(°C) | Mass loss of 50% at temperature(°C) | Residual amount at 800(°C) | |
|---|---|---|---|
| ELS | 166 | 677 | 44.39 |
| AELS | 88 | 480 | 39.76 |
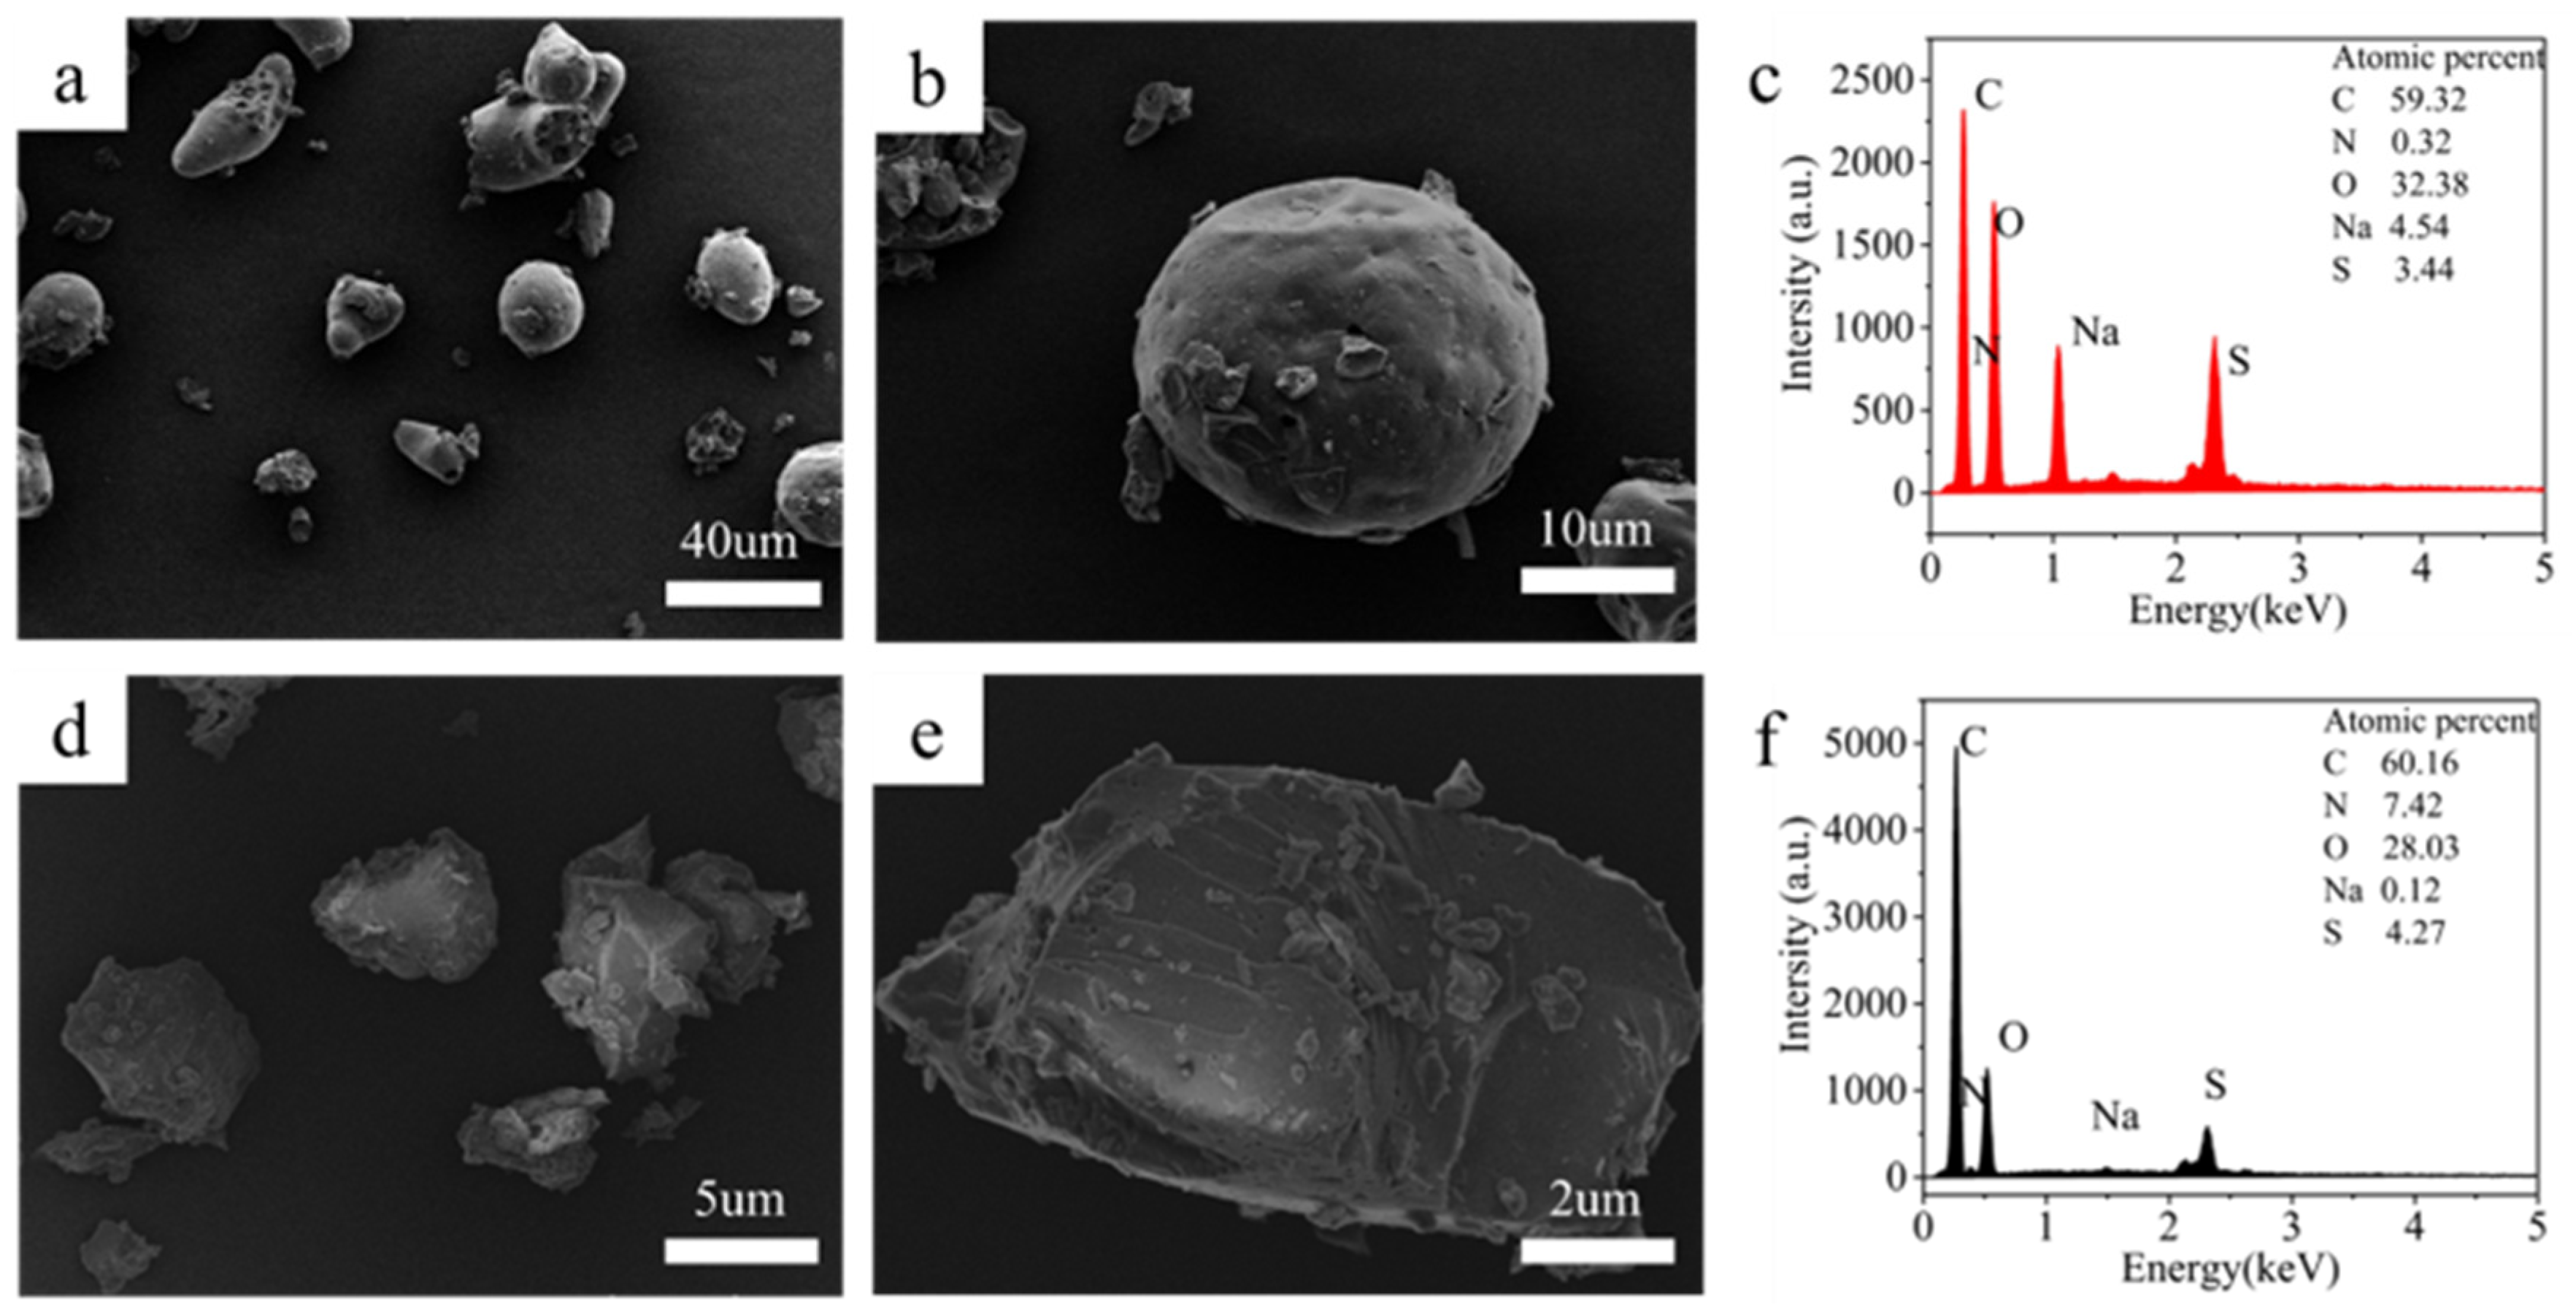
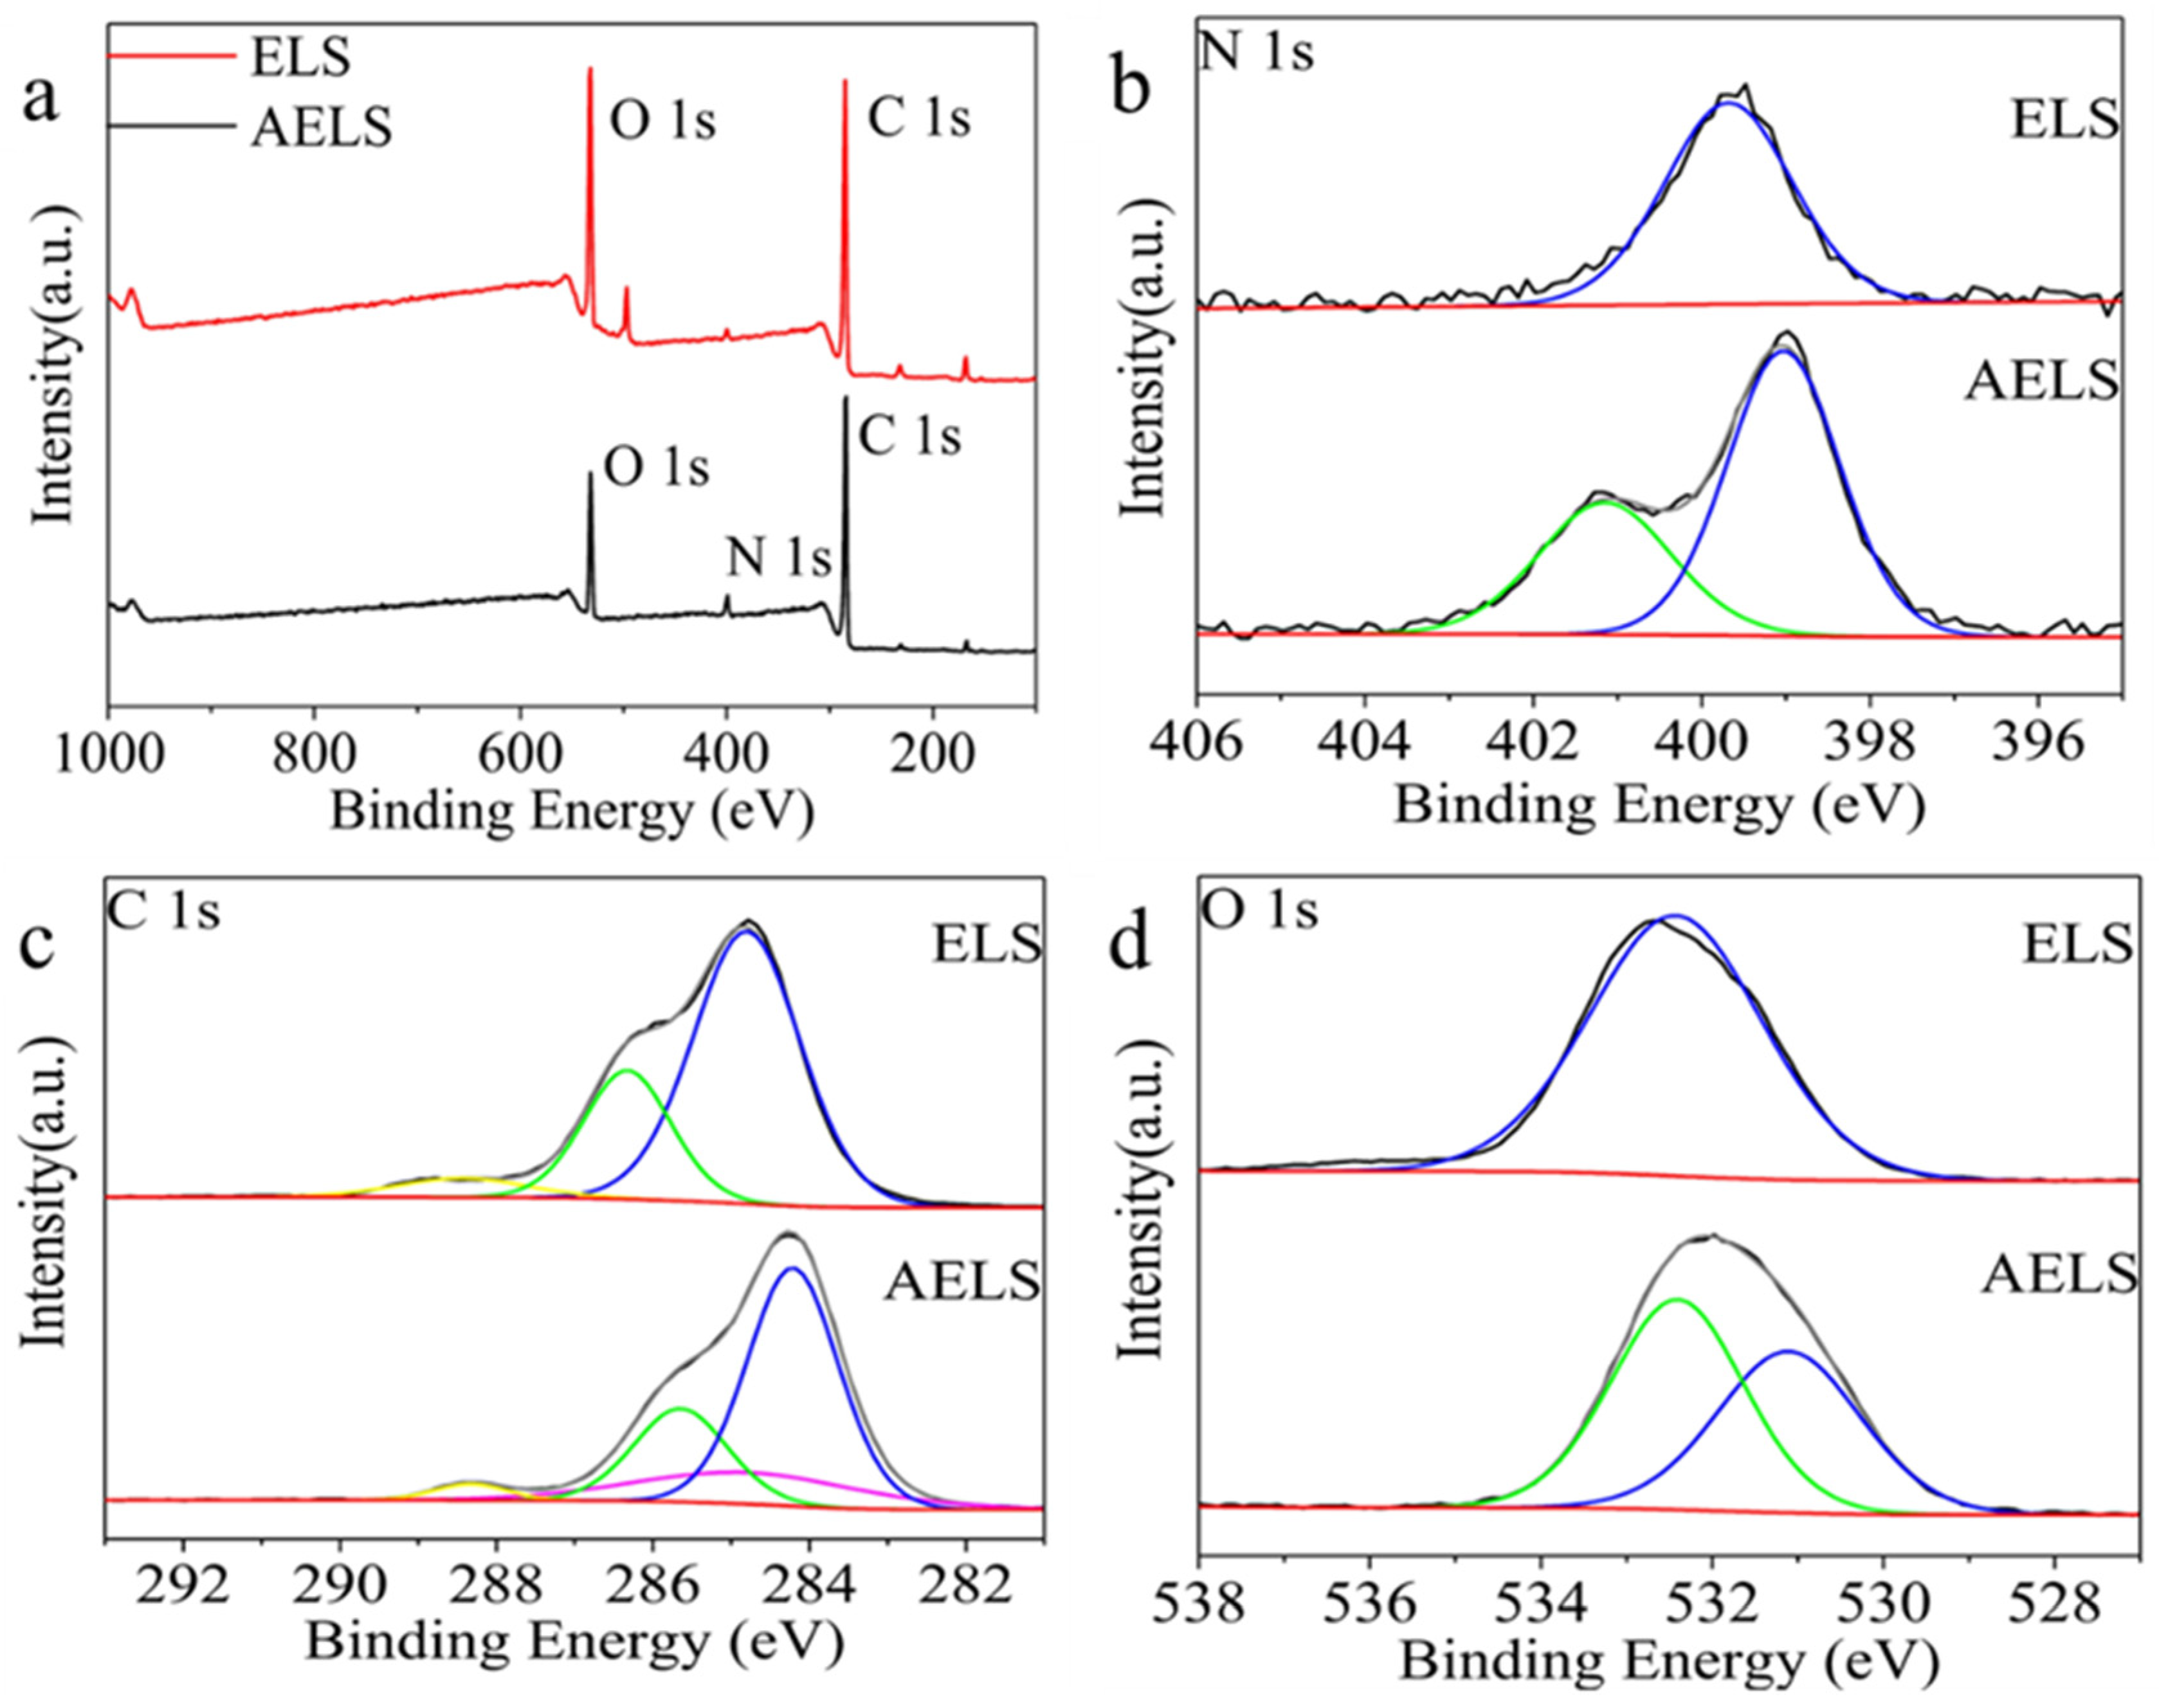
3.2. Performance of AELS Adsorption MB
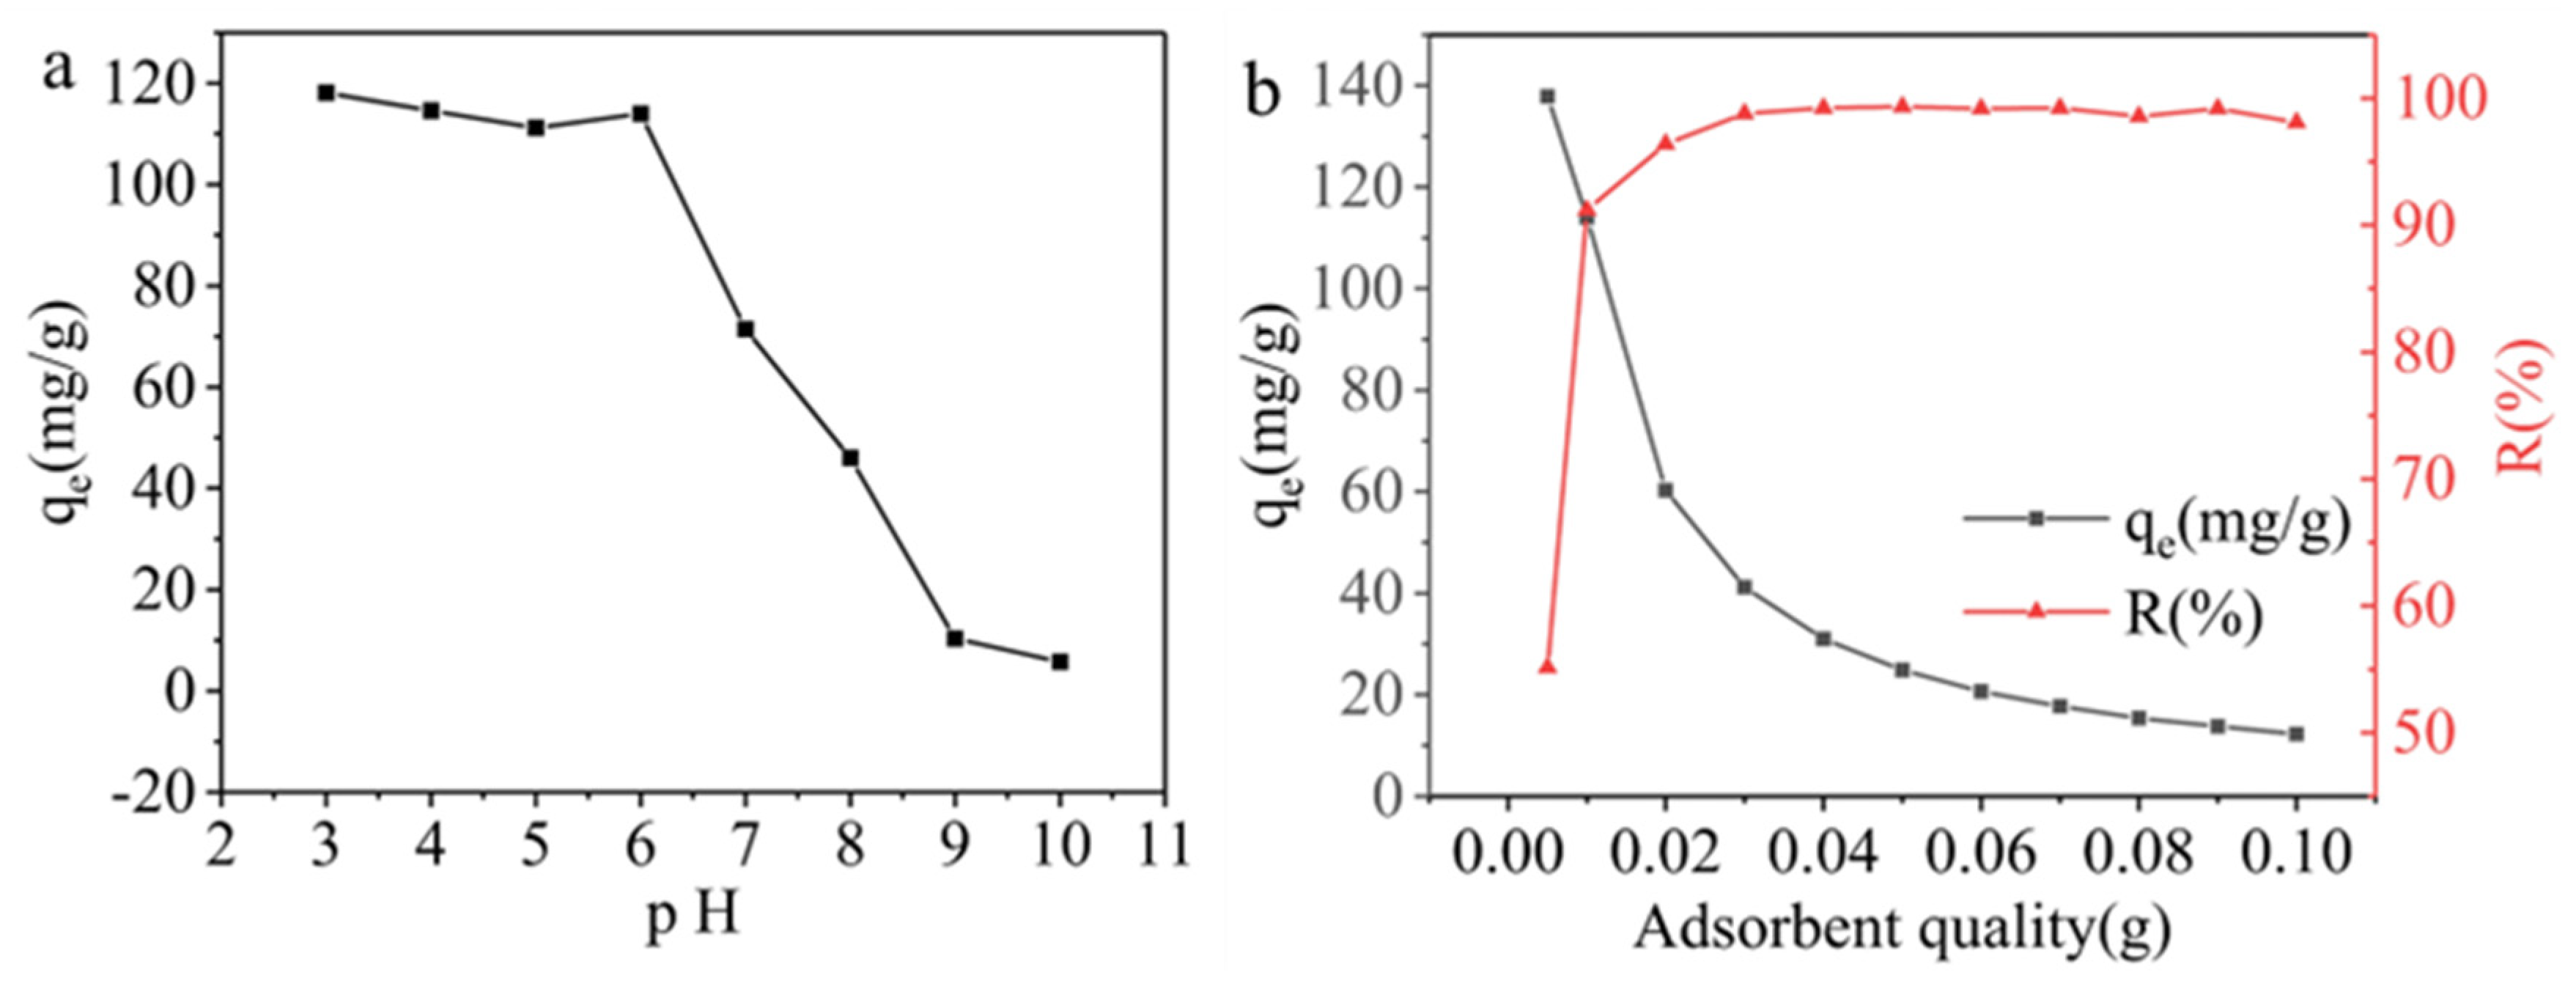
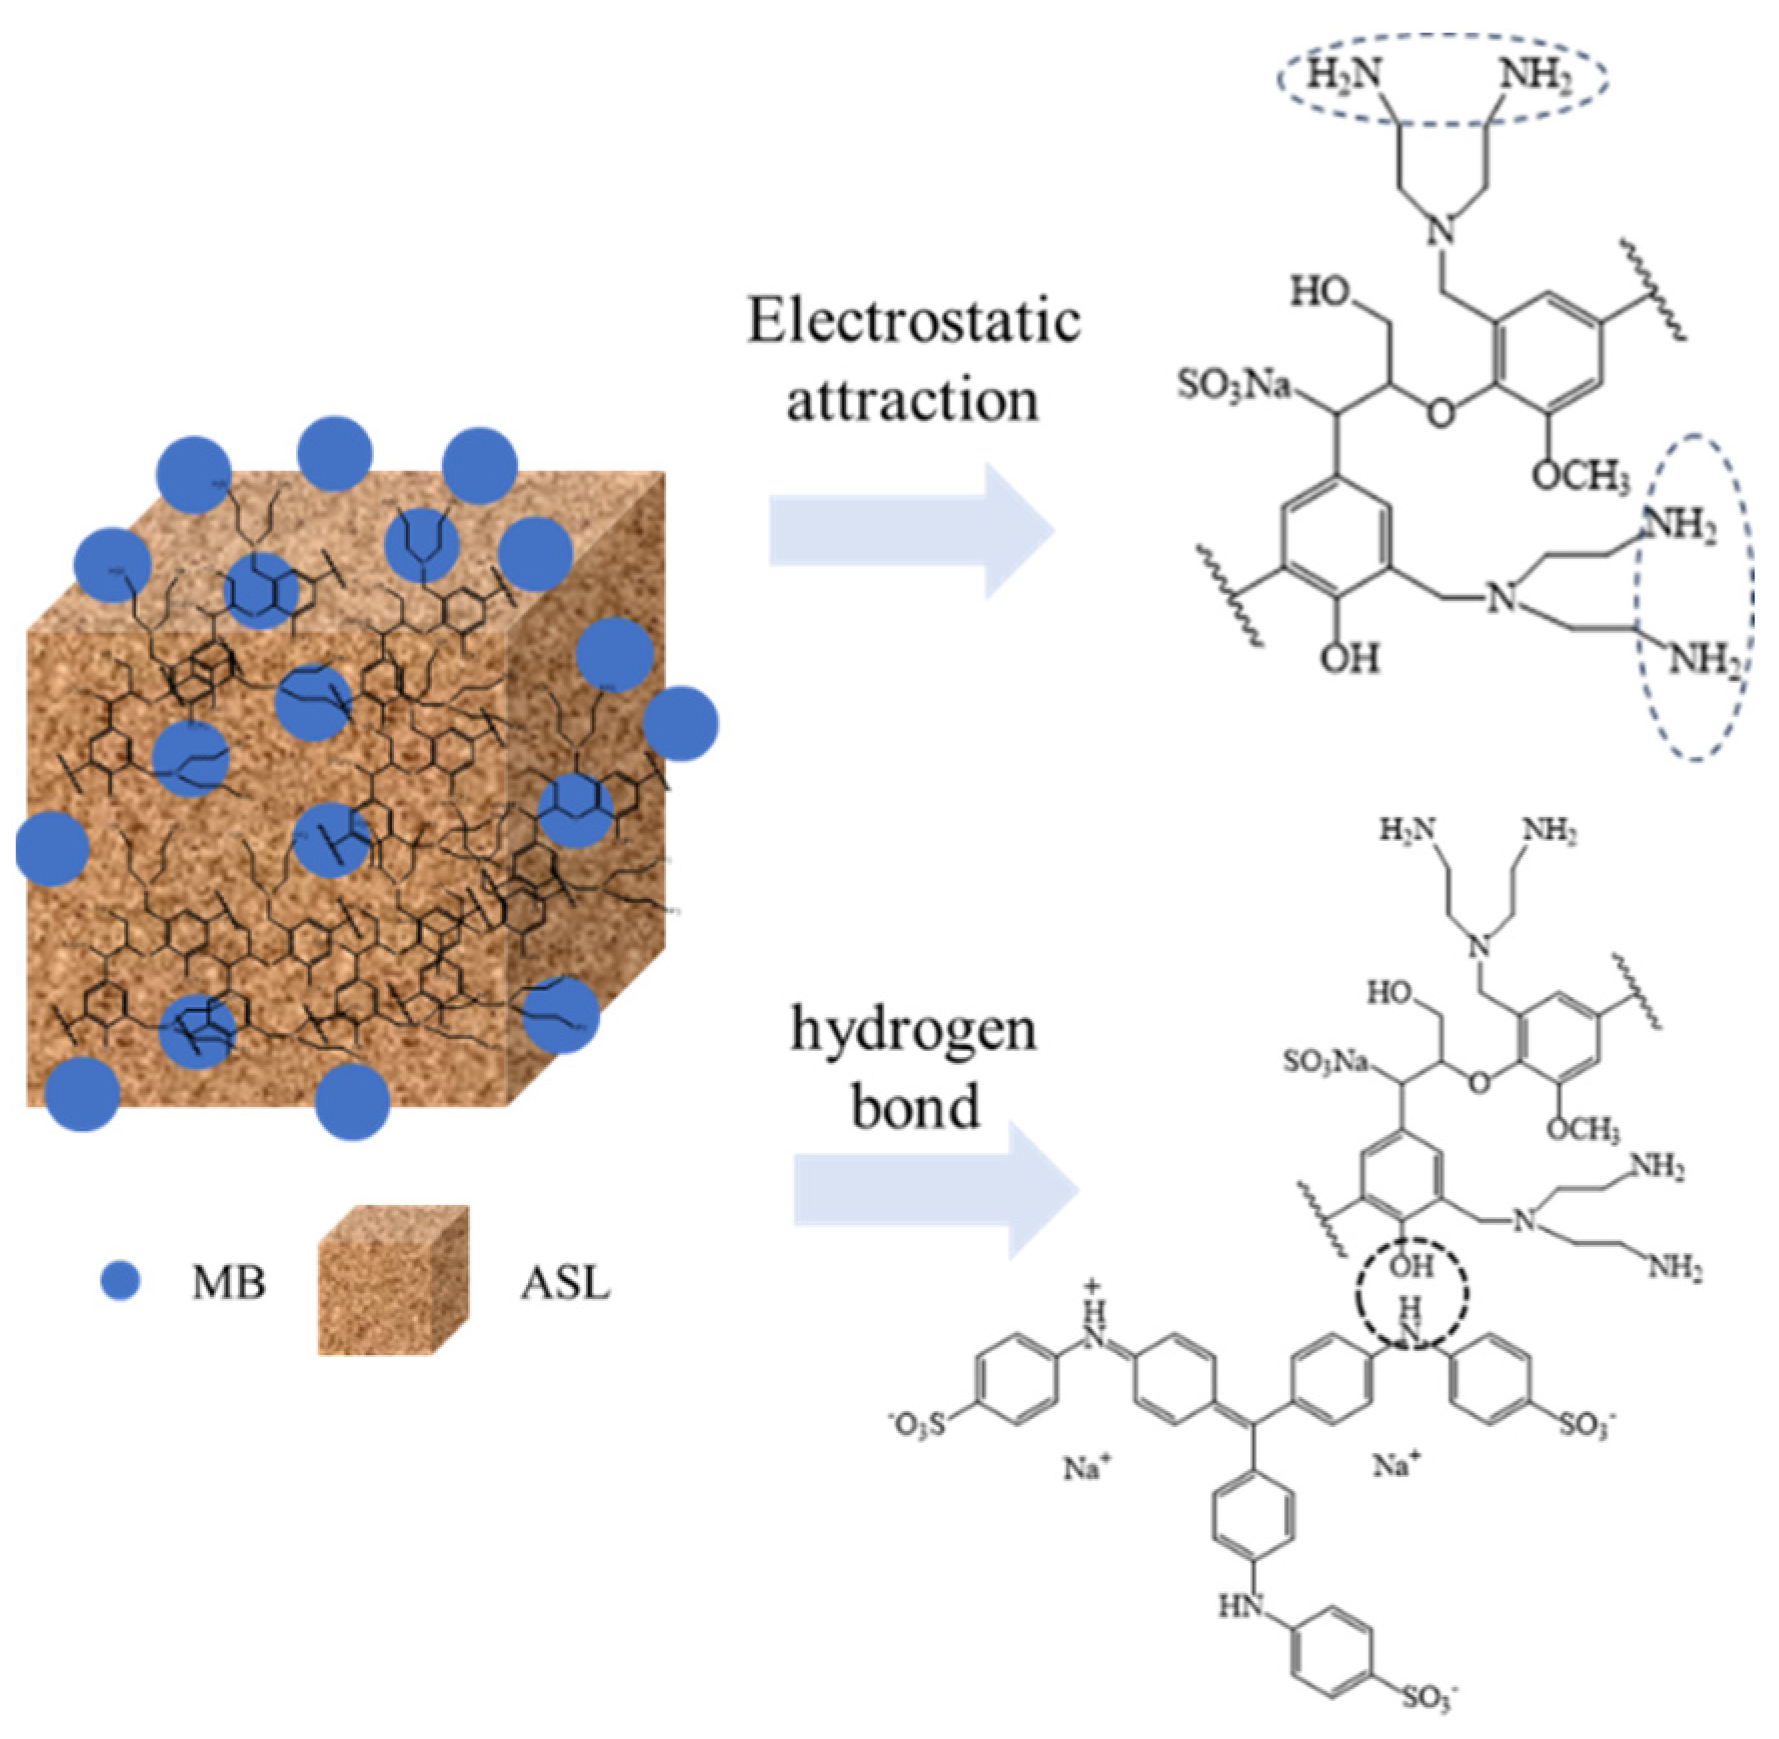
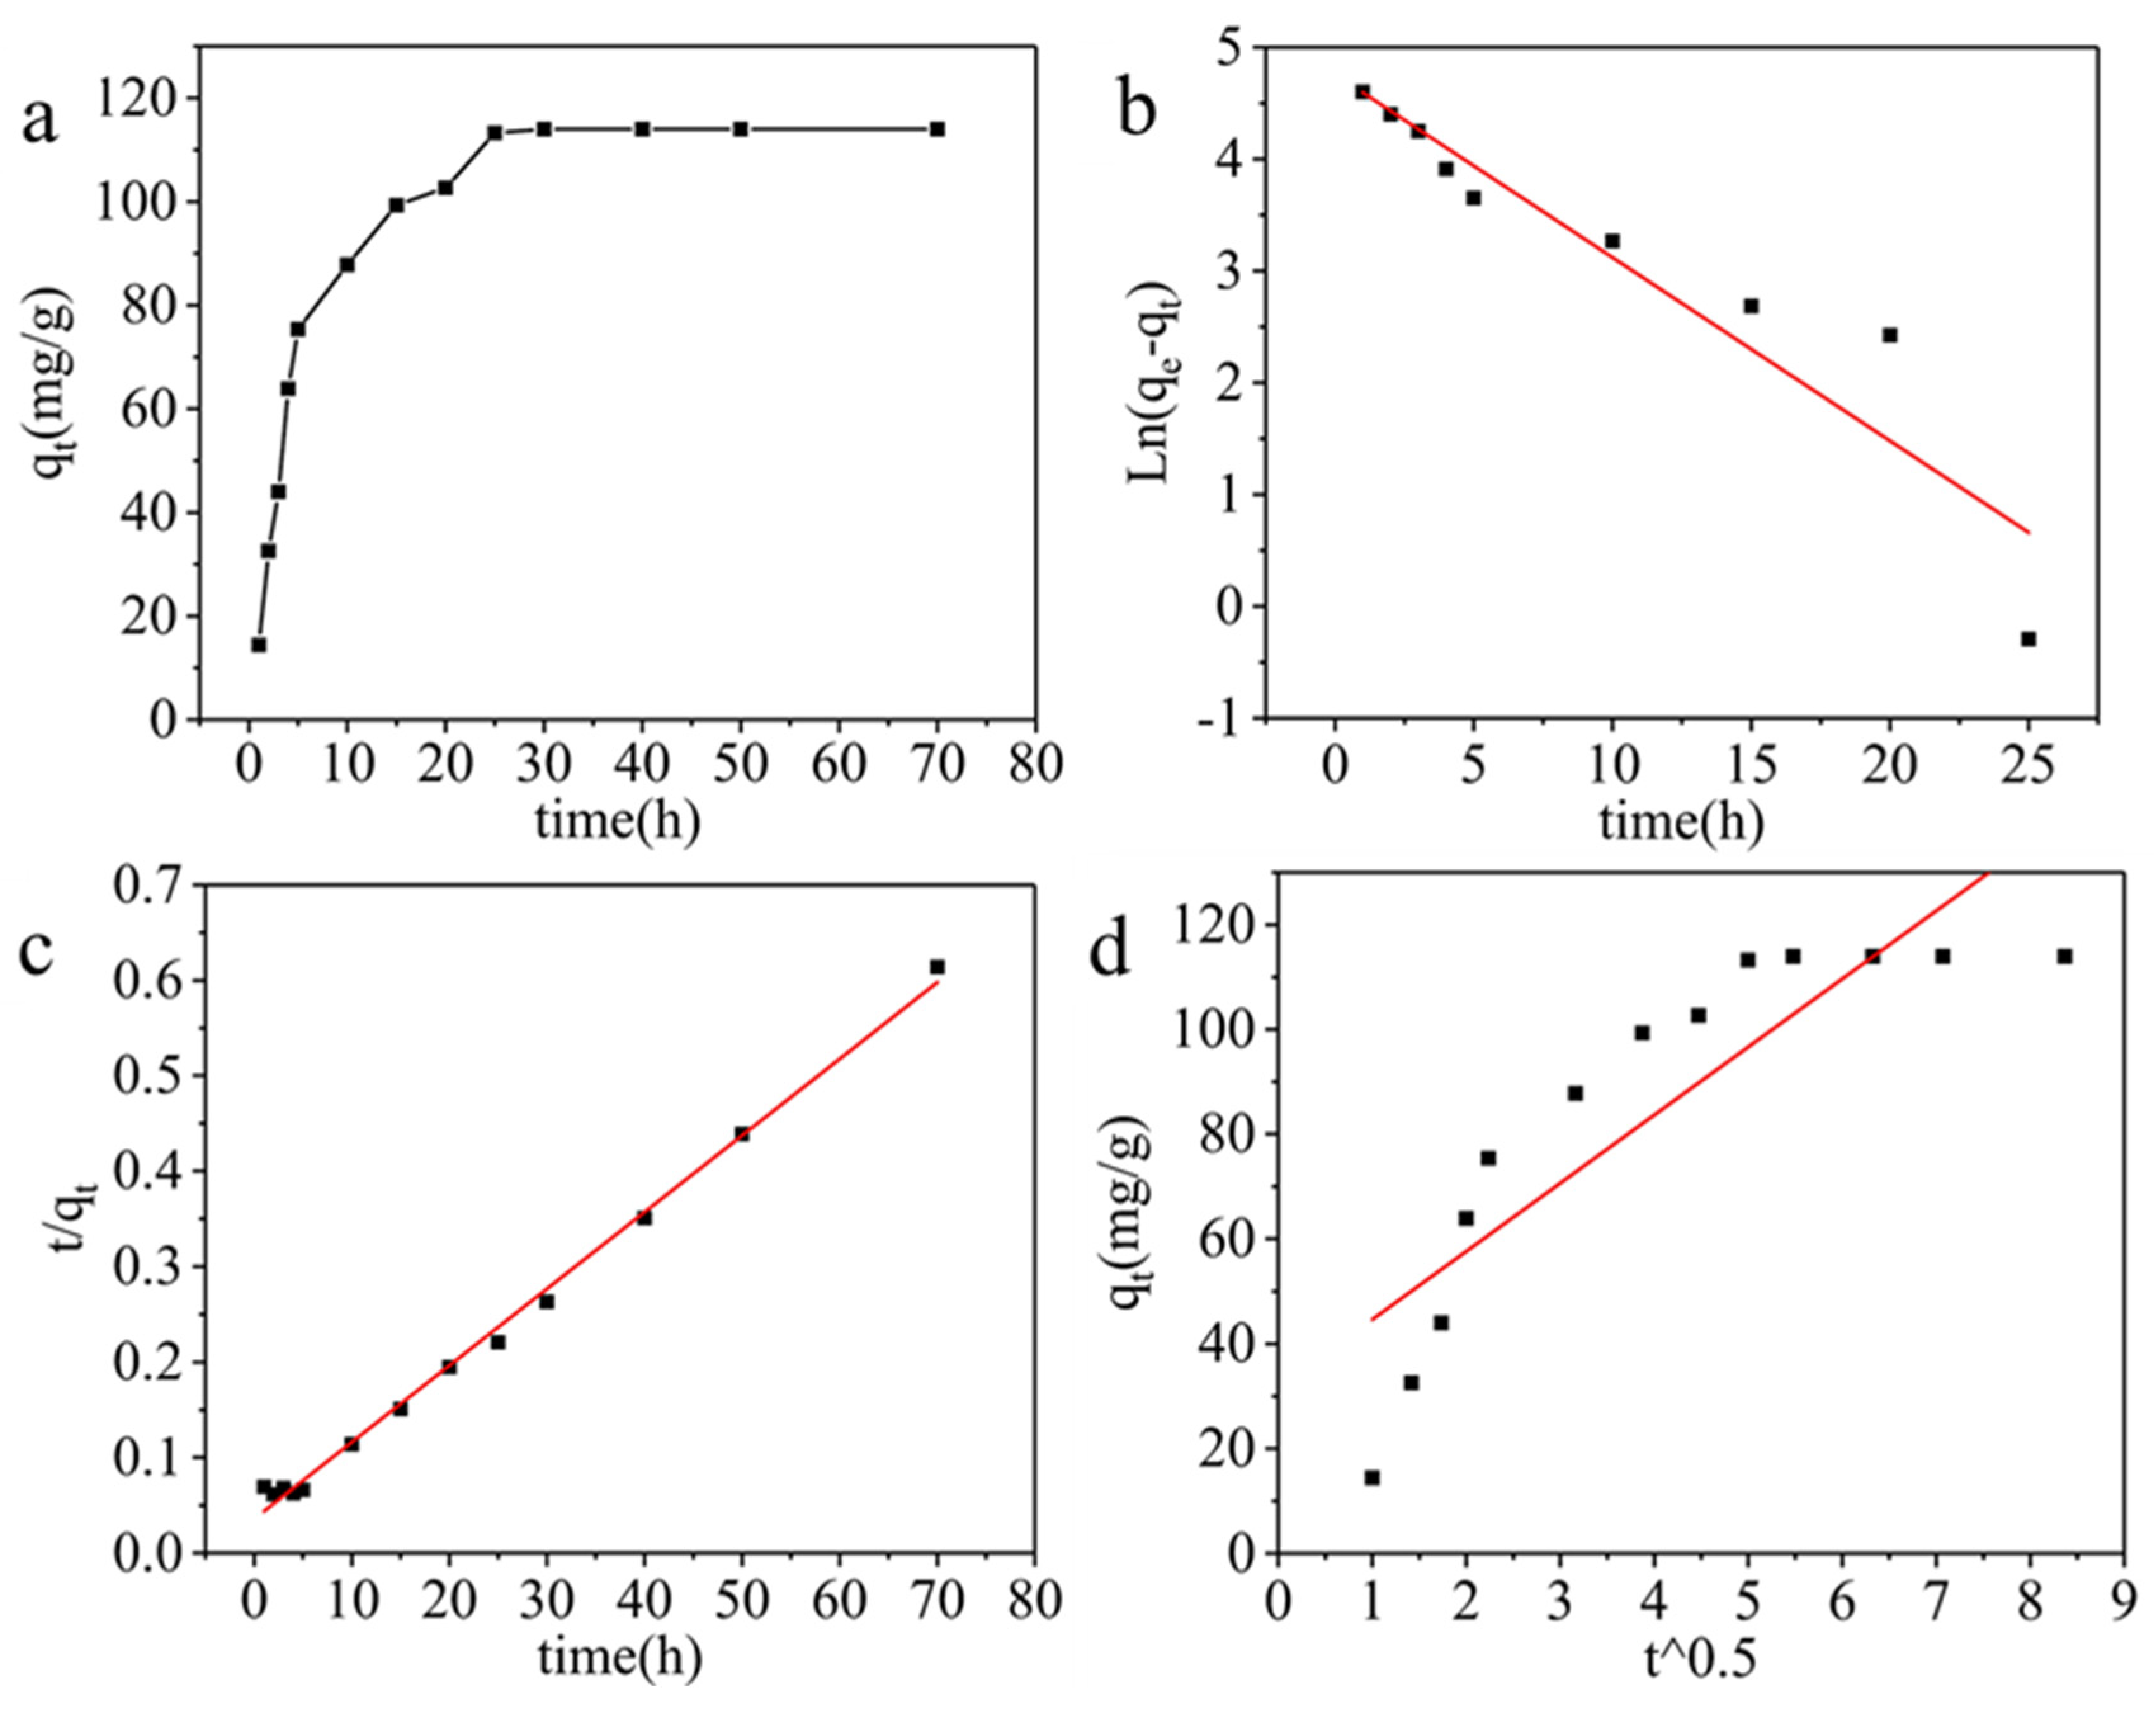
| Dynamic model |
Pseudo-first-order kinetics |
Pseudo-second-order kinetics |
Intra-particle diffusion |
|||
|---|---|---|---|---|---|---|
| Parameters | R2 K1 q |
0.8691 0.1639 116.70 |
R2 K2 q |
0.9948 0.0016 124.53 |
R2 Kp C |
0.7419 13.0059 31.64 |
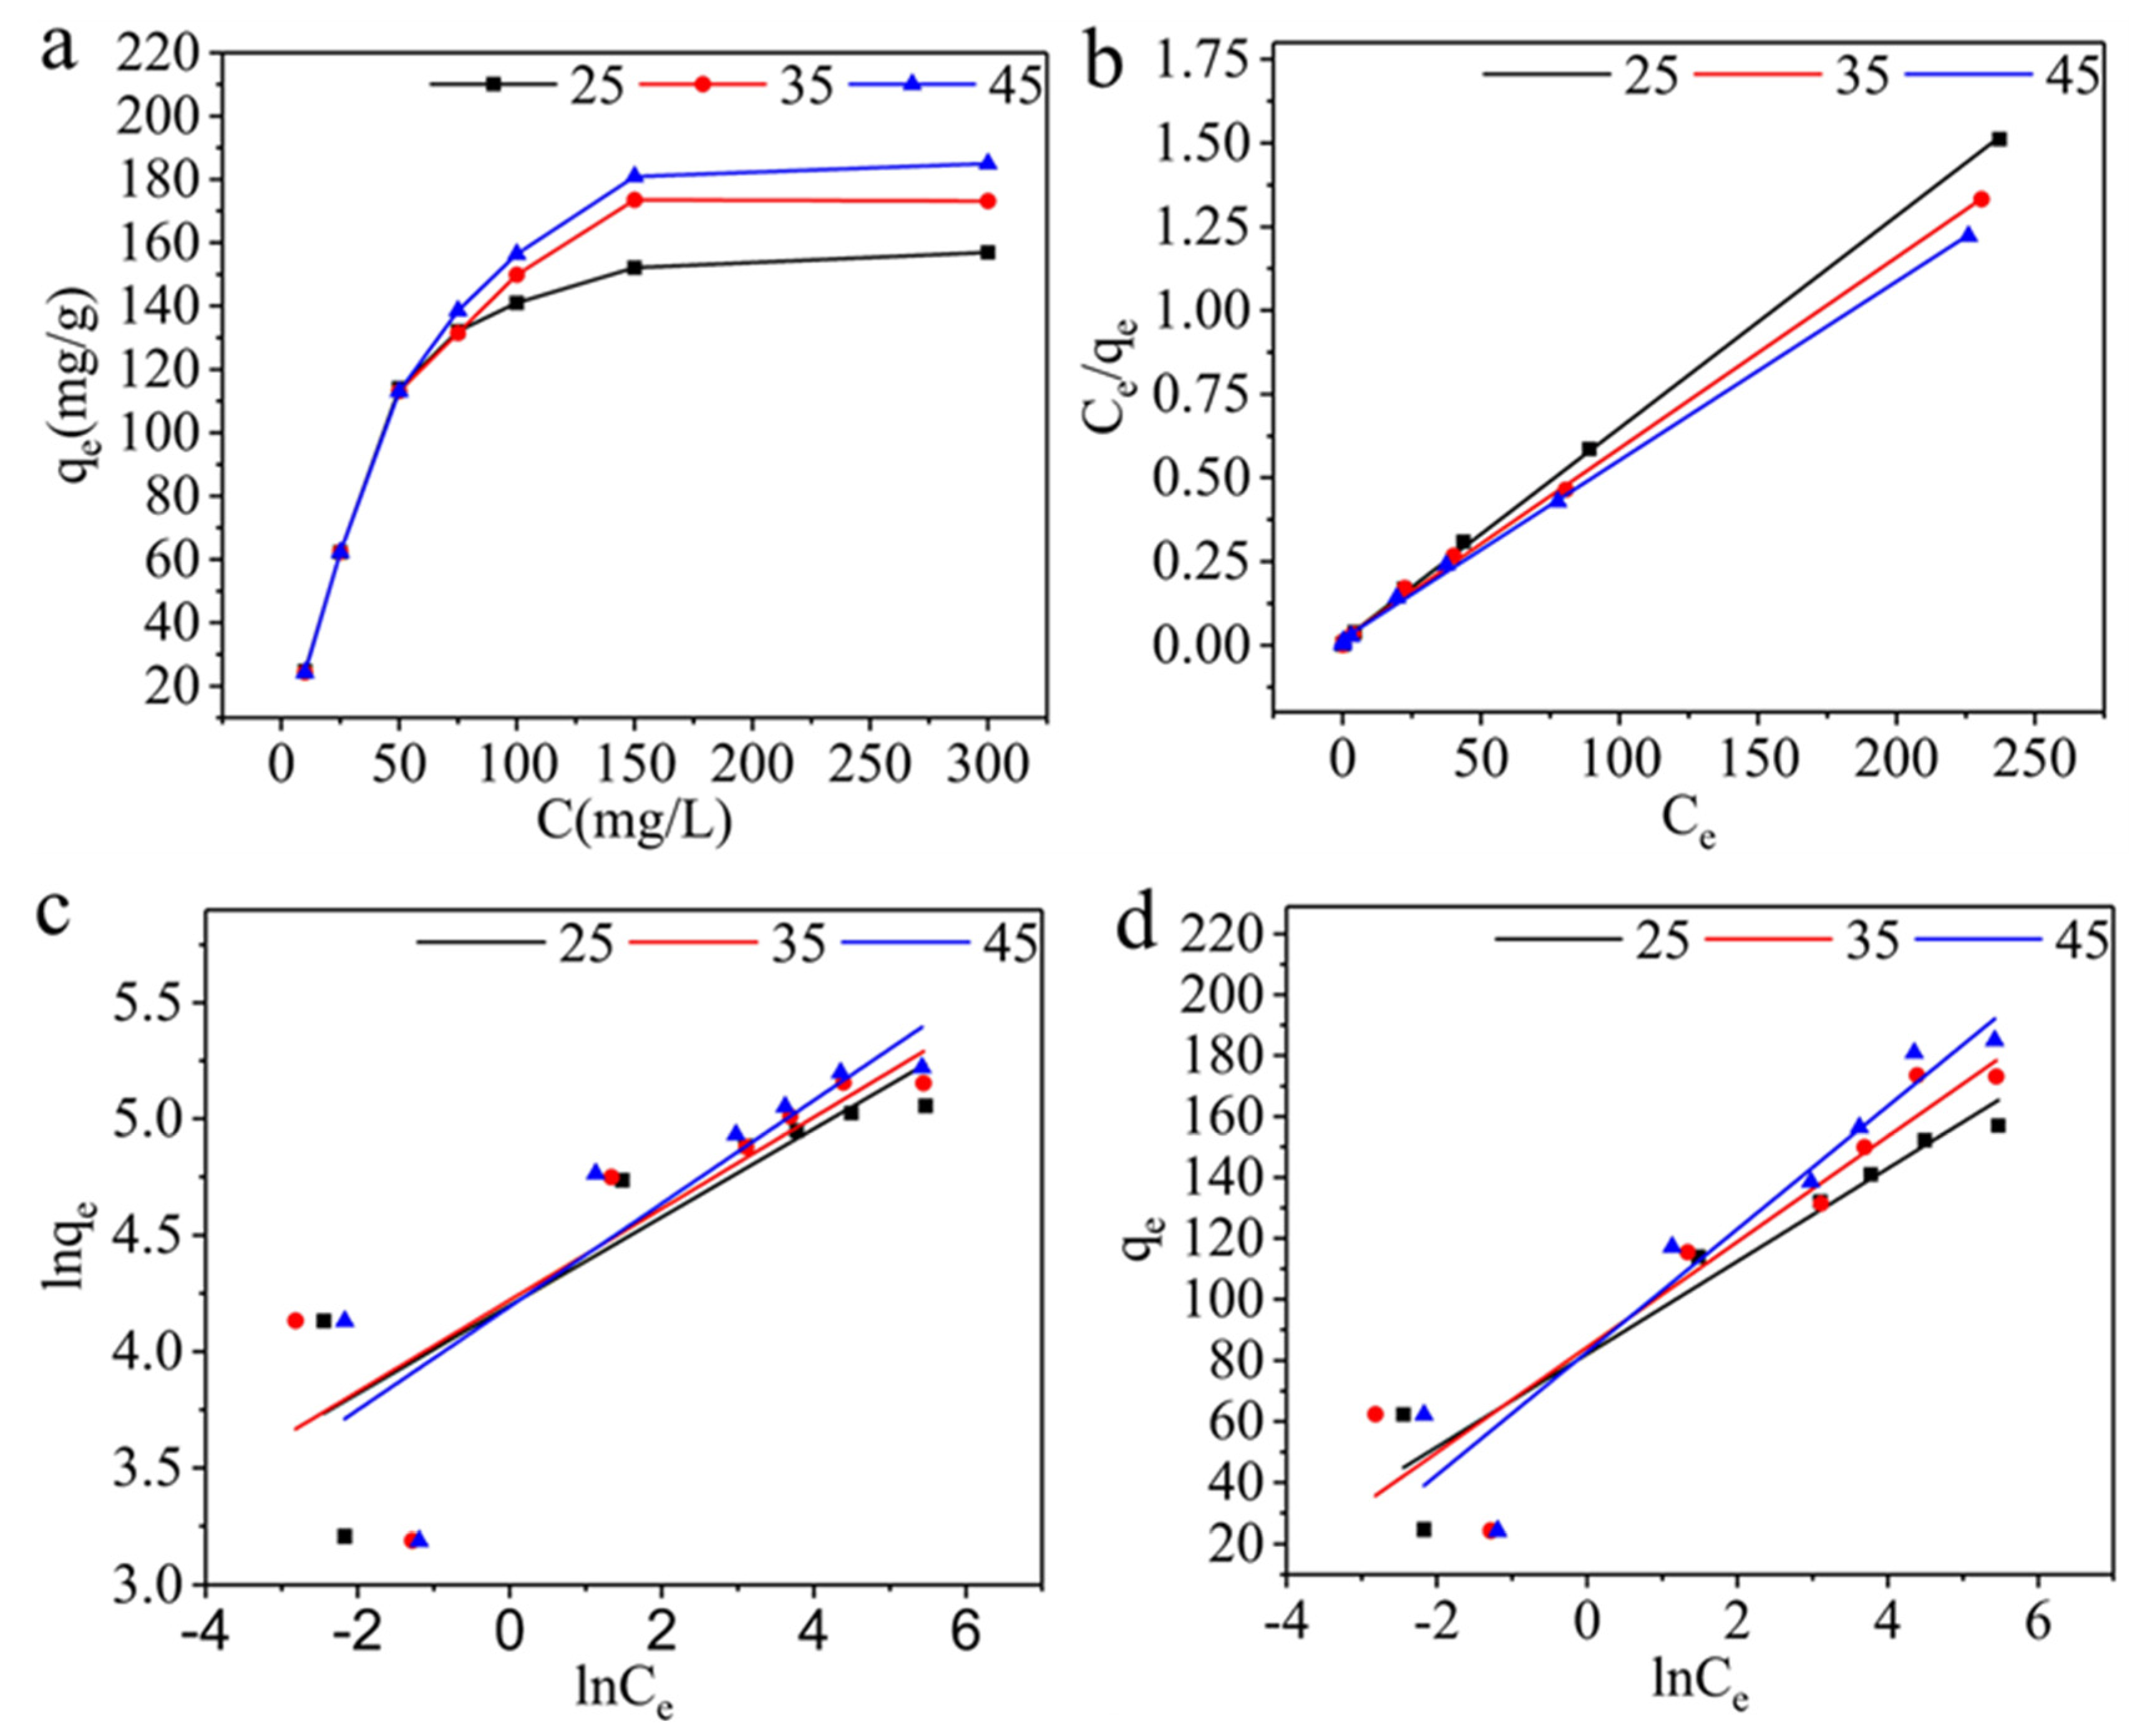
| T/K | Langmuir | Freundlich | Temkin | ||||||
|---|---|---|---|---|---|---|---|---|---|
| qm (mg g-1) |
KL (L mg-1) |
R2 | KF (L mg-1) |
1/n | R2 | b (J mol-1) |
A (L mg-1) |
R2 | |
| 298K | 157.73 | 0.42 | 0.9994 | 66.58 | 0.1897 | 0.7383 | 162.75 | 219.54 | 0.9147 |
| 303K | 175.44 | 0.32 | 0.9986 | 68.10 | 0.1965 | 0.6416 | 144.81 | 132.08 | 0.8461 |
| 313K | 187.27 | 0.29 | 0.9987 | 66.20 | 0.2218 | 0.6827 | 129.04 | 60.61 | 0.8887 |

| Thermodynamic parameter | ΔH0 (KJ mol-1) |
ΔS0 (J mol-1 K-1) |
ΔG0(KJ mol-1) | ||
|---|---|---|---|---|---|
| 298(K) | 303(K) | 313(K) | |||
| MB | 13.49 | 54.95 | -16.36 | -16.64 | -17.19 |
4. Conclusions
Author Contributions
Funding
Conflicts of Interest
References
- Ghedjemis, A.; Ayeche, R.; Kebaili, M.; Benouadah, A.; Gil, L.F. Application of natural hydroxyapatite in the treatment of polluted water: Utilization of dromedary bone as bioadsorbent. Int. J. Appl. Ceram. Technol. 2022, 19, 2124–2134. [Google Scholar] [CrossRef]
- Mon, M.; Bruno, R.; Ferrando-Soria, J.; Armentano, D.; Pardo, E. Metal–organic framework technologies for water remediation: towards a sustainable ecosystem. J. Mater. Chem. A. 2018, 6, 4912–4947. [Google Scholar] [CrossRef]
- Das, T.R.; Patra, S.; Madhuri, R.; Sharma, P.K. Bismuth oxide decorated graphene oxide nanocomposites synthesized via sonochemical assisted hydrothermal method for adsorption of cationic organic dyes. J. Colloid Interface Sci. 2018, 509, 82–93. [Google Scholar] [CrossRef] [PubMed]
- Carneiro, P.A.; Umbuzeiro, G.A.; Oliveira, D.P.; Zanoni, M.V.B. Assessment of water contamination caused by a mutagenic textile effluent/dyehouse effluent bearing disperse dyes. J. Hazard. Mater. 2010, 174, 694–699. [Google Scholar] [CrossRef] [PubMed]
- Sharma, P.; Hussain, N.; Borah, D.J.; Das, M.R. Kinetics and Adsorption Behavior of the Methyl Blue at the Graphene Oxide/Reduced Graphene Oxide Nanosheet–Water Interface: A Comparative Study. J. Chem. Eng. Data. 2013, 58, 3477–3488. [Google Scholar] [CrossRef]
- Yang, J.Q.; Monnot, M.; Ercolei, L.; Moulin, P. Membrane-Based Processes Used in Municipal Wastewater Treatment for Water Reuse: State-of-the-Art and Performance Analysis. Membranes. 2020, 10, 131. [Google Scholar] [CrossRef] [PubMed]
- Saravanan, A.; Deivayanai, V.C.; Kumar, P.S.; Rangasamy, G.; Hemavathy, R.V.; Harshana, T.; Gayathri, N.; Alagumalai, K. A detailed review on advanced oxidation process in treatment of wastewater: Mechanism, challenges and future outlook. Chemosphere. 2022, 308, 136524. [Google Scholar] [CrossRef] [PubMed]
- Pavithra, K.G.; Kumar, P.S.; Jaikumar, V.; Rajan, P.S. Removal of colorants from wastewater: A review on sources and treatment strategies. J. Ind. Eng. Chem. 2019, 75, 1–19. [Google Scholar] [CrossRef]
- Crespo-Monteiro, N.; Cazier, A.; Vocanson, F.; Lefkir, Y.; Reynaud, S.; Michalon, J.Y.; Kämpfe, T.; Destouches, N.; Jourlin, Y. Microstructuring of Mesoporous Titania Films Loaded with Silver Salts to Enhance the Photocatalytic Degradation of Methyl Blue under Visible Light. Nanomaterials. 2017, 7, 334. [Google Scholar] [CrossRef]
- Chen, B.; Zhao, H.N.; Chen, S.J.; Long, F.X.; Huang, B.; Yang, B.Y.; Pan, X.J. A magnetically recyclable chitosan composite adsorbent functionalized with EDTA for simultaneous capture of anionic dye and heavy metals in complex wastewater. Chem. Eng. J. 2019, 356, 69–80. [Google Scholar] [CrossRef]
- Cao, J.S.; Lin, J.X.; Fang, F.; Zhang, M.T.; Hu, Z.R. A new absorbent by modifying walnut shell for the removal of anionic dye: Kinetic and thermodynamic studies. Bioresour. Technol. 2014, 163, 199–205. [Google Scholar] [CrossRef] [PubMed]
- Yagub, M.T.; Sen, T.K.; Afroze, S.; Ang, H.M. Dye and its removal from aqueous solution by adsorption: A review. Adv. Colloid Interface Sci. 2014, 209, 172–184. [Google Scholar] [CrossRef] [PubMed]
- Malarvizhi, R.; Ho, Y.S. The influence of pH and the structure of the dye molecules on adsorption isotherm modeling using activated carbon. Desalination. 2010, 264, 97–101. [Google Scholar] [CrossRef]
- Shao, Y.M.; Wang, X.; Kang, Y.; Shu, Y.H.; Sun, Q.Q.; Li, L.S. Application of Mn/MCM-41 as an adsorbent to remove methyl blue from aqueous solution. J. Colloid Interface Sci. 2014, 429, 25–33. [Google Scholar] [CrossRef] [PubMed]
- Yan, J.J.; Huang, Y.P.; Miao, Y.E.; Tjiu, W.W.; Liu, T.X. Polydopamine-coated electrospun poly (vinyl alcohol)/poly (acrylic acid) membranes as efficient dye adsorbent with good recyclability. J. Hazard. Mater. 2015, 283, 730–739. [Google Scholar] [CrossRef]
- Li, Y.; Wang, T.C.; Zhang, S.S.; Zhang, Y.L.; Yu, L.L.; Liu, R.J. Adsorption and electrochemical behavior investigation of methyl blue onto magnetic nickel-magnesium ferrites prepared via the rapid combustion process. J. Alloys Compd. 2021, 885, 160969. [Google Scholar] [CrossRef]
- Zhu, H.L.; Luo, W.; Ciesielski, P.N.; Fang, Z.Q.; Zhu, J.Y.; Henriksson, G.; Himmel, M.E.; Hu, L.B. Wood-Derived Materials for Green Electronics, Biological Devices. and Energy Applications. Chem. Rev. 2016, 116, 9305–9374. [Google Scholar] [CrossRef] [PubMed]
- Rinaldi, R.; Jastrzebski, R.; Clough, M.T.; Ralph, J.; Kennema, M.; Bruijnincx, P.C.A.; Weckhuysen, B.M. Paving the Way for Lignin Valorisation: Recent Advances in Bioengineering, Biorefining and Catalysis. Angew. Chem. Int. Ed. 2016, 55, 8164–8215. [Google Scholar] [CrossRef] [PubMed]
- Thakur, V.K.; Thakur, M.K.; Raghavan, P.; Kessler, M.R. Progress in Green Polymer Composites from Lignin for Multifunctional Applications: A Review. ACS Sustainable Chem. Eng. 2014, 2, 1072–1092. [Google Scholar] [CrossRef]
- Lora1, J.H.; Glasser, W.G. Recent Industrial Applications of Lignin: A Sustainable Alternative to Nonrenewable Materials. J. Polym. Environ. 2002, 10, 39–48. [Google Scholar] [CrossRef]
- Dawy, M.; Shabaka, A.A.; Nada, A.M.A. Molecular structure and dielectric properties of some treated lignins. Polym. Degrad. Stab. 1998, 62, 455–462. [Google Scholar] [CrossRef]
- Du, X.Y.; Li, J.B.; Lindström, M.E. Modification of industrial softwood kraft lignin using Mannich reaction with and without phenolation pretreatment. Ind. Crops Prod. 2014, 52, 729–735. [Google Scholar] [CrossRef]
- Chen, H.; Liu, T.L.; Meng, Y.; Cheng, Y.; Lu, J.; Wang, H.S. Novel graphene oxide/aminated lignin aerogels for enhanced adsorption of malachite green in wastewater. Colloids Surf. A Physicochem. Eng. Asp. 2020, 603, 125281. [Google Scholar] [CrossRef]
- An, L.; Si, C.L.; Bae, J.H.; Jeong, H.; Kim, Y.S. One-step silanization and amination of lignin and its adsorption of Congo red and Cu (II) ions in aqueous solution. Int. J. Biol. Macromol. 2020, 159, 222–230. [Google Scholar] [CrossRef] [PubMed]
- Shah, M.M.; Grover, T.A.; Barr, D.P.; Aust, S.D. On the mechanism of inhibition of the veratryl alcohol oxidase activity of lignin peroxidase H2 by EDTA. J. Biol. Chem. 1992, 267, 21564–21569. [Google Scholar] [CrossRef] [PubMed]
- Meng, X.Z.; Scheidemantle, B.; Li, M.; Wang, Y.Y.; Zhao, X.H.; Toro-Gonzalez, M.; Singh, P.; Pu, Y.Q.; Wyman, C. E.; Ozcan, S.; Cai, C.M.; Ragauskas, A.J. Synthesis, Characterization, and Utilization of a Lignin-Based Adsorbent for Effective Removal of Azo Dye from Aqueous Solution. ACS omega. 2020, 5, 2865–2877. [Google Scholar] [CrossRef] [PubMed]
- Wang, Y.Y.; Zhu, L.L.; Wang, X.H.; Zheng, W.R.; Hao, C.; Jiang, C.L.; Wu, J.B. Synthesis of aminated calcium lignosulfonate and its adsorption properties for azo dyes. J. Ind. Eng. Chem. 2018, 61, 321–330. [Google Scholar] [CrossRef]
- Wang, X.H.; Zhang, Y.K.; Hao, C.; Dai, X.H.; Zhou, Z.L.; Si, N.C. Ultrasonic-assisted synthesis of aminated lignin by a Mannich reaction and its decolorizing properties for anionic azo-dyes, RSC Adv. 2014, 4, 8156-28164. [CrossRef]
- Zhang, B.P.; Zhang, H.; Wang, Y.; Fang, S.Y. Adsorption behavior and mechanism of amine/quaternary ammonium lignin on tungsten. Int. J. Biol. Macromol. 2022, 216, 882–890. [Google Scholar] [CrossRef] [PubMed]
- Pan, H.; Sun, G.; Zhao, T. Synthesis and characterization of aminated lignin. Int. J. Biol. Macromol. 2013, 59, 221–226. [Google Scholar] [CrossRef]
- Vargas, A.M.M.; Cazetta, A.L.; Kunita, M.H.; Silva, T.L.; Almeida, V.C. Almeida Adsorption of methylene blue on activated carbon produced from flamboyant pods (Delonix regia): Study of adsorption isotherms and kinetic models. Chem. Eng. J. 2011, 168, 722–730. [Google Scholar] [CrossRef]
- Le, G.T.T.; Chanlek, N.; Manyam, J.; Opaprakasit, P.; Grisdanurak, N.; Sreearunothai, P. Insight into the ultrasonication of graphene oxide with strong changes in its properties and performance for adsorption applications. Chem. Eng. J. 2019, 373, 1212–1222. [Google Scholar] [CrossRef]
- Farias, R.S.; Buarque, H.L.D.; Cruz, M.R.; Cardoso, L.M.F.; Gondim, T.D.; Paulo, V.R. Adsorption of congo red dye from aqueous solution onto amino-functionalized silica gel. Eng. Sanit. e Ambient. 2018, 23, 1053–1060. [Google Scholar] [CrossRef]
- Silva, M.M.F.; Oliveira, M.M.; Avelino, M.C.; Fonseca, M.G.; Almeida, R.K.S.; Silva, E.C. Adsorption of an industrial anionic dye by modified-KSF-montmorillonite: Evaluation of the kinetic. thermodynamic and equilibrium data. Chem. Eng. J. 2012, 203, 259–268. [Google Scholar] [CrossRef]
- Radoor, S.; Karayil, J.; Jayakumar, A.; Nandi, D.; Parameswaranpillai, J.; Lee, J.; Shivanna, J.M.; Nithya, R.; Siengchin, S. Adsorption of Cationic Dye onto ZSM-5 Zeolite-Based Bio Membrane: Characterizations, Kinetics and Adsorption Isotherm. J. Polym. Environ. 2022, 30, 3279–3292. [Google Scholar] [CrossRef]
- Tseng, R.L.; Wu, F.C.; Juang, R.S. Characteristics and applications of the Lagergren's first-order equation for adsorption kinetics. J. Taiwan Inst. Chem Eng. 2010, 41, 661–669. [Google Scholar] [CrossRef]
- Mahmoodi, N.M.; Taghizadeh, M.; Taghizadeh, A.; Abdi, J.; Hayati, B.; Shekarchi, A.A. Bio-based magnetic metal-organic framework nanocomposite: Ultrasound-assisted synthesis and pollutant (heavy metal and dye) removal from aqueous media. Appl. Surf. Sci. 2019, 480, 288–299. [Google Scholar] [CrossRef]
- Azimi, E.B.; Badiei, A.; Ghasemi, J.B. Efficient removal of malachite green from wastewater by using boron-doped mesoporous carbon nitride. Appl. Surf. Sci. 2019, 469, 236–245. [Google Scholar] [CrossRef]
- Ho, Y.S.; McKay, G. The kinetics of sorption of divalent metal ions onto sphagnum moss peat. Water Res. 2000, 34, 735–742. [Google Scholar] [CrossRef]
- Cai, W.Q.; Tan, L.J.; Yu, J.G.; Jaroniec, M.; Liu, X.Q.; Cheng, B.; Verpoort, F. Synthesis of amino-functionalized mesoporous alumina with enhanced affinity towards Cr (VI) and CO2. Chem. Eng. J. 2014, 239, 207–215. [Google Scholar] [CrossRef]
- Malkoc, E.; Nuhoglu, Y.; Dunda, M. Adsorption of chromium (VI) on pomace-An olive oil industry waste: Batch and column studies. J. Hazard. Mater. 2006, 138, 142–151. [Google Scholar] [CrossRef]
- Li, Z.C.; Hanafy, H.; Zhang, L.; Sellaoui, L.; Netto, M.S.; Oliveira, M.L.S.; Seliem, M.K.; Dotto, G.L.; Bonilla-Petriciolet, A. Li,Q. Adsorption of congo red and methylene blue dyes on an ashitaba waste and a walnut shell-based activated carbon from aqueous solutions: Experiments, characterization and physical interpretations. Chem. Eng. J 2020, 388, 124263. [Google Scholar] [CrossRef]
- Raji, F.; Pakizeh, M. Study of Hg (II) species removal from aqueous solution using hybrid ZnCl2 -MCM-41 adsorbent. Appl. Surf. Sci. 2013, 282, 415–424. [Google Scholar] [CrossRef]
- Bera, A.; Kumar, T.; Ojha, K.; Mandal, A. Adsorption of surfactants on sand surface in enhanced oil recovery: Isotherms, kinetics and thermodynamic studies. Appl. Surf. Sci. 2013, 284, 87–99. [Google Scholar] [CrossRef]
- Satapathy, M.K.; Das, P. Optimization of crystal violet dye removal using novel soil-silver nanocomposite as nanoadsorbent using response surface methodology. J. Environ. Chem. Eng. 2014, 2, 708–714. [Google Scholar] [CrossRef]
- Sari, A.; Mendil, D.; Tuzena, M.; Soylak, M. Biosorption of palladium (II) from aqueous solution by moss (Racomitrium lanuginosum) biomass: Equilibrium, kinetic and thermodynamic studies. J. Hazard. Mater. 2009, 162, 874–879. [Google Scholar] [CrossRef]
Disclaimer/Publisher’s Note: The statements, opinions and data contained in all publications are solely those of the individual author(s) and contributor(s) and not of MDPI and/or the editor(s). MDPI and/or the editor(s) disclaim responsibility for any injury to people or property resulting from any ideas, methods, instructions or products referred to in the content. |
© 2023 by the authors. Licensee MDPI, Basel, Switzerland. This article is an open access article distributed under the terms and conditions of the Creative Commons Attribution (CC BY) license (http://creativecommons.org/licenses/by/4.0/).


