2.1. Ramsey approach to optical systems: from real optical system to a graph
Ramsey Theory considers complete graphs, in which vertices are connected with at least two kinds of edges/links (multi-colored Ramsey graphs were also addressed [
27]). Let us explain in detail, how the Ramsey Theory is introduced for optical systems. Consider the simplest system built of the source, located in point
S, mirror and the sensor located in point
P, as depicted in
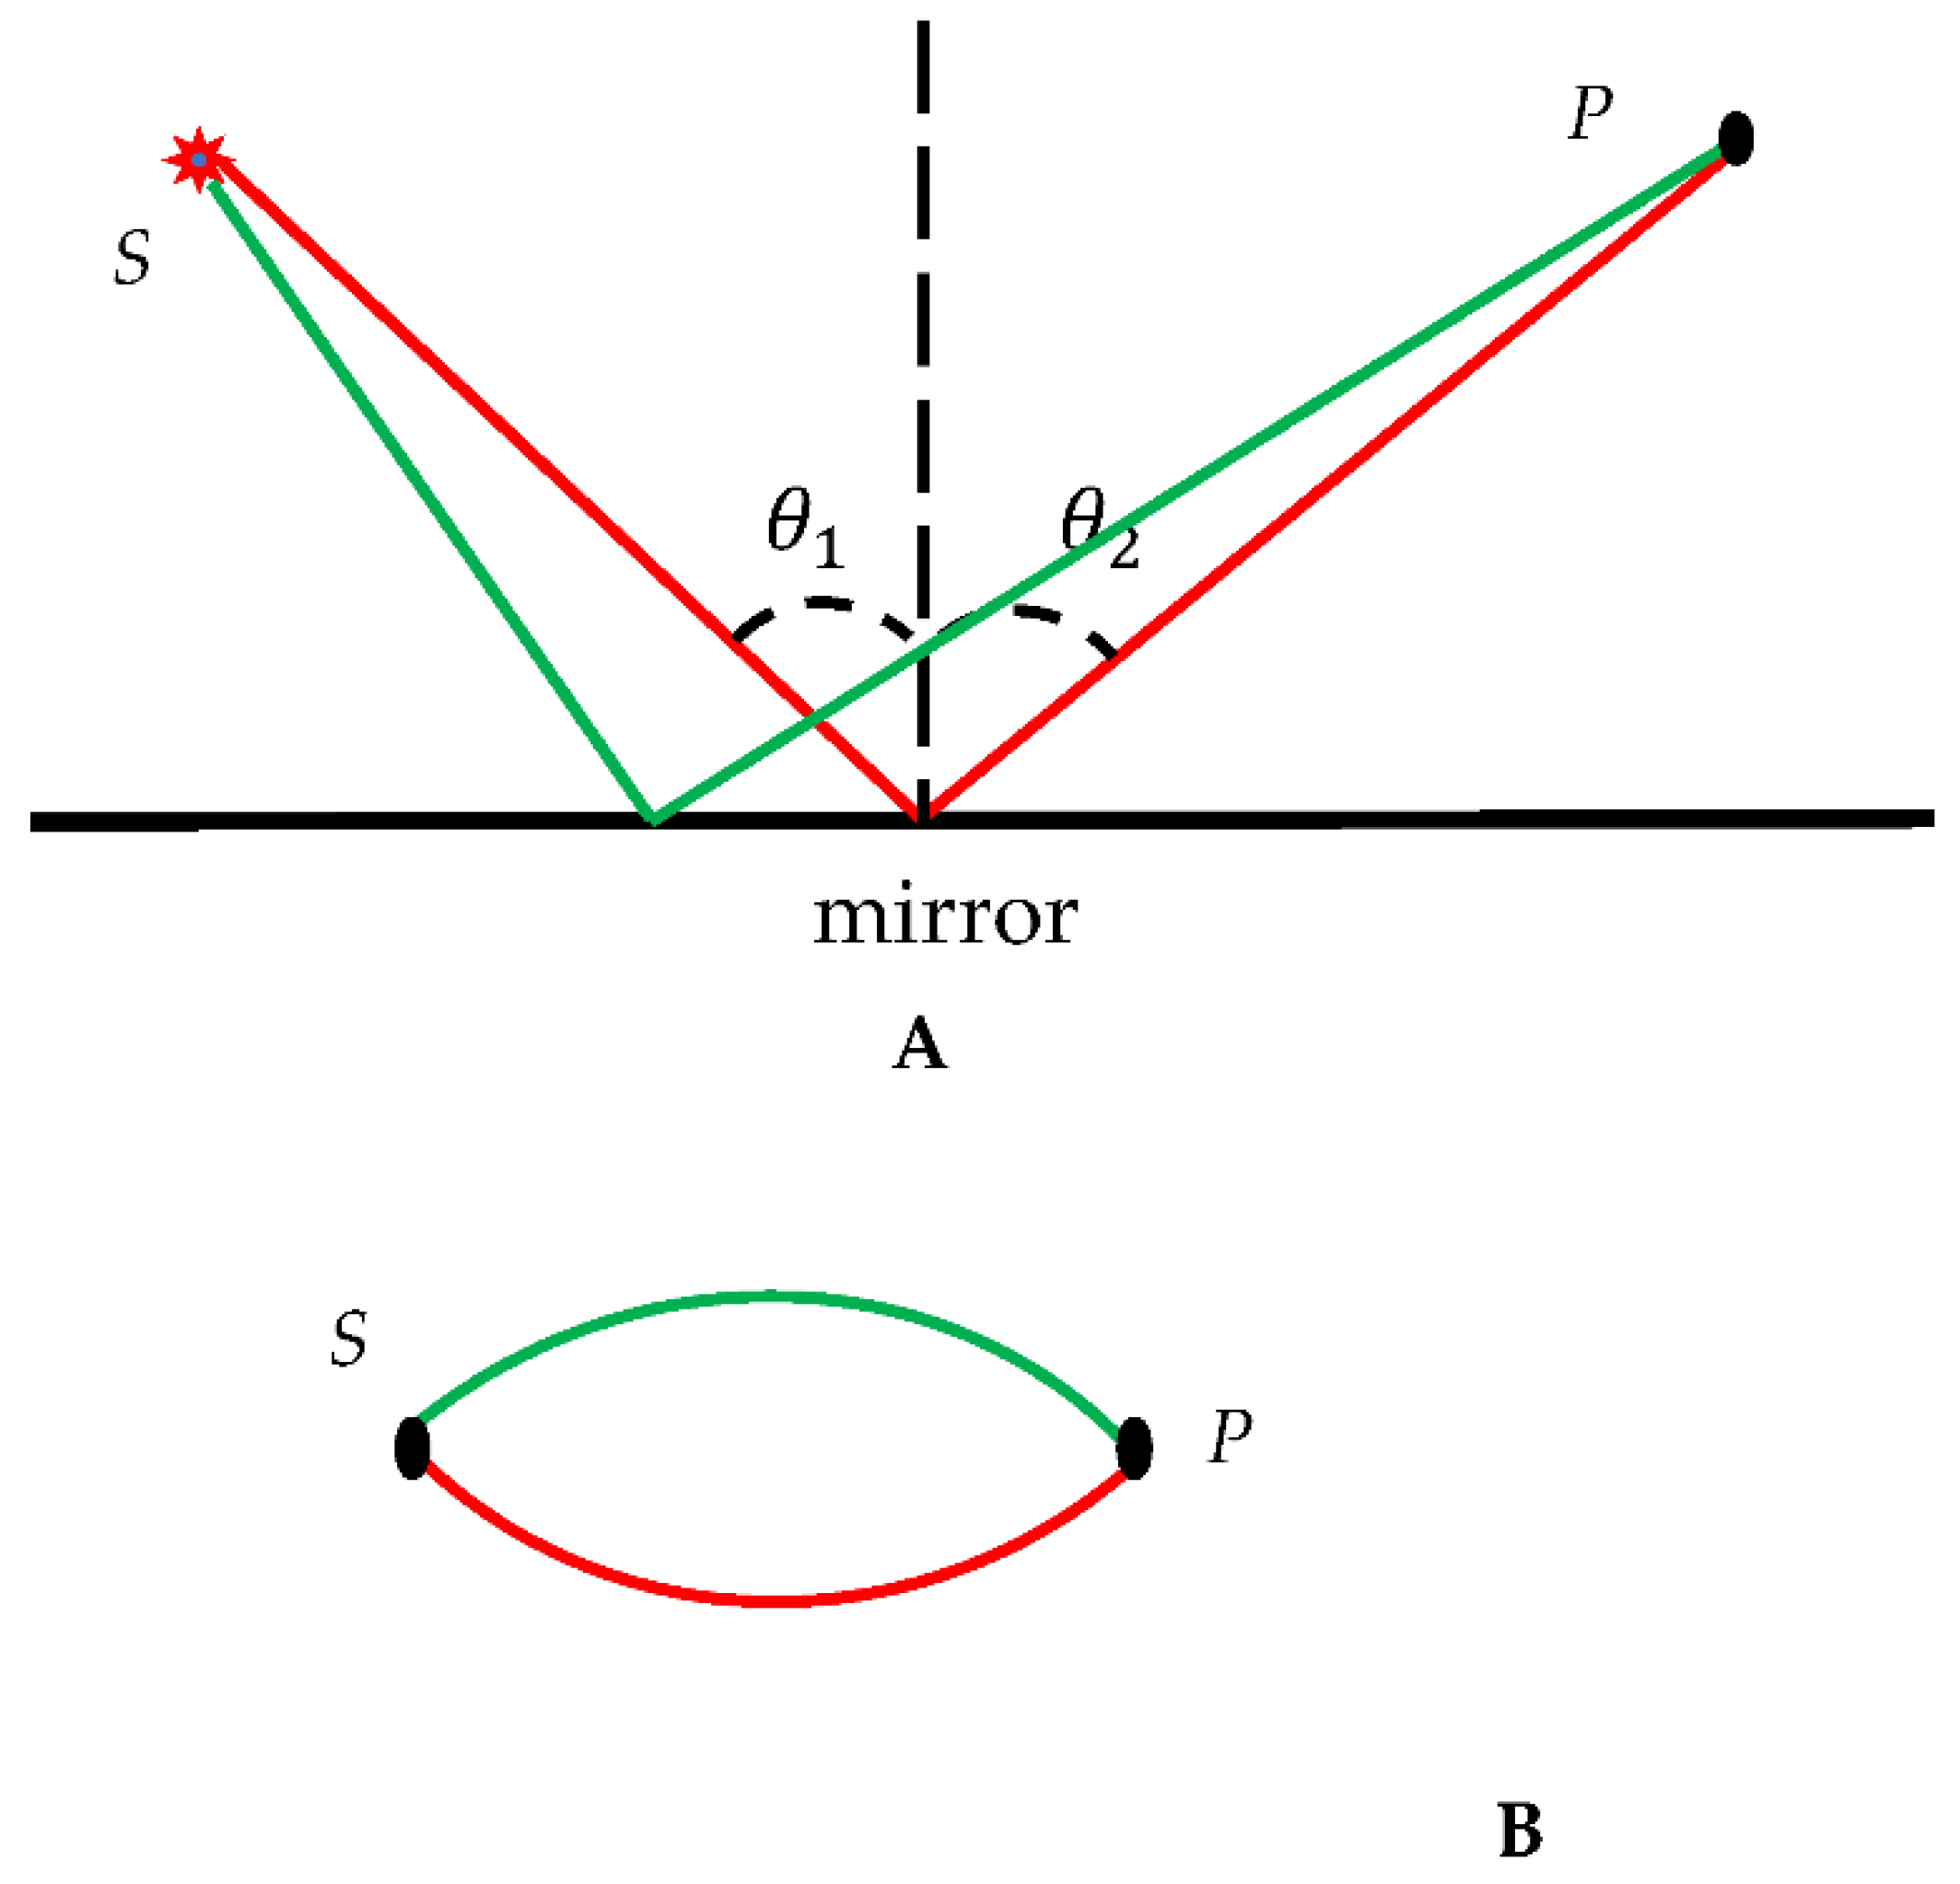
Figure 1A.The mirror is supposed to be ideal; thus, the usual law of light reflection works [
1], and the angle of reflection equals the angle of incidence
as shown in
Figure 1A.
Figure 1.
Converting of the reflection experiment into the bi-color graph is depicted. A. The system is built from the source, placed in point S, sensor located in point P and ideal mirror; thus, takes place. Two kinds of optical paths are depicted. The red trajectory corresponds to the actual optical path; the green trajectory corresponds to the trial/virtual optical path. B. Bi-colored sketch, corresponding to the reflection experiment is shown.
Two kinds of optical paths of the beam generated by the source, located in point
S are possible; namely, the actual path, depicted with the red line, in
Figure 1A, for which the reflection law
is true, and the trial/test/virtual path depicted with the green line in
Figure 1A. The actual/red optical path emerges from the Fermat Principle [
1]. The use of the trial pathways is the usual procedure exploited within the variational principles of physics, such as the Hamilton principle and the Fermat principle [
1]. We propose now the following mathematical procedure converting the real optical experiment depicted in
Figure 1A into the scheme shown in
Figure 1B. Vertices in the graph, presented in
Figure 1B corresponds to the actual points
S and
P in the source/mirror experiment, shown in
Figure 1A, red and green edges/links correspond to the actual/trial optical paths, presented in
Figure 1A. According to principle of reversibility of light, if the path of the light is reversed after suffering a number of reflections and refractions, then it retraces its path [
1]. Thus, vertices
S and
P may be replaced. It should be emphasized that the coloring scheme, presented in
Figure 1B is not a graph; in a graph two vertices are connected by the unique edge/link. The introduced coloring scheme omits the real physical processes occurring within the physical system, and represents only actual and trial optical paths of the light propagation.
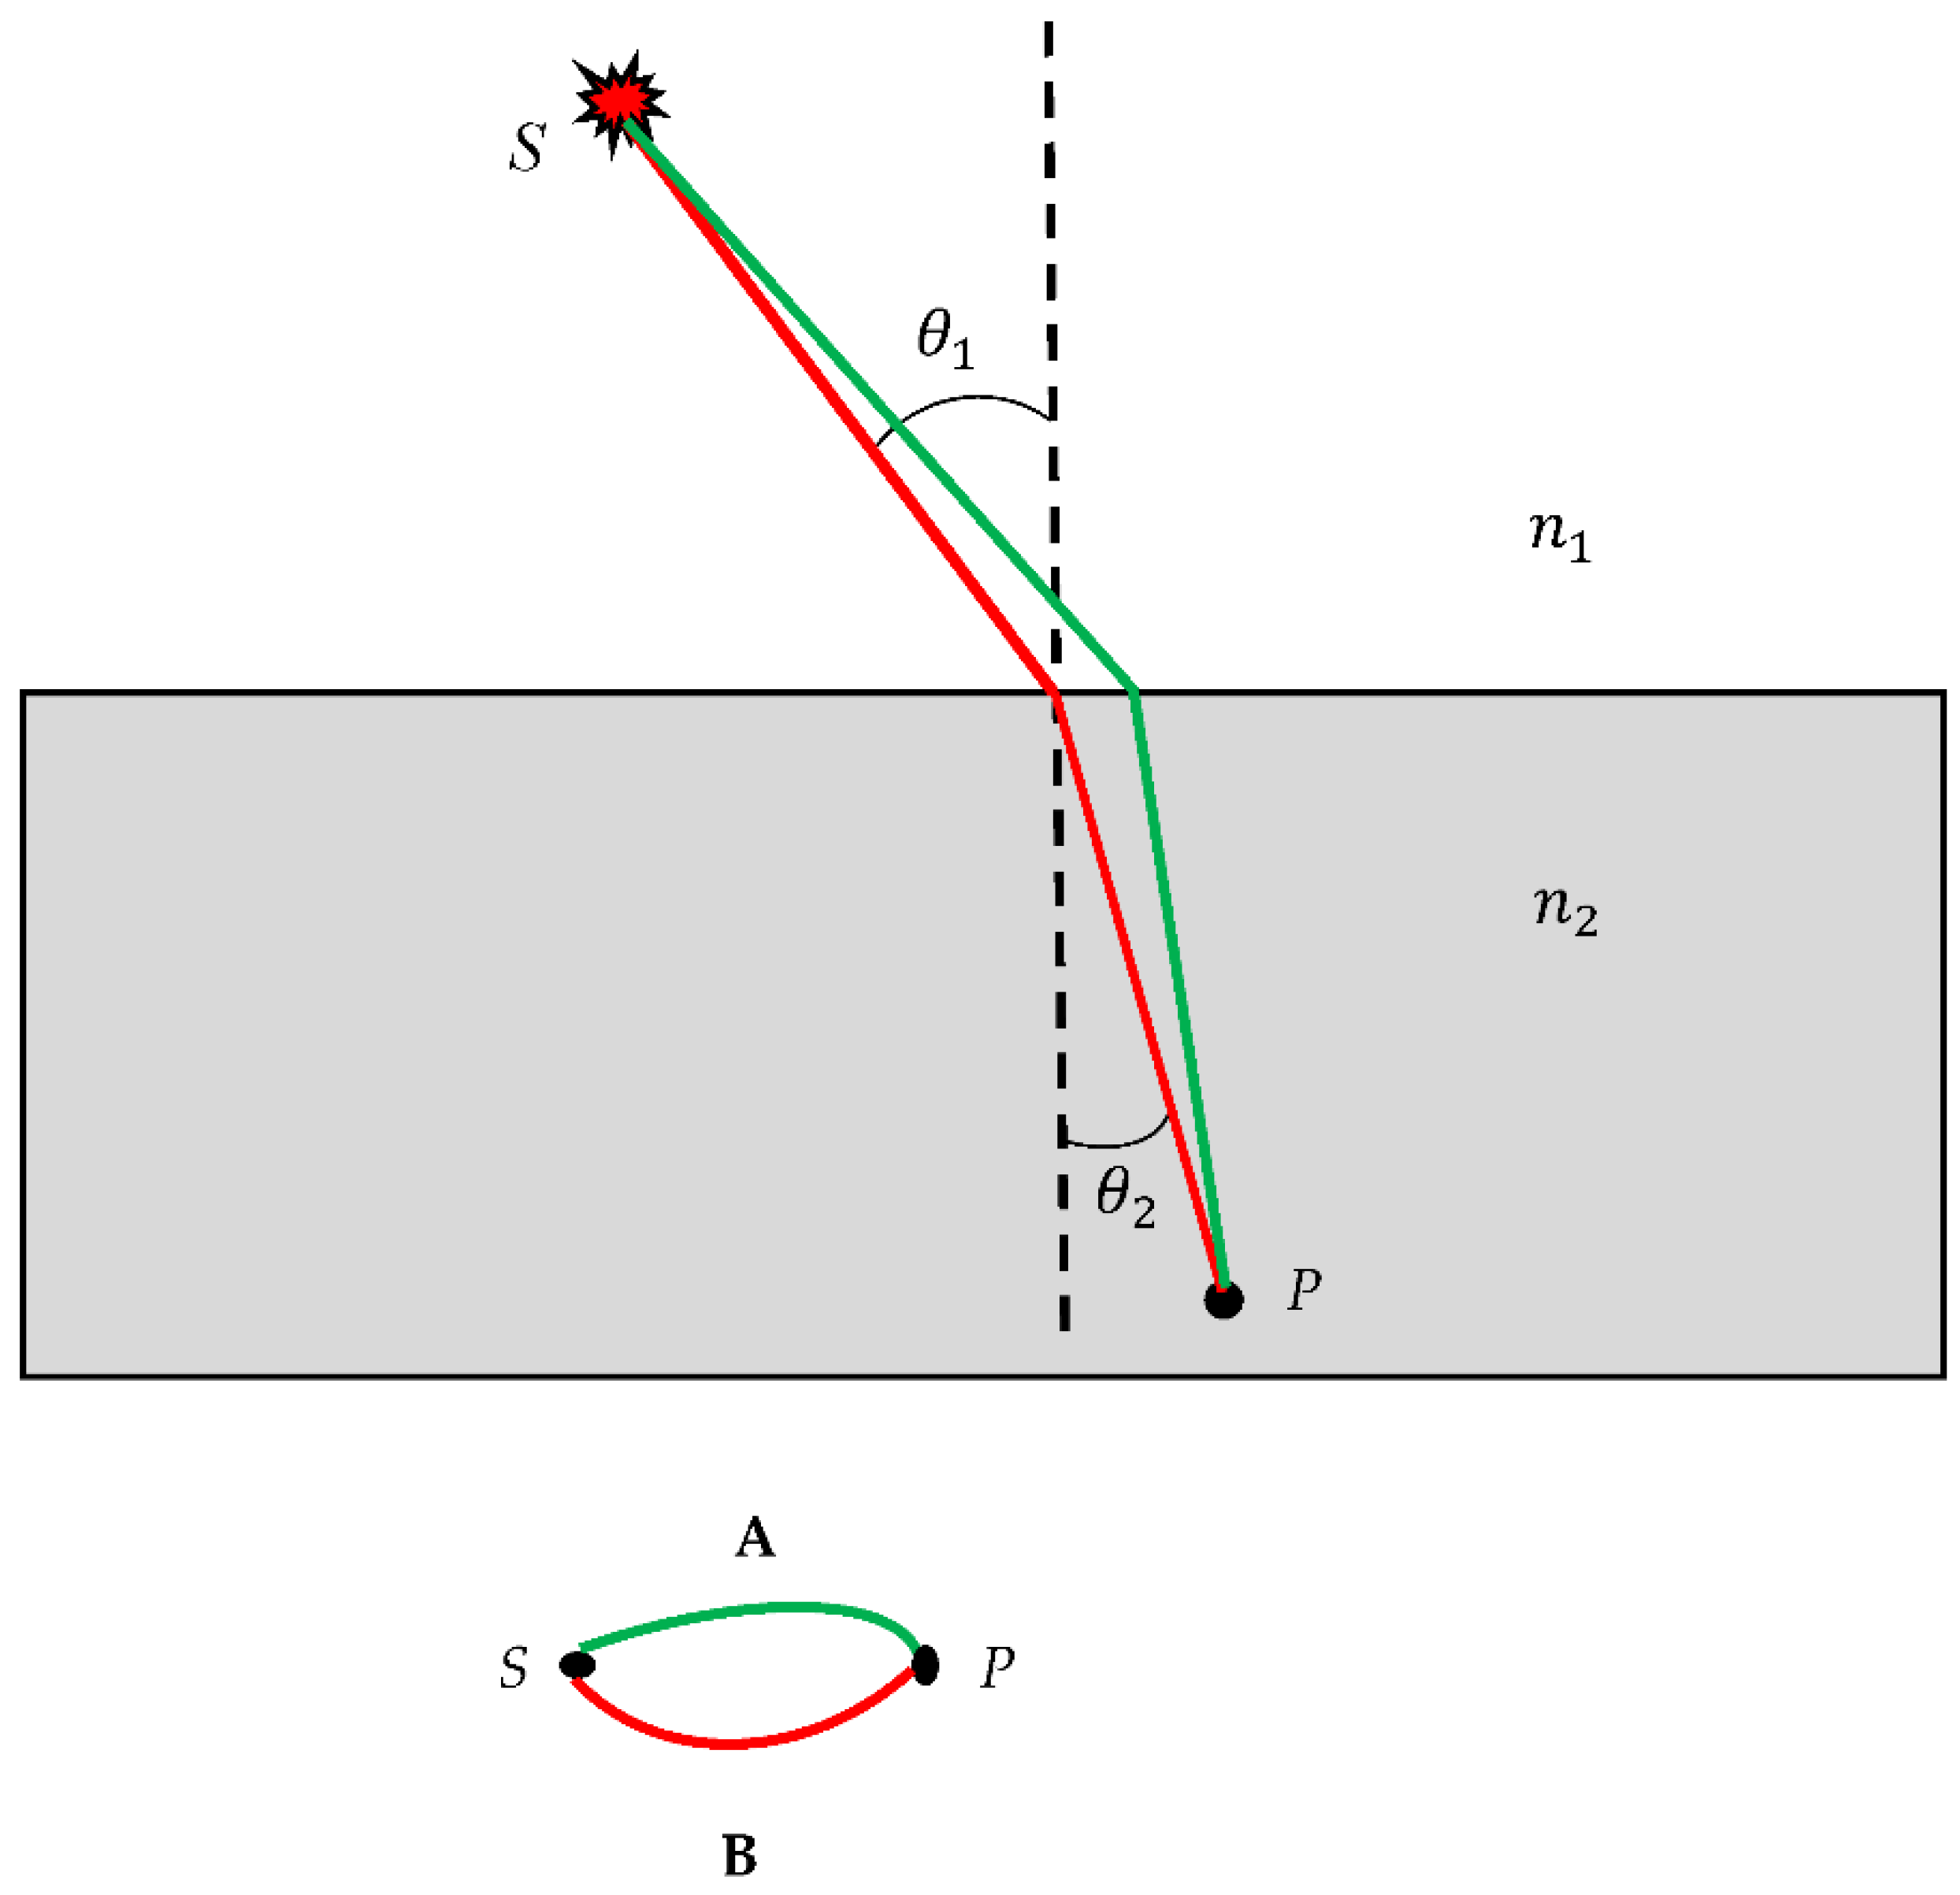
Now we apply the introduced procedure of the converting of real optical event into the optical scheme emerging from the refraction experiment. When the light forming a ray moves from one medium to another – say from air to the glass slab – the incident ray changes the direction at the boundary between the media; the ray is said to undergo – refraction (see
Figure 2). Let the index of refraction of the medium with the incident ray be
and that of the medium to be with the refracted ray be
. In optics, very roughly speaking, the refractive index (or refraction index) of an optical medium is a dimensionless number that gives the indication of the light bending ability of that medium. The angles, that the incident and refracted rays make with the line normal to the boundary between the media are denoted
and
(the angles are shown in
Figure 2, the normal is depicted with the dashed line). The interrelation between the angles and the refraction indices is given by Eq. 4:
This result found by Willibord Snell in 1621 is known as a Snell’ law [
1]. Restoring historical justice demands to say that refraction and reflection of light were first studied by Ḥasan Ibn al-Haytham (965-1040) a medieval mathematician, astronomer, and physicist of the Islamic Golden Age from present-day Iraq [
28]. Ibn al-Haytham was the first to correctly explain the theory of vision, and to argue that vision occurs in the brain, pointing to observations that it is subjective and affected by personal experience [
28]. He also stated the principle of least time for refraction, which would later become the Fermat's principle addressed in the Introduction Section. Coverting of the refraction experiment into the bi-colored graph is illustrated with
Figure 2. The source is located in point
S, the sensor is placed in point
P. Two kinds of optical paths of the beam generated by the source, located in point
S are possible; namely, the actual path, depicted with the red line, in
Figure 2A, for which the Snell/Ibn al-Haytham is true, namely
takes place; and the trial/test/virtual path depicted with the green line in
Figure 2A.
Again, according to principle of reversibility of light, the vertices
S and
P may be mutually replaced [
1].
Figure 2.
Bi-color sketch emerging from the refraction experiment is depicted. A. Light beam passes from the medium with the refraction index to the medium The interrelation between the angles and is given by the Snell Law:; Two kinds of optical paths are depicted. The red trajectory corresponds to the actual optical path; the green trajectory corresponds to the trial/virtual optical path. B. Bi-colored scheme, corresponding to the refraction experiment is shown.
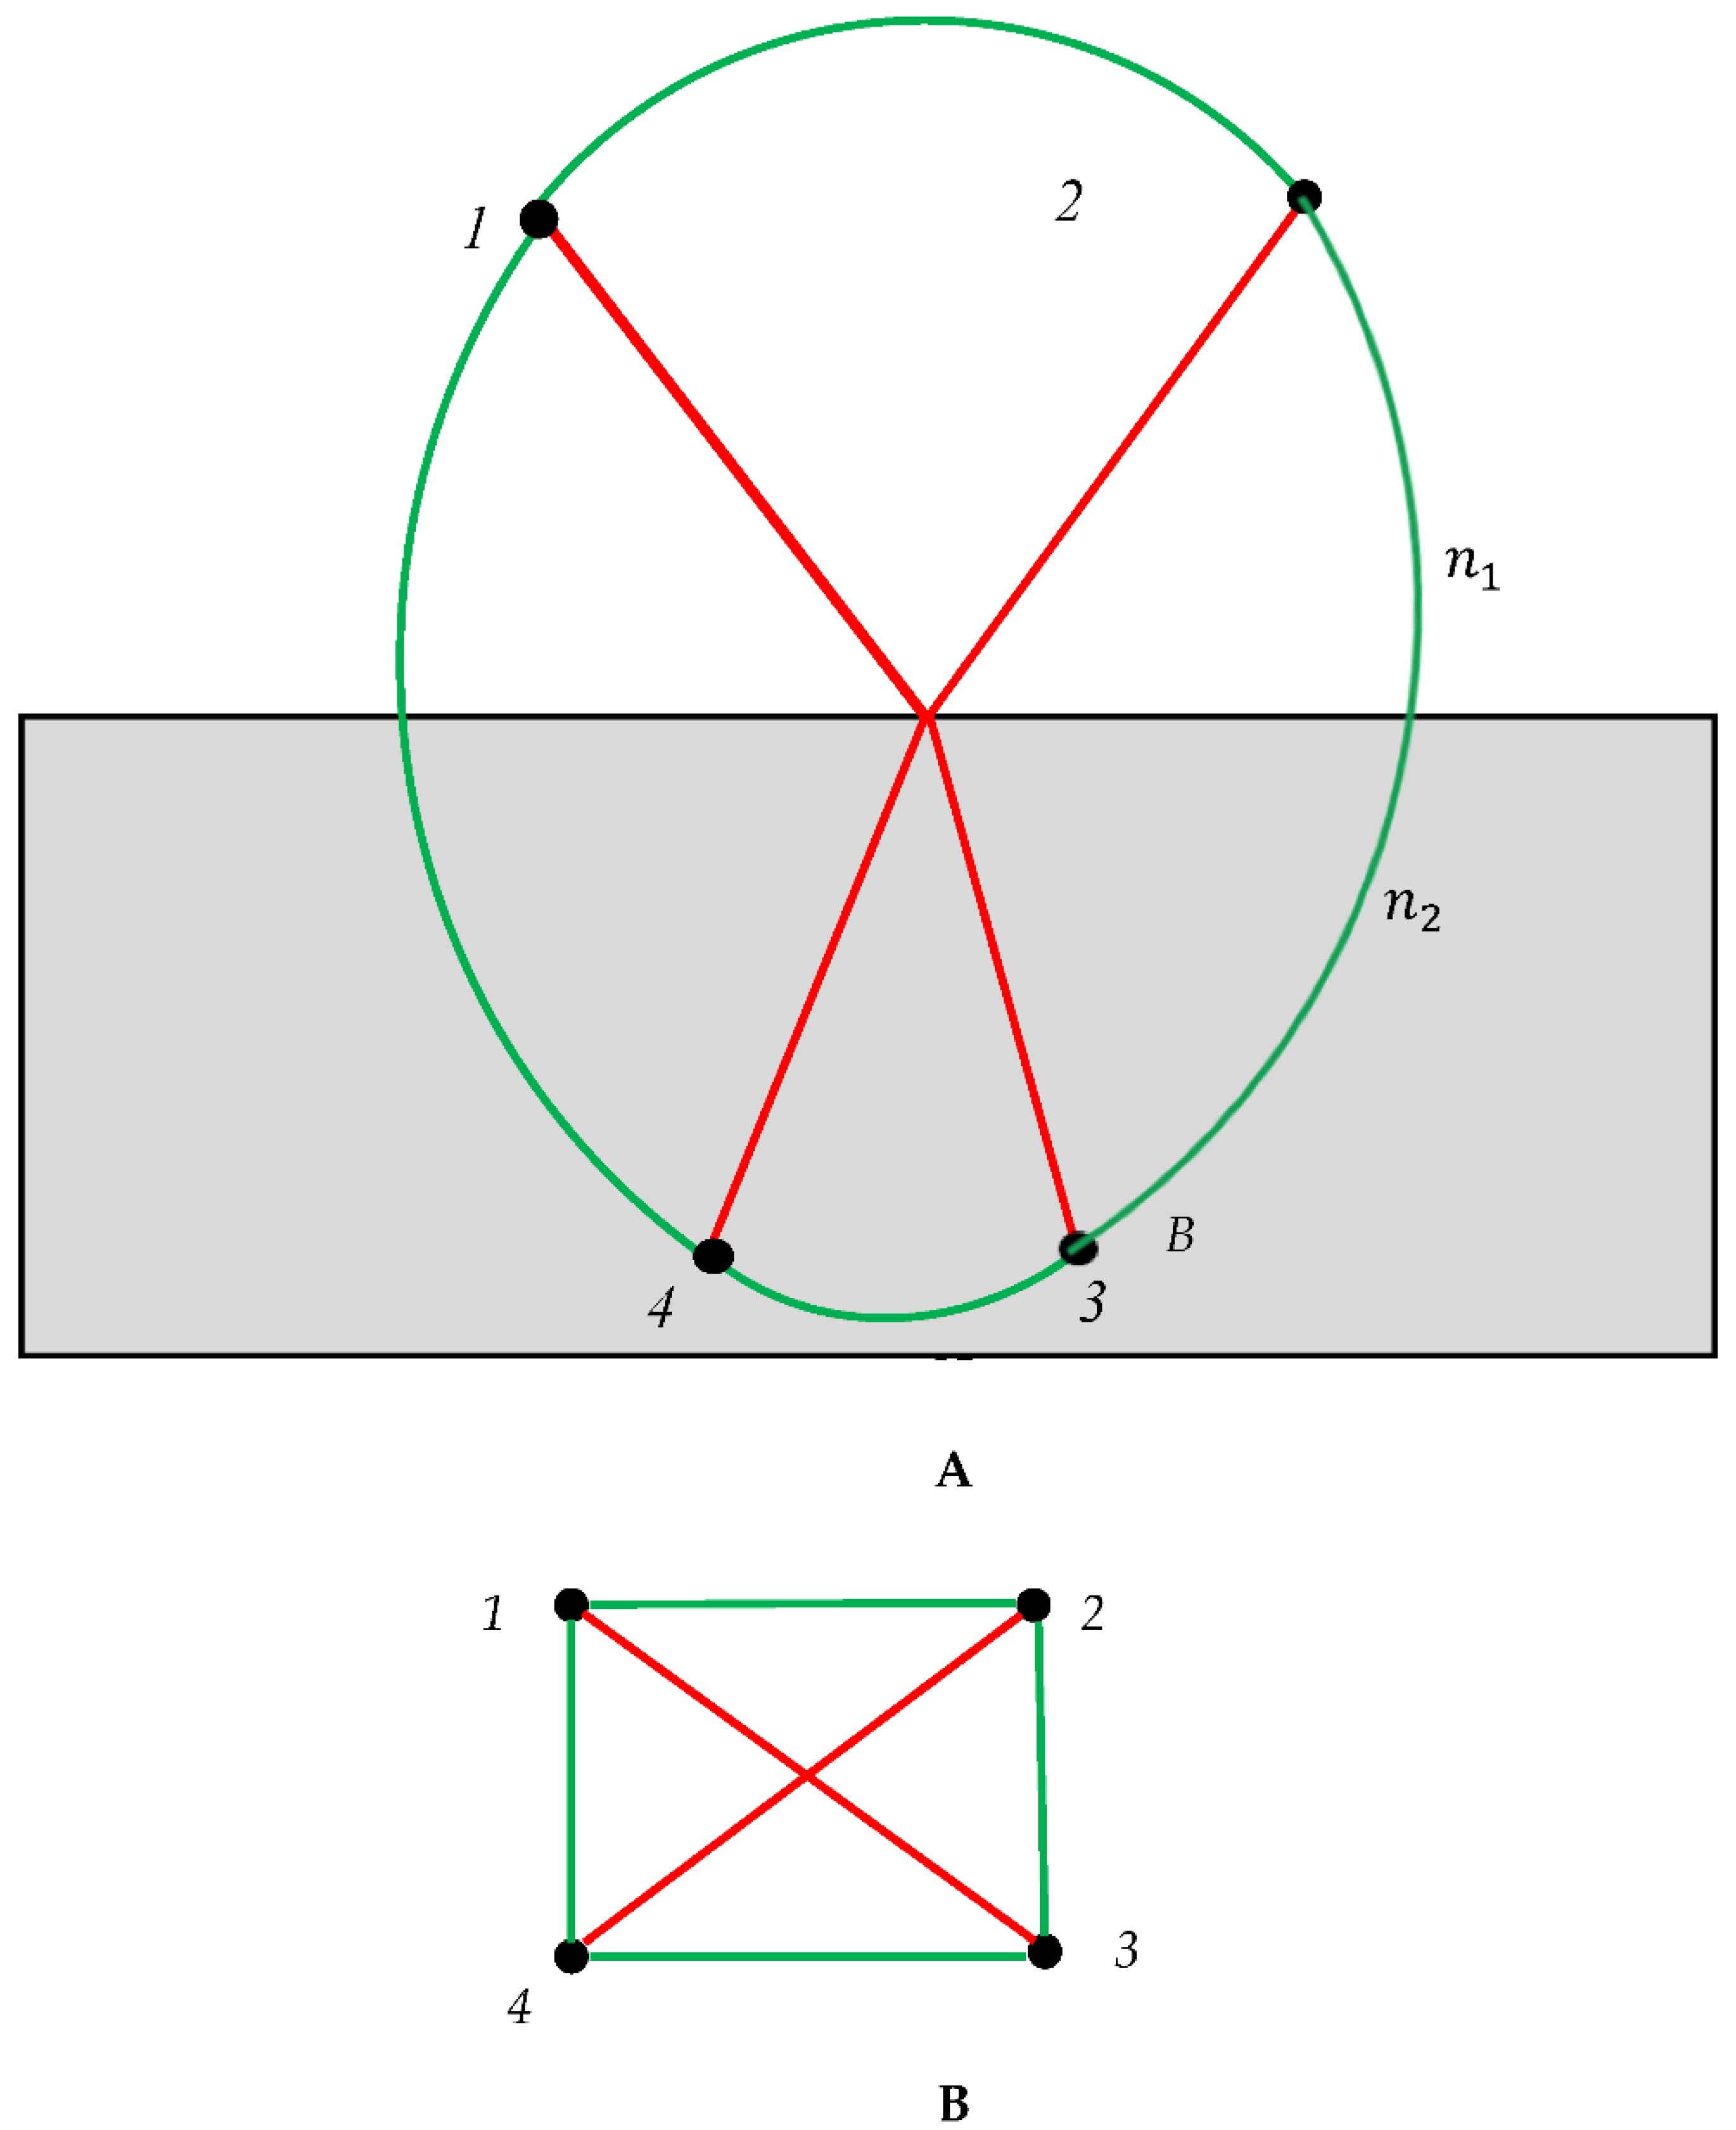
Now we consider the optical experiment in which light rays are generated by a pair of sources, located in points “1” and “2”, as shown in
Figure 3A. Light is refracted at the inteface separating media
and
(see
Figure 3A). Light sources are placed in points “1” and “2”; the sensors are placed in points “3” and “4”. Again we consider two kinds of optical paths: actual paths governed by the Snell law, colored with red, and the trial virtual paths, which actually do not take place, shown with green links in
Figure 3A. Every pair of vertices is connected by a single link. Thus, complete bi-colored graph, depicted in
Figure 3B emerges (and it should be emphasized that
Figure 3B depicts a graph). We call this graph the “optical graph”. This graph contains no mono-colored (fully red or green) triangle; in other words no opical cycle is recognized in the graph. Indeed, according to the Ramsey Theorem it is possible to create complete bi-colored graph, in which no mono-colored triangle appear, and this is to the
. Again, it should be emphasized, that the optical graph depicted in
Figure 3B is a complete, bi-colored, non-directed one [
10,
11,
12,
13,
14].
Figure 3.
Formation of the graph emerging from the ligth refraction. A. Refraction of the light generated by the sources located in points “1” and “2” is depicted. sensors are placed into points “3” and “4”. Red paths coresspond to the actual optical paths; green paths corespond to the trial optical paths which actually do not occur. B. Converting of the optical experiment into the bi-colored, non-directed optical graph, built of 4 vertices and 6 links is depicted. No mono-colored triangle/cycle is reconnized in the graph. This is possible due to the Ramsey Theorem,
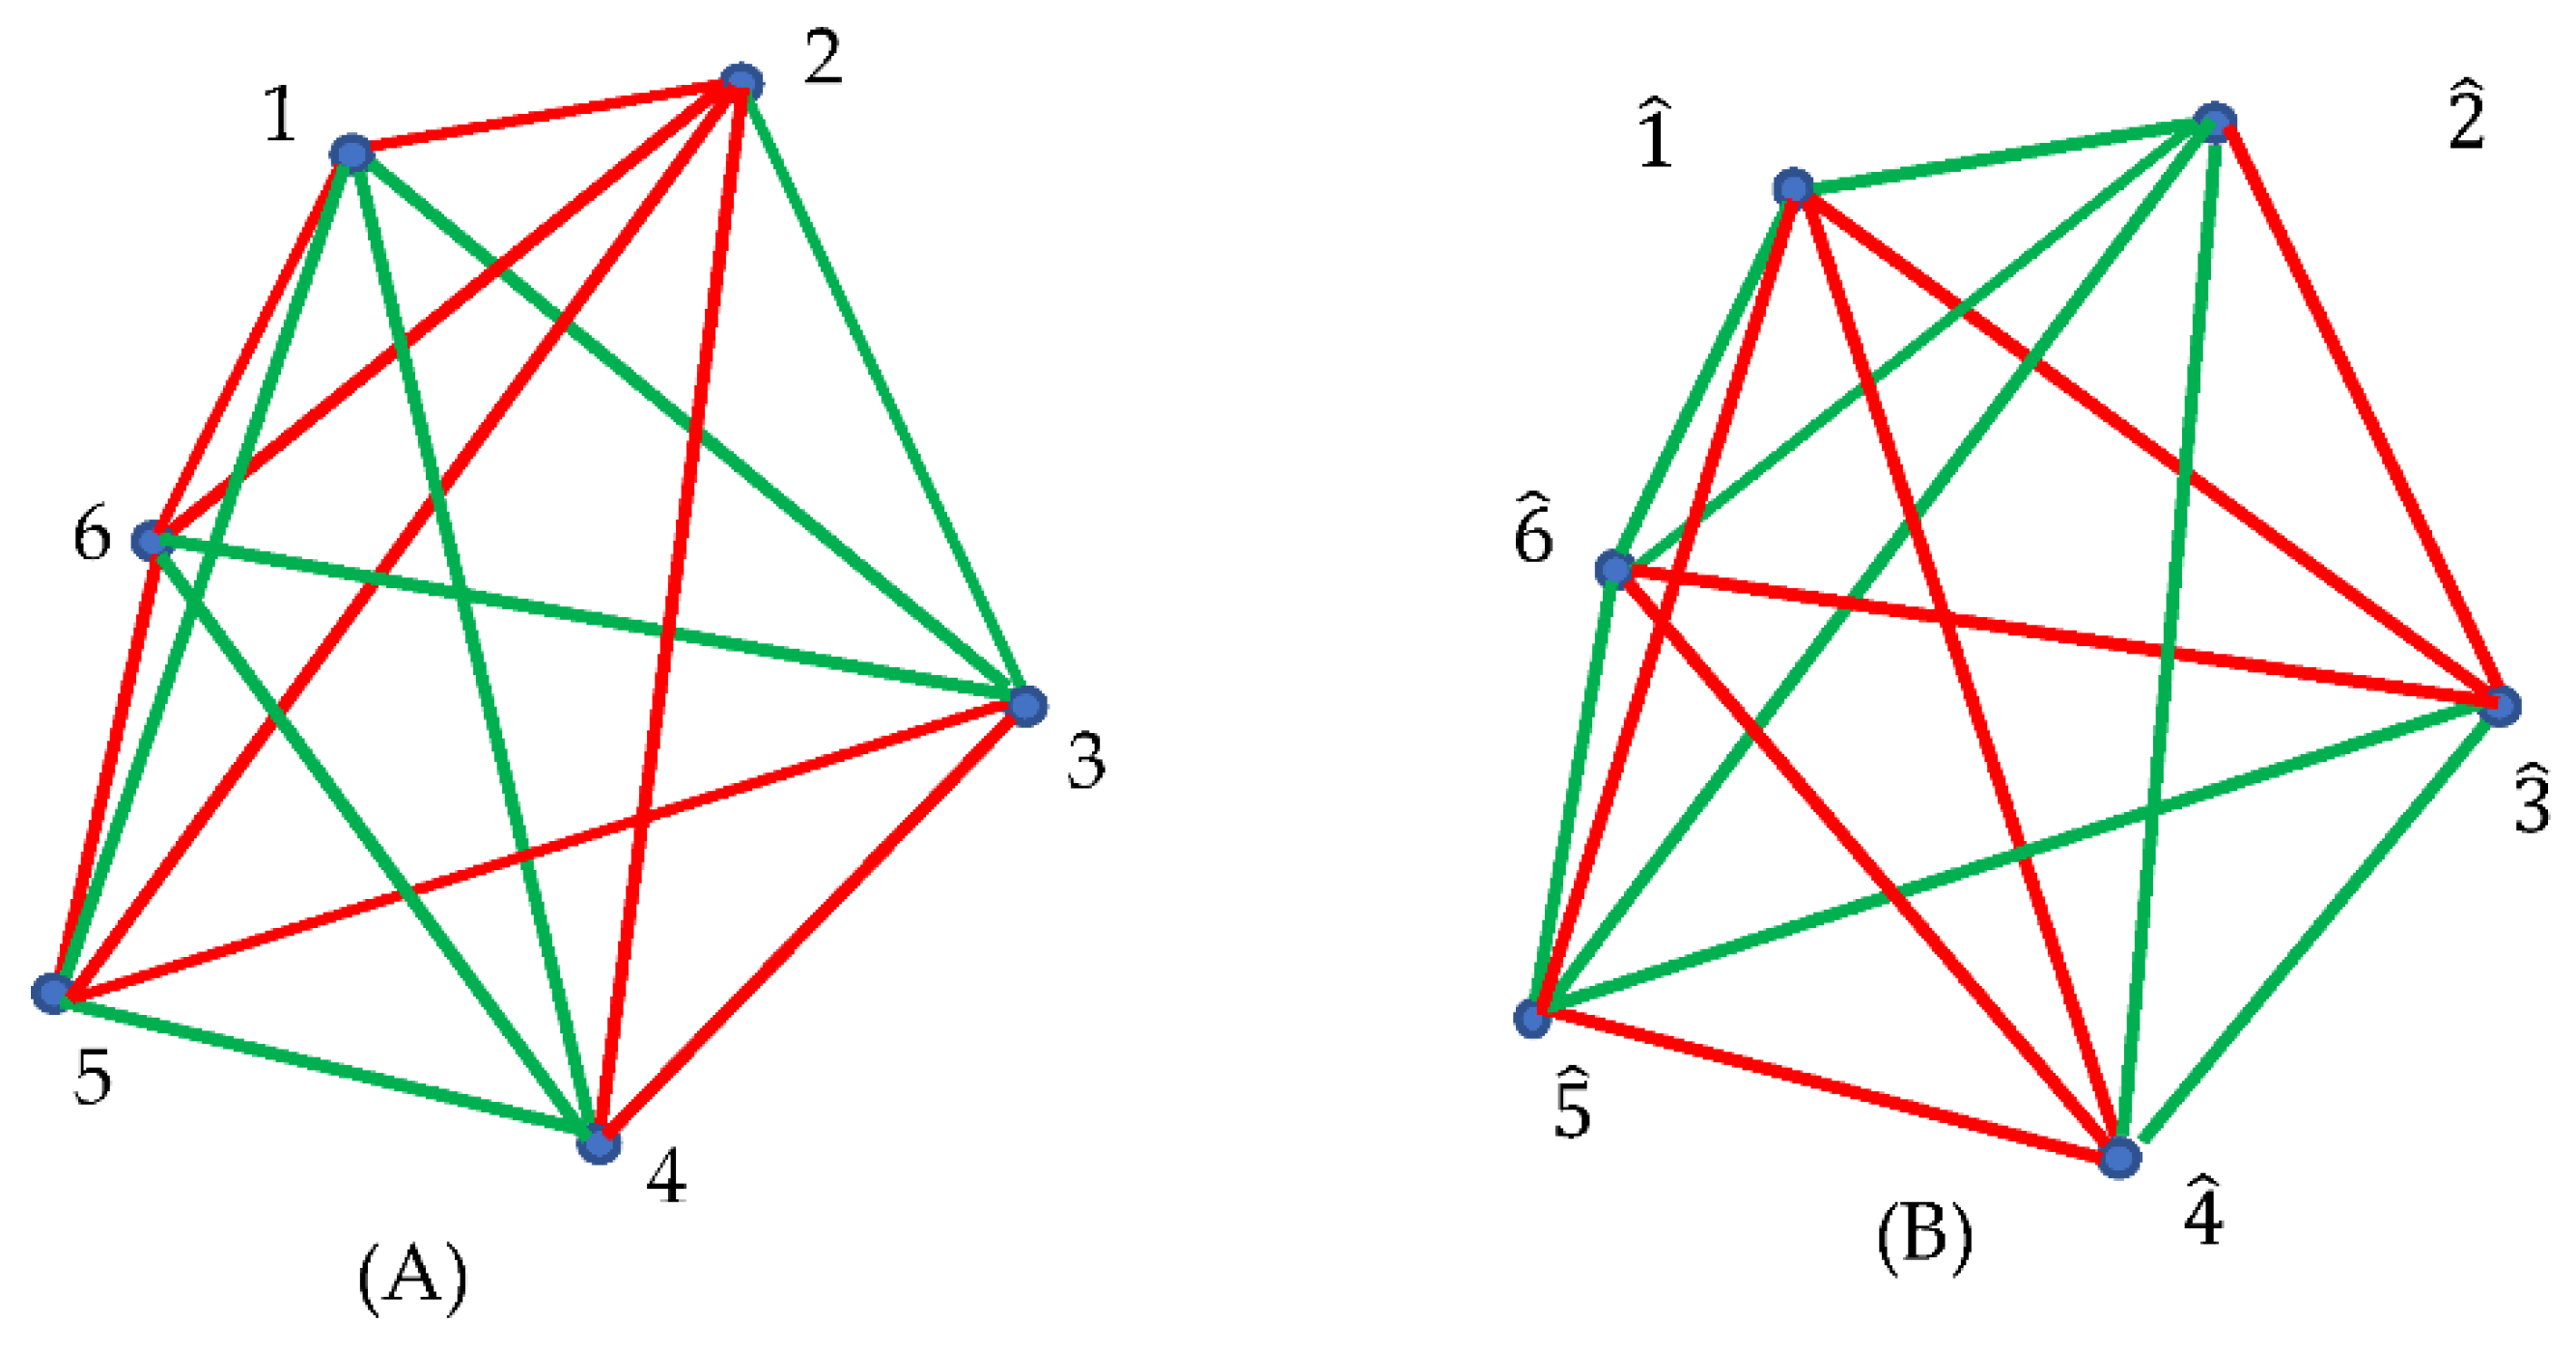
Now consider the optical experiment in which we have three sources placed in the points “1”, “2” and “3; sensors are placed in points “4”, “5” and “6”. Again we consider two kinds of optical paths: actual paths (we do not specify the physics of the light propagation), colored with red, and the trial virtual paths, which actually do not take place, shown with green links in Figure 4A. Every pair of verices is connected with a unique link/optical path. Thus, the optical complete, non-directed, bi-colored graph, depicted in Figure 4A emerges.
It should be emphasized that that the introduced coloring of the links is non transitive. Indeed, consider propagation of the light according to red/actual paths , followed by actual propagation . In this case points “1” and “3” may be conneccted by red/actual or green/virtual paths/links. This fact is very important ia view of application of the Ramsey Theorem for the analysis of complete, bi-colored graphs.
Figure 4.
A. Complete, bi-colored graph corresponding to the optical experiment, in which light sources are located in the points labeled “1”, “2” and “3”. Red paths coresspond to the actual optical paths; green paths corespond to the trial optical paths which actually do not occur. The triangle “126” and “256” are mono-colored and built of red edges only. The mono-colored triangles represent actual optical cycles. B. The inverse graph emerging from the graph, shown in Figure 4A is depicted; triangles and are monochromatic and represent the optical cycles which do not occur.
According to the Ramsey theorem, at least one monochromic triangle/cycle should necessarily appear within the graph, shown in
Figure 4A due to the fact that the Ramsey number is
. Indeed, the triangles “126” and “256” are built of red edges, and corresponding to actual optical cycles (see
Figure 4A). And this result will be true for any optical experiment, represented by the bi-colored, complete, undirected graph comprising six verices; namely, at least green or red optical cycle will necessarily appear. Thus, we recognize two so-called “optical cycles”, appearing in
Figure 4A. Optical cycles attracted an essential attention of invesigators in the fields of photonics and nano-photonics recently [
29,
30,
31]. Regrettably, it is impossible to predict what kind of mono-colored triangle: red/actual or green/virtual one will appear in the graphs; the Ramsey Theory has no tools for such a prediction, and it it is impossible to predict: what kind of cycles (actual or virtual) will be necessarily present in the graph. This is, of course, a weak point of the Ramsey approach.
Now we introduce the notion of the inverse bi-color Ramsey graphs, generated by the source graph; namely we replace red links appearing in the source graph with red ones, and vice versa, as shown in inset (B) of Figure 4. In other words, actual optical paths are replaced with the trial, virtual ones, and vice versa. The inverse optical graph is a complete graph. The vertices of this optical graph are denoted in inset (B) of Figure 4. We call such a Ramsey network the “inverse graph”. Obviously, introducing an inverse Ramsey network is possible for any complete source graph, and in particular for the graphs, representing optical experiments. According to the Ramsey theorem, both the source and inverse optical graphs, arising from six vertices, contain at least one monochromatic triangle. Thus, actual or virtual optical cycles will be necessarily present in the both of source and inverse optical graphs. Indeed, we recognize red monochromatic triangles and in inset (A), and, correspondingly green triangles and in inset (B) of Figure 4. Green triangles represent virtual optical cycles, which actually do not occur.
It is noteworthy, that the total number of triangles in the “direct” (source) and “inverse” Ramsey optical graphs is the same, thus, yielding the conservation law:
where
are the numbers of red and green triangles in the source graph;
are correspondingly the numbers of red and green triangles in the inverse graph. Eq. 5 represents the “conservation law” for the Ramsey complete networks built of six elements. It is noteworthy that direct and inverse graphs form the Abelian (commutative group), when the inversion of the color of the link is taken as an operation.
2.2. Ramsey approach to metamaterials
The alternative application of the Ramsey approach is possible for the light propagating in metamaterials (left-handed media [
5,
6]). We already mentioned that in the metamaterials the Fermat principle should be generalized as follows: a light ray in going from point
S to point
P must traverse an optical path length
L that is stationary with respect to variations of this path. By a stationary value of the function
(see Eq. 1), we mean one for which the slope of
versus
s is zero or equivalently where the function
has a maximum, minimum or a point of inflection with a horizontal tangent [
1,
6]. The kind of extremum (maximum, minimum or inflection point) depends on the actual values of the refraction index of the medium [
1,
6]. Thus, one more optical interpretation of the Ramsey theory becomes possible in meta-materials. For a sake of simplicity, we exclude the exotic situation, when the optical path corresponds to the inflection point of the function
Thus, bi-colored, complete graphs, similar to the depicted in
Figure 5 become possible.
Figure 5.
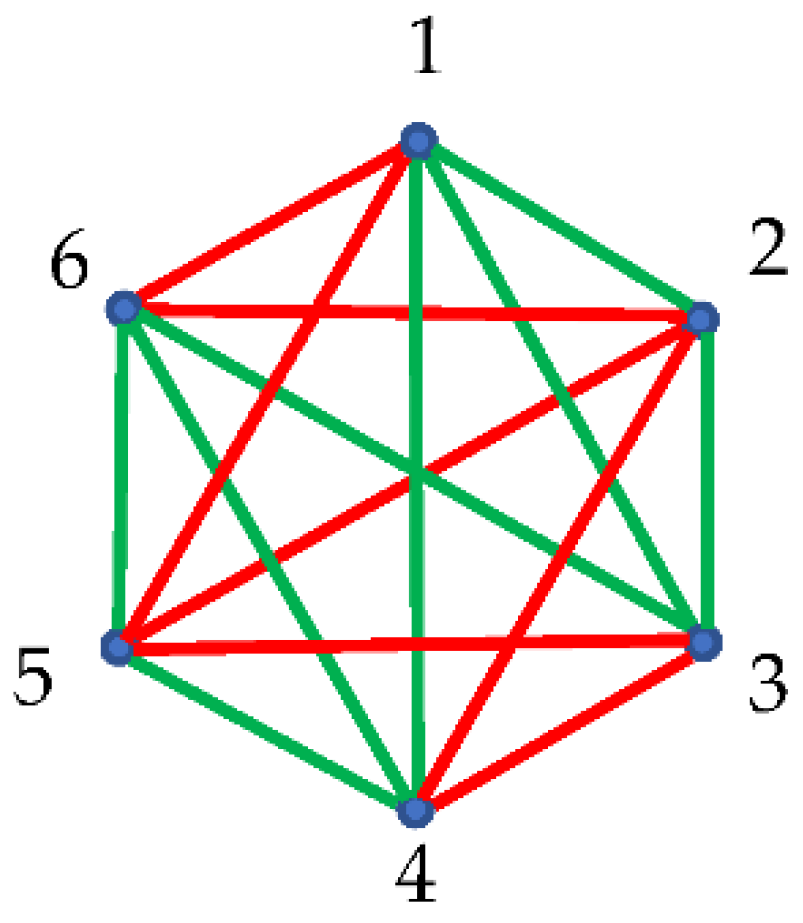
Complete optical graph corresponding to propagation of light in the meta-material. The vertices of the graph correspond to the point of the physical space in which sources or sensors are placed. Links corresspond to the actual optical rays. Red links correspond to the optical paths for the function demonstrates maximum; green links correspond to the optical paths for the function demonstrates minimum. Triangles “456” and “123” are mono-colored (green).
Consider the graph built of six vertices, corresponding to the points of the physical space, in which sources or sensors are placed. All of the links of the graph correspond to the actual optical pathways. We assume that red links correspond to the optical paths for the function
demonstrates maximum; green links, in turn, correspond to the optical paths for the function
demonstrates minimum. Thus, the complete, undirected, optical graph, such depicted in
Figure 5 emerges. According to the Ramsey Theorem this complete graph inevitably contains at least one mono-colored triangle. Indeed, triangles “456” and “123” are mono-colored (green). Thus, two optical cycles built of optical pathways “456” and “123”, for which
is minimal will be observed in the addressed optical experiment [
29,
30,
31]. And now, these pathways are actual optical paths.
Again, the inverse optical graph, may be defined according to the procedure introduced in
Section 2.1, and the conservation law resumed by Eq. 5 will take place.
2.3. Optical Interpretation of the Infinite Ramsey Theorem
Until now, we consider finite graphs. In this Section we will address infinite complete graphs, Infinite Ramsey Theory and their optical interpretation, giving rise to infinite optical graphs. The Infinite Ramsey Theory states: if the complete graph of a countably infinite set is colored with finitely many colors, there is an infinitely monochromatic clique. A clique is a subset of vertices of an undirected graph such that every two distinct vertices in the clique are adjacent. Let us illustrate the Infinite Ramsey Theorem with an understandable example [
11,
12,
13,
14,
15]: let us think about all the positive integers, and imagine joining every pair with a line, as shown in
Figure 6. Every pair of positive integers is joined by a line/link. Let us denote the emerging graph as
. Now we color each link either red or green; thus, we build the complete two-colored graph. The infinite two-color Ramsey Theorem States that: no matter how we two-color the edges in
it will always be possible to find infinitely many points that are all connected by the same color. In other words: consider
which is the complete graph whose vertex set is countably infinite, every 2-colored
must contain a countably infinite monochromatic complete graph. The formulation of the infinite Ramsey theorem for multi-colored graphs, states that if we color each edge of an infinite, complete graph, with one out of finitely many prescribed colors, then there is an infinite, complete monochromatic subgraph. That is, an infinite set of vertices such that all edges among them have the same color.
Figure 6.
Infinite Ramsey Theorem is illustrated for twin-colored infinite graphs: any two-colored must contain a red or green monochromatic countably infinite complete subgraph.
Figure 6.
Infinite Ramsey Theorem is illustrated for twin-colored infinite graphs: any two-colored must contain a red or green monochromatic countably infinite complete subgraph.
The more general formulation of the Infinite Ramsey Theorem states, that if we split an infinite object with a certain regularity property (such a set containing arbitrary long arithmetical progressions) into two parts, one infinite part will exhibit this property too [
12].
Now let us supply the optical interpretation of the Infinite Ramsey Theory. Consider the infinite number of the points of the physical space, numbered “1”, “2”, “3”… Sources or sensors are located in the points. Every point is joint by a link corresponding to the optical event/optical path, namely red link corresponds to actual optical paths coressponding to the light propagation between the connected points; a green link, in turn, corresponds to the trial/virtual optical path, which does not actually occurs. Two points are connected with a single link. Thus, the complete, undirected optical graph, similar to that, depicted in
Figure 6 emerges. According to the Infinite Ramsey Theorem, infinite, complete monochromatic subgraph (either green or red) will necessarily appear in the graph, in other words an infinite monochromatic clique will be present in the graph. Thus, the actual or trial/virtual optical path connecting all of the points will be necessarily present in the graph. According to principle of reversibility of light the addressed infinite bi-colored graph will be non-directional. The generalization of the infinite Ramsey Theorem for metamaterials is straightforward (see
Section 2.2), if we assume that red links correspond to the optical paths for the function
demonstrates maximum; green links, in turn, correspond to the optical paths for the function
demonstrates minimum.
