Preprint
Article

Theoretical Spectra of Lanthanides for Kilonovae Events: Ho I-III, Er I-IV, Tm I-V, Yb I-VI, Lu I-VII

Altmetrics

Downloads

84

Views

20

Comments

0

A peer-reviewed article of this preprint also exists.

This version is not peer-reviewed

Submitted:

22 November 2023

Posted:

23 November 2023

You are already at the latest version

Alerts
Abstract
The broad emission bump in the electromagnetic spectra observed following the detection of gravitational waves created during the kilonova event of merger of two neutron stars in August 2017, GW170817, has been linked to the heavy elements of lanthanides (Z=57-71), and a new understanding of creation of heavy elements in the r-process. The initial spectral emission bump has a wavelength range of 3000 - 7000 \AA, thus covering the region of ultraviolet (UV) to optical (O) wavelengths, and is similar to those seen for lanthanides. Most lanthanides have large number of closely lying energy levels which introduce extensive sets of radiative transitions which often form broad region of lines of significant strength. The current study explores these broad features through photoabsorption spectroscopy of 25 lanthanides ions, Ho I-III, Er I-IV, Tm I-V, Yb I-VI and Lu I-VII. With excitations only to a few orbitals up beyond the ground configurations, we find most of these ions cover large number of bound levels with open $4f$ orbital and produce tens to about hundred thousands lines that may form one or multiple broad features in X-ray to UV, O, and infrared (IR) regions. Spectrum of each of 25 ions is presented indicating presence, shape and wavelength region of the features. Accuracy of atomic data to interpret the merger spectra has been a outstanding problem. The present study aims at providing improved atomic data for energies and transition parameters obtained using relativistic Breit-Pauli approximation implemented in the atomic structure code SUPERSTRUCTURE. The present data have been benchmarked with available experimental data for energies and transition parameters. The study finds that number of ions under the present study are possible contributors of the emission bump of GW170817. All atomic data will be made available online at NORAD-Atomic-Data database.
Keywords: 
Subject: Physical Sciences  -   Atomic and Molecular Physics

1. Introduction

In 2017, LIGO and VIRGO collaborations detected the first gravitational waves generated by merger of two neutron stars, GW170817. This was followed by detection of electromagnetic waves, the spectrum of which showed similarity to those of the heavy elements, lanthanides (Z= 57-71) [1,2]. The observed spectrum exhibited a broad feature or an emission bump of wavelength range of 3000 - 7000 Å, covering ultraviolet (UV) to optical (O) wavelengths regions. The feature moved toward infrared (IR) region during the 10 days of observation, August 18 - 27, 2017 indicating effect of opacity, that is, absorption of the traveling radiation by the plasma and re-emission with some loss of the energy. Detection of the electromagnetic waves has opened up the new scope for understanding on how heavy elements are formed through the r-process. Heavy elements are known to be formed by neutron capture in the s(slow)-process inside a star or by a r-(rapid)-process during a supernova explosion. The spectrum give a new evidence of creation of heavy elements during merger of two neutron stars or two black holes or a combination of them. Interpreting of the emission bump of GW170817 will have a considerable impact on broadening our knowledge for a more complete picture of characteristic atomic features and of creation of elements. Since the finding, an urgent need for the atomic data for lanthanides and other heavy elements has increased. Over the next decade, it is expected that hundreds of mergers will be detected with the full network of current and upcoming gravitational detectors and electromagnetic telescopes.
Lanthanides are heavy elements with large number of electrons (Z=57-71). They have core ion configuration of Xe, [ 1 s 2 2 s 2 2 p 6 3 s 2 3 p 6 4 s 2 3 d 10 4 p 2 5 s 2 5 p 6 4 d 10 ] . In their ground state, the outer electron of a lanthanide can be in 4f, 6s, or 5d orbitals. Configurations of lanthanides can be described as [Xe] 4 f i 6 s j 6 p k 5 d l , where i,j,k,l are various occupancy numbers. These configurations introduce extensive number of radiative transitions that can form broad absorption features. Although lanthanides have been under study for a long time, the focus had been both academic and industrial largely because of the luminescence properties and exhibiting intense narrow-band emission that have large extent of various applications, such as, in optical amplifiers, active waveguides, fluorescent tubes.
Since the detection of the electromagnetic spectra, studies are being carried out to interpret the broad feature and identify the heavy elements that created it. Study includes other elements, in addition to lanthanides, that may fall within the wavelengths of the bump. However, the accuracy for the large sets of atomic data of these elements has been an outstanding problem. Theoretically, computation of lanthanide opacities is a formidable atomic physics problem since these atoms and ions have large number of electrons causing complex electron-electron correlation and relativistic effects, and open 4d- and 4f-orbitals introduce large number of fine structure energy levels resulting from a large Hamiltonian matrix. Among the existing past and recent calculations for the atomic data, Kasen et al [3] used Breit-Pauli intermediate coupling code AUTOSTRUCTURE which was created from and the same atomic structure methodology as SUPERSTRUCTURE, Tanaka and Hotokezaka [4] and Tanaka et al [5] used relativistic HULLAC code with parametric potential, and Tanaka et al [6], Radzute et al [7] used Dirac-Fock code GRASP2, Fontes et al [8] used semi-empirical Dirac-Fock-Slater code of Cowan [9]. Using the atomic data, a new periodic table with origin of creation of elements were produced by Johnson [10] who also using observed data. Kobayashi et al [11] produced another table using theoretical and observation models which differs somewhat from that of Johnson [10]. Kobayashi et al also wrote "Although our calculations provide opacities of a wide range of r-process elements, the detailed spectral features in the model cannot be compared with the observed spectra because our atomic data ... do not have enough accuracies in the transition wave- lengths."
Among the experimental work, the energy levels of lanthanides were measured by Martin et al [12]. These values are listed in NIST [13] compilation table. Carlson et al [14] computed ionization threshold energies for the ground configuration of lanthanides which are quoted at NIST [13] table, particularly when measured data are not available.
Individual transition probabilities, theoretical and calculated, are available for a limited number of transitions. They have been evaluated and compiled by NIST [13]. For the five lanthanides, these values were obtained mainly by Meggers et al [15], Morton [16], Komarovski [17], Wickliffe and Lawler [18], Sugar et al [19], Penkin and Komarovski [20], Fedchak et al [21]. Obaid et al [22] measured the spectrum of Ho II and found a broad feature. We present very large sets of atomic data for the 25 ions of five lanthanides, Ho, Er, Tm, Yb, and Lu, and compare them with the measured energies, transition probabilities and Ho II spectra. We present spectral features of all 25 lanthanide ions over wide range of wavelengths.

2. Theory

Distinct lines in a spectrum are generated mainly by radiative transitions for photo-excitations by absorption or de-excitations by emission of photons. The present study is carried out for these transitions in lanthanides. For an element X with charge Z, the process is expressed as
X + z + h ν X + z
The transitions can be of several types depending on the selection rules, such as, dipole allowed (E1) with same and different spins of the initial and final states, or forbidden of lower magnitudes than those of E1 and follows different selection rules. The selection rules are determined by the probability integral of transition per unit time, P i j , between two levels i and j (e,g, [23]).
P i j = 2 π c 2 h 2 ν j i 2 | < j | e m c e ^ . p e i k . r | i > | 2 ρ ( ν j i ) .
where p and k are the momenta of the electron and the photon respectively, ν i j is the frequency of the photon, and ρ is the density of the radiation field. Various terms in e i k . r yield various multipole transitions. The first term gives the electric dipole transitions E1, 2nd term electric quadrupole E2 and magnetic dipole M1, the 3rd term electric octupole E3 and magnetic quadrupole M2 transition, etc. Various transition parameters, such as, line strength (S), oscillator strength (f), radiative decay rate (A) can be derived from the probability of transition per unit time, P i j , between two levels i and j (e,g, [23]),
Transition matrix element with the first term of the expansion for E1 transition is given by < Ψ B | | D | | Ψ B > where where D = i r i is the dipole operator and i indicates number of electrons in the ion. The generalized line strength can be obtained as
S = Ψ f | j = 1 N + 1 r j | Ψ i 2
The oscillator strength ( f i j ) and radiative decay rate ( A j i ) for the bound-bound transition are obtained from S as
f i j = E j i 3 g i S , A j i ( s e c 1 ) = 0.8032 × 10 10 E j i 3 3 g j S
where g i and g j are the statistical weight factors. The photo-absorption cross section can be obtained as
σ P I ( ν ) = 8.064 E i j 3 g i S [ M b ]
The present work includes E1 transitions to illustrate the spectral features and produce the synthetic spectrum. Magnitudes of decay rates for forbidden transitions are typically orders of magnitude lower than those of E1. However, E2, E3, M1, M2 results are available for distribution at NORAD-Atomic-Data database [28]. The present study considered both the bound-bound and bound-free (continuum) excitations as computed by program SUPERSTRUCTURE (SS) [24].
Computations of the energies and transition parameters have been carried out in relativistic Breit-Pauli approximation where the Hamiltonian is given by (e.g. [23,24])
H BP = H NR + H mass + H Dar + H so +
1 2 i j N [ g i j ( s o + s o ) + g i j ( s s ) + g i j ( c s s ) + g i j ( d ) + g i j ( o o ) ]
where the non-relativistic Hamiltonian is
H N R = i = 1 N i 2 2 Z r i + j > i N 2 r i j
and the one-body mass correction, Darwin, and spin-orbit interaction terms are respectively,
H m a s s = α 2 4 i p i 4 , H D a r = α 2 4 i 2 Z r i , H s o = Z e 2 2 2 m 2 c 2 r 3 L . S
and the two-body Breit interaction term is
H B = i > j [ g i j ( s o + s o ) + g i j ( s s ) ]
Present approximation included contributions of all these terms and part of the last 3 terms of HBP incorporated in the atomic structure code SS [24,25]. The prime notation for spin and orbital angular momenta in the two-body interaction terms indicate the quantity belonging to the other electron.
The electron-electron interaction, as implemented in the atomic structure program SUPERSTRUCTURE [23,24,25], is represented by Thomas-Fermi-Dirac-Amaldi potential that includes electron exchange effect and configuration interactions. Electrons are treated as Fermi sea of electrons, constrained by Pauli exclusion principle, fill in cells up to a highest Fermi level of momentum p = p F at temperature T=0. As T rises, electrons are excited out of the Fermi sea close to the `surface’ levels and approach a Maxwellian distribution. Solutions of the Schrodinger equation provide the wavefunctions and energies of the fine structure levels.

3. Computation

As mentioned above in the Theory section, the transition parameters f, A, and photo-absorption cross sections σ were obtained using the atomic structure program SUPERSTRUCTURE (SS, [24,25]). The wavefunction of each atomic species of the 25 lanthanide ions was optimized with a set of configurations and a set of Thomas-Fermi scaling parameters for the orbitals [24,25], both sets for each ion are presented in Table 1.
Optimization process for the energies was considerable meticulous due to sensitivity of the potential with large number of electron. Large number of angular quantum numbers due to large number of electrons with open orbitals 4f, 5p, 5d, 6s, 6p, particularly 4f introduce very large number of energy levels. Hence a slight variation in the Thomas-Fermi scaling parameters λ for the orbital wavefunctions would perturb the electron-electron interaction and change the energy values and the order in the fine structure levels. The numerical challenge came from exceeding the dimension of the Hamiltonian matrix that SS can accommodate. Number of digital spaces for the dimension overflow that assigned to SS. Hence optimization of the set of configurations was carried out carefully such that the order of calculated energy levels, particularly the ground and low lying energies, can match to those of the measured energies given in NIST [13] table.
Table 1 presents the optimized set of configurations, specifying the occupancy of the outer orbitals that can vary while specifying the number of inner orbitals that remain closed, and Thomas-Fermi scaling parameters of the orbitals for each ion. The top line of each set gives the total number of radiative transitions ( N T ), which includes both the allowed E1 and forbidden E2, E3, M1, M2 transitions, produced by set of configurations.
All atomic data from SS were processed using a program PRCSS [26] to make clear tables and easy applications of them. They were further processed to compute absorption cross sections, sum them if transition energies are the same, and display of spectral features using program SPECTRUM [27]

4. Results and Discussions

The present study reports results on energies and transitions, and the corresponding photo-absorption spectrum of 25 lanthanides ions, Ho I-III, Er I-IV, Tm I-V, Yb I-VI and Lu I-VII. We investigate the spectral features of these ions. Most of the ions have produced close to hundred thousands lines with excitation to a few orbitals up. We discuss some general information and data files for the 25 ions before giving examples of characteristics of individual ions.

4.1. General information of the atomic data

Each lanthanide ion produced significantly large number of energy levels. A file containing all energies for each ion is available electronically from the NORAD-Atomic-Data database [28] A sample set of energies in the complete data file for Ho I is presented in Table 2 to demonstrate the format of the complete energy table of the ions. In the table, the number of energy levels obtained from the set of configurations (Table 1) is quoted at the top of the table which is followed by the number of energies obtained from SS [24]. The total number of levels may include both the bound levels below the ionization threshold and the continuum levels above it. In an atomic structure calculation, such as the present case with SS, all energies are computed relative to the ground level which is set to zero. The program does not distinguish between the bound and continuum levels. It is same format that is followed by NIST [13] which also presents relative energies to the ground level. However, NIST provides the ionization threshold energy obtained separately. The present energies are compared in Table 4 with the measured values available at NIST website.
Large number of levels of each lanthanide ion produced extensive sets of transitions, both allowed and forbidden types. Allowed transitions are strong. Forbidden transitions are much weaker compared to E1 transitions. However, we have obtained a very large set for the combined E2, E3, M1, M2 transitions for each ion. The atomic data file for each ion contains 4 tables of transitions, i) table of dipole allowed E1 transitions where the spin remains the same, ii) table of dipole allowed E1 transitions where the spin changes with transition which are often known as intercombination transitions, iii) table of forbidden E3 and M2 transitions (follow the same selection rules), iv) table of E2 and M1 transitions (follow the same selection rules). At the end of each table, total number of transitions is listed. The file containing complete sets of transition parameters of line strengths, oscillator strengths, and radiative decay rates are available electronically from the NORAD-Atomic-Data database [28]. The same file also contains the energy table. Table 3 presents an example set of E1 transitions with same spin for Ho I, demonstrating the format of the complete table.
The other tables of transitions are self-explanatory for the transitional quantities as explained for Table 3. Hence sample tables for them are not given. A-values from the present work is compared with available published values in Table 5.
We calculated the photoabsorption cross sections σ of the dipole allowed (E1) transitions and plotted the spectrum for each lanthanide ion to display their characteristic features. The spectral features are presented in Figure 2–26. A single strong line can be a sum of lines. There are many lines at or very close to which other transitions are occurring. These overlapped and almost same wavelength transitions have been added together for the total intensity. A separate file containing the photo-absorption cross sections for each ion is also available at the database NORAD-Atomic-Data [28].
We have found one lanthanide spectrum, for Ho II, measured by the experimental group at Connecticut University [22] and presented at a meeting of American Physical Society (APS). The energy range is much smaller than covered in the present work. Figure 1 presents comparison of the present spectrum with the experimental by Obaid et al [22]. We find very good agreement in the comparison in Figure 1 as the predicted features show rising strength of lines with increase in energy and then forming a broad area of strong lines which drops around 65 Å, matching the features, averaged by the set-up, observed in the experiment.

4.2. Features of the lanthanide ions
A small set of energies, 10 levels for brevity, of each 25 lanthanide ions is given in Table 4. It gives the total number of energy levels, N E , obtained from the set of configurations and the total number of dipole allowed (E1) transitions, N E 1 , obtained among them on the top. N E 1 is the subset from the total number of combined allowed and forbidden transitions, N T , specified in Table 1. N E 1 also corresponds to number of transitions included in producing the photo-absorption spectrum for the ion.
Table 4 also benchmarks the present energies with the measured values, largely from Martin et al [12] available at NIST [13] table. Comparison of energies in Table 4 revealed the issues of identification or the spectroscopic designation of levels. NIST tables specify large mixing of the levels from different LS states as well as configurations. Similar to those at NIST, SS provides the final spectroscopic identification based on the leading percentage contributions of the configurations and states. Some differences in potential or wavefunction representation can cause differences in leading percentages of the mixed states, and introduce differences in identification. The difference is found to be more noticeable for lanthanides. This is not unusual for large atomic systems with many electrons, such as lanthanides, to have sensitivity of the electron-electron interactions. Although we try to match the levels with exact identifications for energy comparisons, It seemed the calculated values agree better with those measured values if we just compare levels only by the parity orders. So we have adopted the matching strategy. We made sure that the calculated ground level agrees exactly well with that in the NIST table. The next step was to compare level energies with exact identifications. But if there is an unusual difference in the values or order of levels, we compare levels with same J-values and parities. If NIST table does not provide L and S values, we use those designated by SS.
Ho I-III:
For Ho I comparison, the problem for proper comparison of levels was differences in spectroscopic identification of levels. While NIST table shows that the ground state is 4Io, with which we agree, but it does not give complete identifications for the next levels. We have designated these with L and S of those designated by SS for the same J and parity. Problem with proper matching of levels is also one of the reasons for getting mismatched order of calculated energy levels with those of the measured levels. We have used NIST energy order and SS identifications.
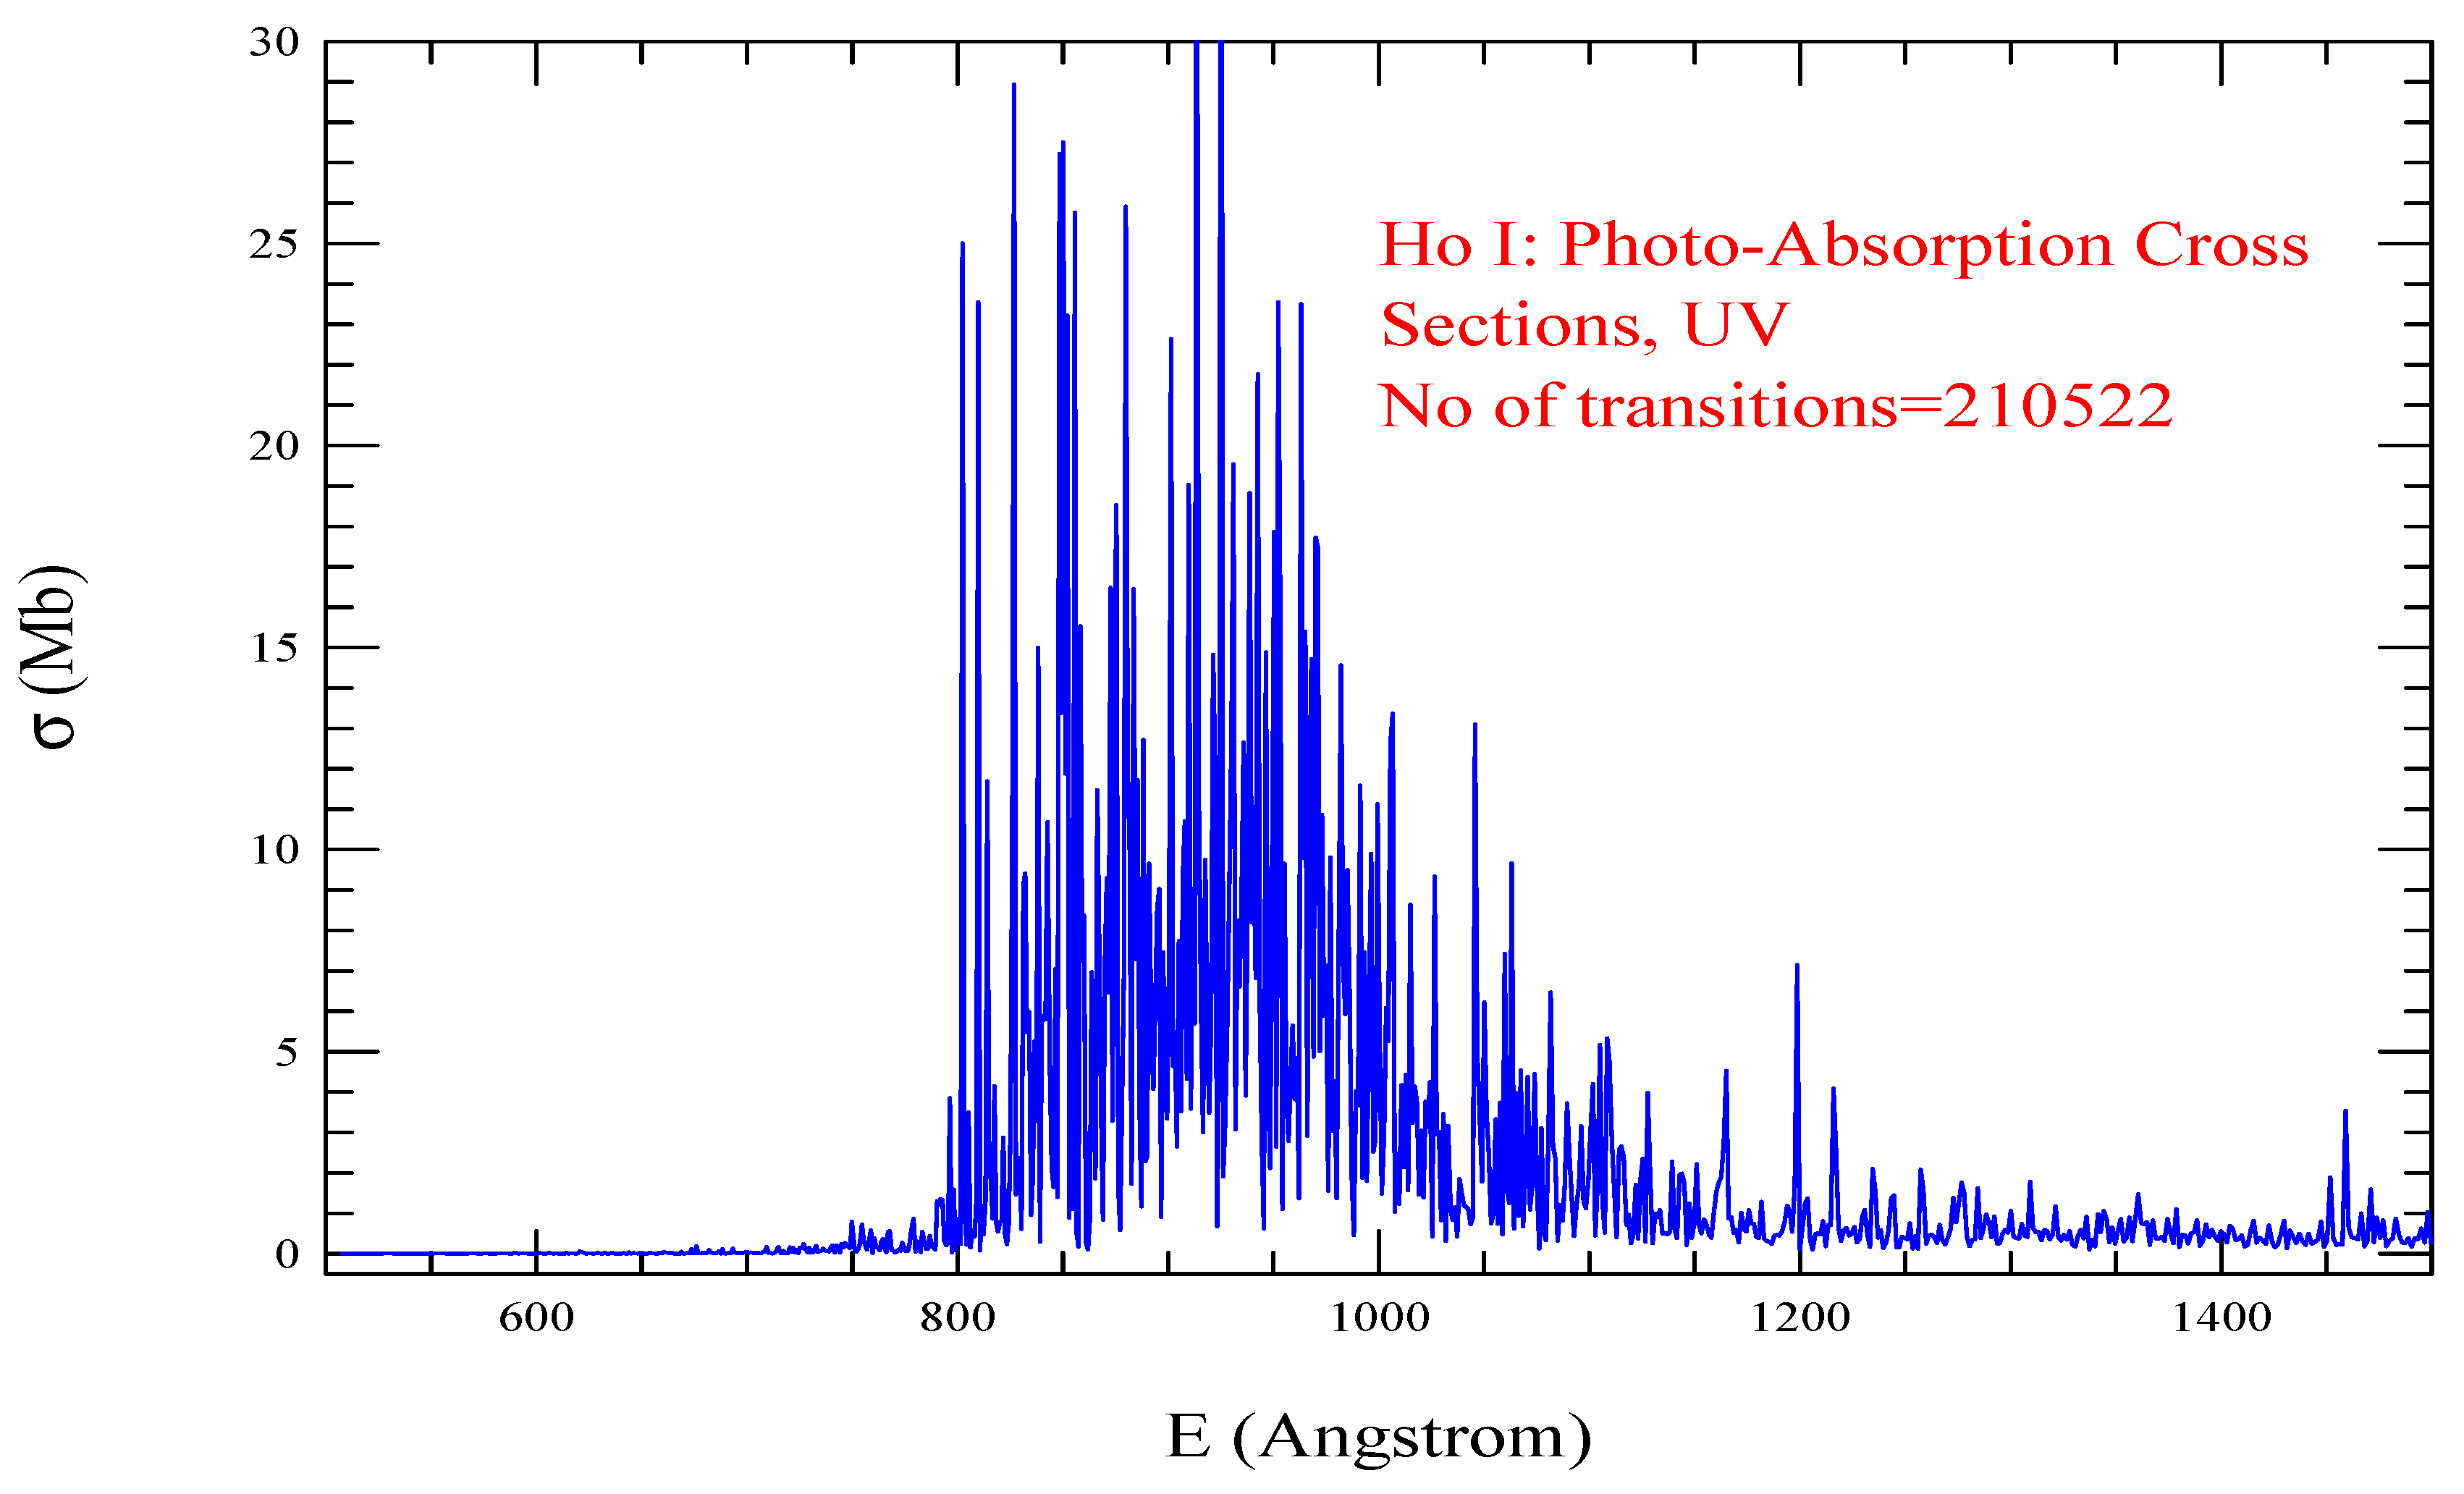
The photoabsorption spectrum of Ho I is presented in Figure 2. A total 210522 transitions are included to plot the spectrum. However those with very low cross sections are outside the scale of the plot. Figure 1 shows that dominant strength of lines lie in the UV range from about 800 to 1200 Å. It may be noted that the range could be off by some Å due to the differences between the calculated and measured energies.
The calculated energies and order of the low lying Ho II levels have good agreement with those at NIST [13] table. However, NIST does not provide spectroscopic values of the total spin S and orbital angular momentum L values. Hence identifications produced by SS are used to designate these values in the comparison table.
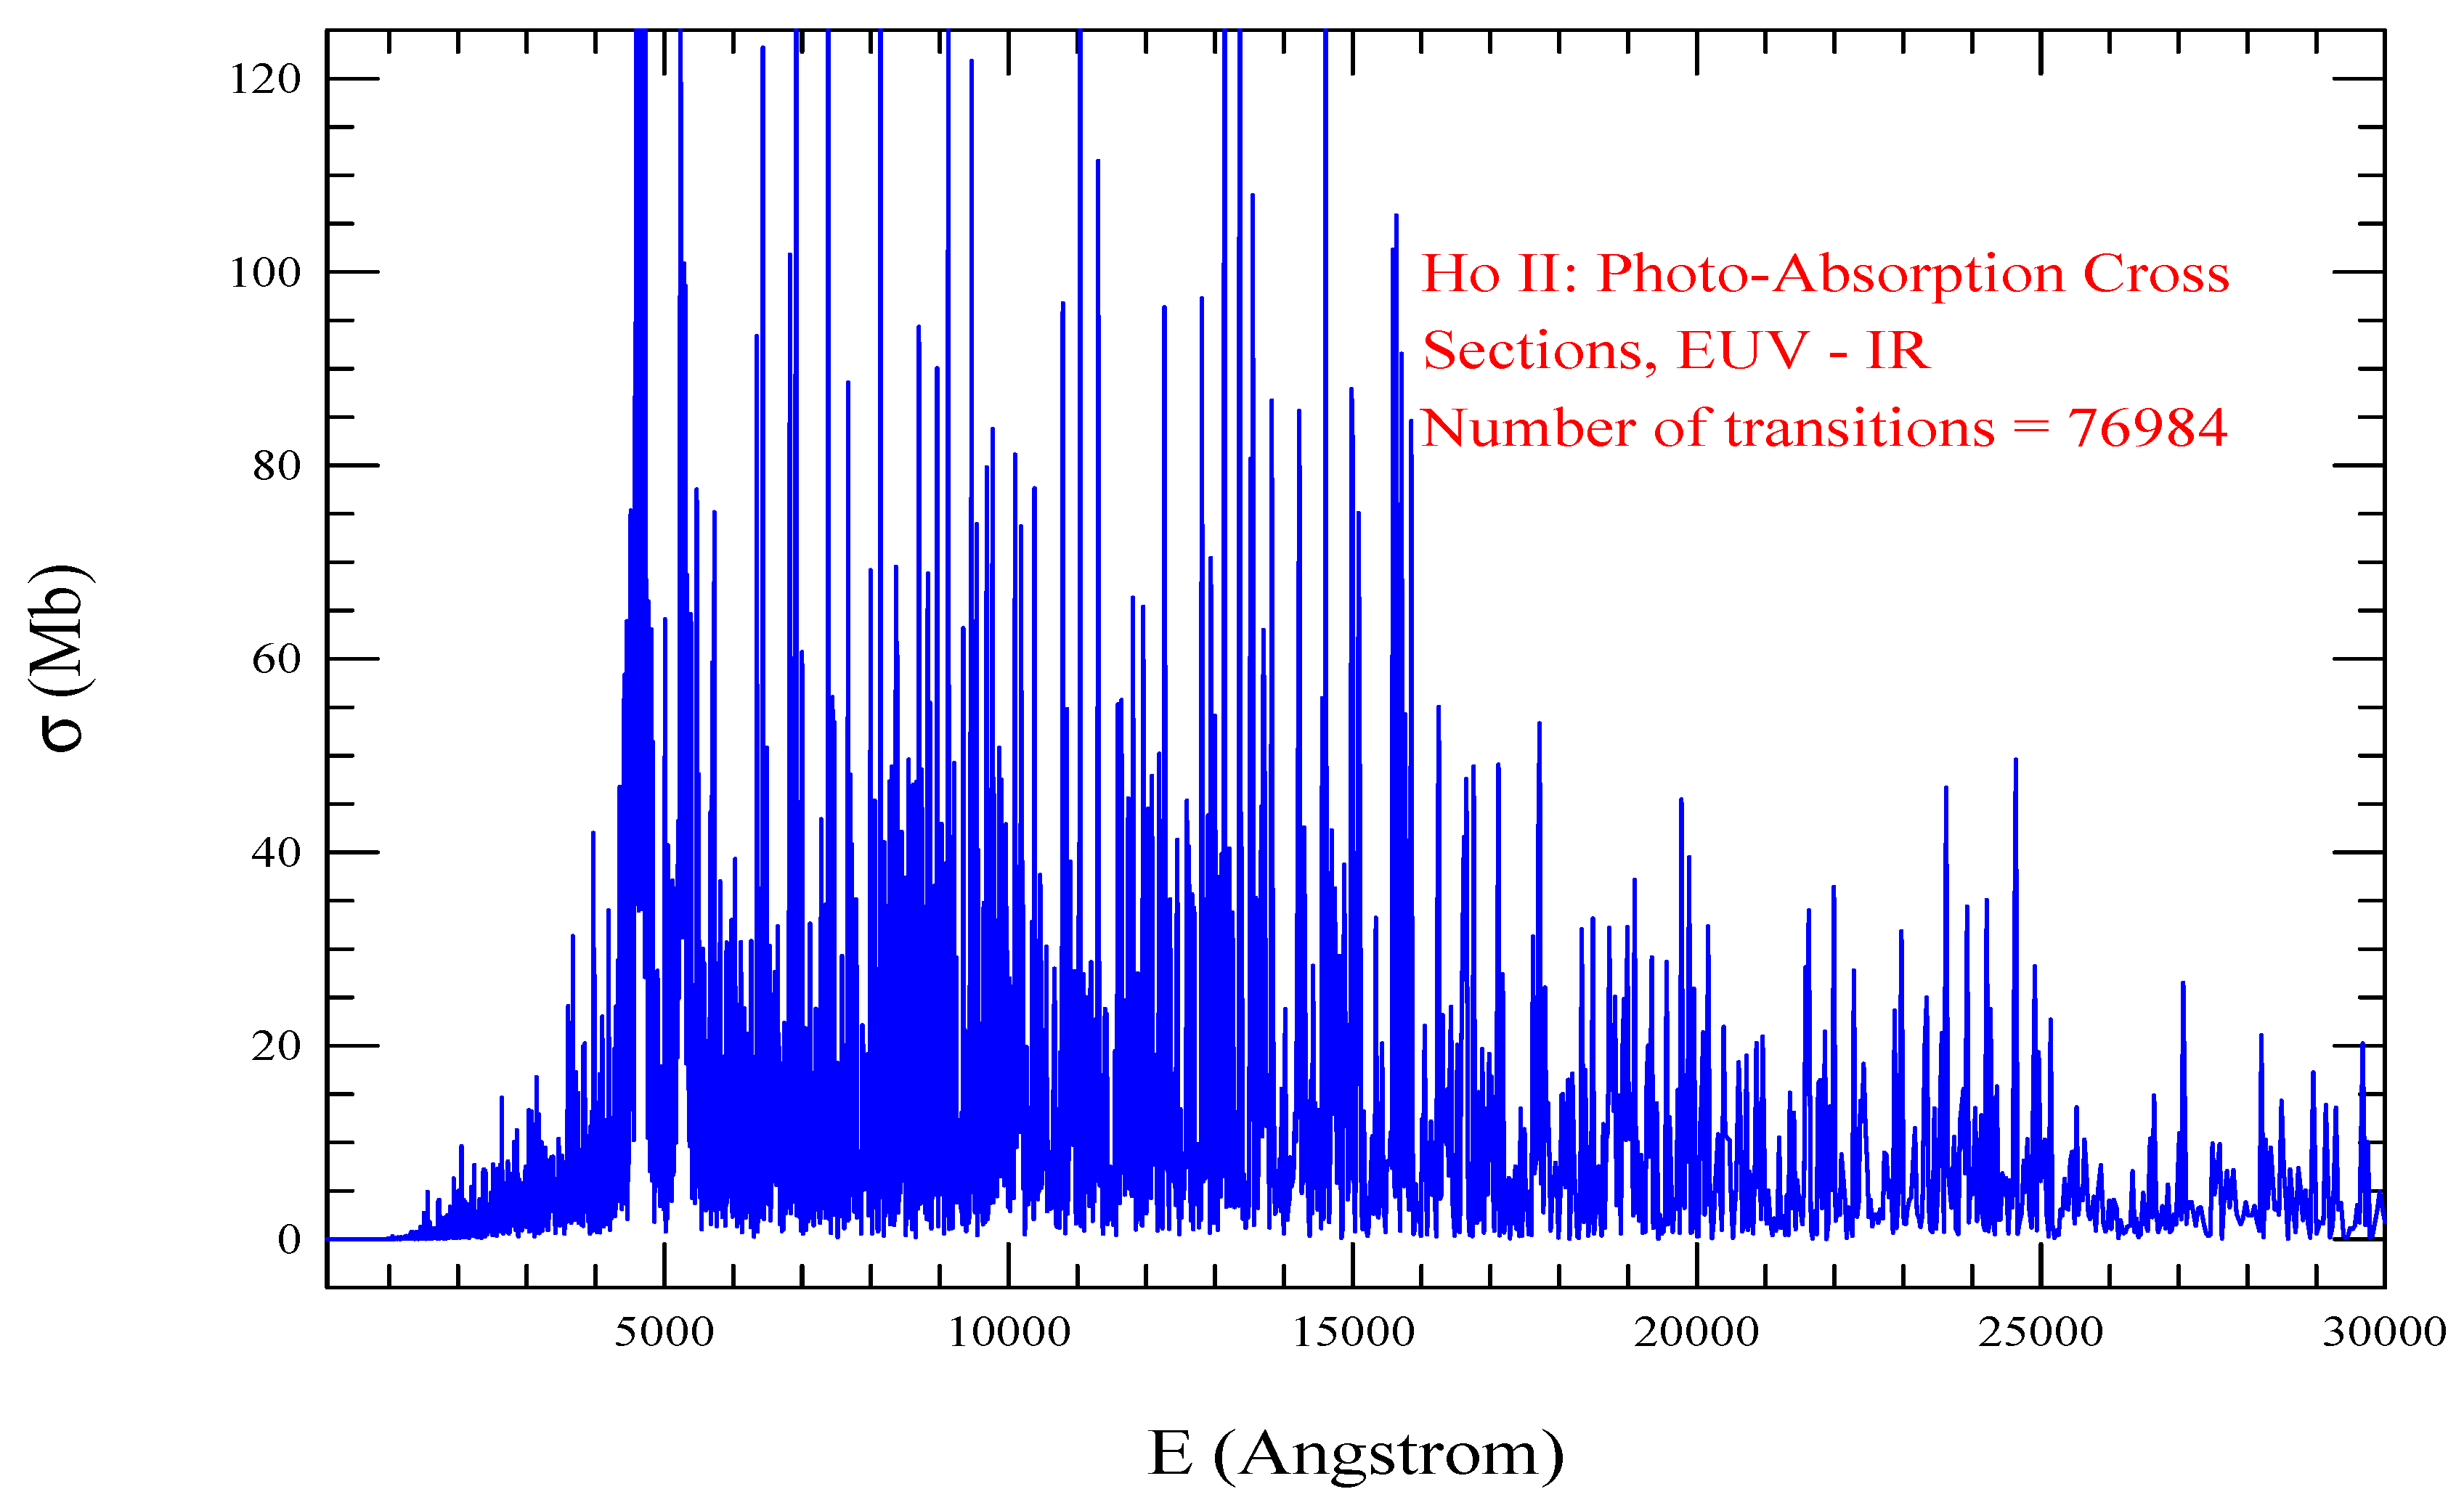
Figure 3 presents the photoabsorption spectrum of Ho II which included 76984 transition. However, very weak transitions lie outside the range of the plot. The figure shows visible presence of lines from UV to IR regions.
Calculated energies of Ho III are comparable to but values are lower than those of [12]. Calculated energy order also differs after the first 5 levels and thus introduce the discrepancy. Further optimization in the wavefunction expansions made the difference between calculated and measured values diverge. Hence the present numbers are kept as they are to maintain an overall agreement. Comparison of energies may have some uncertainties introduced in by lack of proper spectroscopic identifications of levels.
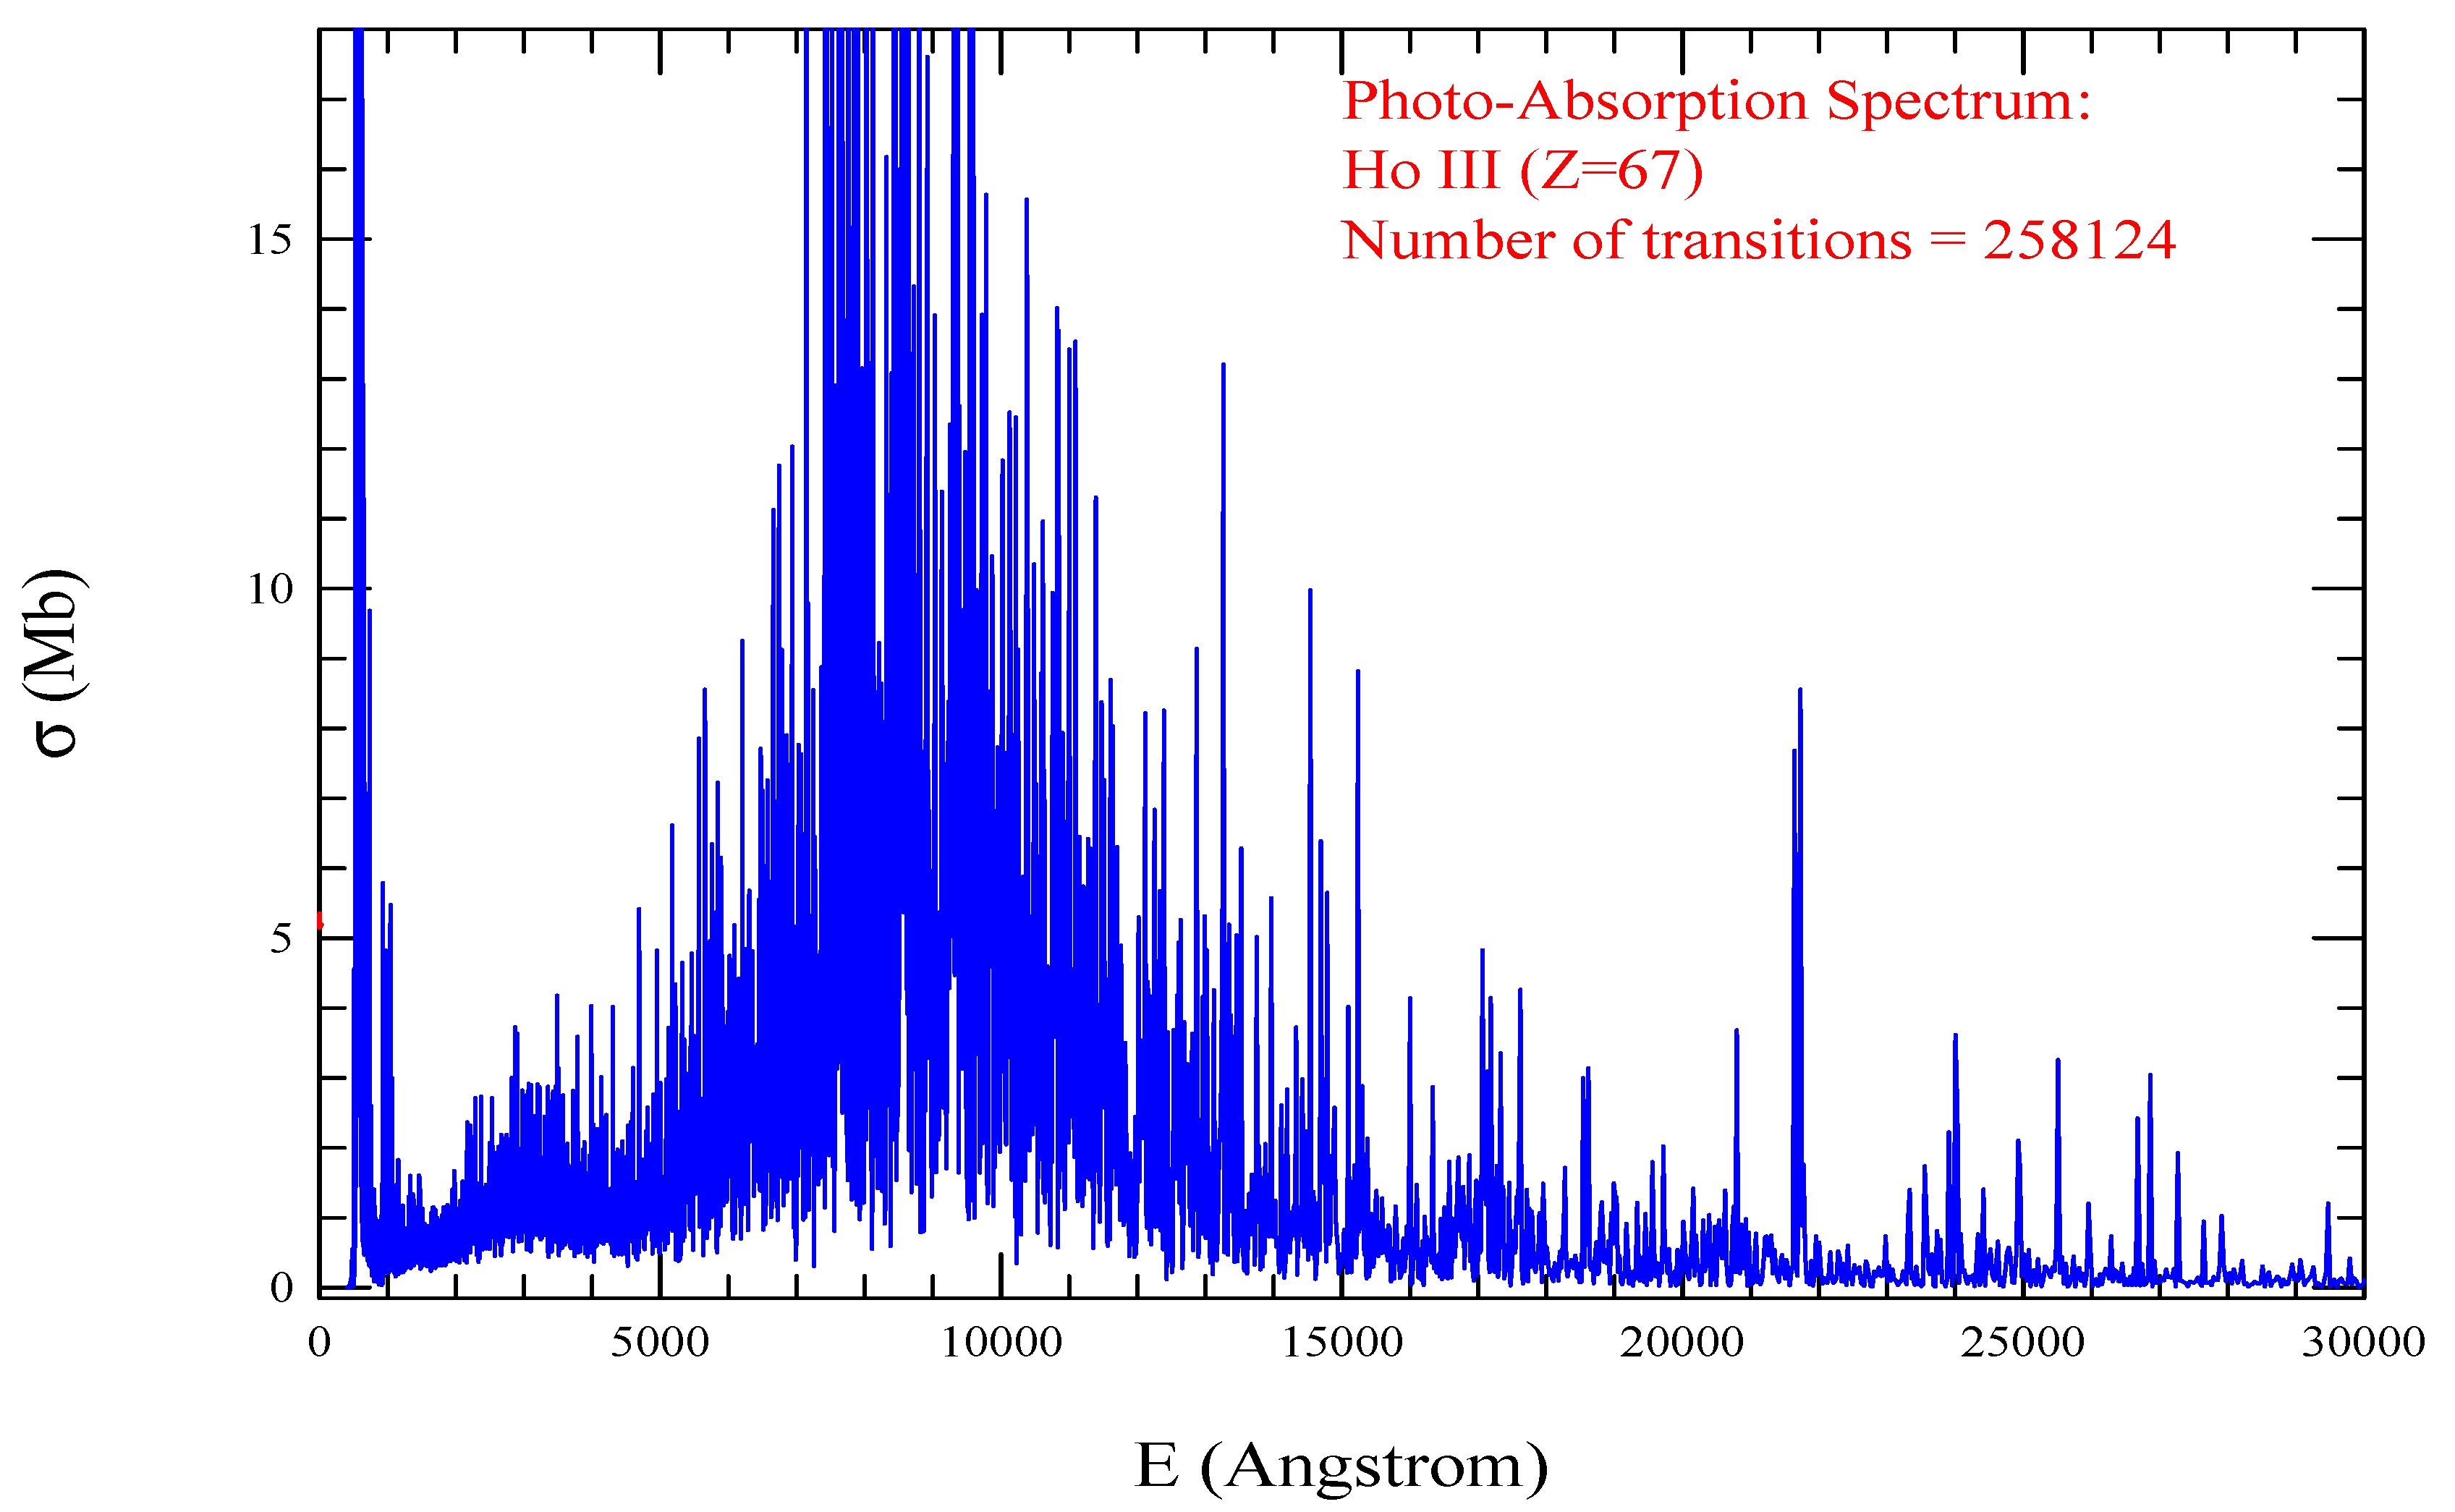
Figure 4 presents the photoabsorption spectrum of Ho III with dominance of lines from X-ray to FIR 22000 Å. A large absorption bump is found to be produced in the wavelength range of 4000 to 15500 Å. Number of transitions included in the figure is 258124.
Er I-IV:
The energy levels show in general good agreement with the measured values. These ions were challenging computationally and spectroscopically in the similar ways as those of Ho ions. Sensitivity of electron-electron interaction caused repeated computations many times to optimize the wavefunctions to match the ground and excited levels. When energy levels would be similar to those of the observed values, identifications and order of levels would be different from those of NIST. We adopted the comparison strategy as mentioned in the above section. the best matching of levels and compare the energies which show good to fair agreement.
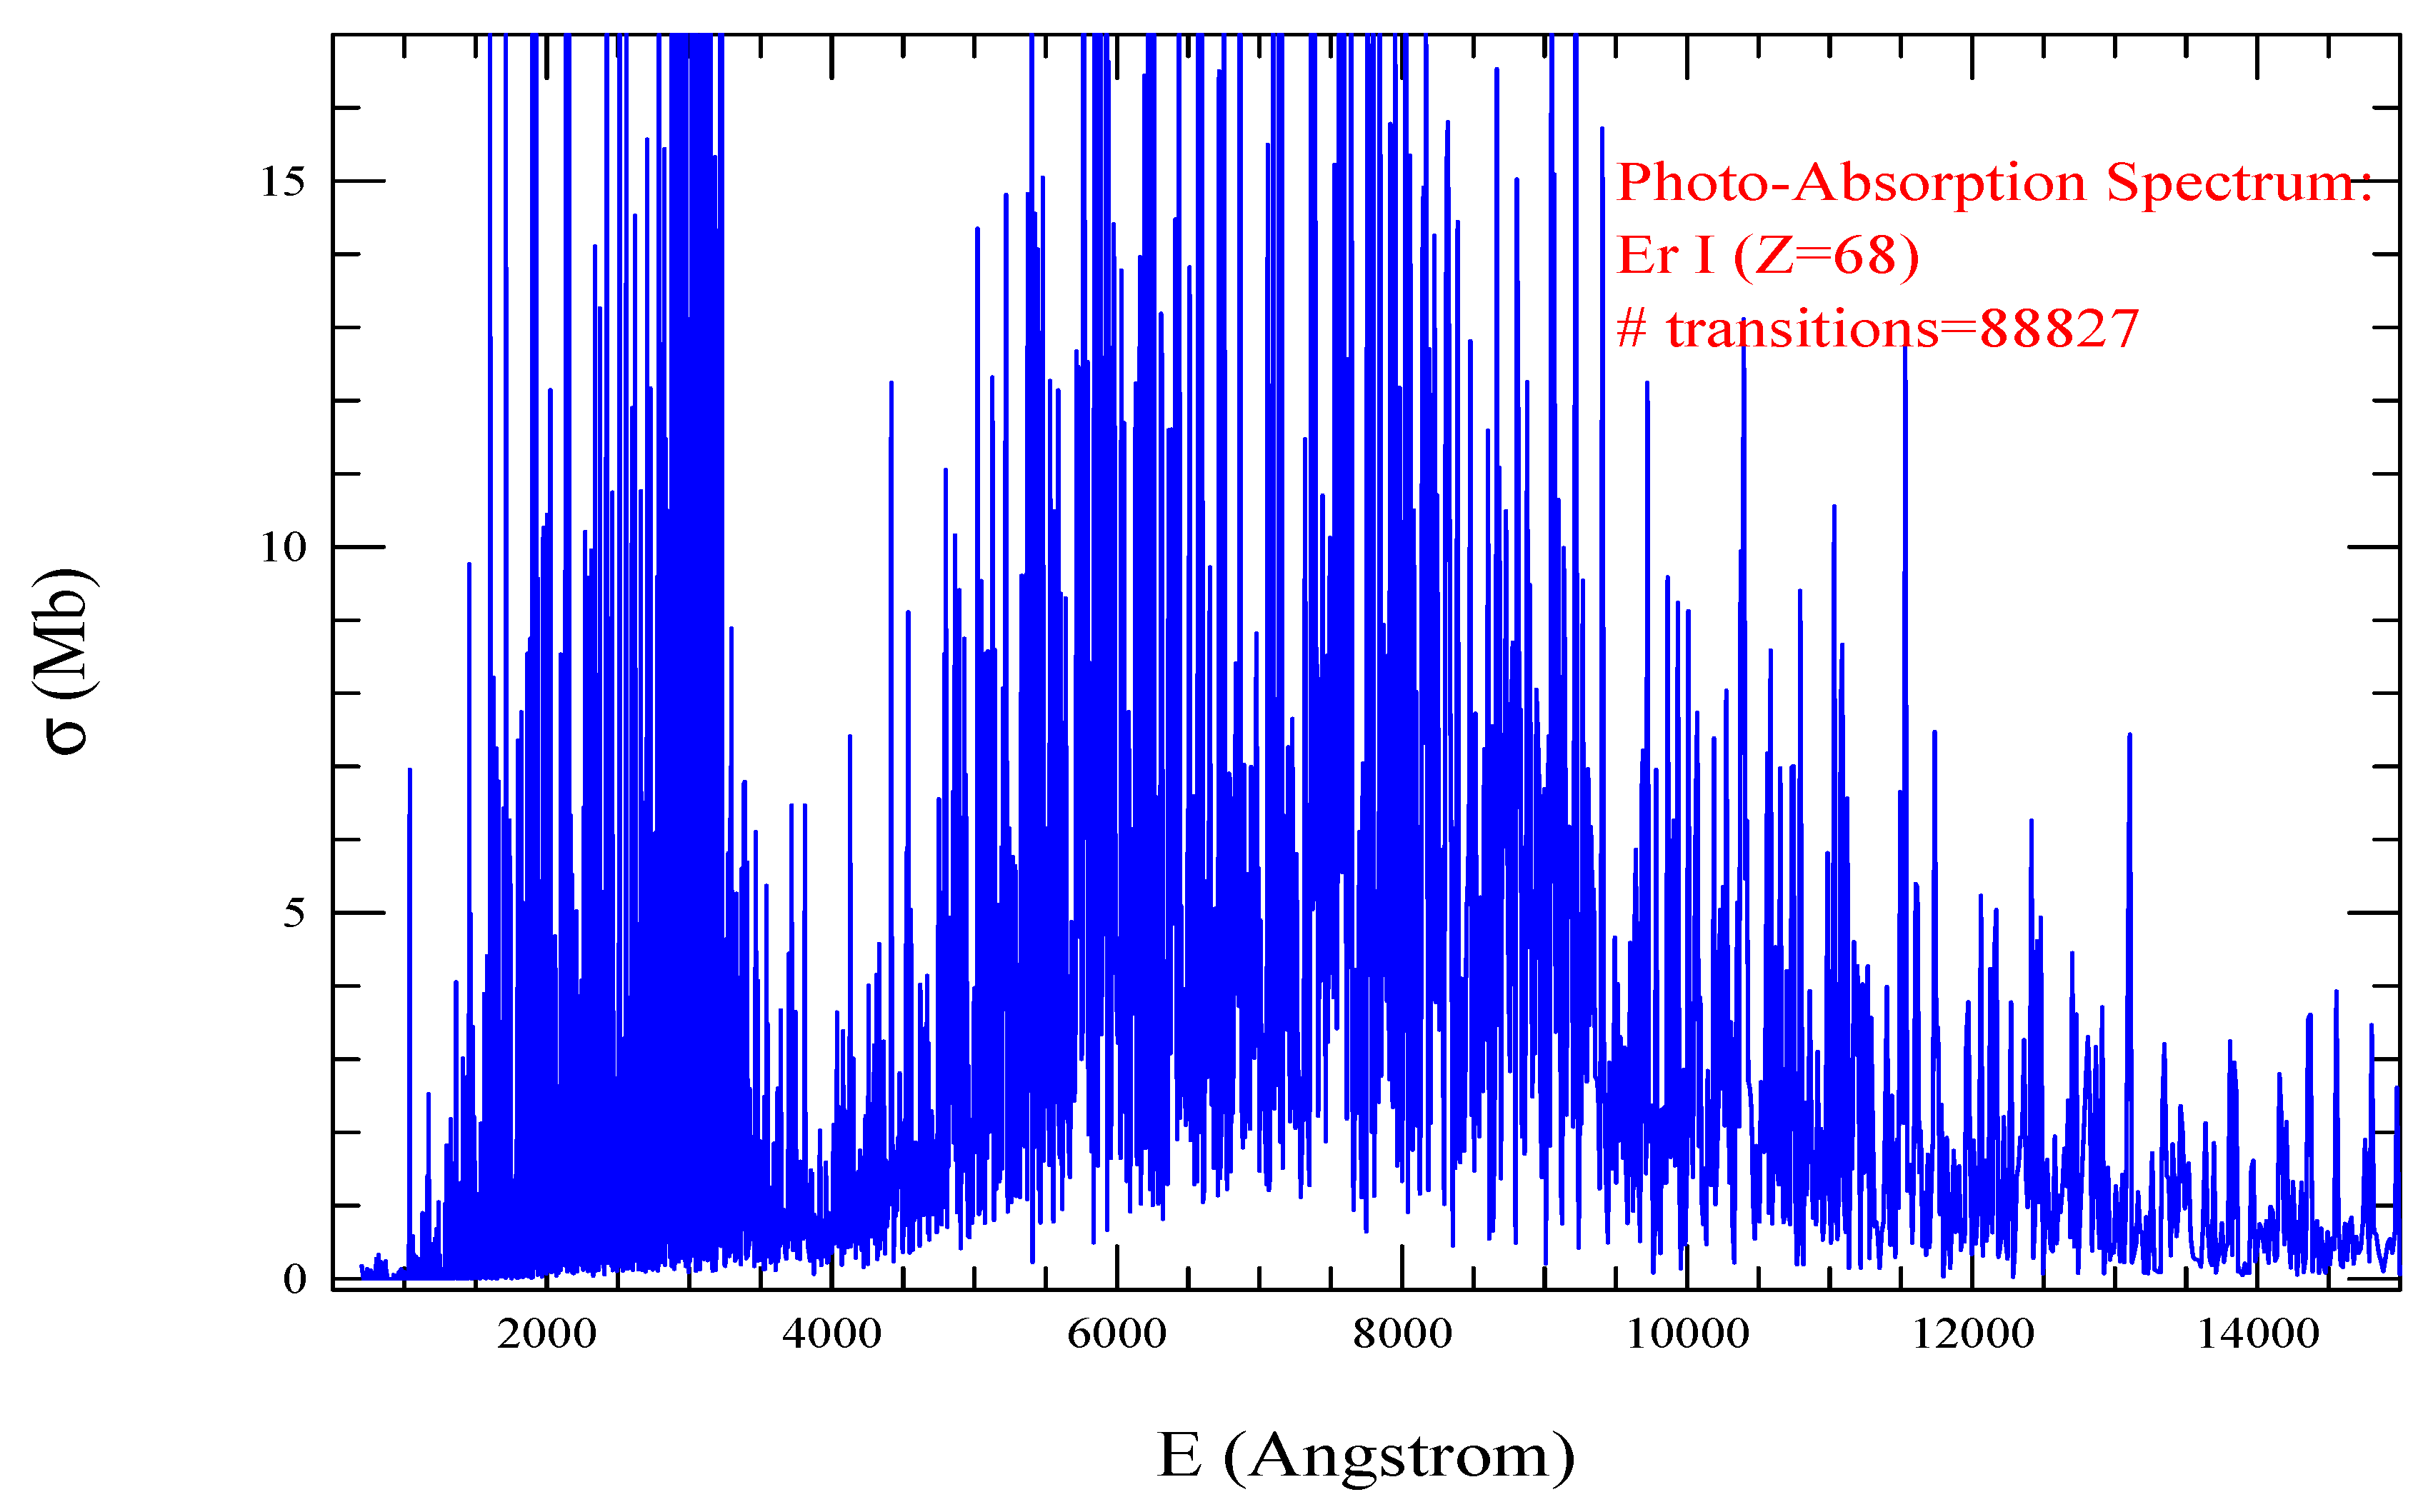
Spectrum of Er I presented in Figure 5 shows two broad features of strong lines, one in the UV region of 1000 - 3500 Åand the other in the O - IR region of wavelengths 4500 - 1500 Å. Number of E1 transitions included in the spectrum is 88827.
Energies of Er II show similar agreements like those for Er I. Except for one odd parity state, none of Er II levels have full spectroscopic designation in the NIST table. NIST provides J-values and the parities. Hence the levels have been assigned with those by SS, including J-values. We have preserved the parities of levels, but not the order of J-values.
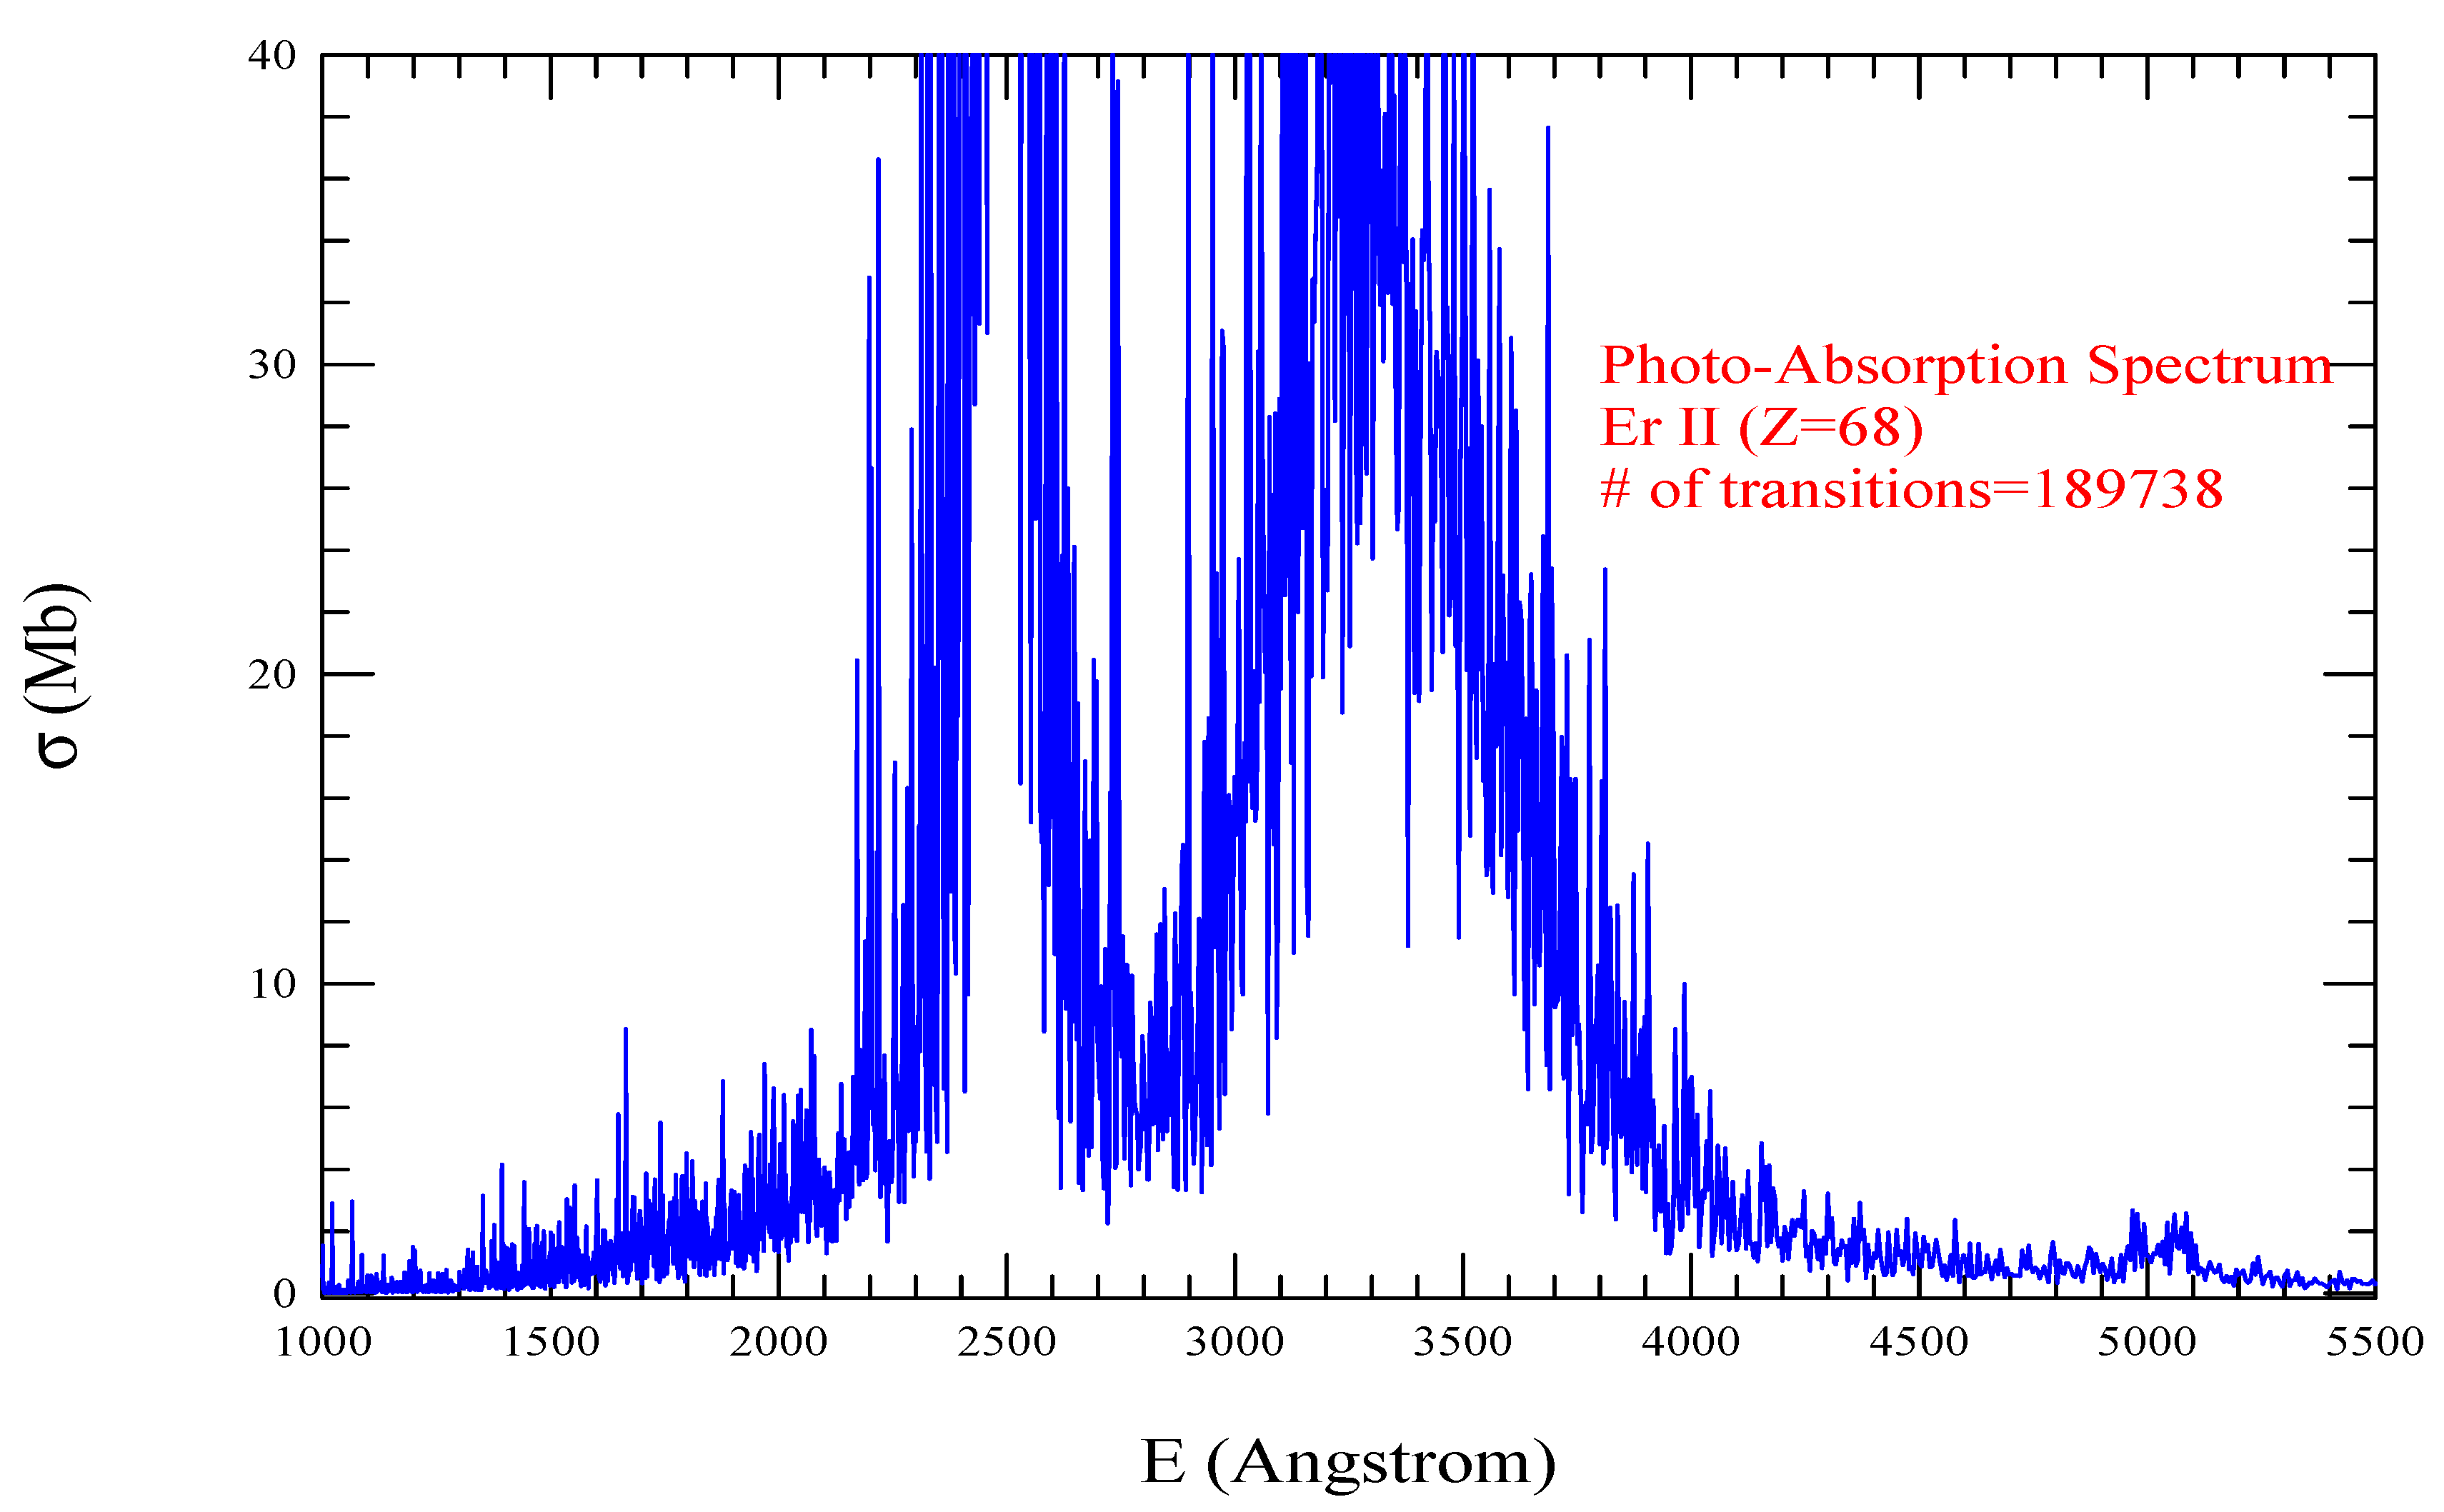
Spectrum of Er II presented in Figure 6 shows two broad features of strong lines, both in the UV region, one in wavelength range of 2200 - 2700 Åand the next one in 2800 - 4000 Å. Number of E1 transitions included in the spectrum is 189738.
Optimization produced calculated energies of Er III somewhat higher than the measured values, but have remained in fair to good agreement.
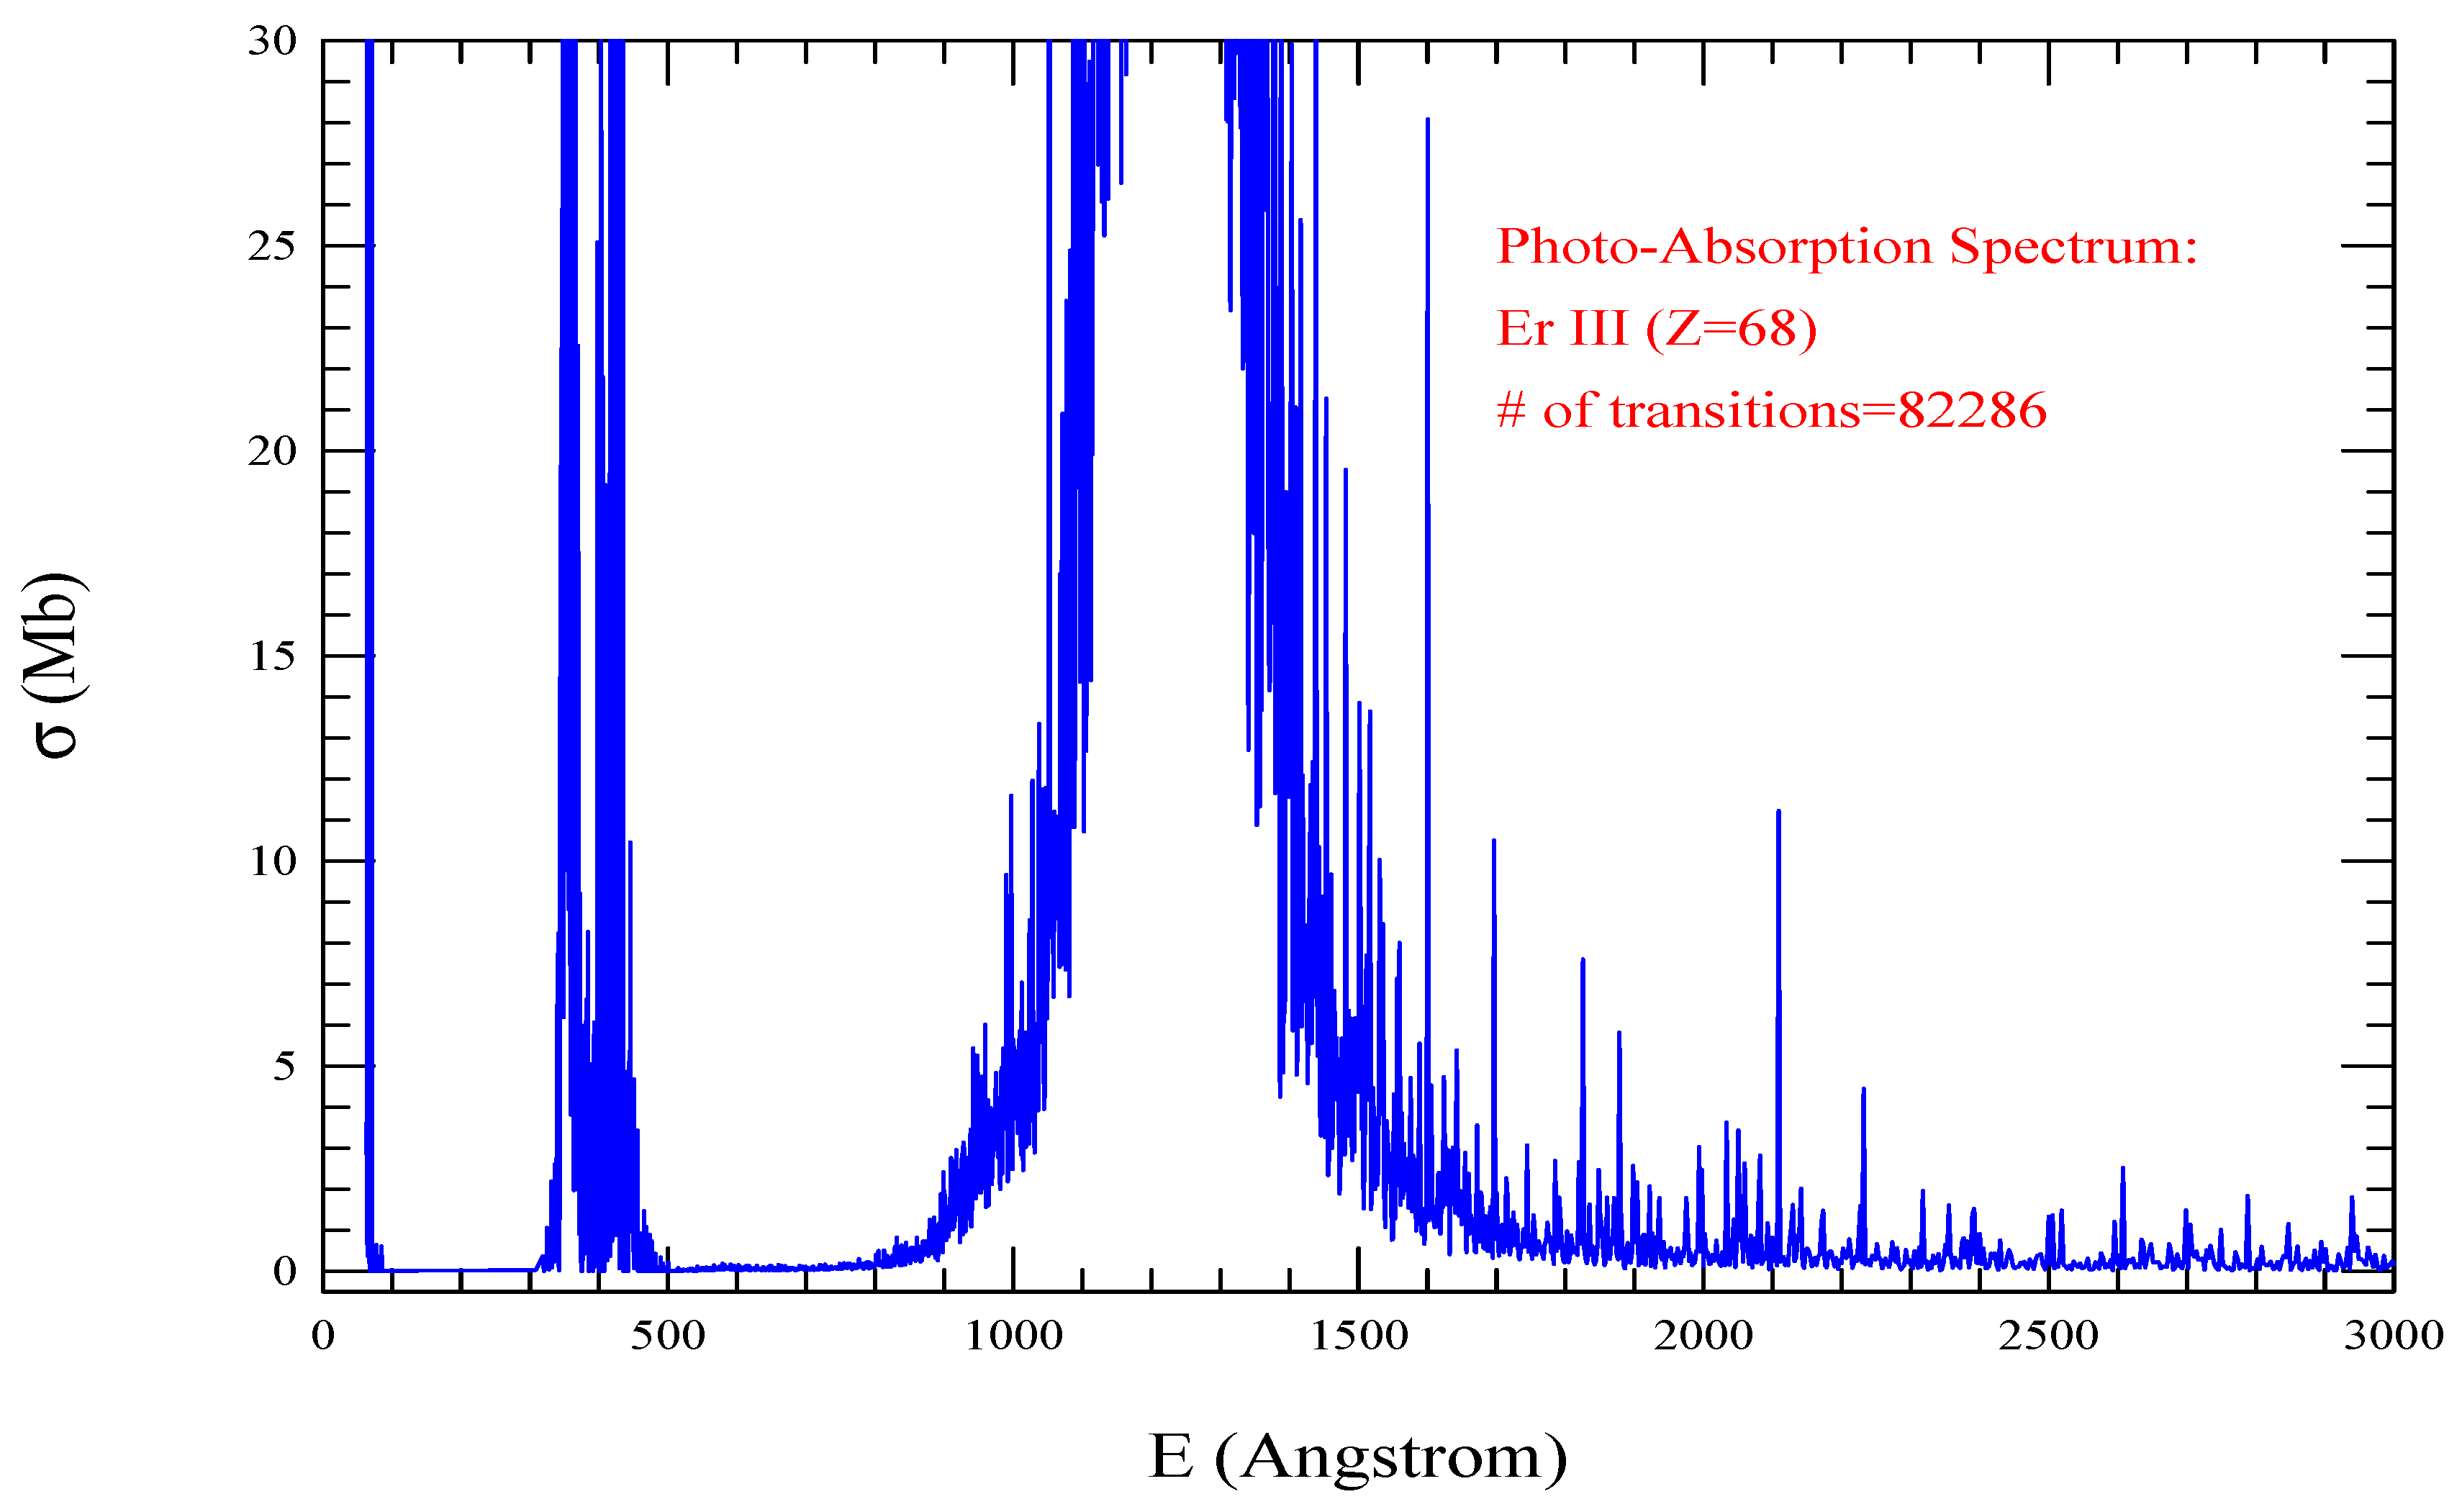
Spectrum of Er III presented in Figure 7 also shows two broad features of strong lines, both in the EUV region, one in wavelength range of 300 - 44r8Åand the next one in 900 - 2100 Å. Number of E1 transitions included in the spectrum is 82286.
Calculated energies of Er IV can be discussed with the same points as those of Er I - III.
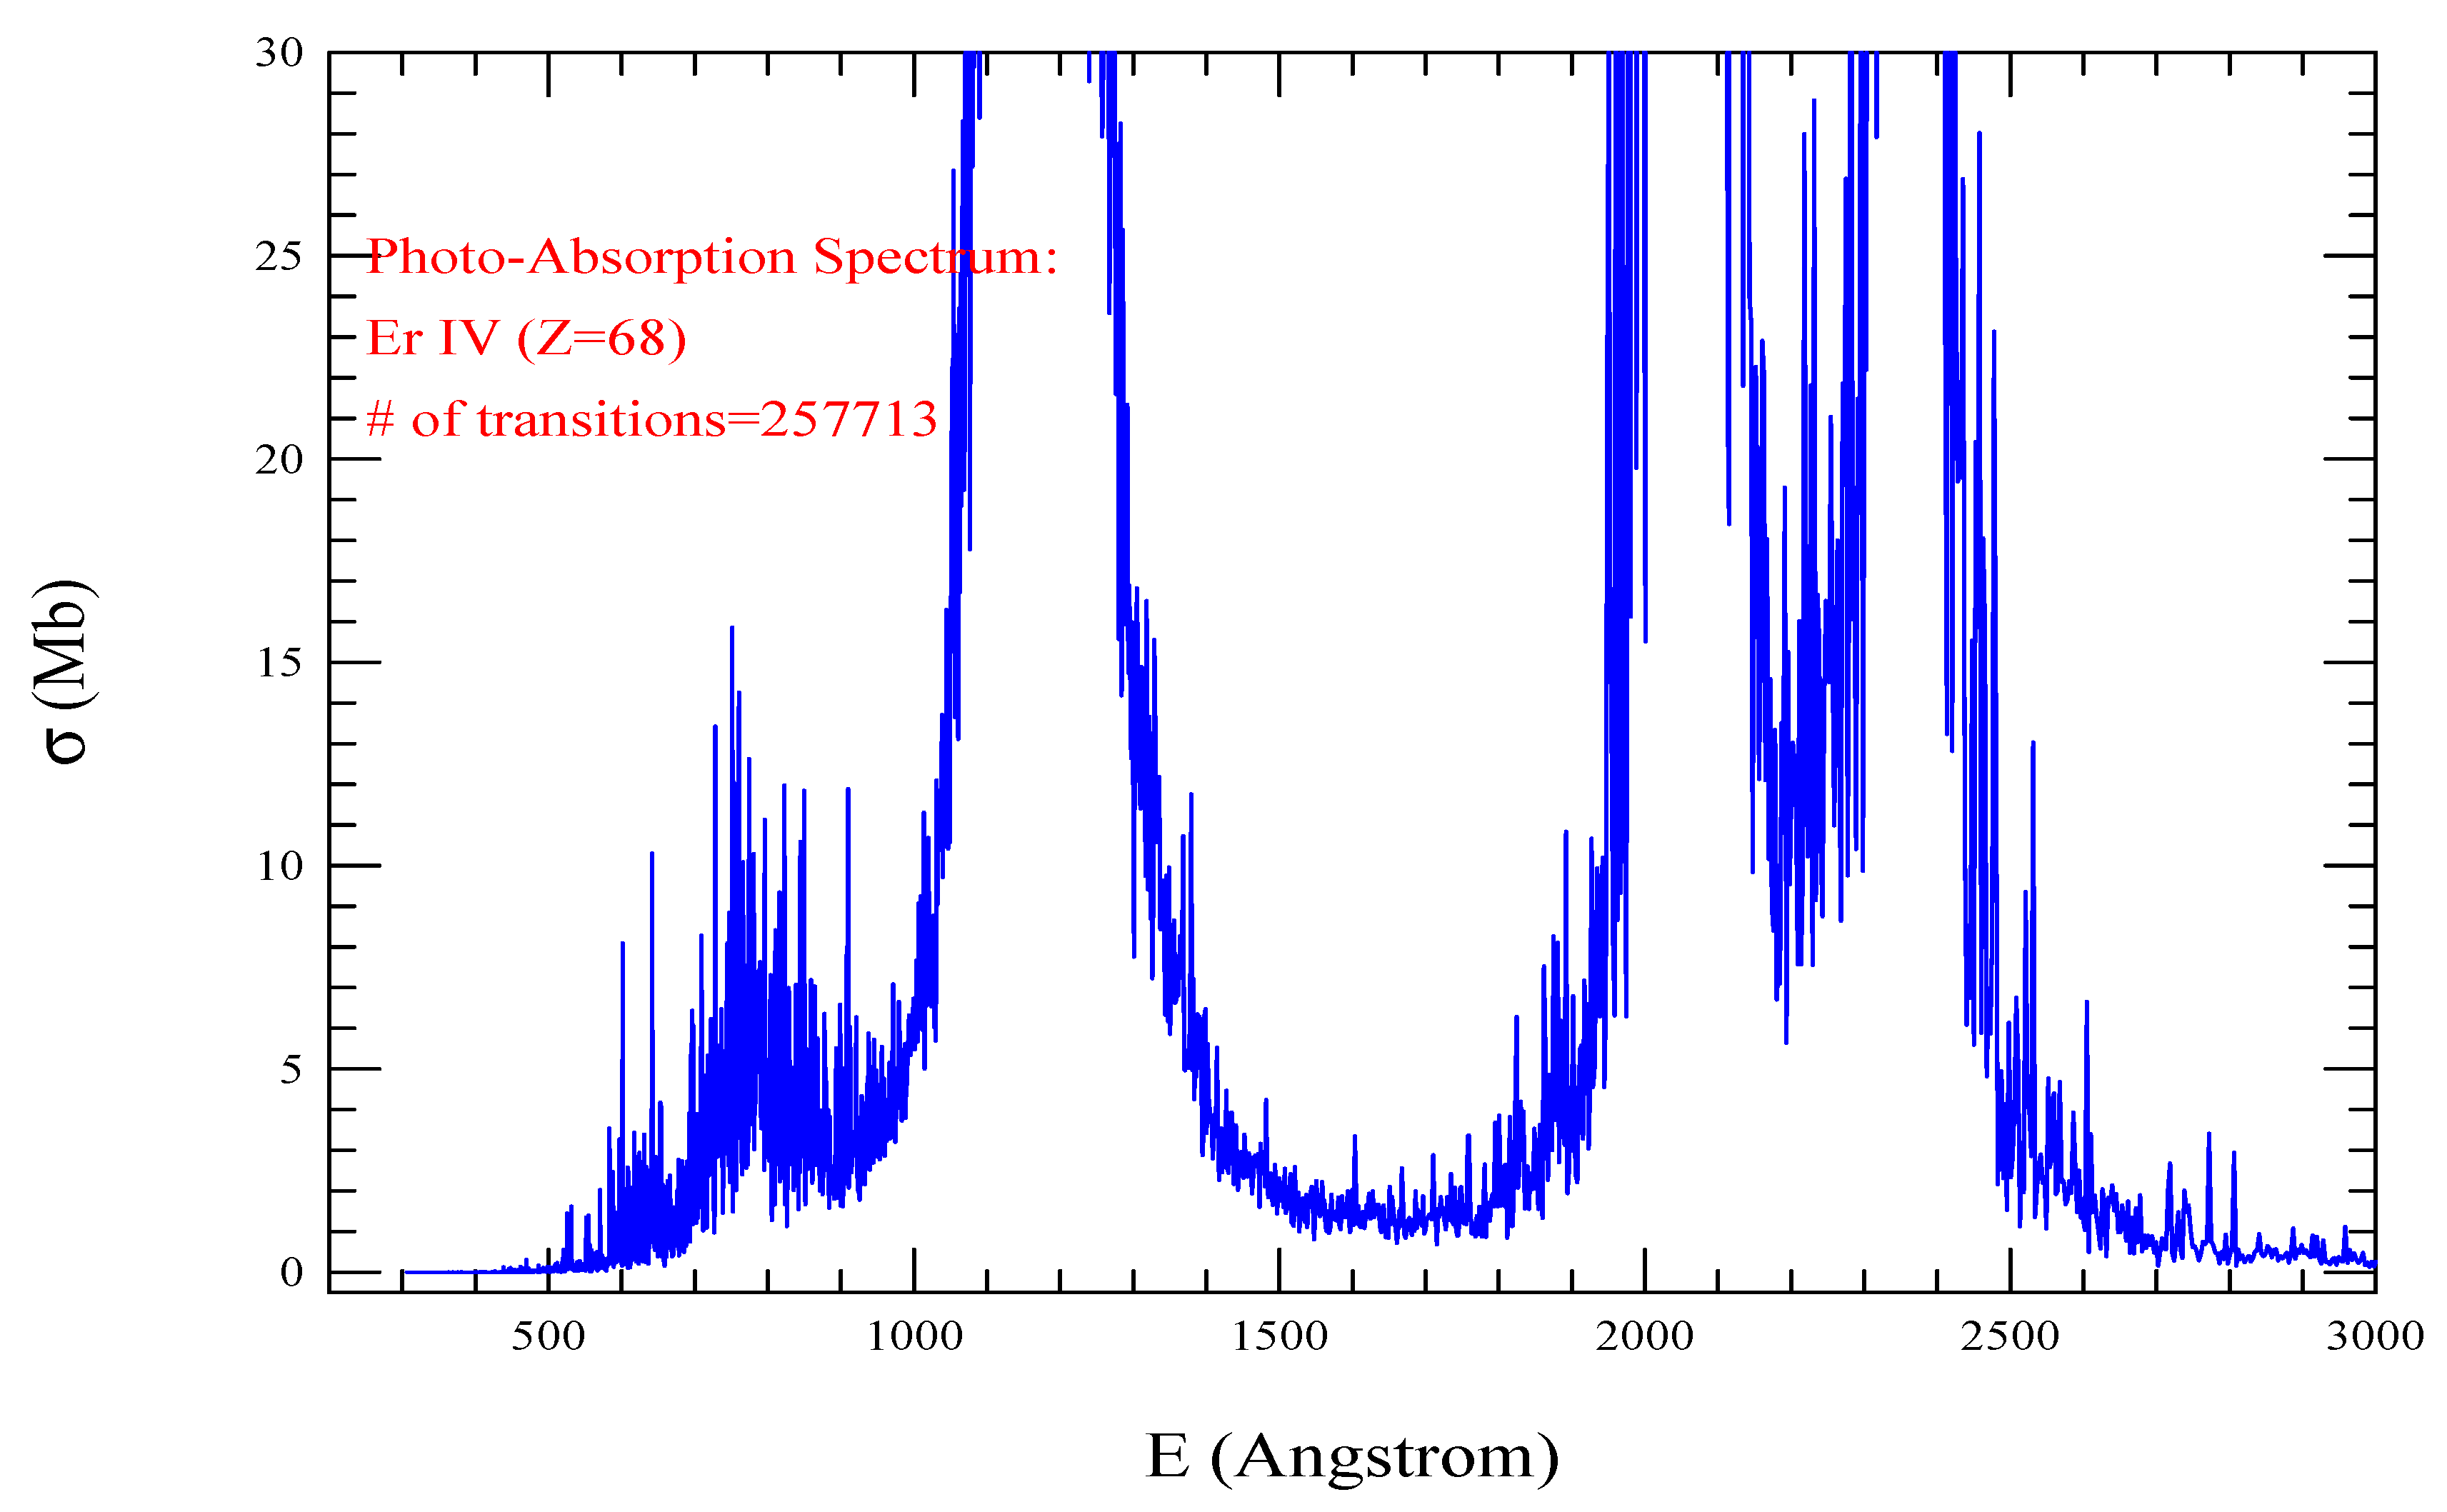
Spectrum of Er IV presented in Figure 8 shows multiple broad features of strong lines in various wavelength ranges in the EUV -UV region. Number of E1 transitions included in the spectrum is 247713.
Tm I - V:
Table 4 shows very good to good to fair agreement between calculated and measured energies of Tm I - Tm-V. The reasons of differences are the same. These lanthanide ions have strong electron-electron interaction that can be perturbed easily by slight change in potential and wavefunction like other lanthanides. The problem of matching identification of levels and partial identification introduced uncertainty in comparison of levels and hence has caused discrepancy between calculated and measured energies. For Tm IV, the present values in general are in good agreement with the measured energy values of Martin et al [12]. However, identification of the two levels, 3H and 3F both with j=4, appear to have misidentified with interchange of energy values 0.114 Ry and 0.0514 Ry. Identification of these levels can be adopted easily in the reverse order as their leading percentages are very close, 60 and 63 respectively. NIST table list only 7 levels. Hence 3 additional calculated levels are included in Table 4. For Tm V, there is no energy levels available except for the ground level 4 f 11 ( 3 I 15 / 2 o ) which is also confirmed by the present work.
Spectrum of Tm I, presented in Figure 9, shows a few regions of strong line, the broadest one is in the EUV region in wavelength range of 500 - 1500 Å. Beyond about 3400 Å. the lines are noticeable, but weaker than those in EUV region. The number of transitions included is 23804.
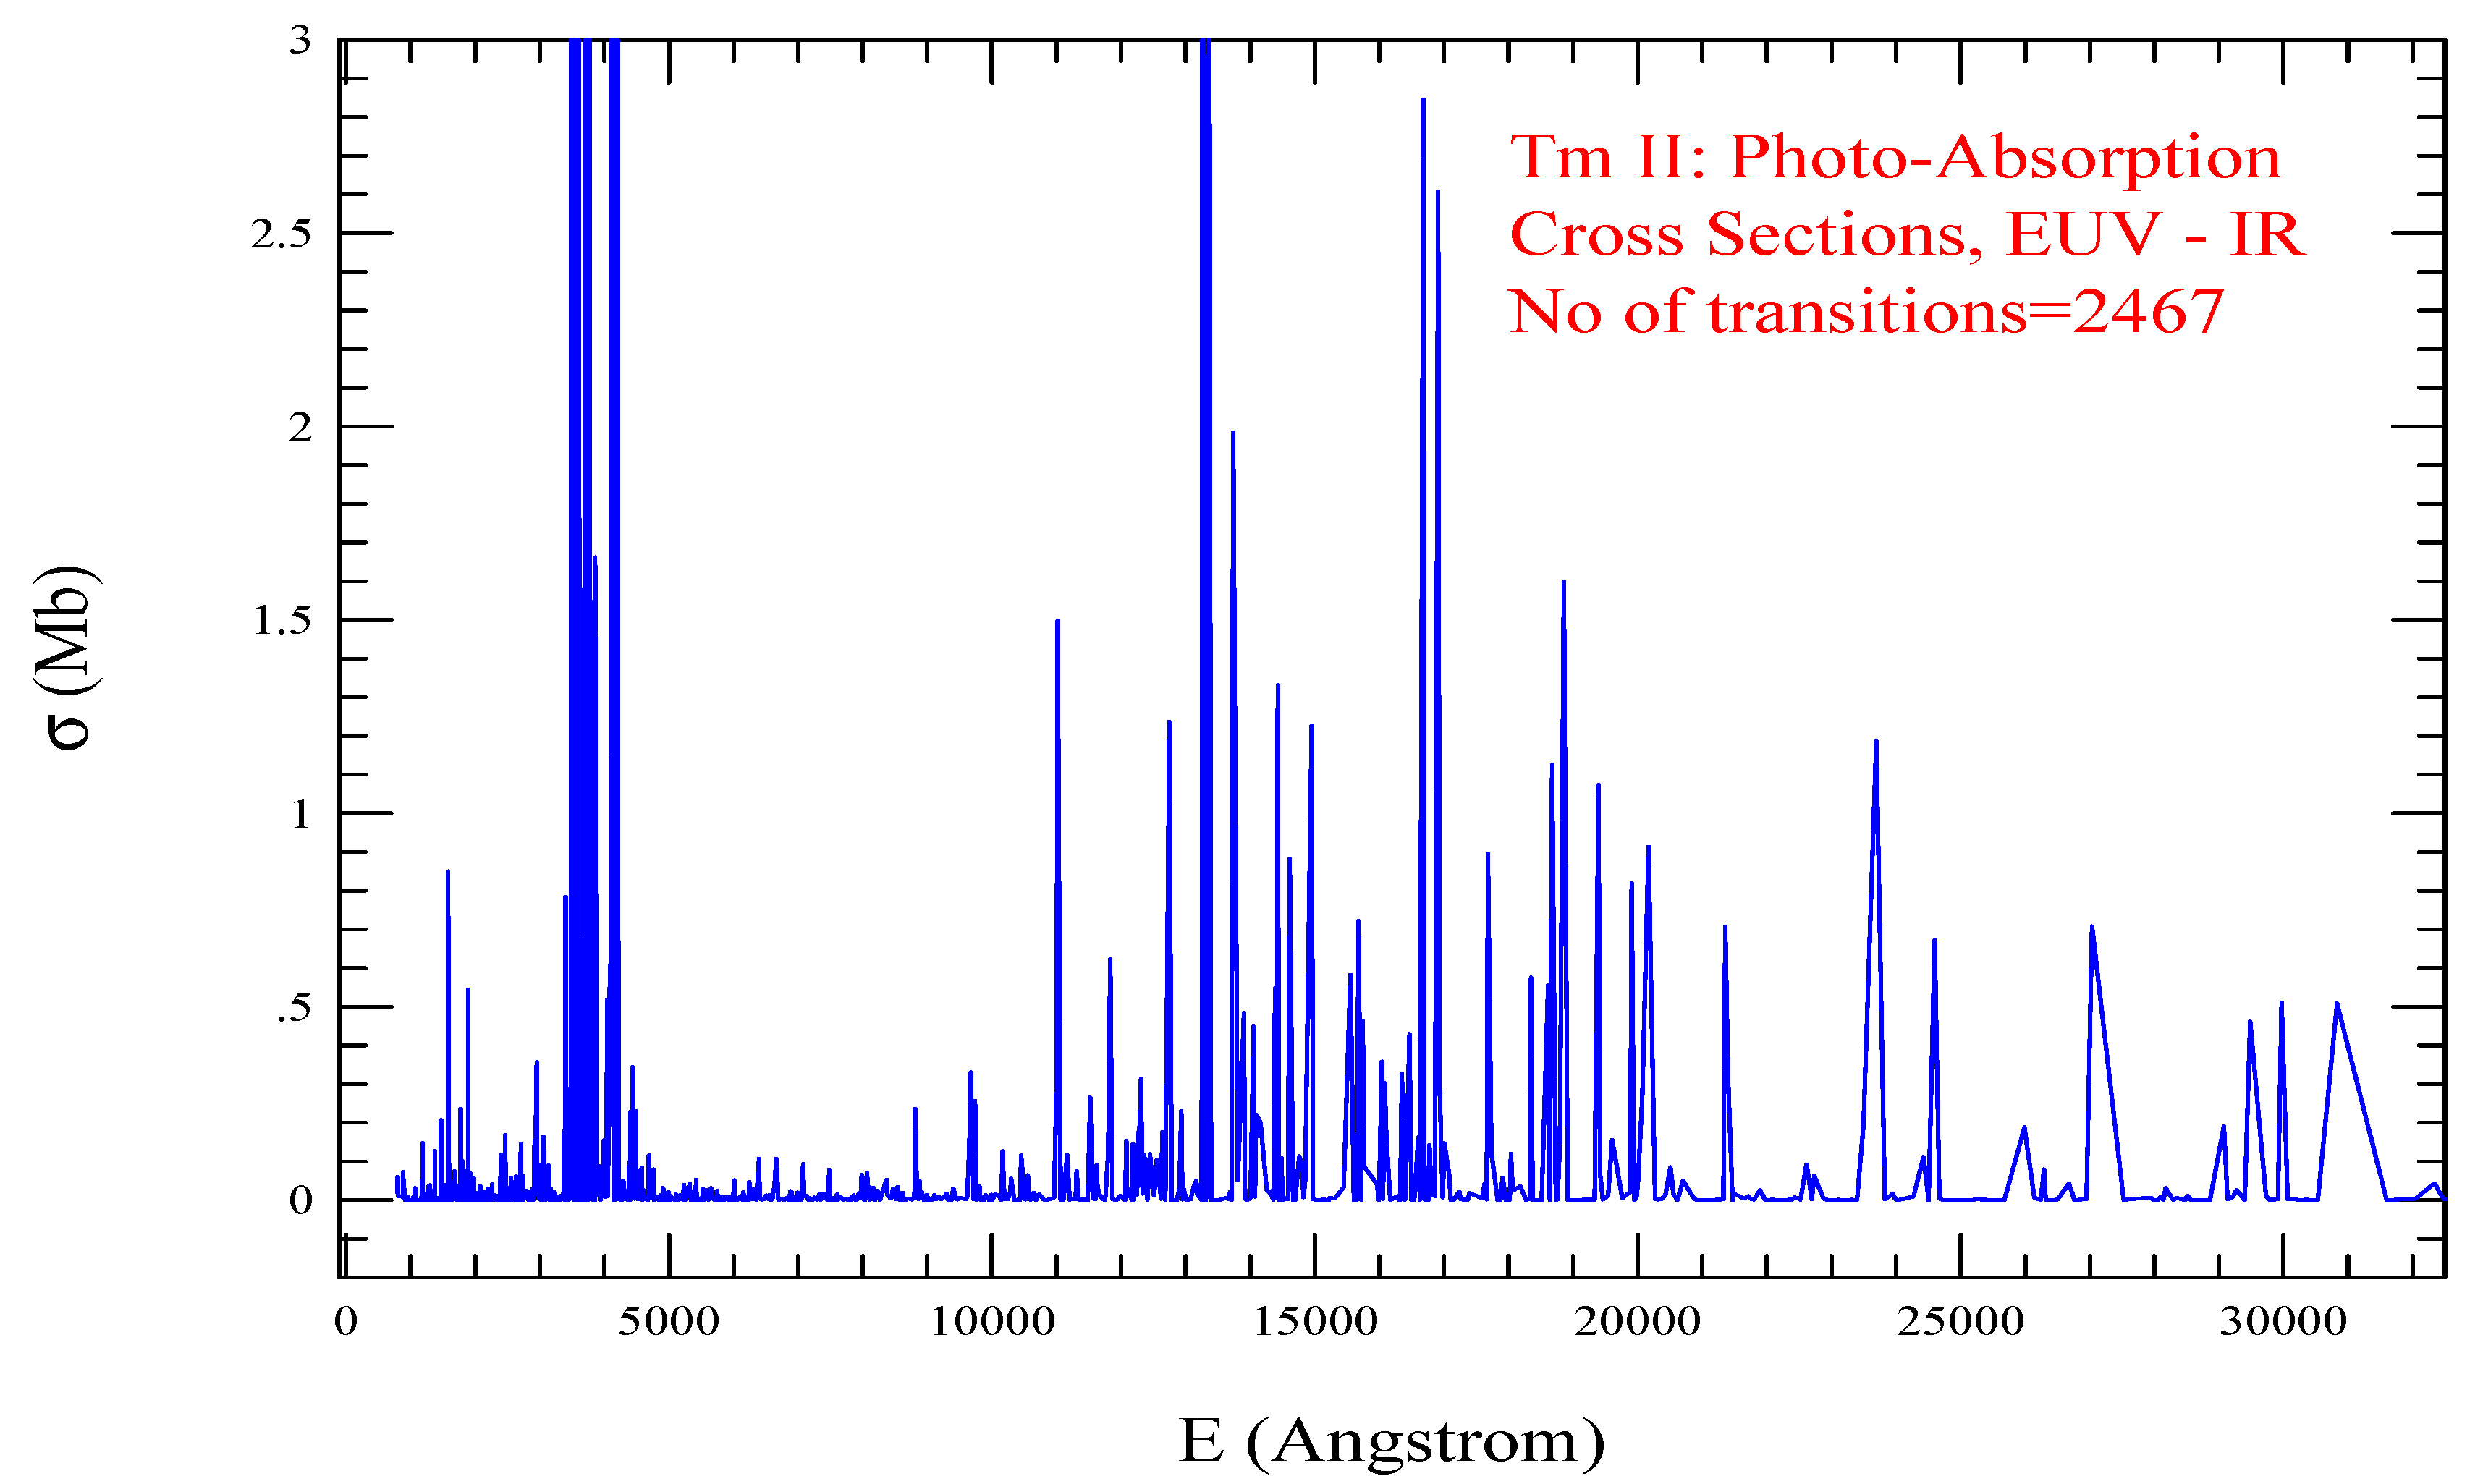
Spectrum of Tm II, presented in Figure 10, shows two visible broad regions, one in UV and a wider one in the IR, almost no strong lines in the optical (400 - 7000 Å) region. The number of transitions included is 2467.
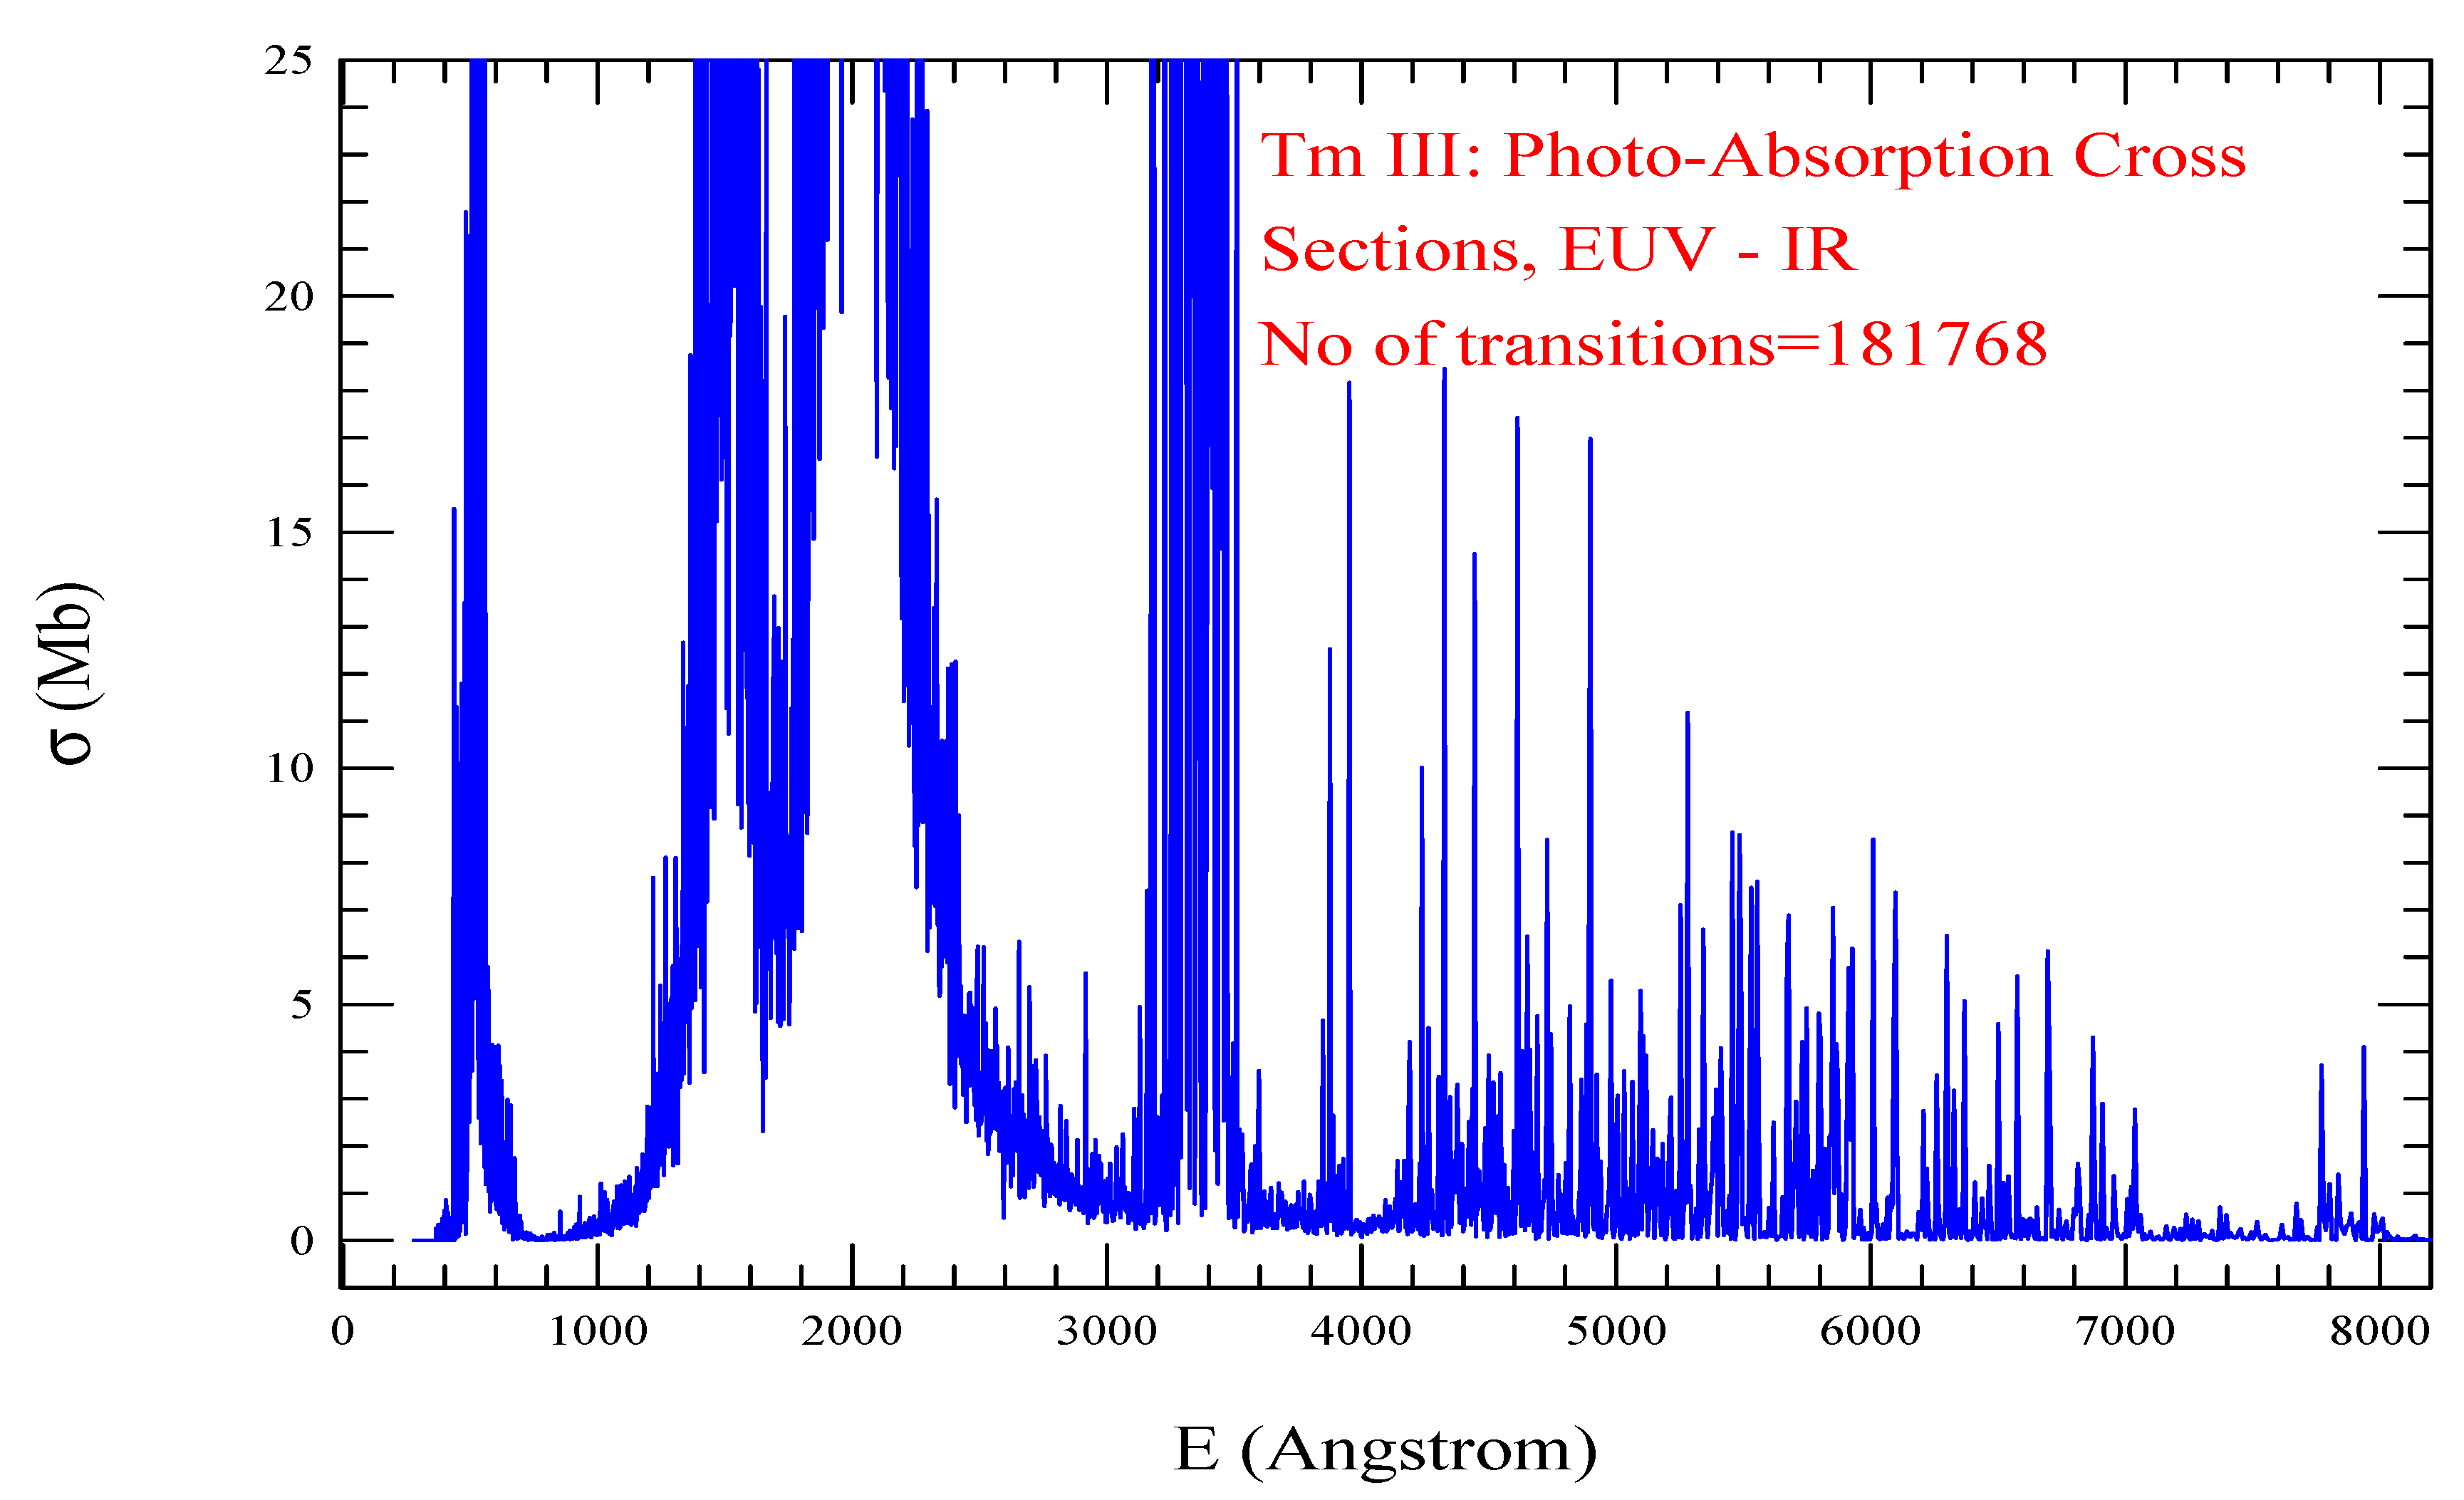
Spectrum of Tm III, presented in Figure 11, shows multiple broad regions with strong lines, in the wavelength regions from EUV to covering the optical range. The widest one is in the range of 1200 - 2500 Å. The number of transitions included is 181768.
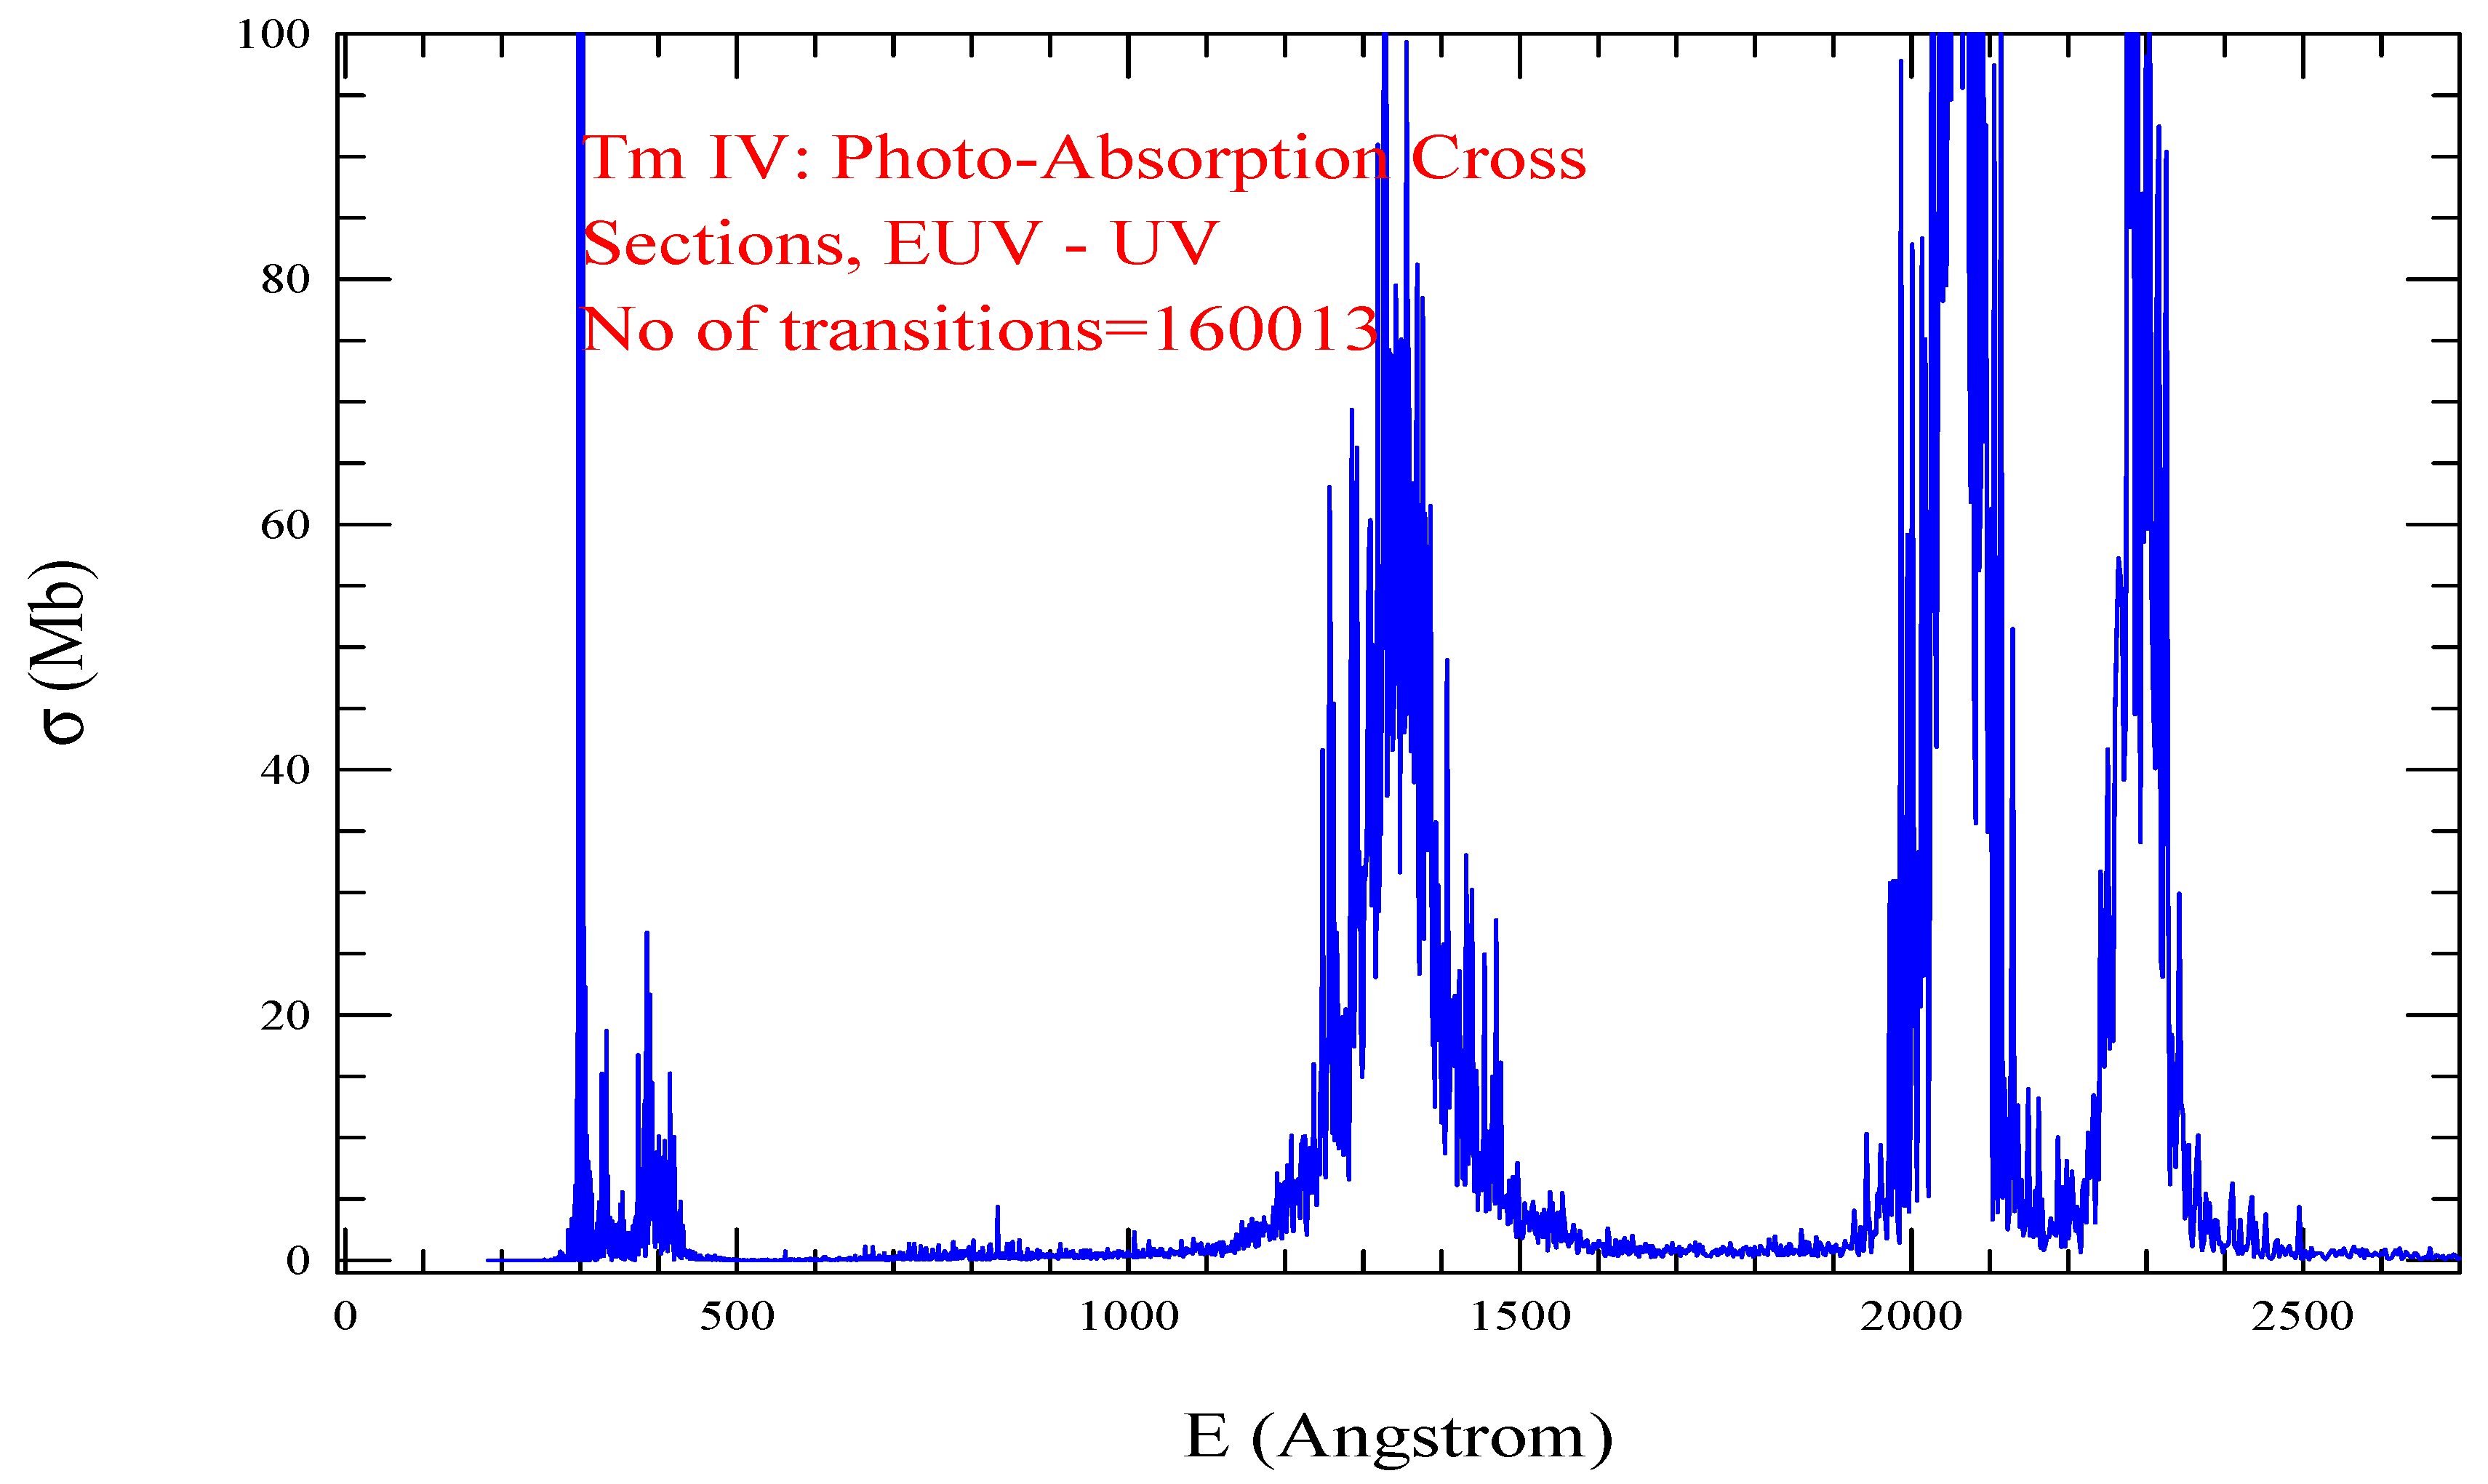
Spectrum of Tm IV, presented in Figure 12, shows four distinct broad regions, with strong lines, in the wavelength regions from EUV to covering up to UV. The number of transitions included is 160013.
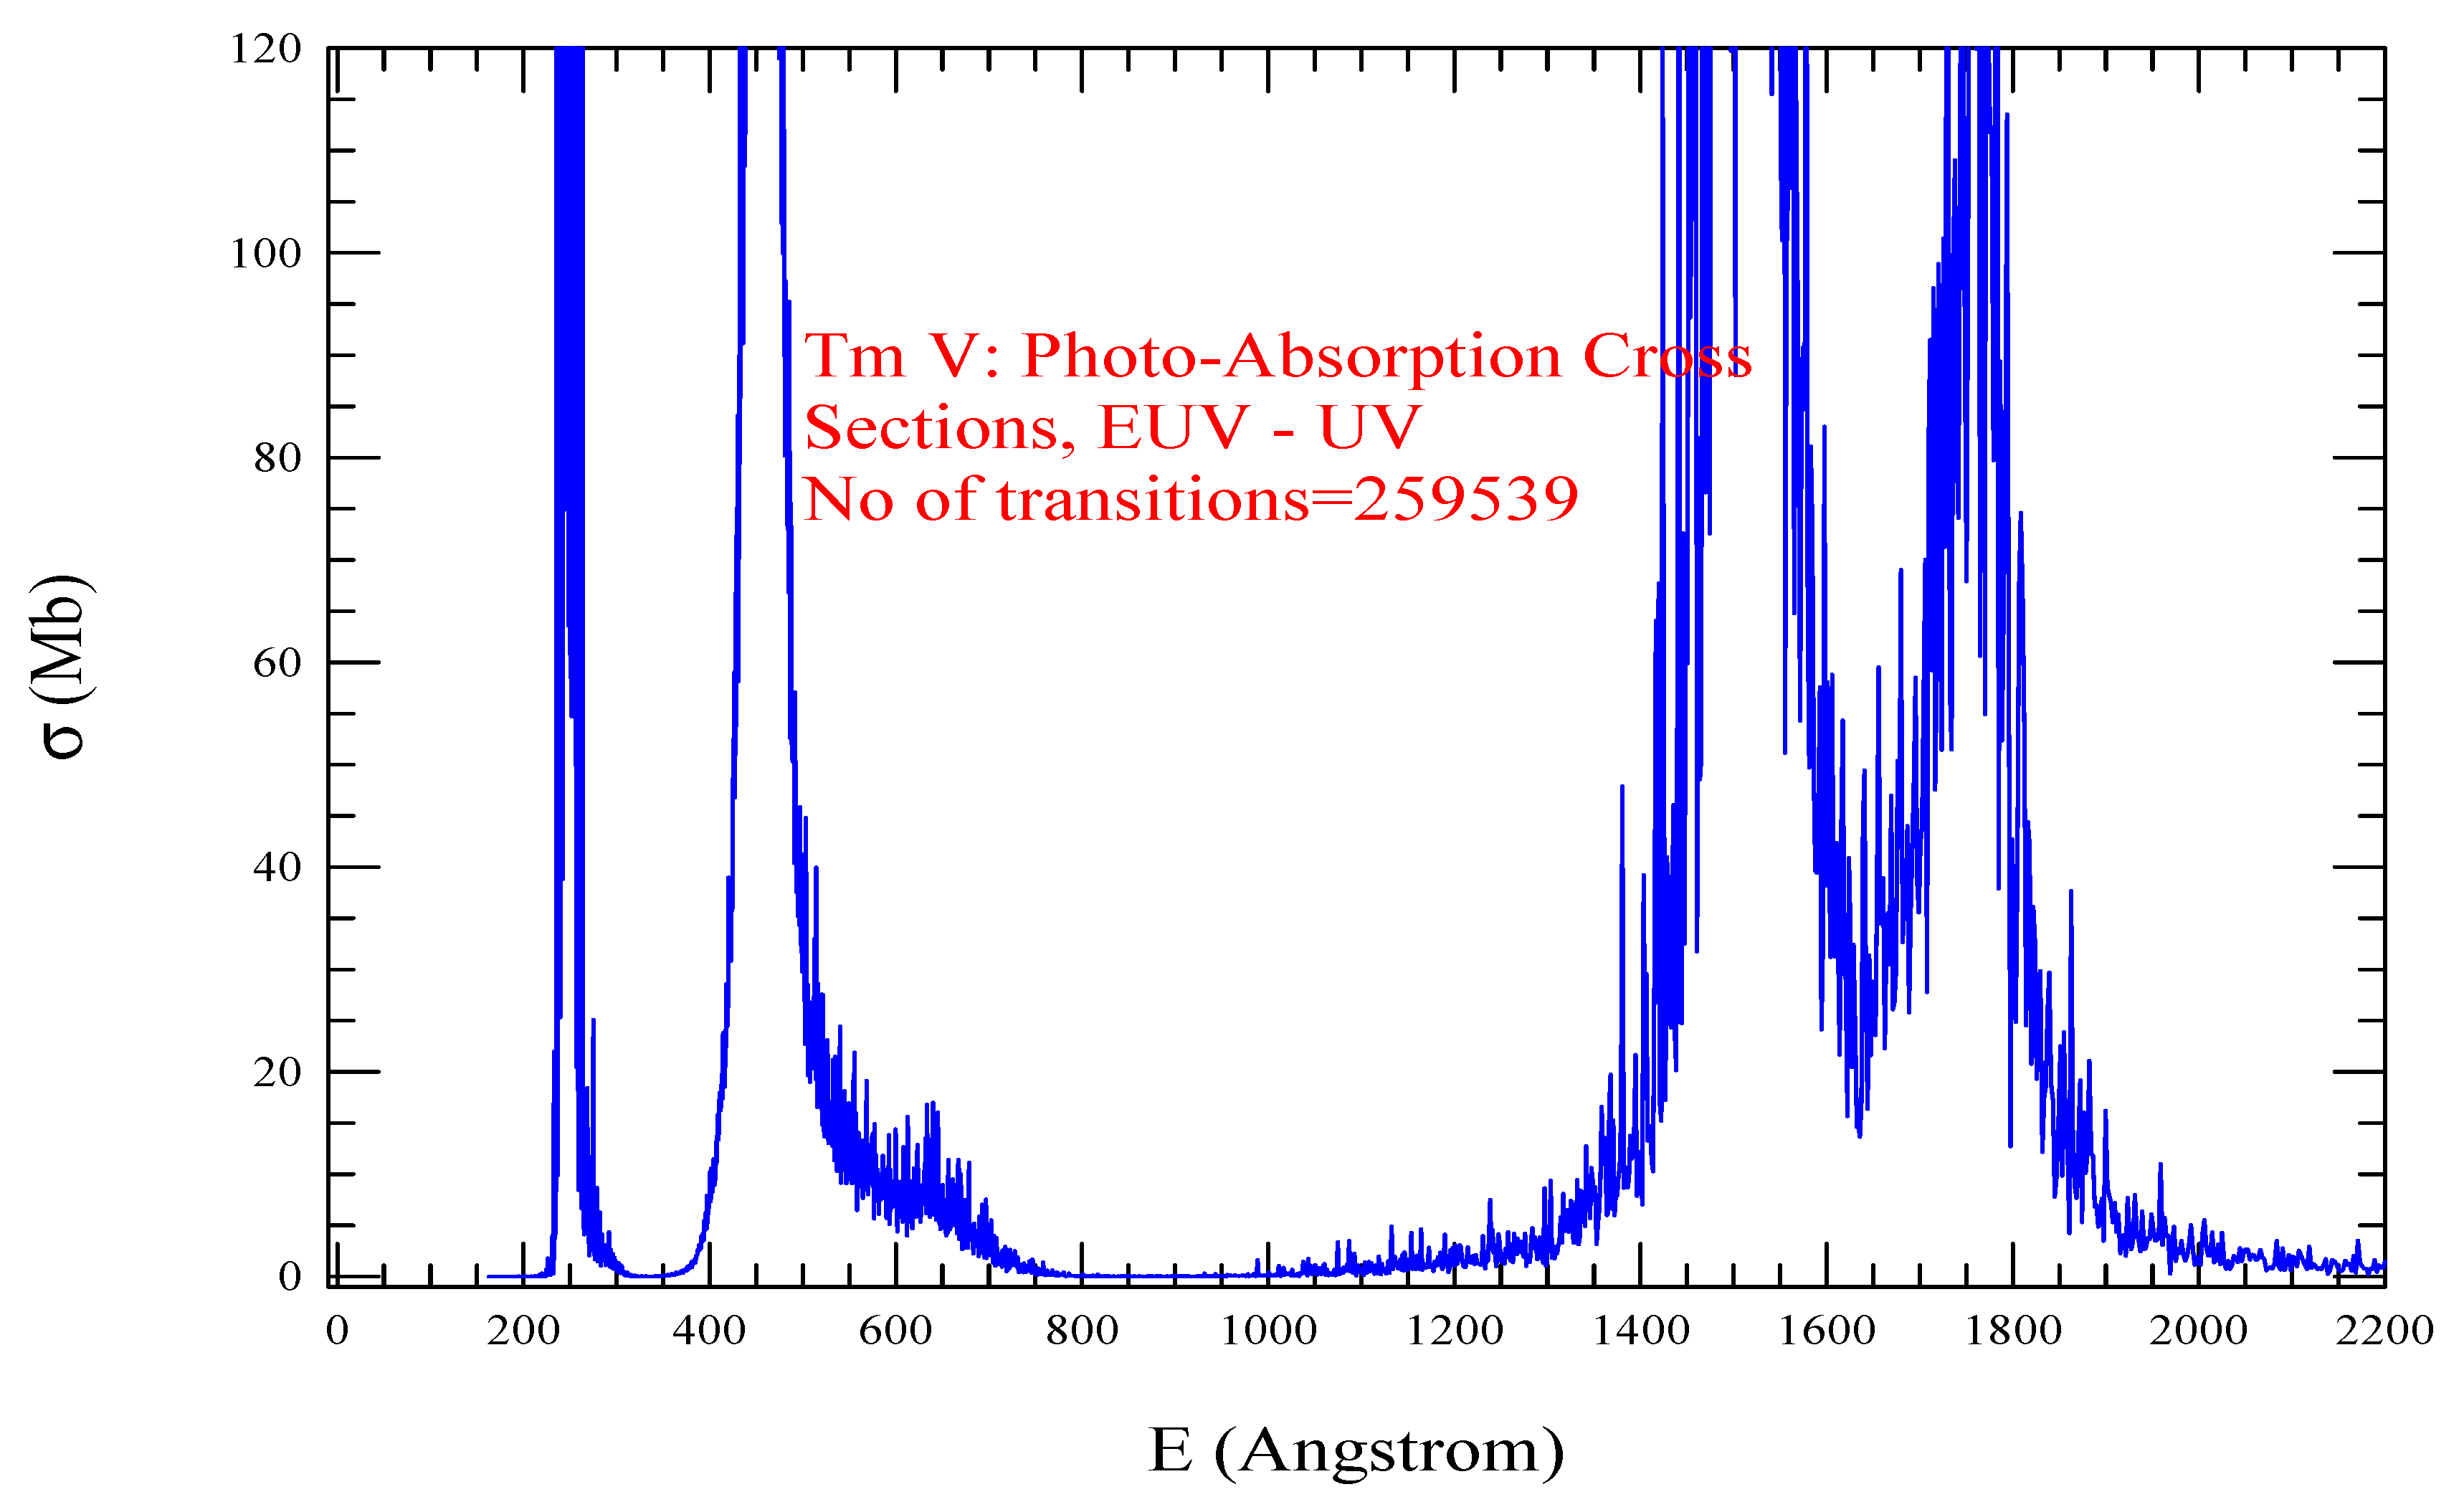
Photoabsorption spectrum of Tm V, presented in Figure 13, demonstrates dominance of strong lines in the energy range of EUV to UV with a gap of about 700 to 13 00 Å. It shows multiple broad structures from EUV to UV wavelength range, widest one being in the range of 1400 - 1900 Åwith a dip around 1650 Å. The number of transitions included is 259539.
Yb I - VI:
Yb I identification for the 4 levels above 4 f 14 6 s 6 p ( 3 P o ) is not defined at NIST table and hence SS identifications that match the j-values are used. Yb I also perturbs easily with slight change in length of the orbital wavefunctions. They were optimized to match the observed low lying energies by Martin et al [12], but order of the spectroscopic identifications has less agreement.
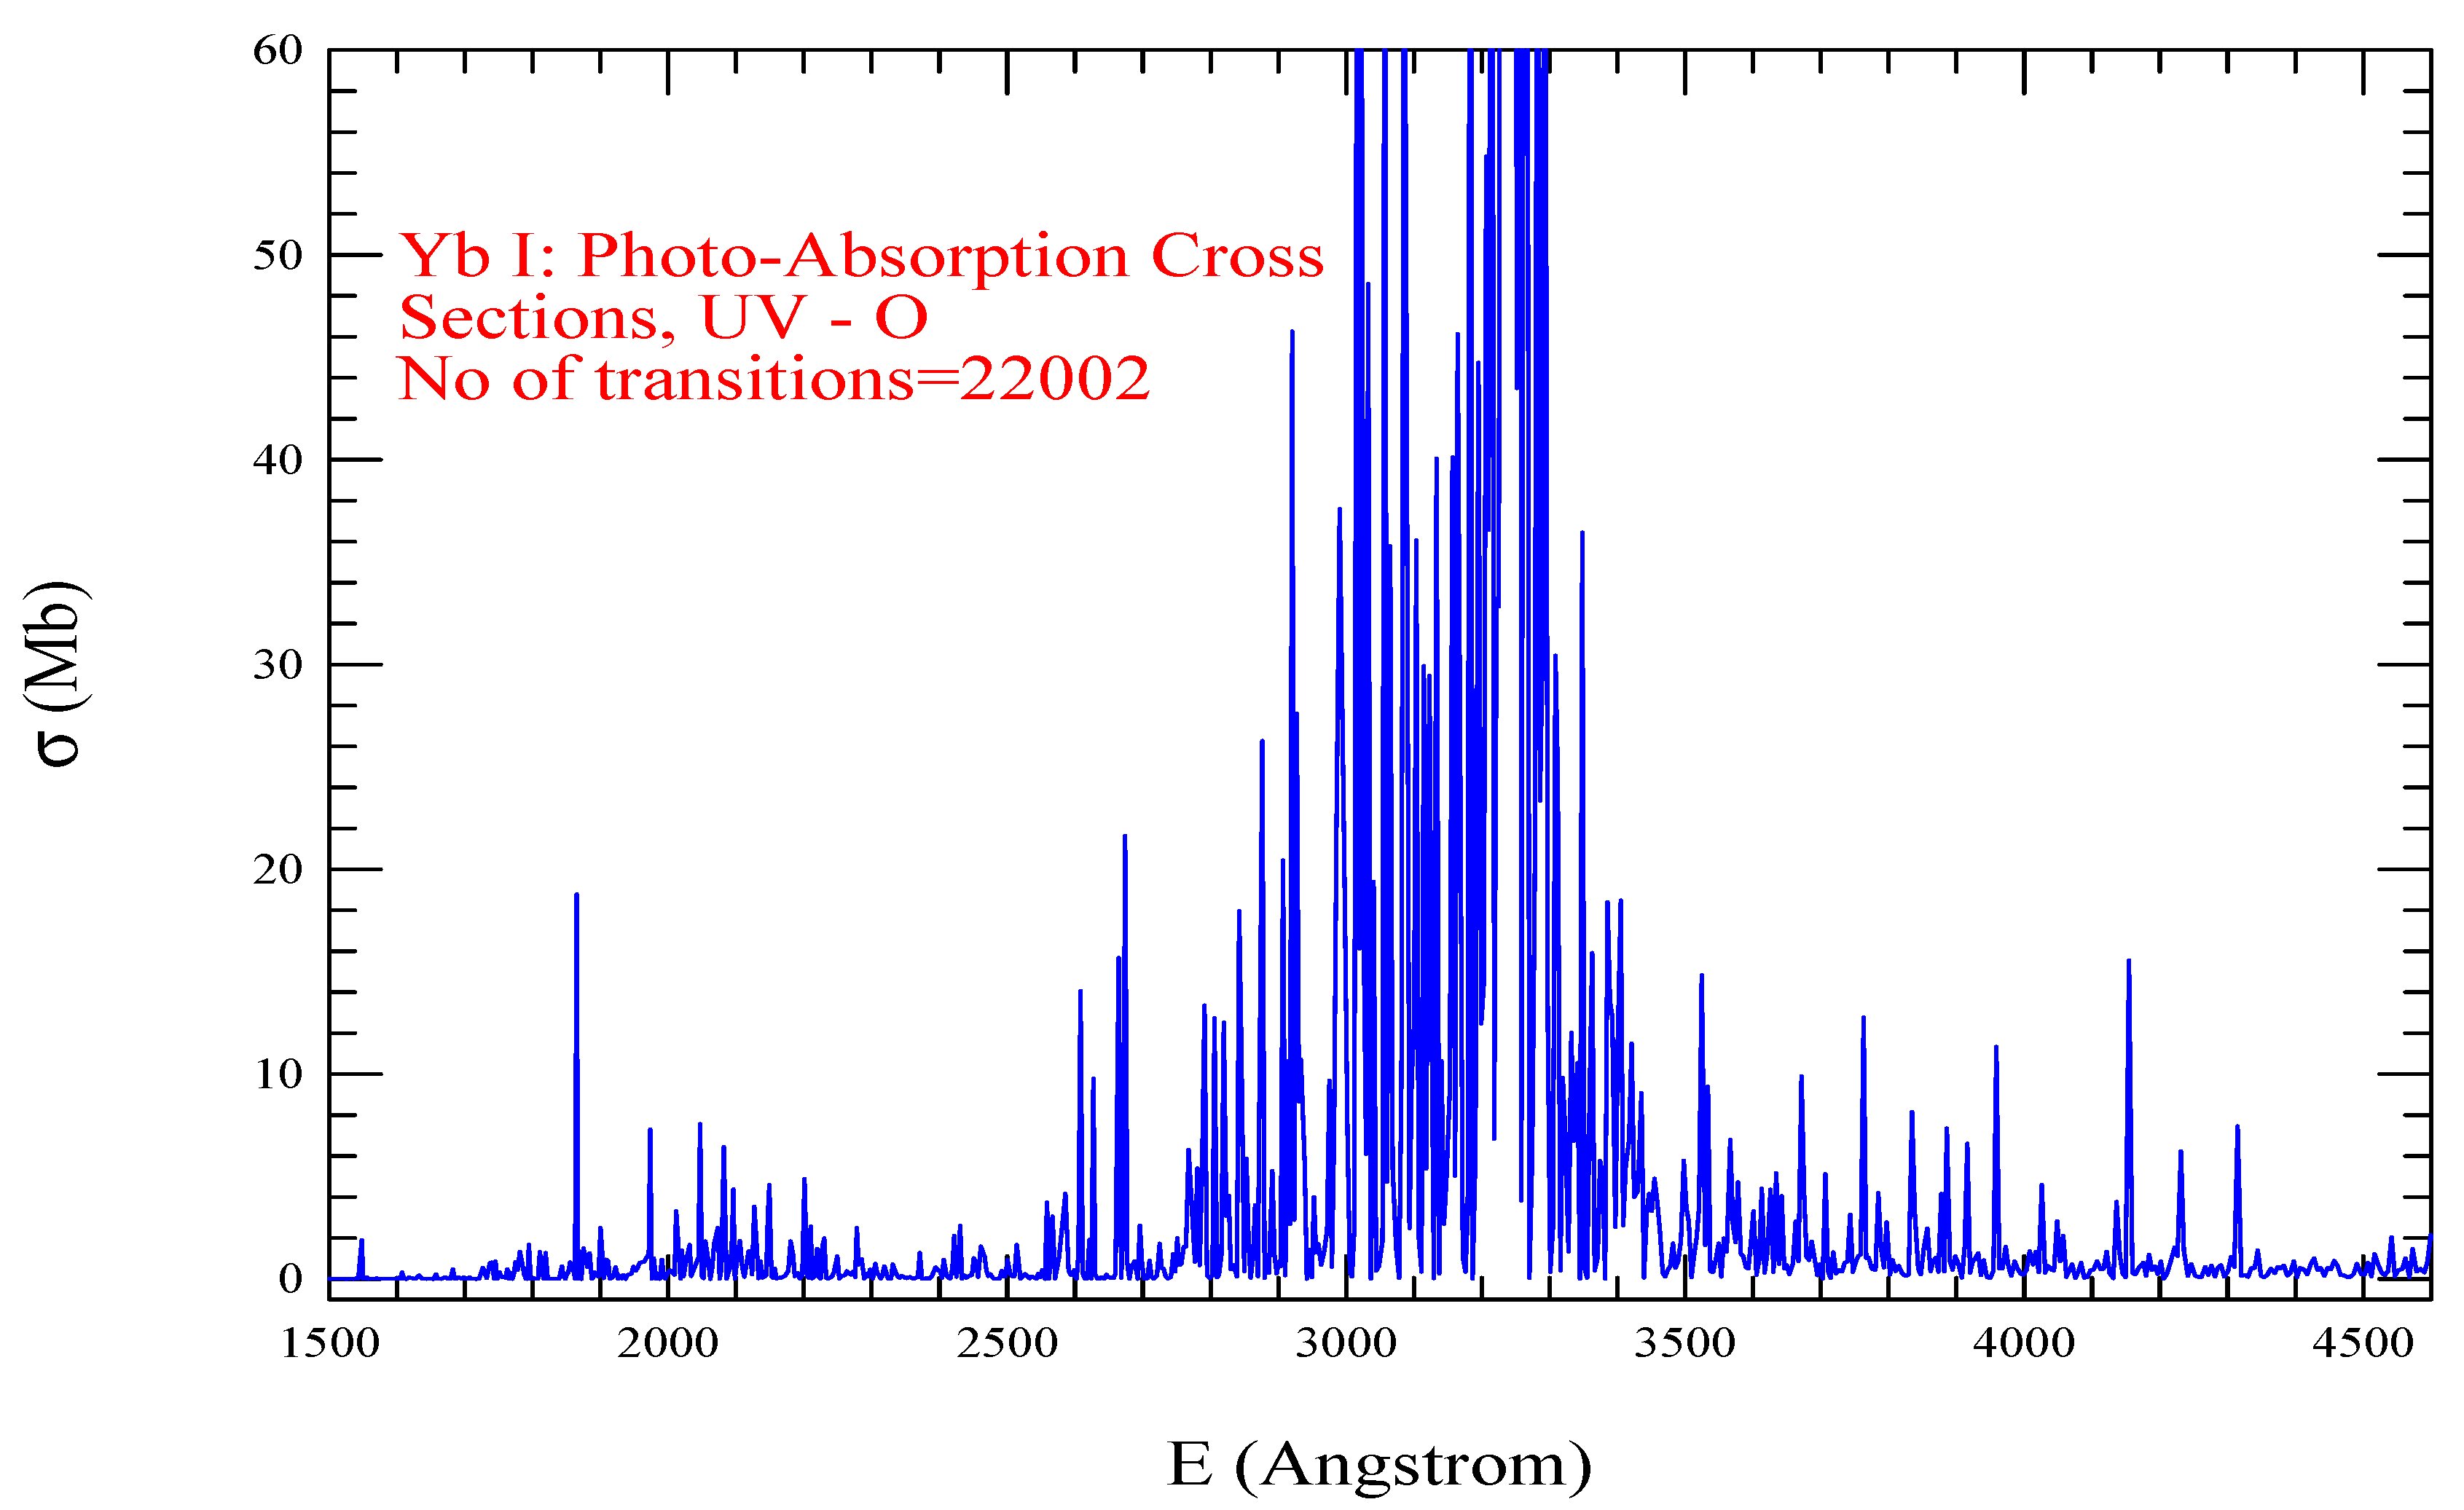
Photoabsorption spectrum of Yb I, presented in Figure 14, demonstrates dominance of strong lines in the energy range of EUV to UV with a broad feature in wavelength range of about 2600 to 3500 Å. The number of transitions included is 22002.
Yb II also had very sensitive electron-electron interaction potential that would cause energy levels to change the order of energy positions or the energy values with slight change in the wavefunction. Since NIST table reports over 90% leading percentage for the lowest lying level designations, the present optimization concentrated more in the energy order than the energy values.
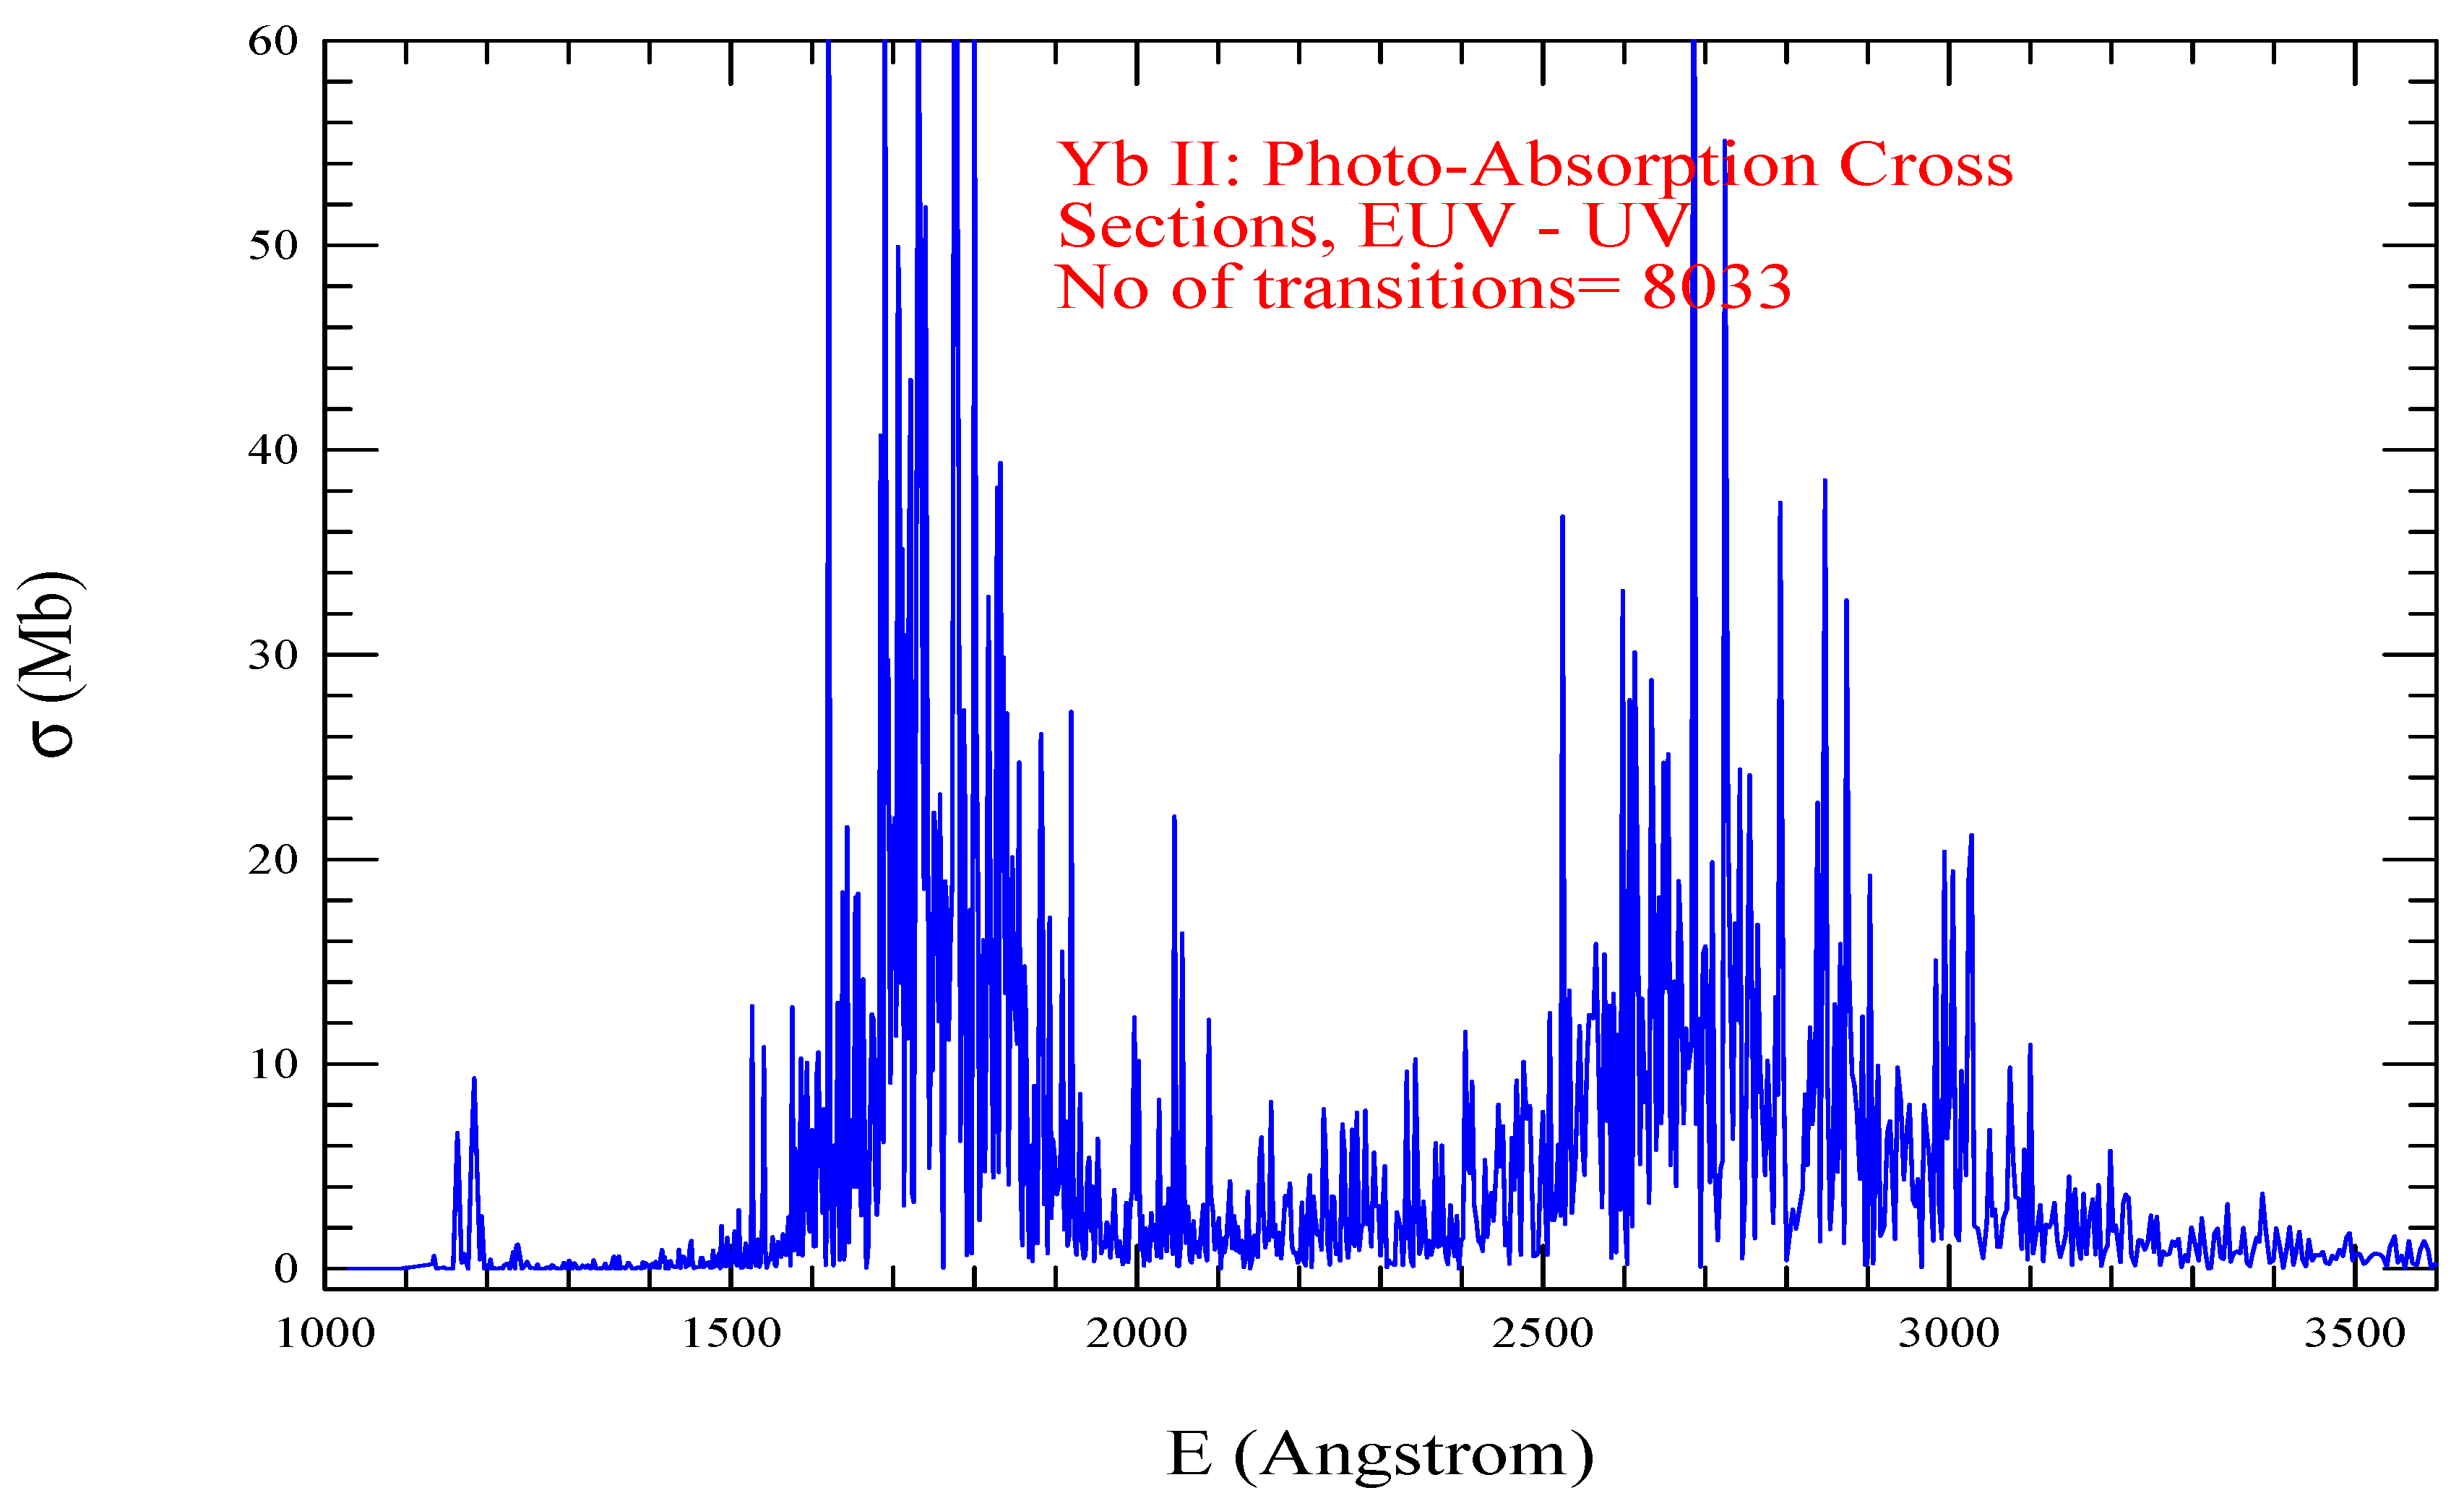
Photoabsorption cross sections ( σ P I ) of the Yb II, presented in Figure 15, shows dominating strong lines in the energy range of EUV - UV. The spectrum also shows two broad features, one in the wavelength range of 1500 - 2100 Åand other one in 2500 - 3100 Å. The number of transitions included is 8083.
Yb III has an energy gap for any configuration beyond configuration 4 f 13 5 d . The present computation could not include 7nl due to exceeding the limit of dimensions. Hence some energies are missing most probably in UV region. SS identification for the levels is used whenever NIST did not have one.
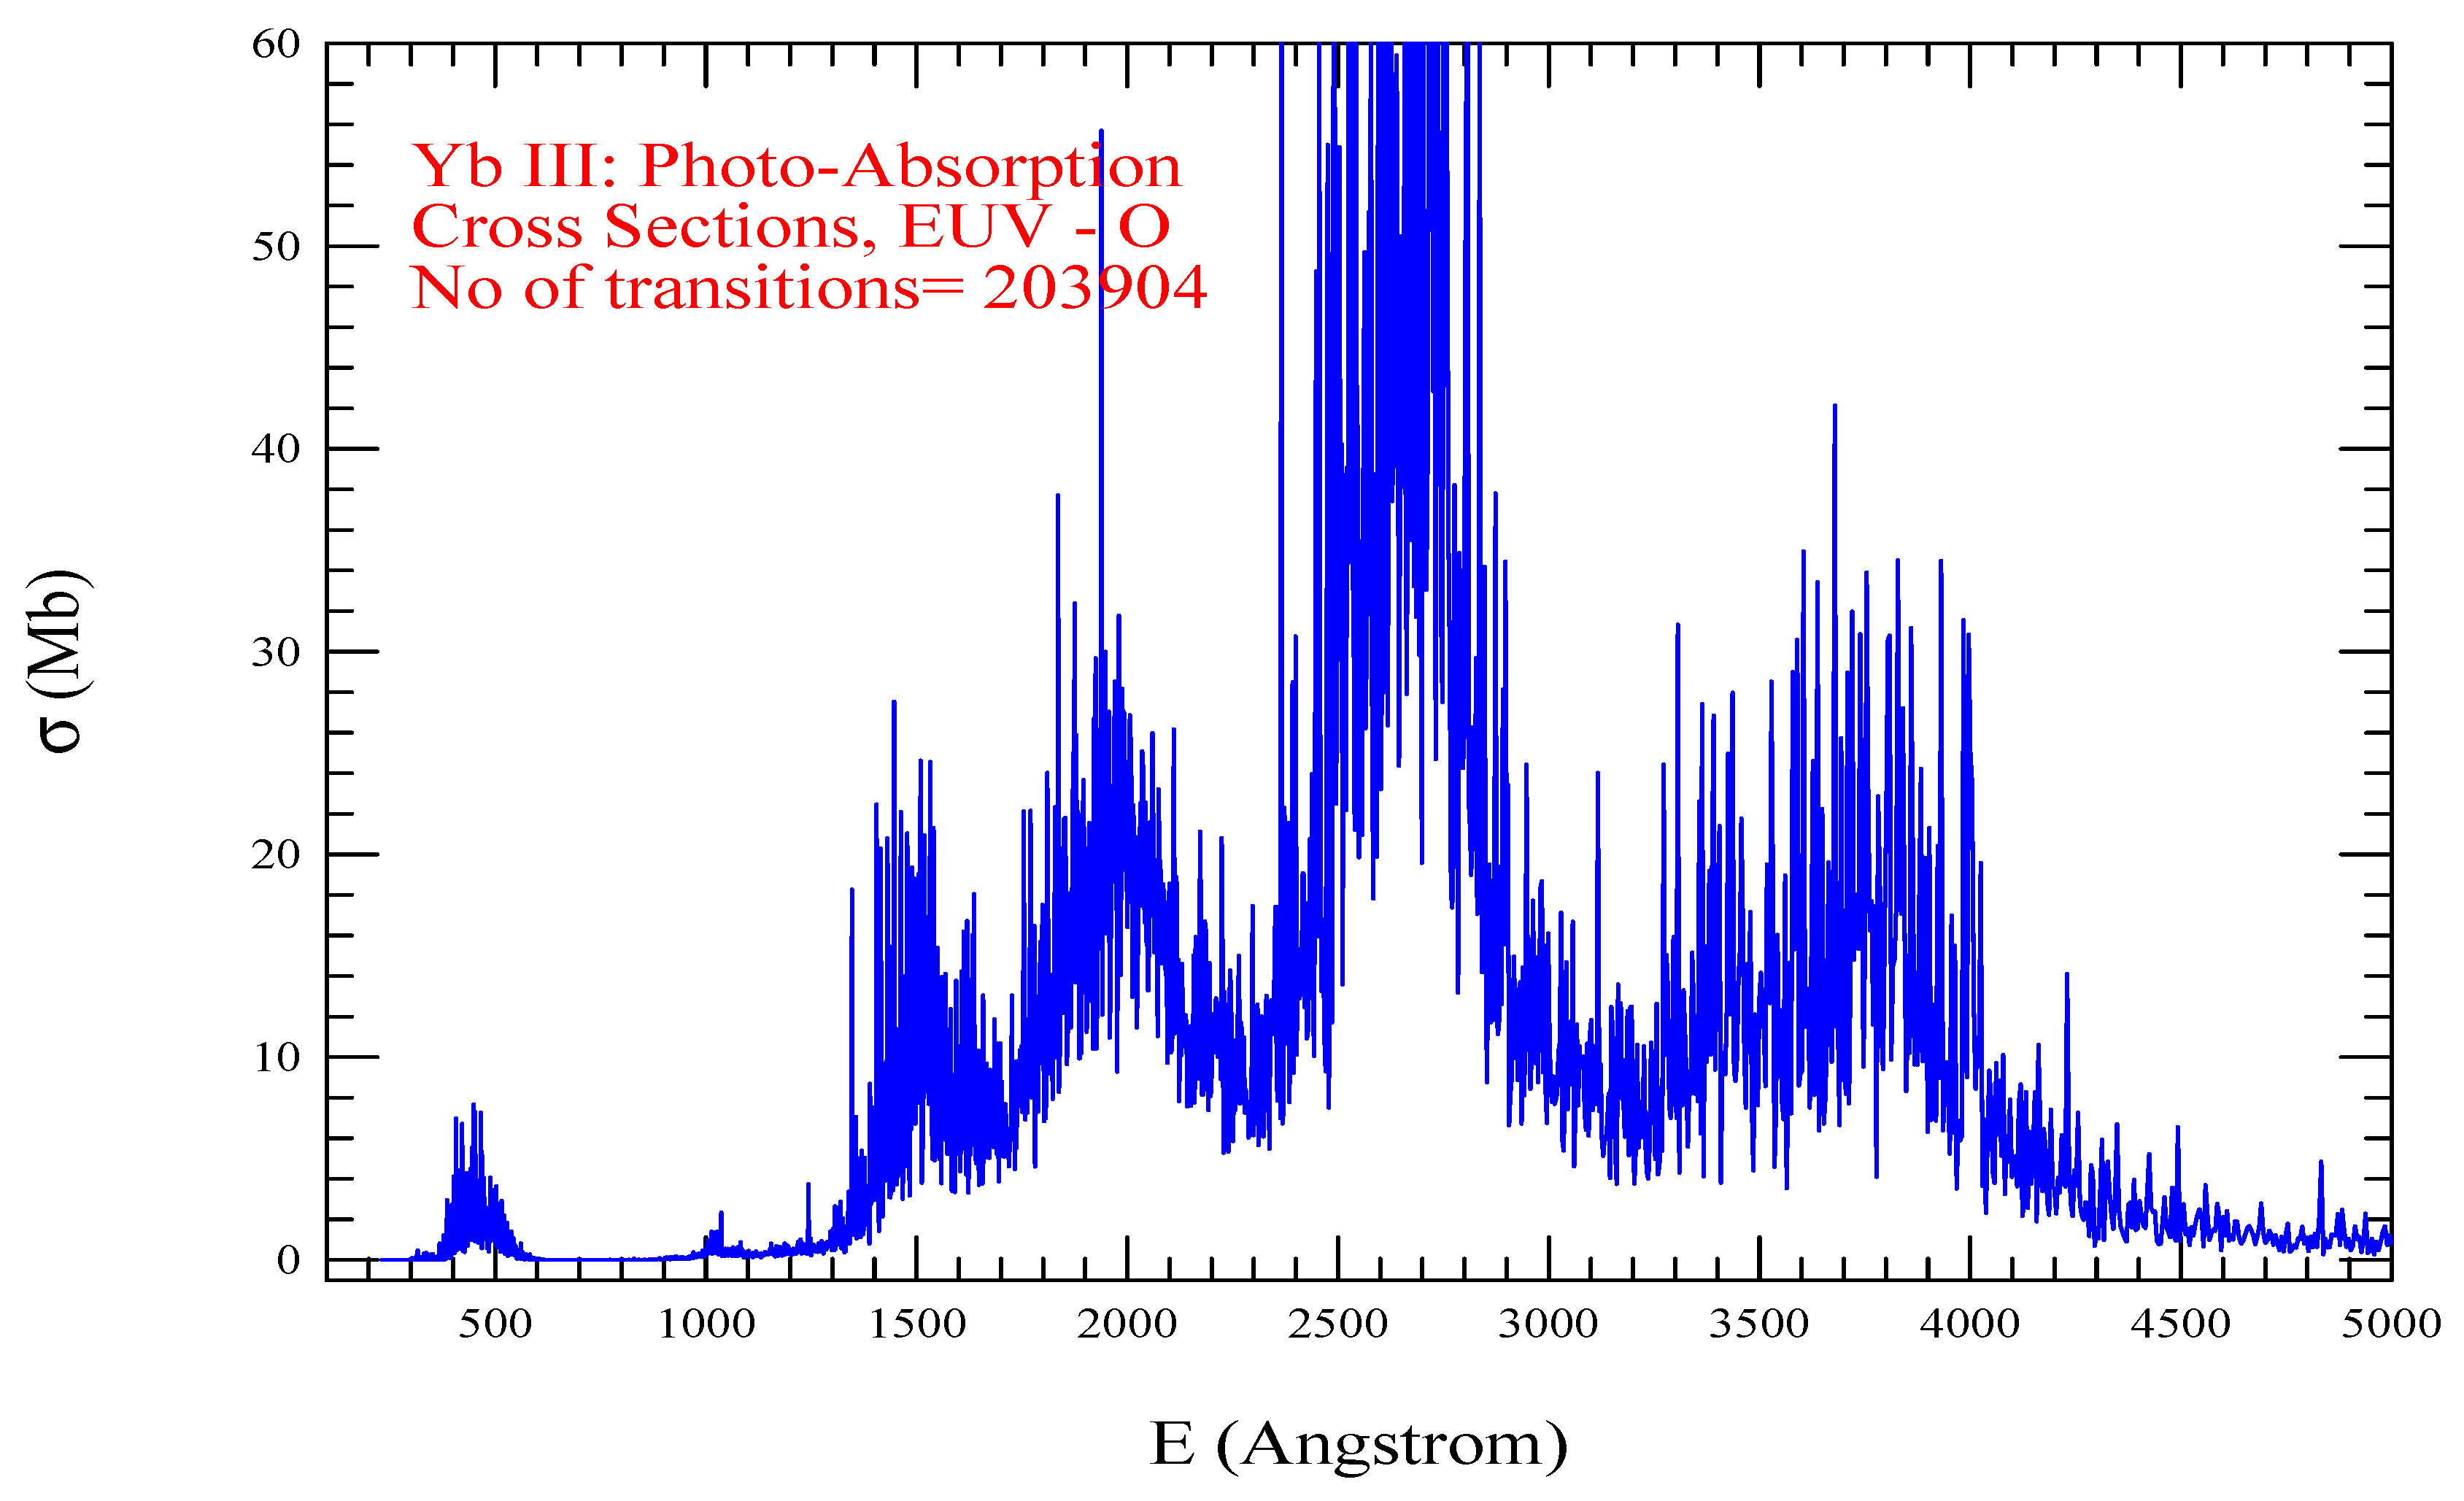
Photoabsorption cross sections ( σ P I ) of the Yb III, presented in Figure 16, has multiple broad features dominated by strong lines in the energy range of EUV - O. The strongest absorption bum is in the wavelength range of 2200 - 3000 Å. The number of transitions included is 203904.
Yb IV energies agree well with measured values. The identifications of levels given in Table 4 correspond to those of SS as most levels are not identified in NIST table.
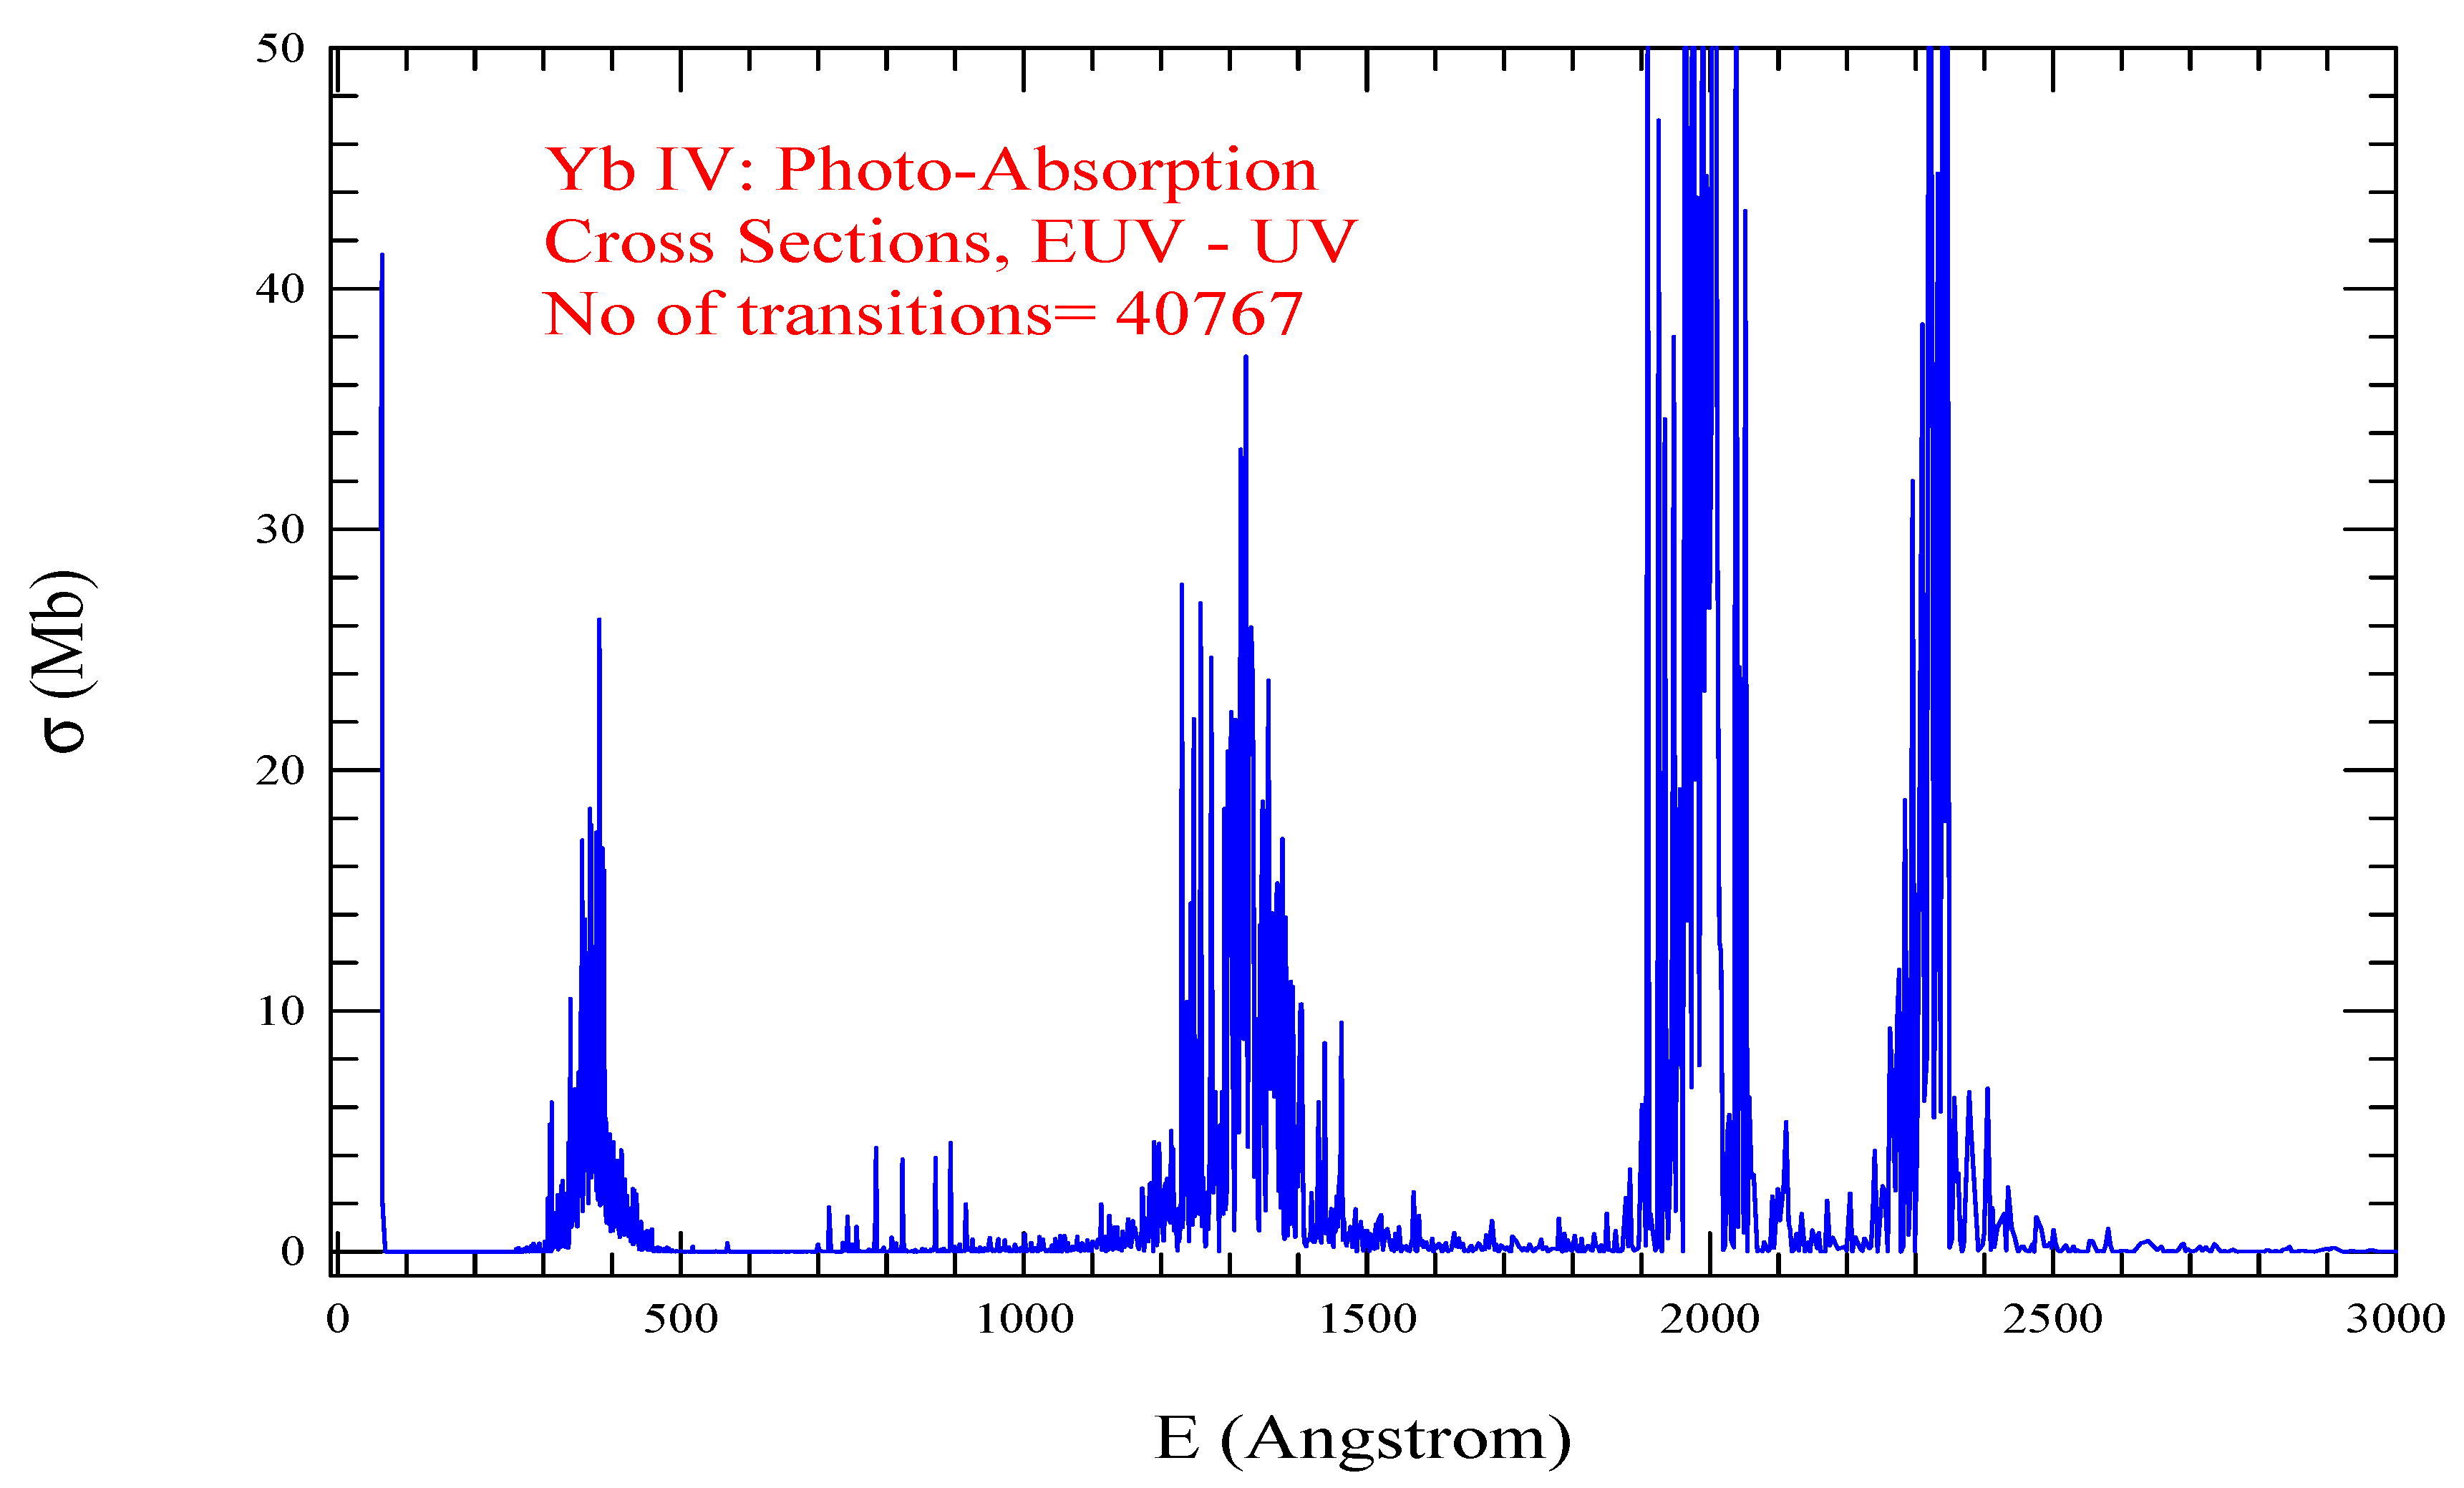
Photoabsorption cross sections ( σ P I ) of the Yb IV, presented in Figure 17, has multiple broad features dominated by strong lines in the energy range of EUV - UV. The number of transitions included is 40767.
There is no measured energy levels for Yb V except the 3H6 is the ground level with which we agree. Rest of the energy levels of Yb V in Table are calculated ones.
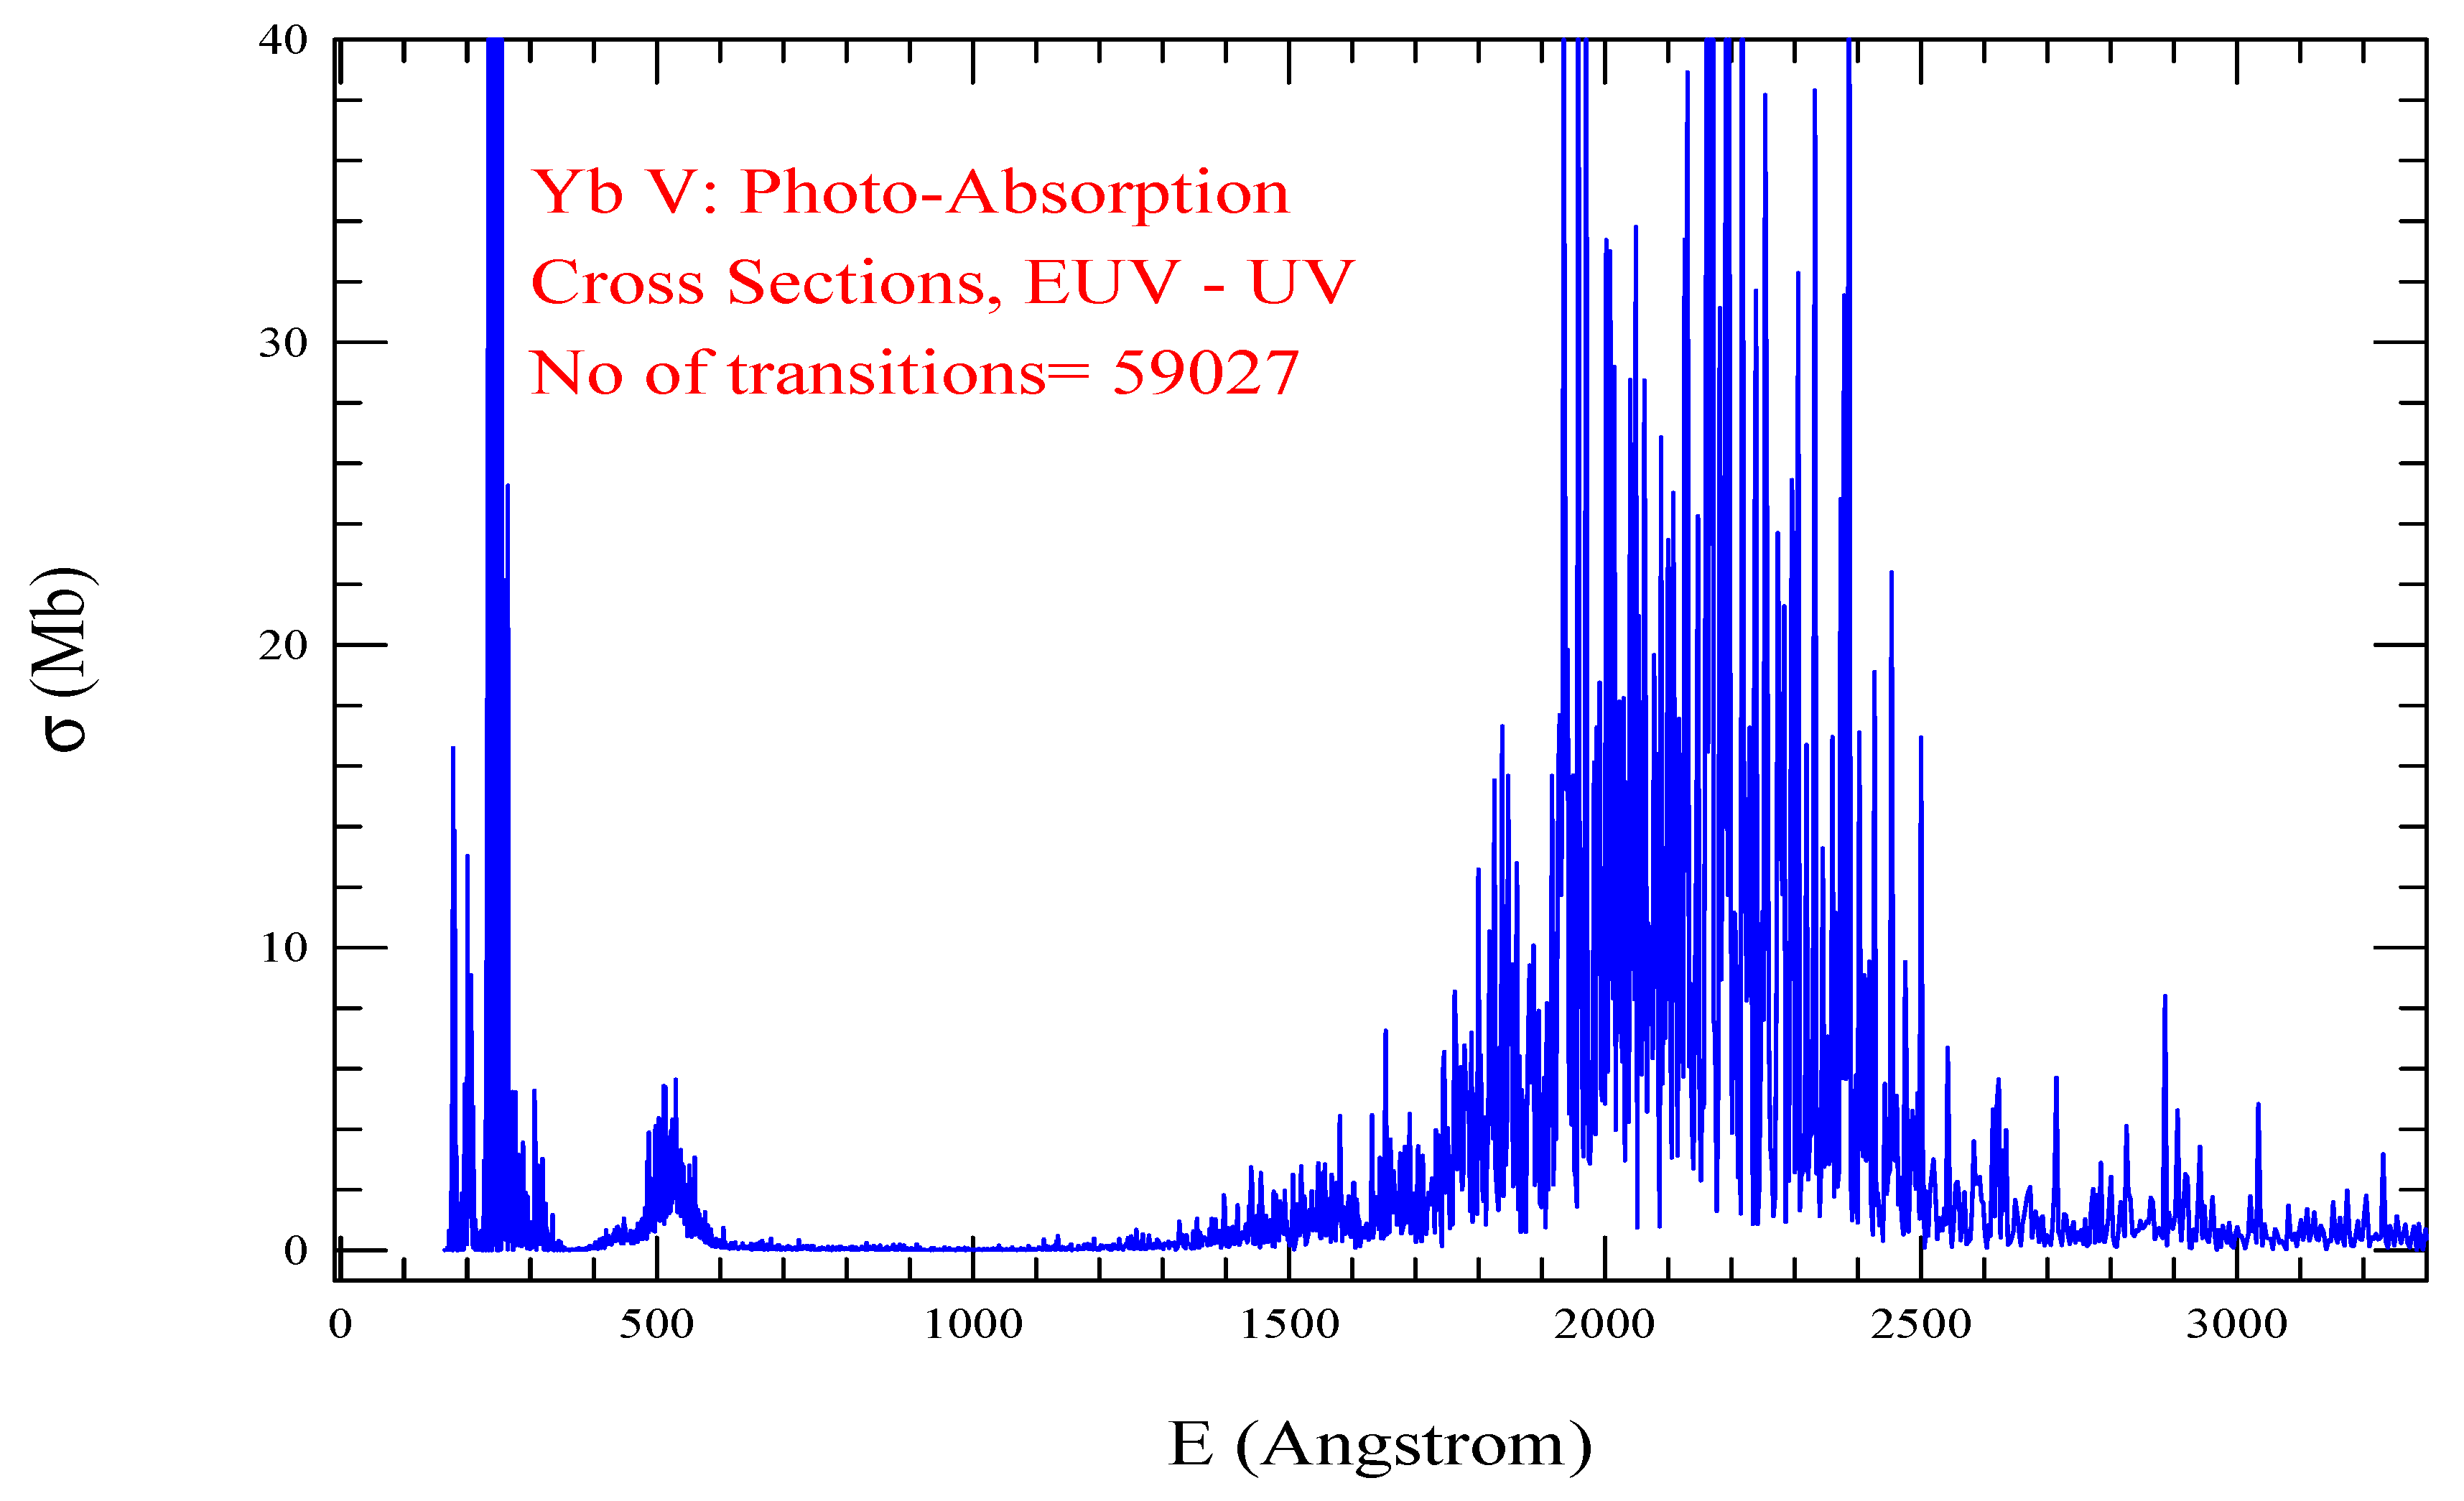
Photoabsorption cross sections ( σ P I ) of the Yb V, presented in Figure 18, shows noticeable features in the energy range of EUV - UH. It has two broad features dominated by strong lines, one in the EUV region followed by a lower peak structure and the broader absorption bump in the wavelength region of 1600 to 2500 ÅThe number of transitions included is 59027.
Yb VI has 68 levels belonging to the ground configuration 4 f 12 5 p 5 . The first dipole allowed transition of the ground level 4 I 15 / 2 o is at about 1 Ry higher which corresponds to a transition wavelength of 911/E(Ry)= 1.1−3 less than x-ray wavelength. No energy values are available at the NIST table. However, the ground level J-value has been predicted by [14] with which present work agrees. We notice that a different set of configurations can also produce energies for Yb VI that is different from the present set. The present set was chosen since the ground level matched that which is given at the NIST table. There is a need for observed values as guidance to determine the configuration set for the ion.
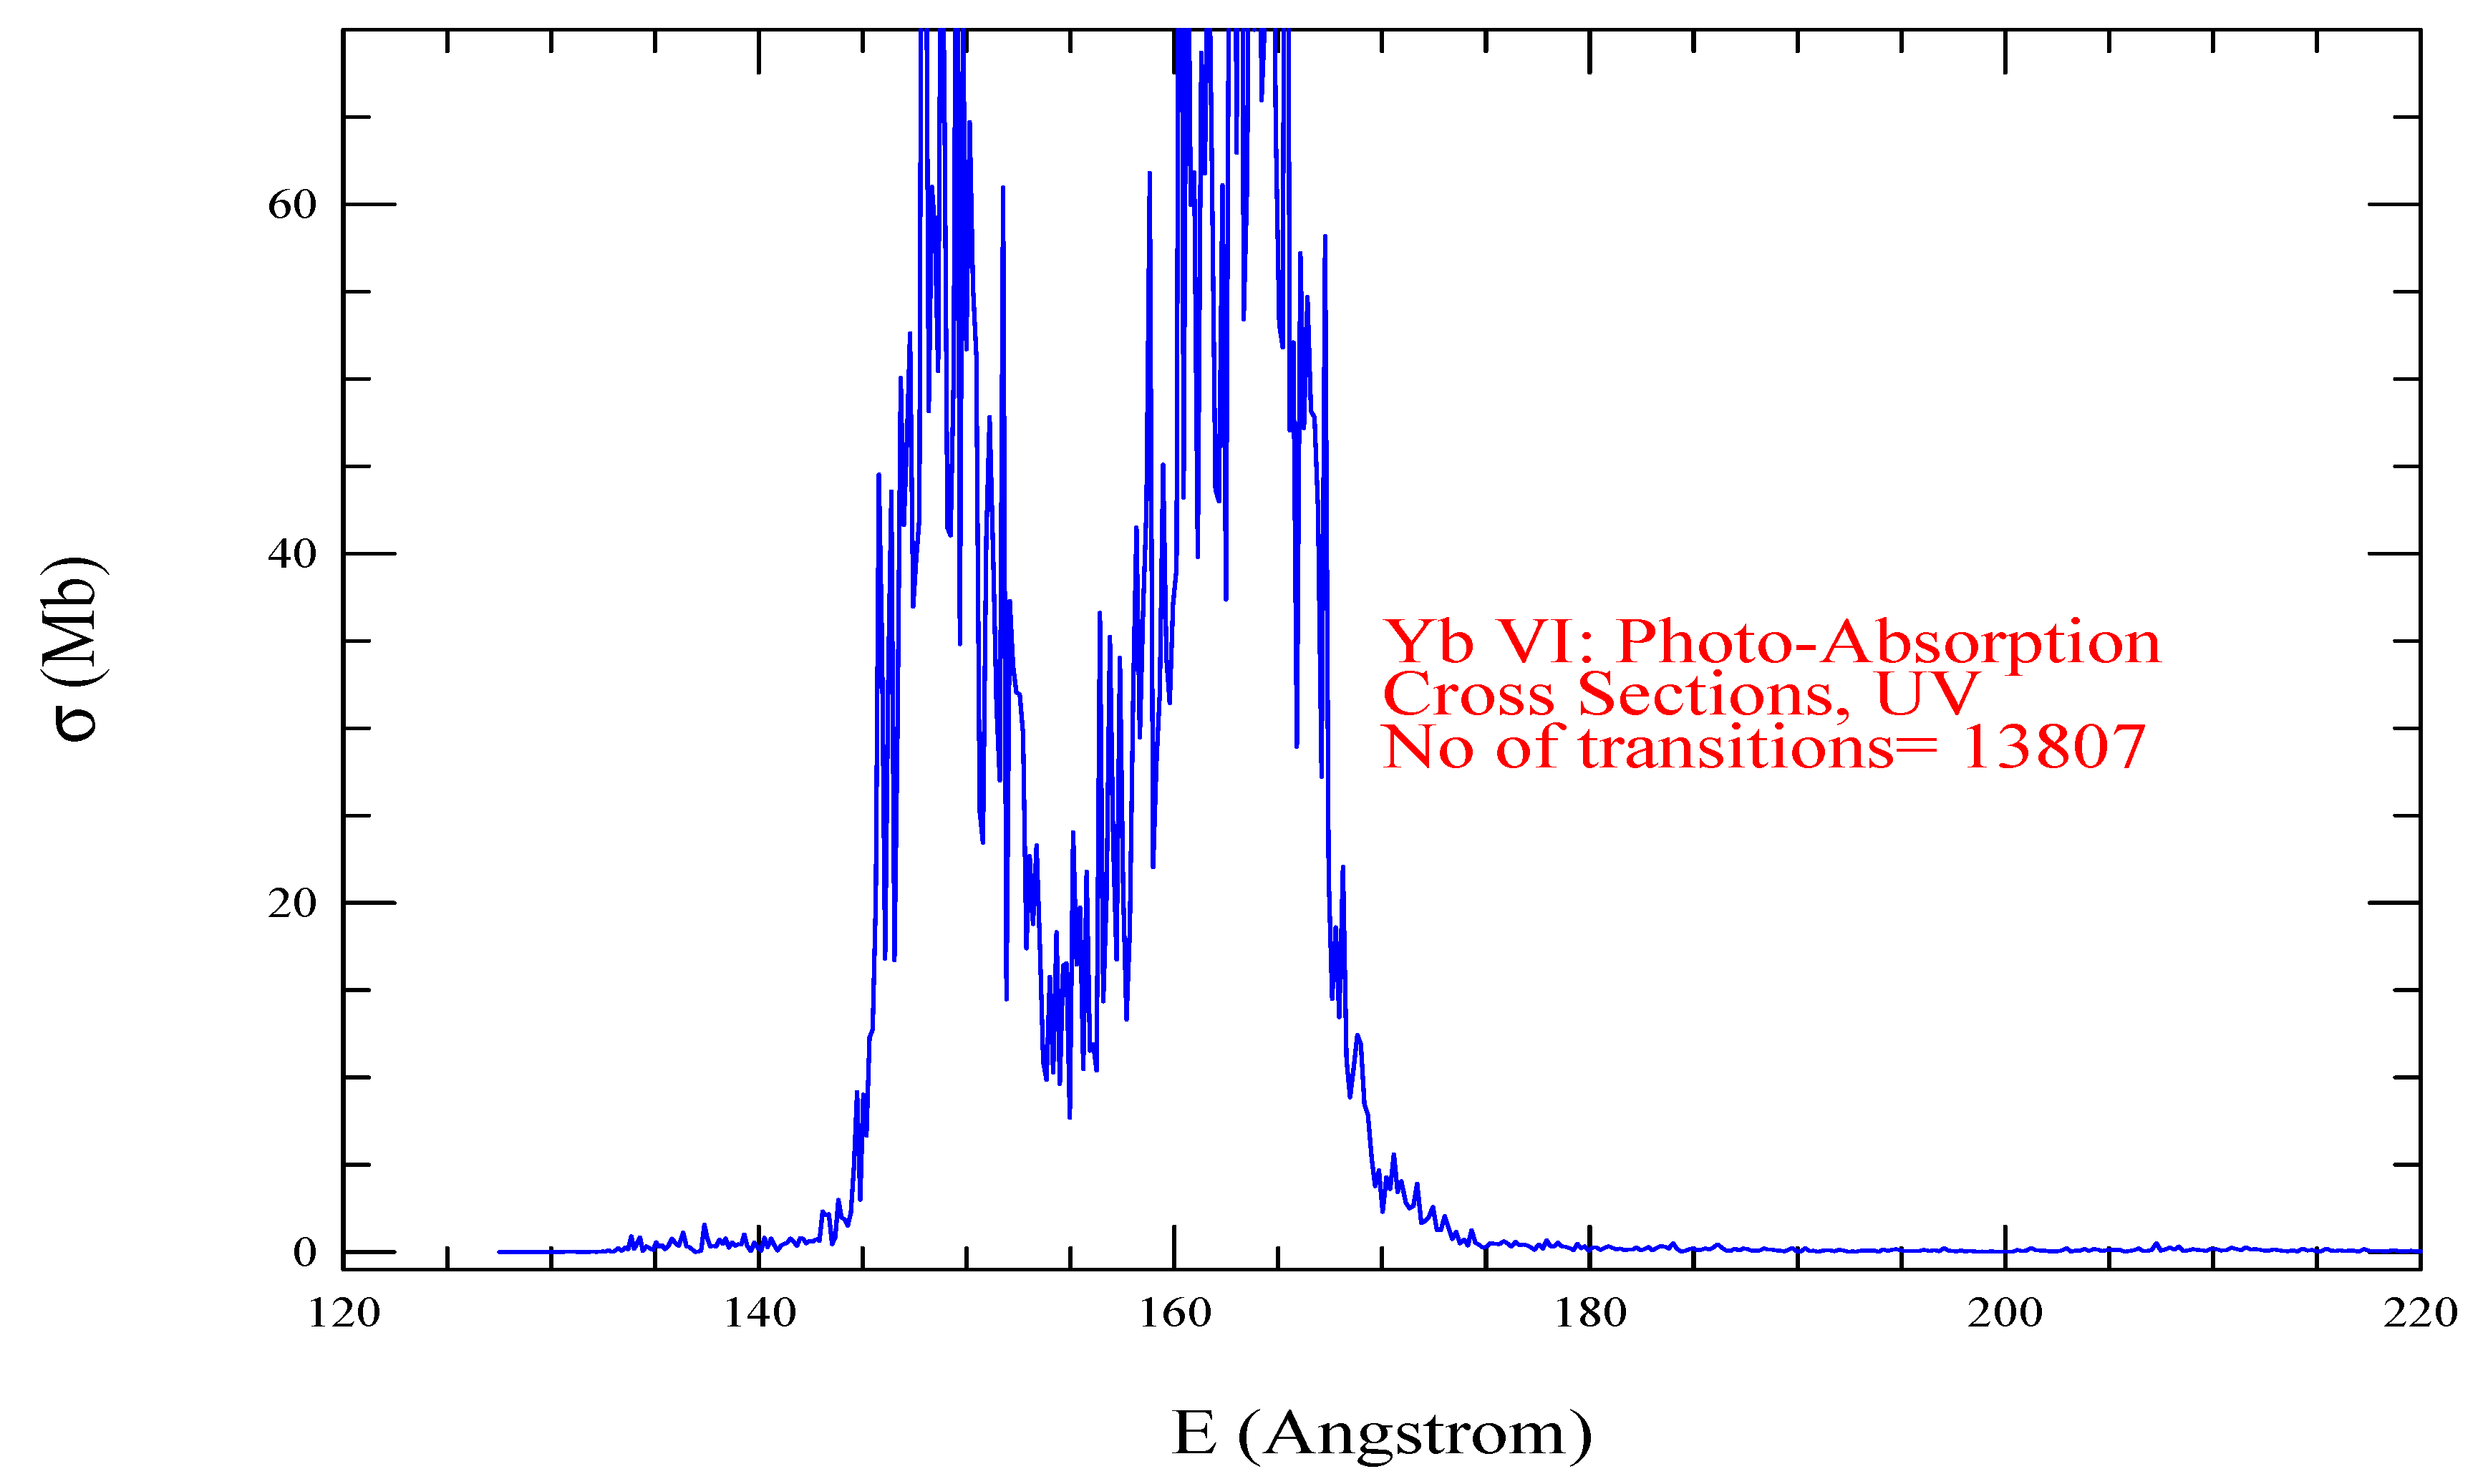
Photoabsorption spectrum ( σ P I ) of the Yb VI, presented in Figure 19. shows visible feature in the EUV region. It has two absorption bumps next to each other in the energy range of 145 - 170 Å. The number of transitions included is 13807.
Lu I - VII:
Optimization of wavefunctions for ordering for Lu I energies was sensitive to excited configuration 5 d 2 6 s whose levels would raise the ground level to a higher excited state. Energy levels of this configuration is not reported in the NIST table. The ground level which has even parity needed odd parity levels for the dipole allowed transitions. Hence we focused on optimization of the energy levels of odd parity which means optimizing the wavefunctions to achieve lower values for the levels.
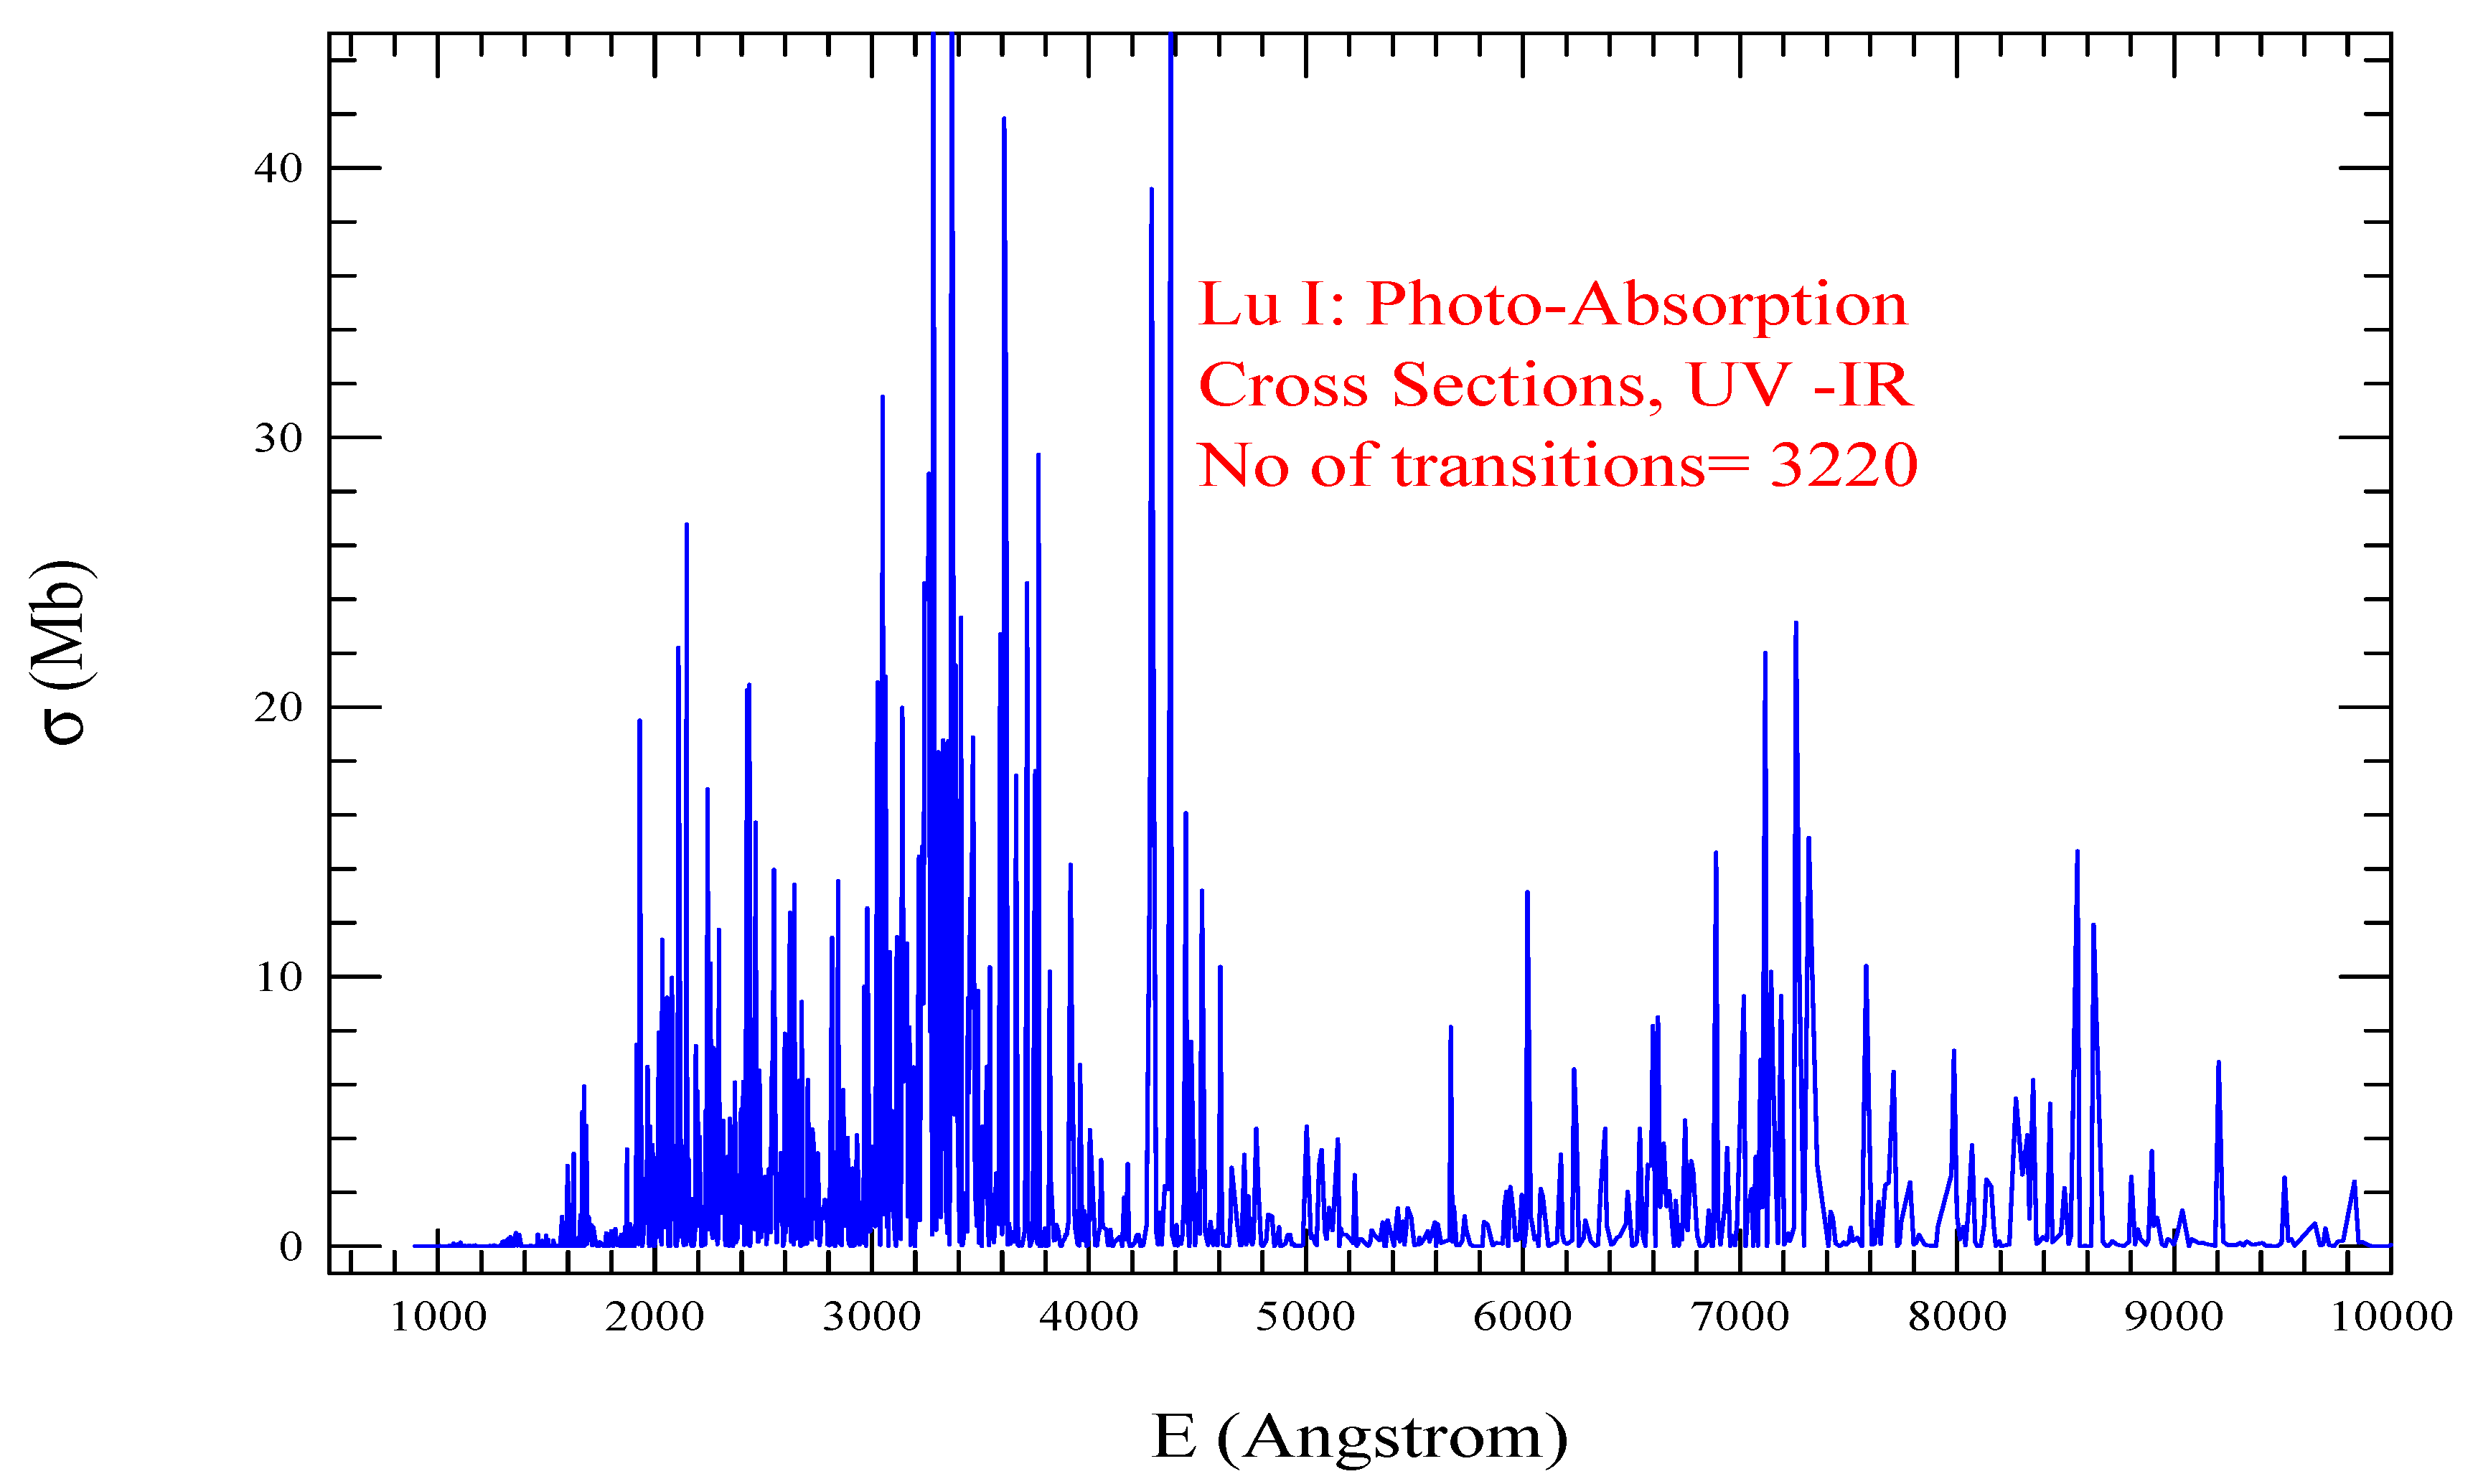
Photoabsorption spectrum ( σ P I ) of the Lu I, presented in Figure 20. shows prominent lines in the energy region from UV to IR. It has a few broader regions of strong photo-absorption line in the region from UV to partial optical. The number of transitions included is 3220.
The energies of Lu II show good agreement with the measured values.
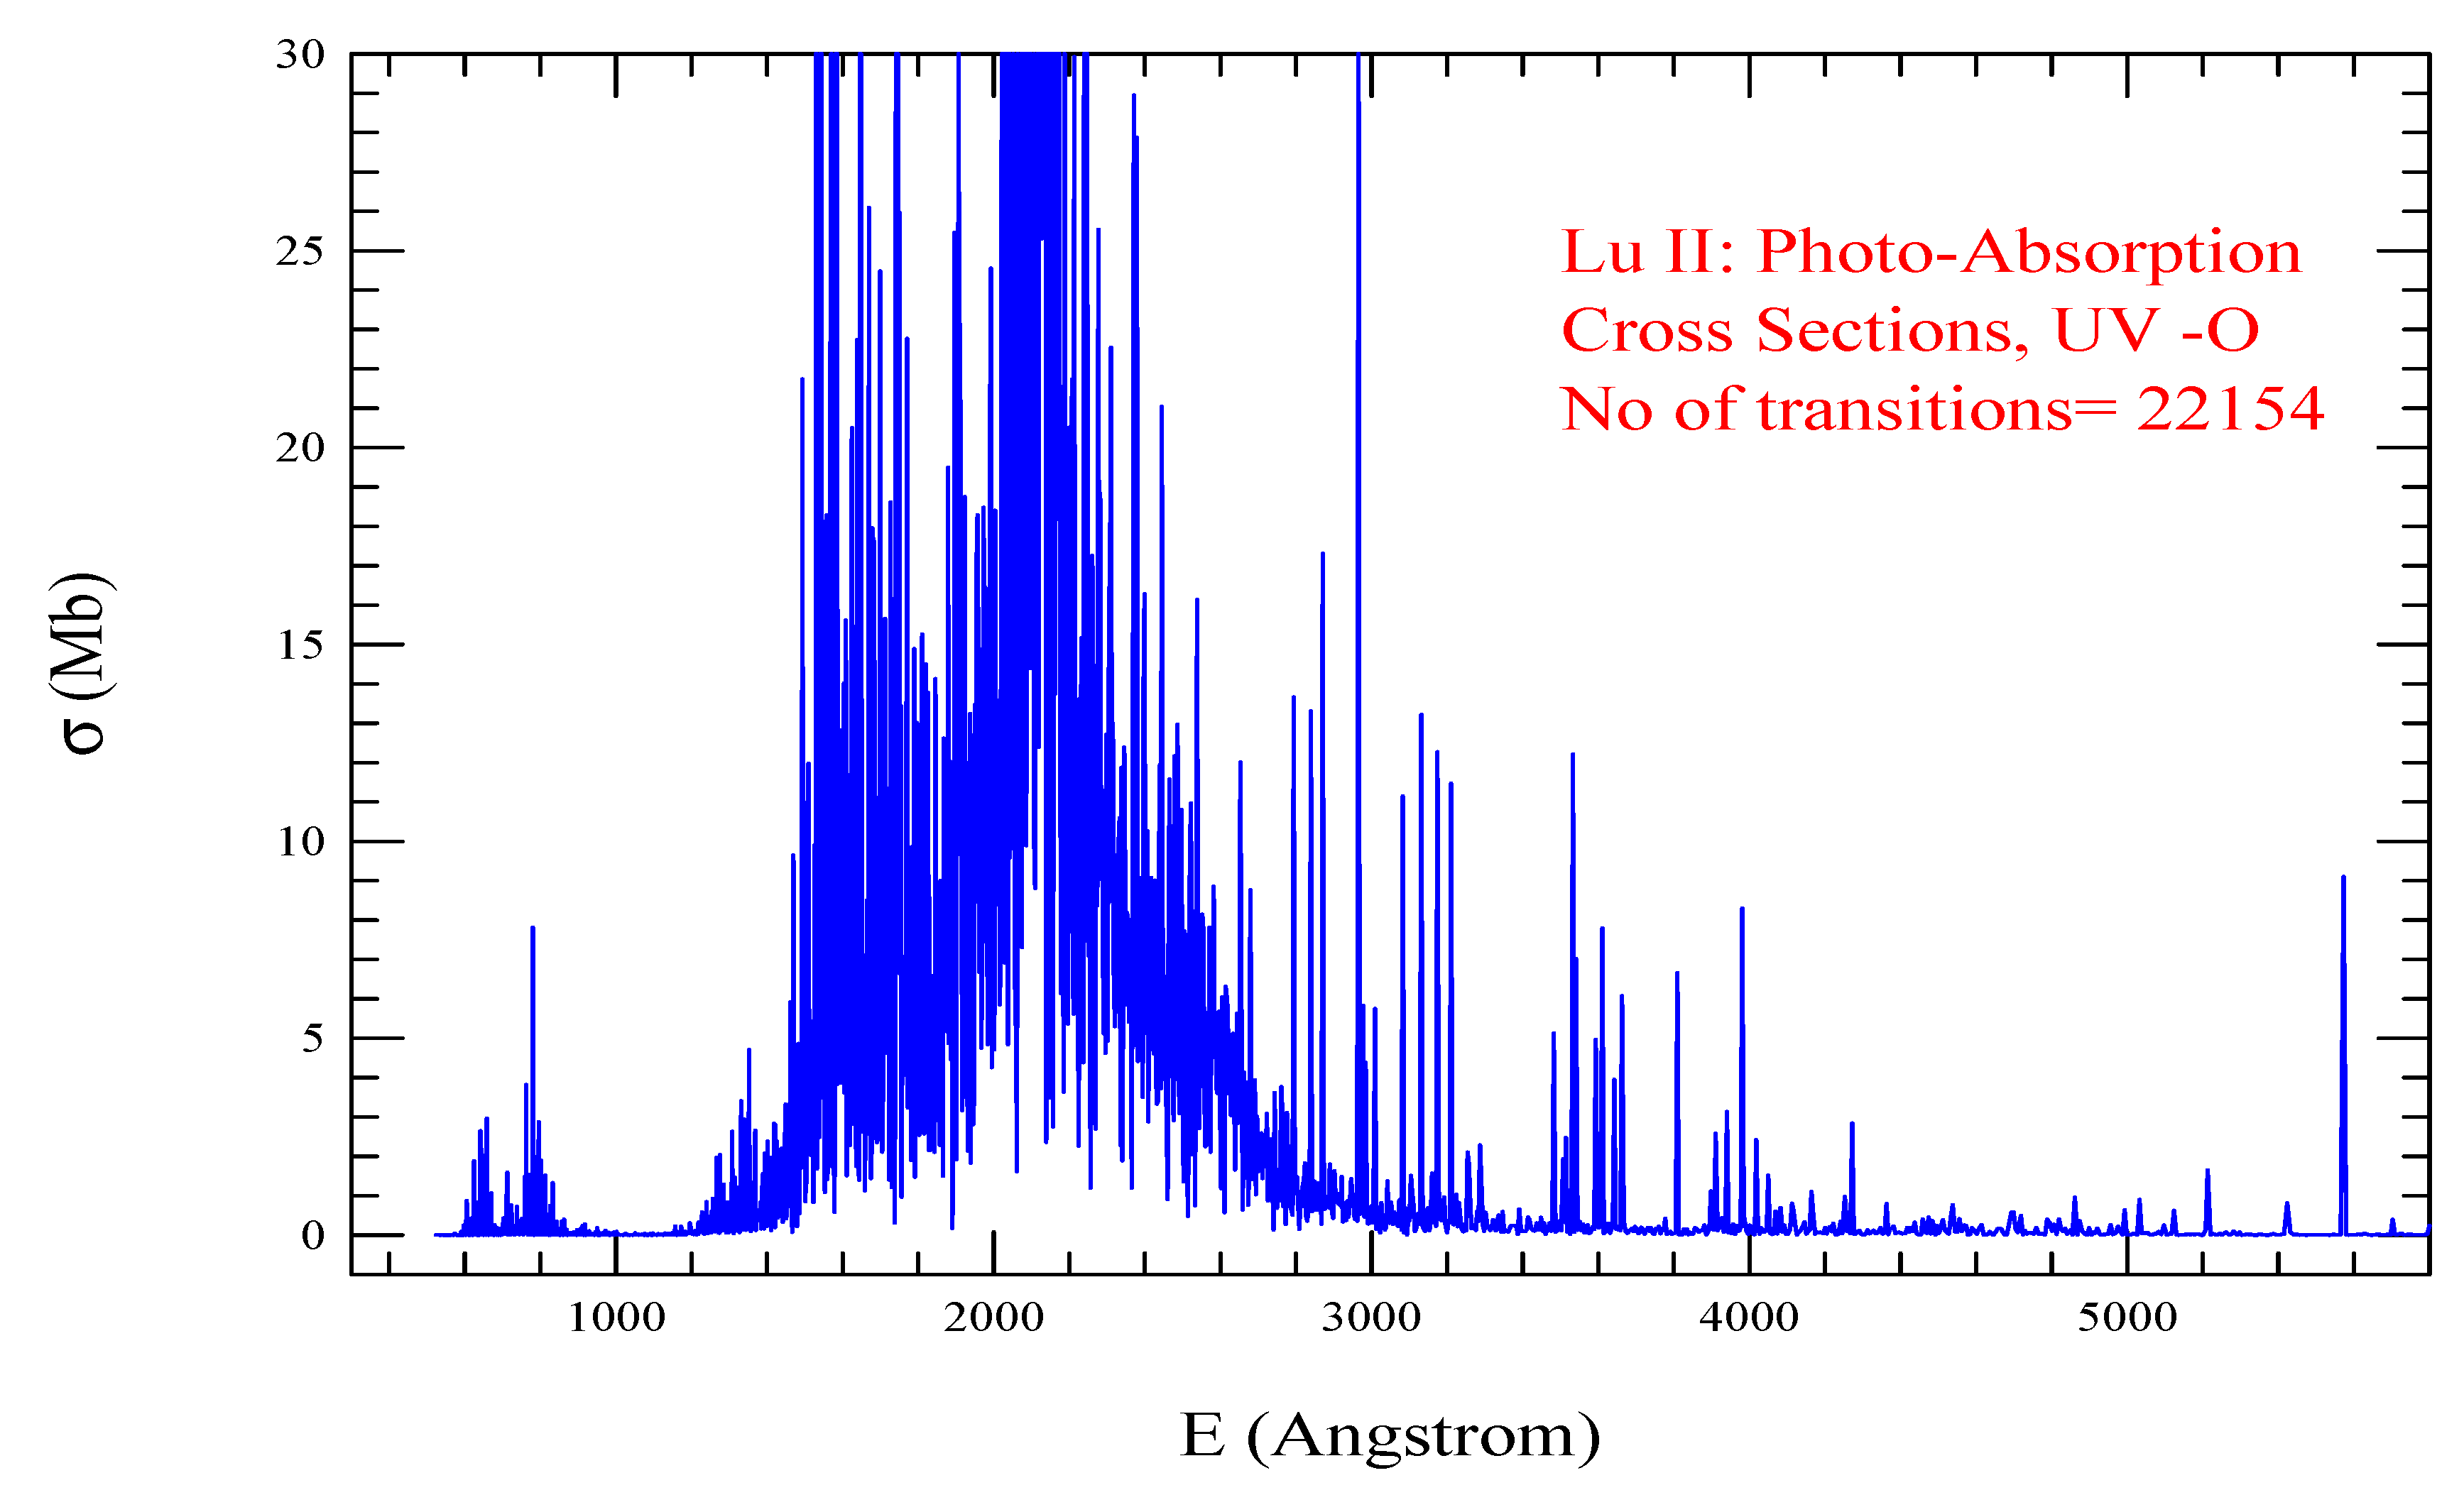
Photoabsorption spectrum ( σ P I ) of the Lu II, presented in Figure 21. shows prominent lines in the energy region from UV to O. It has a wide broad region of strong photo-absorption lines in UV ranging from 1400 to 3300 Å.. The number of transitions included is 22142
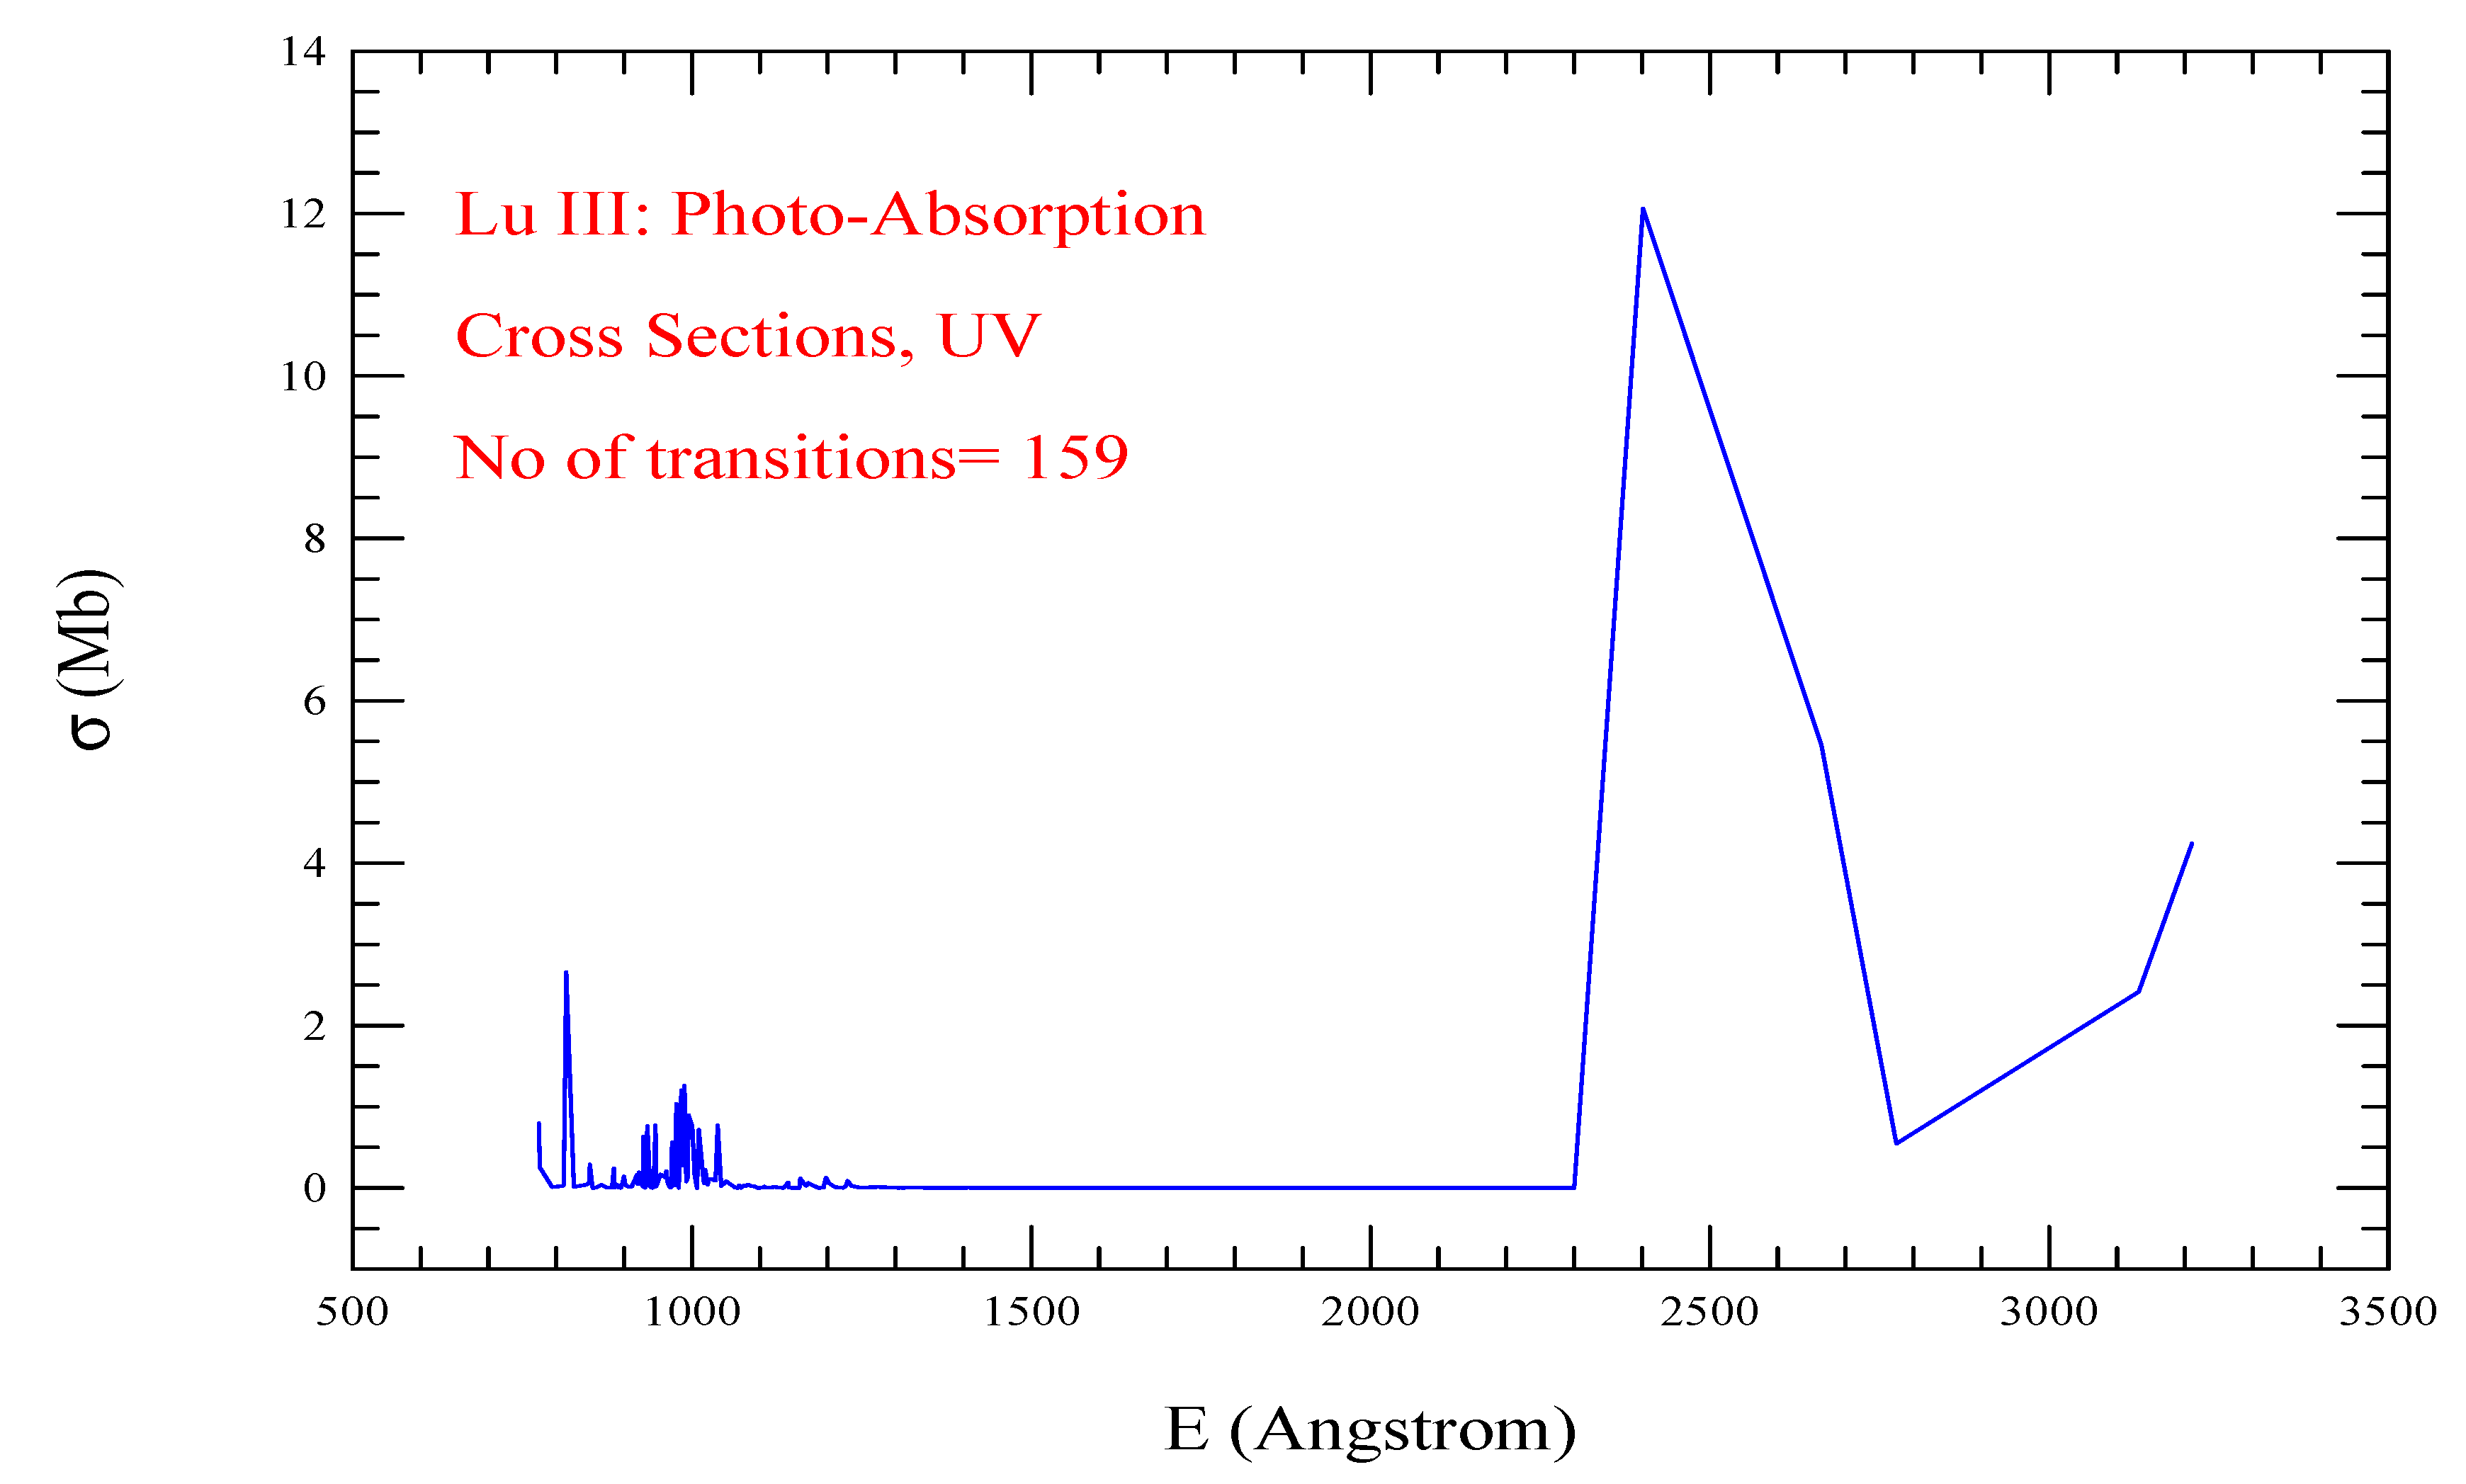
For Lu III, a very limited number of transitions from the ground level 4 f 14 6 s ( 2 S 1 / 2 ) is found as most of the excited levels are outside the dipole allowed transitions. We have only 159 transitions among dipole allowed transitions to be included in the spectrum. Although 4 f 13 5 d 2 forms large number of energy levels theoretically, none of them are listed in NIST[13] table. A few other configurations seem to form bound levels, but not observed.
Photoabsorption cross sections ( σ P I ) of the Lu III, presented in Figure 22, shows only a few strong lines. The number of transitions included is 159.
For Lu IV, an overall good agreement is found between the calculated and measured values. Levels have been identified following SS as NIST does not provide the full spectroscopic designation of any excited level. Configuration 4 f 12 5 d 2 produced many bound levels which are not listed in the NIST table.
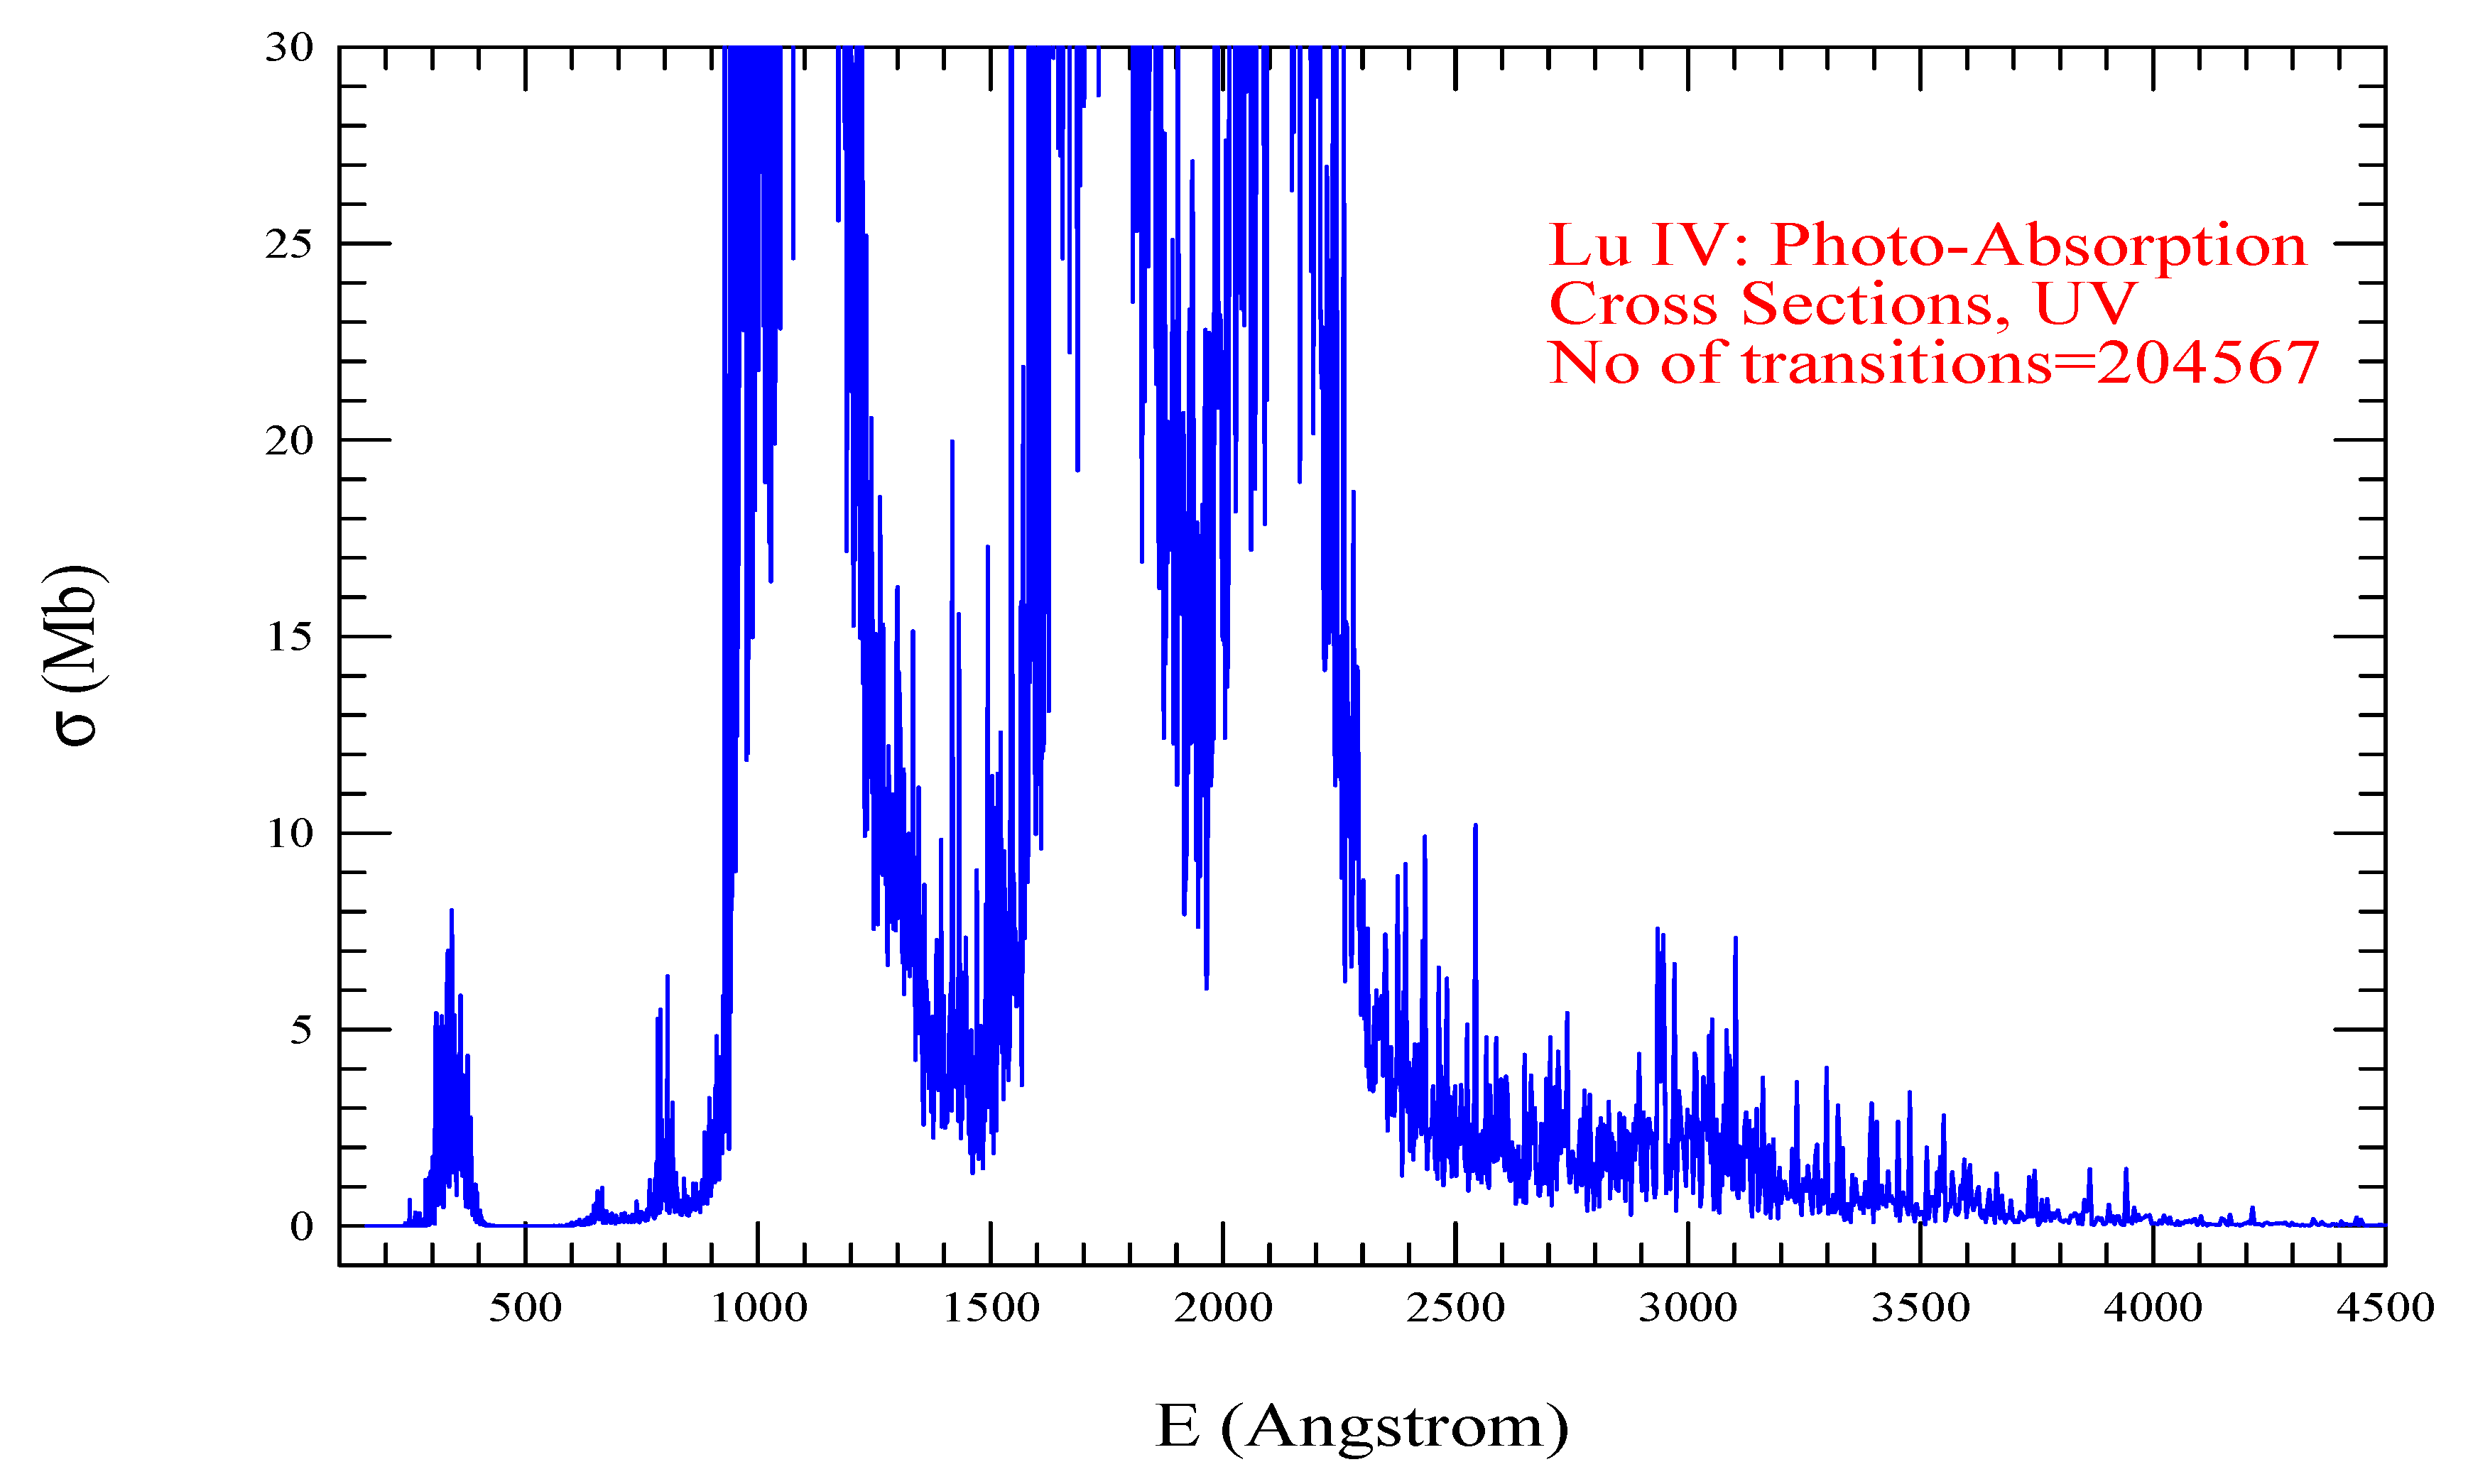
Photoabsorption cross sections ( σ P I ) of the Lu IV, presented in Figure 23, shows prominence of lines in UV region. There are multiple broad absorption bumps in the spectrum. The number of transitions included is 204567.
For Lu V, calculated values of the ground level and lower energies agree with the measured values listed at NIST [13]. The full spectroscopic designation of any excited level of Lu V is not available at the NIST table. Leading percentage values at NIST table indicate highly mixed states. Hence, the comparison in Table 4 used identifications of levels for the L S term and J-vales as obtained in the present results.
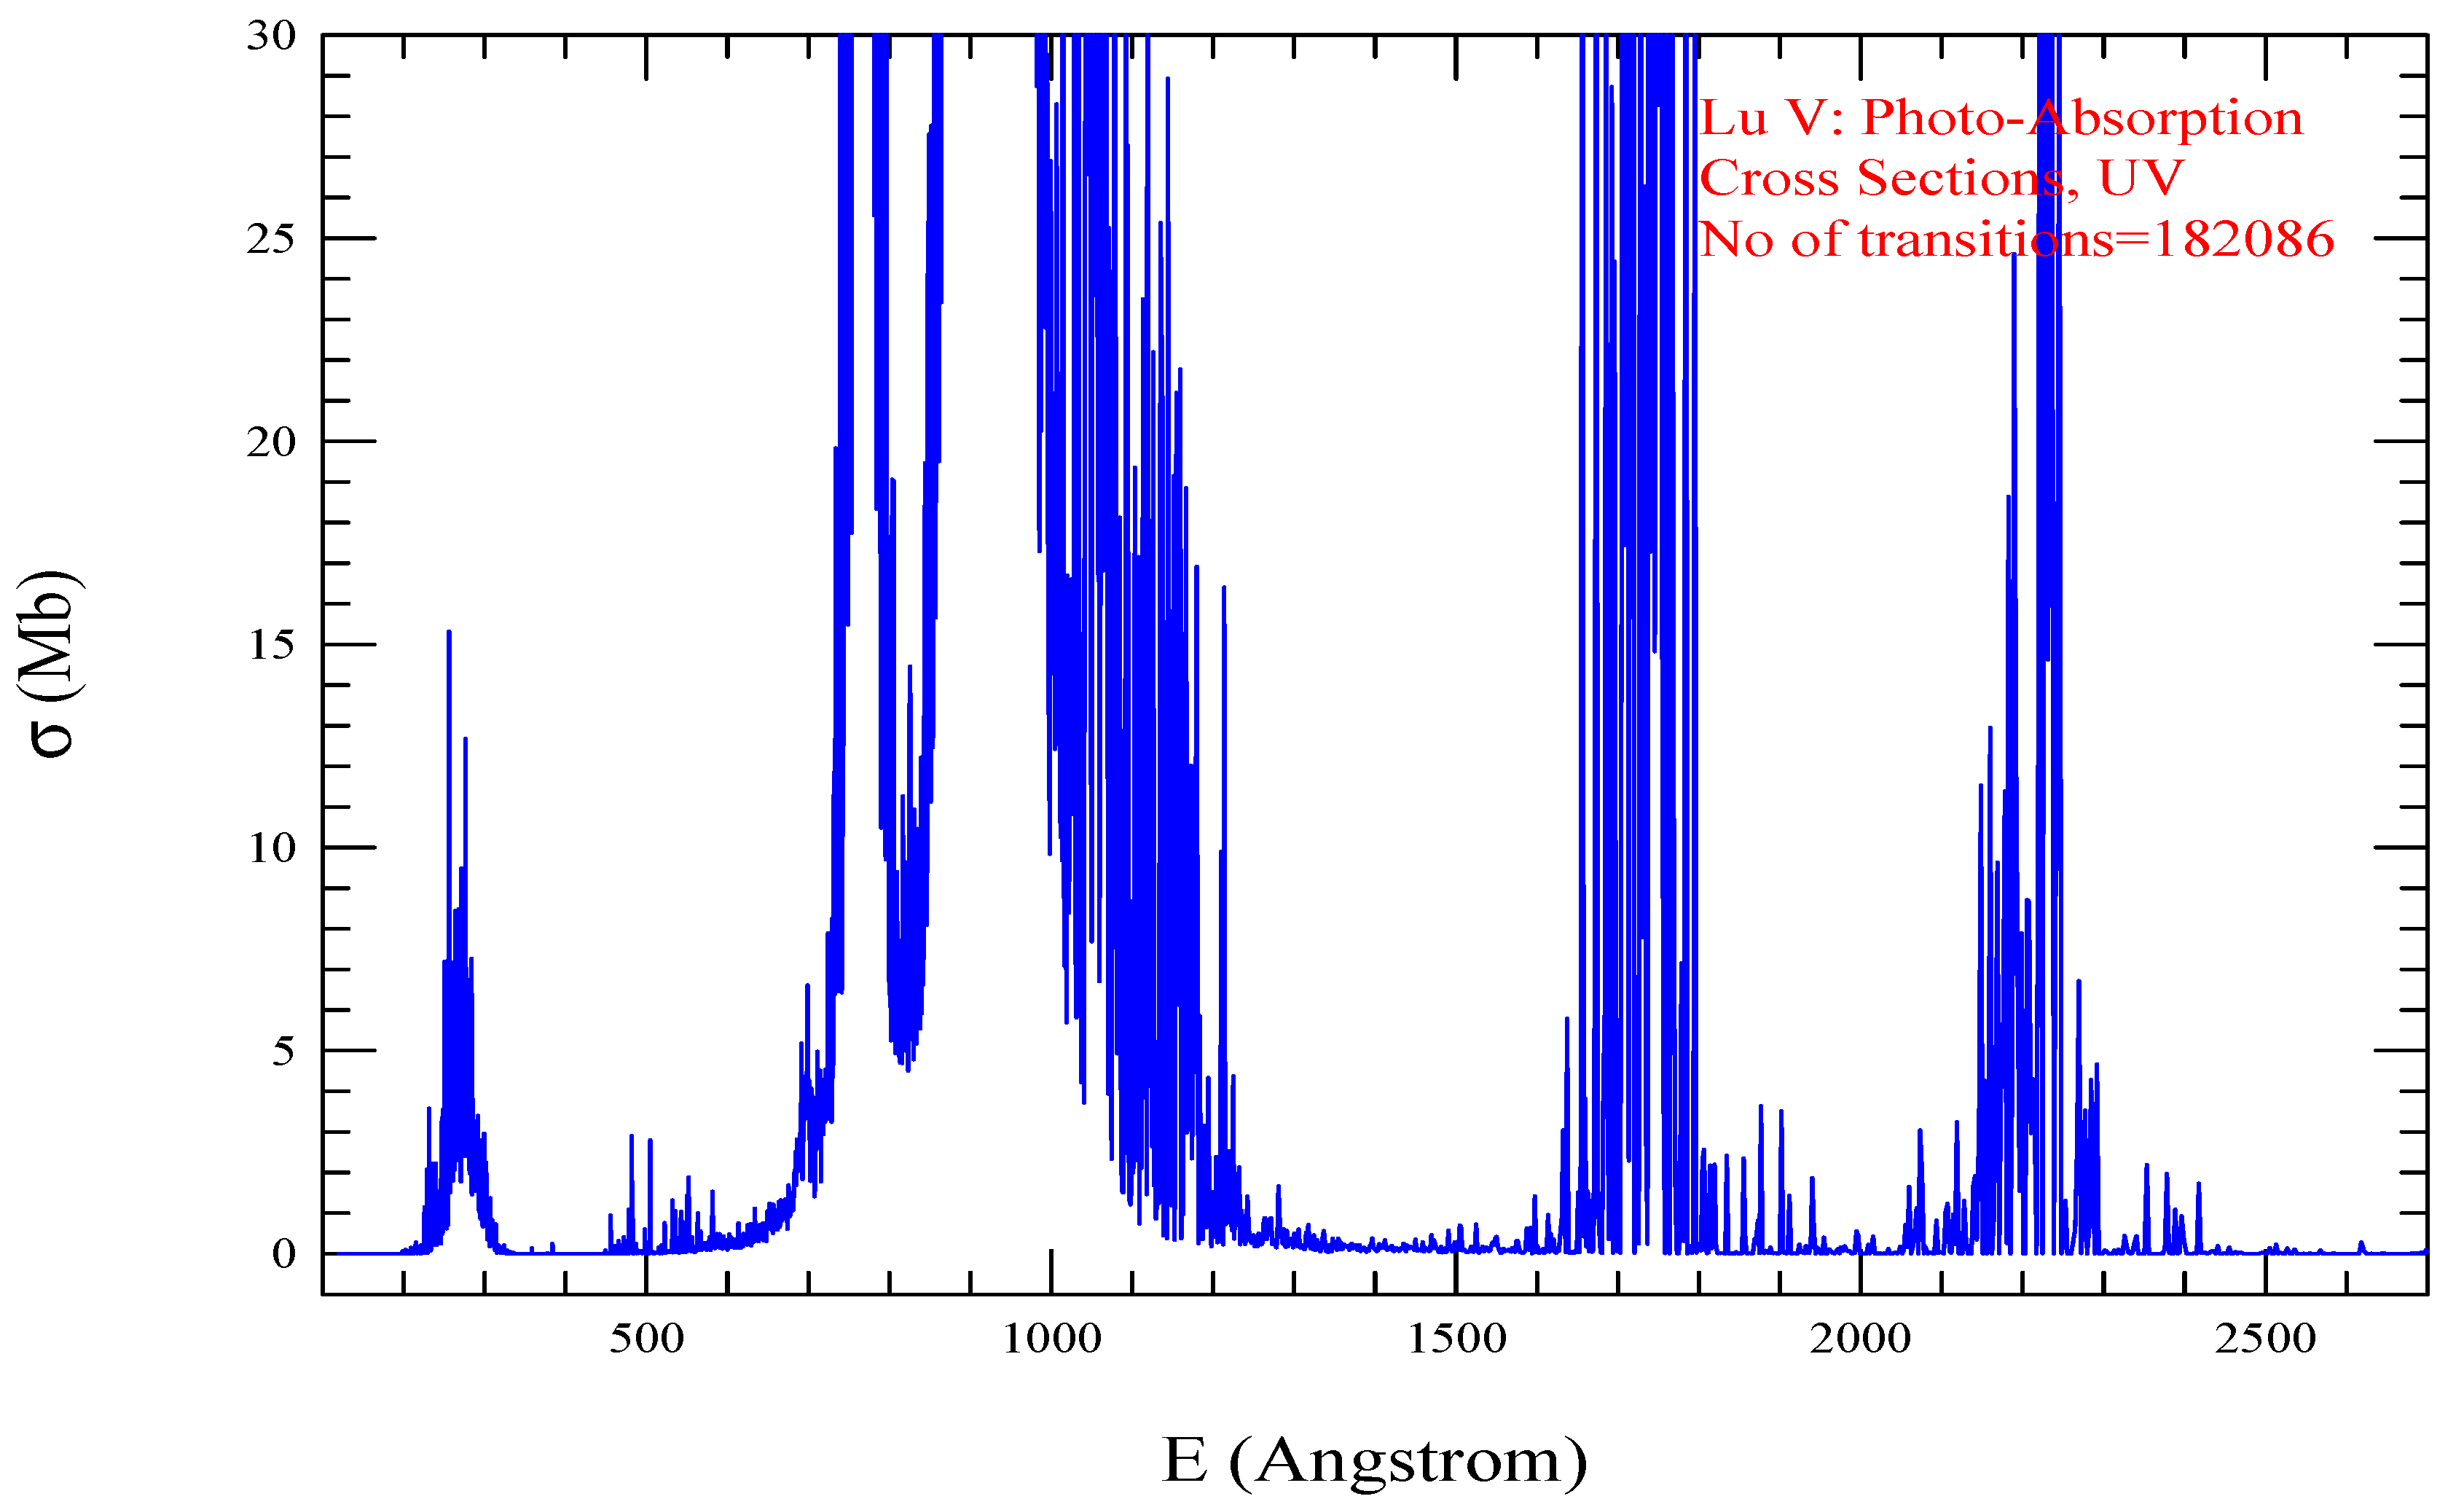
Photoabsorption cross sections ( σ P I ) of the Lu V, presented in Figure 24, shows prominence of lines in UV region. There are multiple broad absorption bumps in the spectrum. The broadest one is in the EUV 700 - 1200 Åwith a dip around 800Å. The number of transitions included is 182086.
For Lu VI, there is no fine structure levels of Lu VI in NIST table except the ground configuration. Hence, there is no guidance available for the energy values. We carried out the optimization of levels such that the absolute values are lowest while maintaining a balance of overall low values for all levels.
Photoabsorption cross sections ( σ P I ) of the Lu VI, presented in Figure 25, shows prominence of lines from EUV to near O region. The spectrum shows 3 energy regions of very strong lines in the EUV, and a relatively broad feature from about 1700 - 3500 Å. The number of transitions included is 59028.
There are no fine structure energy levels for Lu VII in the NIST table except for the ground level. Similar to Lu VI, optimization of energies was carried out by lowering the values.
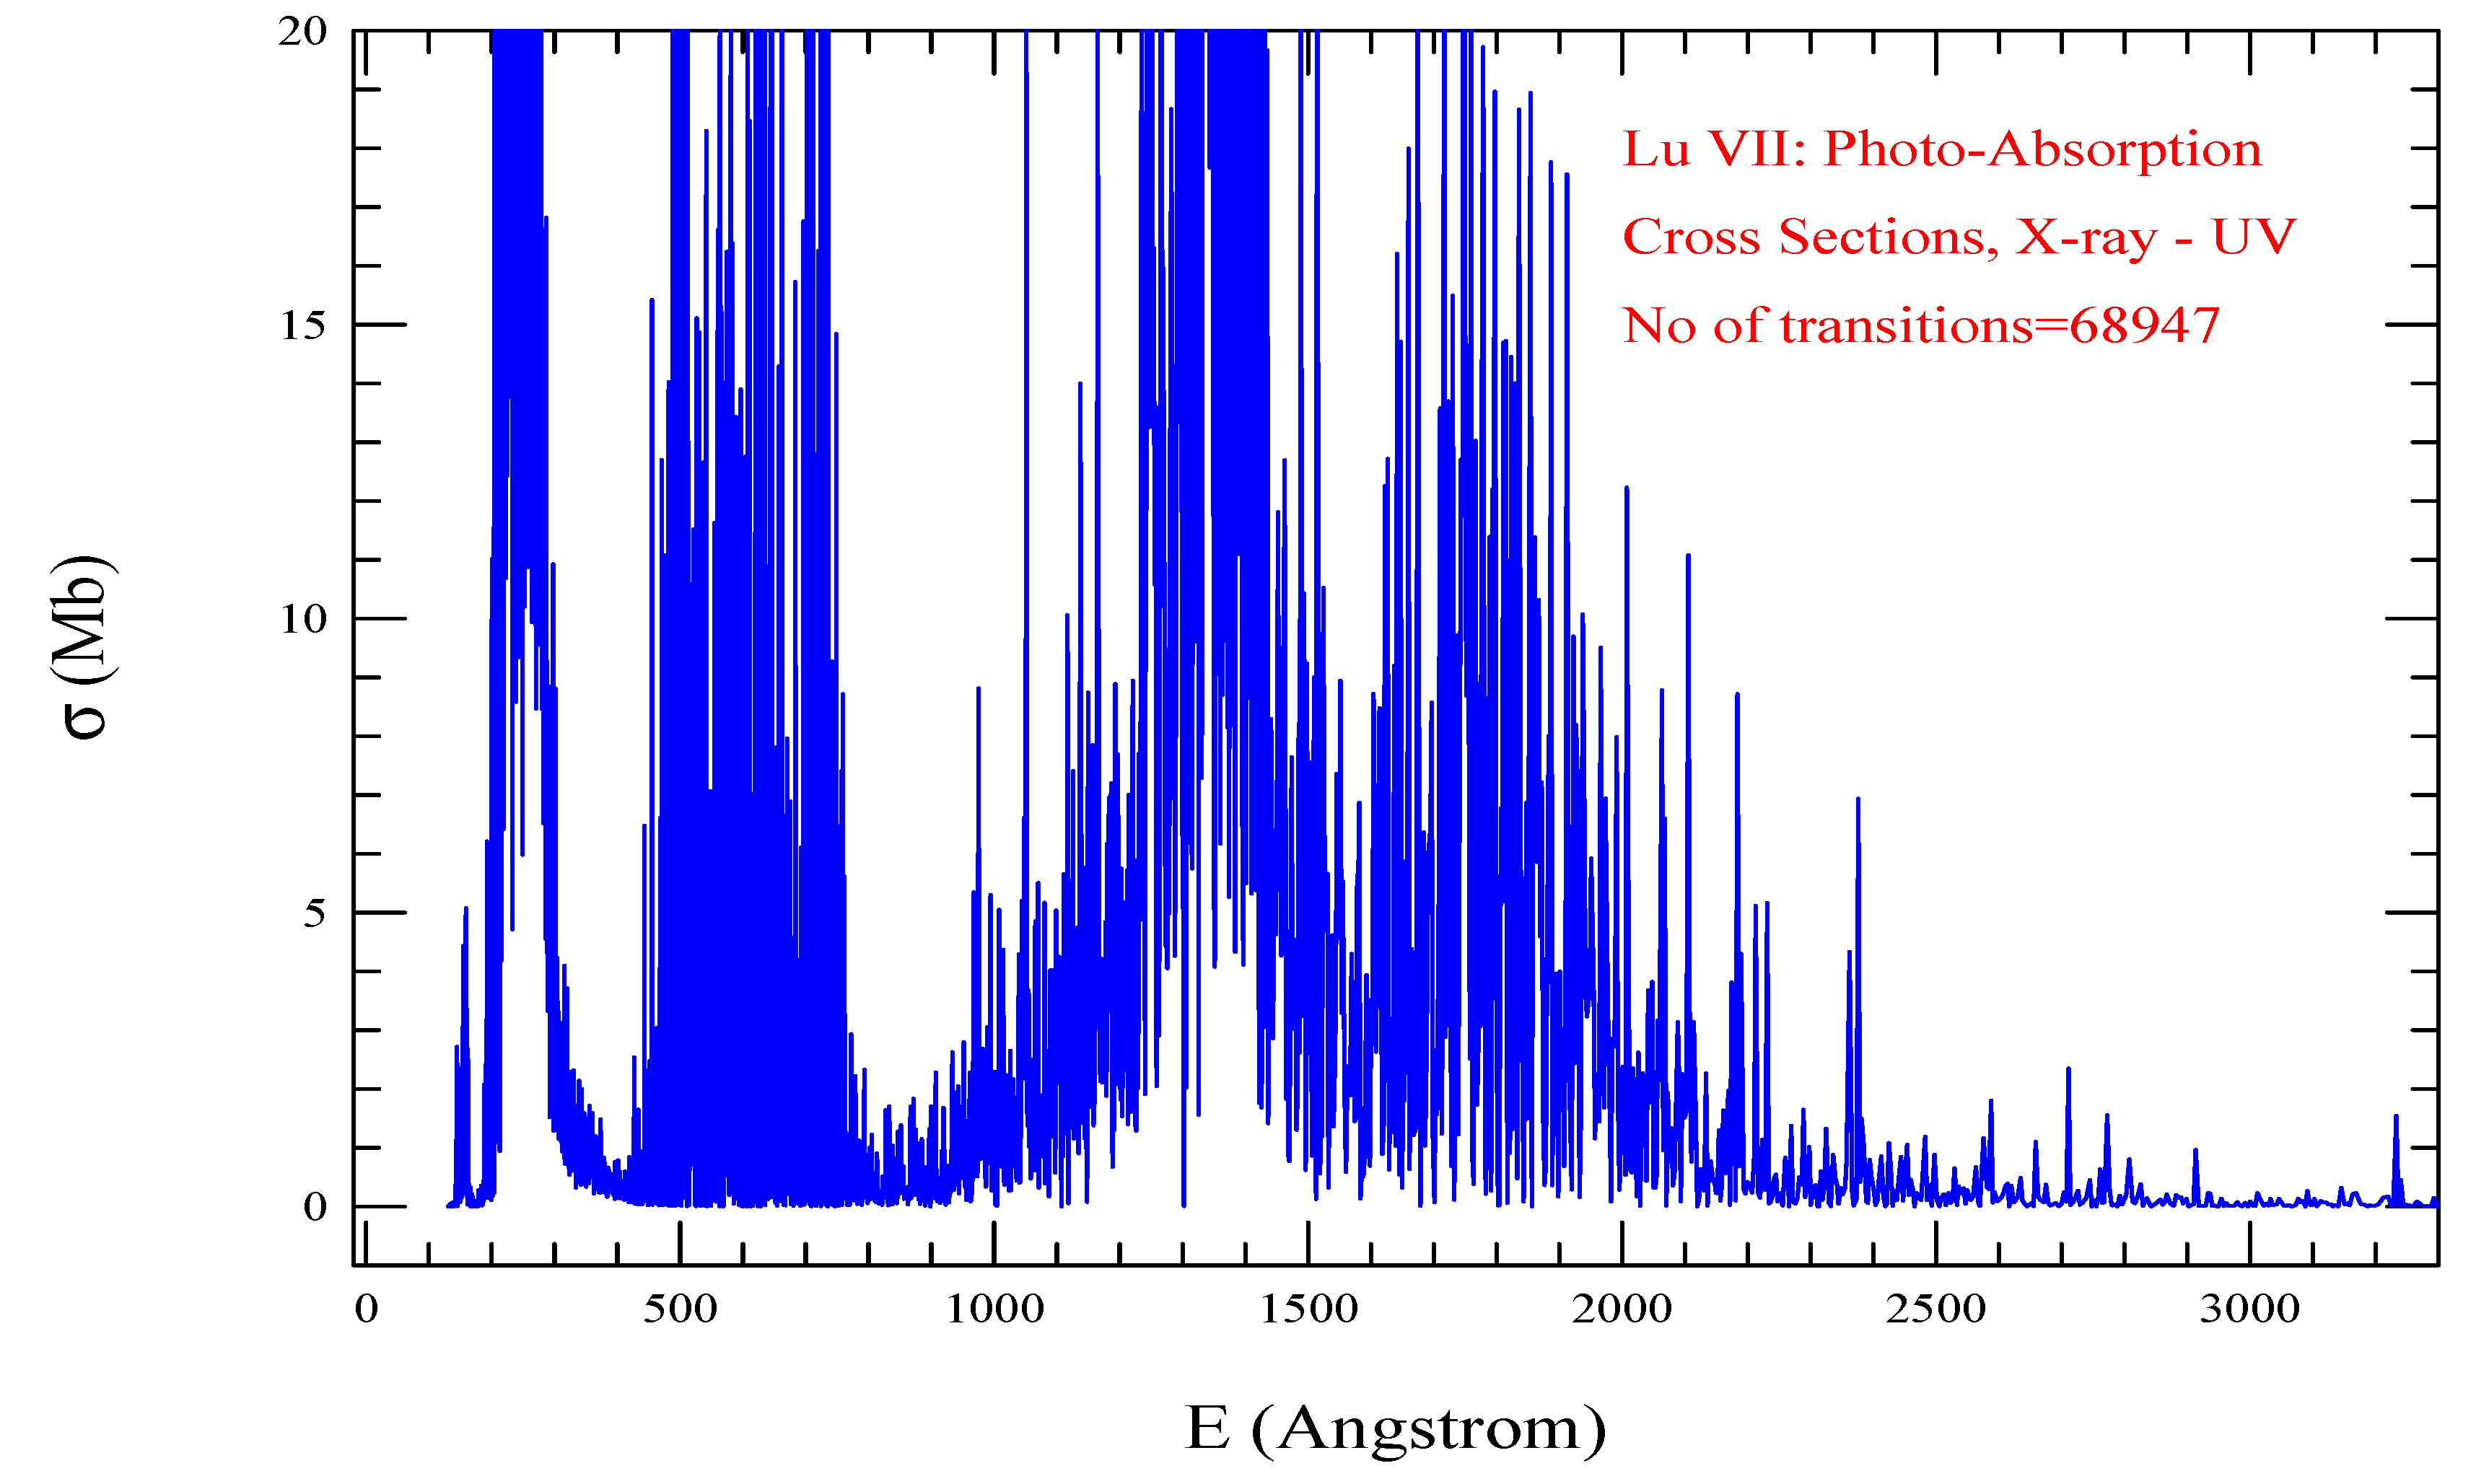
Photoabsorption cross sections ( σ P I ) of the Lu VII, presented in Figure 26, shows prominence of lines from EUV to UV. The spectrum shows multiple broad absorption energy bumps in the energy region. Two absorption bumps are next to each covering a energy width from about 1000 to 2200 Å. The number of transitions included is 68947.
Figure 2. Photoabsorption cross sections ( σ P I ) of Ho I demonstrating broad spectral feature in the UV wavelength region
Preprints 91246 g002
Figure 3. Photoabsorption cross sections ( σ P I ) of the Ho II demonstrating broad spectral feature in the UV wavelength region.
Preprints 91246 g003
Figure 4. Photoabsorption cross sections ( σ P I ) of the Ho III demonstrating a very broad spectral feature in the O - IR wavelength region, particularly ranging from 4000 to 15500 Å.
Preprints 91246 g004
Figure 5. Photoabsorption cross sections ( σ P I ) of the Er I demonstrating one broad, 1000 - 3500 Å, and one very broad, 4000 - 13200 Å, spectral features in the O - IR wavelength region.
Preprints 91246 g005
Figure 6. Photoabsorption cross sections ( σ P I ) of the Er II demonstrating two broad spectral features in the UV (2200 Å) - near optical (4000 Å) region.
Preprints 91246 g006
Figure 7. Photoabsorption cross sections ( σ P I ) of the Er III demonstrating three regions of high peak strong lines from x-ray to UV regions, the first one is in the narrow x-ray region (around 100 Å), one relatively narrow region in the EUV (100-300 Å) and a relatively large broad spectral region in the UV (900 - 1700 Å).
Preprints 91246 g007
Figure 8. Photoabsorption cross sections ( σ P I ) of the Er IV demonstrating multiple regions of high peak strong lines in the UV region.
Preprints 91246 g008
Figure 9. Photoabsorption cross sections ( σ P I ) of the Tm I demonstrating three regions of high peak strong lines from x-ray to UV regions. Beyond 3400 Å, the noticeable lines become more sparse.
Preprints 91246 g009
Figure 10. Photoabsorption cross sections ( σ P I ) of the Tm II demonstrating visible presence in the UV and IR regions, almost no strong lines in the optical (400 - 7000 Å) region. Compared to other lanthanides discussed here this ion has less number of transitions and a relatively wider broad feature exits in the IR region.
Preprints 91246 g010
Figure 11. Photoabsorption cross sections ( σ P I ) of the Tm III demonstrating multiple broad structures from EUV - O wavelength range, widest one being in the range of 1200 - 2500 Å.
Preprints 91246 g011
Figure 12. Photoabsorption cross sections ( σ P I ) of the Tm IV. There are four distinct broad regions, with strong lines, in the wavelength regions from EUV to covering up to UV.
Preprints 91246 g012
Figure 13. Photoabsorption cross sections ( σ P I ) of the Tm V in the energy range of EUV to UV. It demonstrates multiple broad structures from EUV - UV wavelength range, widest one being in the range of 1400 - 1900 Åwith a dip around 1650 Å.
Preprints 91246 g013
Figure 14. Photoabsorption cross sections ( σ P I ) of the Yb I in the energy range of UV to O. A broad feature appears in wavelength range of about 2600 to 3500 Å.
Preprints 91246 g014
Figure 15. Photoabsorption cross sections ( σ P I ) of the Yb II with dominating strong lines in the energy range of EUV - UV. The spectrum shows two broad features, one in the wavelength range of 1500 - 2100 Åand other one in 2500 - 3100 Å.
Preprints 91246 g015
Figure 16. Photoabsorption cross sections ( σ P I ) of the Yb III in the energy range of E to EUV to O. The spectrum has multiple broad features dominated by strong lines in the energy range of EUV - O. The strongest absorption bump is in the wavelength range of 2200 - 3000 Å.
Preprints 91246 g016
Figure 17. Photoabsorption cross sections ( σ P I ) of the Yb IV in the energy range of E to EUV to UV.
Preprints 91246 g017
Figure 18. Photoabsorption cross sections ( σ P I ) of the Yb V in the energy range of E to EUV to UV. It has two broad features dominated by strong lines, one in the EUV region followed by a lower peak structure and the broader absorption bump in the wavelength region of 1600 to 2500 Å.
Preprints 91246 g018
Figure 19. Photoabsorption cross sections ( σ P I ) of the Yb VI in the energy range of UV. It has two absorption bumps next to each other in the energy range of 145 - 170 Å
Preprints 91246 g019
Figure 20. Photoabsorption cross sections ( σ P I ) of the Lu I in the energy range of UV - IR.
Preprints 91246 g020
Figure 21. Photoabsorption cross sections ( σ P I ) of the Lu II in the energy range of UV - O. Prominent lines are seen in the energy region from UV to O. The spectrum has a wide broad region of strong photo-absorption lines in UV ranging from 1400 to 3300 Å..
Preprints 91246 g021
Figure 22. Photoabsorption cross sections ( σ P I ) of the Lu III in the energy range of UV. The spectrum has only a few strong lines.
Preprints 91246 g022
Figure 23. Photoabsorption cross sections ( σ P I ) of the Lu IV in the energy range of UV.
Preprints 91246 g023
Figure 24. Photoabsorption cross sections ( σ P I ) of the Lu V with prominent lines in the UV energy region. The spectrum shows presence of multiple broad absorption bumps. The broadest one is in the EUV 700 - 1200 Åwith a dip around 800Å.
Preprints 91246 g024
Figure 25. Photoabsorption cross sections ( σ P I ) of the Lu VI showing presence of strong lines in the energy region from EUV to near O. The spectrum shows 3 energy regions of very strong lines in the EUV, and a relatively broad feature from about 1700 - 3500 Å.
Preprints 91246 g025
Figure 26. Photoabsorption cross sections ( σ P I ) of the Lu VII with prominent absorption lines in the energy range from EUV - UV. presented in Figure 26, shows prominence of lines from EUV to UV. The spectrum shows multiple broad absorption energy bumps in the energy region. Two absorption bumps are next to each covering a energy width from about 1000 to 2200 Å.
Preprints 91246 g026
We make comparison of a number of A-values of the present lanthanide ions in Table 5 with the compiled values available at NIST [13]. Limited number of A-values of some ions of Ho, Er, Tm, Yb, and Lu are available at the NIST [13] compilation table. The NIST references for the A-values of lanthanides are Meggers et al [15], Morton [16], Komarovski [17], Wickliffe and Lawler [18], Sugar et al [19], Pen kin and Komarovski [20], Fedchak et al [21]. The comparisons show variable agreement between theory and computation. The order of magnitudes agree, the absolute values agree to different extents. Typically, A-values calculated from two different approaches or programs show general agreement on the transitions, not for all transitions. Hence, in the present case the overall agreement should be good given the sensitivity of electron-electron interactions and impact of slight change in wavefunction in lanthanides.
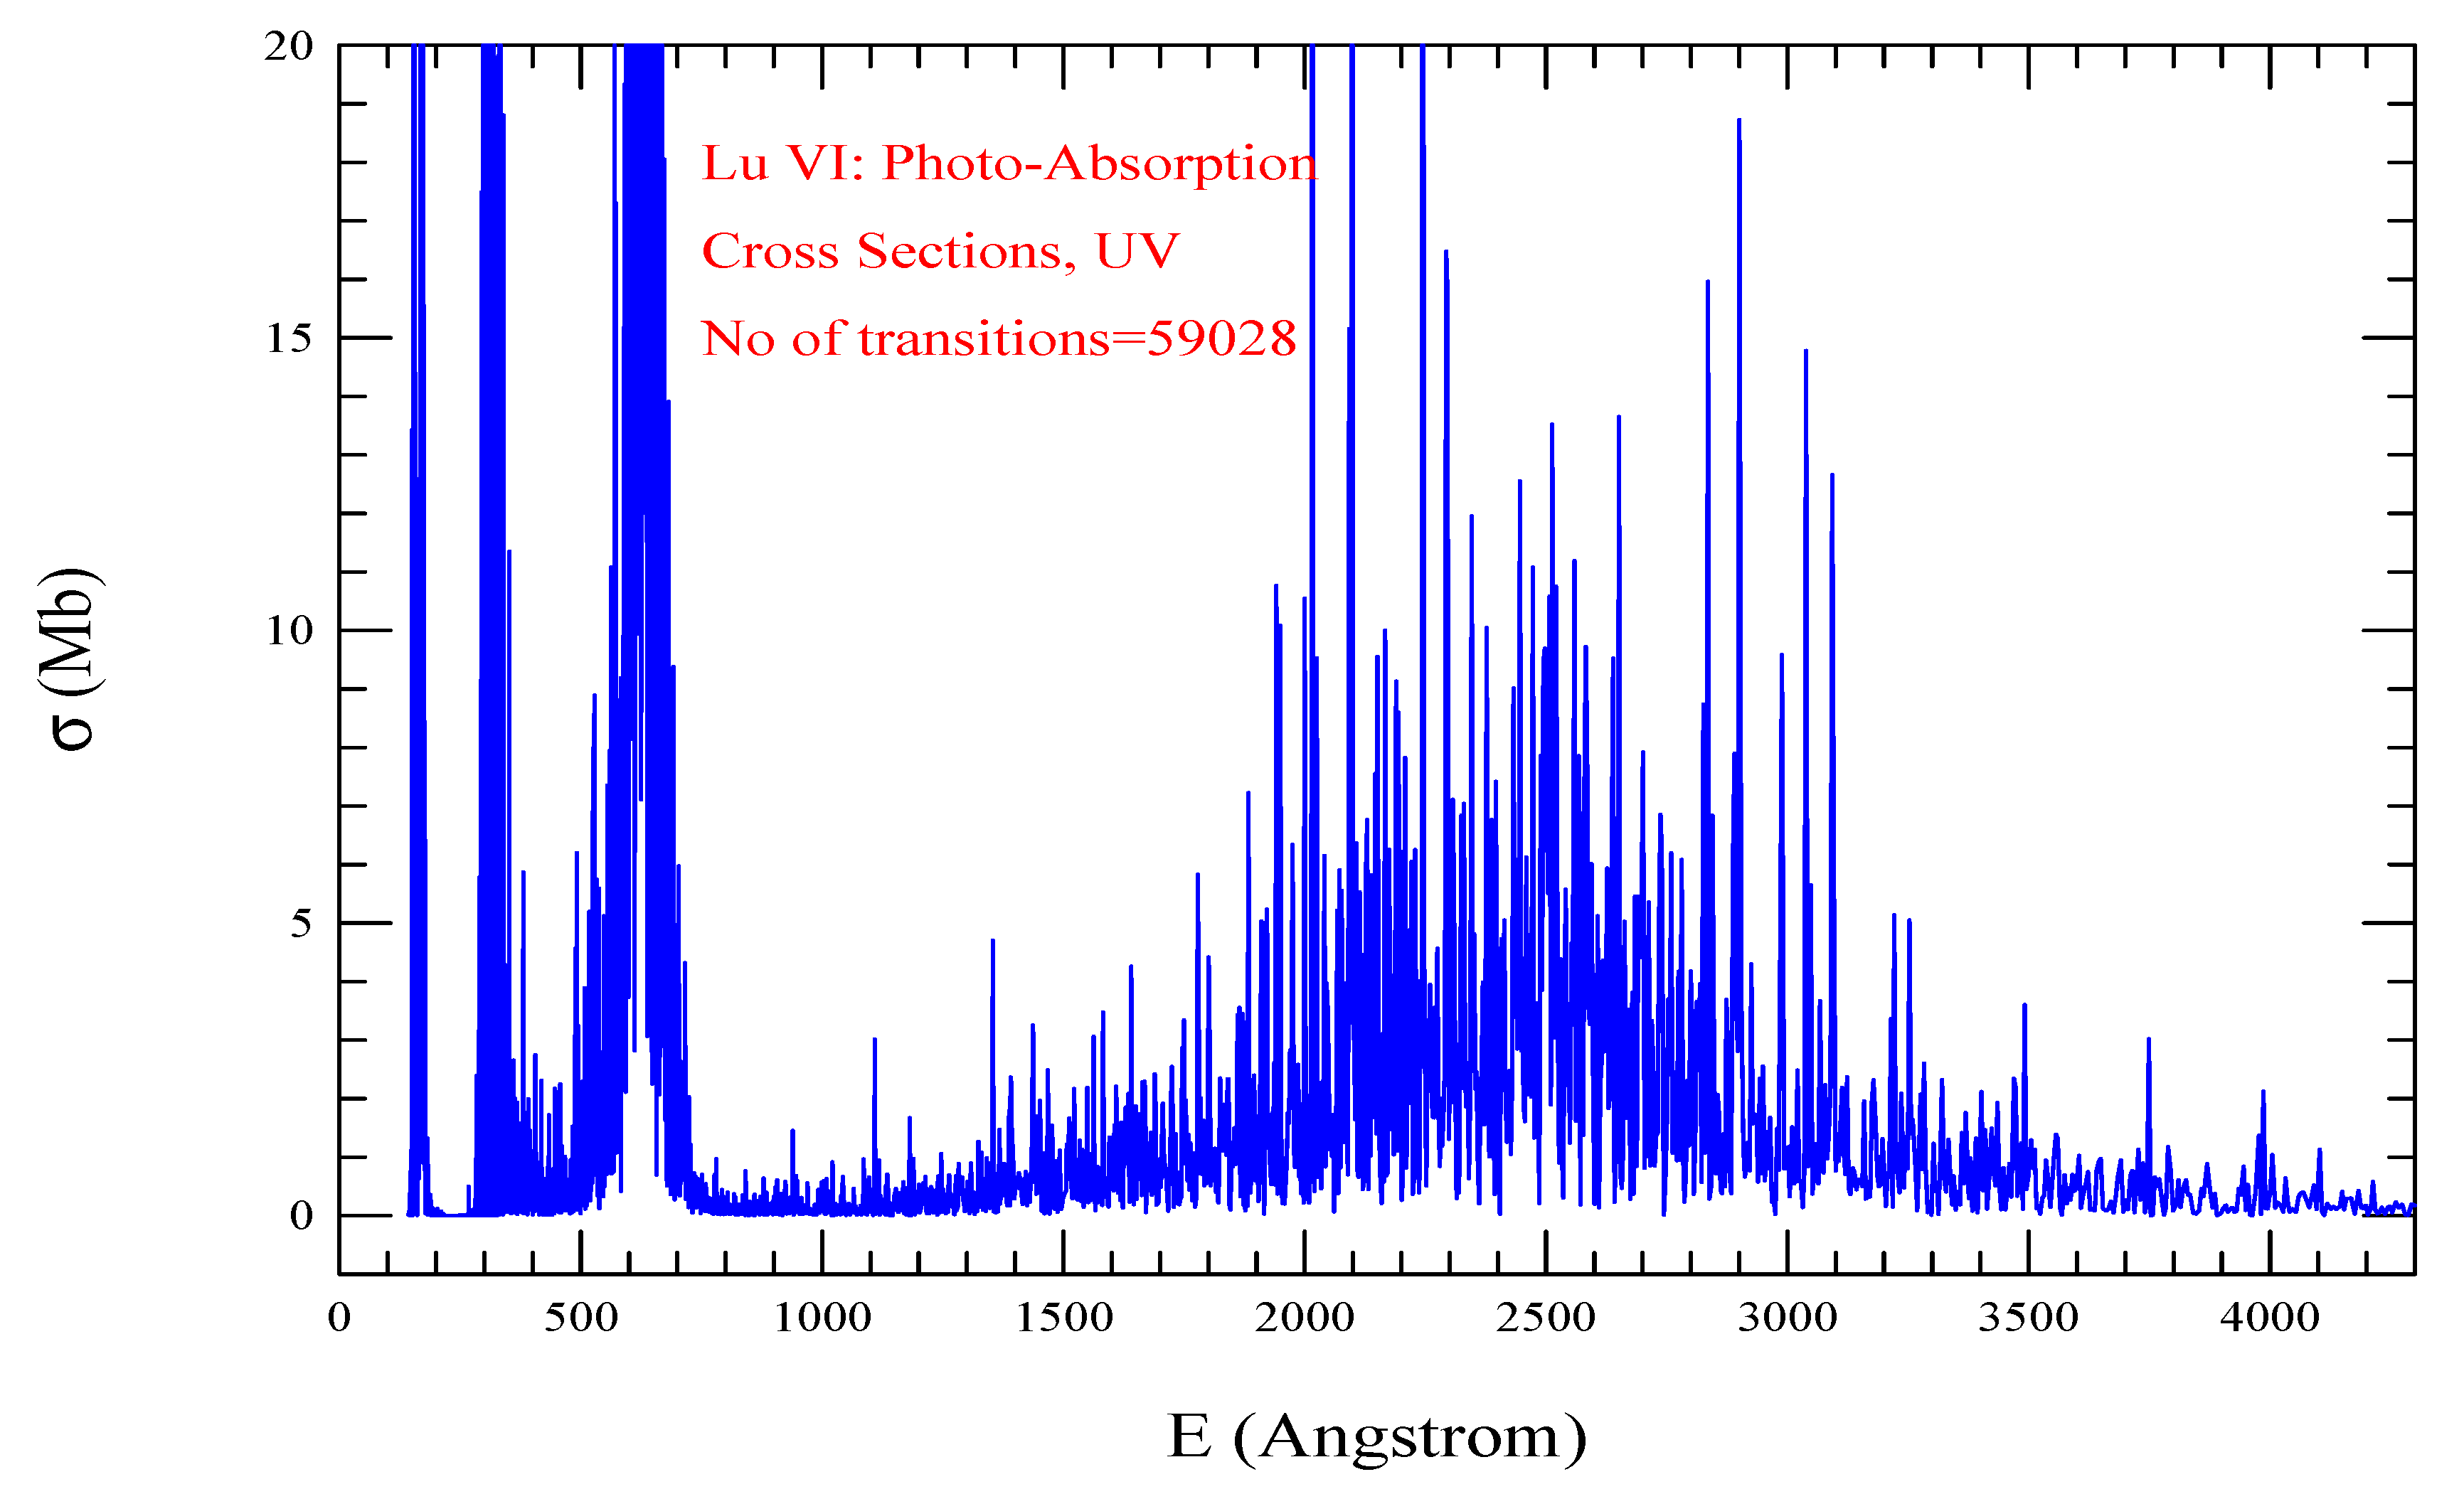
Table 5. Comparison of A-values between the present calculated and those available at NIST [13] compilation table. fij is the oscillator strength and aji(s-1) is the radiative decay rate in sec−1 for transition from level i to j.
A j i ( s 1 ) Transition
NIST SS
Ho I
3.73e+07 2.77E+07 4 f 11 6 s 2 ( 4 I 15 / 2 o ) - 4 f 10 5 d 6 s 2 ( 4 K 13 / 2 )
1.62e+08 1.00E+08 4 f 11 6 s 2 ( 4 I 15 / 2 o ) - 4 f 10 5 d 6 s 2 ( 4 I o ) 15 / 2 )
Ho II
6.35e+07 3.09E+07 4 f 11 6 s ( 4 I 8 o ) 4 f 11 6 p ( 4 I 8 )
4.87e+07 4.64E+07 4 f 11 6 s ( 4 I 7 o ) 4 f 11 6 p ( 4 I 8 )
Ho III: No A-value is available
Er I
1.16e+08 2.49E+08 4 f 12 6 s 2 ( 3 H 6 ) 4 f 12 6 s 6 p ( 3 H 6 o )
7.28e+07 7.26E+07 4 f 12 6 s 2 ( 3 H 6 ) 4 f 11 5 d 6 s 2 ( 3 I 5 o )
Er II
2.0e+07 4.67E+07 4 f 12 6 s ( 4 H 13 / 2 ) 4 f 11 5 d 6 s ( 4 I 11 / 2 o )
1.4e+07 1.01E+07 4 f 12 6 s ( 4 H 13 / 2 ) 4 f 12 6 p ( 4 I 13 / 2 o )
Er III, Er IV: No A-value is available
Tm I
5.3e+06 3.33E+06 4 f 13 6 s 2 ( 2 F 7 / 2 o ) 4 f 12 5 d 6 s 2 ( 2 G 9 / 2 )
1.47e+07 1.81E+07 4 f 13 6 s 2 ( 2 F 7 / 2 o ) 4 f 12 5 d 6 s 2 ( 2 G 7 / 2 )
Tm II
1.06E+08 7.29E+07 4 f 13 6 s ( 3 F 4 o ) 4 f 12 5 d 6 s ( 3 G 5 )
1.57E+07 2.19E+07 4 f 13 6 s ( 3 F 4 o ) 4 f 12 5 d 6 s ( 3 F 4 )
Tm III, IV, V: No A-value is available
Yb I
1.00E+08 1.66E+08 4 f 14 6 s 2 ( 1 S 0 ) 4 f 13 5 d 6 s ( 1 P 1 o )
6.83E+07 9.12E+07 4 f 14 6 s 2 ( 1 S 0 ) 4 f 13 5 d 6 s 2 ( 3 P 1 o )
Yb II
6.83E+07 9.21E+07 4 f 14 6 s 2 ( 1 S 0 ) 4 f 13 5 d 6 s 2 ( 3 P 1 o )
1.92e+08 1.66E+08 4 f 14 6 s 2 ( 1 S 0 ) 4 f 14 6 s 6 p ( 3 P 1 o )
Yb III, IV, V, VI: No A-value is available
Lu I
7.90e+06 4.53E+06 5 d 6 s 2 ( 2 D 3 / 2 ) 5 d 6 s 6 p ( 2 P 3 / 2 o )
1.85e+08 3.10E+08 5 d 6 s 2 ( 2 D 3 / 2 ) 5 d 6 s 6 p ( 2 F 5 / 2 o )
Lu II
4.53e+08 3.97E+08 6 s 2 ( 1 S 0 ) 6 s 6 p ( 1 P 1 o )
7.14e+07 5.43E+07 6 s 2 ( 1 S 0 ) 6 s 6 p ( 1 P 1 o )
Lu III, IV, V, VI, VII: No A-value is available
We compare only couple of transitions. The reason for it is that comparisons are expected to have certain amount of uncertainties due to lack of proper spectroscopic identification. The problem comes from high mixing of levels. The other issue is identical set of quantum numbers. Large number of possible angular momenta resulting from vector addition of individual angular momenta of a large number of electrons introduce multiple sets of similar quantum number that can be assigned to a level. A single configuration can produce number of levels with different energies but with the same J-values and transitions can occur between the same set of two J-values of the transitional levels belonging to the same set of configurations, although with different energies. The small differences in energies, such as for lanthanides, do not resolve the issues since calculated energies are not precise like measured values. The present work aims at overall improvement of accuracies for collective features of transitions, such as, those observed in lanthanide ions.
Lanthanide ions of the present report with strong lines forming spectral features in the wavelength range of about 3000 to about 7000 Åare the possible ions contributors of the broad feature of GW170817. It is also possible that ions with features in the UV near 3000 Åand in the IR beyond 7000 Åalso made contributions, but are not noticeable because of reasons, such as, weaker transitions, Doppler shift of wavelengths, and shifted by energy loss due to opacity.

5. Conclusions

We summarize the present report as follows:
1. We present atomic data for energy levels and radiative transitions for the 25 ions of lanthanides, Ho I-II, Er I-IV, Tu I-V, Yb I-VI, Lu I-VII. Compared to the available data sets, these are probably the largest sets of atomic data for these lanthanide ions and can be applied for broad features, such as those from kilonovae events.
2. These data, as extensive sets, are expected to be much more improved in accuracy than those available and hence should provide for high precision astrophysical applications.
3. The calculated energies have been benchmarked with the measured values, largely from Martin et al [12], available at the NIST webpage [13]. Comparison shows overall good agreement. Radiative transition probabilities have been compared values available at NIST compiled from a number of sources.
4. We present the spectral features of these 25 lanthanide ions that illustrate dominance of lines in various regions from X-ray to infrared.
5. Spectral features have been benchmarked with those observed experimentally for Ho II with very good agreement.
6. Lanthanides have highly mixed levels and are very sensitive to slight changes in representation of potential and wavefunctions. These characteristics can lead easily to a different sets of levels. Hence guidance through experimentally determined levels is of great need and importance.
7. All atomic data will be available online at database, NORAD-Atomic-Data [28].

Author Contributions

S.N. Nahar has written up the article by herself.

Funding

All computations of this project were carried out on the high performance computers of the Ohio Supercomputer Center (OSC).

Acknowledgments

SNN acknowledges support from the Ohio State University to maintain NORAD-Atomic-Data database and Ohio Supercomputer Center (OSC) for the grant of large computational time.

Conflicts of Interest

The authors declare no conflict of interest.

References

  1. B.P. Abbott et al, Phys. Rev. Lett 2017, 161101.
  2. E. Pian et al. Nature 2017, 67, 551.
  3. D. Kasen, J. Barnes, N.R. Badnell. Astrophys J 2013, 25, 774.
  4. M. Tanaka and K. Hotokezaka. Astrophys. J 2013, 113, 775.
  5. M Tanaka, D Kato, G Gaigalas and K Kawaguchi. MNRAS 2020, 496, 1369–1369.
  6. Tanaka M. et al. ApJ 2018, 852, 109.
  7. L Radziutė, Gediminas Gaigalas, Daiji Kato, Pavel Rynkun, and M Tanaka. ApJ Suppl. SerApJ Suppl. Ser 2020, 248, 17.
  8. Fontes C. J., Fryer C. L., Hungerford A. L., Wollaeger R. T., Korobkin O. MNRAS 2020, 493, 4143.
  9. Cowan, R. 1981, The Theory of Atomic Structure and Spectra (Berkeley, CA: Univ. California Press).
  10. Johnson, J. Science 2019, 363, 474–478. [CrossRef] [PubMed]
  11. C. Kobayashi, A.I. Karakas, M. Lugaro. Astrophy J 2020, 900, 179.
  12. W.C. Martin, Romuald Zalubas, and Lucy Hagan, in Nat. Stand. Ref. Data Ser., NSRDS-NBS 60, 422 pp. (Nat. Bur. Stand., U.S., 1978). [CrossRef]
  13. Kramida, A., Ralchenko, Yu., Reader, J., and NIST ASD Team (2020), NIST Atomic Spectra Database (ver. 5.8), Online: https://physics.nist.gov/PhysRefData/ASD/levels_form.htm.
  14. T. A. Carlson, C. W. T. A. Carlson, C. W. Nestor, Jr., N. Wasserman, and J. D. McDowell, At. Data Nucl. Data Tables 1970, 2, 63–99. [Google Scholar]
  15. W. F. Meggers, C. H. Corliss, and B. F. Scribner, Nat. Bur. Stand., Monograph 145, U.S., 600 pp. (1975). [CrossRef]
  16. D. C. Morton. Astrophys. J., Suppl. Ser. Erratum: 132, 411 (2001). 2000, 130, 403–436.
  17. V. A. Komarovskii. Opt. Spektrosk. (Russ.) [Opt. Spectrosc. 71(4), 322 (1991)]. 1991, 71, 559–592.
  18. "Atomic transition probabilities for Tm I and Tm II, M. E. Wickliffe and J. E. Lawler. J. Opt. Soc. Am. B 1997, 14, 737–753. [CrossRef]
  19. J. Sugar, W. F. Meggers, and P. Camus. J. Res. Natl. Bur. Stand. (U.S.), Sect. A 1973, 77, 1–43.
  20. N. P. Penkin and V. A. Komarovskii. J. Quant. Spectrosc. Radiat. Transfer 1976, 16, 217–252.
  21. J. A. Fedchak, E. A. Den Hartog, J. E. Lawler, P. Palmeri, P. Quinet, and E. Biémont. Astrophys. J. 2000, 542, 1109–1118.
  22. R. Obaid, H. Xiong, U. Ablikim, S. Augustin, K. Schnorr, A. Battistoni, T. Wolf, A.M. Carroll, R. Bilodeau, T. Osipov, D. Rolles, N. Berah, Proc. APS Division of At. Mol. Opt. Phys. (DAMOP) Annual Meeting, Abstract: B9.00007, Providence RI, May 23-27 (2016).
  23. Pradhan A.K., Nahar S.N. Atomic Astrophysics and Spectroscopy (Cambridge University press, 2011).
  24. Nahar SN, Eissner W, Chen GX, Pradhan AK. Atomic data from the Iron Project - LIII. Relativistic allowed and forbidden transition probabilities for Fe XVII. A&A 2003, 408, 789–801.
  25. Eissner W, Jones M, Nussbaumer H .Techniques for the calculation of atomic structures and radiative data including relativistic corrections. Comput. Phys. Commun. 1974, 8, 270–306. [CrossRef]
  26. Nahar S.N. Astron. Astrophys. 2003, 413, 779.
  27. Nahar S.N., Proceedings of the 4th international conference on MTPR-10, Modern Trends in Physics Research, Sharm El Sheikh, Egypt, December 12-16, 2010 (Editor: Lotfia El Nadi, World Scientific, 2013), p. 275-285.
  28. Nahar S.N. Database NORAD-Atomic-Data for atomic processes in plasma. Atoms 8, issue 4, 68 (2020). The data are available at http://norad.astronomy.ohio-state.edu.
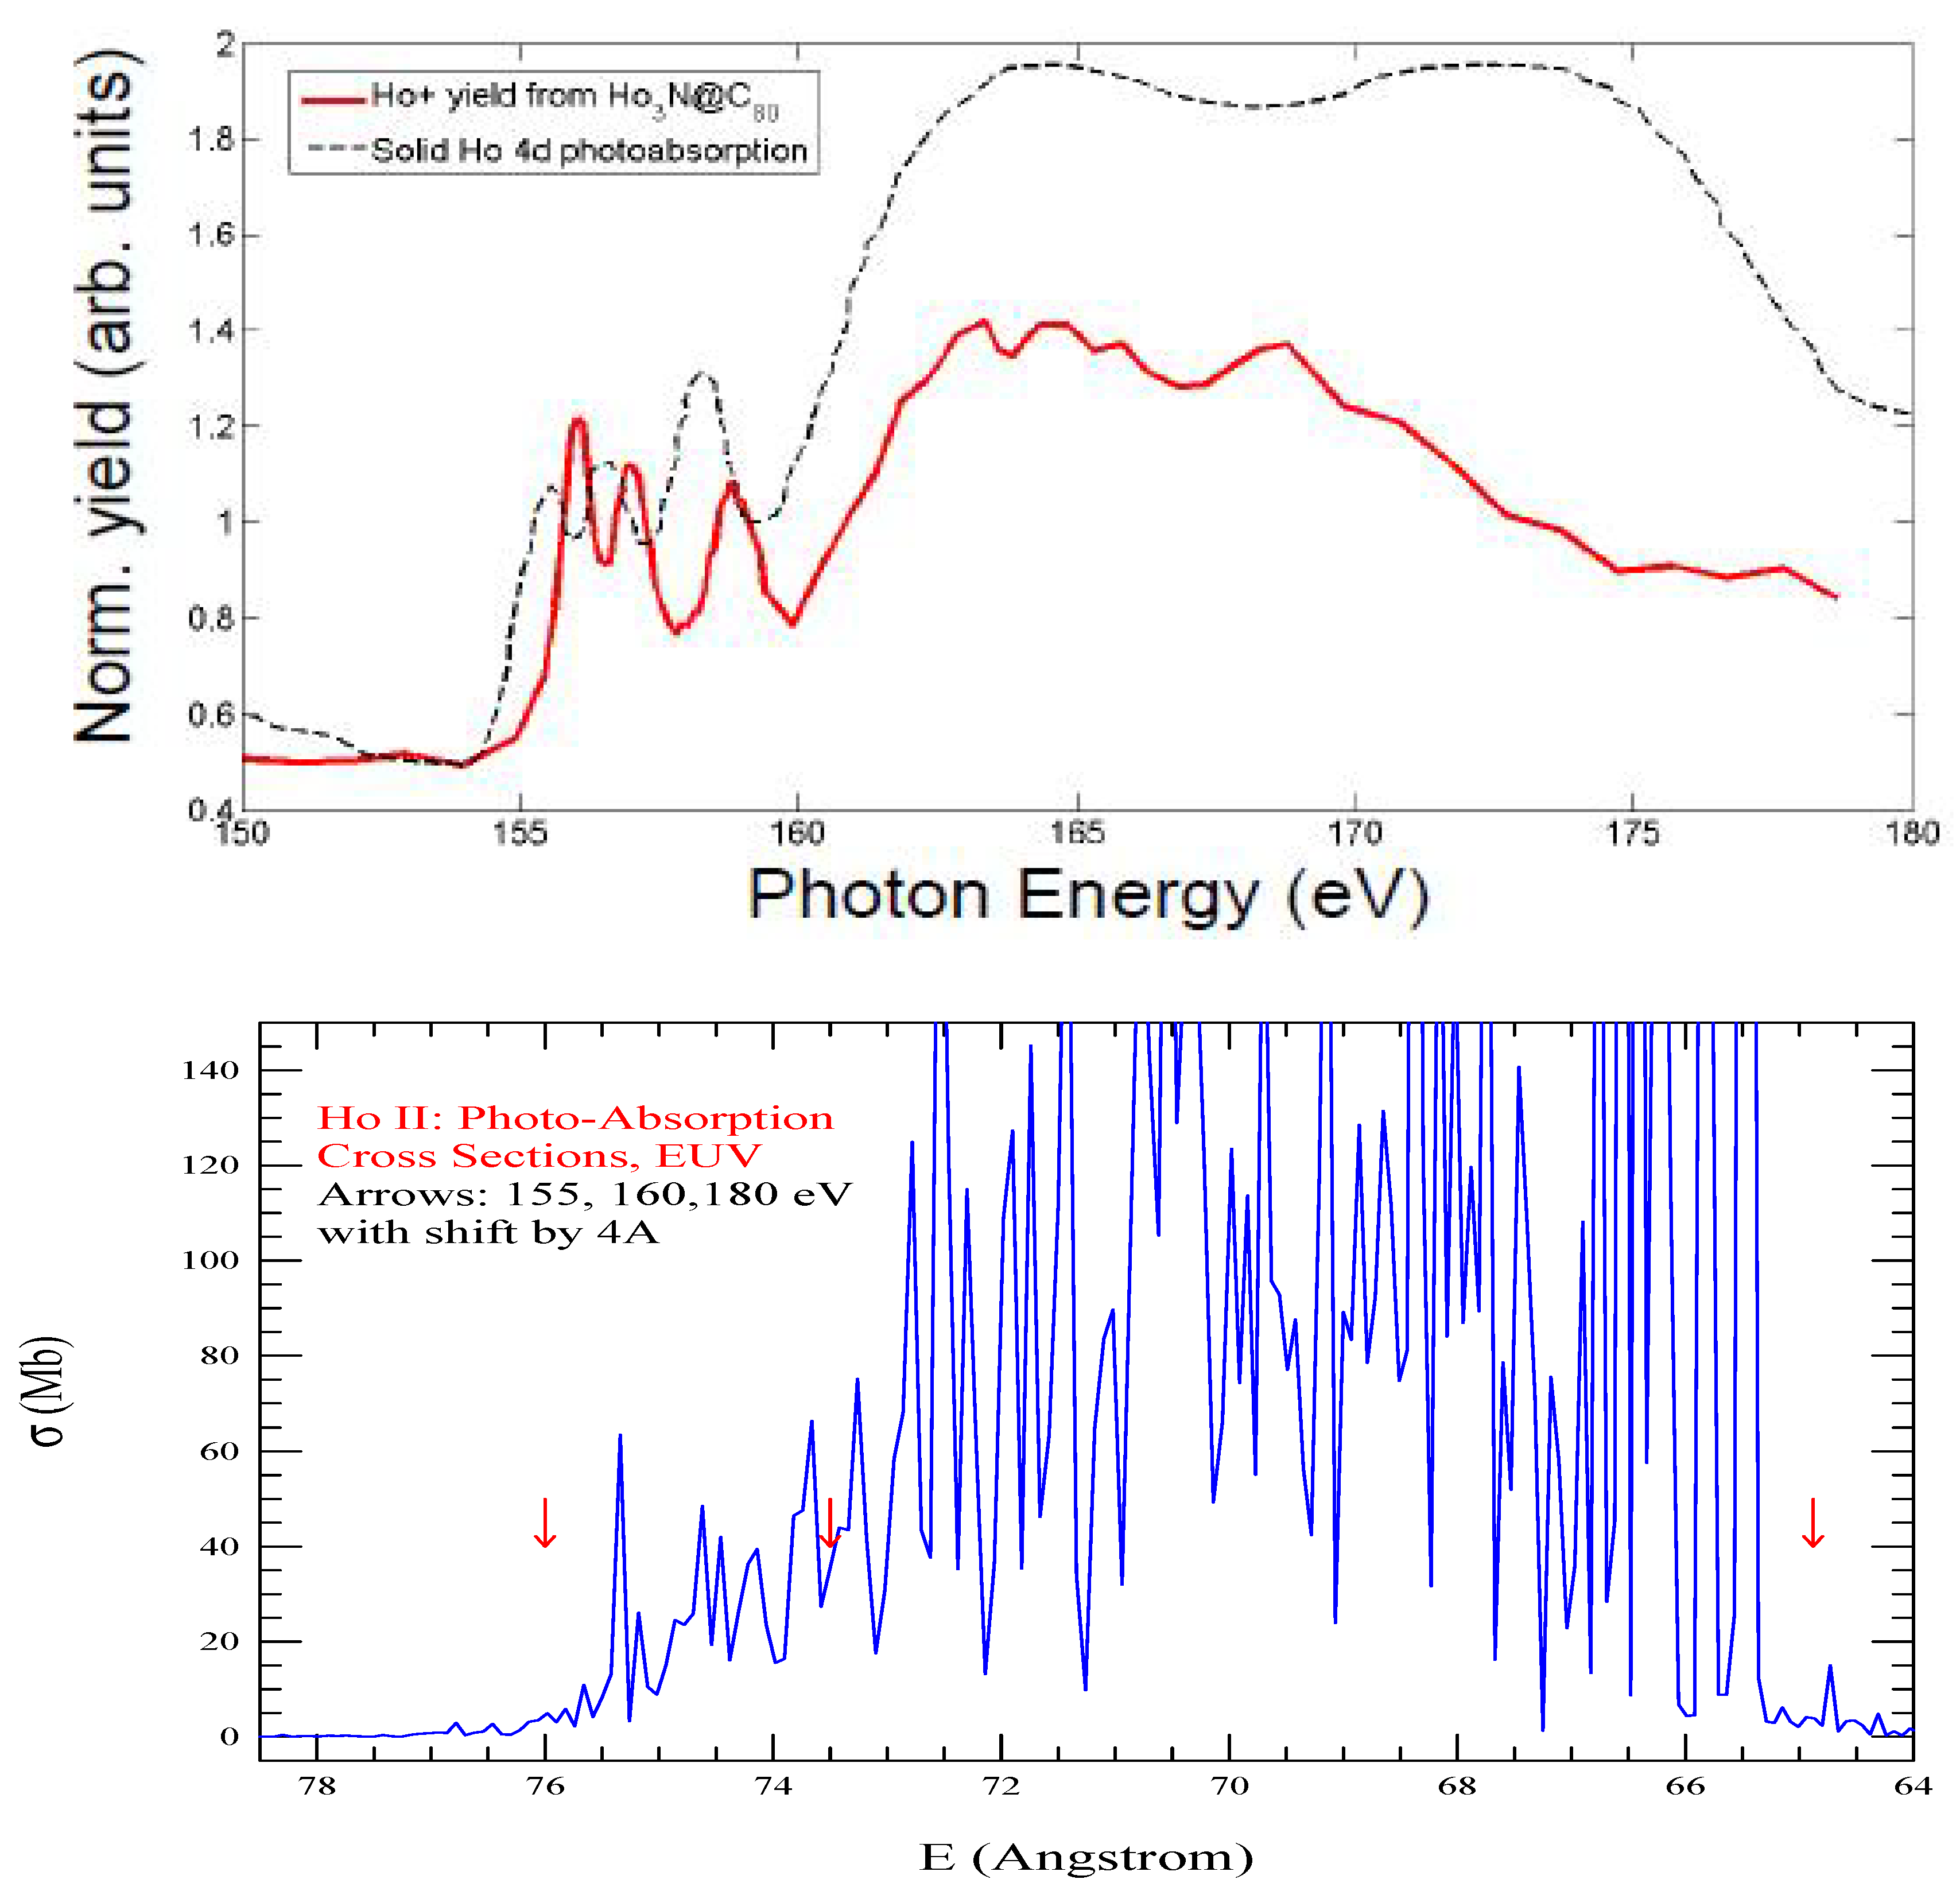
Figure 1. Photoabsorption cross sections ( σ P I ) of the Ho II: Top: Experiment by Obaid et al [22] where the black dashed curve corresponds to photo-absorption spectrum of Ho II, Bottom: Predicted spectrum from the present work covering the experimental energy range but converted to Å. Arrows point at energies E = 155, 160, and 180 eV, around which change in feature in the measured spectrum is noticeable, but shifted by 4 Å toward higher energy in the lower panel.
Preprints 91246 g001
Table 1. Sets of optimized configurations with identifying number within parentheses next to them and Thomas-Fermi orbital scaling parameters ( λ nl ) used in SS to compute the energies and transition parameters. All listed configurations correspond to nine inner closed or filled orbitals, [ 1 s 2 2 s 2 2 p 6 3 s 2 3 p 6 4 s 2 3 d 10 4 p 2 5 s 2 ] , plus additional ones depending on the ion being studied. N T is the total number of transitions, allowed and forbidden, computed for each ion.
Ho I (10 orbitals filled),   N T =1019566
Configurations: 4 f 11 6 s 2 (1), 4 f 10 6 s 2 6 p (2), 4 f 10 6 s 2 5 d (3)
λ n l 1.30 (1s), 1.25 (2s), 1.12 (2p), 1.07 (3s), 1.05 (3p), 1.0 (3d), 1.0 (4s), 1.0 (4p),
1.0 (5s), 0.94 (5p), 1.0 (4d), 1.0 (4f), 1.0 (6s),1.0 (6p), 1.0 (5d)
Ho II (9-0orbitals filled), N T = 408070
Configurations: 4 d 10 5 p 6 4 f 12 (1), 4 d 9 5 p 5 4 f 12 6 s (2), 4 d 10 4 f 11 6 p (3). 4 d 10 4 f 11 5 d (4)
λ n l 1.30 (1s), 1.25 (2s), 1.12 (2p), 1.07 (3s), 1.05 (3p), 1.00 (3d), 1.0 (4s), 1.0 (4p),
1.0 (5s), 1.00 (5p), 1.0 (4d), 1.0 (4f), 1.0 (6s),1.0 (6p), 1.0 (5d)
Ho III (11 orbitals filled), N T = 1309895
Configurations: 4 f 11 (1), 4 f 10 5 d (2), 4 f 10 6 s (3), 4 f 10 6 p (4)
λ n l 1.30 (1s), 1.25 (2s), 1.12 (2p), 1.07 (3s), 1.05 (3p), 1.00 (3d), 1.0 (4s), 1.2 (4p),
0.925 (5s), 1.50 (4d), 1.00 (5p), 0.95 (4f), 1.20 (6s),1.25 (6p), 1.0 (5d)
Er I (11 orbitals filled), N T = 206202
Configurations: 4 f 12 6 s 2 (1), 4 f 11 6 s 2 5 d (2), 4 f 11 6 s 2 6 p (3), 4 f 12 6 s 6 p (4), 4 f 12 6 s 5 d (5)
λ n l 1.30 (1s), 1.25 (2s), 1.12 (2p), 1.07 (3s), 1.05 (3p), 1.00 (3d), 1.0 (4s), 1.05 (4p), 1.0 (5s),
1.00 (5p), 1.00 (4d), 1.05 (4f), 1.09 (6s),1.0 (6p), 1.0 (5d)
Er II (11 orbitals filled), N T = 897374
Configurations: 4 f 12 6 s (1), 4 f 11 6 s 2 (2), 4 f 11 6 s 5 d (3), 4 f 12 5 d (4), 4 f 12 6 p (5), 4 f 11 6 s 6 p (6)
λ n l 1.30 (1s), 1.25 (2s), 1.12 (2p), 1.07 (3s), 1.05 (3p), 1.00 (3d), 1.0 (4s), 1.0 (4p), 1.2 (5s),
0.955 (5p), 1.02 (4d), 1.0 (4f), 1.0 (6s),1.0 (6p), 1.0 (5d)
Er III (9 orbitals filled), N T = 409161
Configurations: 4 d 10 5 p 6 4 f 12 (1), 4 d 10 5 p 6 4 f 11 5 d (2), 4 d 10 5 p 6 4 f 11 6 s (3), 4 d 10 5 p 6 4 f 11 6 p (4),
4 d 10 5 p 5 4 f 13 (5), 4 d 10 5 p 6 4 f 10 6 s 2 (6), 4 d 9 5 p 6 4 f 13 (7)
λ n l 1.30 (1s), 1.25 (2s), 1.12 (2p), 1.07 (3s), 1.05 (3p), 1.00 (3d), 1.0 (4s), 1.0 (4p), 1.8 (5s),
1.17 (4d), 1.01 (5p), 1.0 (4f), 1.2 (6s),1.0 (6p), 1.0 (5d)
Er IV (11 orbitals filled), N T = 1309955
Configurations: 4 f 11 (1), 4 f 10 5 d (2), 4 f 10 6 s (3), 4 f 10 6 p (4)
λ n l 1.30 (1s), 1.25 (2s), 1.12 (2p), 1.07 (3s), 1.05 (3p), 1.0 (3d), 1.0 (4s), 1.0 (4p), 1.0 (5s),
1.07 (4d), 1.0 (5p), 1.0 (4f), 1.0 (5d),1.0 (6s), 1.0 (6p)
Tm I (11 orbitals filled), N T = 118759
Configurations: 4 f 13 6 s 2 (1), 4 f 12 6 s 2 5 d (2), 4 f 13 6 s 5 d (3), 4 f 13 6 s 6 p (4), 4 f 12 6 s 2 6 p (5), 4 f 13 6 p 5 d (6),
4 f 13 6 p 2 (7), 4 f 13 5 d 2 (8), 4 f 14 6 s (9), 4 f 14 6 p (10), 4 f 14 5 d (11)
λ n l 1.30 (1s), 1.25 (2s), 1.22 (2p), 1.1 (3s), 1.12 (3p), 1.1262 (3d), 1.002 (4s), 1.0606 (4p),
0.9 (5s), 1.05436 (5p), 0.97512 (4d), 1.0 (4f), 0.718 (6s), 1.16173 (6p), 1.1096 (5d)
Tm II (11 orbitals filled), N T = 34184
Configurations: 4 f 13 6 s (1), 4 f 12 6 s 2 (2), 4 f 12 6 s 6 d (3), 4 f 13 5 d (4), 4 f 13 6 p (5), 4 f 12 5 d 2 (6),
4 f 12 6 s 6 p (7), 4 f 12 6 s 5 d (8), 4 f 14 (9)
λ n l 1.30 (1s), 1.25 (2s), 1.12 (2p), 1.07 (3s), 1.05 (3p), 1.01 (3d), 0.92 (4s), 0.80 (4p),
1.53 (5s), 0.9 (5p), 1.004 (4d), 1.02 (4f), 1.014 (6s),0.9 (6p), 0.95 (5d)
Tm III (10 orbitals filled), N T = 849878
Configurations: 4 f 13 (1), 4 f 12 5 d (2), 4 f 12 6 s (3), 4 f 12 6 p (4), 4 f 11 6 s 5 d (5), 4 f 11 6 s 6 p (6)
λ n l 1.30 (1s), 1.25 (2s), 1.12 (2p), 1.07 (3s), 1.05 (3p), 1.00 (3d), 1.0 (4s), 1.00 (4p), 1.0 (5s),
1.12 (5p), 1.0  (4d), 0.97 (4f), 0.98 (6s),1.00 (6p), 0.98 (5d)
Tm IV (10 orbitals filled), N T = 1096164
Configurations: 5 p 6 4 f 12 (1), 5 p 6 4 f 11 6 s (2), 5 p 6 4 f 11 5 d (3), 5 p 6 4 f 11 6 s (4), 5 p 6 4 f 11 6 p (5), 5 p 5 4 f 13 (6),
5 p 5 4 f 12 5 d (7), 5 p 5 4 f 12 6 s (8), 5 p 6 4 f 10 6 s 2 (9)
λ n l 1.30 (1s), 1.25 (2s), 1.12 (2p), 1.07 (3s), 1.05 (3p), 1.0 (3d), 1.0 (4s), 1.0 (4p), 1.0 (5s),
1.0 (4d), 1.03 (5p), 1.0 (4f), 1.0 (6s),1.0  (6p), 1.0  (5d)
Tm V (10 orbitals filled), N T = 801717
Configurations: 4 f 11 (1), 4 f 10 5 d (2), 4 f 10 6 s (3), 4 f 10 6 p (4)
λ n l 1.3 (1s), 1.25 (2s), 1.12 (2p), 1.07 (3s), 1.05 (3p), 1.0 (3d), 1.0 (4s), 1.0 (4p), 1.0 (5s),
1.0 (4d), 1.0 (5p), 1.0 (4f),1.0 (6s),1.0  (6p), 1.0  (5d)
Yb I (11 orbitals filled), N T = 109127
Configurations: 4 f 14 6 s 2 (1), 4 f 14 6 s 6 p (2), 4 f 13 6 s 2 5 d (3), 4 f 14 6 s 5 d (4), 4 f 13 6 s 2 6 p (5), 4 f 13 6 s 5 d 2 (6),
4 f 13 6 s 6 p 5 d (7), 4 f 14 6 p 2 (8), 4 f 14 6 p 5 d (9), 4 f 14 5 d 2 (10)
λ n l 1.30 (1s), 1.25 (2s), 1.12 (2p), 1.07 (3s), 1.05 (3p), 1.03 (3d), 1.05 (4s), 1.02 (4p),
0.935 (5s), 0.937 (5p), 1.0 (4d), 1.0 (4f), 1.0 (6s),1.0  (6p), 1.0  (5d)
Yb II (11 orbitals filled), N T =39009
Configurations: 4 f 14 6 s (1), 4 f 13 6 s 2 (2), 4 f 14 5 d (3), 4 f 13 6 s 5 d (4), 4 f 14 6 p (5), 4 f 13 5 d 2 (6), 4 f 13 6 s 6 p (7),
4 f 13 6 p 5 d (8)
λ n l 1.30 (1s), 1.45 (2s), 1.20 (2p), 1.10 (3s), 1.07 (3p), 1.0 (3d), 1.0 (4s), 1.05 (4p),
0.918 (5s), 0.90  (5p), 1.025 (4d), 1.0 (4f), 1.1007 (6s),0.97 (6p), 0.97 (5d)
Yb III (11 orbitals filled), N T = 925575
Configurations: 4 f 14 (1), 4 f 13 5 d (2), 4 f 13 6 s (3), 4 f 13 6 p (4), 4 f 12 5 d 2 , 4 f 12 6 s 5 d , 4 f 12 6 p 5 d , 4 f 12 6 s 6 p , 4 f 12 6 s 2
λ n l 1.30 (1s), 1.25 (2s), 1.12 (2p), 1.07 (3s), 1.05 (3p), 1.15 (3d), 1.05 (4s), 0.819 (4p),
1.24 (5s), 0.887  (5p), 0.98 (4d), 1.02 (4f), 1.05 (6s),0.95 (6p), 1.0 (5d)
Yb IV (10 orbitals filled), N T = 400325
Configurations: 4 d 10 4 f 13 (1), 4 d 10 4 f 12 5 d (2), 4 d 10 4 f 12 6 s (3), 4 d 10 4 f 12 6 p (4), 4 d 9 4 f 14 (5), 4 d 10 4 f 11 6 s 5 d (6)
λ n l 1.3 (1s), 1.25 (2s), 1.12 (2p), 1.07 (3s), 1.05 (3p), 1.0 (3d), 1.0 (4s), 1.0 (4p),
1.0 (5s), 0.995 (5p), 1.0  (4d), 1.0  (4f), 1.0  (6s),1.0 (6p), 1.0 (5d)
Yb V (10 orbitals filled), N T = 208128
Configurations: 4 f 12 5 p 6 (1), 4 f 13 5 p 5 (2), 4 f 11 5 p 6 5 d (3), 4 f 12 5 p 5 6 s (4), 4 f 11 5 p 6 6 s (5), 4 f 11 5 p 6 6 p (6)
λ n l 1.30 (1s), 1.25 (2s), 1.12 (2p), 1.07 (3s), 1.05 (3p), 1.0 (3d), 1.0 (4s), 1.0 (4p), 1.0 (5s),
1.0  (4d), 1.03 (5p), 1.0  (4f), 1.0  (6s),1.15 (6p), 1.2 (5d)
Yb VI (10 orbitals filled), N T = 486262
Configurations: 45 p 5 4 f 12 (1), 5 p 6 f 10 5 d (2), 5 p 4 4 f 12 6 s (3), 5 p 4 4 f 13 (4)
λ n l 1.30 (1s), 1.25 (2s), 1.12 (2p), 1.07 (3s), 1.05 (3p), 1.0 (3d), 1.0 (4s), 1.0 (4p), 1.1 (5s),
1.0  (4d), 1.0  (5p), 1.0  (4f), 1.0  (6s),1.0 (6p), 1.0 5d
Lu-I (12 orbitals filled), N T = 13936
Configurations: 5 d 6 s 2 (1), 6 s 2 6 p (2), 5 d 6 s 6 p (3), 6 s 5 d 2 (4), 6 s 6 p 2 (5), 6 p 5 d 2 (6), 5 d 6 p 2 (7), 5 p 3 (8), 5 d 3 (9)
λ n l 1.30 (1s), 1.25 (2s), 1.12 (2p), 1.07 (3s), 1.05 (3p), 1.0 (3d), 1.0 (4s), 1.0 (4p),
0.95 (5s), 1.135 (4d), 0.94 (5p), 1.0  (4f), 1.0  (6s), 0.98 (6p), 1.0 5d
Lu-II (11 orbitals filled), N T = 109566
Configurations: 4 f 14 6 s 2 (1), 4 f 14 6 s 5 d (2), 4 f 14 6 s 6 p (3), 4 f 14 5 d 2 (4), 4 f 14 5 d 6 p (5), 4 f 14 6 p 2 (6), 4 f 13 6 s 5 d 2 (7),
4 f 13 6 s 2 5 d (8), 4 f 13 6 s 5 d 6 p (9), 4 f 13 6 s 2 6 p (10)
λ n l 1.30 (1s), 1.25 (2s), 1.12 (2p), 1.07 (3s), 1.05 (3p), 1.0 (3d), 1.0 (4s), 1.0 (4p), 0.95 (5s),
0.937 (5p), 1.0 (4d), 1.0  (4f), 1.0  (6s), 1.0 (6p), 0.99 5d
Lu-III (11 orbitals filled), N T = 8564
Configurations: 4 f 14 6 s (1), 4 f 14 5 d (2), 4 f 14 6 p (3), 4 f 13 5 d 2 (4), 4 f 13 5 d 6 s (5), 4 f 13 6 s 2 (6), 4 f 13 6 s 5 d (7),
4 f 13 6 s 6 p (8)
λ n l 1.30 (1s), 1.25 (2s), 1.12 (2p), 1.07 (3s), 1.05 (3p), 1.00 (3d), 1.0 (4s), 1.05 (4p), 1.00 (5s),
0.95  (5p), 0.98 (4d), 1.0  (4f), 1.03 (6s), 0.97 (6p), 0.97 5d
Lu-IV (11 orbitals filled), N T = 926436
Configurations: 4 f 14 (1), 4 f 13 5 d (2), 4 f 13 6 s (3), 4 f 13 6 p (4), 4 f 12 5 d 2 (5), 4 f 12 5 d 6 s (6), 4 f 12 6 s 2 (7),
4 f 12 6 s 6 p (8), 4 f 12 6 p 5 d (9)
λ n l 1.30 (1s), 1.25 (2s), 1.12 (2p), 1.07 (3s), 1.05 (3p), 1.00 (3d), 1.0 (4s), 0.80 (4p), 1.40 (5s),
0.90  (5p), 0.98 (4d), 1.02 (4f), 1.05 (6s), 0.92 (6p), 0.97 5d
Lu-V (11 orbitals filled), N T = 850668
Configurations: 4 f 13 (1), 4 f 12 5 d (2), 4 f 12 6 s (3), 4 f 12 6 p (4), 4 f 12 5 d 6 s (5), 4 f 12 6 s 6 p (6)
λ n l 1.30 (1s), 1.25 (2s), 1.12 (2p), 1.07 (3s), 1.05 (3p), 1.0 (3d), 1.0 (4s), 1.0 (4p), 1.0 (5s),
0.999 (5p), 0.993 (4d), 1.01 (4f), 0.98 (6s), 1.02 (6p), 1.0 5d
Lu-VI (10 orbitals filled), N T = 317817
Configurations: 4 f 12 5 p 6 (1), 4 f 13 5 p 5 (2), 4 f 11 5 p 6 5 d (3), 4 f 12 5 p 5 6 s (4), 4 f 11 5 p 6 6 s (5), 4 f 11 5 p 6 6 p (6)
λ n l 1.30 (1s), 1.25 (2s), 1.12 (2p), 1.07 (3s), 1.05 (3p), 0.80 (3d), 1.0 (4s), 1.00 (4p), 1.40 (5s),
0.98  (4d), 1.0 (5p), 1.0 (4f), 0.95(6s), 1.3  (6p), 1.3 5d
Lu-VII (10 orbitals filled), N T = 304178
Configurations: 4 f 13 5 p 4 (1), 4 f 12 5 p 5 (2), 4 f 14 5 p 3 (3), 4 f 13 5 p 3 5 d (4), 4 f 13 5 p 3 4 s (5), 4 f 13 5 p 3 6 p (6)
λ n l 1.30 (1s), 1.25 (2s), 1.12 (2p), 1.07 (3s), 1.05 (3p), 1.0 (3d), 1.0 (4s), 1.0 (4p), 1.0 (5s),
0.98  (4d), 0.97 (5p), 1.0 (4f), 1.0 (6s), 1.0 (6p), 1.12 5d
Table 2. Sample table of energies for Ho I demonstrating the format of the complete energy table for each lanthanide ion. The total number of levels obtained is given at the top. The column head, ie, is running index for the energies, S L π is the symmetry of level, the number within parentheses is the configuration number as given in Table 1, 2J+1 is the statistical weight and E is the level energy in Ry.
Number of fine structure levels = 1629
ie SL π (cf#) 2J+1 E(Ry)
1 4Io( 1) 15 0.00000E+00
2 4Io( 1) 13 3.60033E-02
3 4Io( 1) 11 5.85101E-02
4 4Io( 1) 9 7.43454E-02
5 4Me( 2) 15 9.79376E-02
6 6Le( 2) 13 1.01223E-01
7 4Fo( 1) 9 1.09269E-01
8 6Le( 2) 11 1.22576E-01
9 2Ho( 1) 11 1.28064E-01
10 4So( 1) 3 1.35965E-01
Table 3. Sample table of dipole allowed E1 transitions with same spin for Ho I to demonstrate the format of the complete table of transitions. Ni and Ni are the energy level numbers, SLpiCi and SLpCj are the transitional level symmetries with their configuration numbers, gi and gj are the statistical weight factors (as given in the energy table), wl(A) is the wavelength of the transition in Å, fij is the oscillator strength and aji(s-1) is the radiative decay rate in sec−1 for transition from level i to j.
Ni- Nj SLp Ci-SLp Cj gi-gj wl(A) fij aji(s-1)
29- 3 4Ie  2- 4Io  1 12- 10 6454.84 4.24E-06 8.15E+02
29- 4 4Ie  2- 4Io  1 10- 10 7270.34 4.48E-06 5.65E+02
42- 2 4Ke  2- 4Io  1 14- 12 4678.36 9.76E-06 3.47E+03
42- 3 4Ke  2- 4Io  1 12- 12 5289.56 1.11E-05 2.65E+03
Table 4. Ground and low lying excited energy levels of lanthanide ions of Ho, Er. Tm. Yb. Lu obtained from SUPERSTRUCTURE (SS) are compared with the available measured values, largely by Martin et al [12], available in the compiled table of the NIST [13]. Each configuration below corresponds to electrons outside the core ion configuration of Xe and filled 4 d orbitals unless 4d has vacancies. N E is the number of energy levels and N E 1 is the number of corresponding E1 transitions obtained from the configuration set of each ion.
Config SL π J E(SS,Ry) E(NIST,[12],Ry)
Ho I,  N E =1629,   N E 1 = 210522
1 4 f 11 6 s 2 4 I o 15/2 0.0 0.0
2 4 f 11 6 s 2 4 I o 13/2 0.03603 0.0493879
3 4 f 11 6 s 2 4 I o 11/2 0.05851 0.0784160
4 4 f 11 6 s 2 4 I o 9/2 0.07434 0.0974668
5 4 f 10 5 d 6 s 2 4 M 15/2 0.09794 0.0763542
6 4 f 10 5 d 6 s 2 6 L 13/2 0.10122 0.0767935
7 4 f 10 5 d 6 s 2 6 L 11/2 0.12257 0.0833543
8 4 f 10 5 d 6 s 2 6 L 13/2 0.10122 0.0887711
9 4 f 11 6 s 2 4 M 17/2 0.13881 0.1031765
10 4 f 10 5 d 6 s 2 6 K 9/2 0.14215 0.1050742
Ho II, N E =924,  N E 1 = 81623
1 4 f 11 6 s 5 I o 8 0.0 0.0
2 4 f 11 6 s 5 I o 7 0.00724 0.005808
3 4 f 11 6 s 3 I o 7 0.05528 0.051186
4 4 f 11 6 s 5 I o 6 0.05793 0.053306
5 4 f 11 6 s 5 I o 5 0.08928 0.080652
6 4 f 11 6 s 3 I o 6 0.09113 0.082029
7 4 f 11 5 d 5 G o 6 0.11003 0.098771
8 4 f 11 6 s 5 I o 4 0.11108 0.102111
9 4 f 11 6 s 3 I o 9 0.11702 0.148388
10 4 f 11 5 d 5 H o 7 0.11832 0.152628
Ho III, N E =1837,  N E 1 = 258124
1 4 f 11 4 I o 15/2 0.0 0.0
2 4 f 11 4 I o 13/2 0.03114 0.04956
3 4 f 11 4 I o 11/2 0.04969 0.07877
4 4 f 11 4 I o 9/2 0.06203 0.09815
6 4 f 11 4 F o 9/2 0.08576 0.12147
7 4 f 11 4 F o 7/2 0.1149 0.16282
8 4 f 11 4 F o 5/2 0.1245 0.17656
9 4 f 11 4 F o 3/2 0.1261
10 4 f 11 2 H o 11/2 0.10275 0.15392
Er I. N E =993,   N E 1 = 88827
1 4 f 12 6 s 2 3 I 6 0.0 0.0
2 4 f 12 6 s 2 3 I 5 0.06787 0.063408
3 4 f 12 6 s 2 3 I 4 0.06158 0.097970
4 4 f 12 6 s 2 3 F 4 0.11386 0.045884
5 4 f 12 6 s 2 3 F 3 0.13971 0.112792
6 4 f 12 6 s 2 3 F 2 0.15311 0.119357
7 4 f 11 5 d 6 s 2 5 G o 6 0.089544 0.065397
8 4 f 11 5 d 6 s 2 5 I o 7 0.097936 0.070140
9 4 f 11 5 d 6 s 2 5 K o 9 0.104784 0.078556
10 4 f 11 5 d 6 s 2 5 I o 8 0.114163 0.085204
Er II, N E =1476,  N E 1 = 189738
1 4 f 12 6 s 4 H 13/2 0.0 0.0
2 4 f 12 6 s 2 H 11/2 0.00112 0.004013
Config SL π 2J E(SS,Ry) E(NIST,[12],Ry)
3 4 f 12 6 s 2 H 9/2 0.06211 0.046772
4 4 f 12 6 s 4 H 7/2 0.06260 0.049242
5 4 f 11 5 d 6 s 6 G o 13/2 0.06788
6 4 f 12 6 s 4 H 11/2 0.06837 0.0661522
7 4 f 12 6 s 4 H 9/2 0.06855 0.065567
8 4 f 11 5 d 6 s 6 H o 15/2 0.07743 0.121552
9 4 f 11 5 d 6 s 6 G o 11/2 0.08817 0.15444
10 4 f 11 5 d 6 s 6 L o 17/2 0.08825 0.09720
Er III, N E =1000,   N E 1 = 82286
1 4 f 11 6 s 2 4 I o 16 0.0 0.0
2 4 f 11 6 s 2 4 I o 14 0.0360 0.0493879
4 4 f 12 3 F 2 0.09552
5 4 f 12 3 F 3 0.08026
6 4 f 12 3 F 4 0.07184 0.04631
7 4 f 11 5 d 5 I o 8 0.17621 0.17602
8 4 f 11 5 d 3 I o 7 0.21743 0.18431
9 4 f 11 5 d 3 I o 8 0.21743 0.18431
10 4 f 11 5 d 3 I o 8 0.23221 0.19617
Er IV, N E =1837,  N E 1 = 257713
1 4 f 11 4 I o 15/2 0.0 0.0
2 4 f 11 4 I o 13/2 0.0598 0.0591
3 4 f 11 4 I o 11/2 0.0970 0.0921
4 4 f 11 4 I o 9/2 0.1230 0.1125
5 4 f 11 4 F o 9/2 0.1770 0.1383
6 4 f 11 4 F o 7/2 0.2333 0.1863
7 4 f 11 4 F o 5/2 0.2525 0.2011
8 4 f 11 4 F o 3/2 0.2555 0.2042
9 4 f 11 2 H o 11/2 0.2103
10 4 f 11 4 S o 3/2 0.2193 0.1667
Tm I, N E =470,  N E 1 = 23804
1 4 f 13 6 s 2 2 F o 7/2 0.0 0.0
2 4 f 11 6 s 2 2 F o 5/2 0.0891 0.0799
3 4 f 12 6 s 2 6 p 4 G o 11/2 0.0933 0.1195
4 4 f 11 6 s 2 6 p 2 I o 13/2 0.1017 0.1392
5 4 f 12 6 s 2 5 d 4 F 9/2 0.1343 0.1420
6 4 f 11 6 s 2 6 p 4 G o 7/2 0.1621 0.1591
7 4 f 11 6 s 2 6 p 4 G o 9/2 0.1639 0.1500
8 4 f 11 6 s 2 6 p 4 I o 11/2 0.1774 0.1545
9 4 f 11 6 s 2 6 p 4 I o 9/2 0.1785 0.1703
10 4 f 12 6 s 2 5 d 2 K 15/2 0.2030 0.1716
Tm II, N E =1129,  N E 1 = 2467
1 4 f 13 6 s 3 F o 4 0.0 0.0
2 4 f 13 6 s 1 F o 3 0.000309 0.00216
3 4 f 13 6 s 3 F o 2 0.1050 0.0799
4 4 f 13 6 s 3 F o 3 0.1053 0.0816
5 4 f 12 6 s 2 3 H 6 0.1449 0.1135
6 4 f 12 6 s 2 3 H 5 0.2272 0.1879
7 4 f 12 6 s 2 3 H 4 0.1812 0.2272
8 4 f 12 5 d 6 s 5 F 5 0.1362 0.1510
9 4 f 12 5 d 6 s 3 K 7 0.14733 0.17878
10 4 f 13 5 d 3 P o 2 0.15058 0.1606
Tm III, N E =1437,  N E 1 = 181768
1 4 f 13 2 F o 7/2 0.0 0.0
2 4 f 13 2 F o 5/2 0.06669 0.07995
3 4 f 12 5 d 4 F 9/2 0.24034 0.20866
4 4 f 12 5 d 4 H 15/2 0.27574 0.235825
Config SL π 2J E(SS,Ry) E(NIST,[12],Ry)
Tm III, N E =1437,  N E 1 = 181768
5 4 f 12 5 d 4 H 11/2 0.27975 0.239230
6 4 f 12 5 d 4 K 13/2 0.30738 0.261724
7 4 f 12 6 s 2 H 13/2 0.21097 0.230575
8 4 f 12 6 s 2 H 11/2 0.21716 0.236207
9 4 f 12 5 d 4 H 7/2 0.27029 0.251029
10 4 f 12 5 d 4 I 17/2 0.28719 0.251127
Tm IV, N E =1606,  N E 1 = 160013
1 4 f 12 3 H 6 0.0 0.0
2 4 f 12 3 H 5 0.08038 0.0737
3 4 f 12 3 H 4 0.06591 0.114 !
4 4 f 12 3 F 4 0.12865 0.0514!
5 4 f 12 3 F 3 0.15760 0.1308
6 4 f 12 3 F 2 0.17087 0.1353
7 4 f 12 1 G 4 0.21265 0.1943
8 4 f 12 1 D 2 0.33334
9 4 f 12 1 I 6 0.40132
10 4 f 12 3 P 0 0.43598
Tm V, N E =1837,  N E 1 = 259539
1 4 f 11 4 I o 15/2 0.0 0.0
2 4 f 11 4 I o 13/2 0.04067
3 4 f 11 4 I o 11/2 0.06393
4 4 f 11 4 I o 9/2 0.07922
5 4 f 11 4 F o 9/2 0.10784
6 4 f 11 2 H o 11/2 0.12898
7 4 f 11 4 S o 3/2 0.13396
8 4 f 11 4 F o 7/2 0.14556
9 4 f 11 4 F o 5/2 0.15756
10 4 f 11 4 F o 3/2 0.15875
Yb I, N E =455,  N E 1 = 22002
1 4 f 14 6 s 2 1 S 0 0.0 0.0
2 4 f 14 6 s 6 p 3 P o 0 0.11722 0.157544
3 4 f 14 6 s 6 p 3 P o 1 0.12353 0.163955
4 4 f 14 6 s 6 p 3 P o 2 0.13864 0.179614
5 4 f 13 5 d 6 s 2 3 H o 2 0.17604 0.211309
6 4 f 13 5 d 6 s 2 3 H o 5 0.21229 0.235651
7 4 f 13 5 d 6 s 2 3 D o 3 0.23746 0.250103
8 4 f 13 5 d 6 s 2 3 H o 4 0.25282 0.256836
9 4 f 14 5 d 6 s 3 D 1 0.37221 0.223161
10 4 f 14 6 s 6 p 1 P o 1 0.23039 0.228438
Yb II, N E =264,  N E 1 = 8033
1 4 f 14 6 s 2 S 1/2 0.0 0.0
2 4 f 13 6 s 2 2 F o 7/2 0.12512 0.195182
3 4 f 13 6 s 2 2 F o 5/2 0.22718 0.287669
4 4 f 14 5 d 2 D 3/2 0.13701 0.209234
5 4 f 14 5 d 2 D 5/2 0.15567 0.221736
6 4 f 13 6 s 5 d 4 P o 5/2 0.20627 0.243846
7 4 f 13 6 s 5 d 4 P o 3/2 0.23529 0.262062
8 4 f 13 6 s 5 d 4 P o 1/2 0.22353 0.306676
9 4 f 14 6 s 6 p 2 P o 1/2 0.25680 0.246605
10 4 f 14 6 s 6 p 2 P o 3/2 0.27636 0.276954
Yb III, N E =1485,  N E 1 = 203904
1 4 f 14 1 S 0 0.0 0.0
2 4 f 13 5 d 3 P o 2 0.31312 0.304234
3 4 f 13 5 d 3 H o 5 0.35368 0.337353
Config SL π 2J E(SS,Ry) E(NIST,[12],Ry)
Yb III, N E =1485,  N E 1 = 203904
4 4 f 13 5 d 1 D o 3 0.381433 0.356681
5 4 f 13 5 d 3 H o 4 0.397868 0.365965
6 4 f 13 6 s 3 D o 4 0.313955 0.315810
7 4 f 13 6 s 3 D o 3 0.314706 0.318858
8 4 f 13 5 d 3 H o 12 0.387298 0.365965
9 4 f 13 5 d 3 P o 2 0.393126 0.361962
10 4 f 13 5 d 3 D o 4 0.406379 0.367132
Yb IV, N E =963,  N E 1 = 40767
1 4 f 13 2 F o 7/2 0.0 0.0
2 4 f 13 2 F o 5/2 0.10849 0.093077
3 4 f 12 5 d 4 F 9/2 0.68093 0.715611
4 4 f 12 5 d 2 K 15/2 0.71781 0.748930
5 4 f 12 5 d 4 G 11/2 0.72798 0.753373
6 4 f 12 5 d 4 K 13/2 0.75809 0.779549
7 4 f 12 5 d 4 F 7/2 0.74697 0.768627
8 4 f 12 5 d 4 K 17/2 0.75311 0.775715
9 4 f 12 5 d 4 G 9/2 0.78667 0.802991
10 4 f 12 5 d 4 I 11/2 0.79105 0.803512
Yb V, N E =873,   N E 1 = 59027
1 4 f 12 5 p 6 3 H 6 0.0 0.0
2 4 f 12 5 p 6 3 H 4 0.031148
3 4 f 12 5 p 6 3 H 5 0.056967
4 4 f 12 5 p 6 3 F 4 0.085510
5 4 f 12 5 p 6 3 F 3 0.10029
6 4 f 12 5 p 6 3 F 2 0.10611
7 4 f 12 5 p 6 1 G 4 0.13819
8 4 f 12 5 p 6 1 D 2 0.21423
9 4 f 12 5 p 6 1 I 6 0.26570
10 4 f 12 5 p 6 3 P 0 0.28940
Yb VI, N E = 1407,  N E 1 = 13807
1 4 f 12 5 p 5 4 I o 15/2 0.0 0.0
2 4 f 12 5 p 5 4 H o 11/2 0.020645
3 4 f 12 5 p 5 4 I o 13/2 0.021470
4 4 f 12 5 p 5 2 H o 9/2 0.024775
5 4 f 12 5 p 5 2 G o 11/2 0.036494
6 4 f 12 5 p 5 2 G o 5/2 0.072901
7 4 f 12 5 p 5 2 H o 11/2 0.074037
8 4 f 12 5 p 5 4 H o 11/2 0.082992
9 4 f 12 5 p 5 4 F o 7/2 0.093051
10 4 f 12 5 p 5 2 G o 9/2 0.103729
Lu I, N E = 148,   N E 1 = 3220
1 5 d 6 s 2 2 D 3/2 0.0 0.0
2 5 d 6 s 2 2 D 5/2 0.020658 0.018170
3 6 s 2 6 p 2 P o 1/2 0.083090 0.037691
4 6 s 2 6 p 2 P o 3/2 0.097783 0.068130
5 5 d 6 s 6 p 4 F o 3/2 0.116829 0.158809
6 5 d 6 s 6 p 4 F o 5/2 0.123975 0.168626
7 5 d 6 s 6 p 4 F o 7/2 0.137319 0.186195
8 5 d 6 s 6 p 4 F o 9/2 0.152215 0.206033
9 5 d 6 s 6 p 4 D o 1/2 0.121224 0.189202
10 5 d 6 s 6 p 4 D o 3/2 0.125580 0.193146
Config SL π 2J E(SS,Ry) E(NIST,[12],Ry)
Lu II, N E =455,   N E 1 = 22154
1 6 s 2 1 S 0 0.0 0.0
2 5 d 6 s 3 D 1 0.088774 0.107495
3 5 d 6 s 3 D 2 0.098492 0.113319
4 5 d 6 s 3 D 3 0.132393 0.129392
5 5 d 6 s 1 D 2 0.162822 0.157946
6 6 s 6 p 3 P o 0 0.235055 0.248452
7 6 s 6 p 3 P o 1 0.248583 0.259740
8 6 s 6 p 3 P o 2 0.288652 0.295736
9 5 d 2 3 F 2 0.286572 0.267974
10 5 d 2 3 F 3 0.318543 0.281482
Lu III, N E = 145,   N E 1 = 159
1 4 f 14 6 s 2 S 1/2 0.0 0.0
2 4 f 14 5 d 2 D 3/2 0.0510604 0.052011
3 4 f 14 5 d 2 D 5/2 0.0956229 0.078805
4 4 f 14 6 p 2 P o 1/2 0.342017 0.349932
5 4 f 14 6 p 2 P o 3/2 0.379465 0.407384
6 4 f 14 5 d 2 4 G o 5/2 0.741428
7 4 f 14 5 d 2 4 F o 7/2 0.743474
8 4 f 14 5 d 2 4 D o 3/2 0.745181
9 4 f 14 5 d 2 4 I o 11/2 0.758697
10 4 f 14 5 d 2 4 F o 7/2 0.766942
Lu IV, N E =1485,  N E 1 = 204567
1 4 f 14 1 S 0 0.0 0.0
2 4 f 13 5 d 3 P o 2 0.860650 0.824085
3 4 f 13 5 d 3 H o 5 0.894914 0.863590
4 4 f 13 5 d 3 D o 3 0.919319 0.886969
5 4 f 13 5 d 3 H o 4 0.934682 0.898131
6 4 f 13 5 d 3 H o 6 0.927311 0.895222
7 4 f 13 5 d 3 P o 1 0.939756 0.897644
8 4 f 13 5 d 3 P o 2 0.943373 0.908169
9 4 f 13 5 d 3 F o 4 0.971074 0.931466
10 4 f 13 5 d 3 F o 3 0.971264 0.939247
Lu V, N E =1437,  N E 1 = 182086
1 4 f 13 2 F o 7/2 0.0 0.0
2 4 f 13 2 F o 5/2 0.127518 0.107464
3 4 f 12 5 d 4 F 9/2 1.392281 1.373872
4 4 f 12 5 d 2 K 15/2 1.417875 1.412341
5 4 f 12 5 d 4 G 11/2 1.428745 1.429373
6 4 f 12 5 d 4 K 17/2 1.448544 1.448762
7 4 f 12 5 d 4 K 13/2 1.451578 1.449241
8 4 f 12 5 d 4 F 7/2 1.457972 1.476007
9 4 f 12 5 d 2 H 11/2 1.484829 1.481346
10 4 f 12 5 d 4 G 9/2 1.485680 1.483601
Lu VI, N E =873,  N E 1 = 59028
1 4 f 12 5 p 6 3 H 6 0.0 0.0
2 4 f 12 5 p 6 3 H 4 0.030443
3 4 f 12 5 p 6 3 H 5 0.055132
4 4 f 12 5 p 6 3 F 4 0.083617
5 4 f 12 5 p 6 3 F 3 0.099283
6 4 f 12 5 p 6 3 F 2 0.106151
7 4 f 12 5 p 6 1 G 4 0.133692
8 4 f 12 5 p 6 1 D 2 0.219180
Config SL π 2J E(SS,Ry) E(NIST,[12],Ry)
Lu VII, N E = 777,  N E 1 = 68947
9 4 f 12 5 p 6 1 I 6 0.280176
10 4 f 12 5 p 6 3 P 0 0.305074
1 4 f 13 5 p 4 2 H o 11/2 0.0 0.0
2 4 f 13 5 p 4 2 H o 9/2 0.0125831
3 4 f 13 5 p 4 4 F o 3/2 0.0421028
4 4 f 13 5 p 4 4 G o 7/2 0.0666561
5 4 f 13 5 p 4 4 G o 5/2 0.104410
6 4 f 13 5 p 4 4 F o 5/2 0.104410
7 4 f 13 5 p 4 4 D o 3/2 0.123075
8 4 f 13 5 p 4 4 D o 1/2 0.127465
9 4 f 13 5 p 4 2 G o 9/2 0.147603
10 4 f 13 5 p 4 4 F o 7/2 0.224123
Disclaimer/Publisher’s Note: The statements, opinions and data contained in all publications are solely those of the individual author(s) and contributor(s) and not of MDPI and/or the editor(s). MDPI and/or the editor(s) disclaim responsibility for any injury to people or property resulting from any ideas, methods, instructions or products referred to in the content.
Copyright: This open access article is published under a Creative Commons CC BY 4.0 license, which permit the free download, distribution, and reuse, provided that the author and preprint are cited in any reuse.
Prerpints.org logo

Preprints.org is a free preprint server supported by MDPI in Basel, Switzerland.

Subscribe

© 2024 MDPI (Basel, Switzerland) unless otherwise stated