Preprint
Article

Investigating Soil Water Retention and Hydrological Properties in Retrogressive Thaw Slumps in the Qinghai-Tibet Plateau, China

Altmetrics

Downloads

104

Views

61

Comments

0

Submitted:

22 November 2023

Posted:

23 November 2023

You are already at the latest version

Alerts
Abstract
Retrogressive thaw slumps (RTSs) are becoming more common on the Qinghai-Tibet Plateau as permafrost thaws, but the hydraulic characteristics of these slumps have not been extensively studied. To fill this knowledge gap, we used the ''space-for-time substitution method'' to differentiate three stages of RTSs: original grassland, collapsing, and collapsed. Our study included on-site investigations, measurements, and simulated analyses of soil water characteristics, environmental factors, and hydrological properties. Our findings show that the measurements and simulated analyses of soil water characteristics were highly consistent across RTSs, indicating the accuracy of the V-G model in reproducing soil hydraulic parameters for different stages of RTSs. The original grassland stage had the highest soil water retention and content due to its high SOM content and fine-textured micropores. In contrast, the collapsed stage had higher soil water retention and content compared to the collapsing stage, primarily due to increased proportions of soil micropores, SOM content, and lower bulk density (BD). Freeze-thaw cycles had a significant impact on the soil texture and structure of RTSs, resulting in a decrease in SOM content and an increase in BD. However, the absence of soil structure and compaction led to the subsequent accumulation of organic matter, increasing SOM content. Changes in field capacity (FC), permanent wilting point (PWP), and soil micropore distribution aligned with variations in SOM content and water content.These findings highlight the importance of managing SOM content and water content to mitigate the adverse effects of freeze-thaw cycles on soil structure and stability at different stages of RTSs. Effective management strategies may include incorporating organic matter, reducing soil compaction, and maintaining optimal water content. Further research is needed to determine the most suitable management practices for different soil types and environmental conditions.
Keywords: 
Subject: Environmental and Earth Sciences  -   Soil Science

1. Introduction

The thawing of permafrost, including seasonal permafrost, due to melting ice has significant implications for Arctic landscapes and ecosystems [1,2,3]. This phenomenon results in the formation of thermokarst landforms known as retrogressive thaw slumps (RTSs) [4,5,6,7], which are prevalent in permafrost regions globally, including the Qinghai-Tibet Plateau (QTP) in China [8,9,10]. RTSs stabilize gradually as air temperatures drop below 0 °C, and ground ice ceases to melt. Mechanical or thermal erosion triggers these RTSs, often manifesting as minor disturbances in the base or slope breaks, aligning with water flow trajectories or shallow landslides that remove insulating materials from the surface and expose the ice-rich permafrost [11,12]. Thawed materials are seasonally transferred downslope through gradual creep or episodic surface or deeper flows, resulting in periodic activity and instability in slopes affected by thaw slides [13,14,15,16,17]. Freeze-thaw cycles influence the rates of ice melting and thaw slumping in RTSs, leading to the destruction of the original soil structure. In the summer, RTSs reactivate, causing vegetation and soil on slopes to flow away and re-exposing ground ice. Climate warming can alter the rate of ice ablation and degradation by modifying the net radiative flux or sensible heat flux, thereby impacting the RTS rate of slopes [3]. Generally, the thawing of ice-rich permafrost on sloping terrain can result in the thermokarst development of RTS, initiating in the middle of a slope and advancing until stabilization [4,7,18,19,20]. RTSs significantly impact alpine meadow grasslands by modifying soil structure, vegetation coverage, soil hydraulic properties, and inducing soil erosions [21,22]. Studying soil water retention and hydraulic properties in alpine meadows at different freeze-thaw stages of RTSs is vital for understanding the mechanisms affecting water availability in these fragile ecosystems, assessing the impacts of climate change, and informing management and conservation strategies. However, the widely investigated hydraulic characteristics of RTSs and comprehensive field surveys are still lacking.
Previous investigations have revealed certain trends in alpine grassland degradation, such as an increase in soil bulk density and a decrease in soil moisture content and soil organic matter content [23]. However, the Qinghai-Tibet Plateau is characterized by temporal and spatial heterogeneity, leading to inconsistent findings regarding the factors influencing soil water retention in alpine ecosystems [24,25,26]. For instance, grassland degradation in the eastern Tibetan Plateau has been associated with a decrease in field capacity and soil water content [27]. In contrast, in Maqu County of the Qinghai-Tibet Plateau, alpine meadow degradation initially results in an increase and then a decrease in field capacity [28]. Moreover, the effects of soil texture on soil water retention have been inconsistent across different studies [24,29]. Previous research has predominantly concentrated on the effects of human-induced degradation on alpine meadow grasslands and alterations in soil water retention. However, limited field investigation has been conducted on the characteristics of degradation and changes in soil water retention resulting from natural factors such as the freeze-thaw process observed in retrogressive thaw slumps [30,31,32]. These retrogressive thaw slumps have a significant impact on land surface properties in the Qinghai-Tibet Plateau, leading to the redistribution and decrease of soil organic matter content [31,32]. Soil water retention curves (SWRCs) offer valuable insights into the water-holding capacity of soil and can be utilized to analyze the response of soil water retention to freeze-thaw cycles [33,34,35]. These curves provide a comprehensive understanding of how soil moisture content changes with varying soil water potentials, allowing for a more precise evaluation of the impact of freeze-thaw processes on soil water retention. The "space-for-time" substitution method enables a quantitative analysis of the impacts of freeze-thaw cycles and retrogressive thaw slumps on soil water retention and hydraulic properties [36]. This method involves studying sites with different stages of freeze-thaw processes, ranging from intact areas to fully degraded slumps, and inferring the temporal changes in soil water retention based on the spatial variations observed. By employing this approach, researchers can gain a better understanding of how freeze-thaw cycles and retrogressive thaw slumps influence soil water retention and the associated hydraulic characteristics. To address the gaps in knowledge, this study conducted field sampling and laboratory experiments to quantify soil water retention curves, water content, and hydraulic properties at different stages of RTSs. The Van Genuchten (VG) model was used to fit SWRCs based on experimental data and simulations [37]. Pedotransfer functions were utilized to determine the field capacity and the permanent wilting coefficient, which serve as indicators for available water in plant-soil systems [38,39,40]. The study aimed to explore the variation characteristics of soil water retention and hydraulic properties in different thaw slump stages of RTSs and analyze the factors and mechanisms through which thaw slumps influence soil water retention and hydraulic properties.

2. Methods

2.1. Study area and field investigation

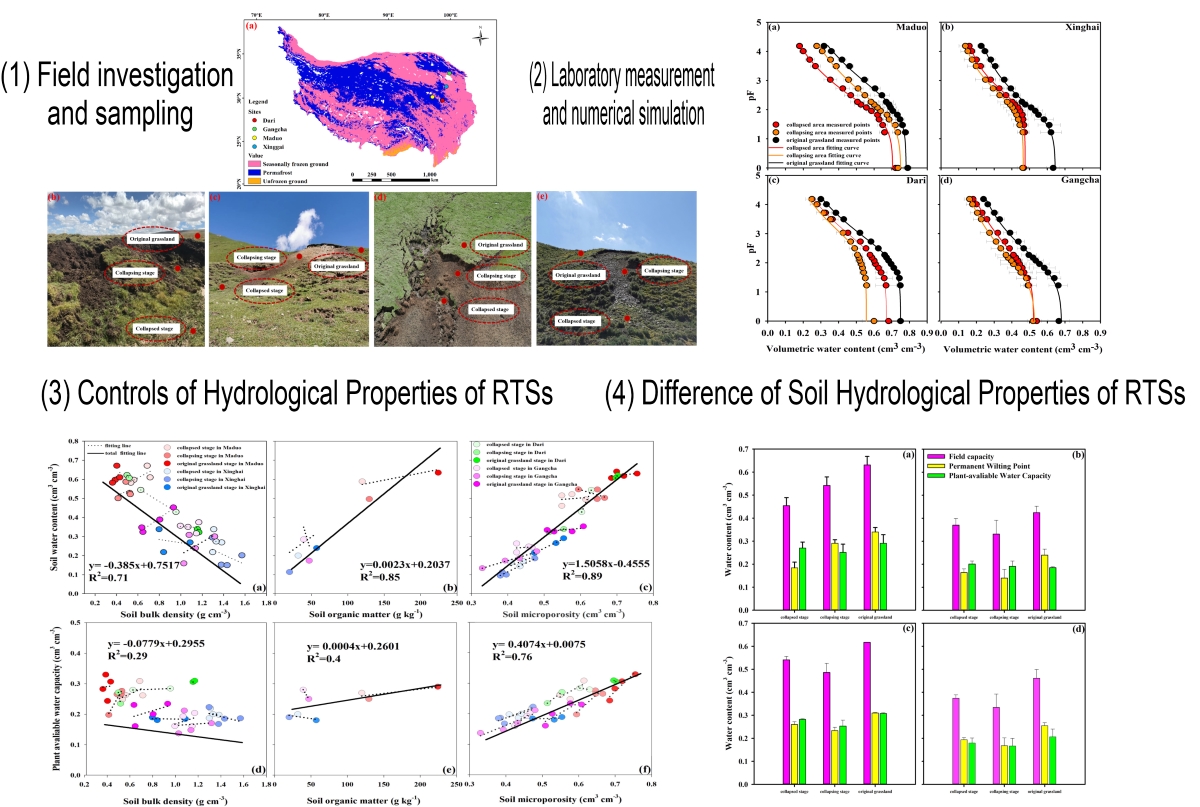
The study was conducted in typical Retrogressive Thaw Slumps (RTSs) located at various latitudes and longitudes on the northeastern QTP (Figure 1). Four representative RTS sites were selected for the study: Maduo, Xinghai, Dari, and Gangcha. These sites are considered typical examples of RTSs on the QTP, but they differ in their collapsing stages. While the Maduo site is experiencing slumping, with simultaneous slumping of soil and vegetation resulting in an increase in bare soil and a decrease in vegetation, the collapsing stage of the remaining three sites has gradually become stable, characterized by the absence of vegetation and mainly bare soil. Table 1 summarizes the land surface information for each site. Maduo has a mean annual air temperature of -1.45°C, with the highest temperature in July (8.8°C) and the lowest in January (-13.8°C). It receives an annual precipitation of 92 mm. Xinghai has a mean annual air temperature of 0.55°C, with the highest temperature in July (11.5°C) and the lowest in January (-11.9°C). Its annual precipitation is 87 mm. Dari experiences a mean annual air temperature of -3.3°C, with the highest temperature in July (8.1°C) and the lowest in January (-14.9°C). It receives an annual precipitation of 942 mm. Gangcha has a mean annual air temperature of -6.2°C, with the highest temperature in July (6.6°C) and the lowest in January (-18.9°C), and its annual precipitation is 313 mm.
All four sites have subalpine meadow soil as the predominant soil type, and the dominant species in these sites is the typical Kobresia pygmaea community, which is known for its rich organic matter content [41]. The RTSs of thermokarst landforms were classified into three stages based on field investigations, following the classification for the RTSs of Eboling Mountain on the northeastern QTP [42]. These stages are the original grassland stage, collapsing stage, and collapsed stage. Each stage represents a different degree of damage and collapse of the mattic epipedon and the Kobresia pygmaea community. In the original grassland stage, the Kobresia pygmaea community remains intact. The collapsing stage is characterized by the development of cracks and slumps in the mattic epipedon of the Kobresia pygmaea community, with vegetation starting to decrease and bare soil gradually increasing. Finally, the collapsed stage is characterized by severe damage to the mattic epipedon, resulting in little to no vegetation remaining (Figure 1b–e).
To assess the degree of alpine meadow degradation, a space-for-time method was employed. This method relies on observing long-term changes in community succession stages to infer the degradation process [21]. In total, 48 undisturbed ring cutter soil samples were collected at the three stages of the four RTSs, with four replicated soil samples collected at each stage of each site. The ring cutter soil-sampling method was used [33], where each soil sample was placed in a ring cutter and sealed with filter paper to prevent evaporation. The collected undisturbed ring cutter soil samples mainly consisted of the top 5 cm of soil at different freeze-thaw stages of the RTSs. The four study sites were primarily influenced by natural factors such as freeze-thaw cycles, precipitation patterns, and net solar radiation.

2.2. Measurement of soil water retention curves and related physical properties

Four undisturbed soil samples were collected at each stage of RTSs using a ring cutter (height = 5 cm and volume = 100 cm3) at depth of 5 cm. The SWRCs were measured using a centrifuge approach (KOKUSAN H-1400, Japan) at 22℃ (room temperature). The centrifuge had the capacity to test four soil samples simultaneously. Different centrifugal forces were applied to each soil sample, and soil water content was determined once equilibrium was achieved under the respective centrifugal force. This fast and accurate centrifuge allowed the determination of SWC under multiple centrifugal forces, which could be used to fit SWRCs eventually. Although the method of measuring SWRCS through centrifugation is more precise, it is also time consuming and labor intensive. The rotational speed of the centrifuge was converted to the soil matrix potential [43]. Rotational speeds of 300, 400, 500, and 600 rpm (revolutions per minute) etc were set according to different time intervals such as 20 min, 30 min, 1 h, and 1.5 h etc, respectively. After reaching equilibrium, the centrifuged soil samples were weighed, and a laboratory oven was used to dry them at 105℃ for 24 h. This drying process allowed the determination of dry soil weight. The gravimetric water content of soil was measured at each rotation speed (suction) and subsequently used to calculate the volumetric water content (θv).
The BD and mass water content (θm) of soil samples were determined using the oven method [44]. The θv value of the soil was derived from θm using the following formula:
θ v = θ m ρ b ρ w
where ρ b represents the BD of the soil and ρ w denotes the density of water.
ρ b = m 1 v
where m1 represents the dry soil weight and v represents the volume of the ring cutter.
θ m = m 2 m 1 m 1 × 100 %
where m2 represents the original weight of the soil.
The rotational speed of the centrifuge is converted into matric soil water potential, and the rotational speed is usually expressed in units of angular velocity, such as radians per second (rad s-1). The equation used to calculate the average distribution of matric soil water potential is as follows [43]:
h ¯ = k 6 ω 2 L g L 3 r e
g represents the acceleration of gravity (9.8 m s-2) and k is a constant with a value equal to 0.098kPa cm-1, L is the length of soil (cm), ω represents the angular velocity (rad s-1), re is the outer radius of the centrifuge.
pF is the abbreviation for soil suction and the use of pF originated from the study of soil water retention curves, and it can be converted from matric soil water potential [43]. The specific formula is as follows:
p F = l o g 10 ψ
pF is soil suction and ψ is matric soil water potential.
The Walker-Black method was used to determine the soil organic carbon content, which was then converted into SOM content in this study [45,46].

2.3. Simulation of soil water retention curves with associated soil hydraulic properties

The VG model and experimental data were employed to fit SWRCs and effectively depict the relations between matric suction and SWC [37].
θ v θ r θ s θ r = 1 1 + α h n m
where θv denotes the volumetric water content (cm3 cm-3); θs denotes the saturated water content (cm3 cm-3); θr denotes the residual water content (cm3 cm-3); h denotes the pressure head (cm); α (cm3 cm-3), n, and m denote the parameters fitted by the VG model and are used to fit the shape of soil water characteristic curves, and m is obtained by n (m = 1 − 1/n).
The VG model can be utilized to fit SWRCs, which in turn enables the estimation of soil hydraulic parameters. By analyzing the characteristics of these curves, the volumetric water content corresponding to matrix potentials of -337.1 and -15352.19 represents the field capacity (FC) and permanent wilting point (PWP), respectively. The plant available water capacity (PAWC) is determined as the difference between FC and PWP. To estimate the plant available water (PAW), the difference between measured soil moisture content (SWC) and PWP. The soil water storage (SWS) and plant available water storage (PAWS) for the 5 cm soil layer at the ground surface can be calculated using the following equations [47]:
S W S 5 c m = S W C × ρ b × d × ρ W 1 × U C F
P A W S 5 c m = P A W × ρ b × d × ρ w 1 × U C F
where SWS5cm denotes the soil water storage in the top 5 cm deep layer of the ground surface (mm), ρ b   denotes the BD (g cm-3), d denotes the thickness of the soil layer (cm), ρ W denotes the water density (g cm-3), and UCF denotes a unit conversion factor (10 mm cm-1).
In the study, the soil pore-size distributions were also determined from SWRCs and the pore diameter was calculated using Jurin’s law equation. The specific equation, as provided by Gao et al (2019) [48], is presented below:
d e = 4 v c o s α ρ w g h
where de denotes the pore diameter (μm), h denotes the pressure head (cm), v denotes the water surface tension (75 × 10-3 N m-1), α denotes the contact angle between the soil and water and is set to zero in the study, ρ W denotes the water density (103 kg m-3), and g denotes the acceleration of gravity (10 m s-2). Using these values, Equation (9) can be simplified as follows:
d = 3000 h
In this study, soil pores were categorized into three groups according to their diameters: micropores (<30 μm), mesopores (30-100 μm), and macropores (>100 μm) [49]. Consequently, in accordance with Equation (8), mesoporosity was calculated based on the SWC in the range of 30-100 cm in absolute value, whereas microporosity was determined based on the SWC at a pressure head of 100 cm in absolute value. Macroporosity was derived by subtracting the combined values of mesoporosity and microporosity from the saturated water content (θs).

2.4. Evaluation of simulation performances

SWRCs were simulated using the VG model in MATLAB R2020b (Math Works Inc., MA, USA). The simulation effect of the VG model was evaluated using the coefficient of determination (R2) and root mean square error (RMSE). The fitting parameters, SWC, proportion of pore size, and SOM in different thaw slump stages of RTSs were compared. One-way analysis of variance (ANOVA) and least significant difference methods were used to compare the fitting hydraulic parameters, soil water retention, SWC, soil hydraulic properties, soil pore-size distribution, and SOM for different RTSs sites and its thaw slump stages. Pearson correlation was used to quantify the relations between SOM content, soil properties, and soil water retention and content.

3. Results

3.1. Observed soil hydraulic properties changes in different freeze-thaw slump stages

The SWC was measured at the 5cm depth from the ground surface during the three stages of thaw collapse at four RTS sites: Maduo, Xinghai, Dari, and Gangcha (Table 2). At the Maduo site, the average SWC values were 0.66, 0.53, and 0.62 cm3 cm-3 during the original grassland, collapsing, and collapsed stages, respectively. Similarly, at the Xinghai site, the SWC values were 0.31, 0.19, and 0.27 cm3 cm-3, respectively. At the Dari site, the SWC values were 0.61, 0.33, and 0.52 cm3 cm-3, respectively. At the Gangcha site, the measured SWC values were 0.34, 0.18, and 0.24 cm3 cm-3, respectively. Notably, the SWC was the lowest during the collapsing stage, and the highest SWC was observed during the original grassland stage for all the four RTS sites. The decrease in SWC during the collapsing stage for all the four RTSs was attributed to thaw collapse caused by increased freeze-thaw action, causing a reduction in vegetation cover and destruction of soil structures. The degree of collapse increased with increasing thaw slumps, resulting in an initial decrease and then an increase in the ground surface SWC. Changes in soil BD were observed across the three freeze-thaw stages at the four RTS sites (Table 2). At the Maduo site, the BD values were 0.4, 0.49, and 0.62 g cm-3 for the original grassland stage, collapsing stage, and collapsed stage, separately. At the Xinghai site, the BD values were 0.91, 1.42, and 1.33 g cm-3, respectively. At the Dari site, the values of BD were 0.51, 1.16, and 0.79 g cm-3, respectively. At the Gangcha site, the BD values were 0.75, 1.14, and 1.09 g cm-3, respectively. The SOM content at the Maduo and Xinghai sites of the RTS for the original grassland stage, collapsing stage, and collapsed stage were 224.23, 129.52, and 119.87 g kg-1 and 57.15, 19.84, and 31.72 g kg-1, respectively (Table 2). The changes in soil BD at each freeze-thaw stage were opposite to those of SWC but consistent with those of the SOM content.

3.2. Simulation of soil water retention curves and associated soil hydrological properity

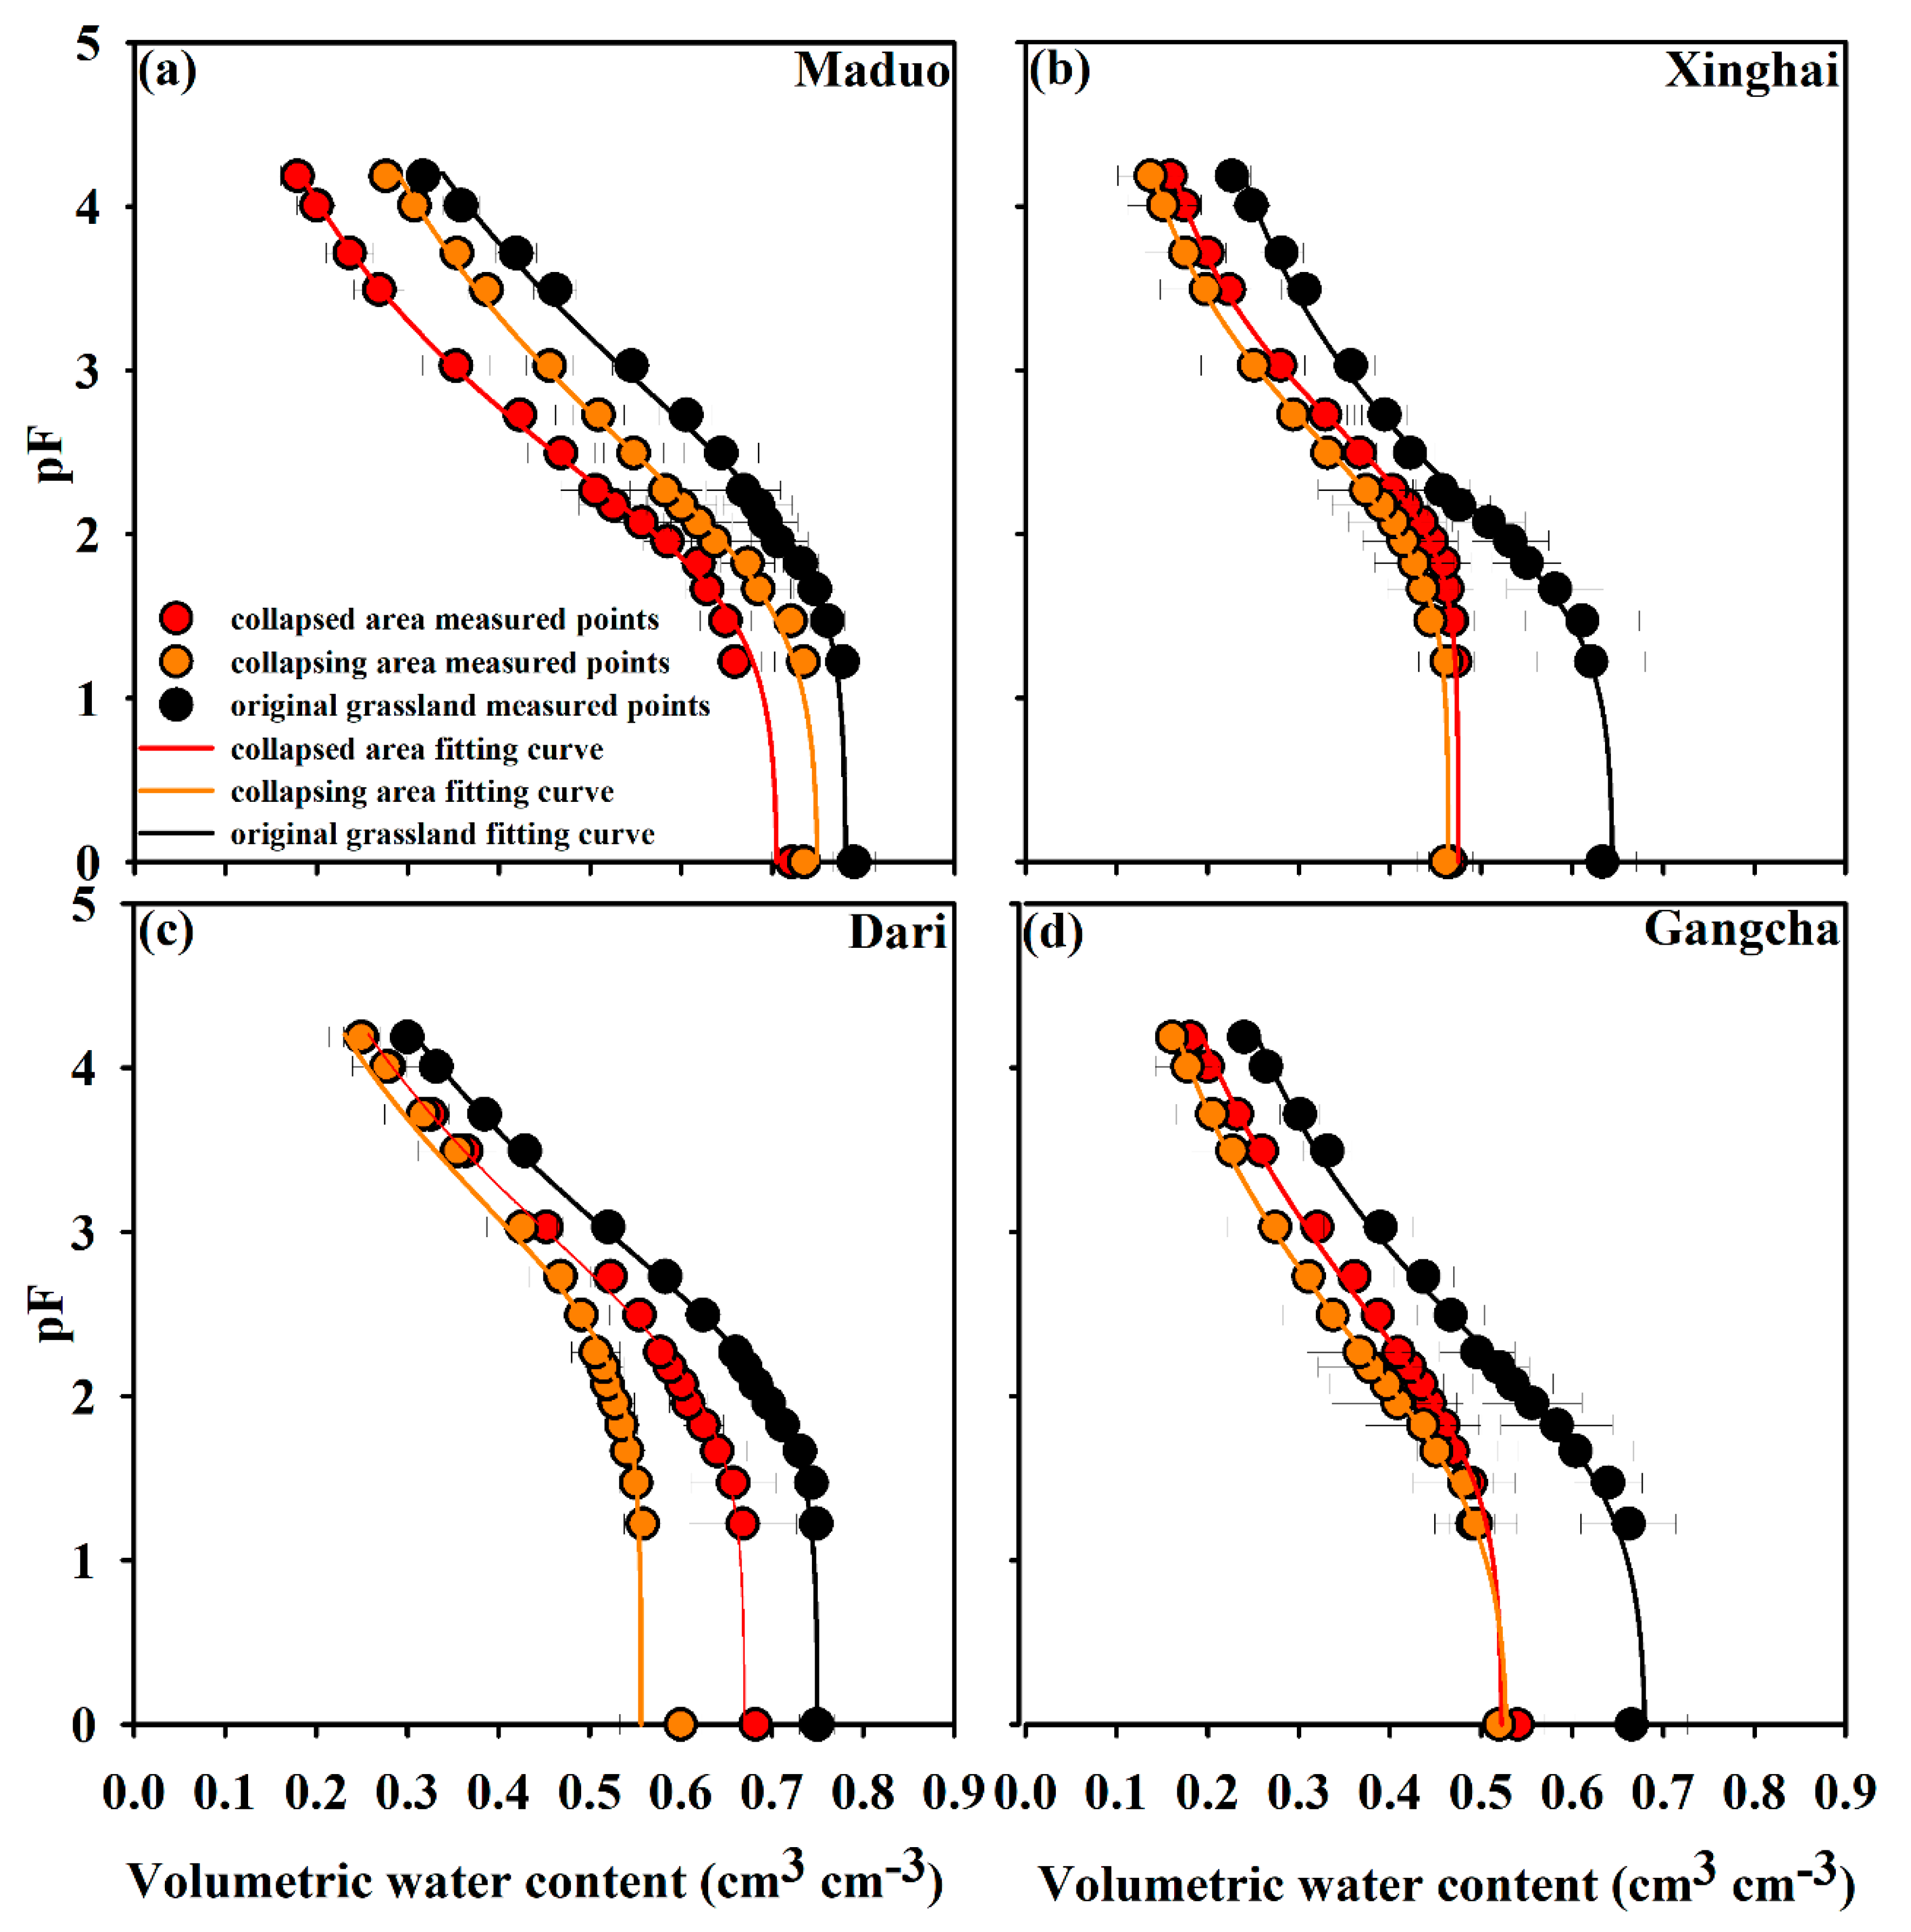
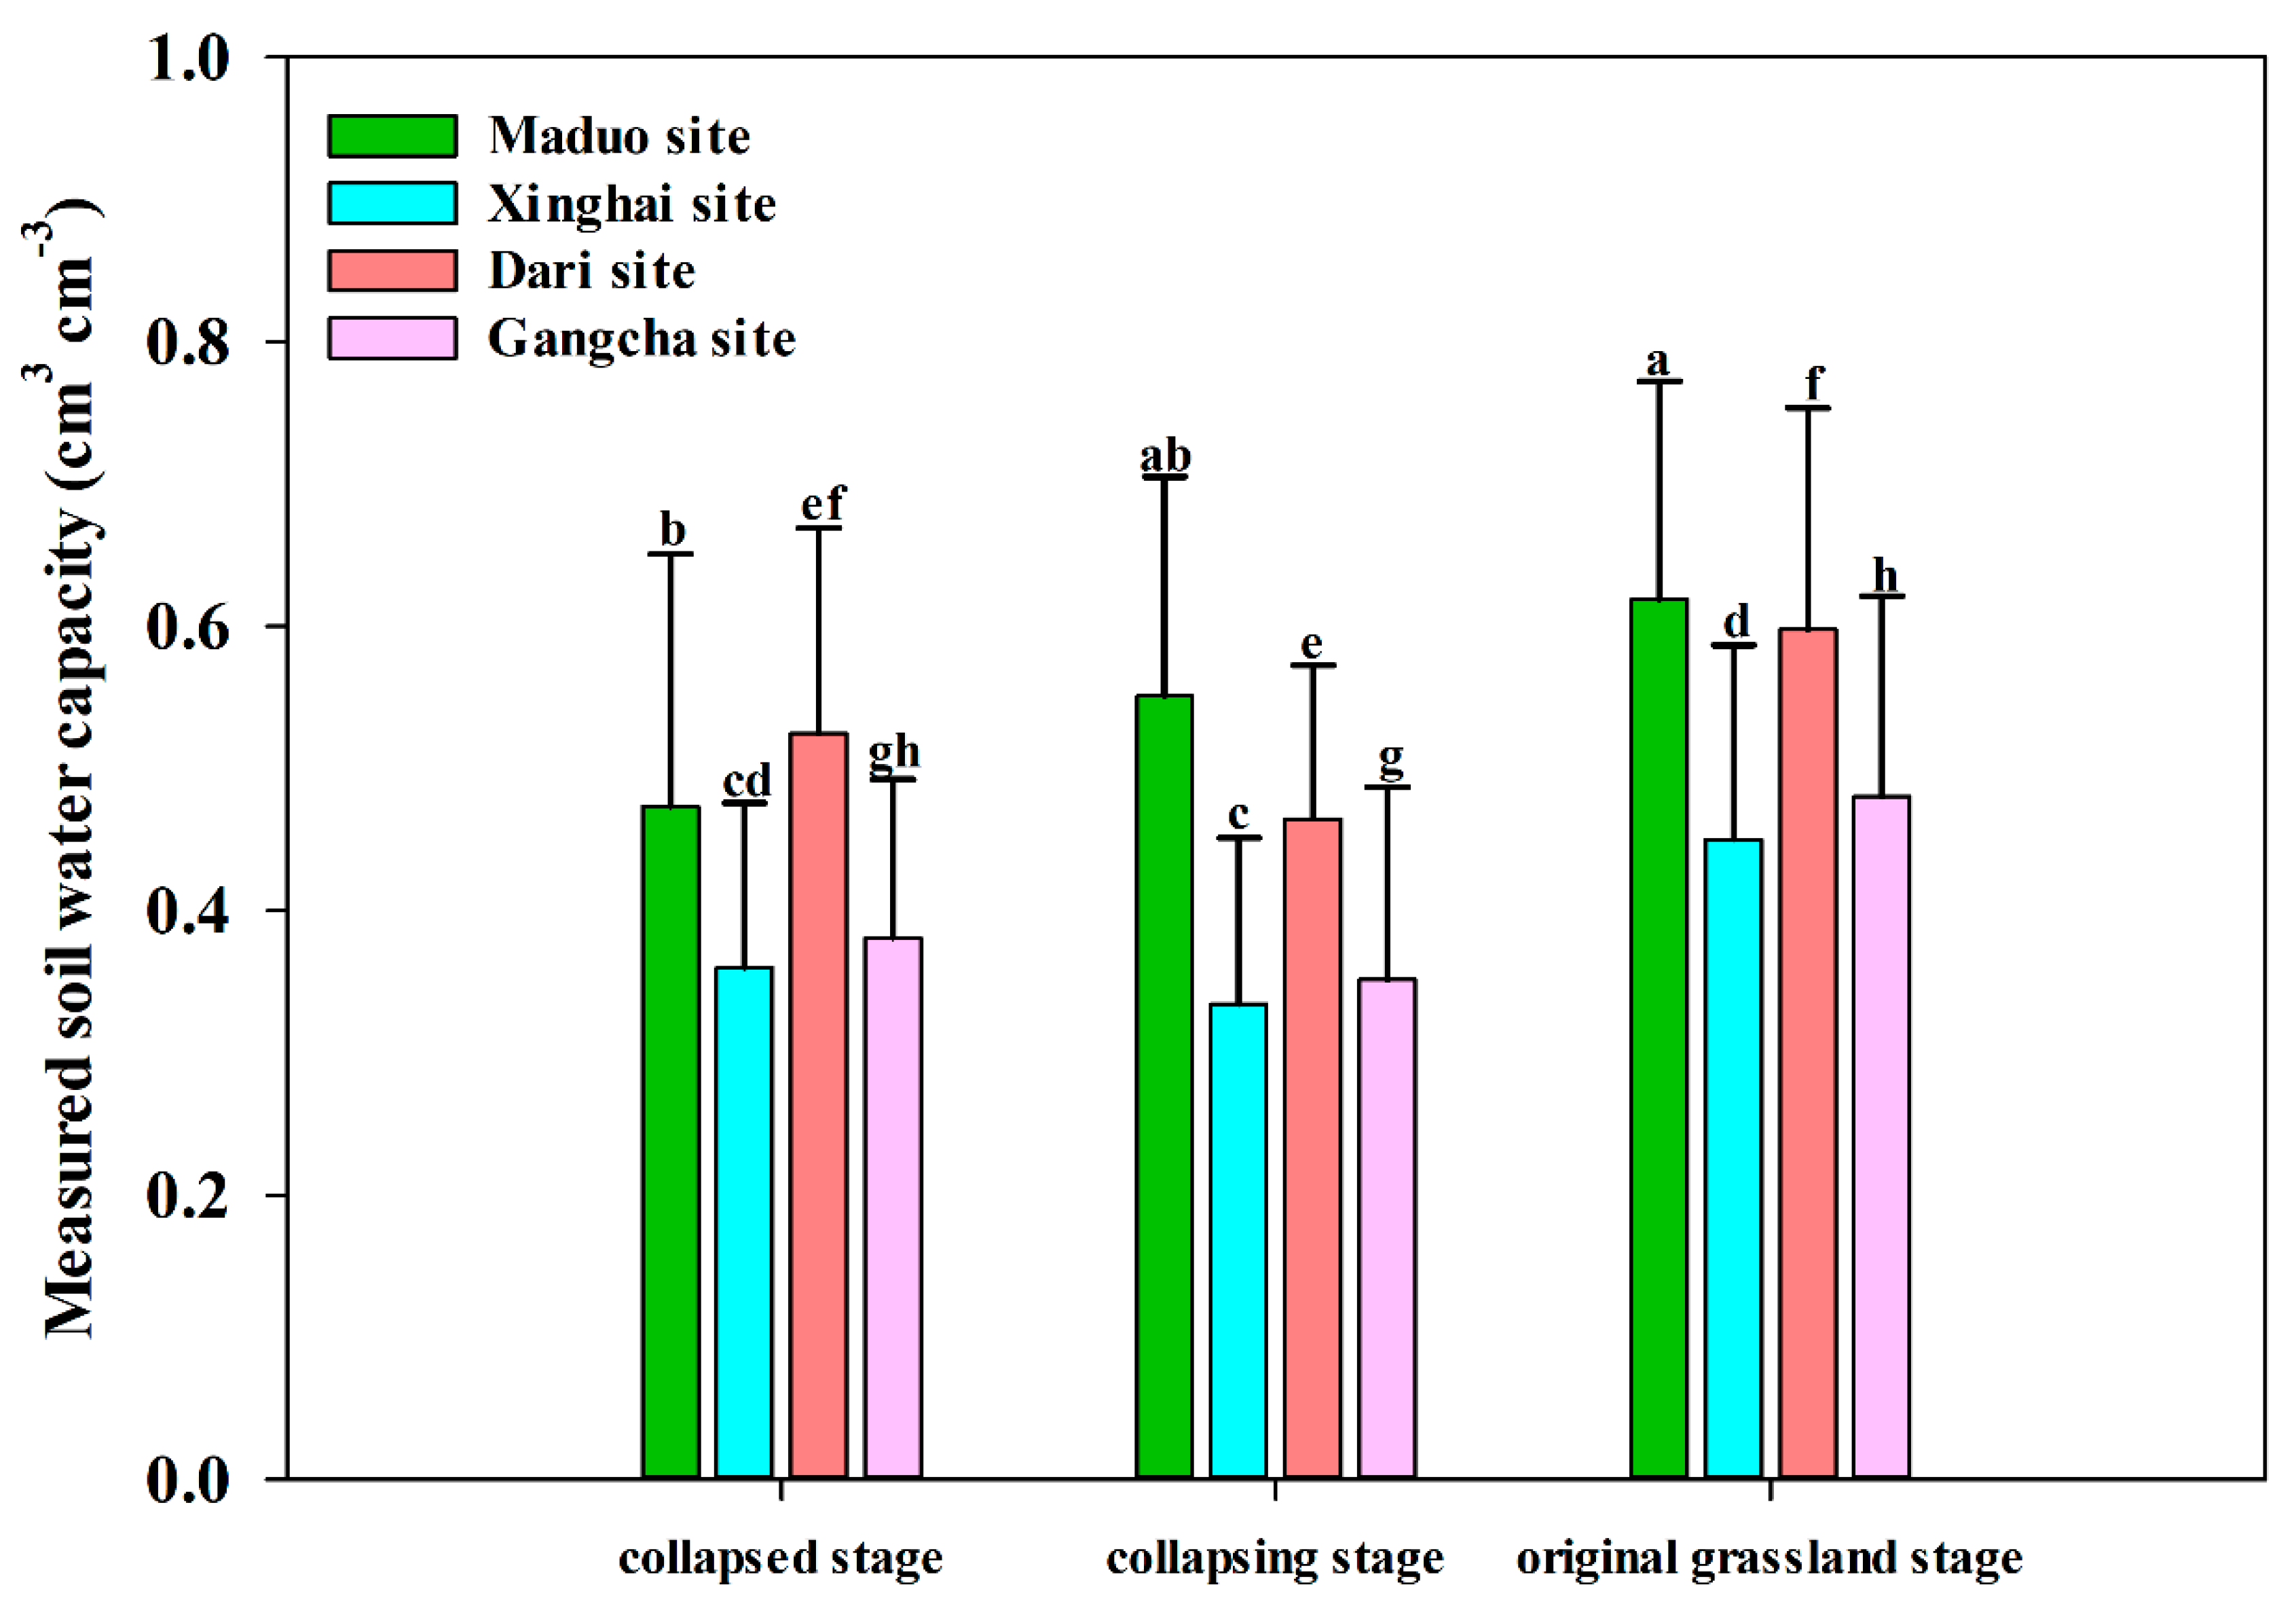
The simulation results demonstrate excellent performance for SWRCs, exhibiting a high coefficient of determination (R2) of 0.99 and a negligible RMSE of less than 0.01 cm3 cm-3 (Table 3). These findings indicate that the VG model possesses the capability to accurately reconstruct SWRCs for soils in varying thaw collapse stages of QTP RTSs (Figure 2). Specifically, it is observed that as SWC increases, the soil water retention also increases under a specific suction level. ANOVA with single-factor and subsequent multiple comparison tests reveal significant disparities in the SWRCs for different freeze-thaw collapse stages, particularly at the Maduo site (Figure 3). soil water capacity indicates the corresponding soil water content under different soil suction forces. Notably, a significant difference in soil water holding content is observed between the collapsed stage and the original grassland stage at the Maduo site (P < 0.05). Conversely, significant differences are observed between the original grassland stage and the collapsing stages at the other RTSs, with probabilities of 0.029, 0.024, and 0.013 at the Xinghai, Dari, and Gangcha sites, respectively. For the four RTSs (Maduo, Xinghai, Dari, and Gangcha), the original grassland stage exhibits the highest soil water retention than the other stages. By contrast, the degree of thaw collapse is relatively mild at the Maduo site compared to the other three sites, where the collapsing stages experience severe thaw collapse and lack vegetation cover. Consequently, water retention in the collapsing stage of the Maduo site surpasses that in the collapsed stage, while the opposite is observed in the other three RTSs. The SWRCs of the Maduo site clearly demonstrate that the original grassland stage possesses the strongest soil water retention capacity, followed by the collapsing stage, and finally, the collapsed stage with the lowest water retention capacity. Based on the analysis of SWRCs, it can be concluded that the original grassland stage in the four representative RTSs of QTP exhibits the highest soil water retention. However, the soil water retention in the collapsing and collapsed stages primarily depends on the presence or absence of vegetation cover during the collapsing stage.
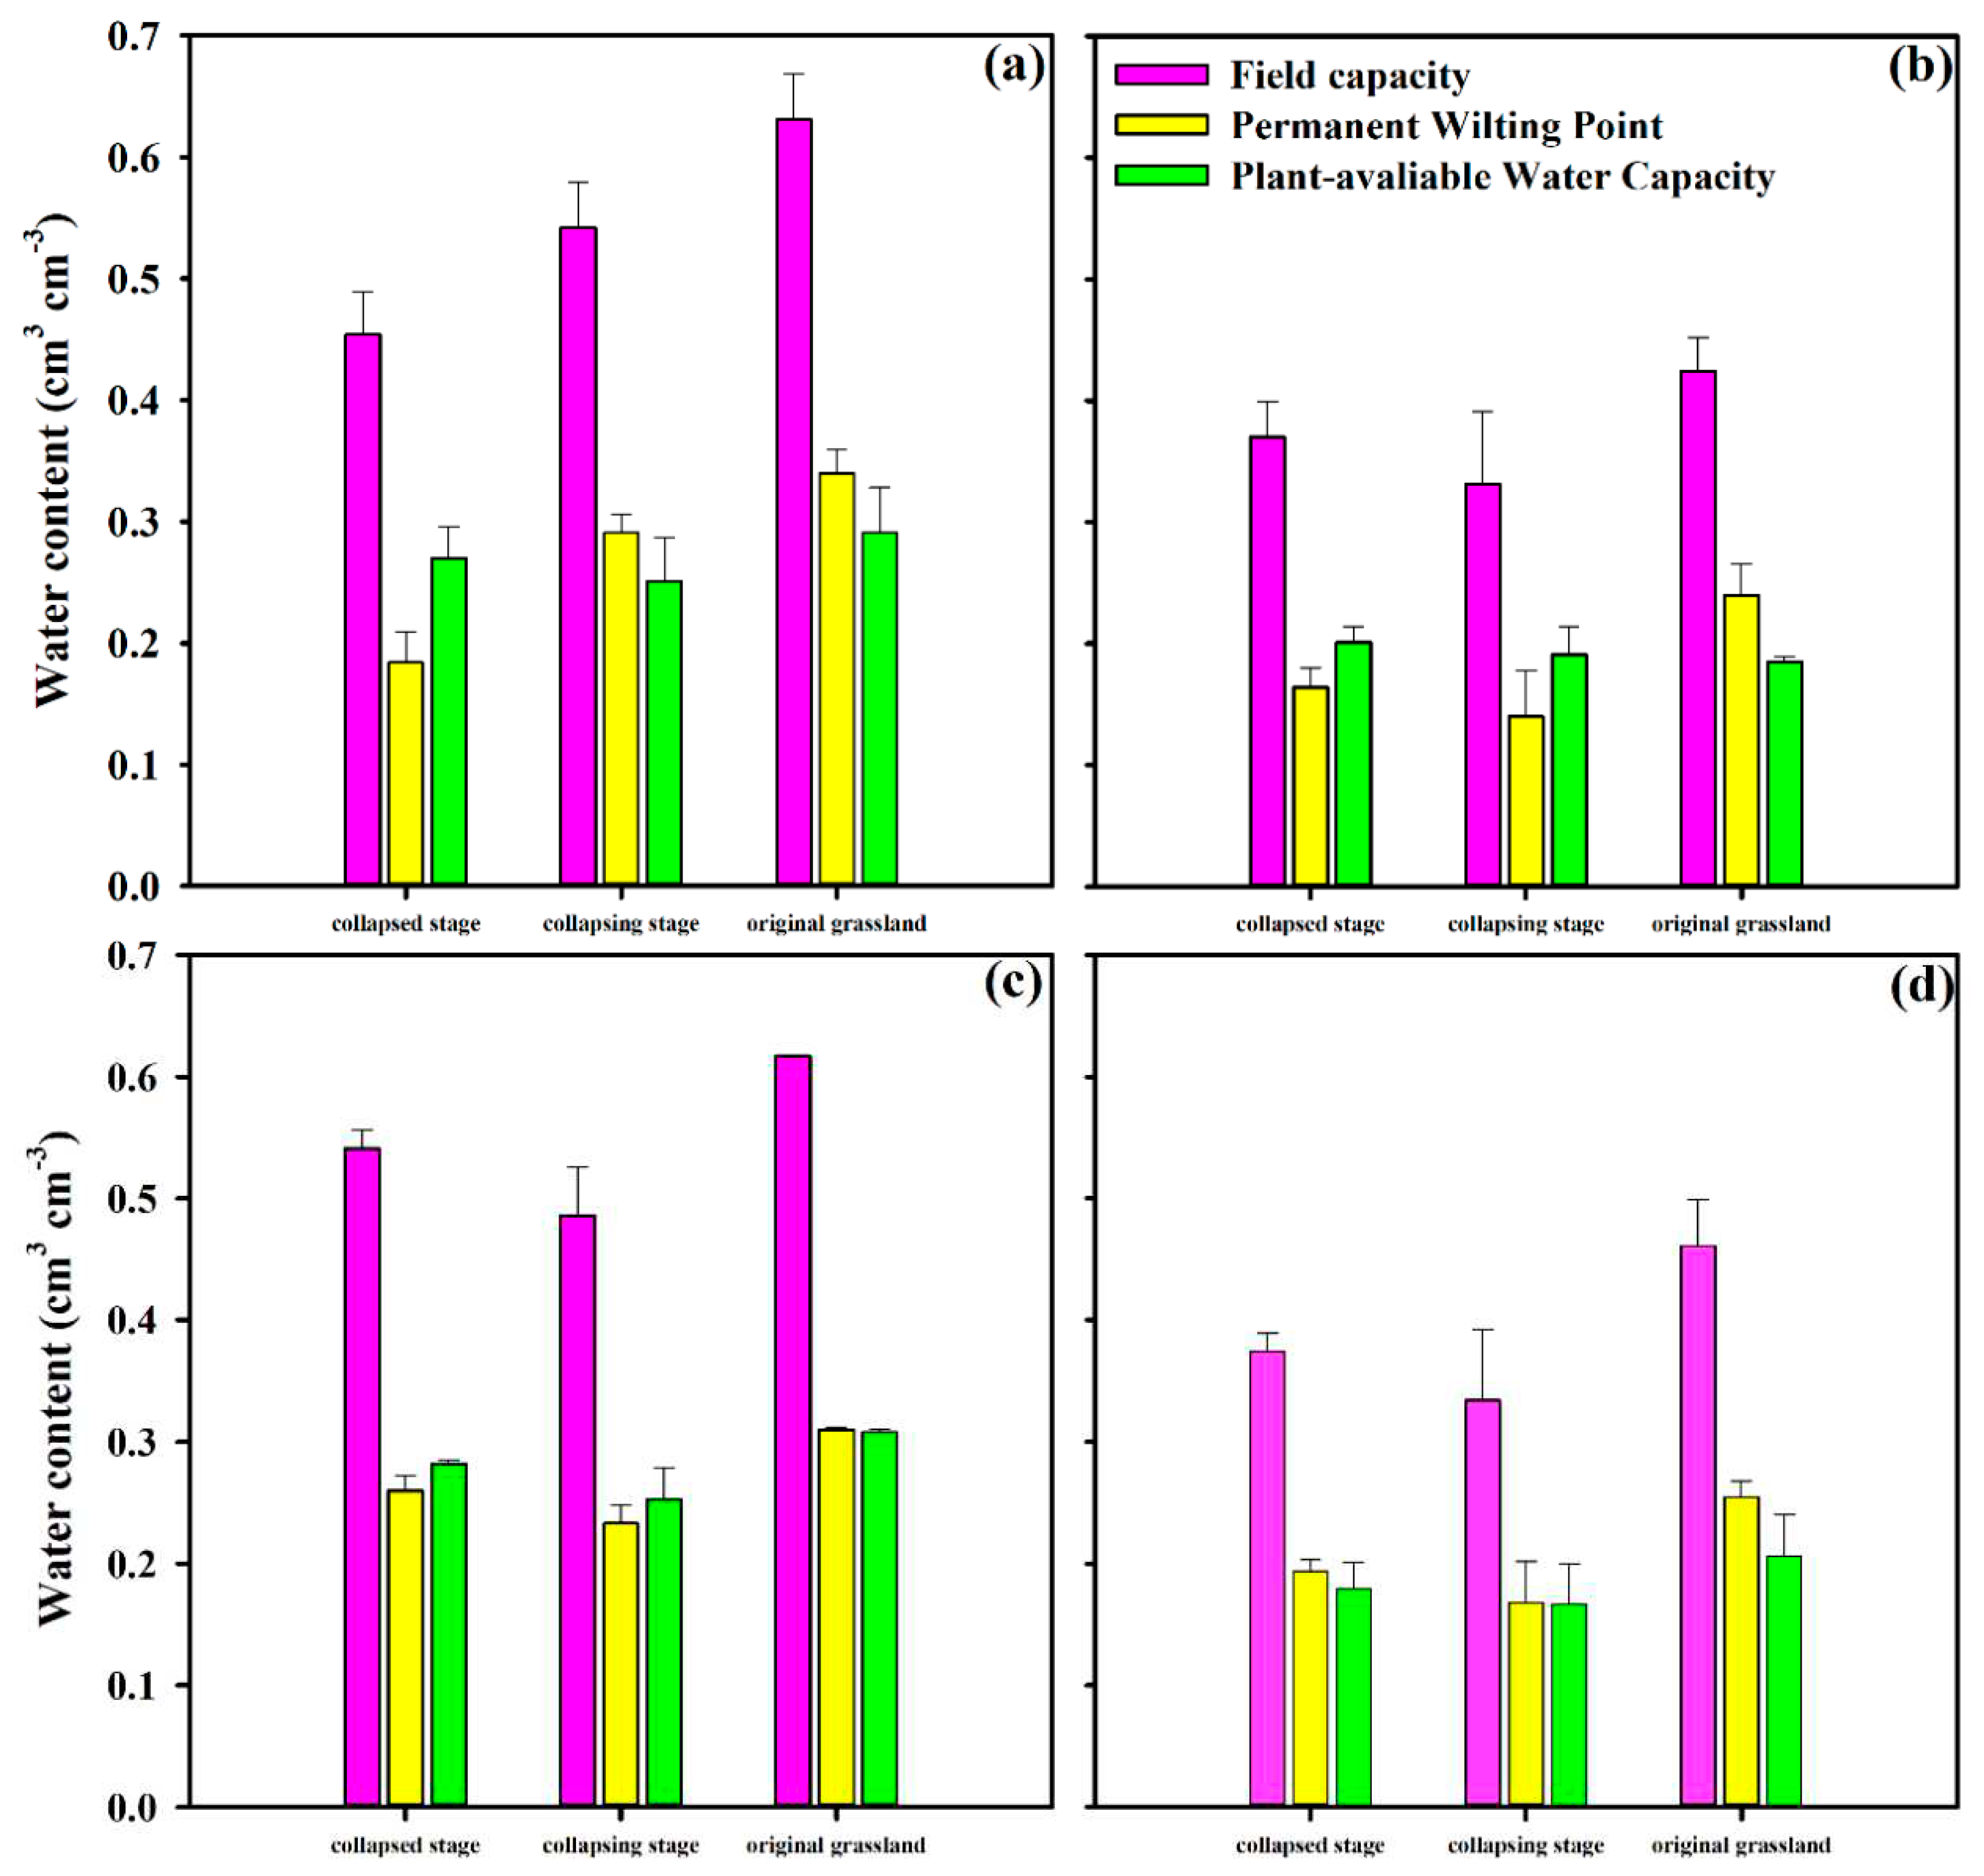
The model has demonstrated that the related parameters (such as θs and θr) possess reasonable values, accurately representing soil hydraulic properties. The fitting parameters of SWRCs are explicitly presented in Table 3. The θs values of Maduo, Xinghai, Dari, and Gangcha in the three different stages of thaw slump (the collapsed stage, collapsing stage, and original grassland stage) are as follows: 0.71, 0.75, and 0.78 cm3 cm-3; 0.48, 0.46, and 0.65 cm3 cm-3; 0.67, 0.56, and 0.75 cm3 cm-3; and 0.52, 0.53, and 0.68 cm3 cm-3, respectively. Generally, there is a gradual decrease in saturated water content from the original grassland to the collapsed stage. Compared to the collapsed stage, the original grassland exhibits a 10% higher soil-saturated water content at the Maduo site, a 26% higher content at the Xinghai site, an 11% higher content at the Dari site, and a 23% higher content at the Gangcha site. The FC, PWP, and PAWC at the three different stages of thaw slump at the RTS sites were determined using SWRCs (Figure 4). As the intensity of freeze and thaw collapse increases, FC decreases from 0.63 to 0.45 cm3 cm-3, indicating a 29% decrease from the original grassland stage to the collapsed stage at the Maduo site. At the Xinghai site, FC decreases from 0.52 to 0.41 cm3 cm-3 and then to 0.44 cm3 cm-3, resulting in an overall reduction of 15%. In the Dari site, FC decreases from 0.62 to 0.49 cm3 cm-3 and then to 0.54 cm3 cm-3, with an overall decrease of 13%. At the Gangcha site, FC decreases from 0.46 to 0.33 cm3 cm-3 and then to 0.37 cm3 cm-3, exhibiting an overall reduction of 20%. FC decreases by 21%, 21%, and 28% from the original grassland to the collapsing stage in the Xinghai, Dari, and Gangcha sites, respectively. In contrast to the changes in Maduo’s FC, the FC of the other three RTS sites (Xinghai, Dari, and Gangcha) demonstrates a pattern of initial decrease followed by an increase, resulting in overall reductions of 15%, 13%, and 20%, respectively. The changes in PWP from the original grassland stage to the collapsed stage follow the same trend as FC. PWP exhibited a gradual decrease from 0.34 to 0.18 cm3 cm-3, resulting in an overall reduction of 47%. In the remaining three sites, it decreased from 0.24 to 0.14 cm3 cm-3, then increased to 0.16 cm3 cm-3 at the Xinghai site, leading to an overall decline of 33%. At the Dari site, it decreased from 0.31 to 0.23 cm3 cm-3, followed by an increase to 0.26 cm3 cm-3, resulting in an overall decrease of 17%. Similarly, at the Gangcha site, it decreased from 0.25 cm3 cm-3 to 0.17 cm3 cm-3, then increased to 0.19 cm3 cm-3, resulting in an overall decline of 24%. PAWC first decreased and then increased (except for the Xinghai site, where it steadily decreased) from the original grassland stage to the collapsed stage of the RTSs in all four sites. In the Maduo site, PAWC dropped from 0.29 to 0.25 cm3 cm-3, then increased to 0.27 cm3 cm-3, resulting in an overall decrease of 7%. In the Xinghai site, PAWC continuously increased from 0.18 cm3 cm-3 to 0.19 cm3 cm-3 and further to 0.20 cm3 cm-3, experiencing an 11% increase. At the Dari site, PAWC first decreased from 0.31 cm3 cm-3 to 0.25 cm3 cm−3 and then increased to 0.28 cm3 cm-3, resulting in an overall decrease of 10%. At the Gangcha site, it decreased from 0.21 to 0.17 cm3 cm−3 and further to 0.18 cm3 cm-3, indicating a 14% decrease. Overall, FC, PWP, and PAWC values in the original grassland stage of each RTS site were greater than those in the collapsing and collapsed stages. Consequently, the values of FC, PWP, and PAWC decreased as the intensity of freeze-thaw slumping increased, particularly during the collapsing stage.

3.3. Plant available water, soil water storage and plant available water storage changes across thaw slump stages

As shown in Figure 4, the variation characteristics of PAW are observed during freeze-thaw cycles at the three stages. At the Maduo site, the PAW values for the original grassland, collapsing, and collapsed stages were measured as 0.44, 0.23, and 0.16 cm³ cm-³, respectively. At the Xinghai site, the PAW values were measured as 0.02, 0.00, and 0.01 cm³ cm-³, respectively. At the Dari site, the PAW values were measured as 0.30, 0.10, and 0.23 cm³ cm-³, respectively. At the Gangcha site, the PAW values were measured as 0.08, 0.01, and 0.05 cm³ cm-³, respectively. The results showed that among the four RTS sites, the highest PAW value was observed at the original grassland stage, followed by the collapsed stage, and the smallest value in the collapsing stage. Therefore, compared with the collapsed stage, the original grassland stage exhibited higher PAW values, suggesting that thaw slumps are unfavorable for plant growth. Table 4 presents the changes in SWS and PAWS across three freeze-thaw slump stages (from the original grassland stage to the collapsed stage) at the four RTS sites. At the Maduo site, the SWS values at a soil depth of 5 cm for the original grassland, collapsing, and collapsed stages were measured as 12.40, 12.74, and 15.50 mm, respectively. At the Xinghai site, the SWS values were measured as 11.83, 8.52, and 17.96 mm, respectively. At the Dari site, the SWS values were measured as 15.56, 19.14, and 19.36 mm, respectively. At the Gangcha site, the SWS values were measured as 12.38, 10.26, and 13.08 mm, respectively. Based on the these data, the SWS value at a depth of 5 cm is the highest at the collapsed stage. At the Maduo site, the PAWS values at the 5 cm deep soil for the original grassland, collapsing, and collapsed stages were 8.80, 5.63, and 4.96 mm, respectively. At the Xinghai site, the values were 0.94, 0.00, and 0.40 mm, respectively. At the Dari site, the values were 7.65, 5.80, and 9.90 mm, respectively. At the Gangcha site, the values were 3.00, 0.57, and 2.70 mm, respectively. The values of SWS and PAWS were influenced by the complex freeze-thaw action and soil BD, and they did not exhibit a consistent trend across different freeze-thaw stages at the four RTS sites.

3.4. Relations of soil water retention and content with soil hydraulic properties

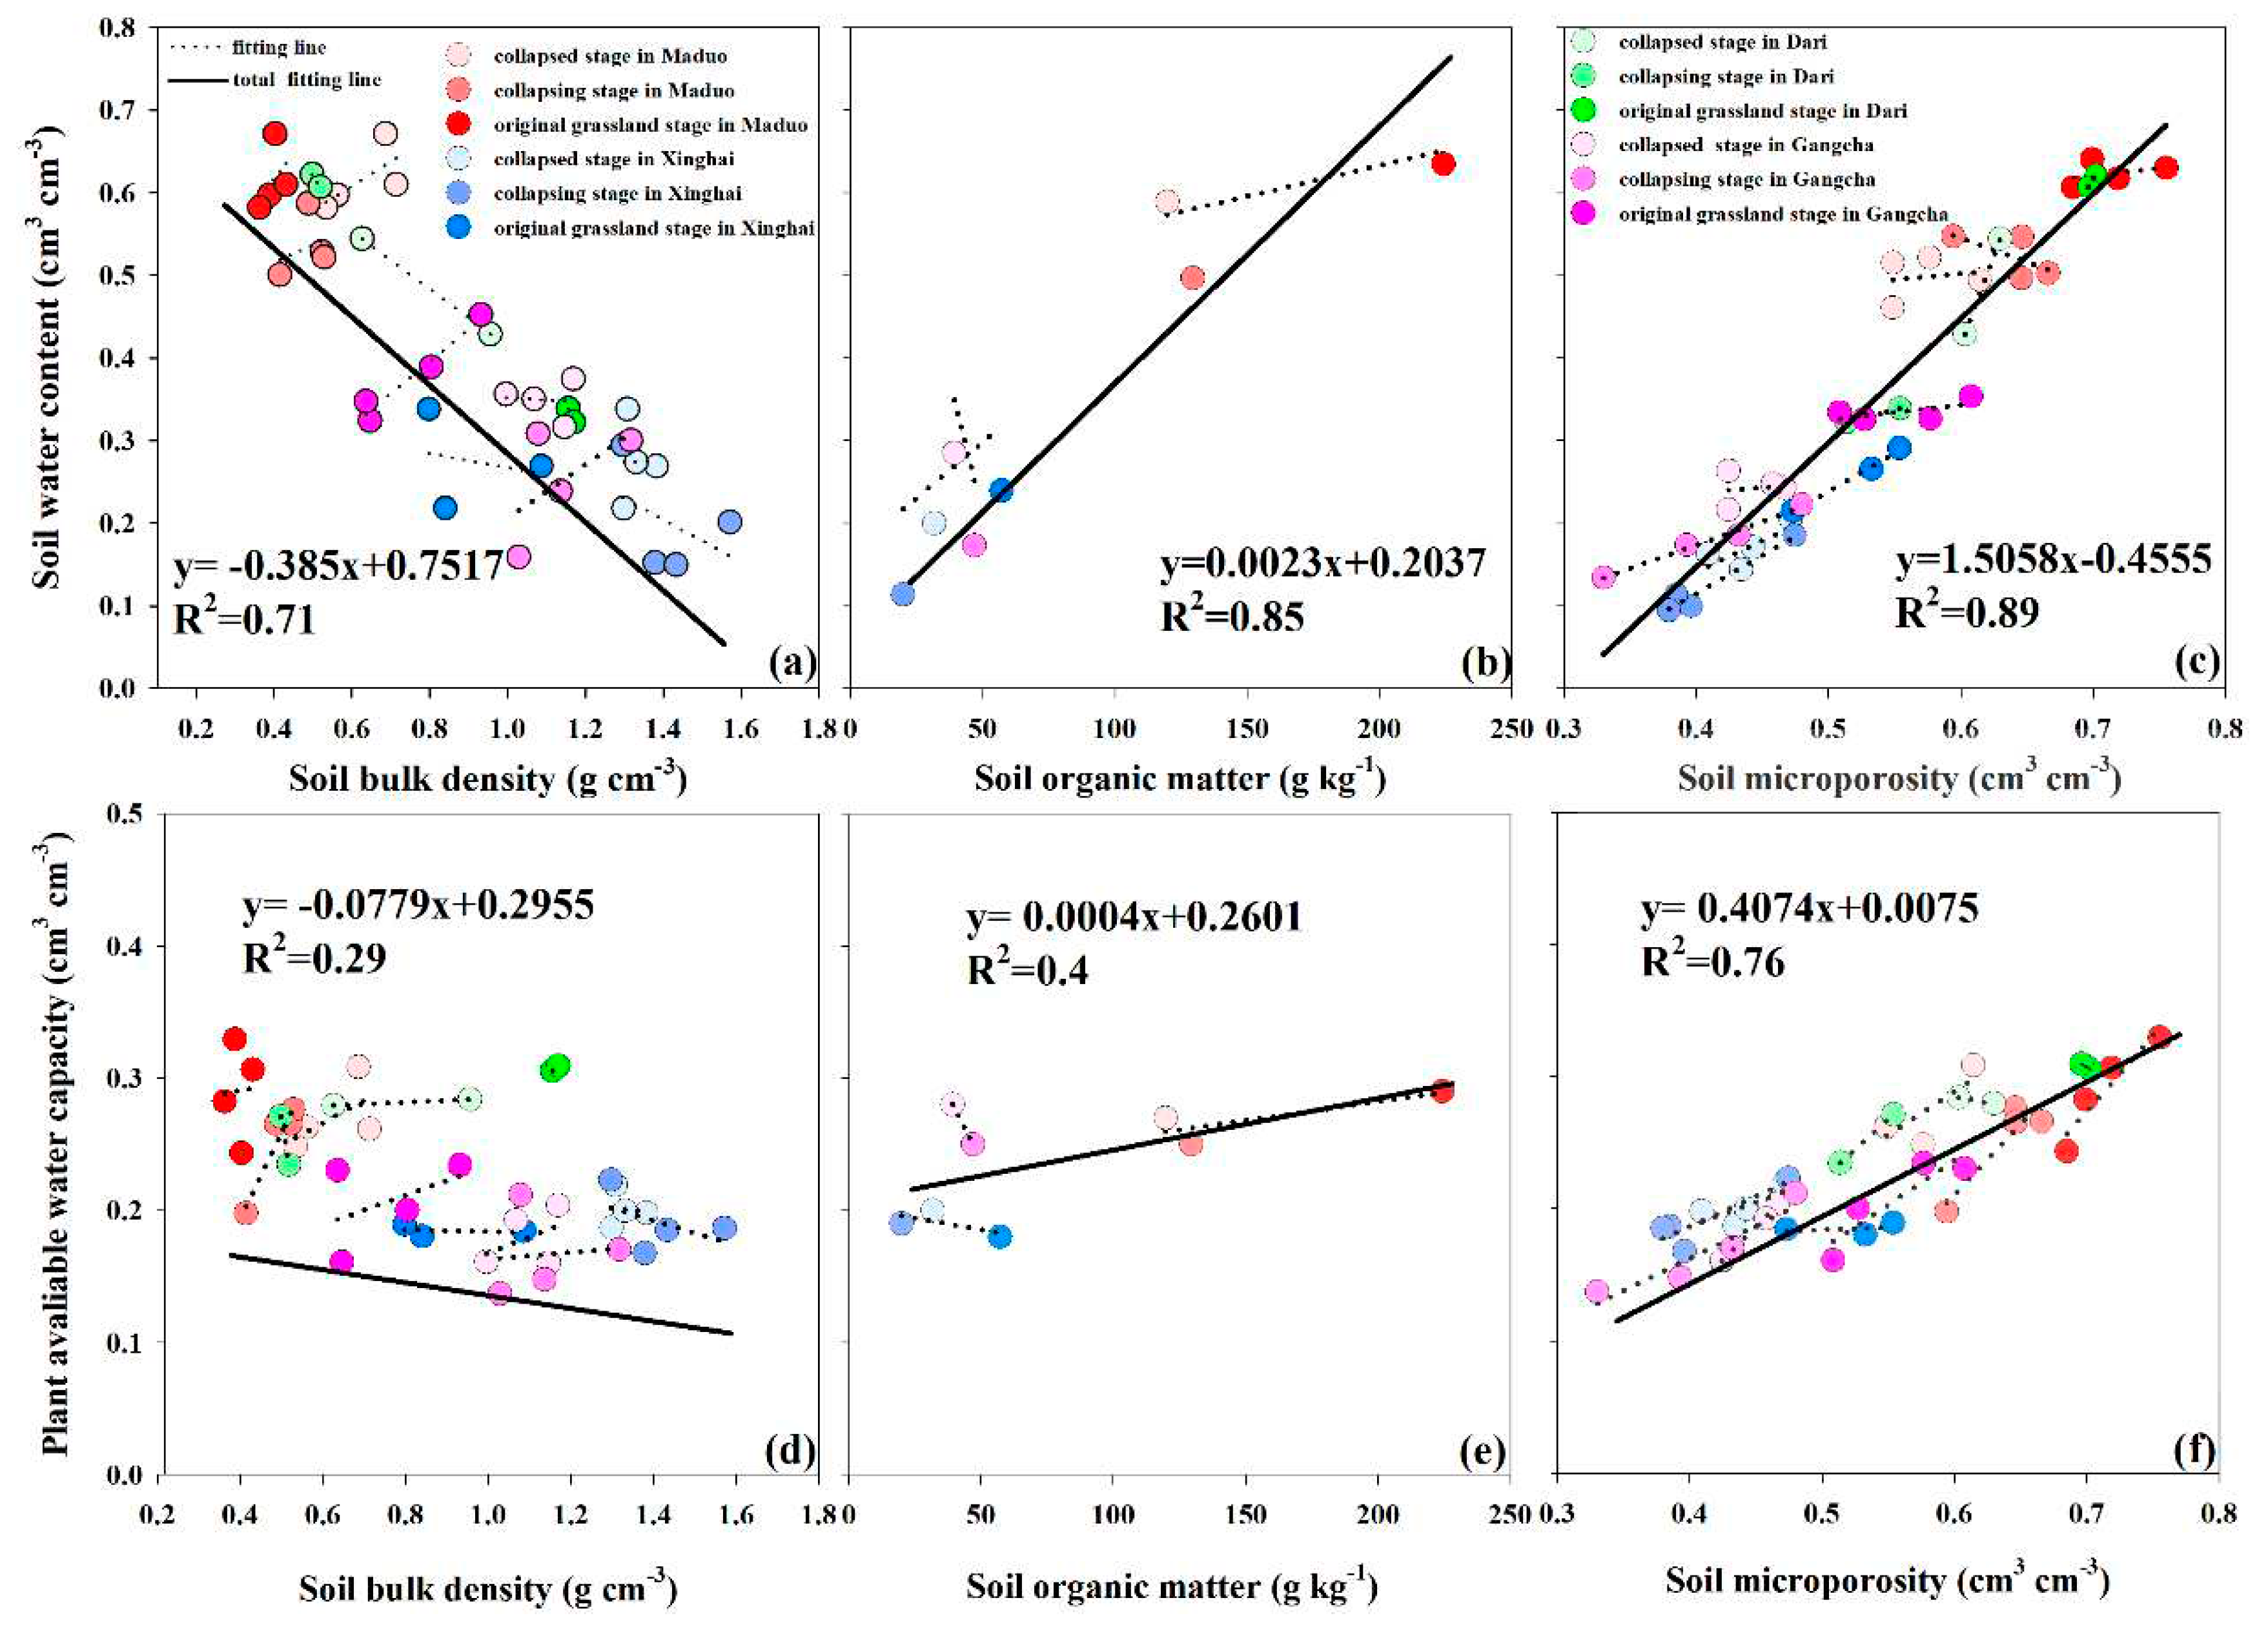
Figure 5 illustrates the results of a linear correlation analysis examining the relationship between soil water holding capacity, plant available water capacity, and several influencing factors. The results reveal that, among the several factors examined, soil BD exhibits a negative correlation with both SWC and PAWC, with correlation coefficients (R2) of 0.71 and 0.29, respectively. Conversely, SOM and soil microporosity display a significant positive correlation with SWC and PAWC, with correlation coefficients (R2) of 0.85 and 0.4 for SOM, and 0.89 and 0.76 for soil microporosity, respectively. It is worth noting that the original grassland stage, which maintained a higher SWC, can be attributed to its elevated levels of SOM and the presence of a well-developed mattic epipedon that remained undamaged [50]. Clearly, the content of SOM and the proportion of soil microporosity have a positive impact on both SWC and PAWC, while soil BD demonstrates a negative correlation with these parameters. Therefore, the correlation analysis highlights the crucial role of SOM, soil microporosity, and soil BD in determining soil water retention and water content throughout the three freeze-thaw collapse stages.

4. Discussion

4.1. Effects of the freeze-thaw cycle on soil water retention across thaw slump stages

Soil water retention is affected not only by plant characteristics but also by the physical structure of the soil, which plays an important role in surface processes and hydrological cycles in cold regions [24]. The combination of experiment and model simulations effectively demonstrates soil water retention, soil water content (SWC), and other hydraulic parameters under different freeze-thaw intensities and stages at the four RTS (retrogressive thaw slump) sites. Significant differences (P< 0.01) were observed between the soil water retention and content values of the original grassland and the collapsing or collapsed stages. However, no significant difference (P > 0.05) was found between the soil water retention and SWC values of the collapsing and collapsed stages. The collapsing and collapsed stages, identified by the geomorphic features and characteristic land surface, were connected, and their difference was not statistically significant (P > 0.05). For instance, soil water retention, SWC, FC, PAW, and other soil hydraulic parameters exhibited significant differences (P = 0.015) between the original grassland stage and the collapsed stage at the Maduo site, while the soil hydraulic parameter values at the collapsing stage and collapsed stage at the Maduo site did not exhibit significant difference (P = 0.24, i.e., P > 0.05). This study revealed that soil water retention at the original grassland stage was significantly higher than those at the other two thaw slump stages at the four RTS sites (Figure 2). This trend matches with the trend presented in previous research, indicating that as grassland degradation increases, soil water retention decreases [27,51]. However, other studies have shown that soil water retention does not necessarily decrease with vegetation degradation [24]. The influence of thaw slumps on hydraulic characteristics varies owing to the diverse vertical heterogeneity and vegetation distribution on the QTP as well as different causes of alpine meadow degradation, such as human activities, grazing, and freeze-thaw action [23]. Our findings suggest that with increasing freeze-thaw intensity, vegetation coverage and soil water retention decrease. However, in the collapsed stage, soil water retention and water content are higher than in the collapsing stage. These results indicate that the thaw collapse of alpine meadows caused by grazing and human activities differs from natural factors such as global warming, continuous melting of underground ice in the active layer of permafrost and seasonally frozen gound, and frequent freeze-thaw action, which can accelerate RTSs and amplify alpine meadow degradation. Negative feedback resulting from these factors can reduce the organic matter content in the soil, hindering plant growth and development in alpine meadow ecosystems, particularly under the backdrop of climate warming. Since 1950, the Tibetan Plateau has been warming at a rate of 0.32 °C per decade, twice the global average temperature increase [52]. The ground surface soil of the QTP exhibits high sensitivity to climate warming and is expected to continue experiencing impacts in the future. Although remote sensing satellite technologies have been employed to detect and locate RTSs sites [53], limited research has investigated soil water retention and soil parameters of RTSs in different freeze-thaw slump (FTS) stages. Our findings indicate that the negative feedback between FTS and soil water retention can contribute to the long-term degradation of alpine meadow soil, exerting a negative influence on plant growth. Through a comparative analysis of soil water retention across four RTS sites, particularly during the collapsing stage characterized by intense freeze-thaw slumping and severe damage to soil structure, hydraulic parameters, and vegetation, we identified the significance of the mattic epipedon in retaining soil water in alpine meadows. The intensification of underground ice melting, ground surface subsidence, and degradation of the mattic epipedon inevitably lead to the destruction of alpine meadow vegetation. Therefore, safeguarding and managing the collapsing stage of RTSs alpine meadow landscapes is of utmost importance. We conducted a comparison of FC, PWP, and PAWC at various stages of FTS across the four RTS sites. As freeze-thaw action intensified, the characteristics of FC and PWP variations aligned with those of soil water retention, emphasizing the impact of thaw slumps on soil structure and hydraulic properties in RTSs. Previous studies suggest that SOM plays a vital role in soil water retention due to its hydrophilic properties and influence on soil BD. Freeze-thaw collapse also induces changes in SOM, with considerably lower SOM values observed during the collapsing stage compared to the other two freeze-thaw slump stages. This phenomenon can be attributed to the destruction of soil structure during the collapsing stage, resulting in the destruction of plants and a gradual reduction in SOM to its minimum value. Furthermore, FC and PAW reached their lowest values during the collapsing stage under the influence of freeze-thaw slumping (Figure 3). This is due to the severe slumping causing Kobresia pygmaea vegetation to slide along with collapsing earth blocks during freeze-thaw action, leading to their destruction and a significant decline in SOM content over time. Consequently, this process results in increased soil BD and ultimately reduces soil water retention.

4.2. Effects of RTSs on soil structure over the three freeze-thaw stages

The soil structure consists of solid particles and a three-dimensional arrangement of voids, which have an impact on its capacity to maintain and transport air, water, and nutrients essential for plant growth and development. Additionally, it plays a crucial role in enhancing soil fertility, permeability, and erosion prevention [54]. The freeze-thaw process also influences the soil structure and must be considered when studying the characteristics of frozen soil structures. The proportion of soil pore sizes is a vital property of soil structures that affects their water retention capacity and water content. Previous research has indicated that alterations in soil pore-size distribution can enhance soil water retention and water content during shrub encroachment [33]. In this study, soil pores were classified into micropores (<30 μm), mesopores (30-100 μm), and macropores (>100 μm) [49], with micropores dominating in all three stages across the four RTS sites (Table 5). The proportion of mesopores and macropores was relatively small, with the proportion of mesopores slightly higher than that of macropores. At the Maduo site, the proportion of micropores gradually decreased from the original grassland to the collapsed stage, whereas the proportion of mesopores and macropores gradually increased, with the highest proportion of mesopores (0.08 cm3 cm-3) observed in the collapsed stage. Similarly, at the Dari site, the proportion of micropores also decreased gradually, with the highest proportion (0.66 cm3 cm-3) observed in the original grassland. The proportion of mesopores and macropores first increased and then decreased, reaching maximum proportions of 0.04 cm3 cm-3 and 0.02 cm3 cm-3, respectively, during the collapsing stage. In Xinghai and Gangcha site, the proportion of micropores first decreased and then increased, with peak values of 0.70 cm3 cm-3 and 0.56 cm3 cm-3, respectively, occurring in the original grassland stage. The proportion of mesopores and macropores generally decreased from the original grassland to the collapsed stage, with maximum values of 0.04 cm3 cm-3 and 0.07 cm3 cm-3, and 0.01 and 0.06 cm3 cm-3, respectively, in the two RTS sites. Consistent with FC, soil micropores were relatively small during the collapsing stage, and the smaller the soil micropores, the lower the FC values. Micropores in the soil function as water storage reservoirs, aiding in the retention of water [33], while mesopores act as conduits, providing air and water for plant growth [55]. The proportion of soil micropores was highest in the original grassland stage for the four RTS sites. Freeze-thaw collapse damages the soil structure, particularly by reducing the proportion of soil micropores during the collapsing and collapsed stages, consequently diminishing soil water retention and water content.

4.3. Controls of differences in soil water retention and water content for RTSs

Various factors, including soil texture, bulk density (BD), soil organic matter (SOM), soil pore-size distribution, and vegetation coverage, have been identified as influencing soil water retention and content [56,57,58,59]. These factors interact with each other and play important roles in determining the ability of soil to hold and release water. Previous studies in dicate that frequent freeze-thaw cycles indirectly influence soil hydrlogical property by modifying soil texture [34], soil structure [60] and vegetation in the RTS landform of the QTP. Previous studies have indicated that thaw slumps in Eboling Mountain induce soil texture changes in three distinct stages. Specifically, the clay content in the original grassland stage is the highest, followed by the collapsing stage, and the lowest in the collapsed stage. Conversely, the sand content exhibits opposite variation characteristics to the clay content (Table 6). Clay content is a crucial factor influencing soil water retention, as supported by correlation analysis indicating a strong positive relationship between clay content and soil water retention [61]. This finding aligns with the observation that the clay content is highest in the original grassland stage, which correlates with the highest water retention capacity. Previous studies have demonstrated that the degradation of alpine meadow grasslands brings about alterations in soil properties, significantly affecting soil water retention [24]. In the alpine meadows of the QTP, both RTSs and grassland degradation exert a substantial influence on soil texture, consequently affecting soil hydrological processes, including soil water retention. In comparison to grassland degradation, RTS induces more pronounced changes in soil structure and texture, leading to a more substantial impact on soil water retention. The influence of freeze-thaw cycles on the soil texture and structure of RTS is prominently observed through a reduction in soil organic matter (SOM) content and an increase in bulk density (BD). Previous studies have indicated that SOM plays a crucial role in affecting soil water retention in Qinghai-Tibet Plateau alpine ecosystem [24,62,63]. The specific effects of SOM on soil water retention can be explained from two perspectives. First, a higher SOM content leads to increased vegetation coverage and plant growth, rendering it more resistant to freeze-thaw cycles while also accelerating thaw collapse due to the amplified presence of meltwater and rainfall. Second, SOM influences soil BD and the mattic epipedon [64], as supported by the correlation between SOM and soil BD in this study (R2 = 0.45). SOM alters soil structure by reducing soil solid density and enhancing soil porosity (mesopores and macropores), ultimately affecting soil BD [24,65] and subsequently influencing soil water retention and content. In this study, the original grassland stage exhibited the highest SWC due to its elevated SOM content and the presence of Kobresia pygmaea, which remained undamaged. Previous research on the soil water conservation capacity of alpine hillside meadows in Dari County on the QTP indicates that greater surface coverage of alpine meadows corresponds to a stronger soil water conservation capacity [66]. Additionally, root adsorption also plays a vital role in soil water retention in alpine meadows [60,67]. The soil moisture content was also highest in the original grassland stage, with soil water remaining above 25% even under wilting coefficient pressure. Consequently, it can be concluded that SOM greatly influenced the highest soil water retention and content in the original grassland stage. The higher soil water retention and content in the collapsed stage, compared to the collapsing stage, may be attributed to lower topography, runoff, the meltwater of the alpine path, and a higher proportion of micropores in the soil. Soil pore size is a critical factor affecting soil water retention and SWC. The proportion of micropores in the ground surface soil is considerably high, while the proportions of mesopores and macropores are very low. Micropores exhibit a positive correlation with SWC (R2 = 0.89) and PAWC (R2 = 0.76). Conversely, mesopores and macropores show a negative correlation with SWC and PAWC, and their proportions are very low. Pearson correlation analysis was also conducted to examine the three influencing factors on SWC and PAWC during the three freeze-thaw collapse stages. The results indicate that the soil on the QTP is affected differently by freezing and thawing action, resulting in considerable soil heterogeneity. The SOM content at each RTS site exhibits a considerably positive correlation with the Pearson correlation of SWC and PAWC (correlation > 0.67), except for the Xinghai RTS site, where the SOM content is considerably negatively correlated with PAWC owing to its steeper than the other three sites. In terms of the proportion of micropores, except for individual collapsing stage and collapsed stage, the overall soil micropore proportion exhibits a high correlation with SWC and PAWC, particularly during the collapsing stage. This finding is consistent with the low soil micropore proportion and the corresponding low SWC and FC values. Notably, the variation in the characteristics of micropores in the three collapse stages is consistent with the variation laws of SWC and FC, suggesting that the proportion of micropores in the ground surface soil considerably influences SWC and FC. This study examines the characteristics of soil water retention and water content in three freeze-thaw stages of alpine meadows using space analysis instead of time analysis. It includes a comparative analysis and discussion of influencing factors. Understanding the soil hydrological processes and their influencing mechanisms in typical RTSs on the QTP is crucial. The soil organic matter content in the original grassland stage of RTS is the highest and the mat layer is intact, corresponding to the highest soil water retention. During collapsing stage, the mat layer was damaged and the organic matter content was reduced, and the soil water retention decreased. In the collapsed stage, fallen debris begin to accumulate, soil organic matter content increases, and vegetation begins to appear. Interesting findings show that when the collapsing stage is stable, the soil water retention of the soil in the collapsed stage is greater than that in the collapsing stage (Xinghai, Dari and Gangcha site), and when the collapsing stage is slumping, its soil water retention is greater than collapsed stage. It shows that the mat layer has an important influence on soil water retention.
Although encouraging results indicating that RTSs have a negative impact on soil water retention, this study has several limitations. Despite measuring soil water retention curves on 48 samples is expensive and time-consuming, more RTSs should be selected on the Tibetan Plateau for verification. In addition, this study was determined through a single sampling survey and cannot represent changes in soil water retention in other periods except the growing season. Therefore, in order to more convincingly prove the interaction between RTSs and soil water retention in future studies, more RTS points should be selected to test the universality of these results, and at the same time, long-term field sampling and experiments are carried out.

5. Conclusions

The freeze-thaw action has a significant impact on soil water retention in alpine meadow soil, leading to the formation of freeze-thaw slumps, changes in soil properties, and alterations in vegetation coverage. The collapse caused by freeze-thaw variations results in shifts in the distribution of soil pore sizes, which in turn affects the soil’s water-holding capacity, particularly the proportion of micropores. During the collapsing stage of freeze-thaw slumps, there is a decrease in micropores and organic matter content, which subsequently leads to reduced soil water retention. As the freeze-thaw slumps progress to the collapsed stage, the soil water retention further diminishes.The effects of global warming exacerbate the negative feedback between freeze-thaw slumps and soil moisture, accelerating the rate of retrogressive thaw slump collapse. However, it is worth noting that during intense freeze-thaw cycles, the soil water retention and soil water content surpass those observed during the collapsing stages. This is due to a higher proportion of micropores and higher soil organic matter content, which enhance the soil’s ability to retain water. This study emphasizes the negative feedback effect of freeze-thaw slumps on soil water retention and water content. It provides a new perspective for understanding and monitoring hydrological changes in RTSs, as well as for establishing parameters for hydrological models in cold regions. By considering the impacts of freeze-thaw slumps on soil water retention, researchers and policymakers can better comprehend the hydrological processes in these fragile ecosystems and develop effective strategies for their management and conservation.

Acknowledgments

The study was financially supported by the Second Tibetan Plateau Scientific Expedition and Research Program (STEP), Grant No. 2019QZKK0306, and the National Natural Science Foundation of China (42071034).

References

  1. Bowden, W.B.; Gooseff, M.N.; Balser, A.; Green, A.; Peterson, B.J.; Bradford, J. Sediment and nutrient delivery from thermokarst features in the foothills of the North Slope, Alaska: potential impacts on headwater stream systems. J. Geophys. Res. Biogeosci. 2008, 113, G02026. [Google Scholar] [CrossRef]
  2. Olefeldt, D.; Goswami, S.; Grosse, G.; Hayes, D.; Hugelius, G.; Kuhry, P.; McGuire, A.D.; Romanovsky, V.; Sannel, A.B.K.; Schuur, E.; Turetsky, M.R. Circumpolar distribution and carbon storage of thermokarst landscapes. Nat. Commun. 2016, 7, 13043. [Google Scholar] [CrossRef]
  3. Lewkowicz, A.G.; Way, R.G. Extremes of summer climate trigger thousands of thermokarst landslides in a High Arctic environment. Nat. Commun. 2019, 10, 1329. [Google Scholar] [CrossRef]
  4. Burn, C.R.; Lewkowicz, A.G. Canadian Landform Examples -17: Retrogressive thaw slumps. Can. Geogr. 1990, 34, 273–276. [Google Scholar] [CrossRef]
  5. Burn, C.R.; Kokelj, S.V. The permafrost and environment of the Mackenzie Delta area. Permafr. Periglac. Process. 2009, 20, 83–105. [Google Scholar] [CrossRef]
  6. Lewkowicz, A.G. Dynamics of active-layer detachment failures, Fosheim Peninsula, Ellesmere Island, Nunavut, Canada. Permafr. Periglac. Process. 2007, 18, 89–103. [Google Scholar] [CrossRef]
  7. Kokelj, S.V.; Jorgenson, M.T. Advances in thermokarst research. Permafr. Periglac. Process. 2013, 24, 108–119. [Google Scholar] [CrossRef]
  8. Cheng, G.D. Problems on zonation of high-altitude permafrost. Acta Geogr Sin. 1984, 39, 185–193. [Google Scholar]
  9. Luo, J.; Niu, F.J.; Lin, Z.J.; Liu, M.H.; Yin, G.A. Recent acceleration of thaw slumping in permafrost terrain of Qinghai–Tibet Plateau: an example from the Beiluhe Region. Geomorphology. 2019, 341, 79–85. [Google Scholar] [CrossRef]
  10. Luo, J. , Niu, F. J.; Lin, Z.J.; Liu, M.H.; Yin, G.A.; Gao, Z.Y.; Inventory and frequency of retrogressive thaw slumps in permafrost region of the Qinghai–Tibet Plateau. Geophys. Res. Lett. 2022, 49, 23, e2022GL099829. [Google Scholar] [CrossRef]
  11. Lewkowicz, A.G. Headwall retreat of ground-ice slumps, Banks Island, Northwest Territories. Can J Earth Sci. 1987, 24, 1077–1085. [Google Scholar] [CrossRef]
  12. Lacelle, D.; Brooker, A.; Fraser, R.H.; Kokelj, S.V. Distribution and growth of thaw slumps in the RichardsonMountains–Peel Plateau region, northwestern Canada. Geomorphology. 2015, 235, 40–51. [Google Scholar] [CrossRef]
  13. Kokelj, S.V.; Tunnicliffe, J.; Lacelle, D.; Lantz, T.C.; Chin, K.S.; Fraser, R. Increased precipitation drives mega slump development and destabilization of ice-rich permafrost terrain, northwestern Canada. Global Planet Change. 2015, 129, 56–68. [Google Scholar] [CrossRef]
  14. Burn, C. R. The thermal regime of a retrogressive thaw slump near Mayo, Yukon Territory. Can. J. Earth Sci. 2000, 37, 967–981. [Google Scholar] [CrossRef]
  15. Lantuit, H.; PollardW, H. Fifty years of coastal erosion and retrogressive thaw slump activity on Herschel Island, southernBeaufort Sea, Yukon Territory, Canada. Geomorphology. 2008, 95, 84102. [Google Scholar] [CrossRef]
  16. Lantz, T.C.; Kokelj, S.V. Increasing rates of retrogressive thaw slump activity in the Mackenzie Delta region, N.W.T., Canada. Geophys. Res. Lett. 2008, 35, L06502. [Google Scholar] [CrossRef]
  17. Kokelj, S.V.; Lantz, T.C.; Kanigan, J.; Smith, S.L.; Coutts, R. Origin and polycyclic behaviour of tundra thaw slumps, Mackenzie Delta region, Northwest Territories, Canada. Permafr. Periglac. Process. 2009, 20, 173–184. [Google Scholar] [CrossRef]
  18. Robinson, S. D. Thaw-slump-derived thermokarst near Hot Weather Creek, Ellesmere Island, Nunavut. In M. Garneau & B. T. Alt (Eds.), Environmental response to climate change in the Canadian high Arctic (2000, 529, 335–345). Geological Survey of Canada.
  19. Jorgenson, M.T.; Osterkamp, T.E. 2005 Response of boreal ecosystems to varying modes of permafrost degradation. Can J Forest Res. 35, 2100–2111. [CrossRef]
  20. Segal, R.A.; Lantz, T.C.; Kokelj, S.V. 2016 Acceleration of thaw slump activity in glaciated landscapes of the Western Canadian Arctic. Environ. Res. Lett. 2016, 11, 034025. [Google Scholar] [CrossRef]
  21. Katamura, F.; Fukuda, M.; Bosikov, N.P.; Desyatkin, R.V.; Nakamura, T.; Moriizumi, J. Thermokarst formation and vegetation dynamics inferred from a palynological study in central Yakutia, eastern Siberia. Arct. Antarct. Alp. Res. 2006, 38, 561–570. [Google Scholar] [CrossRef]
  22. Jiang, G.L.; Gao, S.R.; Lewkowicz, A.G.; Zhao, H.; Pang, S.J.; Wu, Q.B. ; Development of a rapid active layer detachment slide in the Feng huo shan Mountains, Qinghai–Tibet Plateau. Permafr. Periglac. Process. 2022, 33, 298–309. [Google Scholar] [CrossRef]
  23. Lu X.Y.; Kelsey, K.C.; Yan, Y, Sun, J.; Wang, X.D.; Cheng, G.W.; Neff, J.C . Effects of grazing on ecosystem structure and function of alpine grasslands in Qinghai-Tibetan Plateau: a synthesis. Ecosphere. 2017, 8, e01656. [CrossRef]
  24. Dai, L.C.; Yuan, Y.M.; Guo, X.W.; Du, Y.G.; Ke, X.; Zhang, F.W.; Li, Y.K.; Li, Q.; Lin, L.; Zhou, H.K.; Cao, G.M. Soil water retention in alpine meadows under different degradation stages on the northeastern Qinghai-Tibet Plateau. J. Hydrol. 2020, 590, 125397. [Google Scholar] [CrossRef]
  25. Sun, Y.; Wang, Y.B; Yang, W.J.; Sun, Z.; Zhao, J.P. 2019 Variation in soil hydrological properties on shady and sunny slopes in the permafrost region. Qinghai-Tibetan Plateau. Environ. Earth Sci. 2019, 78, 100. [Google Scholar] [CrossRef]
  26. Wu, G.L.; Huang, Z.; Liu, Y.F.; Cui, Z.; Liu, Y.; Chang, X.F.; Tian, F.P.; Lopez-Vicente, M.; Shi, Z.H. Soil water response of plant functional groups along an artificial legume grassland succession under semi-arid conditions. Agric. For. Meteorol. 2019, 278, 107670. [Google Scholar] [CrossRef]
  27. Pan, T, Hou, S, Wu, S. H.; Liu, Y.H.; Liu, Y.H.; Zou, X.; Herzberger, A.J.; Liu, J.G. Variation of soil hydraulic properties with alpine grassland degradation in the eastern Tibetan Plateau. Hydrol. Earth Syst. Sci. 2017, 21, 2249–2261. [CrossRef]
  28. Wei, Q.; Wang, F.; Chen, W.Y.; Zhu, L.; Li, G.Y.; Qi, D.C. Soil physical characteristics on different degraded alpine grasslands in Maqu county in upper Yellow River, Bull. Soil Water Conserv. 30, 16–21, 2010.
  29. Wösten, J.; Pachepsky, Y.A.; Rawls, W. Pedotransfer functions: bridging the gap between available basic soil data and missing soil hydraulic characteristics J. Hydrol. 2001, 251, 123–150. [Google Scholar] [CrossRef]
  30. Dong, S.K.; Shang, Z.H.; Gao, J.X. ; Boone R B 2020 Enhancing sustainability of grassland ecosystems through ecological restoration and grazing management in an era of climate change on Qinghai-Tibetan Plateau. Agr Ecosyst Environ. 2020, 287, 106684. [Google Scholar] [CrossRef]
  31. Xu, H.Y.; Liu, G.; Wu, X.; Smoak, J.M.; Mu, C.C.; Ma, X.L.; Zhang, X.L.; Li, H.Q.; Hu, G.L. Soil enzyme response to permafrost collapse in the Northern Qinghai-Tibetan Platea. Ecol. Indic. 2018, 85 585–593. [CrossRef]
  32. Mu, C.C.; Zhang, T.J.; Zhang, X.K.; Li, L.L.; Guo, H.; Zhao, Q.; Cao, L.; Wu, Q.B.; Cheng, G.D. 2016 Carbon loss and chemical changes from permafrost collapse in the northern Tibetan Plateau. J. Geophys. Res. Biogeosci. 2016, 121, 1781–1791. [Google Scholar] [CrossRef]
  33. Gao, Z.; Hu, X.; Li, X.Y. Changes in soil water retention and content during shrub encroachment process in inner Mongolia, northern China. Catena, 2021, 206, 105528. [Google Scholar] [CrossRef]
  34. Ma, Q.H.; Zhang, K.L.; Jabro, J.D.; Ren, L.; Liu, H.Y. Freeze-thaw cycles effects on soil physical properties under different degraded conditions in Northeast China. Environ Earth Sci. 2019, 78, 1–12. [Google Scholar] [CrossRef]
  35. Lin, J.G.; Zou, W.L.; Han, Z.; Zhang, Z.W.; Wang, X.Q. Structural, volumetric and water retention behaviors of a compacted clay. J. Rock Mech. Geotech. Eng. 2022, 14, 953–966. [Google Scholar] [CrossRef]
  36. Dai, L.C.; Guo, X.W.; Ke, X.; Du, Y.G.; Zhang, F.W.; Cao, G.M. The variation in soil water retention of alpine shrub meadow under different degrees of degradation on northeastern Qinghai-Tibetan plateau. Plant Soil. 2021, 458, 231–244. [Google Scholar] [CrossRef]
  37. Van Genuchten, M.T. A closed-form equation for predicting the hydraulic conductivity of unsaturated soils. Soil Sci Soc Am J. 1980, 44, 892–898. [Google Scholar] [CrossRef]
  38. Veihmeyer, F.J.; Hendrickson, A.H. The moisture equivalent as a measure of the field capacity of soils. Soil Sci. 1931, 32, 181–193. [Google Scholar] [CrossRef]
  39. Twarakavi, N.K. C, Sakai, M.; Simunek, J.J. An objective analysis of the dynamic nature of field capacity. Water Resour. Res, 2009, 45, W10410. [Google Scholar] [CrossRef]
  40. Yang, X.; You, X. Estimating parameters of van Genuchten model for soil water retention curve by intelligent algorithms. Appl. Math. Inf. Sci. 2013, 7, 1977–1983. [Google Scholar] [CrossRef]
  41. Cao, G.M.; Tang, Y.H; Mo, W.; Wang, Y.S.; Li, Y.N.; Zhao, X.Q. 2004 Grazing intensity alters soil respiration in an alpine meadow on the Tibetan plateau. Soil Biol. Biochem. 2004, 36, 237–243. [Google Scholar] [CrossRef]
  42. Yang, Z.G.; Hu, X.; Li, X.Y.; Gao, Z.; Zhao, Y.D. Soil macropore networks derived from X-ray computed tomography in response to typical thaw slumps in Qinghai-Tibetan Plateau, China. J. Soil Sediment. 2021, 21, 2845–2854. [Google Scholar] [CrossRef]
  43. Reatto, A.; da Silva, E.M.; Bruand, A.; Martins, E.S.; Lima, J.E.F.W. Validity of the centrifuge method for determining the water retention properties of tropical soils. Soil Sci. Soc. Am. J. 2008, 72, 1547–1553. [Google Scholar] [CrossRef]
  44. Mirbabaei, S.M.; Shabanpour, M.; van Dam, J.; Ritsema, C.; Zolfaghari, A.; Khaledian, M. 2021 Observation and simulation of water movement and runoff in a coarse texture water repellent soil. Catena, 207, 105637. [CrossRef]
  45. Walkley, A.; Black, I.A. An examination of the Degtjareff method for determining soil organic matter, and a proposed modification of the chromic acid titration method. Soil Sci. 1934, 37, 29–38. [Google Scholar] [CrossRef]
  46. Nelson, D. W Sommers, L. E. Total carbon, organic carbon, and organic matter. Methods of soil analysis: Part 3 Chemical methods. 1996, 5, 961–1010. [Google Scholar] [CrossRef]
  47. Wang, Y.Q.; Shao, M.A; Liu, Z.P. Vertical distribution and influencing factors of soil water content within 21-m profile on the Chinese Loess Plateau. Geoderma. 2013, 193, 300–310. [Google Scholar] [CrossRef]
  48. Gao, L.L; Wang, B.S.; Li, S.P.; Wu, H.J.; Wu, X.P.; Liang, G.P.; Gong, D.Z.; Zhang, X.M.; Cai, D.X.; Degr´e, A. Soil wet aggregate distribution and pore size distribution under different tillage systems after 16 years in the Loess Plateau of China. Catena, 2019, 173, 38–47. [Google Scholar] [CrossRef]
  49. Liang, A.;,Zhang, Y.; Zhang, X.P.; Yang, X.M.; McLaughlin, N.; Chen, X.W; Guo, Y.F.; Jia, S.X.; Zhang, S.X.; Wang, L.X.; Tang, J.W. 2019 Investigations of relationships among aggregate pore structure, microbial biomass, and soil organic carbon in a Mollisol using combined non-destructive measurements and phospholipid fatty acid analysis. Soil Tillage Res. 2019, 185, 94–101. [CrossRef]
  50. Li, J.; Zhang, F.W.; Lin, L.; Li, H.Q.; Du, Y.G.; Li, Y.K.; Cao, G.M. Response of the plant community and soil water status to alpine Kobresia meadow degradation gradients on the Qinghai-Tibetan Plateau China. 2015, Ecol Res. 30, 589-596. [CrossRef]
  51. Zeng, C.; Zhang,F. ; Wang, Q.J; Chen, Y.Y.; Joswiak, D.R. Impact of alpine meadow degradation on soil hydraulic properties over the Qinghai-Tibetan Plateau. J. Hydrol. 2013, 478, 148–156. [Google Scholar] [CrossRef]
  52. Lin, Z.J.; Gao, Z.Y.; Niu, F.J.; Luo, J.; Yin. G.A.; Liu, M.H.; Fan, X.W. High spatial density ground thermal measurements in a warming permafrost region, Beiluhe Basin, Qinghai-Tibet Plateau. Geomorphology. 2019, 340, 1–14. [Google Scholar] [CrossRef]
  53. Nitze, I.; Heidler, K.; Barth, S.; Grosse, G. Developing and testing a deep learning approach for mapping retrogressive thaw slumps. Remote Sens-Basel. 2021, 13, 4294. [Google Scholar] [CrossRef]
  54. Rabot, E.; Wiesmeier, M.; Schlüter, S.; Vogel, H.J. Soil structure as an indicator of soil functions: a review. Geoderma, 2018, 314. 122–137. [CrossRef]
  55. Lal, R.; Shukla, M.K. Principles of Soil Physics. Marcel Dekker, New York, USA. 2004. [CrossRef]
  56. Brooks, R.H.; Corey, A.T. Hydraulic properties of porous media. Hydrology paper. Fort Collins, Colorado: Colorado State University, 1964, 3-27.
  57. Ilek, A.; Kucza, J.; Szostek, M. The effect of stand species composition on water storage capacity of the organic layers of forest soils. Eur J Forest. Res. 2015, 134, 187–197. [Google Scholar] [CrossRef]
  58. Ilek, A.; Kucza, J.; Szostek, M. The effect of the bulk density and the decomposition index of organic matter on the water storage capacity of the surface layers of forest soils. Geoderma. 2017, 285, 27–34. [Google Scholar] [CrossRef]
  59. Liu, C.; Tong, F.G, Yan, L.; Zhou, H.B.; Hao, S. Efect of porosity on soil-water retention curves: theoretical and experimental aspects. Geofuids. 2020, 6671479. [CrossRef]
  60. Gao, Z.Y.; Niu, F.J.; Wang, Y.B.; Lin, Z.J.; Luo. J.; Liu, M.H. Root-induced changes to soil water retention in permafrost regions of the Qinghai-Tibet Plateau, China. J Soil. Sediment. 2018, 18, 791–803. [Google Scholar] [CrossRef]
  61. Bordolo,i R. ; Das, B.; Yam, G.; Pandey, P.K.; Tripathi, O.P. Modeling of water holding capacity using readily available soil characteristics. Agric. Res. 2019, 8, 347–355. [Google Scholar] [CrossRef]
  62. Han, G.Z.; Zhang, G.L.; Gong, Z.T.; Wang, G.F. Pedotransfer functions for estimating soil bulk density in China. Soil Sci, 177, 158-164. [CrossRef]
  63. Yang, F.; Zhang, G.L.; Yang, J.L.; Li, D.C.; Zhao, Y.G.; Liu, F.; Yang, R.M.; Yang, F.F. 2014 Organic matter controls of soil water retention in an alpine grassland and its significance for hydrological processes. J Hydrol. 2014, 519, 3086–3093. [Google Scholar] [CrossRef]
  64. Baldock, J.; Nelson, P. Soil Organic Matter. CRC Press. 2000.
  65. Bot, A; Benites. J. The importance of soil organic matter: key to drought-resistant soil and sustained food production. Food Agriculture Org. 2005.
  66. Cui, Z.; Liu, Y.F.; Liu, Y.; Leite, P.A.M.; Shi, J.J.; Shi, Z.H.; Wu, G.L. Fragmentation alters the soil water conservation capacity of hillside alpine meadows on the Qinghai-Tibetan Plateau. Geoderma. 2022, 428, 116113. [Google Scholar] [CrossRef]
  67. Li, J.; Zhang, F.W; Lin, L.; Li, H.Q.; Du, Y.G.; Li, Y.K.; Cao, G.M. Response of the plant community and soil water status to alpine Kobresia meadow degradation gradients on the Qinghai-Tibetan Plateau China. Ecol Res. 2015, 30, 589–596. [Google Scholar] [CrossRef]
Figure 1. Geographical locations of the four study sites (a) and landscape maps of retrogressive thaw slumps and its three freeze-thaw slump stages named original grassland stage; collapsing stage; collapsed stage at Maduo (b), Xinghai (c), Dari (d) and Gangcha (e), respectively.
Preprints 91167 g001
Figure 2. Measured and simulated by Van Genuchten (VG) model soil water retention curves (SWRCs) of four RTS sites among original grassland stage, collapsing stage, and collapsed stage in Maduo (a), Xinghai (b), Dari (c), and Gangcha site (d), respectively. Error bars represent the standard deviations of measured values with four repetitions.
Preprints 91167 g002
Figure 3. Changes of soil water retention under three different freeze-thaw collapse stages of four RTS sites. The lowercase letters represent the significant difference of soil water retention under different freeze-thaw collapse stages (at the 0.05 probability level). The error bars of the histogram represent the standard deviation of the soil water capacity of four replicate samples at different stages of RTS.
Preprints 91167 g003
Figure 4. Field capacity (FC), permanent wilting point (PWP), and plant available water capacity (PAWC) of the alpine meadow across original grassland stage, collapsing stage, and collapsed stage at Maduo (a); Xinghai (b); Dari (c) and Gangcha (d), respectively. Error bars represent the standard deviations of output driven by measured values with four repetitions.
Preprints 91167 g004
Figure 5. The relationships between soil organic matter (SOM) content, soil bulk density (BD) and soil microporosity with soil water content (SWC) and plant available water capacity (PAWC) in three freeze-thaw collapse stages of four RTS sites in QTP.
Preprints 91167 g005
Table 1. Infromation of scelected study sites of Retrogressive thaw slumps (RTSs).
Study Site Latitude Longitude Elevation (m) Mean Annual Air Temperature
(°C)
Highest Temperature (°C) Lowest Temperature (°C) Annual Precipitation (mm)
Maduo 34°29′ N 98°02′ E 4355 -1.45 8.8 -13.8 92
Xinghai 35°49′ N 99°55′ E 3900 0.55 11.5 -11.9 87
Dari 34°08′ N 99°28′ E 4329 -3.3 8.1 -14.9 942
Gangcha 37°53′ N 98°25′ E 3515 -6.2 6.6 -18.9 313
Table 2. The average value of measured soil moisture content, bulk density and soil organic matter content among three freeze thaw slump stages of four RTSs.
Site of freeze thaw slump Stages of freeze thaw slump Soil water content (cm3 cm-3) Soil bulk density
(g cm-3)
Soil organic matter
(g kg-1)
Maduo Collapsed stage 0.5 0.62 119.87
Collapsing stage 0.52 0.49 129.52
Original grassland stage 0.62 0.4 224.23
Xinghai Collapsed stage 0.17 1.33 31.72
Collapsing stage 0.12 1.42 19.84
Original grassland stage 0.26 0.91 57.15
Dari Collapsed stage 0.49 0.79 N/A
Collapsing stage 0.33 1.16 N/A
Original grassland stage 0.61 0.66 N/A
Gangcha Collapsed stage 0.24 1.1 39.24
Collapsing stage 0.19 1.14 46.89
Original grassland stage 0.34 0.75 N/A
N/A is not available.
Table 3. The fitting parameters of soil water retention curves (SWRCs) and the prediction performance of Van Genuchten (VG) model.
Sites of freeze thaw collapse States of thaw slump Fitting parameters of SWRCs Model Performance
θr (cm3 cm-3) θs (cm3 cm-3) α(°) n RMSE(cm3 cm-3) R2
Maduo collapsed stage 0.00±0.00 0.71±0.02 0.02±0.01 1.25±0.03 0.012 0.995
collapsing stage 0.07±0.07 0.75±0.04 0.02±0.02 1.22±0.03 0.011 0.993
original stage 0.00±0.00 0.78±0.02 0.01±0.01 1.17±0.02 0.013 0.992
Xinghai collapsed stage 0.10±0.02 0.48±0.03 0.01±0.00 1.42±0.08 0.005 0.998
collapsing stage 0.07±0.04 0.46±0.03 0.01±0.00 1.37±0.08 0.005 0.998
original stage 0.13±0.10 0.65±0.05 0.02±0.01 1.28±0.10 0.010 0.994
Dari collapsed stage 0.00±0.00 0.67±0.06 0.01±0.01 1.21±0.01 0.009 0.996
collapsing stage 0.00±0.00 0.56±0.02 0.00±0.00 1.23±0.03 0.004 0.999
original stage 0.00±0.00 0.75±0.01 0.01±0.00 1.20±0.00 0.006 0.998
Gangcha collapsed stage 0.01±0.02 0.52±0.03 0.02±0.01 1.18±0.04 0.012 0.985
collapsing stage 0.04±0.04 0.53±0.04 0.04±0.04 1.23±0.06 0.007 0.994
original stage 0.09±0.10 0.68±0.06 0.03±0.03 1.26±0.13 0.013 0.990
4 sites×3 states×4 replications = 48 soil samples; the data represent mean ± standard deviation.
Table 4. Soil water storage (SWS), plant available water storage (PAWS) and plant available water (PAW) during the different stages of freeze-thaw collapse in the four sites.
Sites of freeze thaw collapse States of thaw slump SWS (mm) PAWS (mm) PAW(mm)
Total Total Total
Maduo collapsed stage 12.4 4.96 0.16
collapsing stage 12.74 5.63 0.23
originalgrassland stage 15.5 8.8 0.44
Xinghai collapsed stage 11.83 0.40 0.01
collapsing stage 8.52 0.00 0.00
originalgrassland stage 11.31 0.94 0.02
Dari collapsed stage 15.56 9.09 0.23
collapsing stage 19.14 5.8 0.10
originalgrassland stage 19.36 7.65 0.30
Gangcha collapsed stage 12.38 2.73 0.05
collapsing stage 10.26 0.57 0.01
originalgrassland stage 13.08 3.00 0.08
Total represents the total water storage of the 5cm soil profile. The data represent mean ± standard deviation.
Table 5. Soil pore size distributions in three freeze-thaw stages of four typical RTSs in QTP.
Sites of freeze thaw collapse States of thaw slump Porosity (cm3 cm-3)
Microporosity
(< 30 μm)
Mesoporosity
(30-100μm)
Macroporosity
(>100μm)
Maduo collapsed stage 0.57±0.03 0.08±0.02 0.05±0.02
collapsing stage 0.64±0.03 0.07±0.03 0.05±0.04
original grassland stage 0.72±0.03 0.04±0.01 0.02±0.01
Xinghai collapsed stage 0.44±0.03 0.03±0.01 0.01±0.00
collapsing stage 0.41±0.04 0.04±0.02 0.02±0.01
original grassland stage 0.52±0.04 0.08±0.01 0.05±0.01
Dari collapsed stage 0.62±0.02 0.04±0.03 0.02±0.02
collapsing stage 0.53±0.00 0.02±0.01 0.01±0.00
original grassland stage 0.70±0.00 0.04±0.01 0.02±0.00
Gangcha collapsed stage 0.44±0.02 0.05±0.09 0.03±0.01
collapsing stage 0.41±0.06 0.06±0.02 0.06±0.05
Original grassland stage 0.56±0.05 0.07±0.03 0.06±0.05
The data represent mean ± standard deviation.
Table 6. Soil texture of the three thaw slump stages.
Thaw slump stages Soil layer (cm) Soil type Vegetation Particle size composition
Clay (%) Silt (%) Sand (%)
Original grassland 0-10 Subalpine meadow soil Kobresia Pygmaea 6.13 46.18 47.68
Collapsing areas 0-10 4.28 43.42 52.30
Collapsing areas 0-10 3.48 36.43 60.09
(Data are extracted from Yang et al (2021)).
Disclaimer/Publisher’s Note: The statements, opinions and data contained in all publications are solely those of the individual author(s) and contributor(s) and not of MDPI and/or the editor(s). MDPI and/or the editor(s) disclaim responsibility for any injury to people or property resulting from any ideas, methods, instructions or products referred to in the content.
Copyright: This open access article is published under a Creative Commons CC BY 4.0 license, which permit the free download, distribution, and reuse, provided that the author and preprint are cited in any reuse.
Prerpints.org logo

Preprints.org is a free preprint server supported by MDPI in Basel, Switzerland.

Subscribe

© 2024 MDPI (Basel, Switzerland) unless otherwise stated