1. Introduction
One phenomenon that has attracted worldwide concern is heavy metal contamination, which is now a significant environmental issue and a major stress. Due to their toxicity, bioaccumulation, and non-biodegradability, these pollutants are of particular interest to researchers who study human health and aquatic environments. These pollution problems are the result of rapid growth in industrial activity which has resulted in an environmental disorder [
1].
As stated by
Tchounwou et al., (2012) [
2], heavy metals are classified as metallic elements with a density that is very high when compared to water. They can be identified by having a high atomic weight, and a density that is around five times more than that of water. They are present in a variety of industrial effluents produced by various human activities, including tanneries, mineral extraction, and plating facilities, and they are also continuously released into the environment by volcanoes, as a result of rocks naturally weathering [
3,
4,
5].
Metal toxicity leads to the creation of free radicals, which cause DNA damage. The formation of free radicals has been studied in particular for iron, copper, nickel, chromium, and cadmium. The last metals are known for their carcinogenic properties. We have chosen to investigate two metals in this study: nickel and copper. These metals have been selected because of their extreme toxicity, multitude of information available regarding their biogeochemical cycles, and the fact that they are on lists of priority metals for monitoring contamination in rivers and marine waters [
6,
7].
Copper is a type of inorganic pollutant that has been extensively studied by researchers in the field of bio-absorption [
8,
9]. According to
Kadirvelu et al., (2000) [
10], this metal can exist in the form of the free cation Cu
2+ in acidic environments, and as traces of soluble Cu(OH)
2 and [Cu(OH)]
+ in neutral or basic environments.
Nickel is used in stainless steel currency, metallic alloys, super alloys, nonferrous metals, mineral processing, paint formulation, electroplating, battery manufacturing and copper sulfate manufacturing [
11]. In addition to being a heavy metal ion that is frequently used, nickel is also toxic. Its toxicity spreads throughout the chemical, electroplating, mining, refining, paint, and ink formulation sectors [
12]. It has detrimental consequences on health, including cancer, dermatitis, nausea, persistent asthma, and coughing. The maximum amount of nickel allowed in the drinking water is 0.015 mg/L, according to the US EPA [
13].
Wastewaters that contain copper and nickel should be appropriately treated before being released, due to their toxicity.
The conventional techniques for removing Ni
2+ and Cu
2+ ions from aqueous solutions include ion exchange, solvent extraction, chemical precipitation, oxidation/reduction, filtration, reverse osmosis, membrane technology, and adsorption methods [
14,
15,
16,
17,
18,
19]. Considering it is less expensive and easier to understand, design and operate, the adsorption process appears to be a more suitable approach for controlling water pollution [
20].
The aim of this work is to evaluate the feasibility of using Alginate-Moroccan clay for the removal of toxic heavy metals from aqueous solution. The influence of experimental conditions such as contact time, metal ion concentration, or pH have been studied. Experimental results have been analysed to provide an understanding of the adsorption mechanism. Various kinetic models, including pseudo-first order, pseudo-second order, intraparticle diffusion, and Elovich models, were tested and evaluated to illustrate the adsorption kinetics. The study's findings demonstrated that the adsorption process follows second-order kinetics, with associated rate constants successfully determined. The Langmuir isotherm was found to be the most appropriate for describing how bio-nanocomposite beads are used to remove heavy metals. The obtained results showed that alginate-based bio-nanocomposites have a highly significant adsorption ability for the retention of Cu2+ and Ni2+ in aqueous solution, which is scientifically relevant. The positive values of ΔH° indicate that the adsorption is physical and endothermic, in agreement with experimental results. The negative value of ∆G° shows that the adsorption process is spontaneous. Positive ΔS° values indicate increased randomness at the solid/liquid interface during adsorption of Cu2+ and Ni2+ cations onto the engineered bio-nanocomposite.
2. Materials and Methods
2.1. Preparation of adsorbent materials
Using the extrusion synthesis process, a bio-nanocomposite based on Moroccan clay encapsulated in alginate was developed. 1 g of alginate was constantly mixed with bidistilled water in a 100 mL Erlenmeyer flask for seven hours at 40 °C. The solutions were agitated at 500 rpm to completely disperse the alginate. After that, the alginate suspension received 2 g of Moroccan natural clay, while being gently magnetically stirred at room temperature. The Alginate-clay solution is injected into a syringe for bead production. Above a 0.1 M calcium chloride (CaCl
2) gelling solution, the syringe is held vertically. Gradually, the treatment is drip-fed into the gel bath. The saline solution gels quickly, and the creation of chains around the Ca
2+ cations result in the formation of beads [
21].
2.2. Batch adsorption studies
In the batch adsorption experiments, 50 mL of an initial concentration solution (C0) was mixed with 0.05 g of Alginate-Moroccan clay bio-nanocomposite beads, the mixture being vigorously stirred with the use of a magnetic stirrer. The solution with the Alginate-Moroccan clay bio-nanocomposite beads was maintained in water bath thermostat, at a constant temperature.
After varying contact time (t), the resulting solutions were centrifuged at 5000 rpm for 10 minutes. The supernatant was then subjected to 0.45-μm membrane filtration, and the filtrate was analysed. The concentration of metals in the supernatant was determined by flame atomic absorption spectroscopy for Cu2+ and Ni2+ (Analytik Jena ContrAA 300).
The retention of Cu
2+ or Ni
2+ ions concentration (
Cr -removal concentration) from the aqueous solution was calculated as the difference between the initial concentration (
C0) and the concentration at different contact times. The amount removed per unit mass of adsorbent (
qt, mg/g) at time "
t" was calculated as follows:
The removed percentage of Cu
2+ and Ni
2+ ions was calculated by:
Where qt (mg/g) indicates the amount of Cu2+ and Ni2+ ions removed per unit mass of the adsorbent at a given time (t); C0 (mg/L) represents the initial concentration of Cu2+ and Ni2+ ions in the aqueous solution, Ct (mg/L) is the concentration of Cu2+ or Ni2+ ions at time (t). V(L) denotes the volume of the solution.
2.3. Characterization of bio-nanocomposite beads
2.3.1. Morphology analysis
To know the structure sight of the Alginate-Moroccan clay bio-nanocomposite beads, scanning electron microscopy (SEM) was generally employed to observe samples morphology. The microparticles structure and morphology were characterized by scanning electron microscope, SEM, using Quanta Inspect F50, FEI Company, Eindhoven, Netherlands, which was equipped with a field emission electron gun (FEG) —with a resolution of 1.2 nm, and an energy dispersive X-ray spectrometer (EDS) with a resolution of MnK of 133 eV.
2.3.2. Elemental analysis
The elemental analysis of microparticle Alginate-Moroccan clay bio-nanocomposite beads was analysed by SEM coupled with energy dispersive X-ray analysis (SEM/EDX, Quanta Inspect F50, FEI Company, Eindhoven, Netherlands).
2.3.3. Determination of pH zero-point charges for Bio-nanocomposite adsorbent
To determine the pHZPC of the adsorbent, 50 ml of 0.01 M of NaCl solution were placed in different 250 ml Erlenmeyer flasks, and 0.5g of the Alginate-Clay bio-nanocomposite beads was introduced into each of them. The pH values of these solutions were adjusted to values between 2 and 12 with 0.1 M of HCl and NaOH solutions. These flasks were kept for 48 hours, and the final pH of the solutions was measured. The point of intersection of the curve of pHfinal versus pHinitial was recorded as pHZPC of the saw dust.
2.3.4. XRD analysis
The Alginate-Clay bio-nanocomposite was prepared and characterized by several analyses. The X-ray diffraction (XRD) technique was used within the scanning range of 5° ≤ 2θ ≤ 80° to confirm the crystalline structure of Alginate-Clay bio-nanocomposites. It was carried out in air and at room temperature, with the help of PANalytical Empyrean (Almelo, Netherlands) equipment that comprised a characteristic Cu X-ray tube (λ Cu Kα1 = 1.541874 Å).
3. Results and discussion
3.1. Characterization of bio-nanocomposite beads
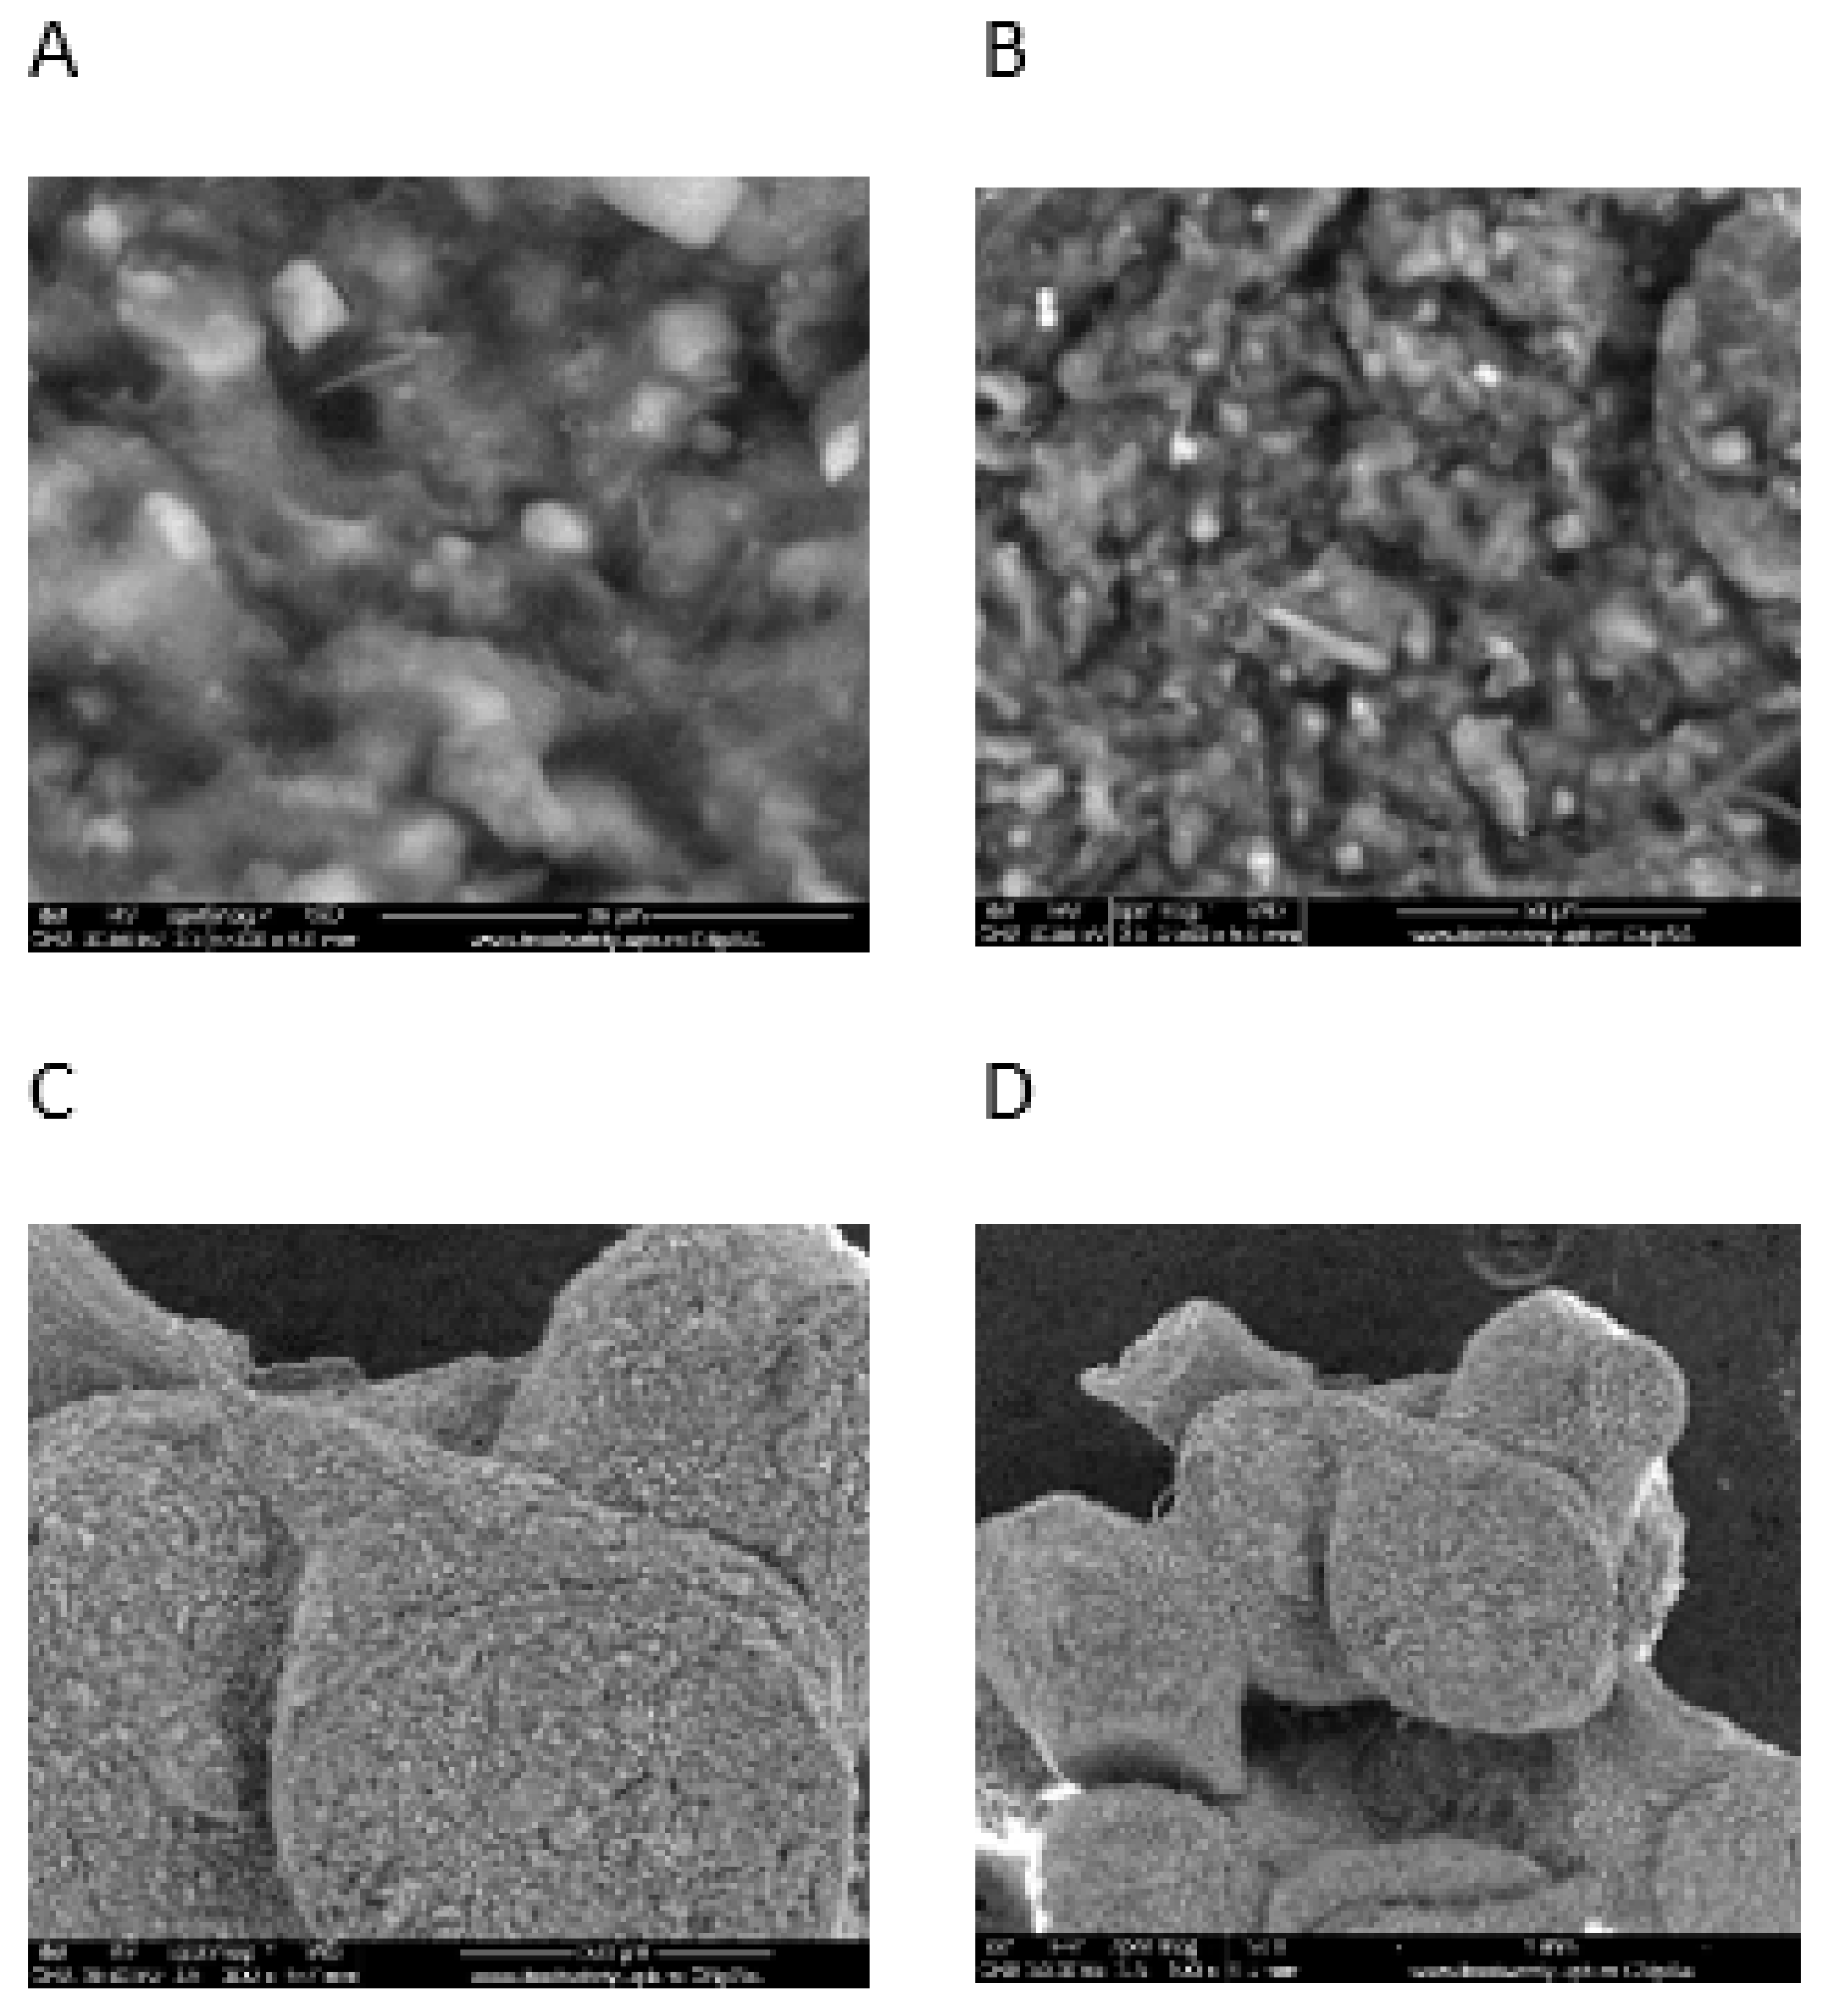
The SEM images of the Alginate-Moroccan clay bio-nanocomposite beads are presented in
Figure 1. This figure shows SEM images of Alginate-Moroccan clay bio-nanocomposite microparticles obtained at different magnifications. Images A and B show that the overall appearance of the powder in this sample is in the form of agglomerates whose diameter exceeds even 1 mm. These agglomerates exhibit an uneven morphology and are distinguished by the presence of voids and pores on their surfaces. At high magnification, these are agglomerates of a very fine powder containing grains of various sizes and inhomogeneous forms with dimensions ranging from 0.5 to 8 µm (images C, and D).
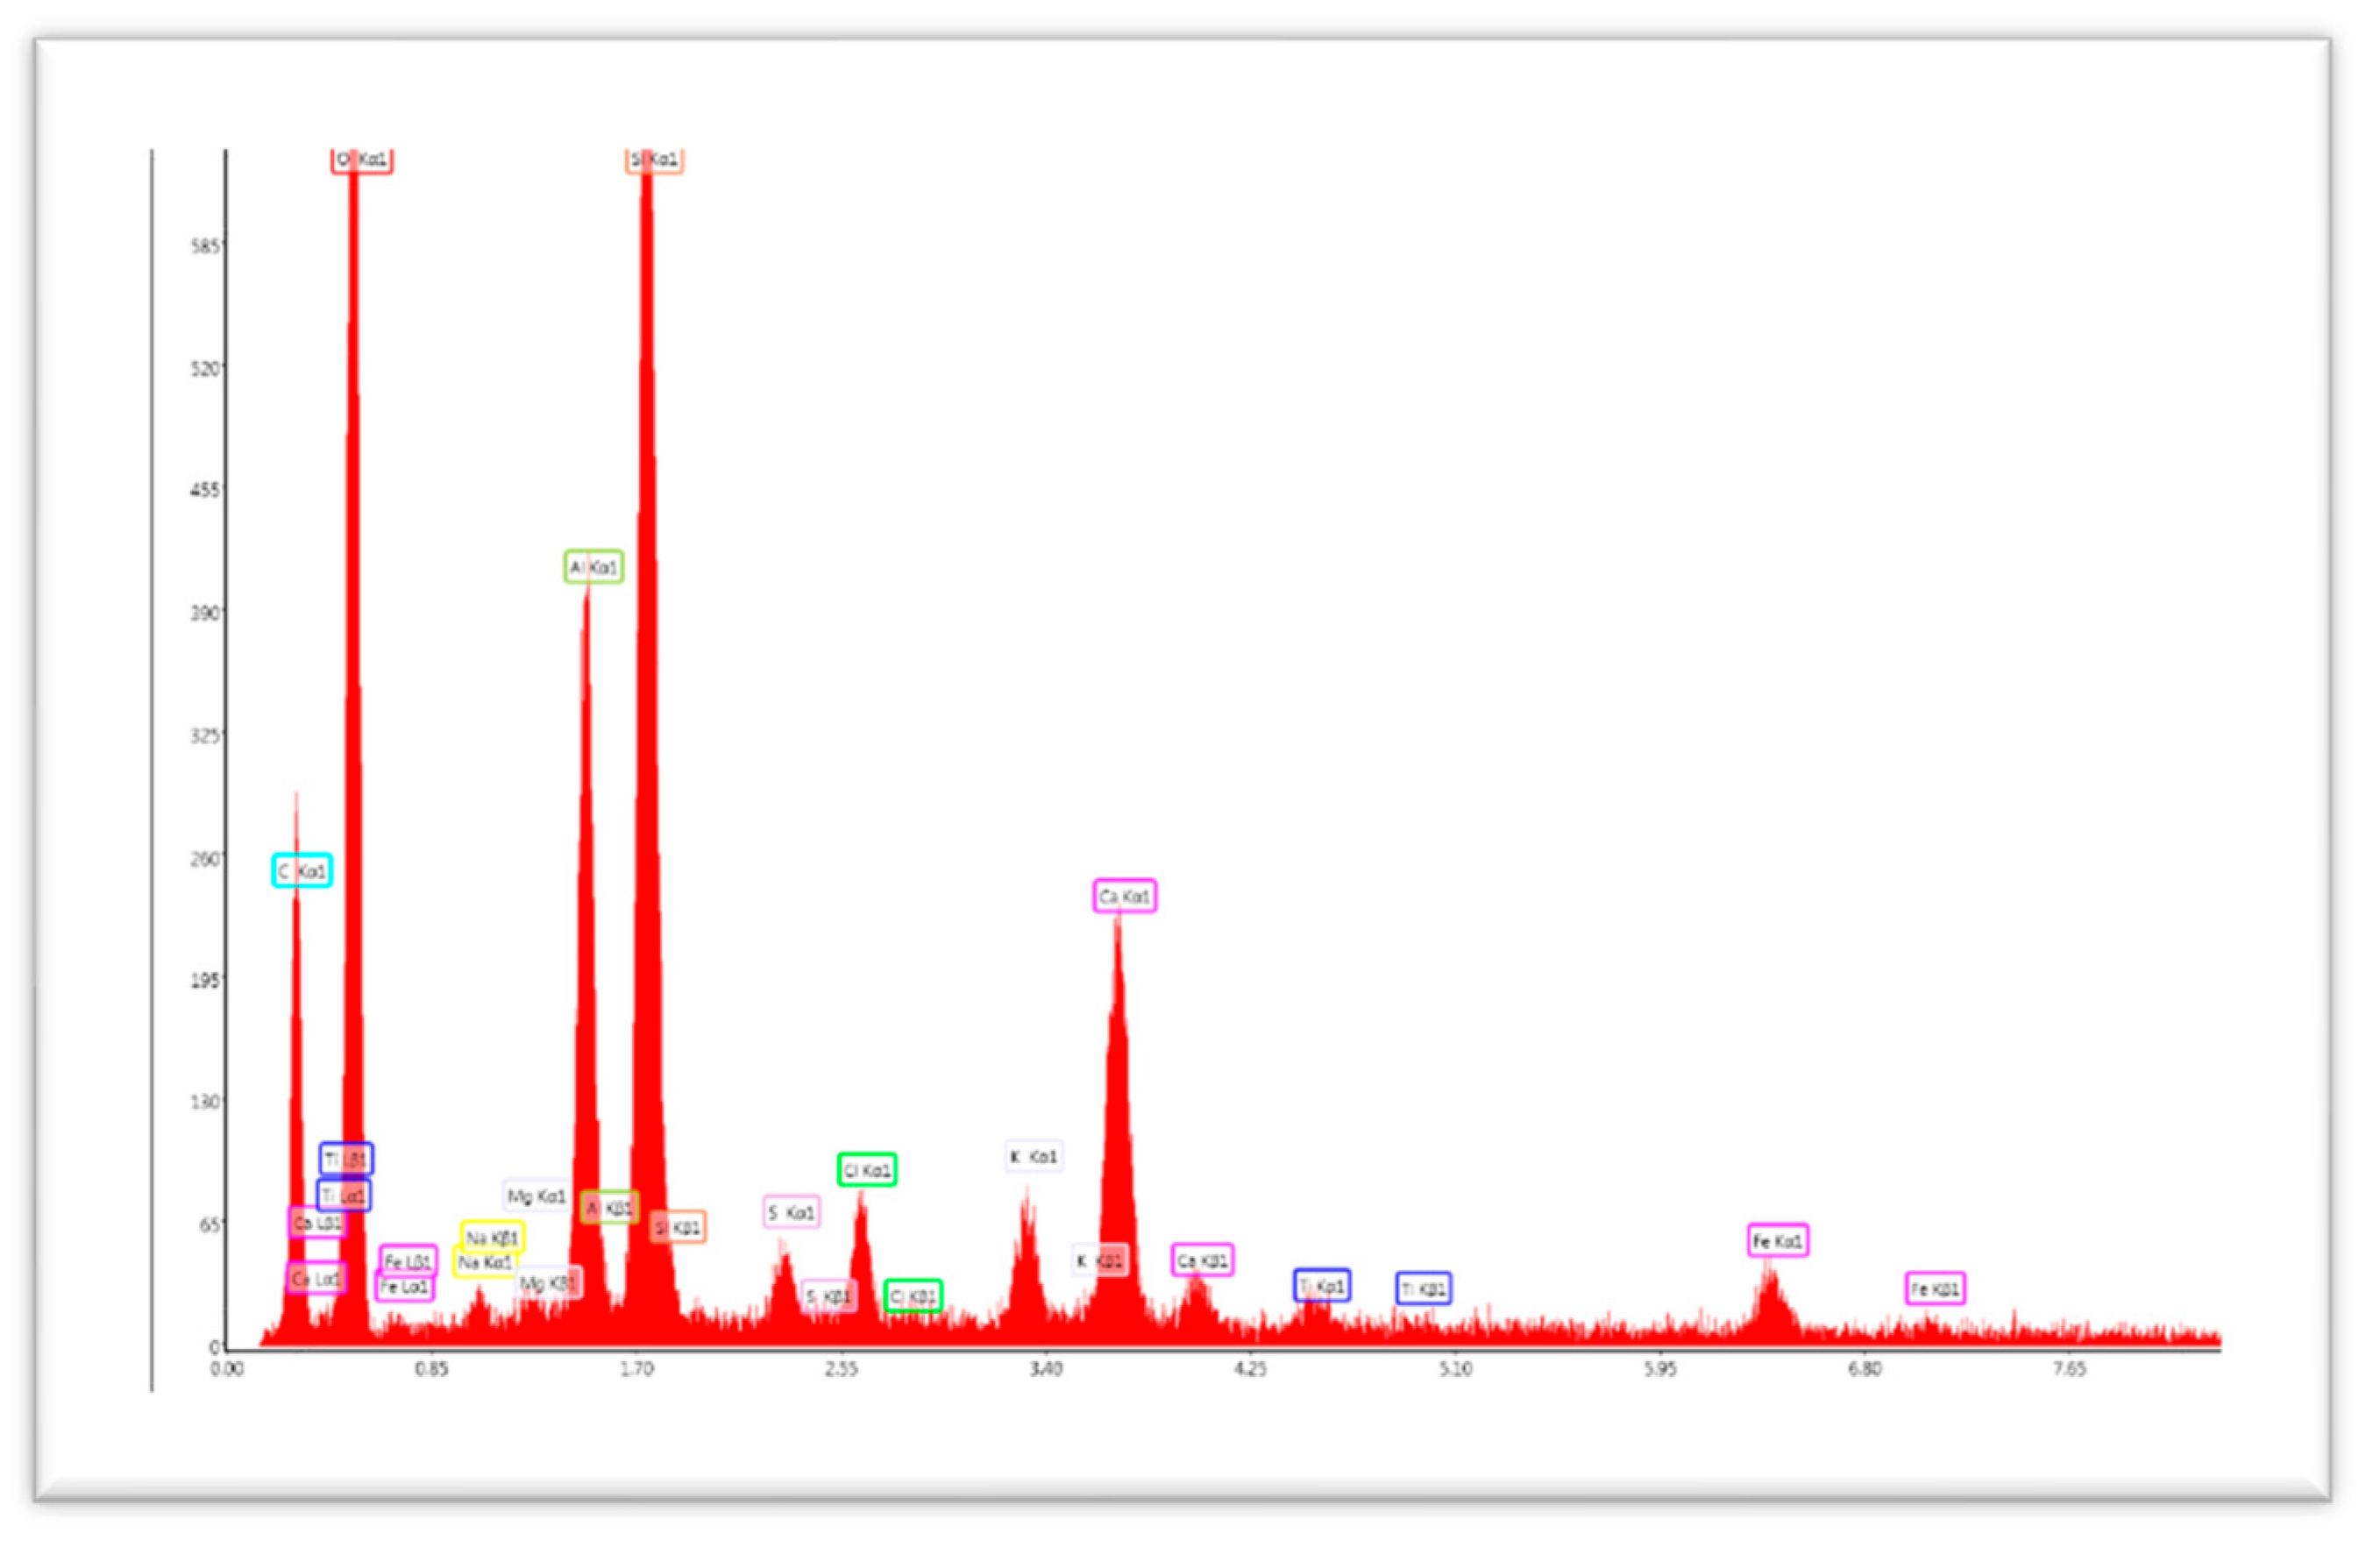
EDX is usually used to analyze the elemental constitution of solid samples. The EDX analyses for the Alginate- Moroccan clay bio-nanocomposite beads are shown in
Figure 2 and
Table 1.
EDX analysis of Alginate-Moroccan clay bio-nanocomposite beads shows that the average atom fractions of O, C, Si, and Al are approximately 54.04%, 33.83%, 5.45%, and 3.55%, respectively (in atomic percentage %). The appearance of the calcium atom Ca (equal to 1% in atomic %). This is due to the addition of alginate, which can contain Ca in its atomic chain from the marine environment.
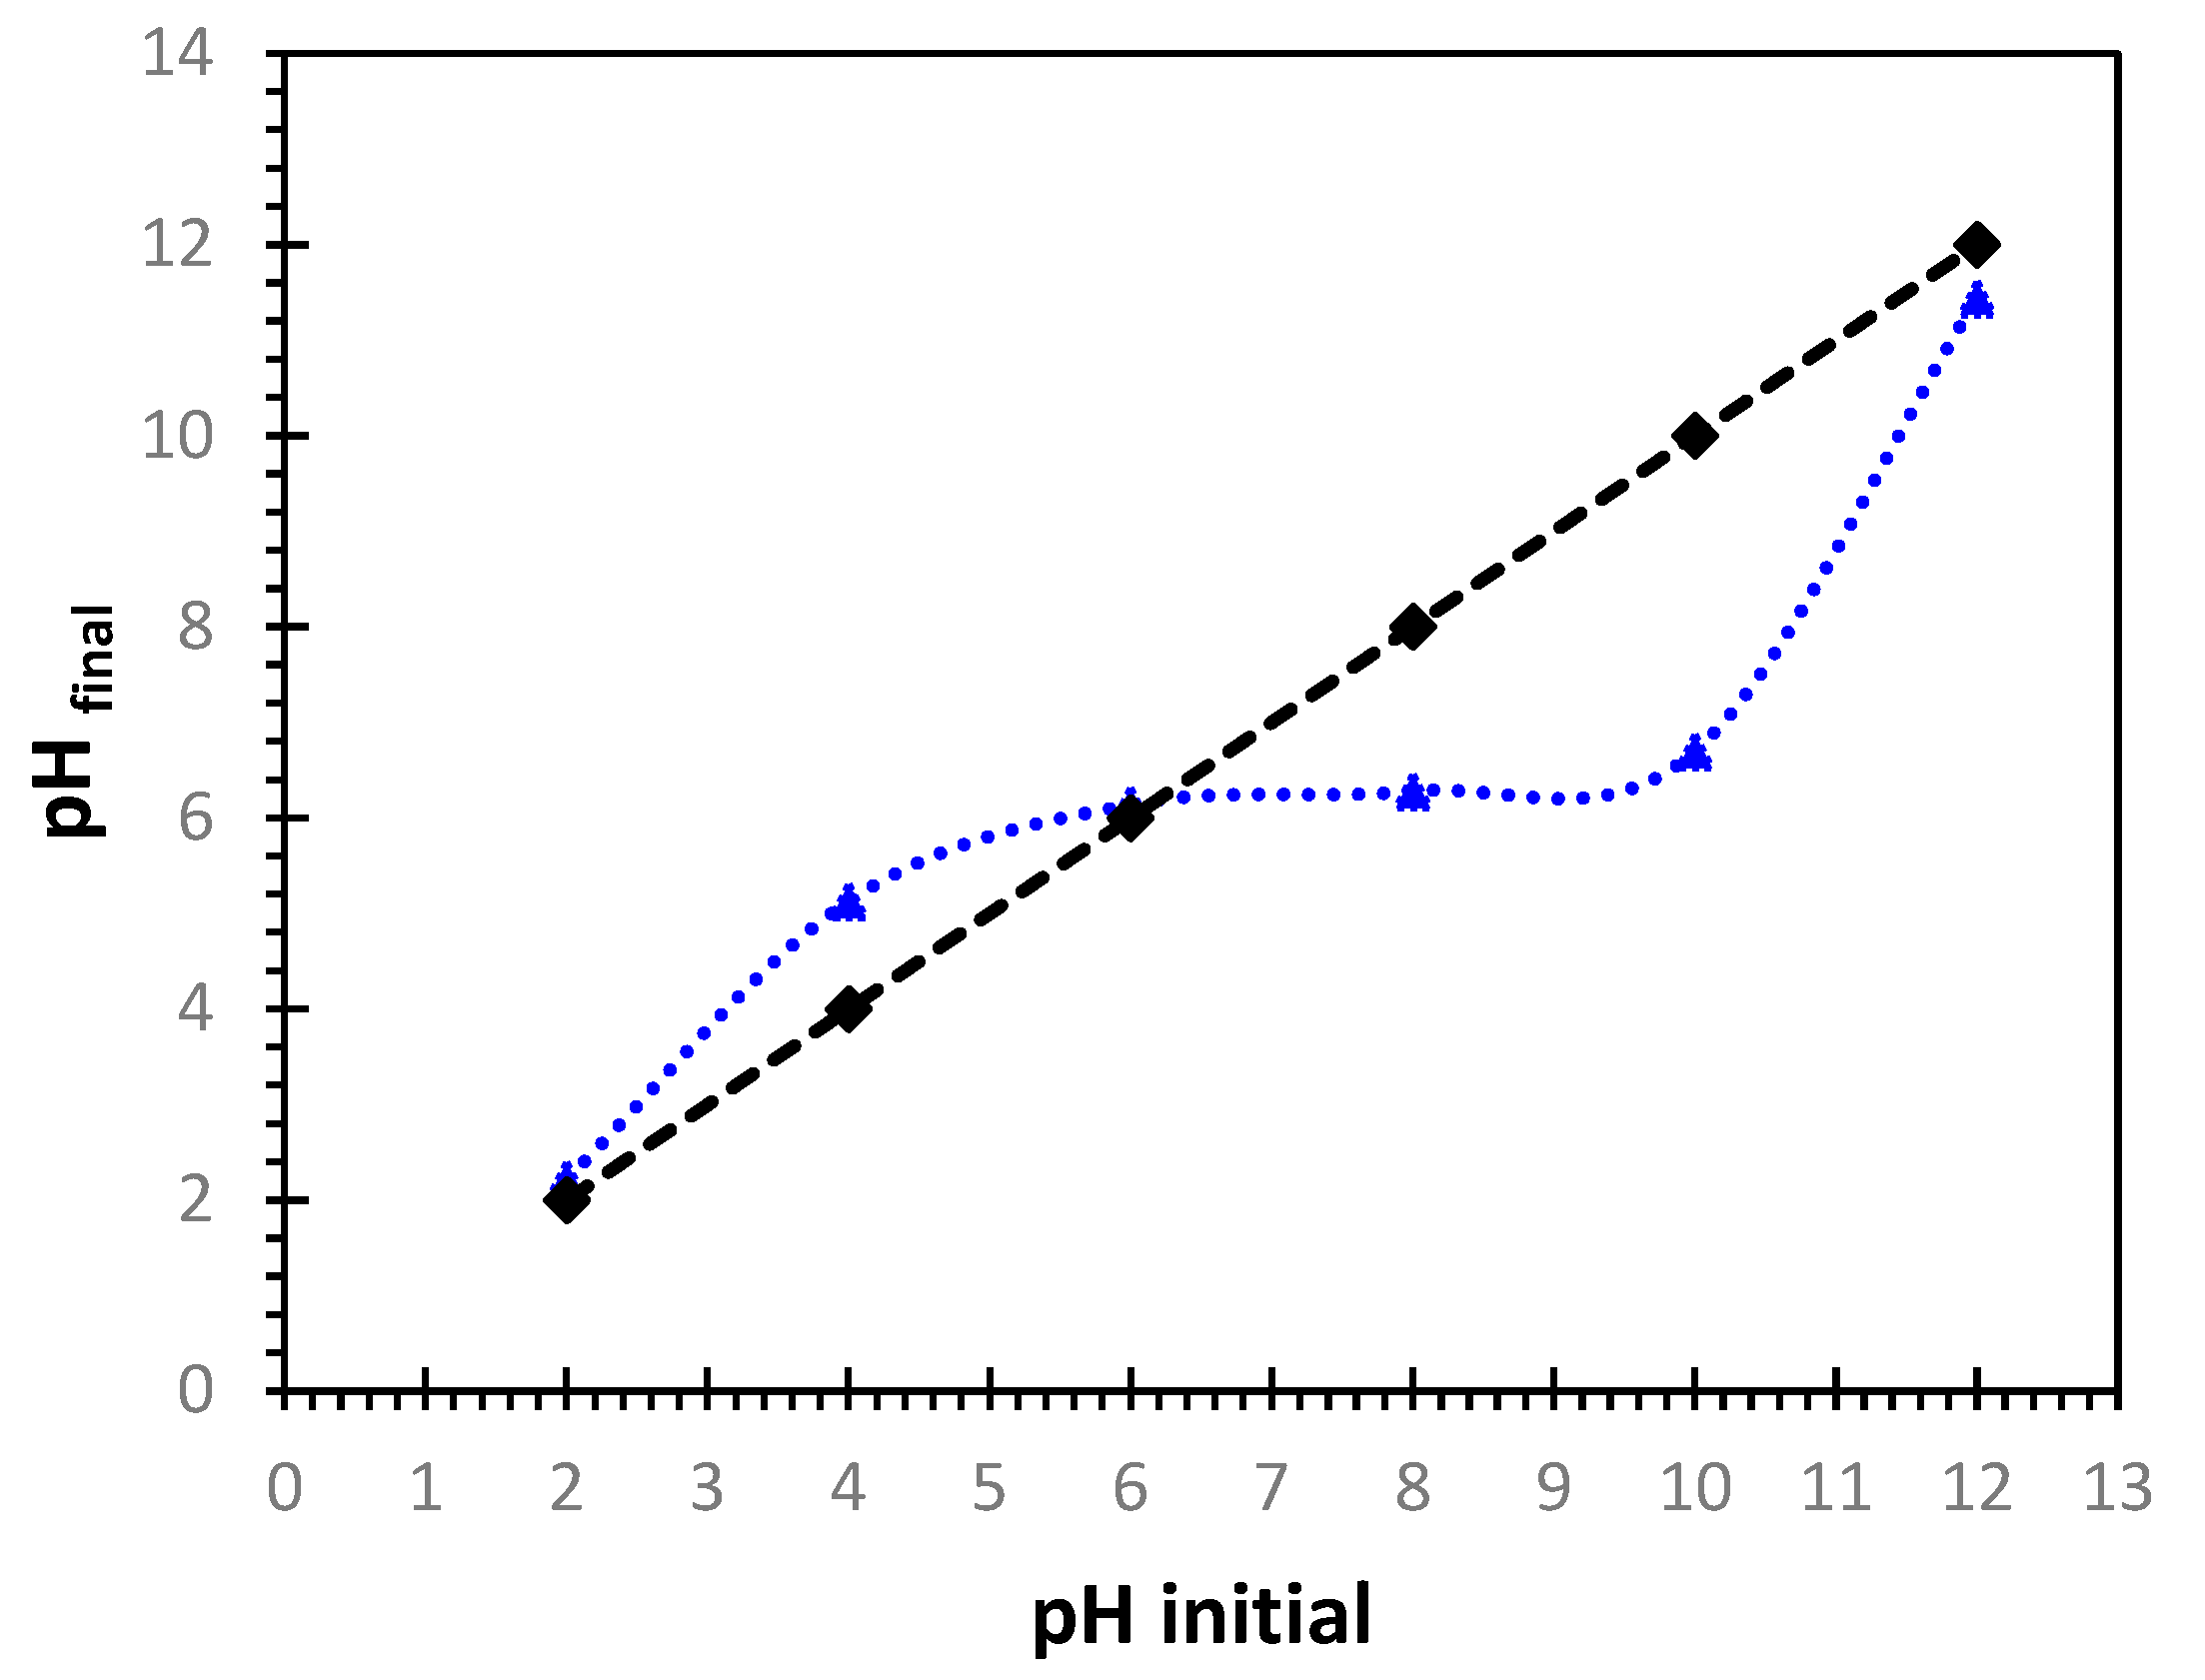
The zero-charge point pH
ZPC of the Alginate-Moroccan clay bio-nanocomposite beads used was found to be 6.2 (
Figure 3). This value shows that, at pH less than pH
ZPC, the surface of the Alginate-Moroccan clay bio-nanocomposite beads is predominated by positive charges, while at pH greater than pH
ZPC, the surface is predominated by negative charges. Thus, at pH< 6.2, the surface has a high positive charge density, so the uptake of negatively charged Cu
2+ and Ni
2+ ions would be limited. At pH > 6.2, the surface has a high negative charge density, so absorption of positively charged Cu
2+ and Ni
2+ ions would be significant [
20,
22].
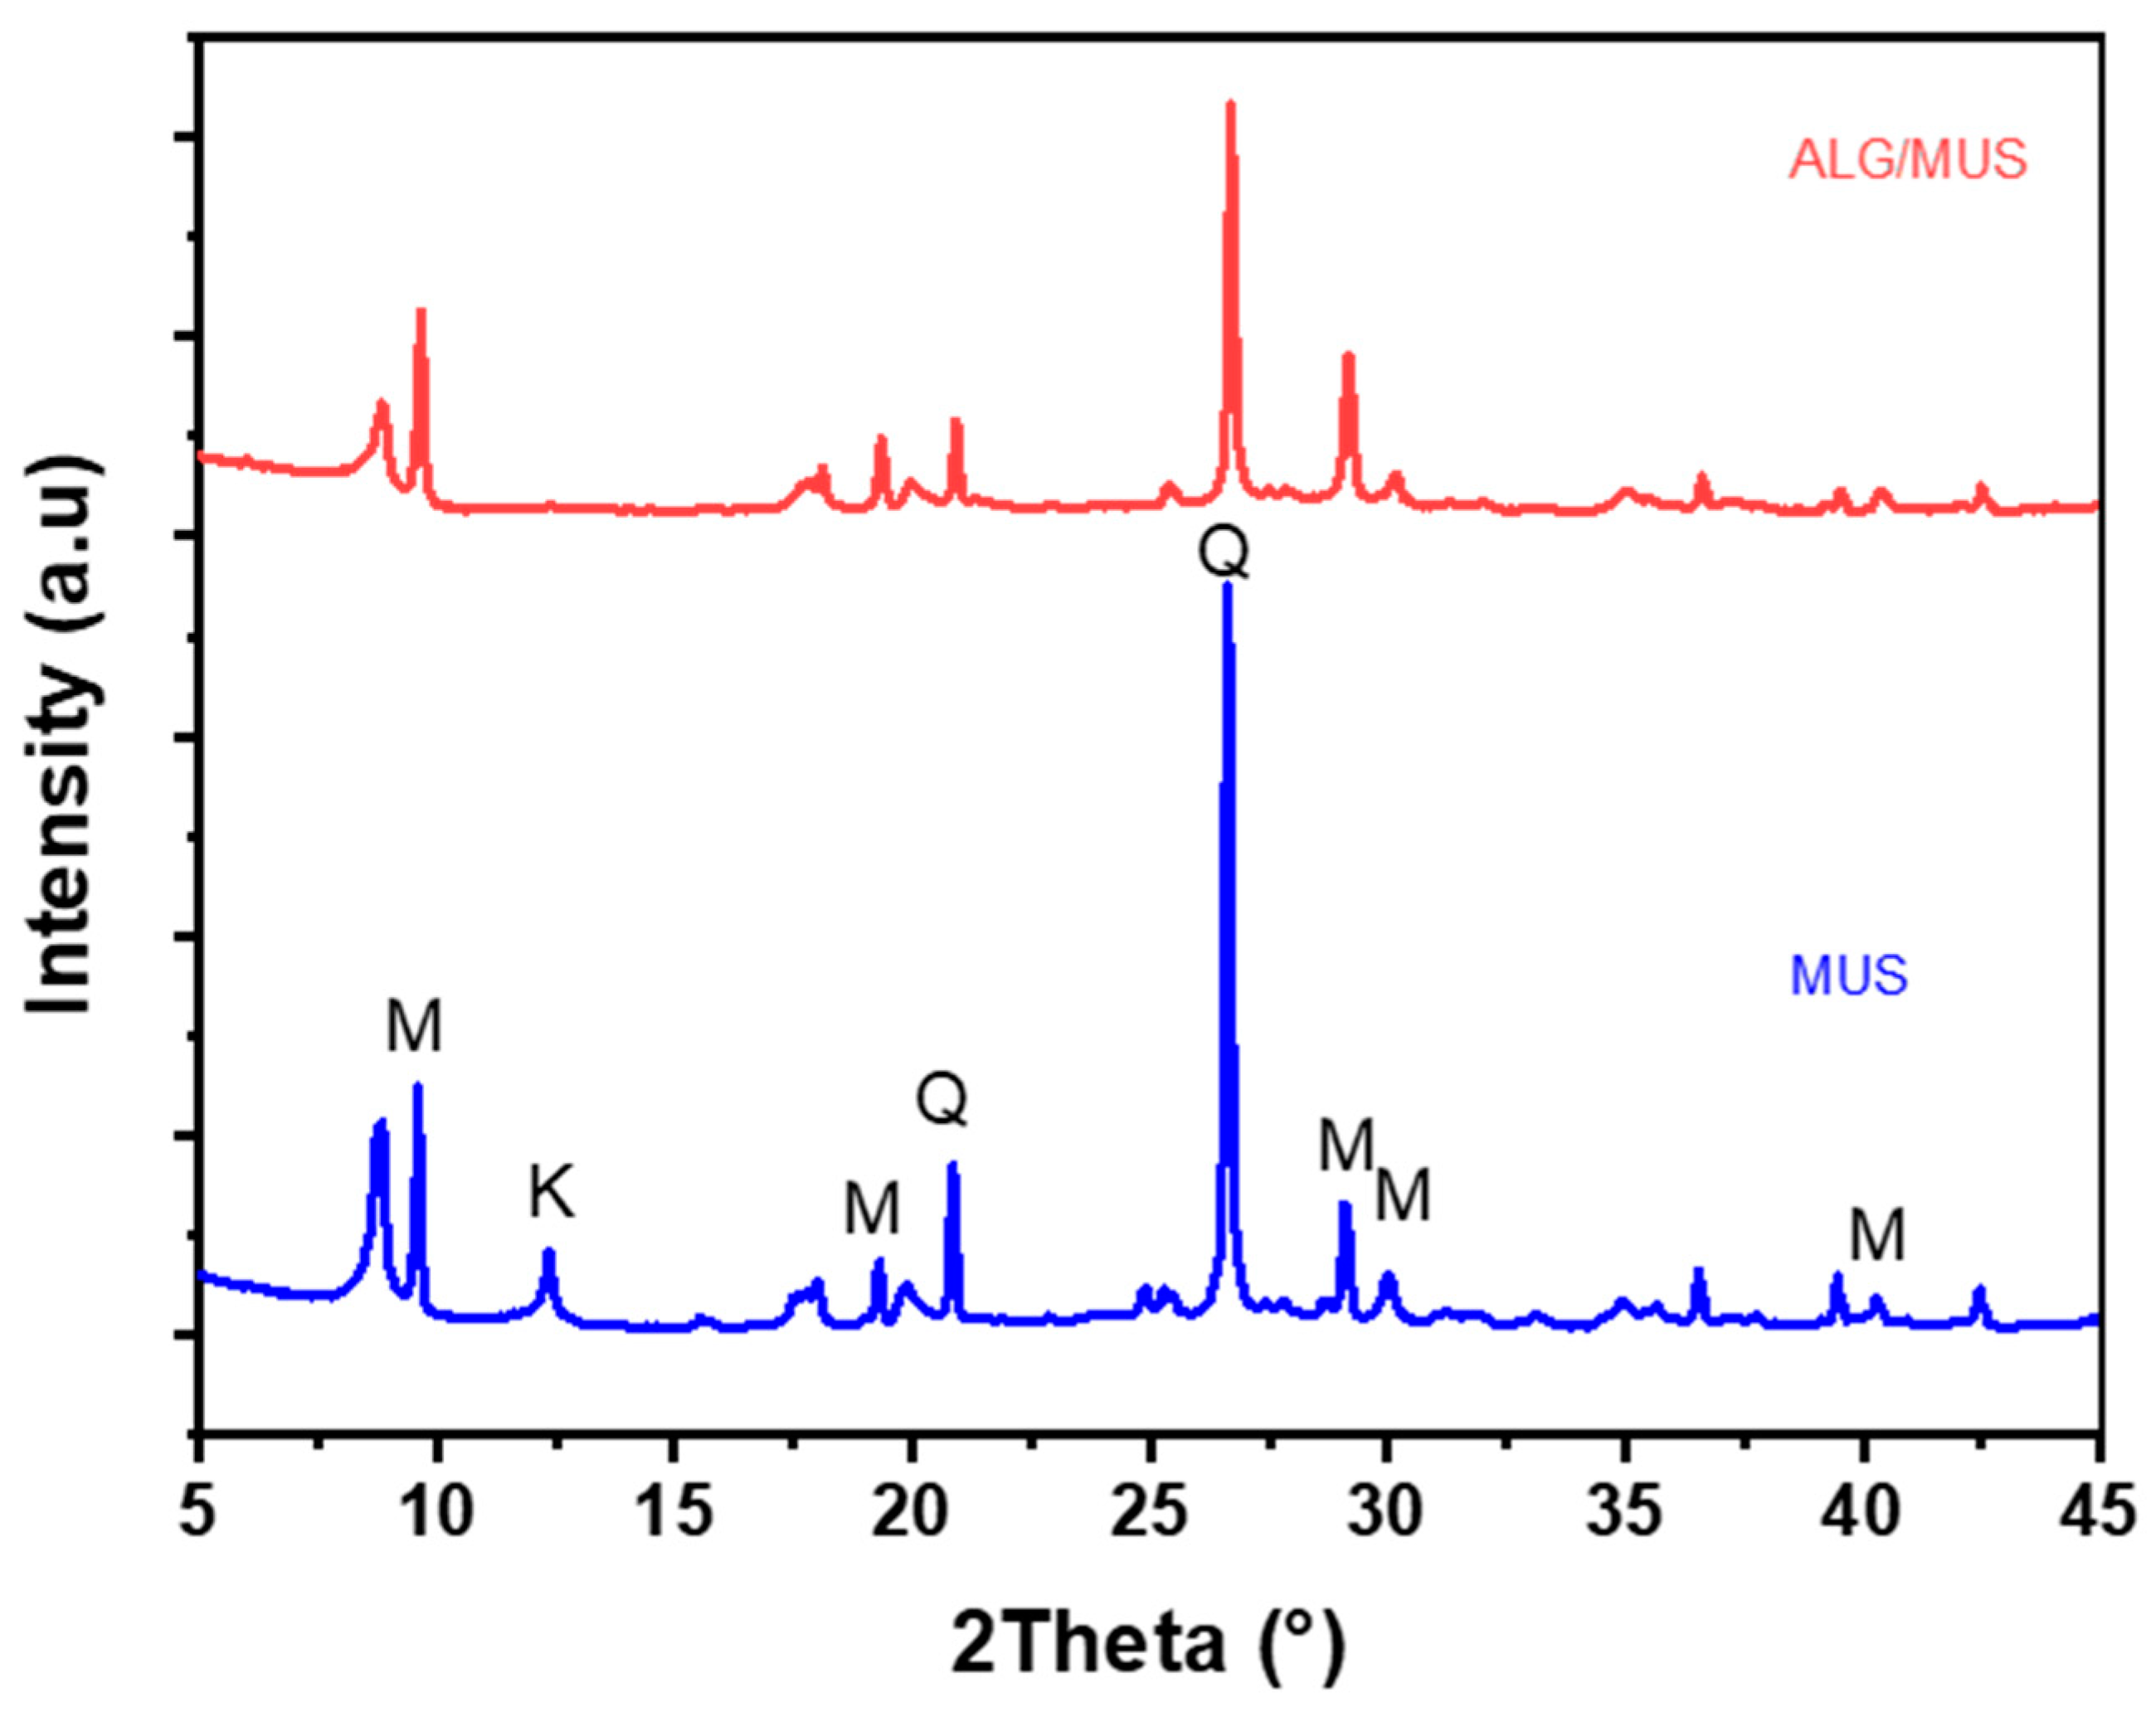
The X-ray Diffraction spectra of the Alginate-Clay bio-nanocomposite elaborated is displayed in
Figure 4. The X-ray diffraction analysis of Bio-nanocomposite elaborated was examined using a Bruker CCD-Apex apparatus equipped with an X-ray generator (Ni filtered Cu-Kα radiation) operated at 40 kV and 40 mA. Samples in powder form were scanned from 5° to 80° (2θ) at a step of 2°/min. The X-ray Diffraction patterns for Alginate-Clay Bio-nanocomposite are depicted in
Figure 4. The diffraction signals at 2θ values of 9.61°, 18.05°,19.85°, 29.13°, 35.03°, and 42.45° correspond to the lattice planes of clay (Muscovite) mineral. Additionally, there is a diffraction peak at 2θ = 20.95°, 26.68°, and 42.60°, indicating the presence of quartz [
23,
24]. The diffractograms of alginate-Moroccan clay bio-nanocomposites demonstrate the effective dispersion of clay layers within the amorphous alginate matrix (ALG). This dispersion is evident from the observed shifts and reduction in the intensity of the peaks, which are typically associated with the interbasal distances between the clay layers [
21,
25].
3.2. Single component systems adsorption of heavy metals ions by Alginate-Moroccan clay Bio-nanocomposite
3.2.1. Determination of m/V ratio
The ratio of the weight of Alginate-Moroccan clay bio-nanocomposite beads adsorbent to volume of the aqueous phase is a very important parameter of the adsorption process. Different weights (m) of Alginate-Moroccan clay bio-nanocomposite beads were shaken with
V = 50 ml of metal solutions of initial concentration value
C0 = 100 mg/L for 12 hours. The effect of adsorbent dosage on the removal of Cu
2+ and Ni
2+ cations at
C0 = 100 mg/L was studied by stirring in different masses at 25°C.
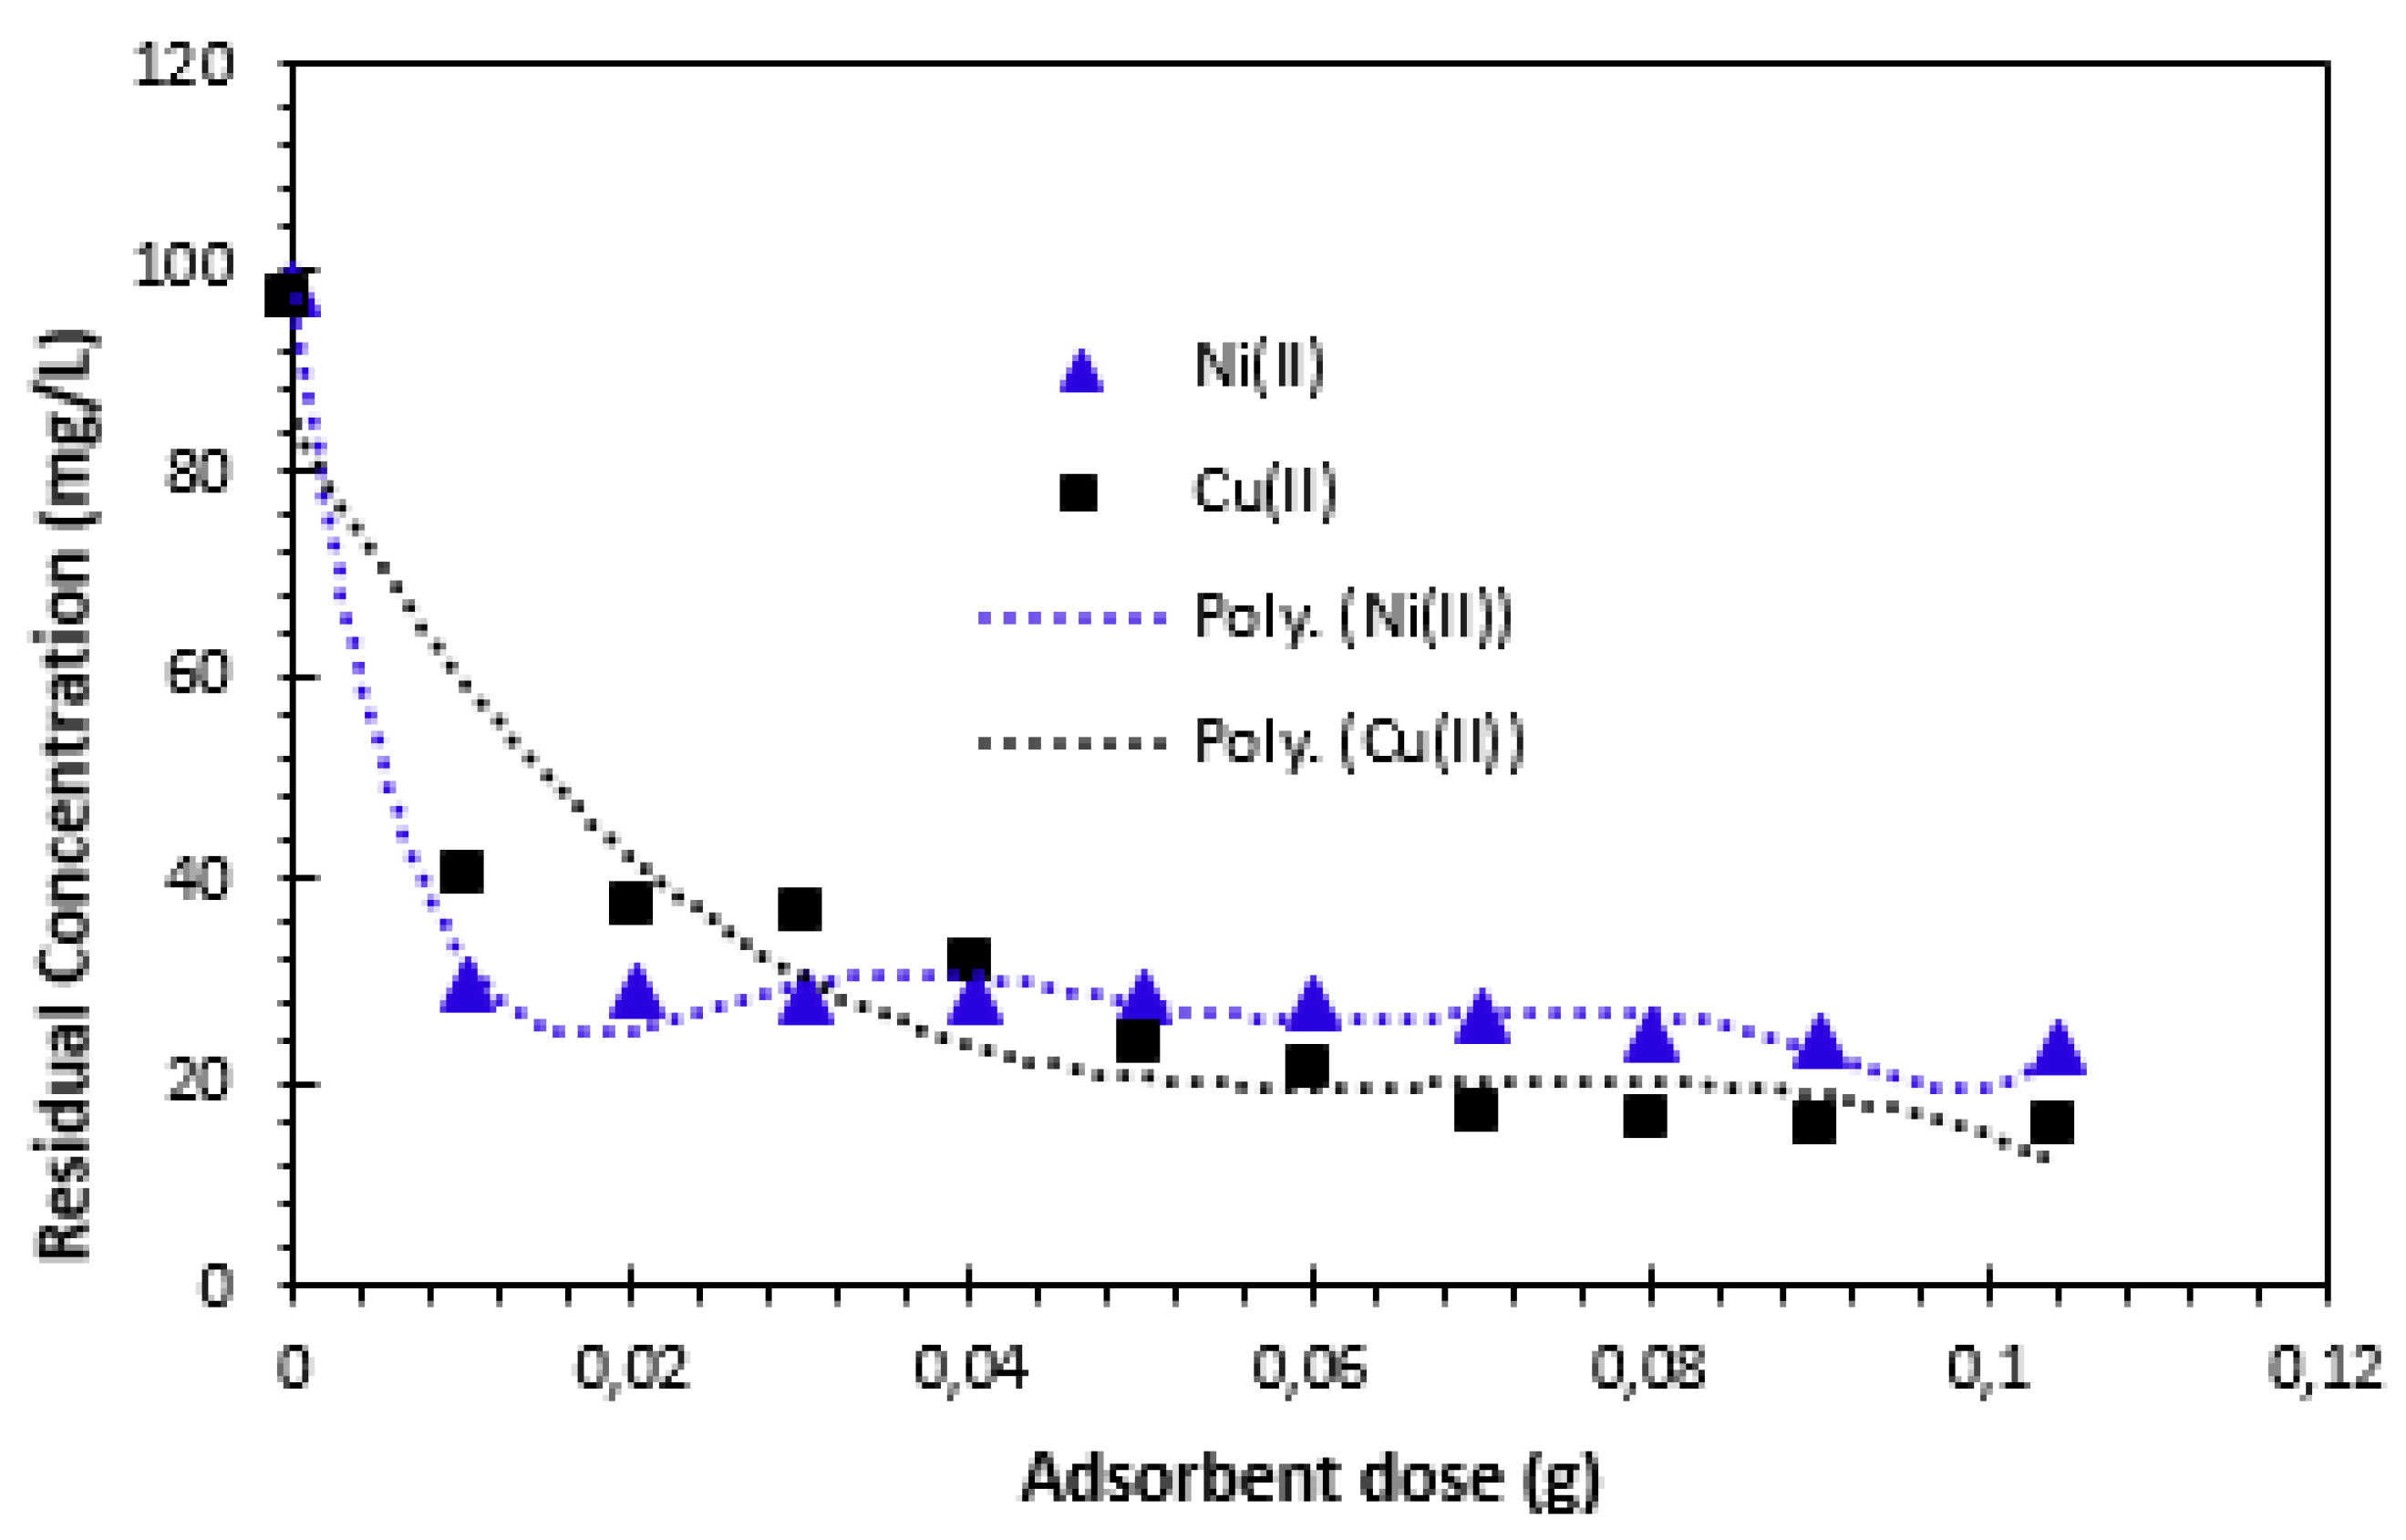
Figure 5 illustrates the variation in the amount of Cu
2+ and Ni
2+ cations adsorbed as a function of adsorbent mass.
The removal capacity of Cu
2+ and Ni
2+ cations increases with the adsorbent dose, which could be explained by the increase in the number of available adsorption sites [
26]. From these results, we can see that the relative adsorption capacity expressed in residual concentration decreases with increasing material mass, then stabilizes at an optimum mass equal to 0.05g for Cu
2+ and Ni
2+ cations. The results in
Figure 5 show that the amount adsorbed also decreased with increasing adsorbent mass, as a result of the retention capacity of the adsorbent's active surface for copper and nickel ions. As the adsorbent dosage was added, the amount adsorbed continued to decrease until it stabilized. Consequently, the optimum adsorbent dose was set at 50 mg for the remainder of the study.
The removal of Cu
2+ and Ni
2+ cations in contact with Alginate-Moroccan clay bio-nanocomposite beads indicate that Cu
2+ and Ni
2+ cations solutions show a higher adsorption capacity up to the value of ratio R = 1 g/L (50 mg/50 mL), and that any further addition of Alginate-Moroccan clay bio-nanocomposite beads does not show a significant increasing effect on the retention process. This result can be explained by the fact that a large quantity of adsorbent creates particle agglomerations, resulting in a reduction in the total adsorption surface area and, consequently, a decrease in the quantity of adsorbate per unit mass of adsorbent [
21,
26,
27]. This result shows that 0.05 g of Alginate-Moroccan clay bio-nanocomposite per 50 mL of solution, corresponding to a mass/volume ratio equal to 1 g/L (R=1 g/L), is sufficient to achieve adsorption equilibrium for Cu
2+ and Ni
2+ cations after a contact time of 12h.
3.2.2. Effect of contact time
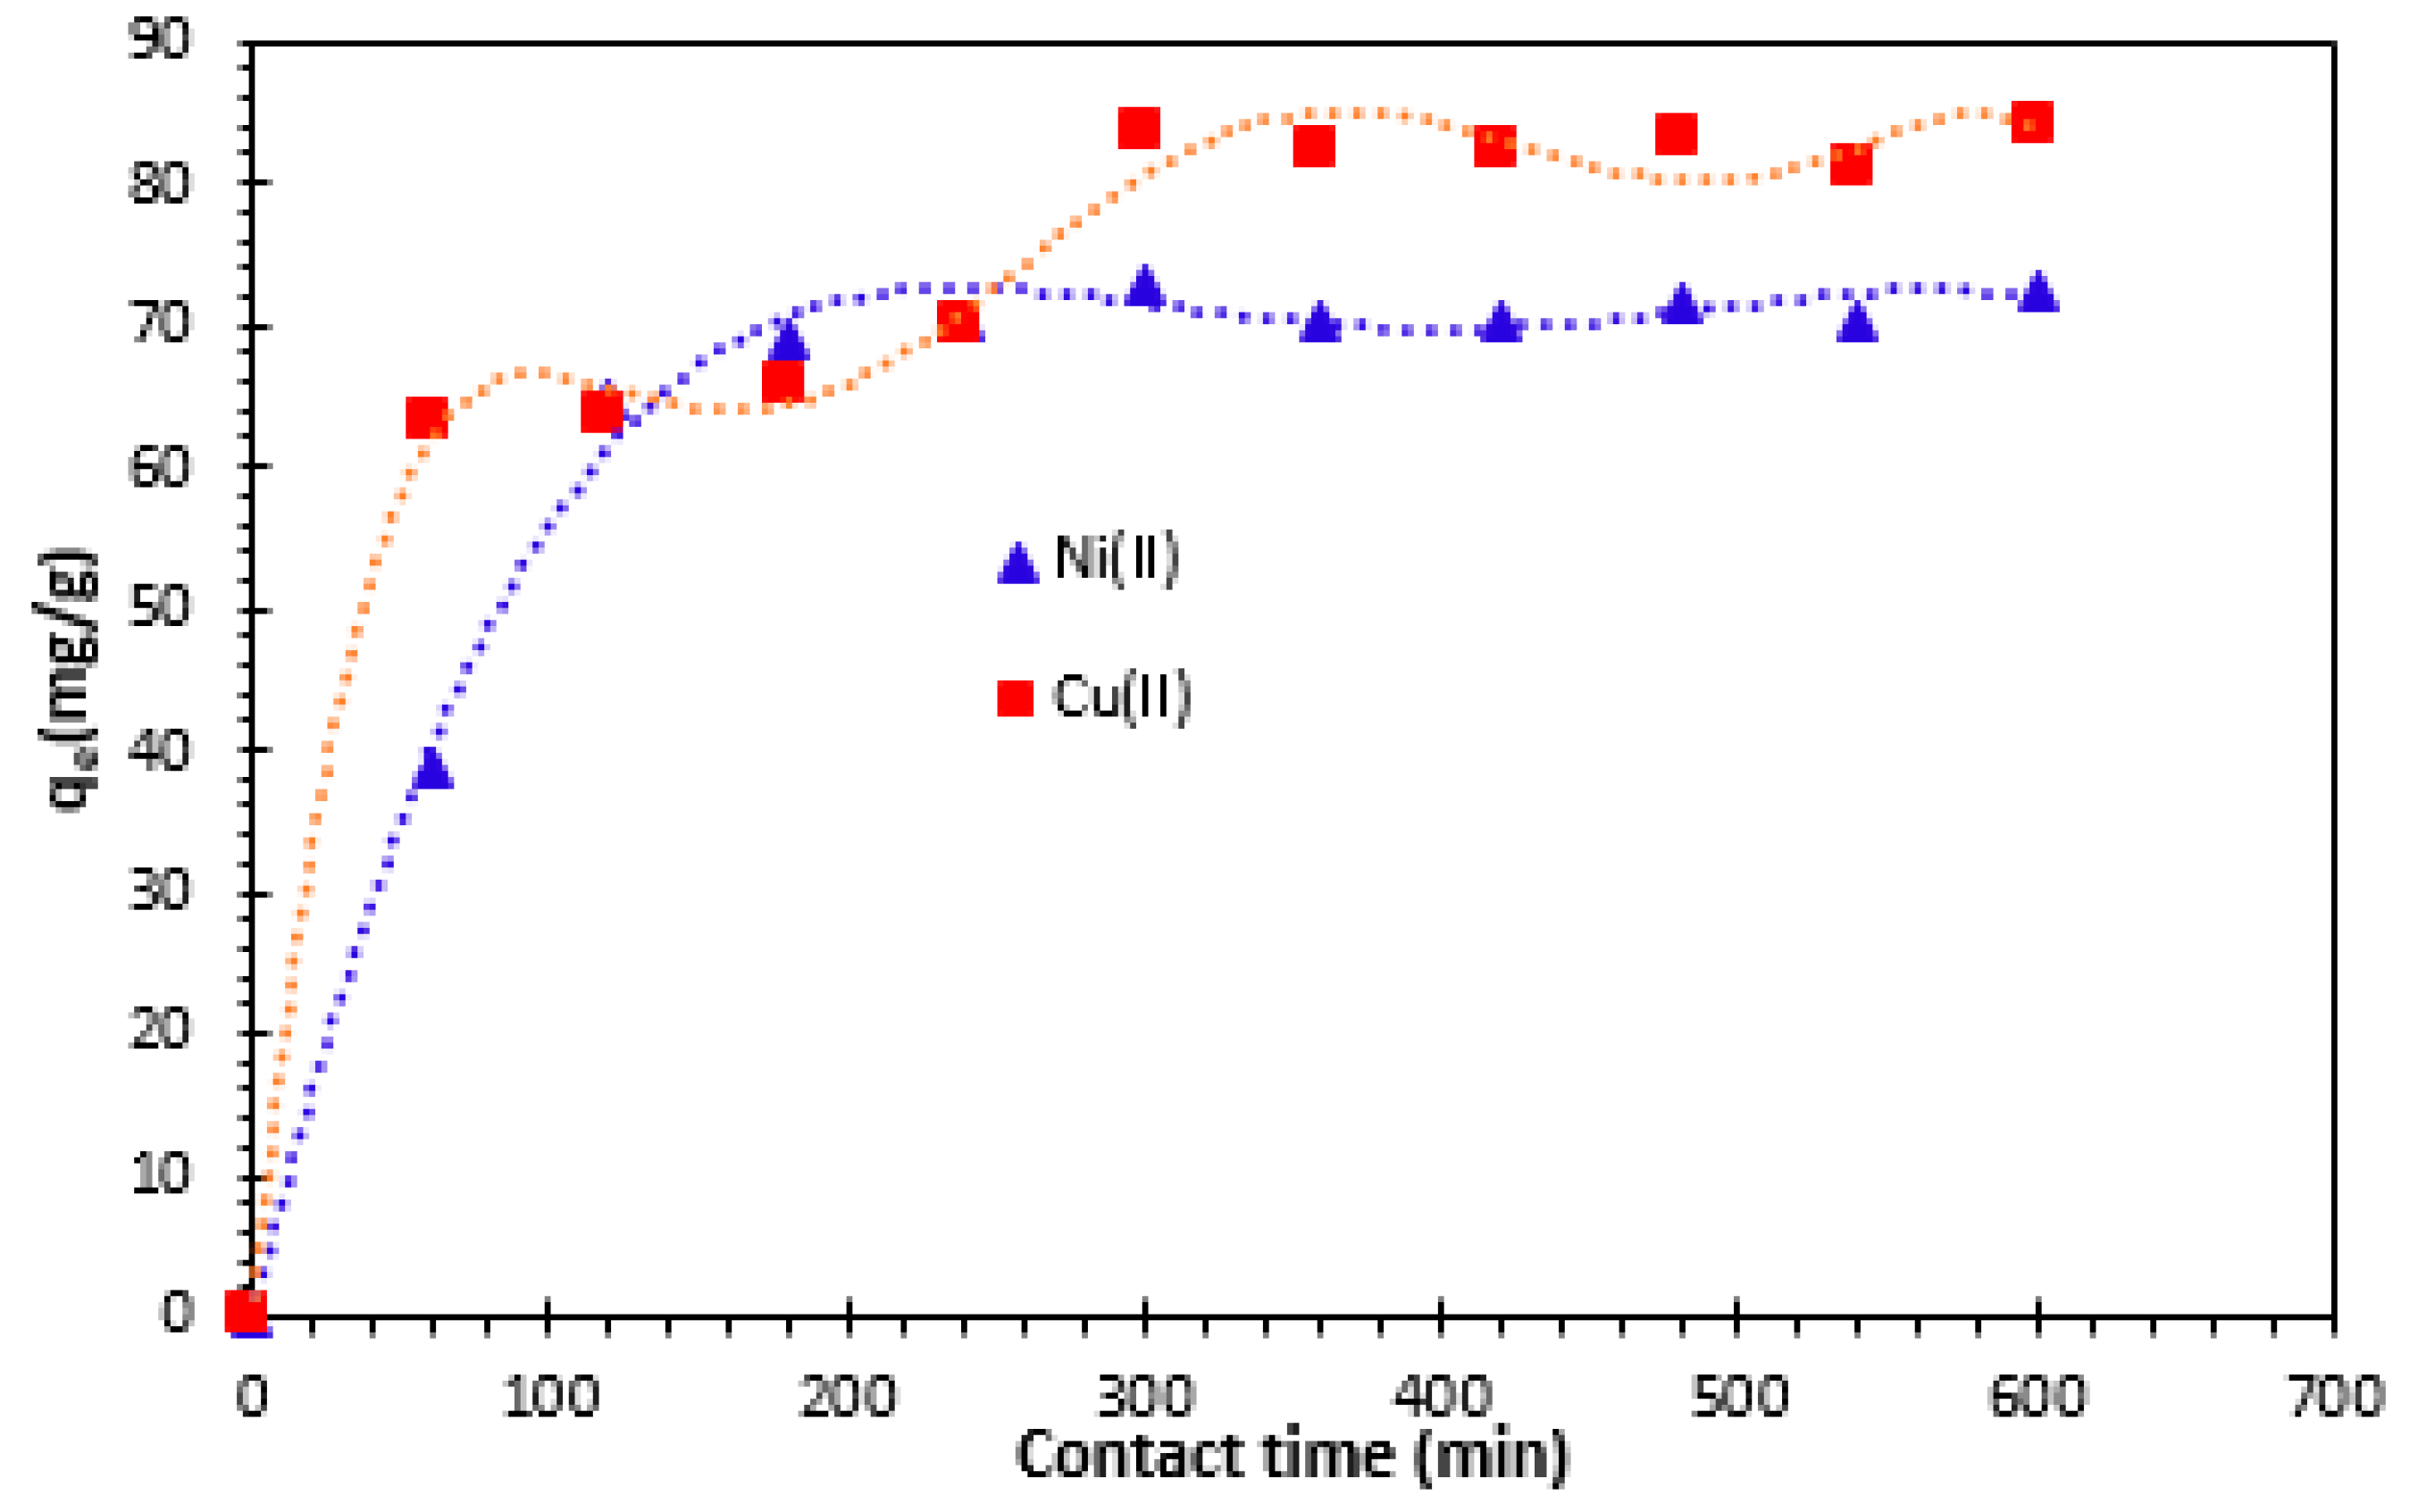
To establish an appropriate contact time between the Alginate-Moroccan clay bio-nanocomposite beads and solutions metallic ions, adsorption capacities of metal ions were measured as a function of time. As shown in
Figure 6, the results revealed that the removal of Cu
2+, and Ni
2+ ions seems to occur in two steps.
The first step is relatively rapid, and the second indicate the achievement of the equilibrium. This time is largely sufficient to establish equilibrium for the study of parameters influencing the removal of Cu
2+ and Ni
2+ cations by Alginate-clay bio-nanocomposite studied. When equilibrium is established, the adsorption rate stabilizes. The rapid step is probably due to the abundant availability of the active sites on the Alginate-Moroccan clay bio-nanocomposite beads surface, and, with the gradual occupancy of these sites, the adsorption becomes less efficient in the second slower step [
26,
28]. For Alginate-Moroccan clay bio-nanocomposite beads, the amount of Cu
2+ and Ni
2+ adsorbed stabilizes at a contact time of 300 min. After adsorption reached equilibrium, the adsorption capacities of Ni
2+ and Cu
2+ were of 72.72 and 83.30 mg/g at 300 minutes. This high level of adsorption could be explained by the existence of readily available reactive sites on the outer surface of the bio-nanocomposite beads, which facilitated the removal of Cu
2+ and Ni
2+ cations during the initial phase [
29].
A similar study was carried out by Benhima et al., (2011) [
26] on the elimination of metallic ions such as Pb
2+, Zn
2+, Cd
2+ and Cu
2+ cations by microparticles of W. frutesens plant as an adsorbent. Benhima et al., (2011) observed that the adsorption of the metals studied takes place in two stages. The first stage involves rapid metal uptake, the second stage is characterized by adsorption equilibrium at 300 minutes.
Barrak et al., (2022) [
21] carried out a similar kinetic study of Cu
2+ adsorption on Sodium alginate encapsulated Moroccan clay beads and showed that, after 190 min, the adsorption capacityof Cu
2+ was 60.05 mg/g.
3.2.3. Effect of initial solution pH
The examination of the pH impact was carried out according to the following method. In the initial step, 0.06 grams of bio-nanocomposite beads studied were introduced into multiple flasks, each containing 50 mL of Cu
2+ and Ni
2+ cations solution. The study of the effect of solution pH on the adsorption of Cu
2+ and Ni
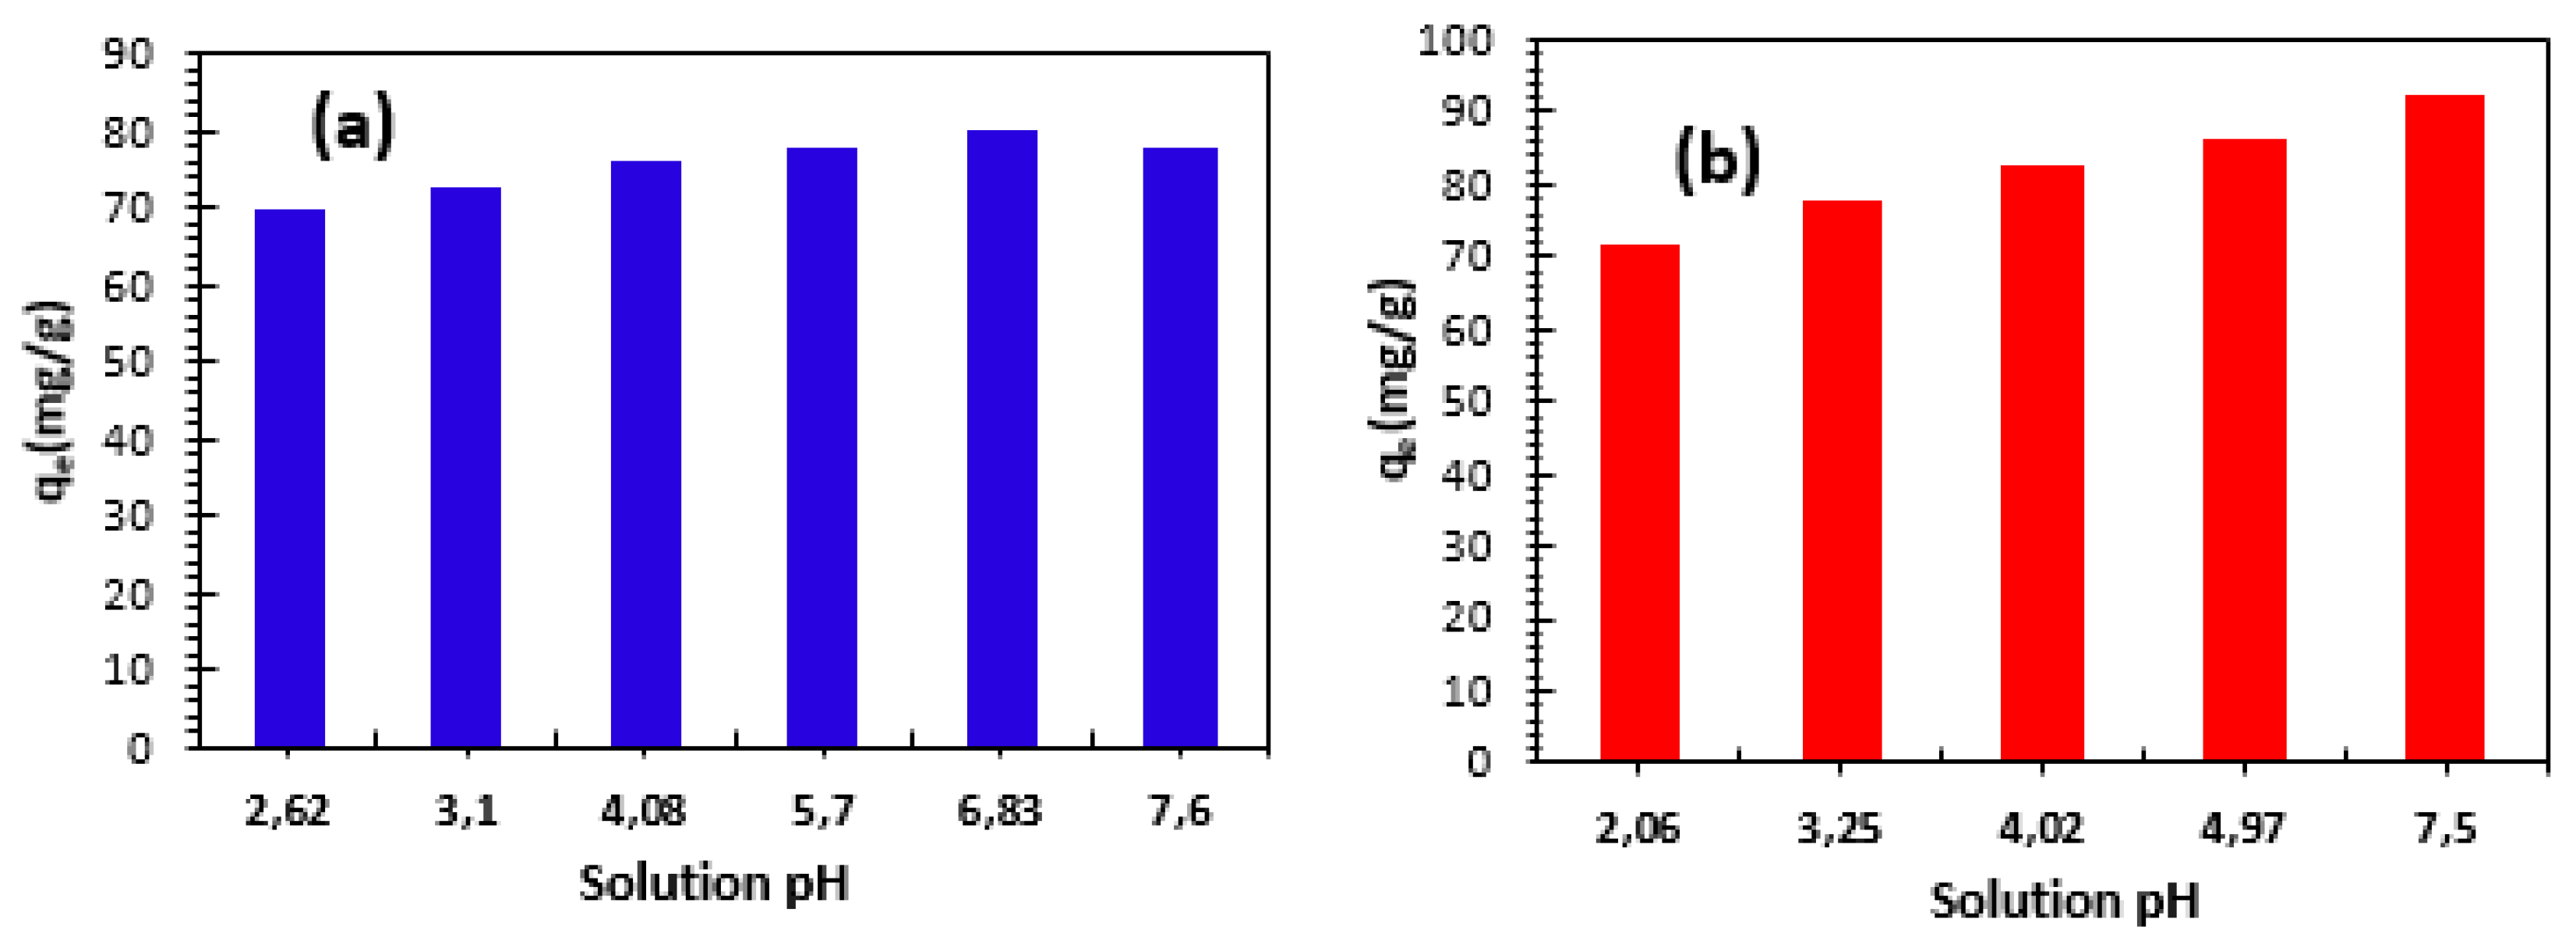
2+ cations was carried out at an initial concentration of 100 mg/L and at different pH values. The pH ranged from 2.06 to 7.5 for Cu
2+ and from 2.62 to 7.5 for Ni
2+.The results are shown in
Figure 7. This figure shows that, for the metal ions studied, the increase in pH leads to an increase in the adsorption capacity of Alginate-Moroccan clay bio-nanocomposite beads.
We can see that, at pH> pH
ZPC, the strong increase in adsorption capacity can be explained by the electrostatic attraction between the cations and the negatively charged adsorbent surface [
20,
30].
A similar behavior was observed by
Stefan and Meghea, (2014) [
31] for the removal of Ca
2+, Pb
2+ and Ni
2+ cations using Purolite1 S930 ion exchange resin. It is supposed that, while the pH increases, the proton concentration inside the aqueous medium is lowered and the dissociation processes of hydroxyl and carboxyl active groups are intensified, allowing metal ions to bind more easily to the resin's active centers.
3.2.4. Effect of temperature
The influence of solution temperature on the adsorption of Cu
2+ and Ni
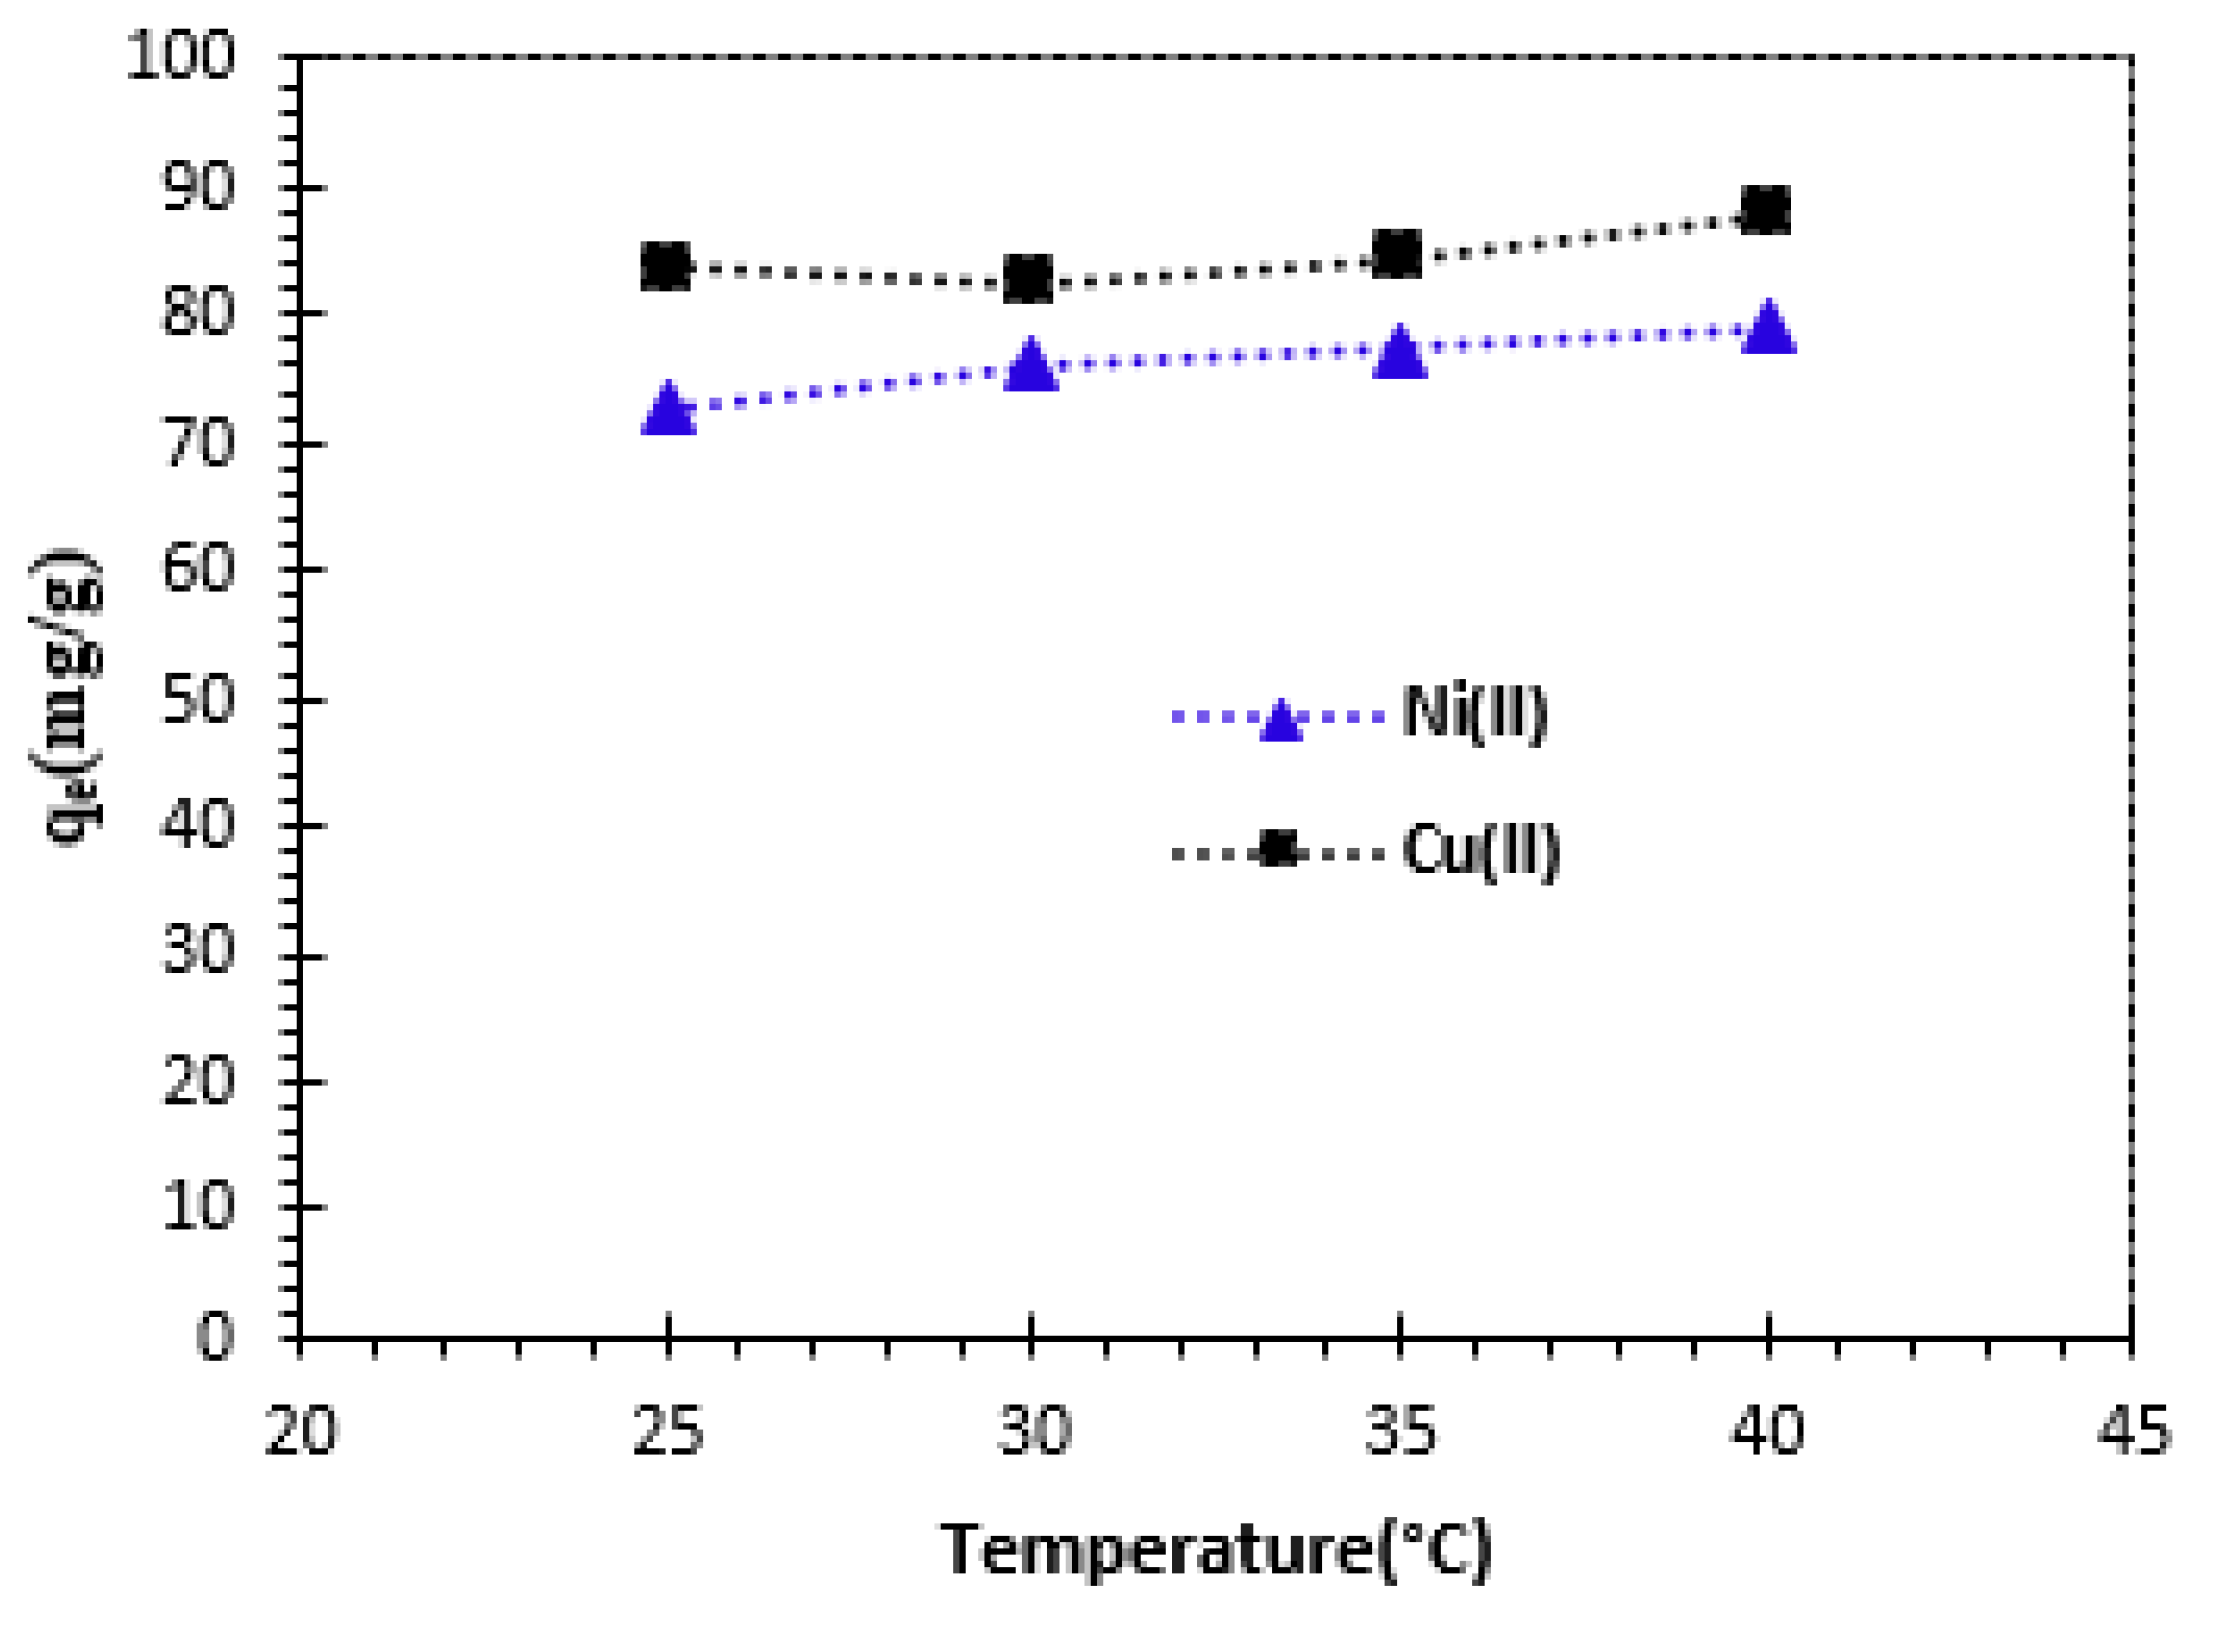
2+ cations was tested over a temperature range from 25 to 40°C, with an initial concentration of 100 mg/L (
Figure 8). Increasing the temperature from 25°C to 40°C resulted in a slight increase in the adsorption capacity of the Alginate-Moroccan clay bio-nanocomposite beads used. The adsorbed amount was set at 83.64 mg/g for Cu
2+ and 72.73 mg/g for Ni
2+ at 25°C.
These results lead to the conclusion that adsorption capacity increases with increasing temperature, suggesting endothermic adsorption. These results can be verified by determining the thermodynamic parameters.
A similar study was carried out by
Alothman et al., (2020) [
32] on the adsorption of metal ions (Cu
2+, Pb
2+ and Cd
2+cations) by low-cost bio-sorbents from fungi. This study showed that the adsorption capacity increases from 10°C to 60°C. The bio-sorption efficiency increased, due to greater affinity of the active sites, leading to greater attraction of heavy metal ions.
3.3. Adsorption kinetic models
The adsorption process consists in three steps:
- -
External diffusion which means the mass transfer of the adsorbate from the bulk solution to the external surface of the adsorbent;
- -
Internal diffusion of the adsorbate through the pores of the adsorbent;
- -
The adsorption itself on the active centers of the adsorbent.
The slowest step among the three steps is the rate limiting step. This can be elucidated by fitting different kinetic models to establish the most probable adsorption mechanism. The experimental data on adsorption kinetics were examined using a variety of kinetic models, pseudo-first-order model, pseudo-second-order model, Elovich model and intraparticle diffusion model [
20].
3.3.1. Pseudo-first order kinetics model
The kinetics equation of pseudo-first order model and its linearized form may be represented as follow [
20,
33,
34,
35,
36,
37]:
Where k1 (min−1) is the rate constant for the pseudo-first order kinetics model, qe (mg/g), qt (mg/g) are the amounts of Cu2+ and Ni2 cations retained on weight unit of adsorbent at equilibrium, and at any time t (min), respectively.
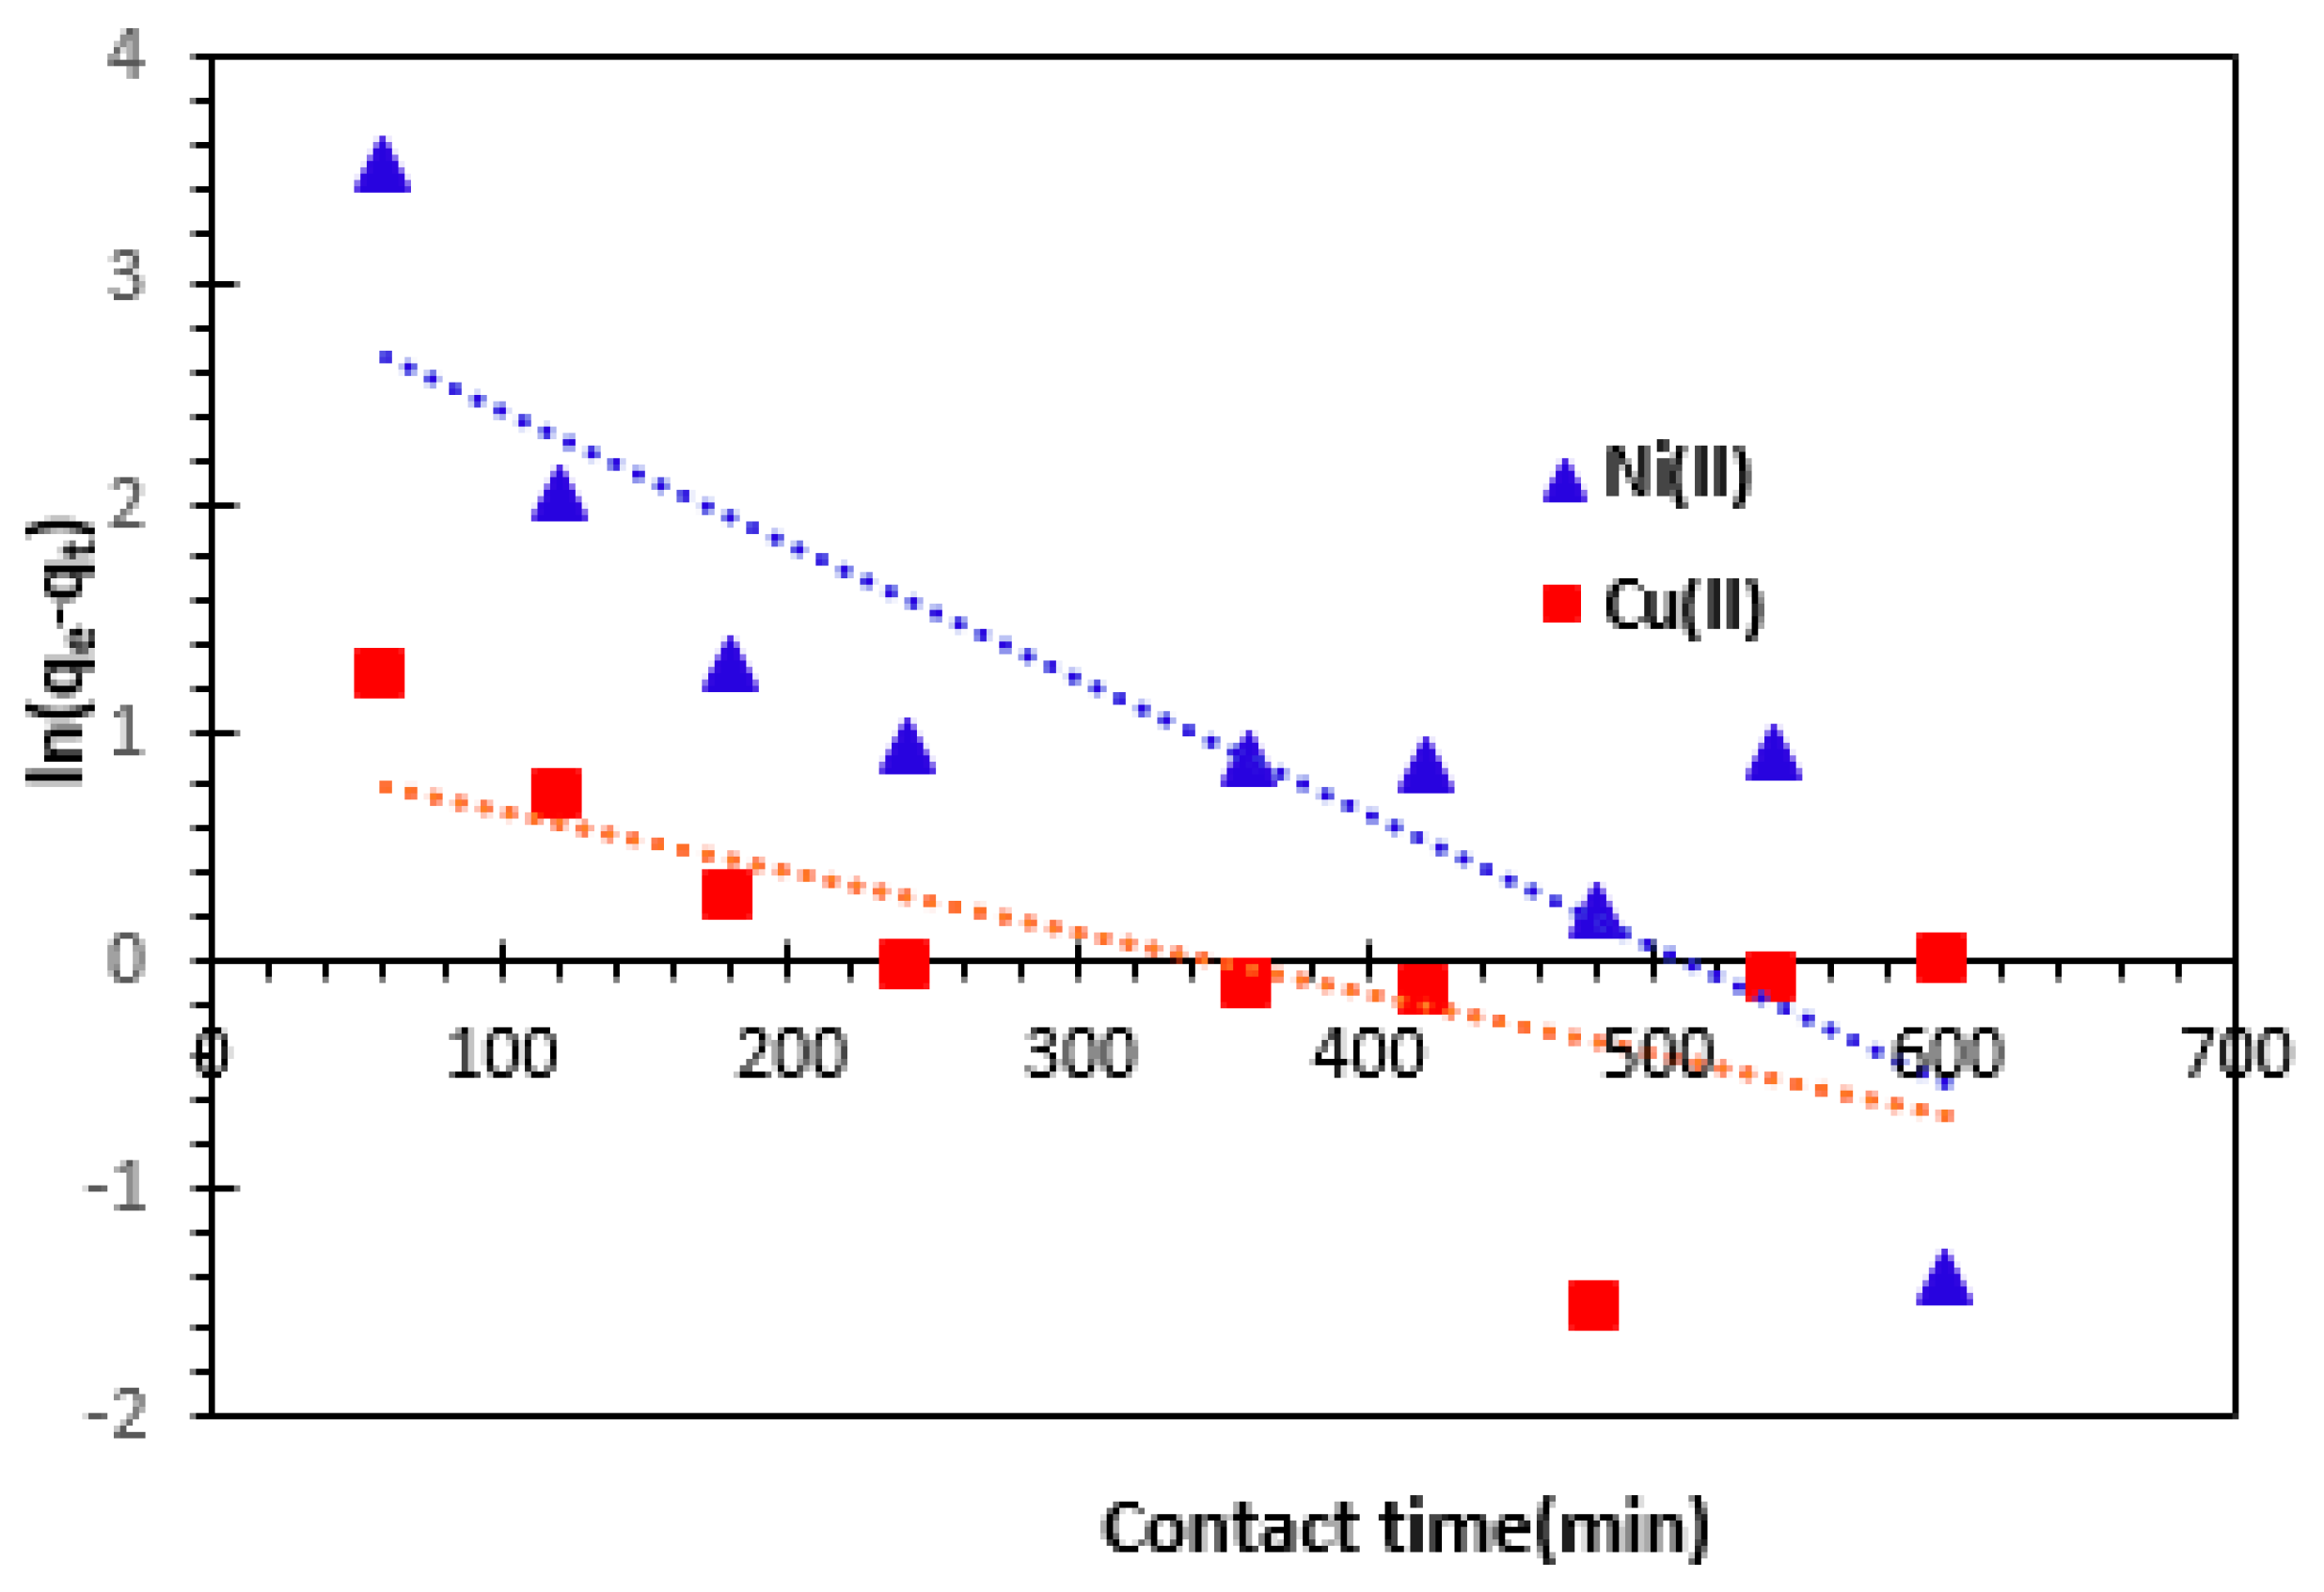
The plot of ln (
qe-qt) versus contact time
t for Alginate-Clay bio-nanocomposite beads, gives a straight line of slope
–k1 and intercepts
lnqe (
Figure 9). The values of the theoretical adsorption capacity (
qe, the), the rate constant for the pseudo-first order kinetics model (k
1) and the correlation coefficient (
R2) are presented in
Table 2. The table shows that the value of theoretical adsorbed amount
qe is not quite similar to the experimental value (
qe, the = 20.46 mg/g <
qe, exp = 72.82 mg/g for Ni
2+ and
qe, the = 2.55 mg/g <
qe, exp = 83.30 mg/g for Cu
2+, suggesting the insufficiency of pseudo-first-order model. We find that, under these conditions, the pseudo-first order model is not adequate to describe the adsorption kinetics of Cu
2+ and Ni
2 cations from aqueous solutions onto Alginate-Moroccan clay bio-nanocomposite beads.
3.3.2. Pseudo- second order kinetics model
The rate equation and its linearized form for the pseudo-second-order kinetics model can be represented as follows [
20,
33,
34,
35,
36,
37,
38]:
Where,
k2 (g.mg-1min
-1) is the rate constant for the pseudo-second order kinetics model,
qe (mg/g),
qt (mg/g) are the amounts of Cu
2+ and Ni
2 cations retained on weight unit of adsorbent at equilibrium, and at any contact time
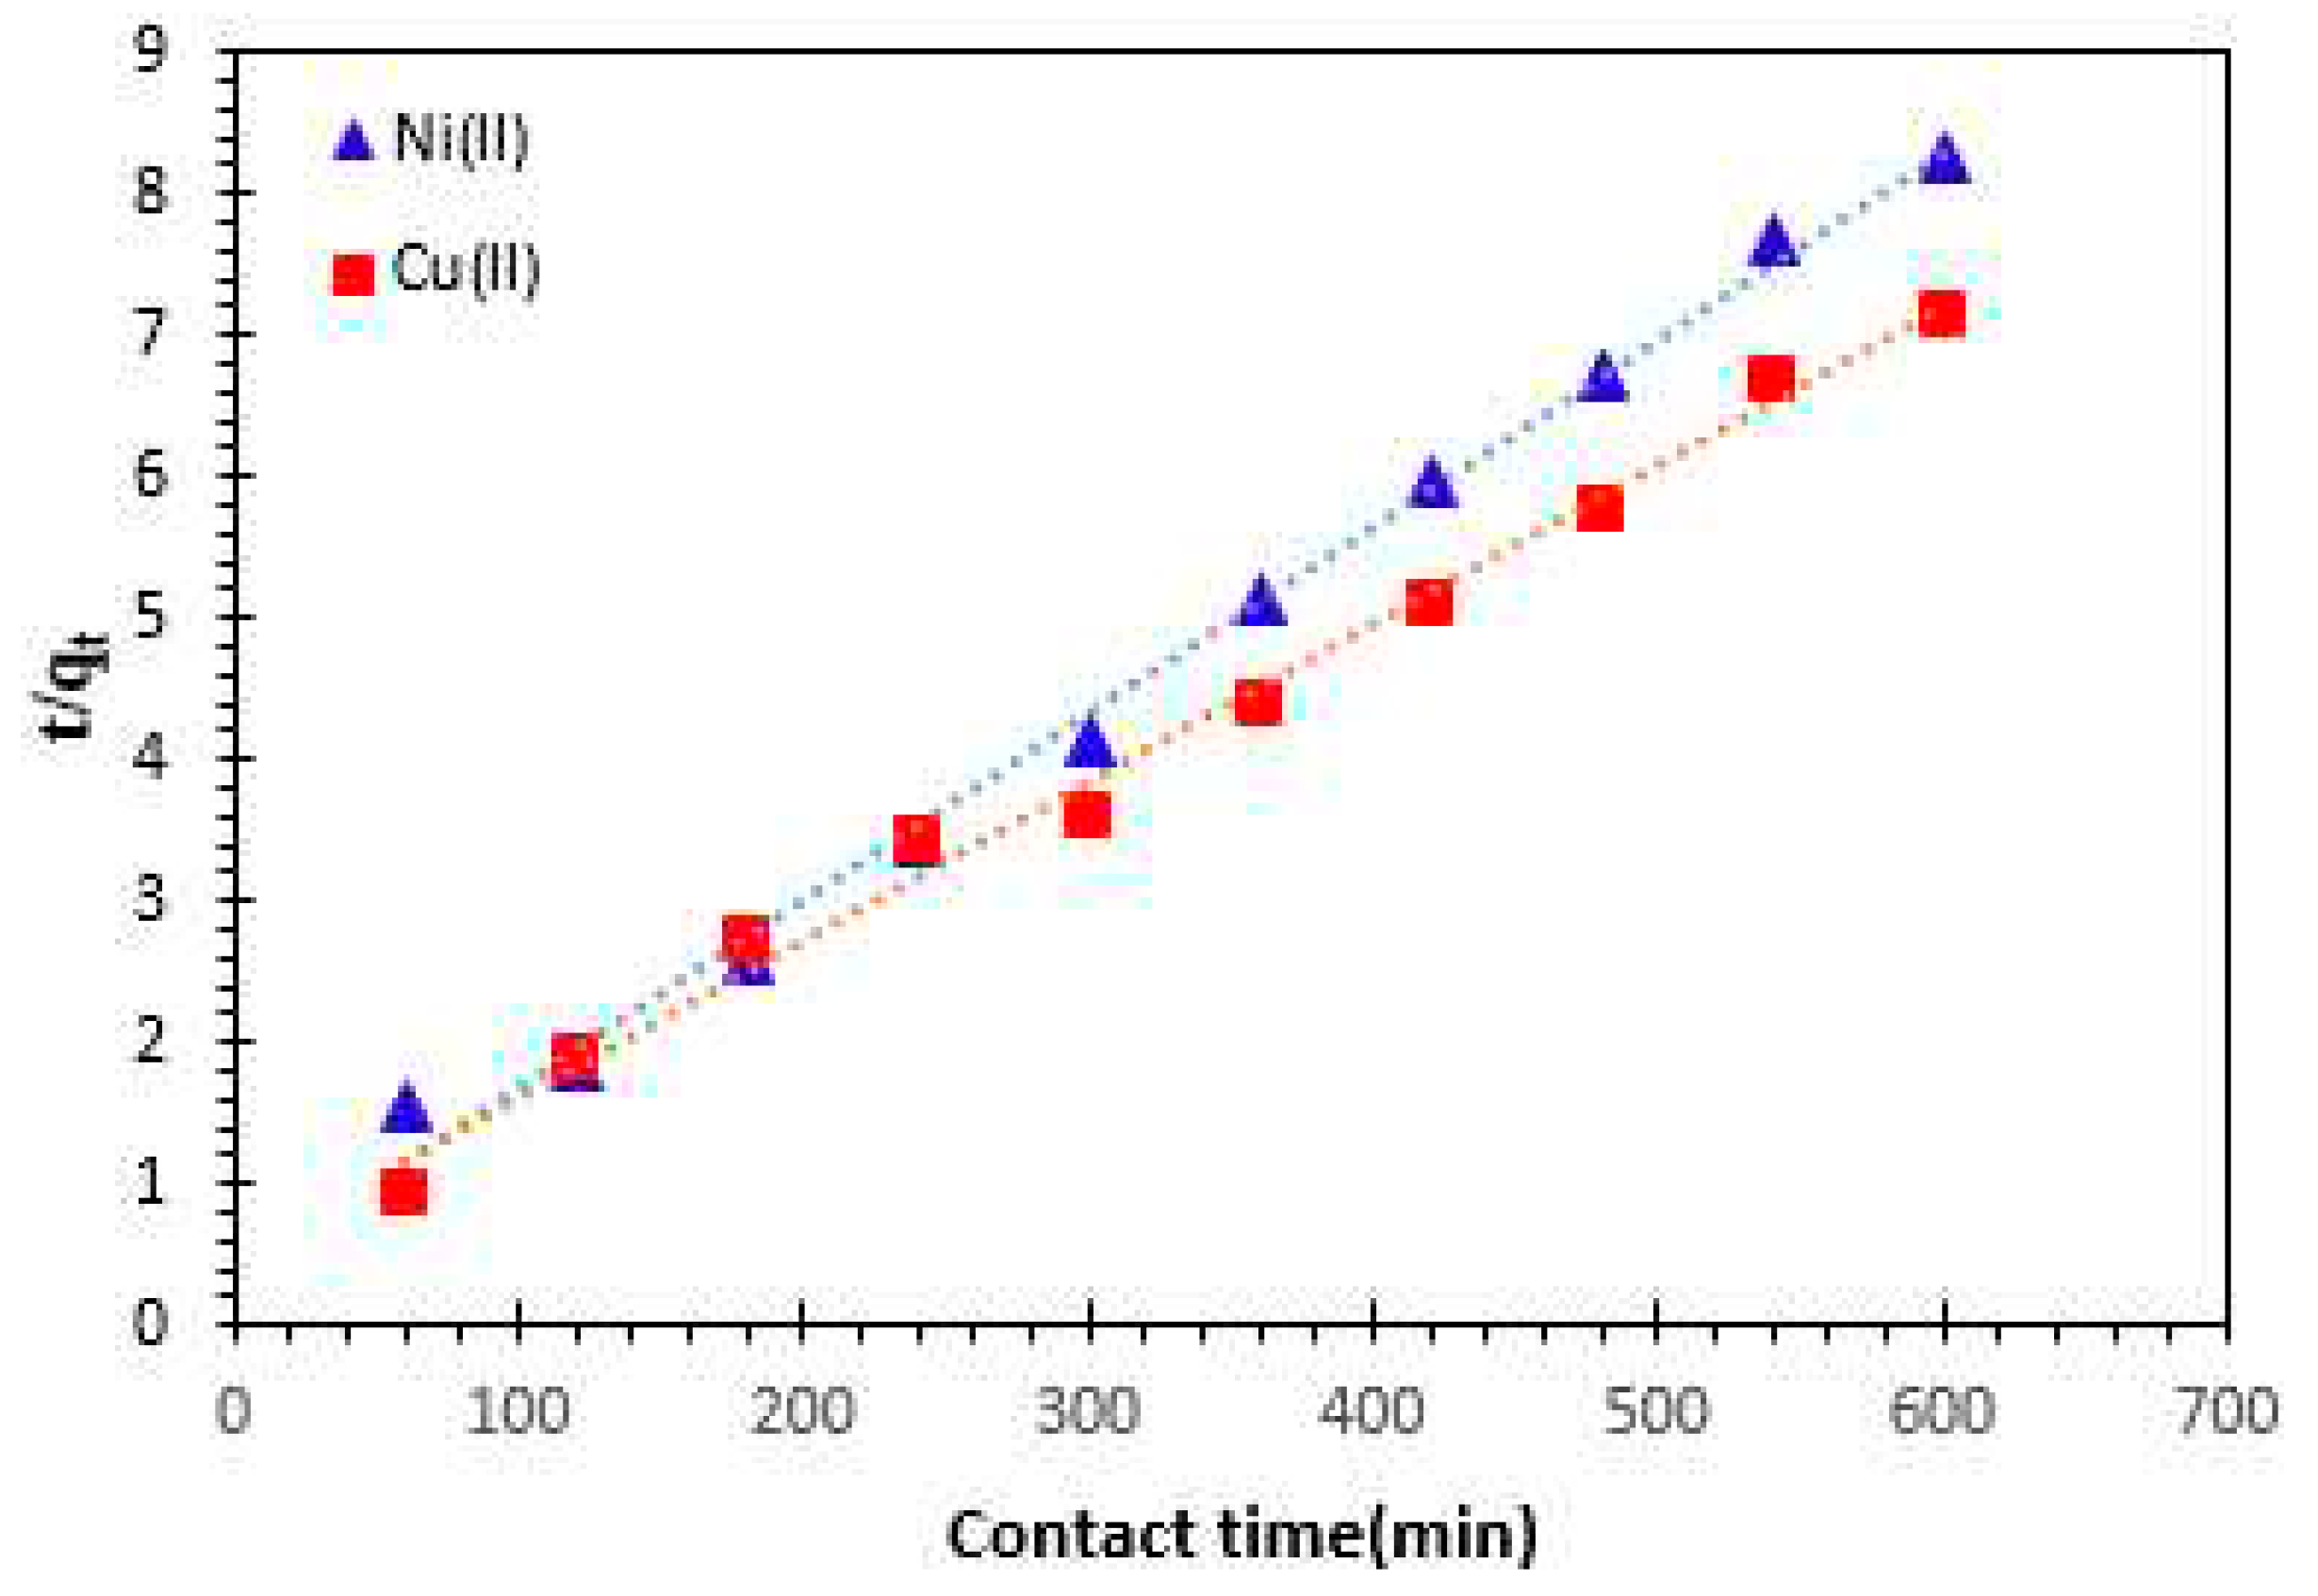
t (min), respectively. The pseudo-second order plots for Cu
2+ and Ni
2 cations adsorption are presented in
Figure 10, and the kinetic parameters are given in
Table 2. The correlation coefficient for the pseudo second order kinetic model is nearly equal to 1, and the value of theoretical adsorption capacity
(qe, the ) is comparable to the experimental one (
qe, the = 75.75 mg/g for Ni
2+ and
qe, the = 90. 09 mg/g for Cu
2+).
Therefore, it was concluded that the pseudo-second order adsorption model is more appropriate to describe the adsorption kinetics of Cu2+ and Ni2 cations on Alginate- Moroccan clay bio-nanocomposite.
3.3.3. Elovich kinetic model
The Elovich model is a useful tool for studying systems with heterogeneous surfaces, especially when describing the kinetics of chemisorption [
20]. This model is mathematically expressed through equations 7 and 8. In these equations,
'qe' and '
qt' (measured in mg/g) denote the quantities of adsorbed Cu
2+ and Ni
2+ cations at equilibrium, and at any specific contact time 't' (in minutes), respectively.
The kinetics equation Elovich model and its linearized form may be expressed as:
Where,
qe (mg/g) and
qt (mg/g) are the amounts of Cu
2+ and Ni
2+ cations adsorbed at equilibrium and at any contact time
t (min), respectively.
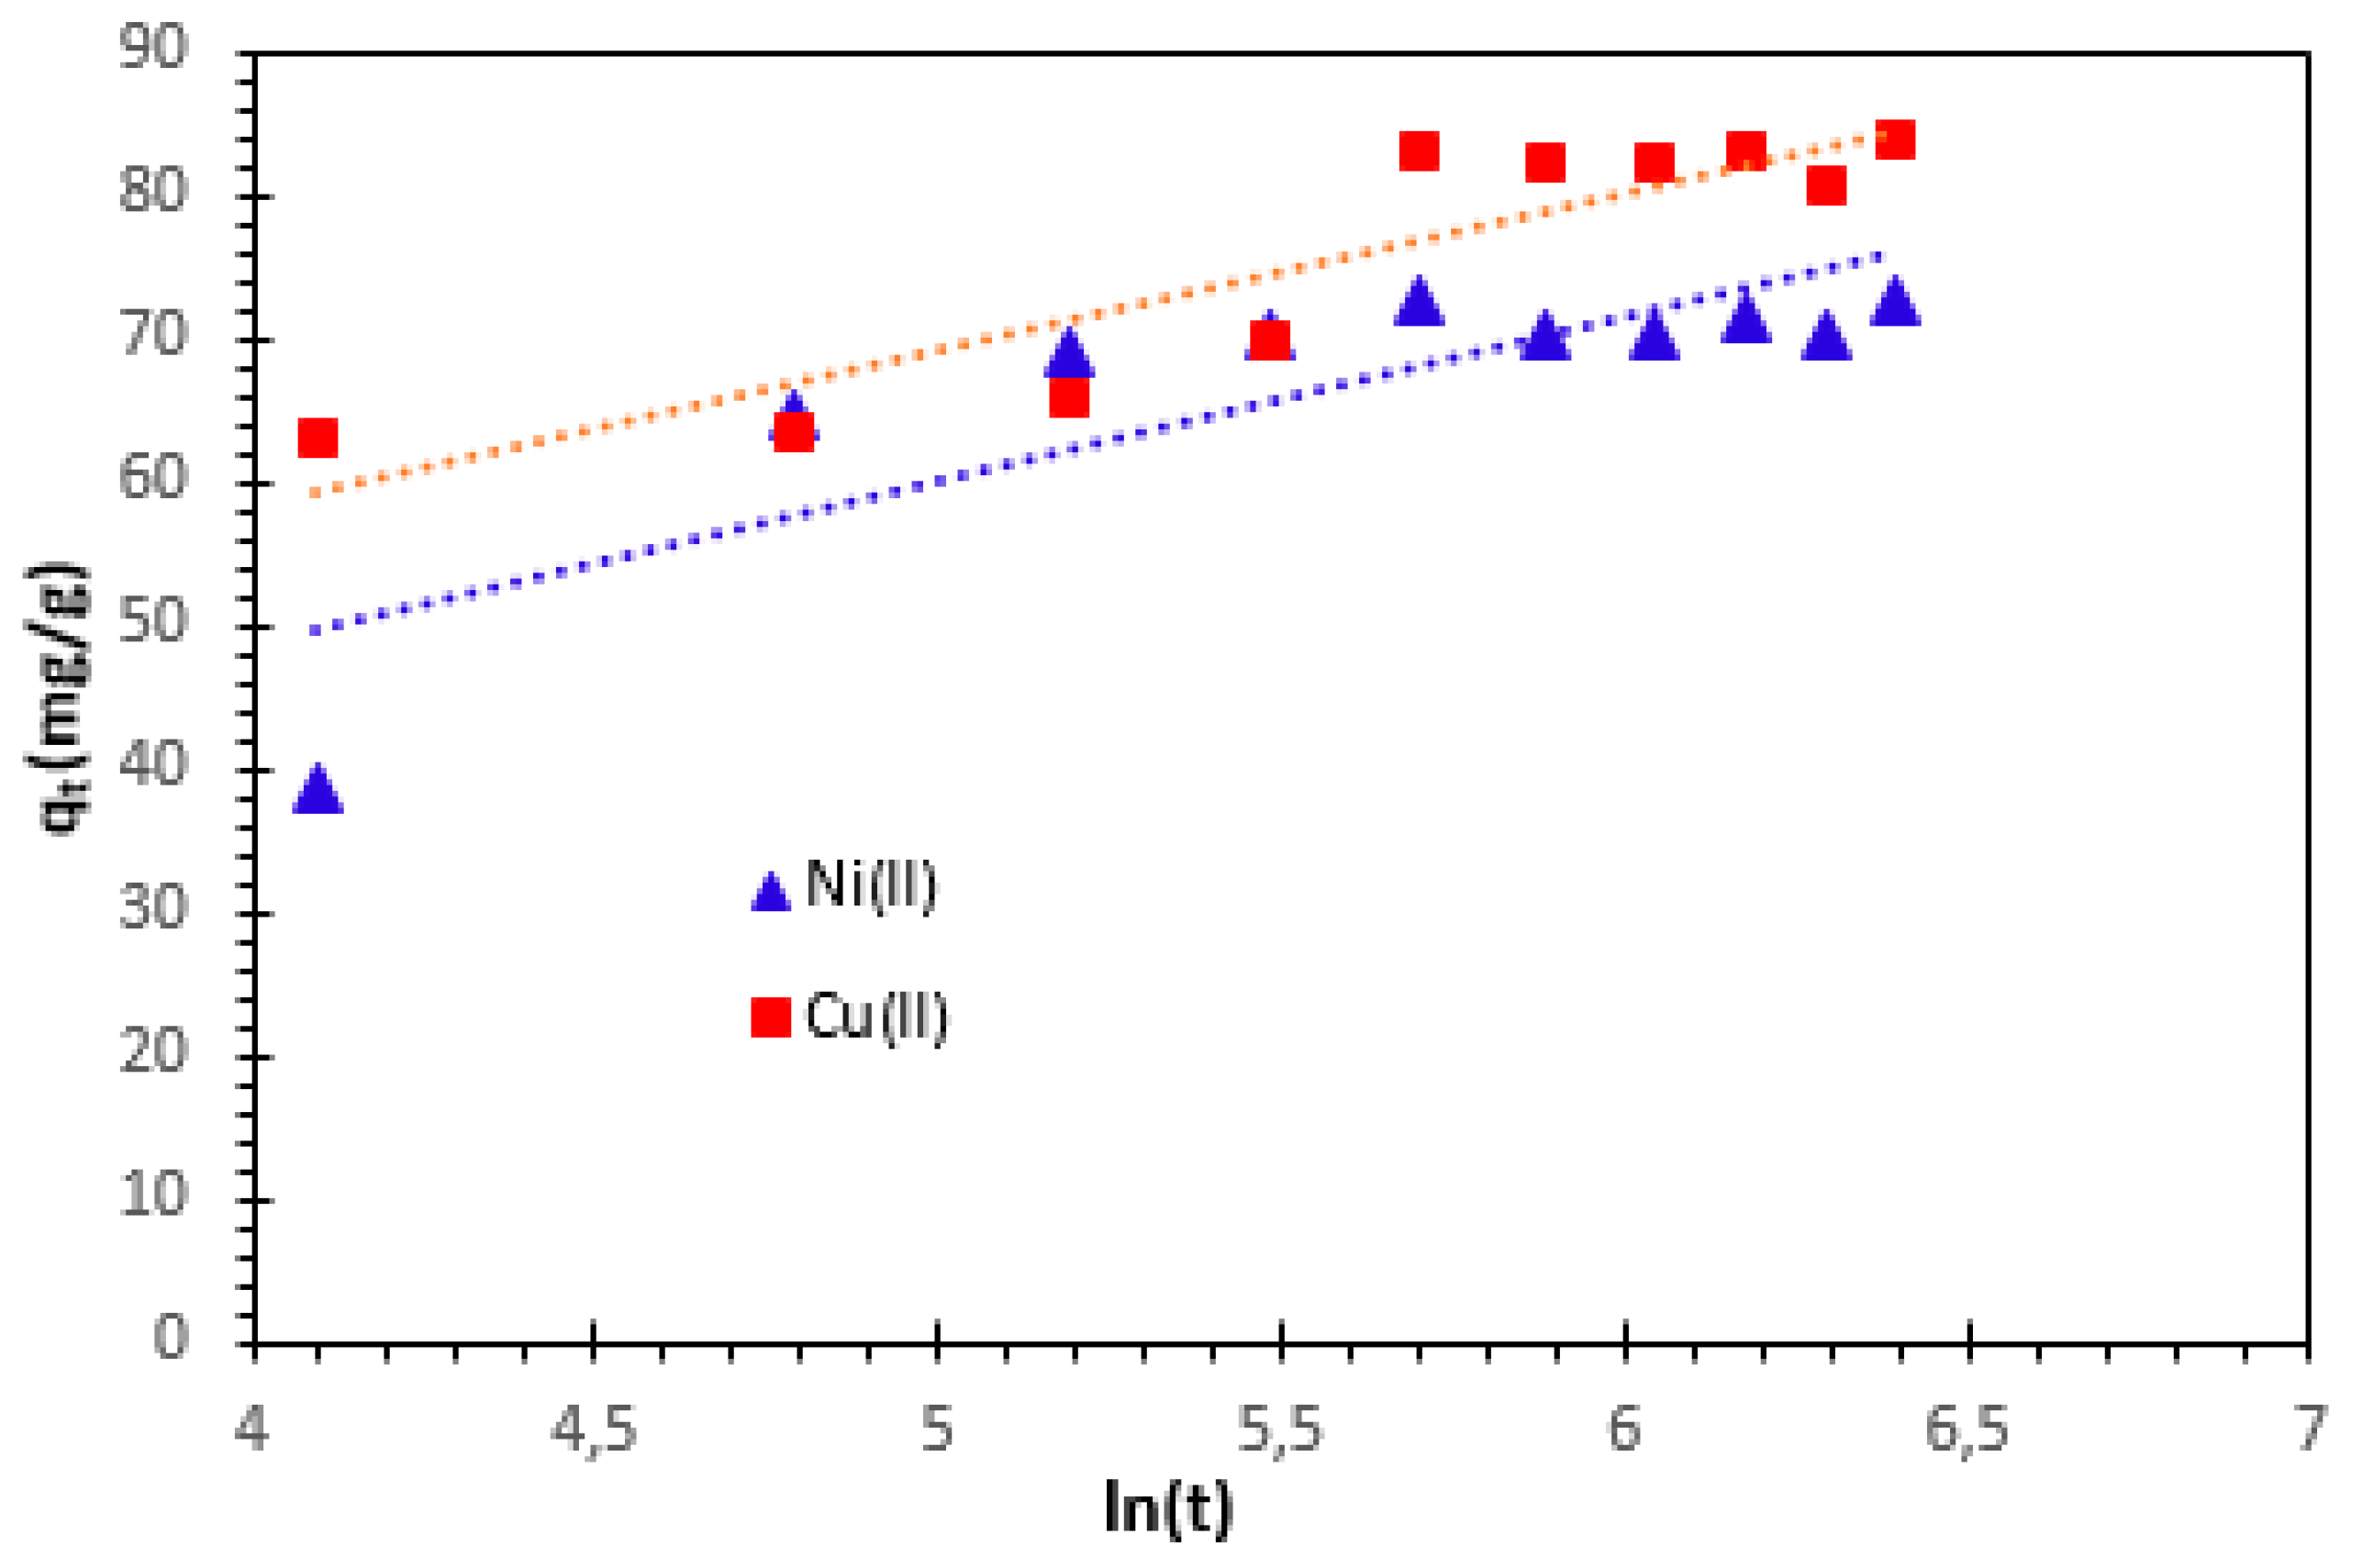
α (mg/g
/min) is the initial adsorption rate and
β (g/mg) is the desorption constant related to the extent of the surface coverage and activation energy for chemisorption. The Elovich kinetic constants α and β are obtained from the intercept and the slope respectively (
Figure 11). The correlation coefficient indicates that the Elovich model is not adequate to characterize the Cu
2+ and Ni
2+ cations adsorption on bio-nanocomposite beads. However, based on the correlation coefficient analysis, it is evident that the Elovich model is not sufficient to accurately characterize the adsorption of Cu
2+ and Ni
2+ cations on bio-nanocomposite beads.
3.3.4. Intra-particle diffusion kinetics model
Fitting the experimental data to an intraparticle diffusion model is the most widely used method for determining the mechanism involved in the sorption process. One or more processes, such as boundary layer (film) or external diffusion, diffusion at the surface, internal pore diffusion, or a combination of several steps, may be used to approximate the overall adsorption of solute onto the solid surface [
20,
39].
To calculate the initial rate of intra-particle diffusion, Equation 9 is linearized. In this equation,
kp (mg
-1·min
1/2) represents the intra-particle diffusion rate constant,
c (mg/g) is the concentration of Cu
2+ and Ni
2+ cations from the solution at equilibrium, and
qt (mg/g) denotes the amount of Cu
2+ and Ni
2+ cations retained on a unit weight of the adsorbent at contact time
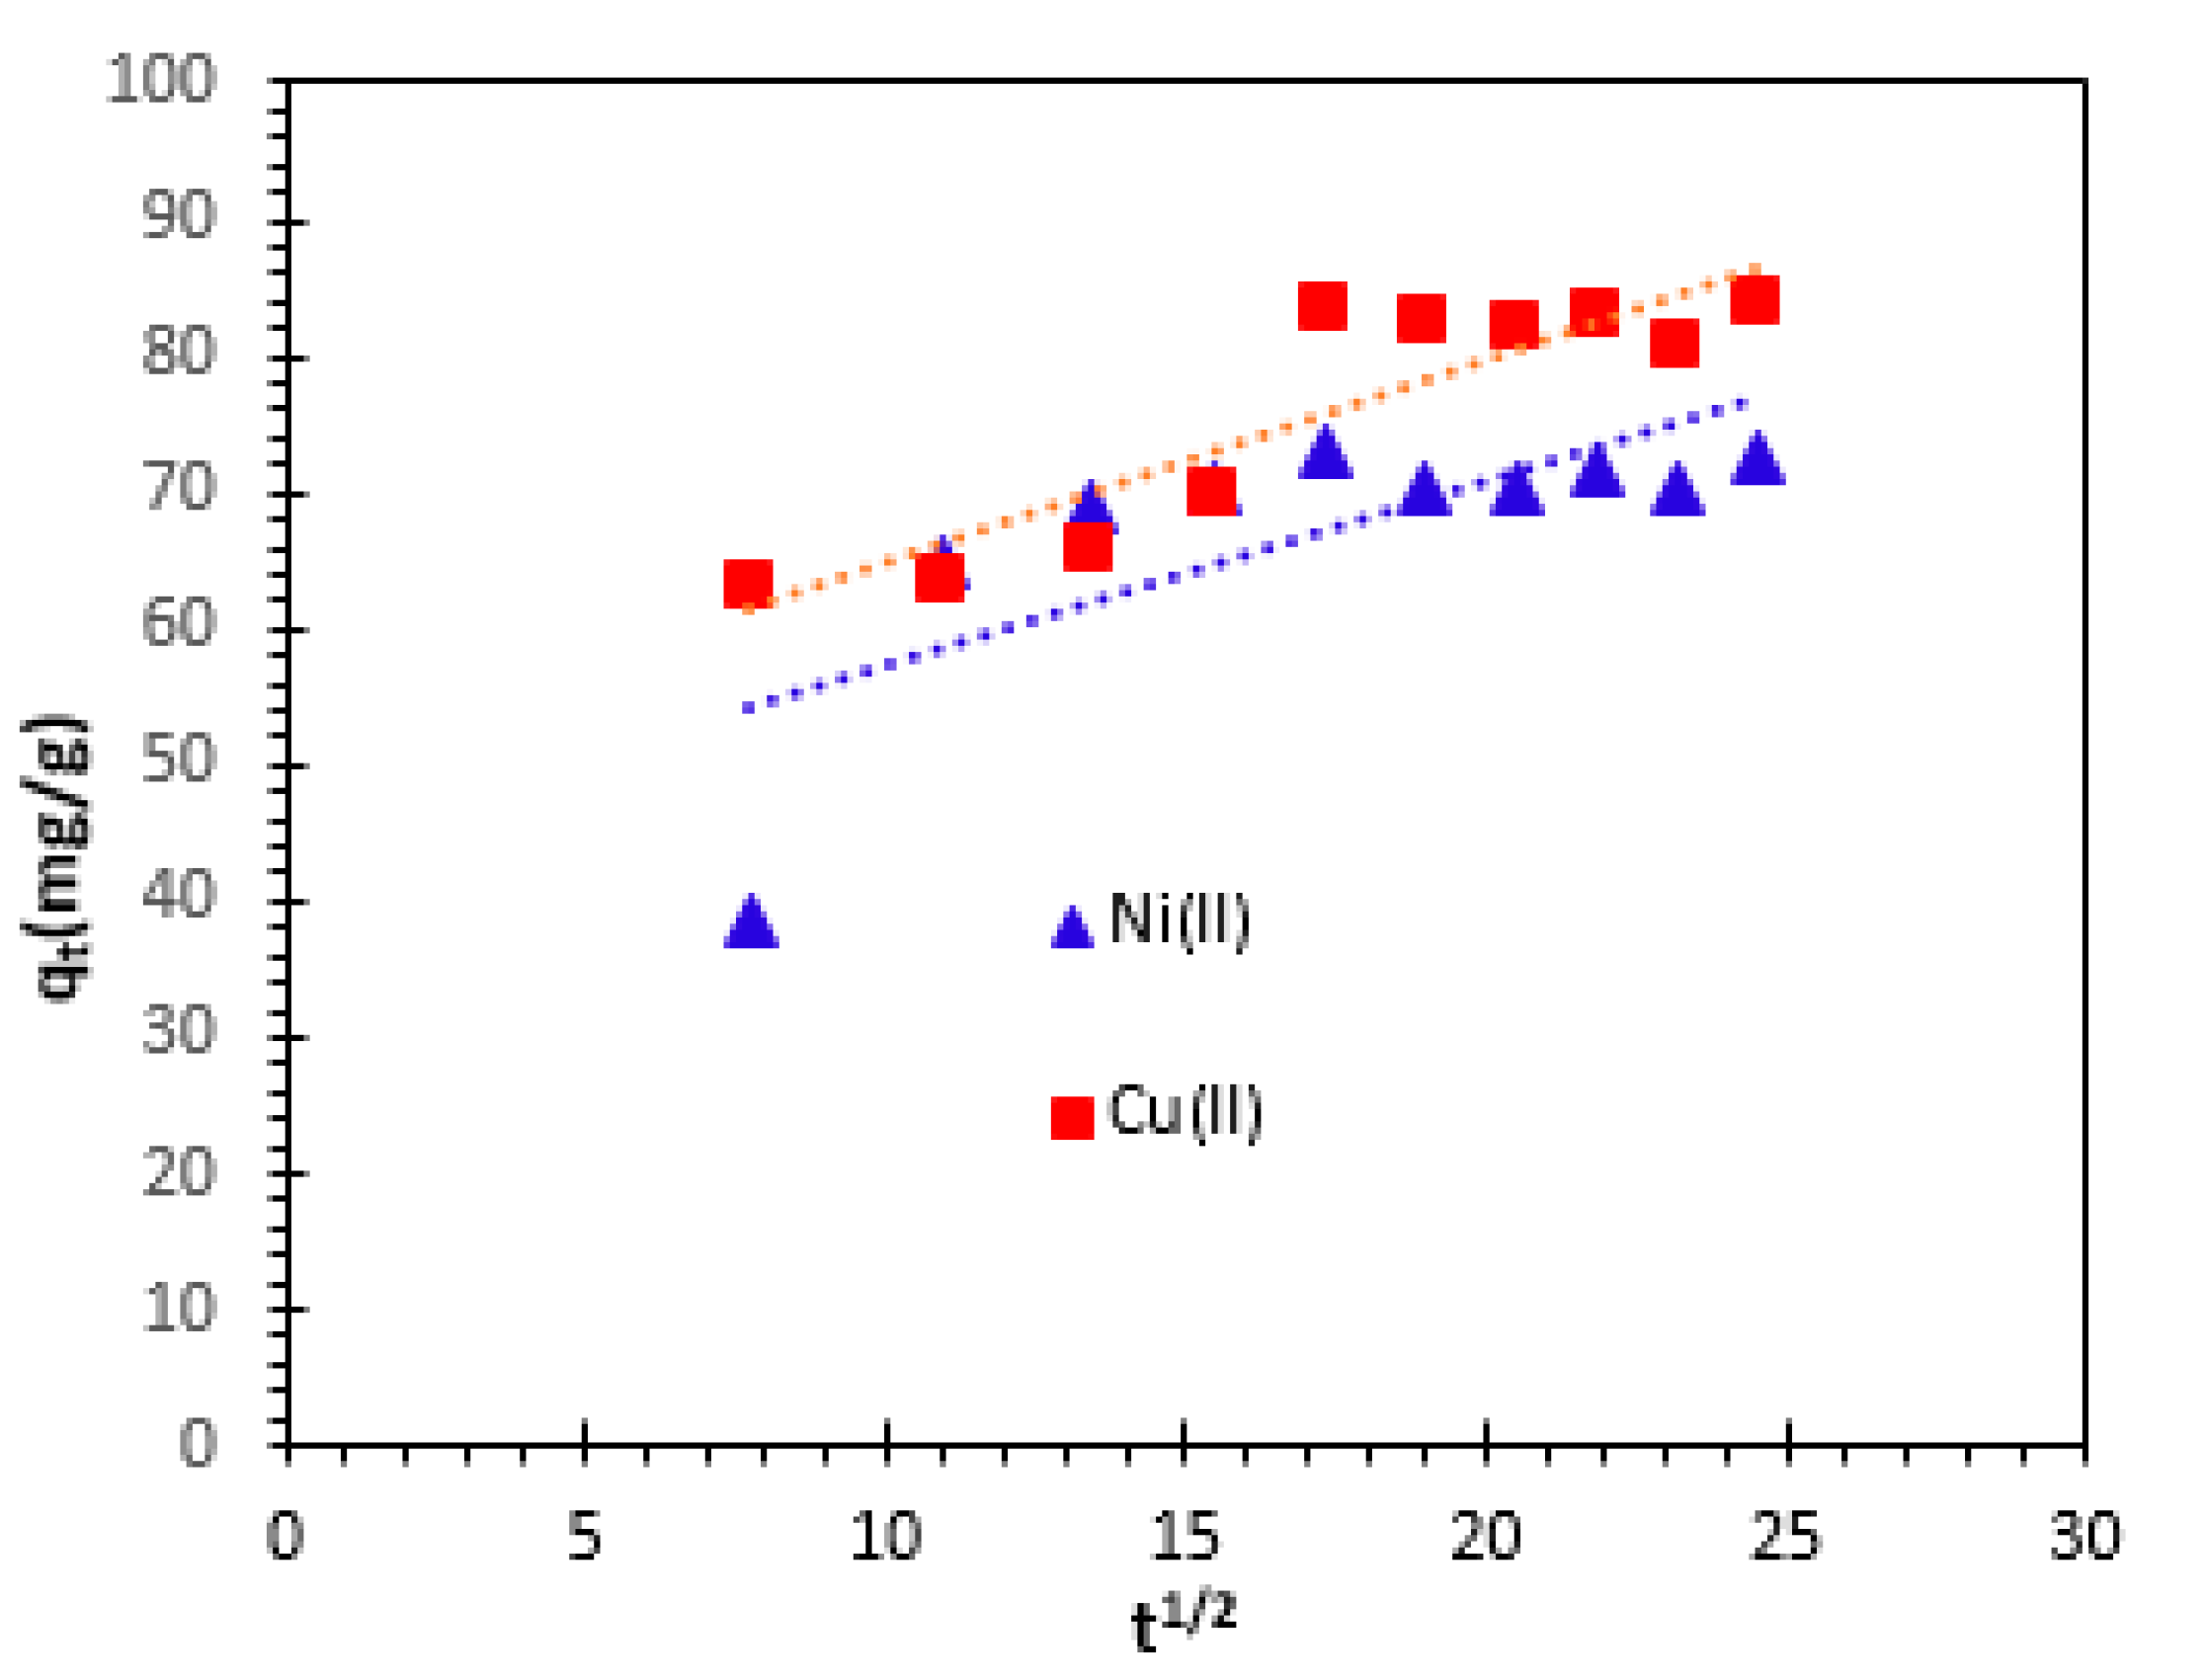
t (minutes). The graphical representation of this relationship is presented in
Figure 12.
The intra-particle diffusion,
kp, values were obtained from the slope of the straight-line part of plot of
qt versus
t1/2, for various solutions temperature. The correlation coefficients (
R2) for both studied cations are 0.815 for Ni
2+ and 0.530 for Cu
2+ at 25°C. This correlation coefficient indicates that the intraparticle diffusion model is not suitable to describe the kinetics of Cu
2+ and Ni
2+ cations adsorption from aqueous solutions on bio-nanocomposite beads. This means that the internal diffusion is either fast and is not the limiting step in the adsorption mechanism or internal diffusion solely is not the limiting step. The values of
kp and
c calculated from the slopes and intercepts are summarized in
Table 2.
Table 2.
Parameters of four kinetic models for Cu2+ and Ni2+ cations adsorption at C0=100 mg/L
Table 2.
Parameters of four kinetic models for Cu2+ and Ni2+ cations adsorption at C0=100 mg/L
| Kinetic model |
Parameters |
Metal Ions |
| Ni2+
|
Cu2+
|
| Pseudo- first order model |
qe,exp(mg/g) |
72.82 |
83.30 |
|
K1 (min-1) |
0.0059 |
0.0027 |
|
qe,the(mg/g) |
20.46 |
2.55 |
| R2
|
0.737 |
0.469 |
| Pseudo-Second order model |
qe,exp(mg/g) |
72.82 |
83.30 |
|
K2 (g.mg-1min-1) |
4.5*10-4
|
2.5*10-4
|
|
qe,the(mg/g) |
75.75 |
90.09 |
| R2
|
0.994 |
0.992 |
| Elovich model |
qe,exp(mg/g) |
72.82 |
83.30 |
| α |
14.64 |
38.94 |
| β |
0.087 |
0.090 |
| R2
|
0.679 |
0.806 |
| Intra-particle diffusion |
KInt(mg.g-1min-1/2) |
1.48 |
1.35 |
| CI |
50.028 |
43.52 |
| R2
|
0.815 |
0.530 |
The bio-nanocomposite utilized in the adsorption investigation of Cu2+ and Ni2+ cations showed that, for an initial concentration of 100 mg/L, the correlation coefficient (R2) values for the pseudo-second-order adsorption kinetic model were very high (about 0.99). This means that the pseudo-second-order model's estimation of adsorption capacity nearly matched the experimental results. The pseudo-second-order adsorption model is thought to be the best option for explaining the kinetics of Cu2+ and Ni2+ cations adsorption by the used bio-nanocomposites.
3.4. Isotherm study
Adsorption isotherms, which are important data for understanding the adsorption mechanism, are mathematical models that describe the distribution of adsorbed species between the solid and liquid phases [
40]. Several mathematical models have been studied in this work, namely Langmuir, Freundlich, Temkin and Dubinin-Radushkevich (D-R) equations. This study was performed by ranging the initial ion concentration from 100 to 600 mg/L at room temperature.
3.4.1. Langmuir adsorption isotherm
According to the Langmuir adsorption isotherm, homogeneous surfaces are indicated by the solid surface, having a limited amount of identical sites [
20,
40,
41,
42,
43] The linearized form of the Langmuir equation can be stated as follows:
Where qe (mg/g) is the amount adsorbed at equilibrium concentration Ce (mg/l), qL(mg/g) is the Langmuir constant representing maximum monolayer capacity, and KL (L/mg) is the Langmuir constant related to energy of adsorption.
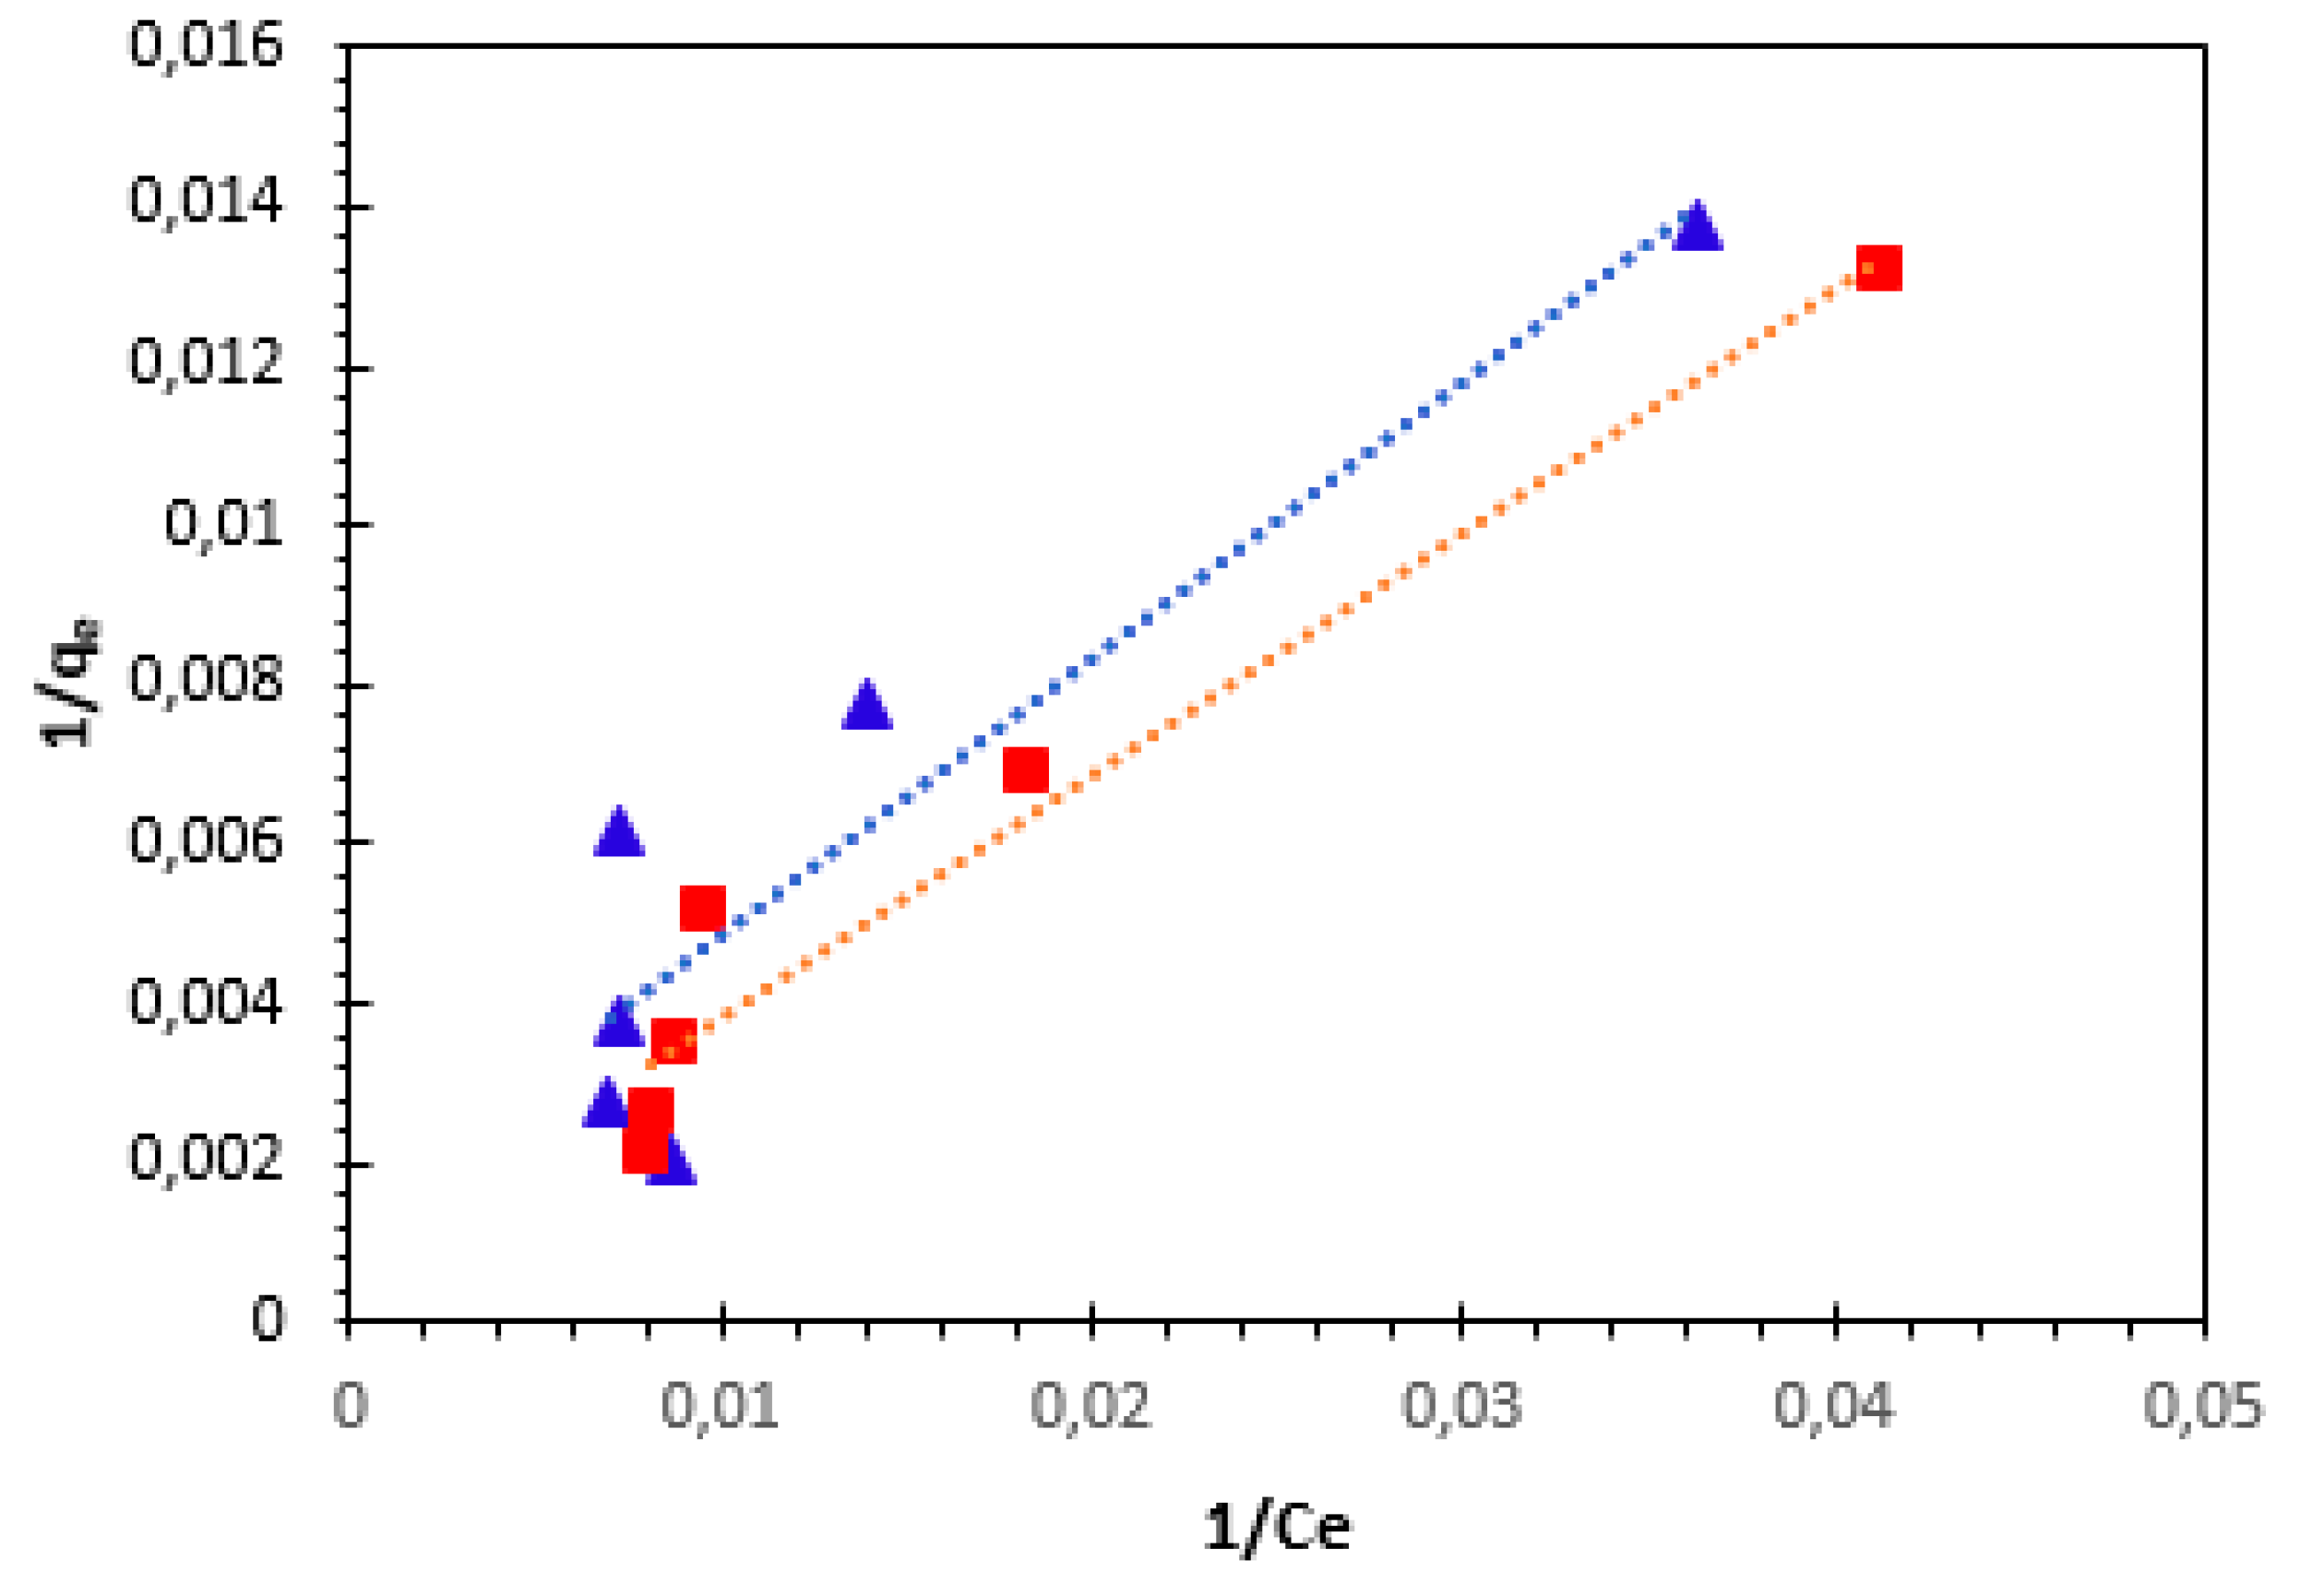
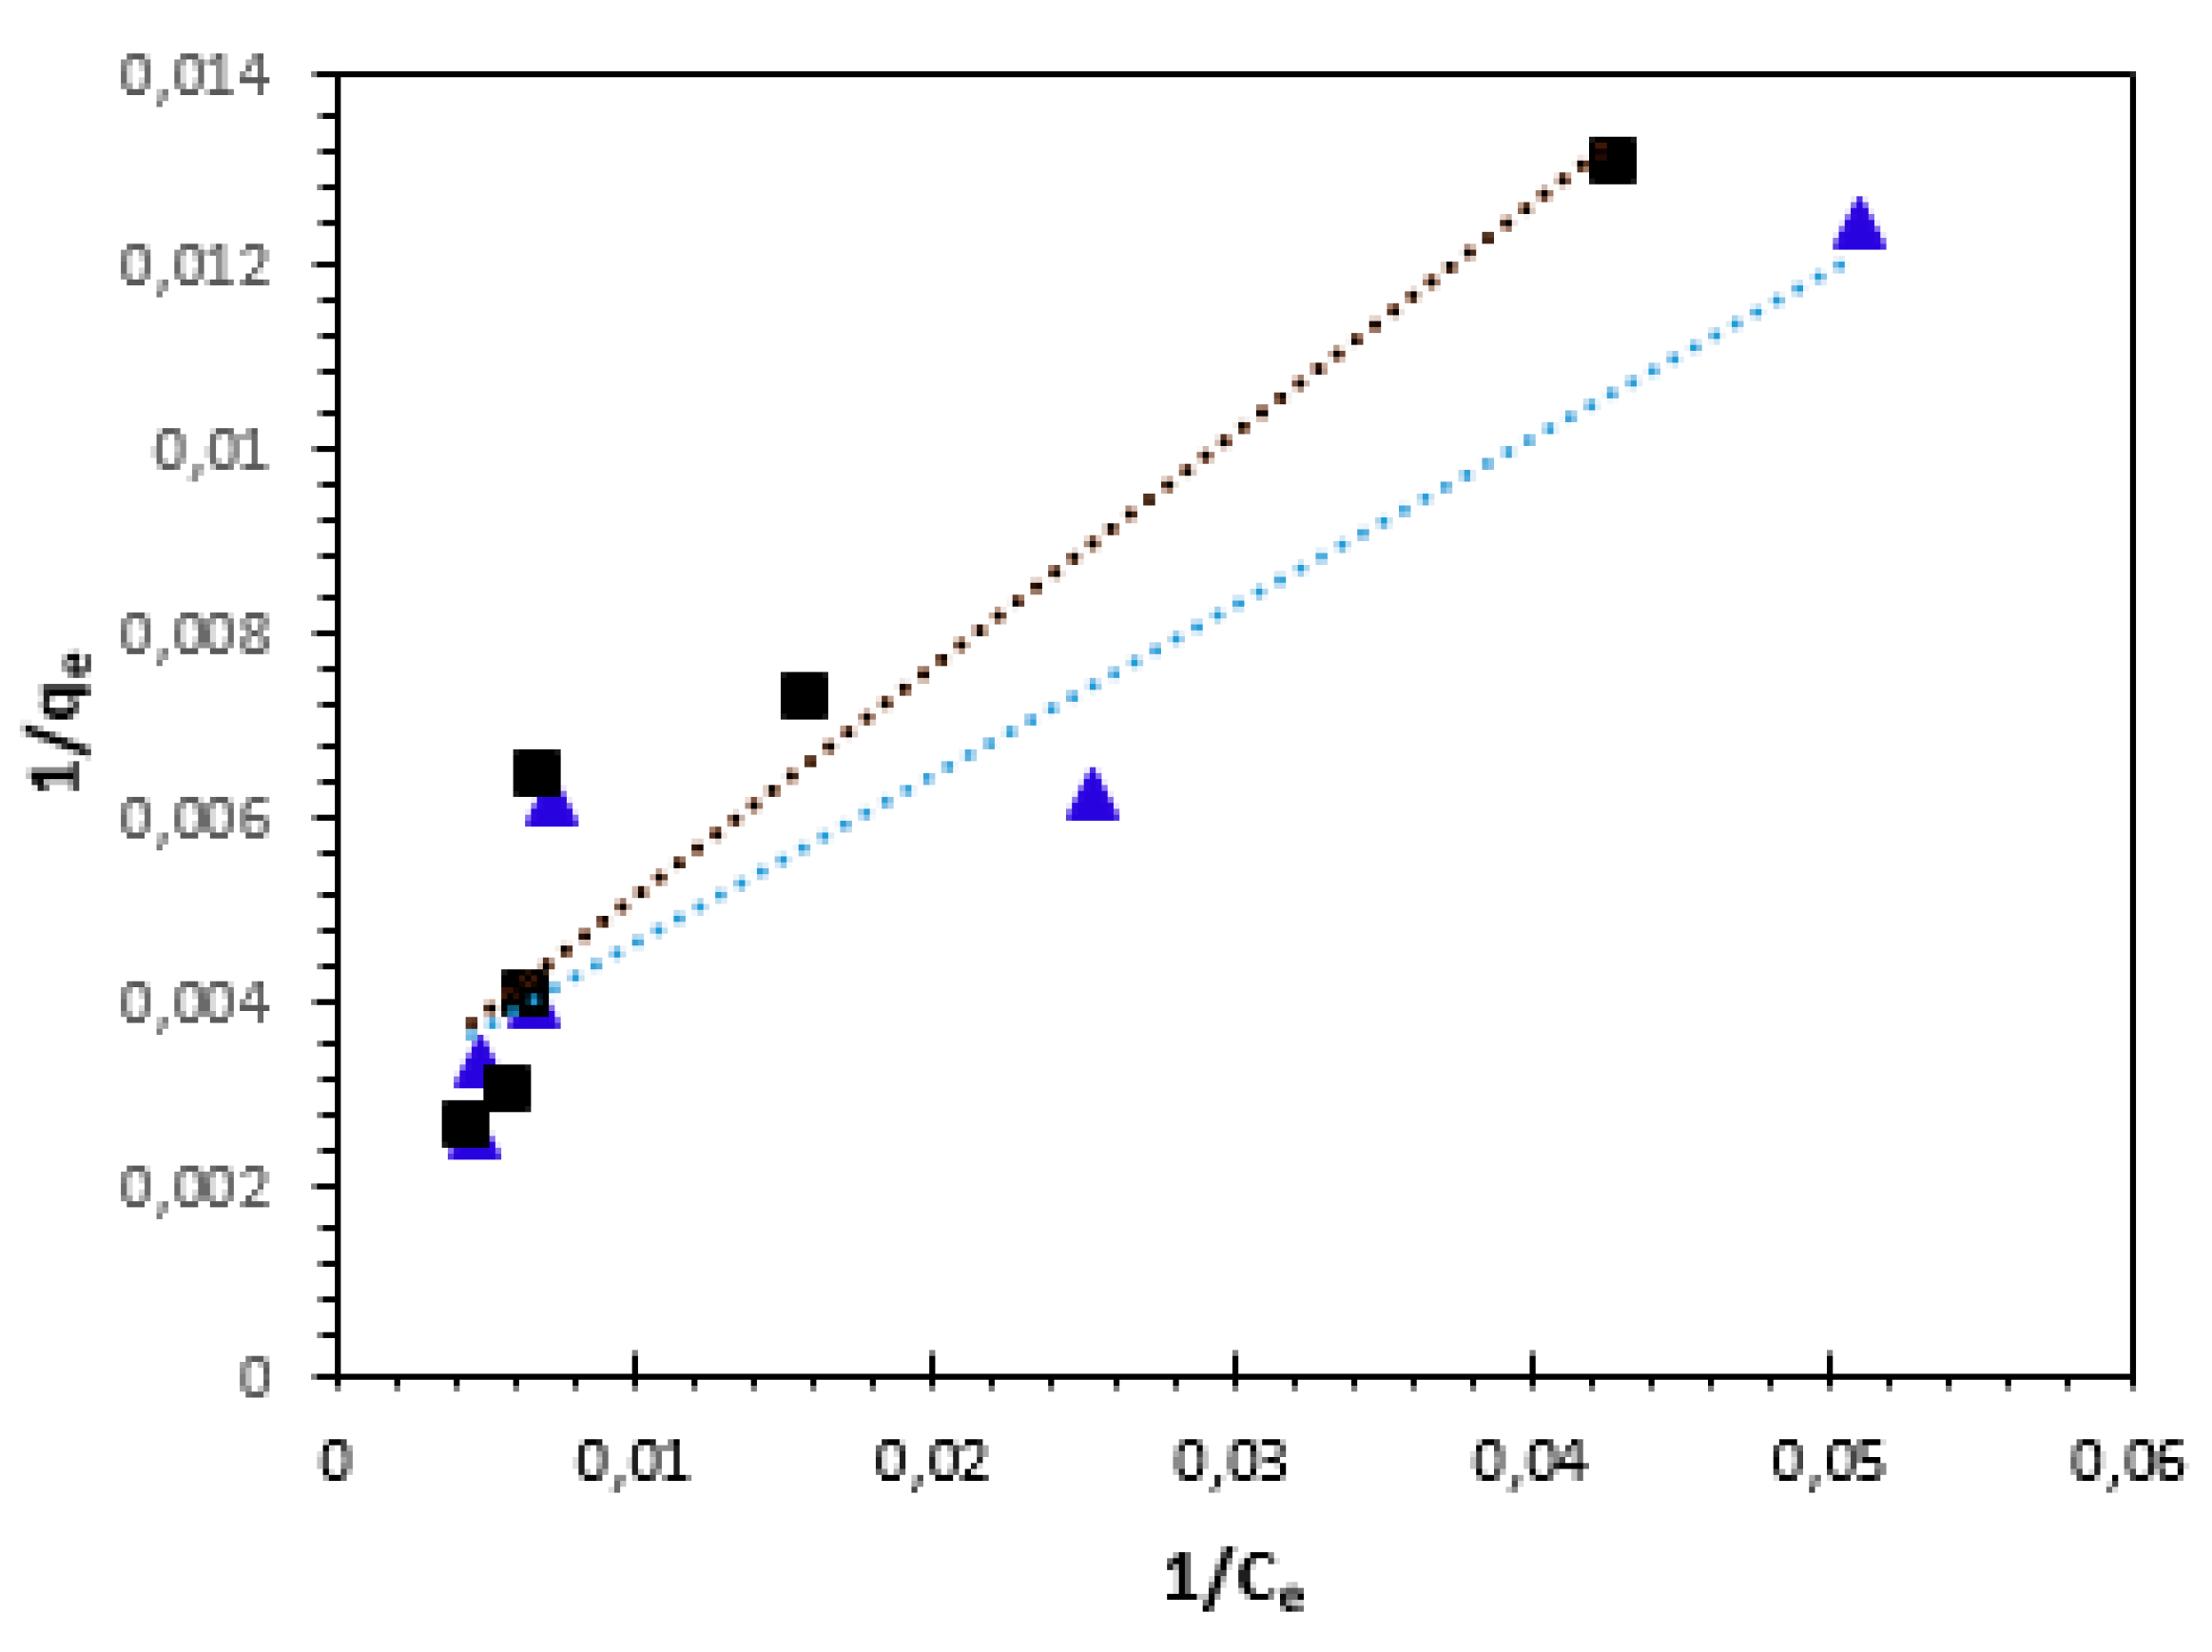
The plots between
1/qe and
1/Ce for the adsorption of Cu
2+ and Ni
2+ cations are represented in
Figure 13. The values of the adsorption capacity (
qL), the Langmuir constant (
KL), and the correlation coefficient (R
2) were presented in
Table 4. The highest value of the adsorption capacity
qL obtained at 25°C was 370.37 mg/g for Ni
2+ and 454.54 mg/g for Cu
2+ ions (
Table 4).
The essential feature of the Langmuir isotherm can be expressed by means of ‘
RL’, a dimensionless constant referred to as separation factor or equilibrium parameter, to predict whether an adsorption system is favorable or unfavorable.
RL is calculated using Eq. 12. Where
KL (L/mol) is Langmuir constant and
C0 (mol/L) the highest initial ions concentration.
The calculated values of parameter
RL for this study were found to be between 0 and 1(0.160 for Ni
2+ and 0.168 for Cu
2+ ions), indicating that the adsorption of Cu
2+ and Ni
2+ cations onto bio-nanocomposite beads particles was favorable (
Table 3).
3.4.2. Freundlich adsorption isotherm
For natural adsorbents which are heterogeneous, the Freundlich equation offers the most suitable adsorption data. The Freundlich adsorption isotherm equation and its linear form can be written as follows [
20,
40,
41,
42]:
where,
qe (mg/g) is the amount of Cu
2+ and Ni
2+ cations adsorbed per unit weight of adsorbent;
Ce (mg/L) is the equilibrium concentration of solute in the bulk solution;
KF (mg/g) is the Freundlich constant, which is a comparative measure of the adsorption capacity of the adsorbent, and
n is an empirical constant related to heterogeneity of the adsorbent surface. The parameter
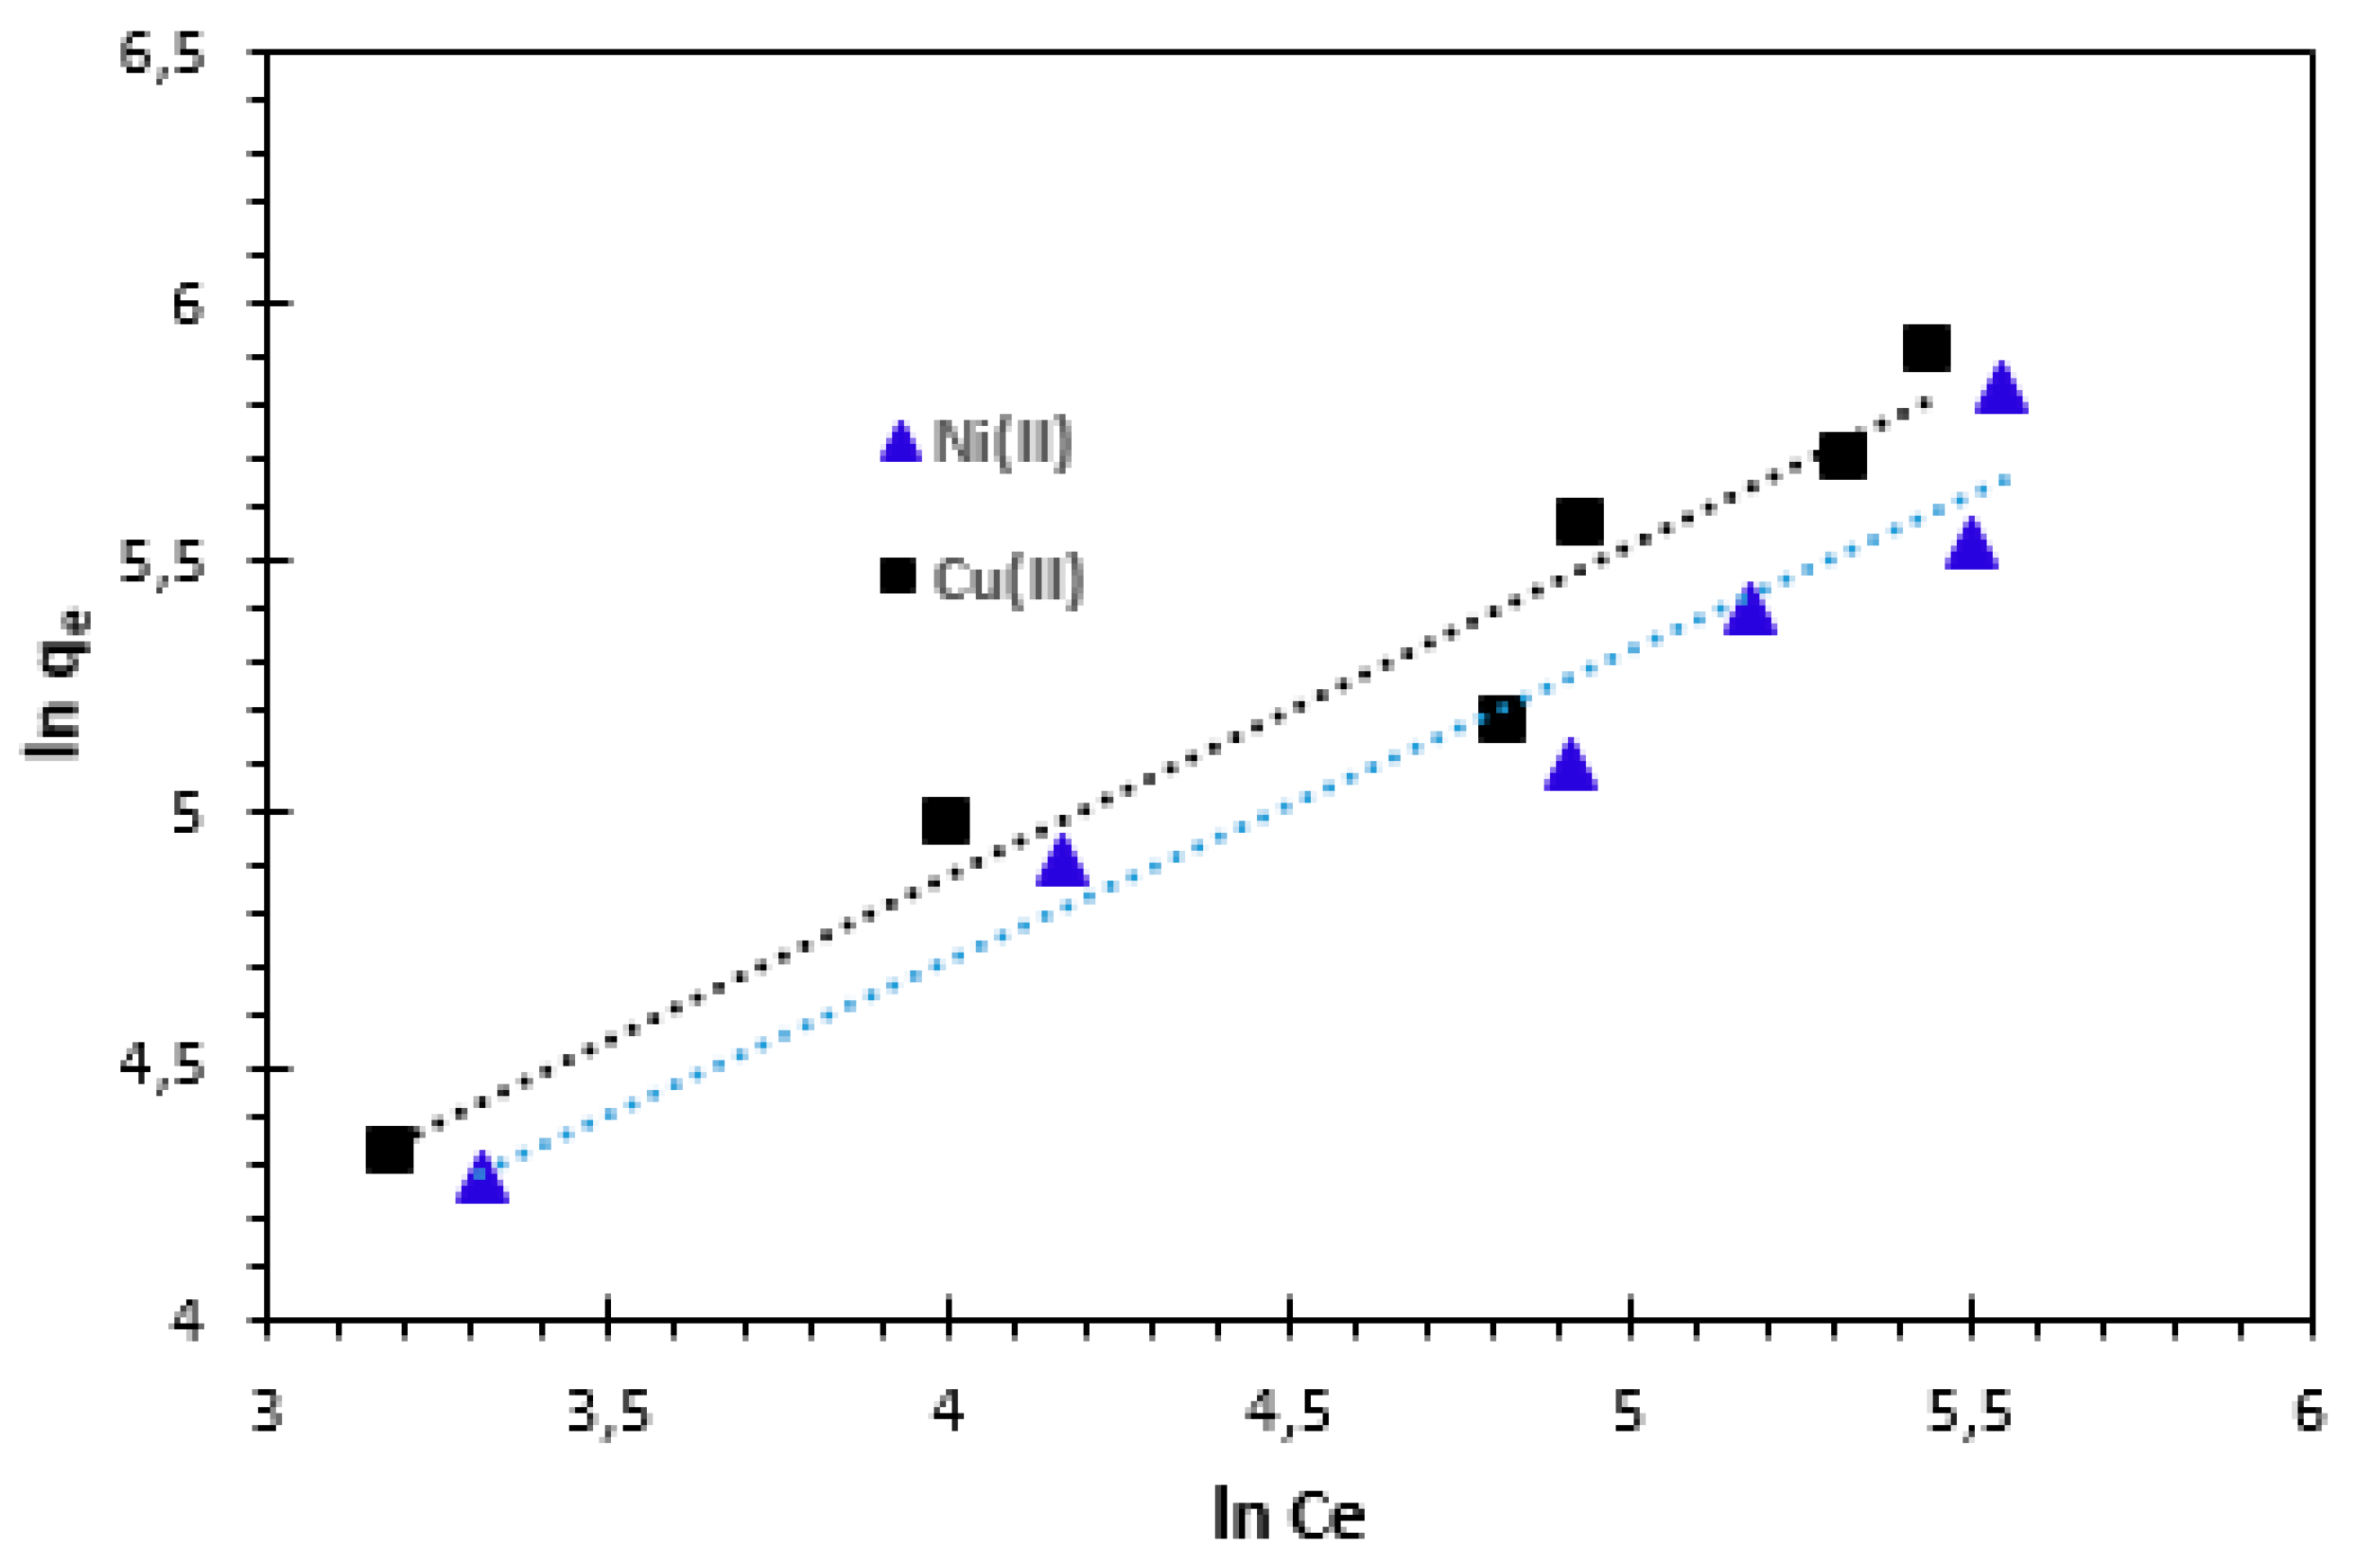
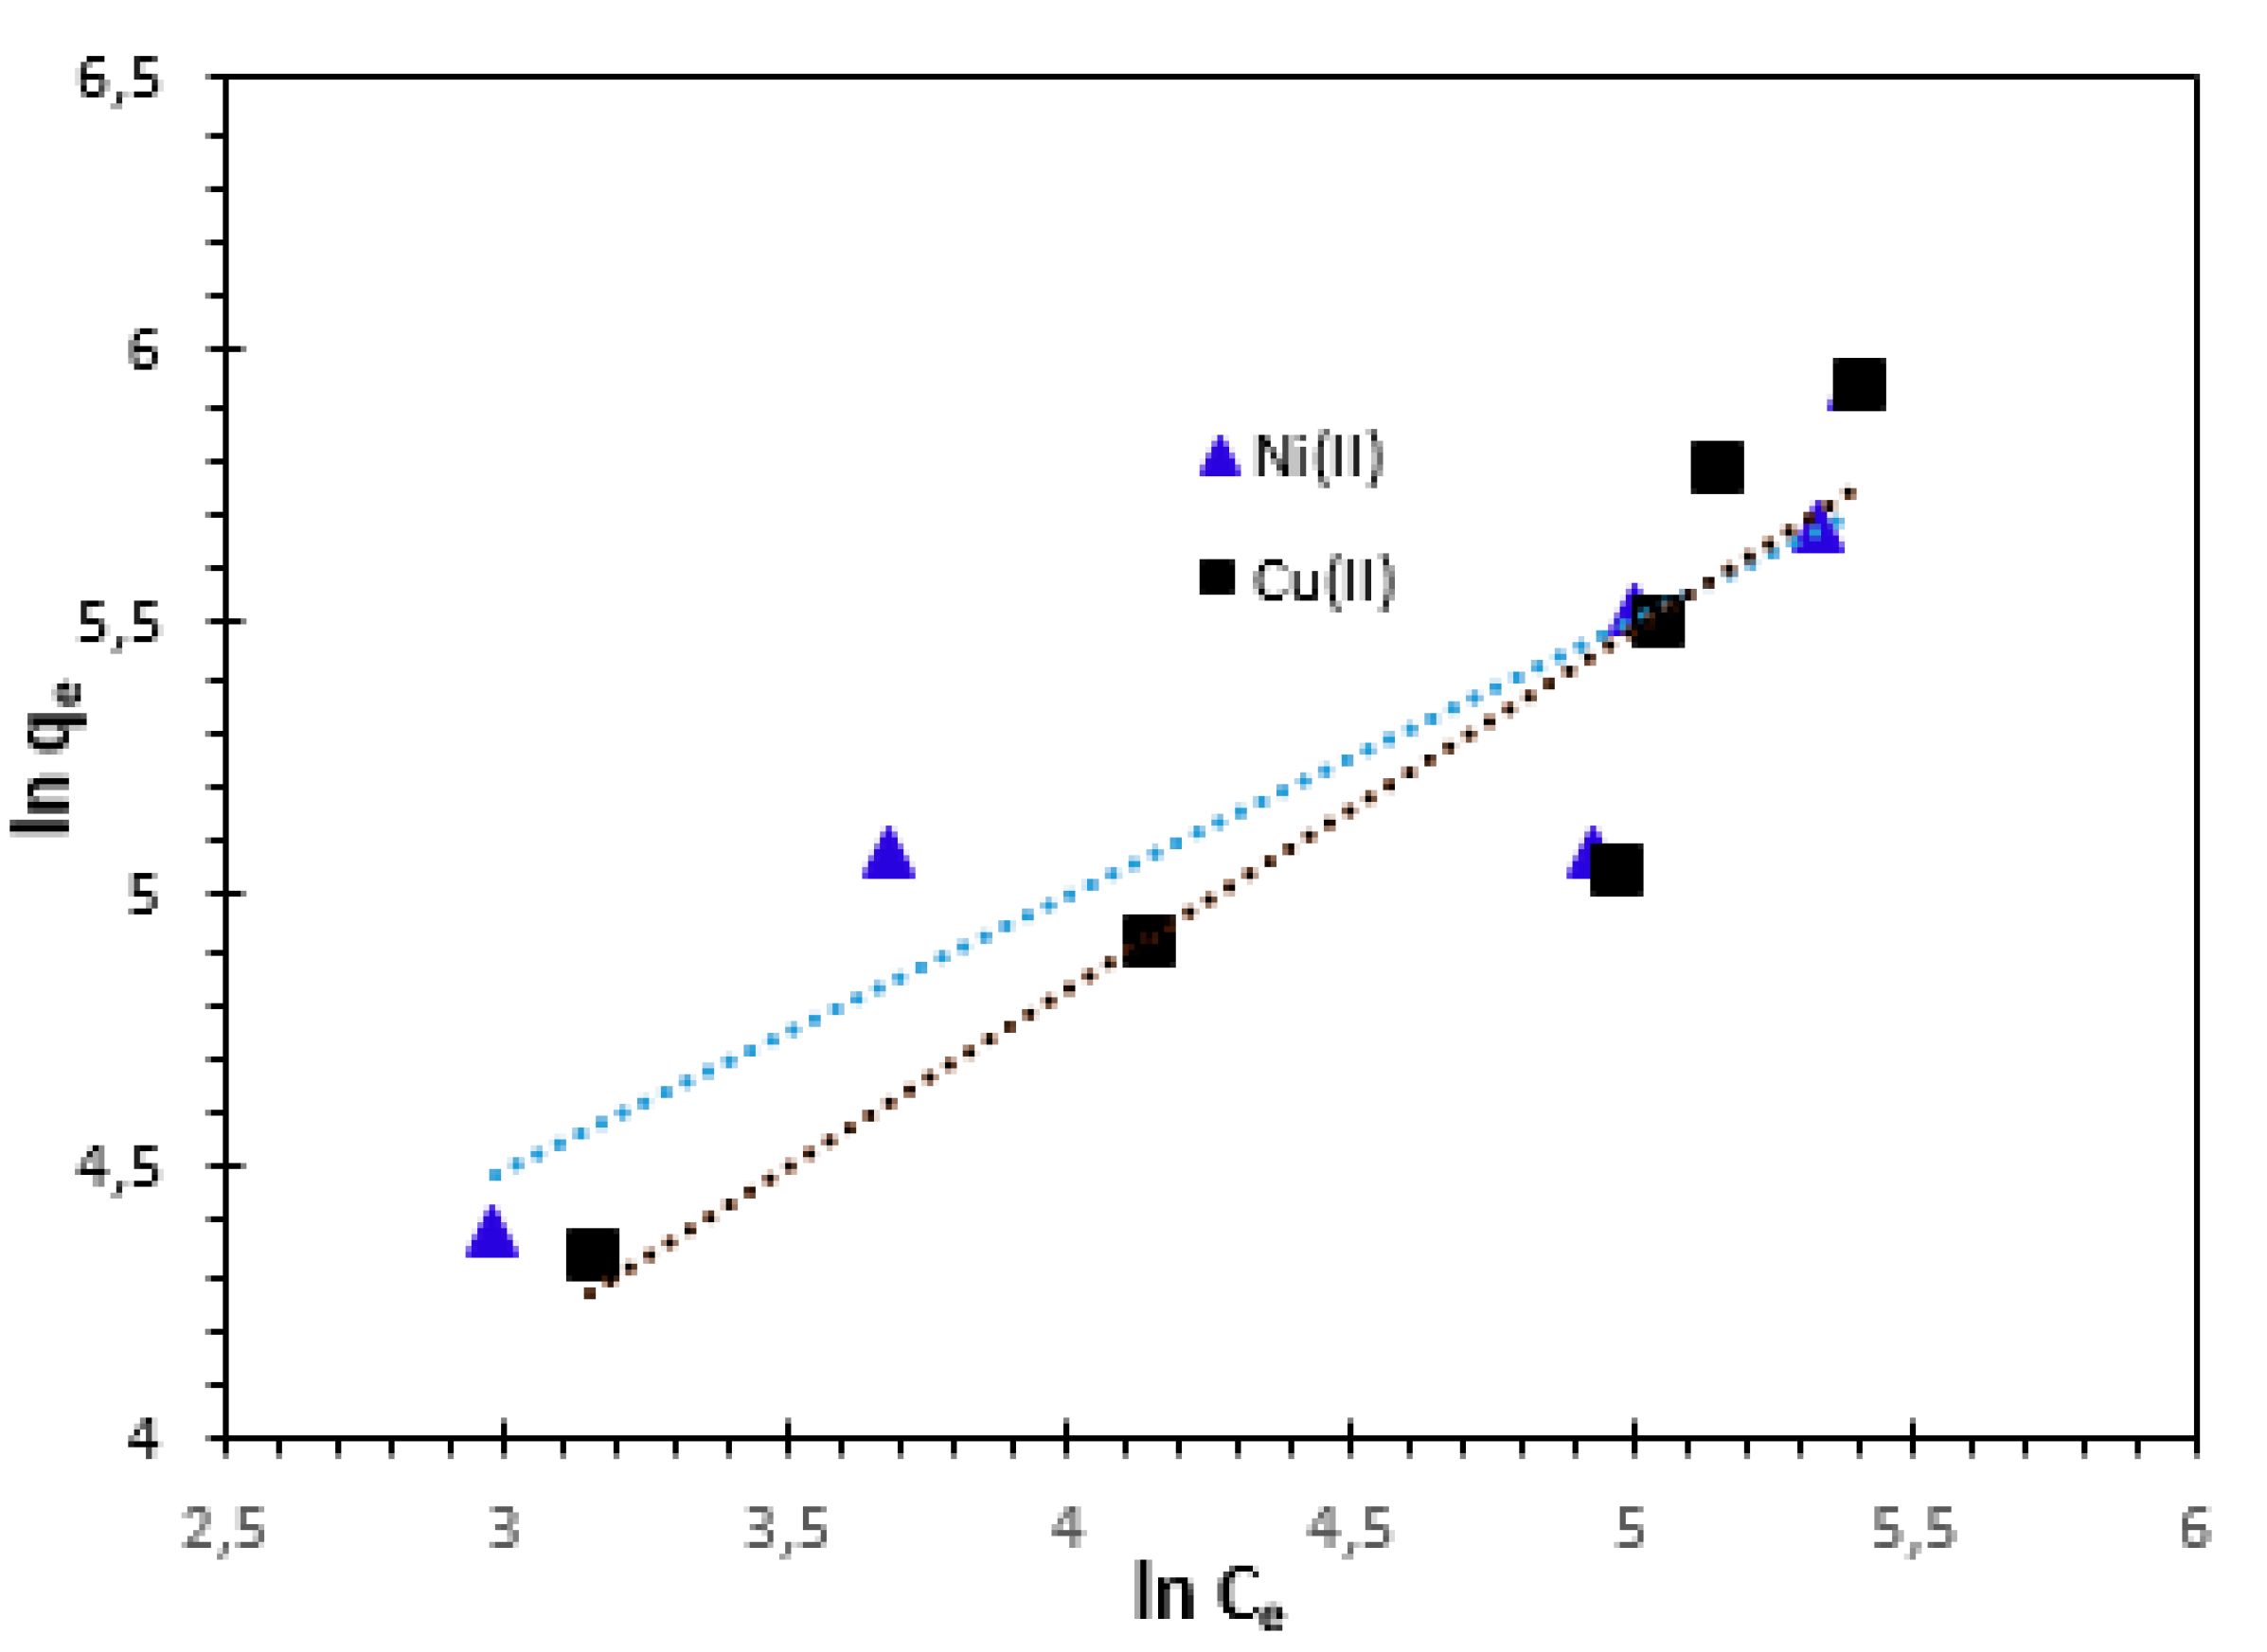
n also indicates the nature of the adsorption process. An adsorption is considered favourable if the value of n is between 0 and 1, unfavourable if its value is more than 1, linear adsorption if its value is 1, and the adsorption process is irreversible if its value is 0. The slope and intercept of the plot ln
qe vs ln
Ce were used to obtain the isotherm constants
n and
KF (
Figure 14). The values for Freundlich constants and correlation coefficients (
R2) for both temperatures are also presented in
Table 4.
The Freundlich isotherm constants KF and n are constants incorporating all factors affecting the adsorption process, such as adsorption capacity and intensity of adsorption. The constants KF and n were calculated from Eq. 14. These experiments confirm the efficiency of the bio-nanocomposite used to remove Cu2+ and Ni2+ cations from aqueous solutions.
3.4.3. Temkin Isotherm
The Temkin adsorption isotherm model is based on the heat of adsorption of ions, which is due to interactions between adsorbate and adsorbent. The Temkin isotherm equation is written as follows [
20,
44]:
Where
T is absolute temperature in Kelvin and
R the universal gas constant (8.314 J/mol/K).
bT (J/mol) is Temkin isotherm constant related to the heat of adsorption.
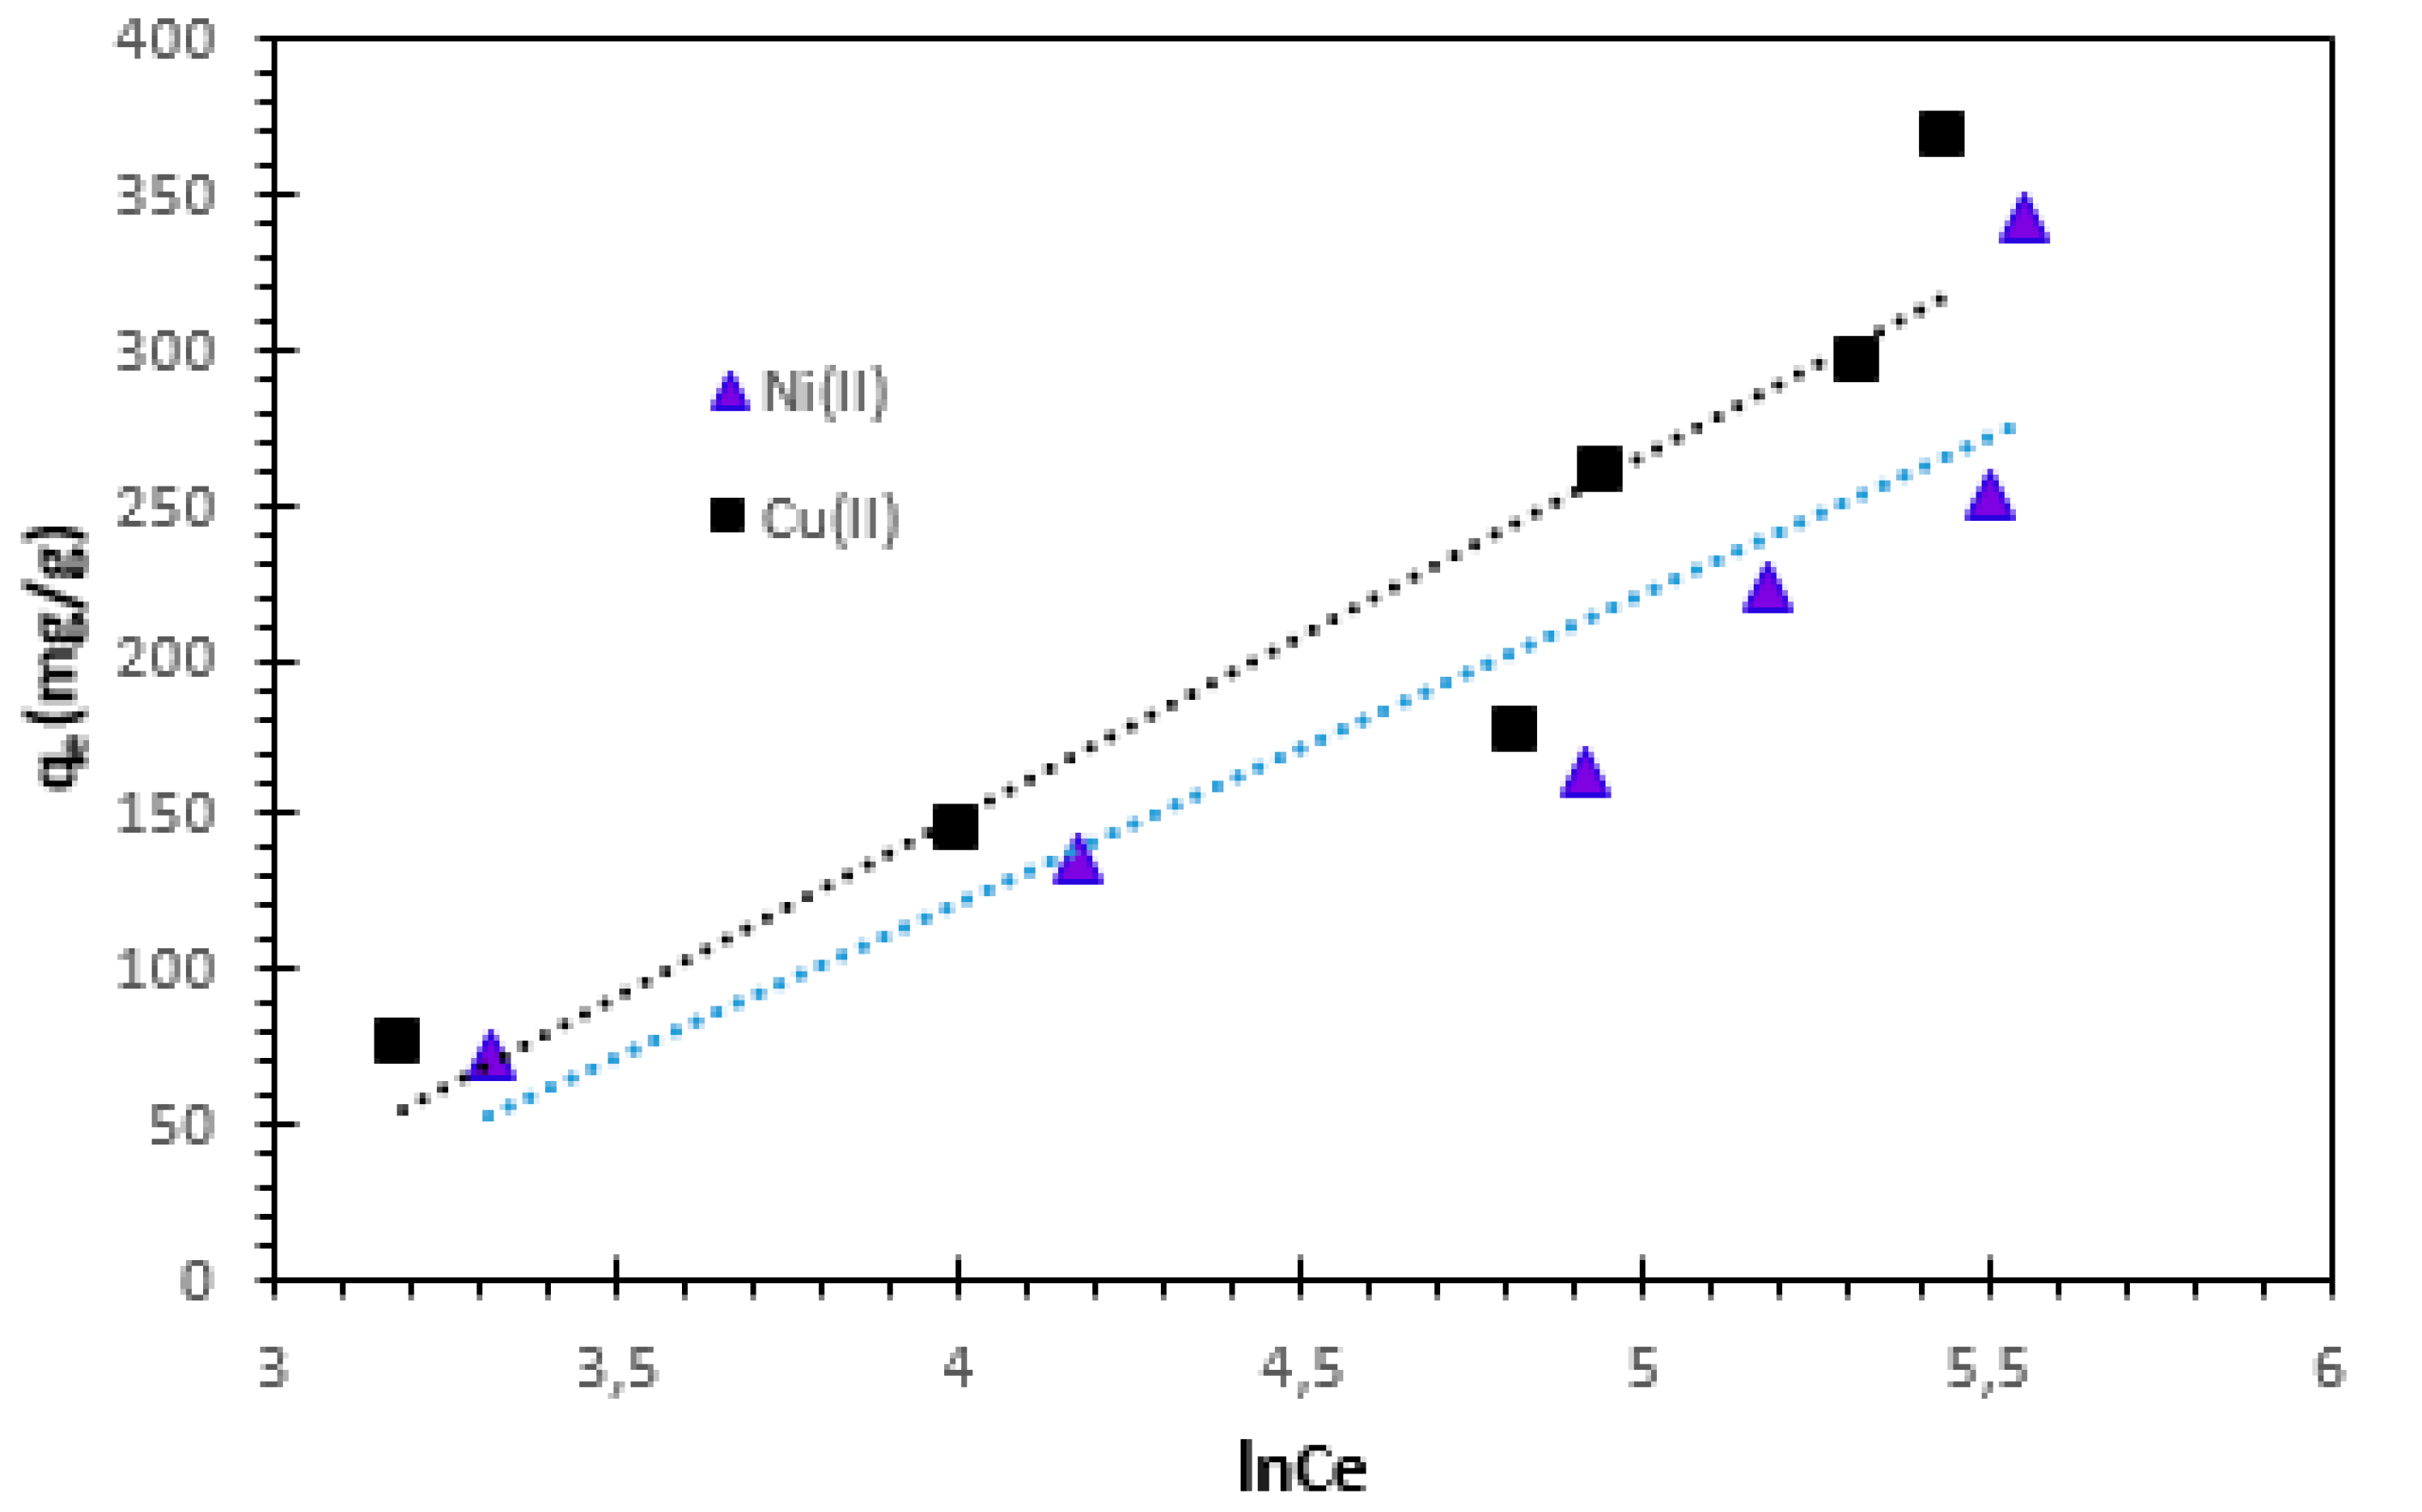
KT (L/mg) is the equilibrium binding constant corresponding to the maximum binding energy. The Temkin isotherm plot is presented in
Figure 15. The isotherm parameters are given in
Table 4. The Temkin constants
bT related to heat of adsorption of Cu
2+ and Ni
2+ cations at 25°C were found to be 24.938 J/mol for Ni
2+ and 21.33 J/mol for Cu
2+, respectively.
The linear regression of the data points showed rather low R2 values (0.829 for Ni2+ and 0.865 for Cu2+, indicating that adsorption of Cu2+ and Ni2+ cations did not fully follow the Temkin isotherm.
3.4.4. Dubinin–Radushkevich (D–R) isotherm
When expressing the adsorption mechanism with a Gaussian energy distribution onto a heterogeneous surface, the Dubinin-Radushkevich isotherm is usually used. It is used for calculating the mean free energy of adsorption
(E), not the constant adsorption potential or homogenous surface assumption. The D-R equation can be written in both linear and non-linear versions as follows [
20]:
Where
qm (mg/g) is the theoretical saturation capacity and
ε is the Polanyi potential that can be calculated from Eq. 19:
When the adsorbate is moved from the bulk solution to the surface of the solid, the constant
KD (mol
2/J
2) provides an estimate of the mean free energy
E (kJ/mol) of adsorption per molecule. This may be computed from the
KD value using the following relation (Eq. 20):
If the value of
E is between 8 and 16 kJ/mol, the adsorption process is expected to be chemisorption, while for values of
E < 8 kJ/mol, the adsorption process is physical in nature. The results are illustrated in
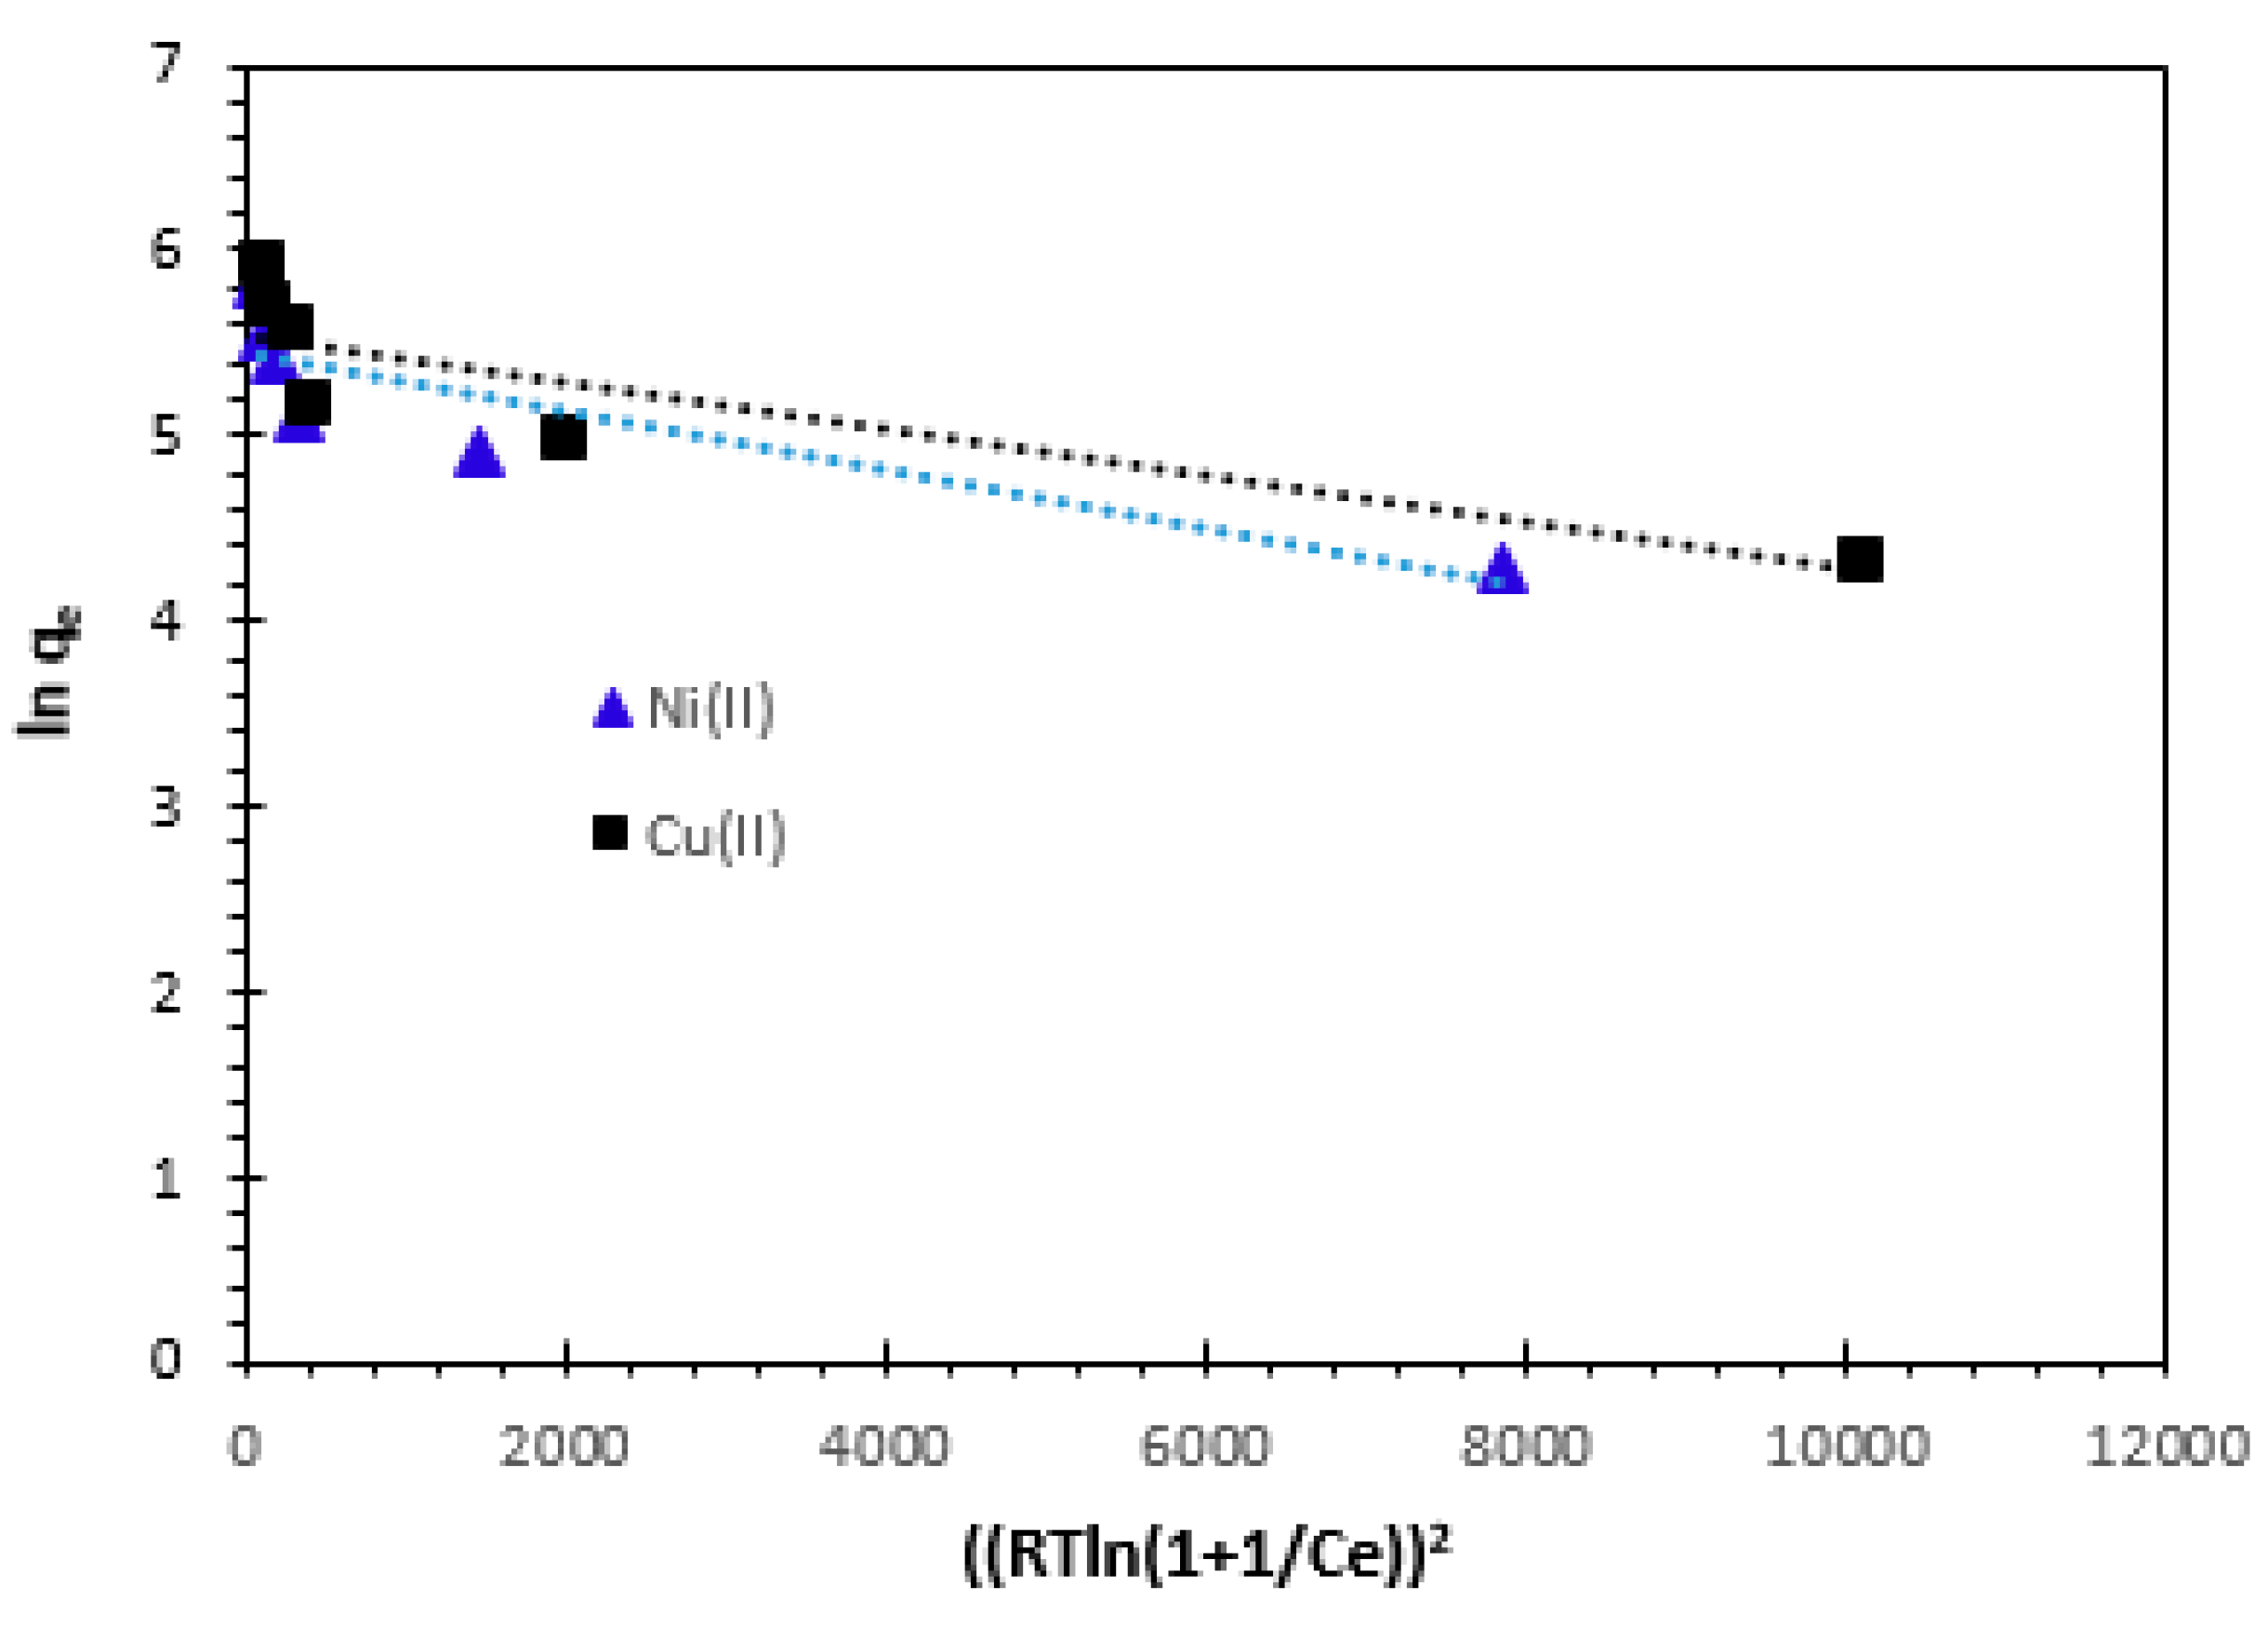
Table 4. The slope of the plot of
ln qe versus ε
2 gives
KD and the intercept yields the adsorption capacity
qm. As it can be seen in
Figure 16 and
Table 4, the correlation coefficient values are 0.756 for Ni
2+ and 0.771 for Cu
2+, respectively at 25°C. The numerical value of adsorption of the mean free energy is 50 J/mol for Ni
2+ and 70.71 J/mol for Cu
2+ (
Table 4) corresponds to a physisorption and the predominance of van der Waals forces.
Table 4.
Parameters of isotherm models for Cu2+ and Ni2+ cations. adsorption at 25°C.
Table 4.
Parameters of isotherm models for Cu2+ and Ni2+ cations. adsorption at 25°C.
| Model |
Parameters |
Metal Ions |
| Ni2+
|
Cu2+
|
| Langmuir |
qL(mg/g) |
370.37 |
454.54 |
|
KL (L/mg) |
0.0087 |
0.0082 |
| R2
|
0.970 |
0.970 |
| Freundlich |
1/n |
0.608 |
0.650 |
|
KF (mg/g) |
9.706 |
9.728 |
| R2
|
0.946 |
0.950 |
| Temkin |
KT (L/mg) |
0.062 |
0.066 |
|
bT (J/mol) |
24.94 |
21.33 |
| R² |
0.829 |
0.865 |
| D-R |
KD (mol2/J) |
2×10⁻⁴
|
10-4
|
|
qm (mg/g) |
229.63 |
258.60 |
|
E (J/mol) |
50 |
70.71 |
| R² |
0.756 |
0.771 |
3.5. Thermodynamic study
Determining the thermodynamic parameters is essential for comprehending the link between temperature and adsorption, which is mostly dependent on the specific combination of adsorbent and adsorbate. In general, adsorption is always accompanied by a thermal effect, which can be either exothermic (
ΔH° < 0) or endothermic (
ΔH° > 0). The measurement of the heat change
(ΔH°) serves as the primary criterion to distinguish between chemisorption and physisorption. In addition, estimating the standard entropy change (
ΔS°) helps in determining the degree of disorder in the adsorbate-adsorbent system, and evaluating the standard Gibbs free energy change (
ΔG°) permits us to forecast the spontaneity of a process [
20,
30,
44,
45]. These thermodynamic parameters were calculated from the following equations:
Where,
T is the absolute temperature in Kelvin and
R the universal gas constant (8.314 J/mol
/K).
Kd (L/mol) is the distribution coefficient. The results for the thermodynamic parameters are shown in
Table 5. The positive values of
ΔH° show that the adsorption is physical and endothermic, which is consistent with experimental data. The negative
∆G° readings demonstrate the spontaneous nature of the adsorption process. Positive ΔS° values indicate increased randomness at the solid/liquid interface during the adsorption of ion-organic ions onto the engineered bio-nanocomposite.
3.6. Binary component systems adsorption
To determine the mechanism of Cu
2+ and Ni
2+ cations adsorption from binary component system on bio-nanocomposite beads used, the experimental data were applied to Langmuir and Freundlich isotherm equations, at room temperature, at the initial ions solution pH, and with percentages of 50% Ni
2+ + 50% Cu
2+. The results obtained are shown in
Figure 17 and
Figure 18.
The values of Langmuir and Freundlich parameter for each anion of binary system and their respective determination of
R2 coefficient values are presented in
Table 6.
Interactions between both metal ions in the binary mixture were evaluated by the ratio
qL, mix/ qL, single, qL, mix, which is the maximum adsorption capacity in binary mixture, and
qL, single is the maximum adsorbed amount in the single system [
46,
47].
qL, mix/ qL, single > 1 adsorption is promoted by the presence of other ions;
qL, mix/ qL, single ˂1: adsorption is suppressed by other ions;
qL, mix/ qL, single = 1: there is no visible net interaction.
In this work, when mixed two metal ions, the ratio qL, mix/ qL, single is less than 1, which shows a great competition between both the ions (Ni2+ + Cu2+) to occupy the active sites (antagonism effect).
4. Conclusions
The aim of this work is to characterize and evaluate the adsorption of Cu2+ and Ni2+ from single and binary systems by Alginate-Moroccan clay bio-composite with the utilization of calcium chloride as a cross-linking agent, using the ionotropic gelation method. The results of the study demonstrated that the adsorption process is described by second-order kinetics, and the associated kinetic parameters were found. The adsorption equilibrium was investigated using a range of mathematical models, including the Langmuir, Freundlich, Temkin, and Dubinin-Radushkevich isotherm models, to evaluate the characteristics associated with the adsorption process. The adsorption of Cu2+ and Ni2+ ions using bio-nanocomposite beads was found to be best described by the Langmuir isotherm out of all the models. The maximum adsorbed amounts of metal ions by the bio-nanocomposite used were 370.37 mg/g for Ni2+ and 454.54 mg/g for Cu2+ from single system, for the binary system, according to the Langmuir isotherm, the maximum adsorbed amounts of Ni2+ and Cu2+ were 357.14 mg/g and 370,37 mg/g, respectively. There is proof that Alginate-Moroccan clay bio-nanocomposites can serve as a less expensive source of sorbents for the removal of metal ions such as Ni2+ and Cu2+ from single and binary systems.
According to the results of experiments, the positive values of ΔH° suggest that the adsorption is physical and endothermic. The spontaneous nature of the adsorption process is indicated by the negative value of ∆G°. Increased unpredictability at the solid/liquid interface during the adsorption of Cu2+ and Ni2+ cations onto the tailored material is shown by positive ΔS° values. The obtained results showed that alginate-based bio-nanocomposites have a highly significant adsorption ability for the removal of Ni2+ and Cu2+ cations in aqueous solutions.
Author Contributions
For research articles with several authors, a short paragraph specifying their individual contributions must be provided. The following statements should be used “Conceptualization, R.A. and D.S.S.; methodology, R.A. and D.S.S.; software, S.N.; validation, R.A., M.C. and M.B.; formal analysis, R.A. and M.B.; investigation, M.C.; resources, D.S.S.; data curation, R.A.; writing—original draft preparation, R.A.; writing—review and editing, R.A., D.S.S, and M.B.; visualization, M.B., S.N. and M.C.; supervision, D.S.S. and M.B.; project administration, D.S.S.; funding acquisition, D.S.S. All authors have read and agreed to the published version of the manuscript”.
Funding
This research received no external funding.
Institutional Review Board Statement
“Not applicable”.
Informed Consent Statement
“Not applicable”.
Data Availability Statement
“Not applicable”.
Acknowledgments
Association of Francophone Universities, AUF, for the BOURSES DE POSTDOCTORAT « EUGEN IONESCU » 2022-2023. National University of Science and Technology Politehnica of Bucharest, Faculty of Chemical Engineering and Biotechnologies, for technical and scientifical support.
Conflicts of Interest
The authors declare no conflict of interest.
References
- Mashkoor, F., Nasar, A., & Inamuddin. (2020). Carbon nanotube-based adsorbents for the removal of dyes from waters: a review. Environ. Chem. Lett. 2020, 18, 605-629.
- Tchounwou, P. B., Yedjou, C. G., Patlolla, A. K., & Sutton, D. J. Heavy metal toxicity and the environment. Molecular, clinical and environmental toxicology: Environ. Toxicol.2012,(3), 133-164.
- Boukarma, L., Aziam, R., Abali, M., Carja, G., Soudani, A., Zerbet, M., Sinan, F., Chiban, M. Algal biomass valorization for the removal of heavy metal ions. Inorganic-Organic Composites for Water and Wastewater Treatment: 2022, (2), 267-302.
- Valavanidis, A., & Vlachogianni, T. Metal pollution in ecosystems. Ecotoxicology studies and risk assessment in the marine environment. Dept. of Chemistry, University of Athens University Campus Zografou,2010, 15784.
- Bailey, S. E., Olin, T. J., Bricka, R. M., & Adrian, D. D. A review of potentially low-cost sorbents for heavy metals. Water research, 1999, 33(11), 2469-2479.
- Singh, S., Wasewar, K. L., & Kansal, S. K. Low-cost adsorbents for removal of inorganic impurities from wastewater. In Inorganic pollutants in water, 2022,173-203). Elsevier.
- Chiban, M., Soudani, A., Sinan, F., Tahrouch, S., & Persin, M. (2011). Characterization and application of dried plants to remove heavy metals, nitrate, and niphate ions from industrial wastewaters. Clean–Soil, Air, Water, 2011, 39(4), 376-383.
- Cho, H. J., Baek, K., Jeon, J. K., Park, S. H., Suh, D. J., & Park, Y. K. Removal characteristics of copper by marine macro-algae-derived chars. J. Chem. Eng, 2013, 217, 205-211.
- Lucaci, A. R., Bulgariu, D., Popescu, M. C., & Bulgariu, L. Adsorption of Cu (II) ions on adsorbent materials obtained from marine red algae Callithamnion corymbosum sp. Water, 2020, 12(2), 372.
- Kadirvelu, K., Faur-Brasquet, C., & Cloirec, P. L. Removal of Cu (II), Pb (II), and Ni (II) by adsorption onto activated carbon cloths. Langmuir, 2000, 16(22), 8404-8409.
- Srivastava, V., Weng, C. H., Singh, V. K., & Sharma, Y. C. (2011). Adsorption of nickel ions from aqueous solutions by nano alumina: kinetic, mass transfer, and equilibrium studies. J. Chem. Eng. Data. 2011,56(4), 1414-1422.
- Srivastava, V. C., Mall, I. D., & Mishra, I. M. Competitive adsorption of cadmium (II) and nickel (II) metal ions from aqueous solution onto rice husk ash. Chem. Eng. Process.: Process Intensification, 2009, 48(1), 370-379.
- Hannachi, Y., Shapovalov, N. A., & Hannachi, A. Adsorption of nickel from aqueous solution by the use of low-cost adsorbents. Korean J Chem Eng. 2010, 27, 152-158.
- Rao, M., Parwate, A. V., & Bhole, A. G. (2002). Removal of Cr6+ and Ni2+ from aqueous solution using bagasse and fly ash. Waste management, 2002, 22(7), 821-830.
- Sharma, Y. C., & Upadhyay, S. N. Removal of a cationic dye from wastewaters by adsorption on activated carbon developed from coconut coir. Energy & Fuels, 2009, 23(6), 2983-2988.
- Sharma, Y. C., Srivastava, V., Upadhyay, S. N., & Weng, C. H. Alumina nanoparticles for the removal of Ni (II) from aqueous solutions. Ind. Eng. Chem. Res.2008, 47(21), 8095-8100.
- Rajaniemi, K.; Hu, T.; Nurmesniemi, E. T.; Tuomikoski, S.; Lassi, U. Phosphate and ammonium removal from water through electrochemical and chemical precipitation of struvite. Processes 2021, 9, 150.–content. [Google Scholar] [CrossRef]
- Vikrant, K.; Kim, K. H.; Ok, Y. S.; Tsang, D. C.; Tsang, Y. F.; Giri, B. S.; Singh, R. S. Engineered/designer biochar for the removal of phosphate in water and wastewater. Sci. Total Environ. 2018, 616, 1242-1260.–1260. [Google Scholar] [CrossRef] [PubMed]
- Sun, J.; Gao, A.; Wang, X.; Xu, X.; Song, J. Removal of phosphorus from wastewater by different morphological alumina. Molecules 2020, 25, 3092. [Google Scholar] [CrossRef] [PubMed]
- Aziam, R.; Chiban, M.; Eddaoudi, H.; Soudani, A.; Zerbet, M.; Sinan, F. Kinetic modeling, equilibrium isotherm and thermodynamic studies on a batch adsorption of anionic dye onto eco-friendly dried Carpobrotus edulis plant. Eur Phys J Spec Top. 2017, 226, 977-992.–992. [Google Scholar] [CrossRef]
- Barrak, I.; Ayouch, I.; Kassab, Z.; El Achaby, M.; Barhoun, A.; Draoui, K. Sodium alginate encapsulated Moroccan clay as eco-friendly and efficient adsorbent for copper ions from aqueous medium. Mater. Today: Proc. 2022, 51, 2040–2046. [Google Scholar] [CrossRef]
- Banerjee, S.; Chattopadhyaya, M. C. Adsorption characteristics for the removal of a toxic dye, tartrazine from aqueous solutions by a low cost agricultural by-product. Arab. J. Chem. 2017, 10, S1629-S1638.–S1638. [Google Scholar] [CrossRef]
- Wang, L.; Sun, W.; Hu, Y. H.; Xu, L. H. Adsorption mechanism of mixed anionic/cationic collectors in Muscovite–Quartz flotation system. Miner. Eng. 2014, 64, 44–50. [Google Scholar] [CrossRef]
- Bao, T.; Damtie, M. M.; Hosseinzadeh, A.; Frost, R. L.; Yu, Z. M.; Jin, J.; Wu, K. Catalytic degradation of P-chlorophenol by muscovite-supported nano zero valent iron composite: Synthesis, characterization, and mechanism studies. Appl. Clay Sci. 2020, 195, 105735. [Google Scholar] [CrossRef]
- Kausar, A.; Rehman, S. U.; Khalid, F.; Bonilla-Petriciolet, A.; Mendoza-Castillo, D. I.; Bhatti, H. N.; Ibrahim, S. M.; Iqbal, M. Cellulose, clay and sodium alginate composites for the removal of methylene blue dye: Experimental and DFT studies. Int. J. Biol. Macromol. 2022, 209, 576–585. [Google Scholar] [CrossRef] [PubMed]
- Benhima, H., Chiban, M., Sinan, F., Seta, P., & Persin, M. Removal of lead and cadmium ions from aqueous solution by adsorption onto micro-particles of dry plants. Colloids Surf. B., 2008, 61(1), 10-16.
- Veli, S., & Alyüz, B. Adsorption of copper and zinc from aqueous solutions by using natural clay. J. Hazard. Mater., 2007, 149(1), 226-233.
- Abou Oualid, H., Abdellaoui, Y., Laabd, M., El Ouardi, M., Brahmi, Y., Iazza, M., & Abou Oualid, J. Eco-efficient green seaweed codium decorticatum biosorbent for textile dyes: Characterization, mechanism, recyclability, and RSM optimization. ACS omega, 2020, 5(35), 22192-22207.
- Karthikeyan, P., & Meenakshi, S. Development of sodium alginate@ ZnFe-LDHs functionalized beads: Adsorption properties and mechanistic behaviour of phosphate and nitrate ions from the aqueous environment. Environmental Chemistry and Ecotoxicology,2021, 3, 42-50.
- Nouaa, S., Aziam, R., Benhiti, R., Carja, G., Iaich, S., Zerbet, M., & Chiban, M. Synthesis of LDH/alginate composite beads as a potential adsorbent for phosphate removal: kinetic and equilibrium studies. Chem. Pap., 2023, 77(11), 6689-6705.
- Stefan, D. S., & Meghea, I. Mechanism of simultaneous removal of Ca2+, Ni2+, Pb2+ and Al3+ ions from aqueous solutions using Purolite® S930 ion exchange resin. C. R. Chim., 2014, 17(5), 496-502.
- Alothman, Z. A., Bahkali, A. H., Khiyami, M. A., Alfadul, S. M., Wabaidur, S. M., Alam, M., & Alfarhan, B. Z. Low cost biosorbents from fungi for heavy metals removal from wastewater. Sep. Sci. Technol., 2020, 55(10), 1766-1775.
- Akram, M.; Xu, X.; Gao, B.; Wang, S.; Khan, R.; Yue, Q.; Duan, P.; Dan, H.; Pan, J. Highly efficient removal of phosphate from aqueous media by pomegranate peel co-doping with ferric chloride and lanthanum hydroxide nanoparticles. J. Clean. Prod. 2021, 292, 125311. [Google Scholar] [CrossRef]
- Sabzehmeidani, M. M.; Mahnaee, S.; Ghaedi, M.; Heidari, H.; Roy, V. A. Carbon based materials: A review of adsorbents for inorganic and organic compounds. Materials Advances, 2021; 2, 598–627. [Google Scholar]
- Photiou, P.; Koutsokeras, L.; Constantinides, G.; Koutinas, M.; Vyrides, I. Phosphate removal from synthetic and real wastewater using thermally treated seagrass residues of Posidonia oceanica. J. Clean. Prod. 2021, 278, 123294. [Google Scholar] [CrossRef]
- Wang, A.; Zhou, K.; Liu, X.; Liu, F.; Zhang, C.; Chen, Q. Granular tri-metal oxide adsorbent for fluoride uptake: adsorption kinetic and equilibrium studies. J. Colloid Interface Sci. 2017, 505, 947–955. [Google Scholar] [CrossRef] [PubMed]
- Wu, C. ; Li, L. ; Zhou, H. ; Ai, J. ; Zhang, H. ; Tao, J., Wang, D. ; Zhang, W. Effects of chemical modification on physicochemical properties and adsorption behavior of sludge-based activated carbon. J. Environ. Sci. 2021; 100, 340–352.
- Benjelloun, M., Miyah, Y., Evrendilek, G. A., Zerrouq, F., & Lairini, S. (2021). Recent advances in adsorption kinetic models: their application to dye types. Arab. J. Chem., 2021, 14(4), 103031.
- Shokoohi, R., Farji, H., Ghiasian, S. A., Faradmal, J., Azizi, S., & Salari, M. Evaluation of ability of aspergillus terreus fungi in removal of Cadmium from Aquatic Solutions: isotherm and kinetic studies. J Res. Environ Health., 2017, 3(2), 126-135.
- Kalam, S.; Abu-Khamsin, S. A.; Kamal, M. S.; Patil, S. Surfactant adsorption isotherms: A review. ACS omega 2021, 6, 32342–32348. [Google Scholar] [CrossRef] [PubMed]
- Ahmadou, F.; Abahdou, F. Z.; Slimani, R.; El Hajjaji, S. Methylen blue removal by adsorption on Moringa oleifera pods powder and Moringa oleifera kernels powder: kinetic, isotherm and thermodynamic studies. Moroc. J. Chem. 2023, 11(1), 11-1.–1. [Google Scholar]
- Elsherif, K. M.; El-Dali, A.; Ewlad-Ahmed, A. M.; Treban, A. A.; Alqadhi, H.; Alkarewi, S. Kinetics and isotherms studies of safranin adsorption onto two surfaces prepared from orange peels. Moroc. J. Chem. 2022, 10, 10-4. [Google Scholar]
- Nguyen, V. T.; Nguyen, T. A.; Tran, T. H.; Le, T. N.; Nguyen, N. H. Batch and column adsorption of reactive dye by eggshell powder–chitosan gel core-shell material. Moroc. J. Chem. 2021; 9, 9-1. [Google Scholar]
- Gunasekar, V.; Ponnusami, V. Kinetics, equilibrium, and thermodynamic studies on adsorption of methylene blue by carbonized plant leaf powder. J. Chem. 2013. [CrossRef]
- Farch, S.; Yahoum, M. M.; Toumi, S.;Tahraoui, H.; Lefnaoui, S., Kebir, M.; Zamouche, M.; Amrane, A.; Zhang, J.; Hadadi, A.; Mouni, L. Application of Walnut Shell Biowaste as an Inexpensive Adsorbent for Methylene Blue Dye: Isotherms, Kinetics, Thermodynamics, and Modeling. Separations 2023, 10(1), 60.
- Chiban, M.; Soudani, A.; Sinan, F.; Persin, M. Single, binary and multi-component adsorption of some anions and heavy metals on environmentally friendly Carpobrotus edulis plant. Colloids Surf. B.: Biointerfaces, 2011, 82(2), 267-276.
- Grover, A.; Mohiuddin, I.; Malik, A.K.; Aulakh, J.S.; Vikrant, K.; Kim, K.H.; Brown, R.J. Magnesium/aluminum layered double hydroxides intercalated with starch for effective adsorptive removal of anionic dyes. J. Hazard. Mater. 2022, 424, 127454. [Google Scholar] [CrossRef] [PubMed]
Figure 1.
SEM images of alginate-clay Bio-nanocomposite microparticles.
Figure 1.
SEM images of alginate-clay Bio-nanocomposite microparticles.
Figure 2.
EDX analysis of Alginate- Moroccan clay bio-nanocomposite beads.
Figure 2.
EDX analysis of Alginate- Moroccan clay bio-nanocomposite beads.
Figure 3.
pH at the point of zero charge (pHZPC) of the Alginate-Moroccan clay bio-nanocomposite.
Figure 3.
pH at the point of zero charge (pHZPC) of the Alginate-Moroccan clay bio-nanocomposite.
Figure 4.
X-ray Diffraction: (a) Natural Moroccan Clay (MUS), (b), Alginate-Moroccan Clay Bio-nanocomposite (ALG/MUS).
Figure 4.
X-ray Diffraction: (a) Natural Moroccan Clay (MUS), (b), Alginate-Moroccan Clay Bio-nanocomposite (ALG/MUS).
Figure 5.
Effect of adsorbent dose on the removal of Cu2+ and Ni2+ cations: C0= 100 mg/L, T=23±2°C and Tc= 12h (contact time).
Figure 5.
Effect of adsorbent dose on the removal of Cu2+ and Ni2+ cations: C0= 100 mg/L, T=23±2°C and Tc= 12h (contact time).
Figure 6.
Effect of contact time on the removal of Cu2+ and Ni2+ cations onto bio-nanocomposite beads: m/V=1 g/L and T=25°C.
Figure 6.
Effect of contact time on the removal of Cu2+ and Ni2+ cations onto bio-nanocomposite beads: m/V=1 g/L and T=25°C.
Figure 7.
Effect of initial pH on the adsorption of Cu2+ (a) and Ni2+(b) cations: C0= 100 mg/L, m/V= 1 g/L and T=23±2°C.
Figure 7.
Effect of initial pH on the adsorption of Cu2+ (a) and Ni2+(b) cations: C0= 100 mg/L, m/V= 1 g/L and T=23±2°C.
Figure 8.
Effect of temperature on the adsorption of Cu2+ and Ni2 cations by bio-nanocomposite beads: C0 = 100 mg/L and m/V = 1 g/L.
Figure 8.
Effect of temperature on the adsorption of Cu2+ and Ni2 cations by bio-nanocomposite beads: C0 = 100 mg/L and m/V = 1 g/L.
Figure 9.
Pseudo-first order adsorption kinetics model on adsorption of Cu2+ and Ni2+ cations by bio-nanocomposite beads.
Figure 9.
Pseudo-first order adsorption kinetics model on adsorption of Cu2+ and Ni2+ cations by bio-nanocomposite beads.
Figure 10.
Pseudo-second-order kinetic model of Cu2+ and Ni2 cations adsorption on bio-nanocomposite beads.
Figure 10.
Pseudo-second-order kinetic model of Cu2+ and Ni2 cations adsorption on bio-nanocomposite beads.
Figure 11.
Elovich kinetic model of Cu2+ and Ni2+ cations adsorption on bio-nanocomposite beads.
Figure 11.
Elovich kinetic model of Cu2+ and Ni2+ cations adsorption on bio-nanocomposite beads.
Figure 12.
Intra-particle diffusion kinetics model of Cu2+ and Ni2 cations adsorption on bio-nanocomposite beads.
Figure 12.
Intra-particle diffusion kinetics model of Cu2+ and Ni2 cations adsorption on bio-nanocomposite beads.
Figure 13.
Langmuir adsorption isotherm of Cu2+ and Ni2+ cations at 25°C.
Figure 13.
Langmuir adsorption isotherm of Cu2+ and Ni2+ cations at 25°C.
Figure 14.
Freundlich adsorption isotherm of Cu2+ and Ni2+ cations at 25°C.
Figure 14.
Freundlich adsorption isotherm of Cu2+ and Ni2+ cations at 25°C.
Figure 15.
Temkin adsorption isotherm of Cu2+ and Ni2+ cations at 25°C.
Figure 15.
Temkin adsorption isotherm of Cu2+ and Ni2+ cations at 25°C.
Figure 16.
Dubinin–Radushkevich (D–R) adsorption isotherm of Cu2+ and Ni2+ cations at 25°C.
Figure 16.
Dubinin–Radushkevich (D–R) adsorption isotherm of Cu2+ and Ni2+ cations at 25°C.
Figure 17.
Langmuir isotherm of Ni2+ and Cu2+ cations on bio-nanocomposite beads in binary component system.
Figure 17.
Langmuir isotherm of Ni2+ and Cu2+ cations on bio-nanocomposite beads in binary component system.
Figure 18.
Freundlich isotherm of Ni2+ and Cu2+ cations on bio-nanocomposite beads in binary component system.
Figure 18.
Freundlich isotherm of Ni2+ and Cu2+ cations on bio-nanocomposite beads in binary component system.
Table 1.
EDX analysis results of Bio-nanocomposite beads.
Table 1.
EDX analysis results of Bio-nanocomposite beads.
| Elements |
Atomic percentage (%) |
| C |
33,83 |
| O |
54,04 |
| Na |
0,76 |
| Mg |
0,46 |
| Al |
3,55 |
| Si |
5,45 |
| Ca |
1.00 |
| S |
0,14 |
| K |
0,29 |
| Ti |
0,23 |
Table 3.
Isotherm type for various RL values.
Table 3.
Isotherm type for various RL values.
| Dimensionless constant |
Metal ions |
| Ni2+
|
Cu2+
|
| RL |
0.160 |
0.168 |
Table 5.
Thermodynamic parameters for of Cu2+ and Ni2+ cations at 25°C. adsorption at C0=100mg/L.
Table 5.
Thermodynamic parameters for of Cu2+ and Ni2+ cations at 25°C. adsorption at C0=100mg/L.
| Ion |
∆G° (kJ/mol) |
∆H° (kJ/mol) |
∆S° (J/K/mol) |
| 25 °C |
30 °C |
35 °C |
40 °C |
| Ni2+
|
-12.52 |
-13.18 |
-13.56 |
-14.06 |
17,178 |
99,83 |
| Cu2+
|
-14.33 |
-14.71 |
-15.69 |
-16.71 |
33.89 |
161.15 |
Table 6.
Parameters of Langmuir and Freundlich models for the adsorption of Ni2+ and Cu2+ cations on bio-nanocomposite beads in binary component system.
Table 6.
Parameters of Langmuir and Freundlich models for the adsorption of Ni2+ and Cu2+ cations on bio-nanocomposite beads in binary component system.
| System |
Freundlich parameters |
Langmuir parameters |
|
| 1/n |
|
|
(mg/g) |
|
|
Ni2+
Cu2+
|
0.507 |
19.53 |
0.823 |
357.14 |
0.0015 |
0.892 |
0.96 |
| 0.655 |
9.09 |
0.853 |
370.37 |
0.010 |
0.902 |
0.81 |
|
Disclaimer/Publisher’s Note: The statements, opinions and data contained in all publications are solely those of the individual author(s) and contributor(s) and not of MDPI and/or the editor(s). MDPI and/or the editor(s) disclaim responsibility for any injury to people or property resulting from any ideas, methods, instructions or products referred to in the content. |
© 2023 by the authors. Licensee MDPI, Basel, Switzerland. This article is an open access article distributed under the terms and conditions of the Creative Commons Attribution (CC BY) license (http://creativecommons.org/licenses/by/4.0/).
