1. Introduction
Radiative budget is known to be the main regulator of the Earth’s climate. Despite a great progress in recent studies [
1], the uncertainties of its evaluation are still noticeable [
1,
2]. For attributing possible scenarios of climate change, one needs the accurate assessment of shortwave and longwave radiation and their changes in different geographical regions of the world. For better understanding physical mechanisms of the variability of radiation budget, the role of main geophysical factors, like aerosols, cloudiness and surface reflectance, should be accurately quantified.
For this purpose, the highest quality measurements have been in operation within the frame of the Baseline Surface Radiation Network (BSRN) [
3] since 1992 [
4]. The ongoing BSRN monitoring is widely used in validation and confirmation of satellite radiative data retrievals and radiative transfer models [
2]. Currently BSRN network includes relatively small number of stations (currently 51 active sites), which are located in different climatic zones, covering a latitude range from 80°N to 90°S.
A special attention has been paid to the application of the BSRN data for verification of the results of CMIP project models [
2,
4]. However, still there is no complete consistency in the model estimations of radiation fluxes [
4] and observations. In this regard, the continuation and spreading of ground-based high quality BSRN observations are of great importance.
Another important aspect of ground-based measurements is the accumulation of long-term series of observations, which are used for detecting global dimming and brightening effects [
2,
5].
Meteorological Observatory of Lomonosov Moscow State University (MSU MO, 55.707 N., 37.52 E) provides a long series of radiative measurements since 1954 [
6]. The observations include measurements of direct, diffuse, global and reflected shortwave irradiance, and net radiation using thermoelectric Russian instruments recommended by Roshydromet agency [
7] as well as UV irradiance 300-380nm and biologically active erythemally weighted UV irradiance [
8,
9]. MSU MO is a part of national and international radiative networks. The radiative data of the MSU MO store in the database of the World Radiation Data Center (WRDC) [
11]. The analysis of long-term radiative measurements, as well as the main features of the radiation regime of Moscow were described in [
9,
10,
12]. In addition, the measurements of MSU MO are used for testing the reconstruction models [
13].
In order to improve the quality of radiative observations and to meet the standard of high quality measurements, a new radiation RAD-MSU(BSRN) complex has been installed at the MSU MO in summer 2021 [
14]. This complex was equipped by the Kipp&Zonen instruments [
15] , which were used at BSRN stations.
The aim of this paper is to analyze the main features of radiative budget at ground for the two years period on the base of the data of the new MSU-RAD(BSRN) complex. In the analysis we focus on the effects of aerosol content, cloudiness, and the influence of surface albedo on shortwave irradiance. In addition, we made the comparisons between the MSU-RAD(BSRN) data and ongoing standard measurements by the Russian instruments, and estimated the radiative changes during the last years compared to long-term observations at the MSU MO.
2. Materials and Methods
2.1. MSU-RAD(BSRN) instrumentation complex
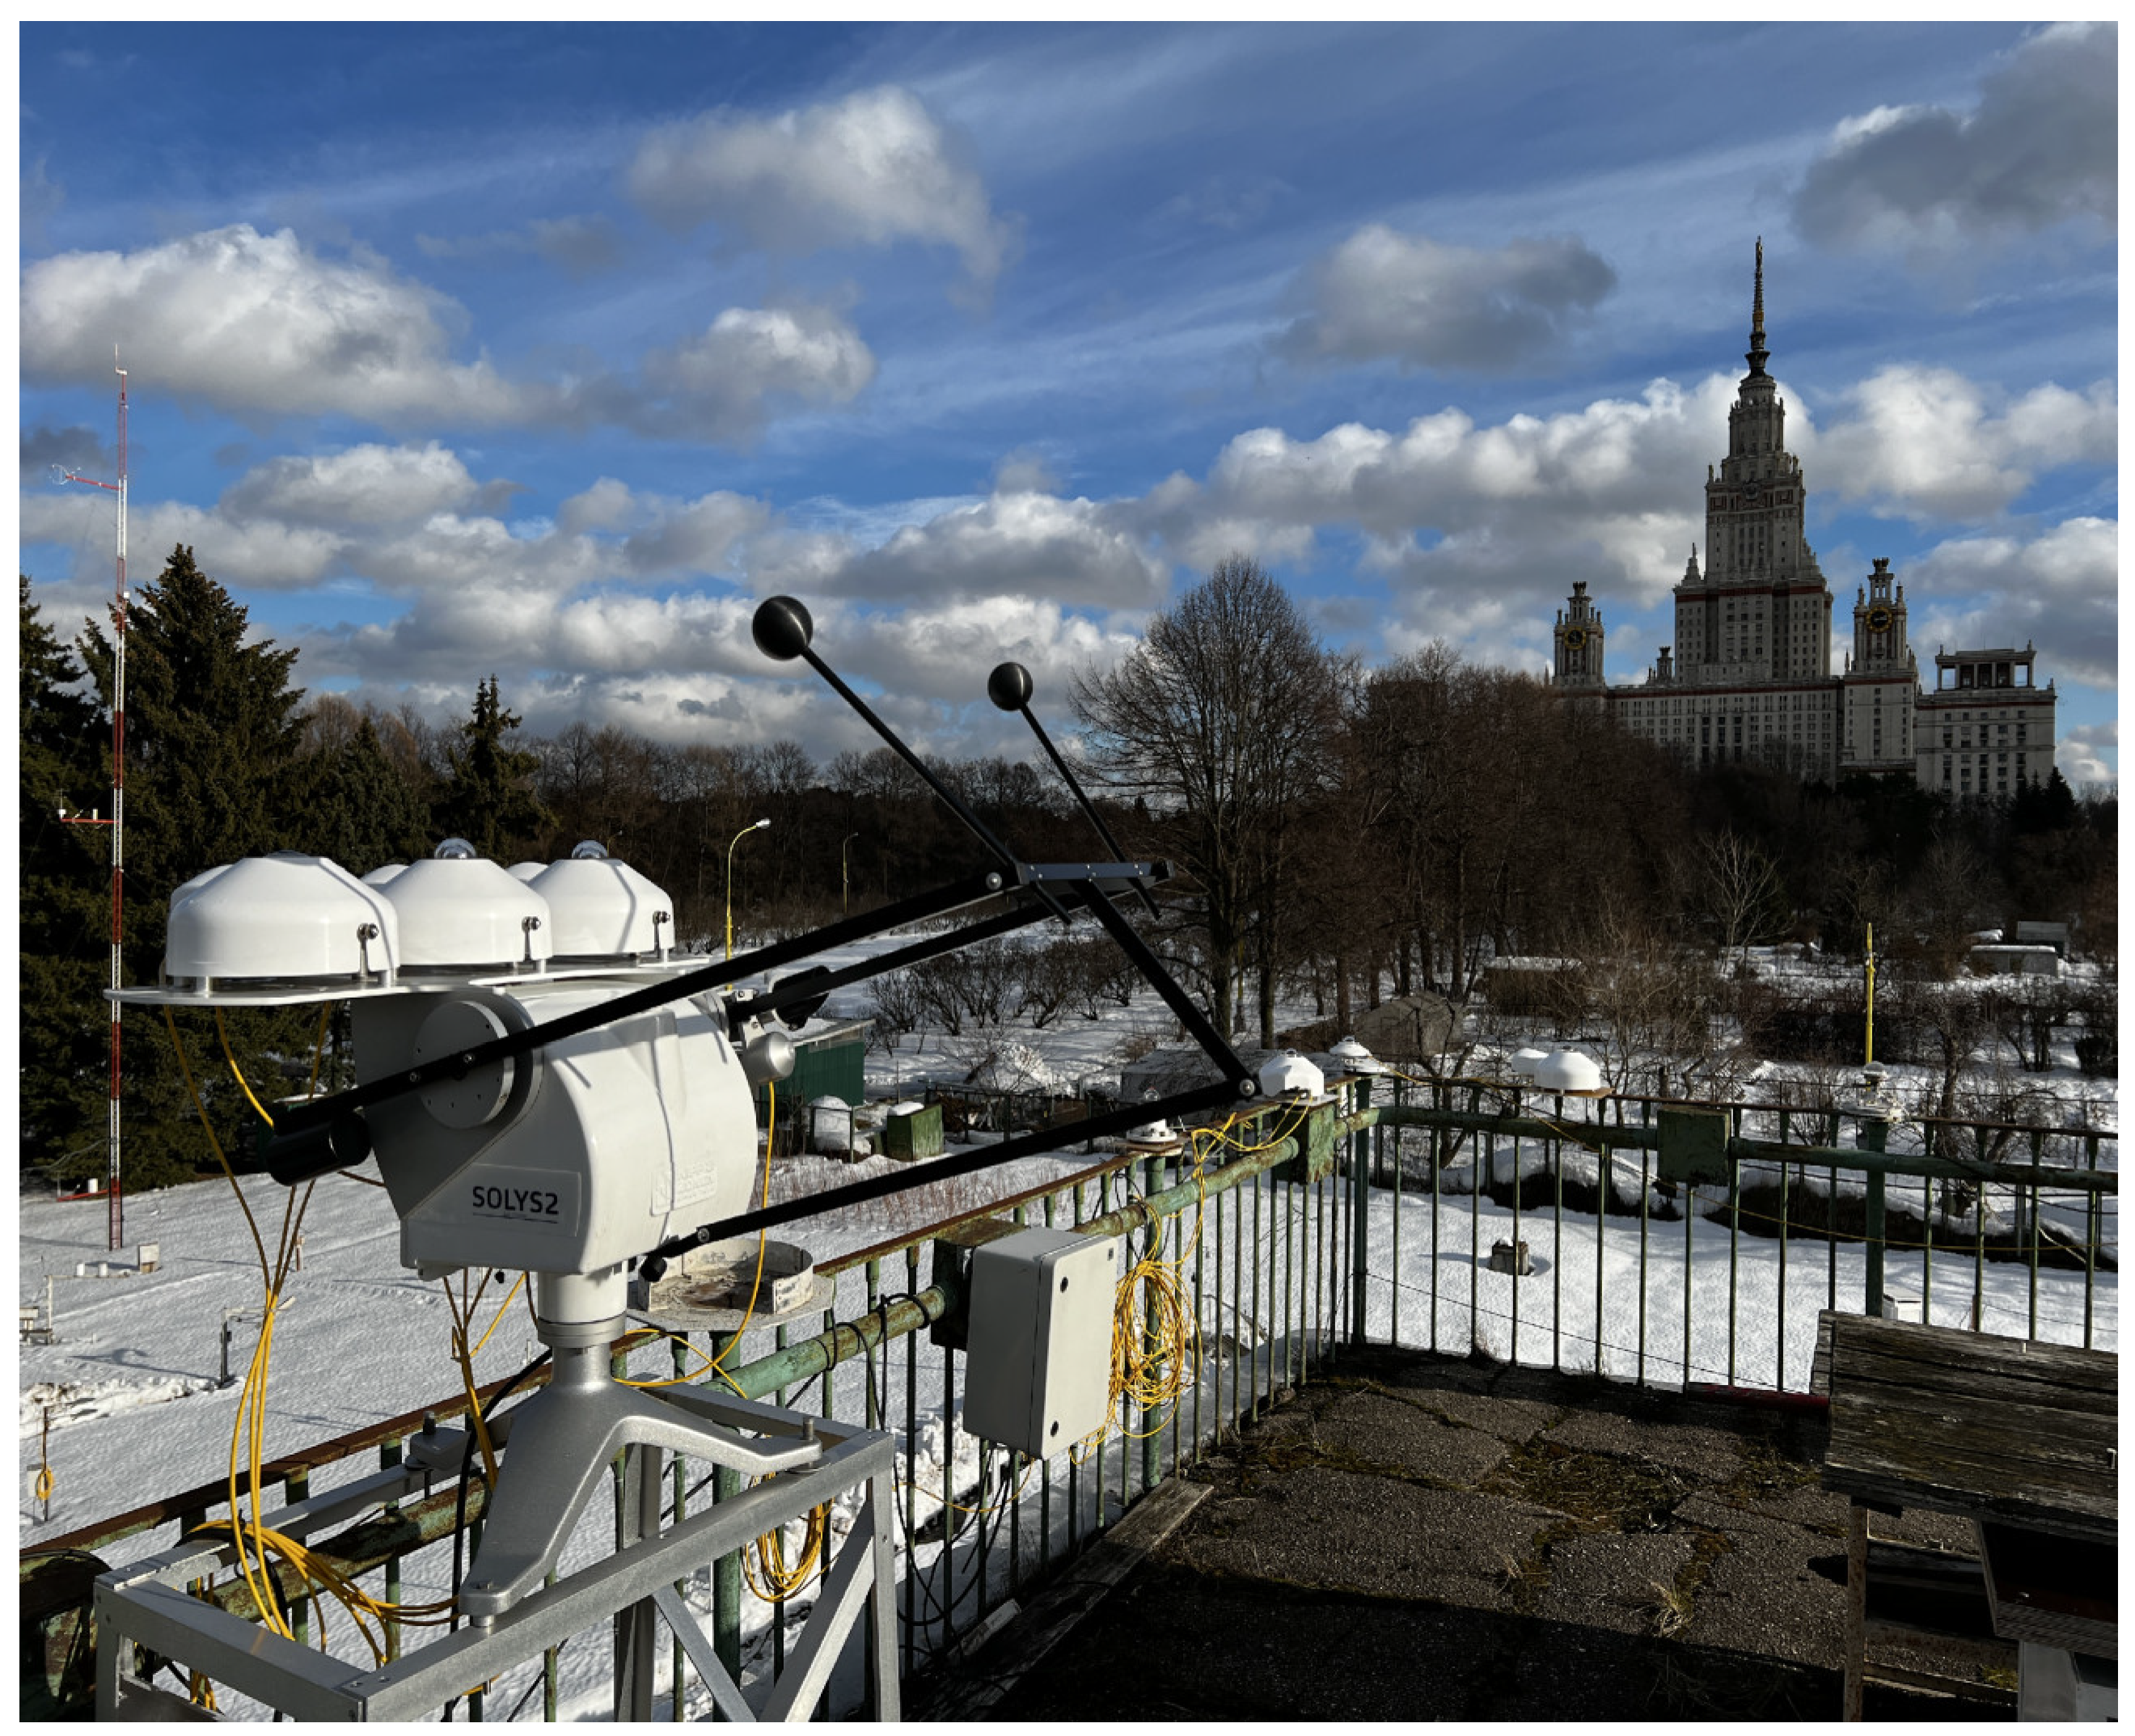
The MSU-RAD(BSRN) complex has been installed at a height of about 10 m at the roof of the MSU MO (
Figure 1) for providing the measurements of downwelling irradiance. The upwelling irradiance is measured over natural surface (grass and snow depending on season) by the instruments located at ground level nearby [
14]. Downwelling radiative measurements include direct (S), diffuse (D), global shortwave irradiance (Q) and downward longwave irradiance (L_U), UV-A (315 – 400 nm) irradiance, erythemally weighted UV irradiance (ER), and sunshine duration (Sd) (
Table 1). Upwelling radiative measurements include reflected shortwave irradiance (R) and upward longwave irradiance (L_L). Such a complete set of measurements is carried out only at 12 stations of the BSRN network.
The instruments of the new complex are installed within few meters to the standard MSU MO instruments, which have been in operation since 1954.
A special data processing software has been developed, which included the correction of the shortwave irradiance on zero offset, as well as the estimation of several important parameters including surface albedo, shortwave, longwave, and total net irradiance as well as solar elevation [
14]. A special attention is paid to evaluation of the automatic quality control flags and their incorporation in the software. For this purpose, we computed a ratio of the measured global shortwave irradiance to the calculated one (a sum of direct irradiance at horizontal surface and diffuse irradiance), which is used as one of the quality flags. Some other quality flags were applied according to the recommendations [
16]. The detailed description of different quality checks is presented in [
14].
The comparisons with standard radiative measurements for shortwave components are presented in
Table A1. On average, there is a good agreement between the two datasets. The differences in annual doses for direct, diffuse and reflected irradiance do not exceed 2.5%, and for global shortwave irradiance it is even less than 0.9%. However, one can see more significant differences during the cold period of the year. Thus, in November, February and March, according to RAD-MSU(BSRN), monthly doses of direct irradiance were about 2.5% higher. However, this difference also lies within the uncertainty of measurements of standard Russian instrumentation of 3.5%. The largest difference is observed for diffuse and reflected irradiance in January (higher than 10%), which can be explained by the instrumental uncertainty of standard Russian instruments and, in addition, by some differences in albedo on microscale level for reflected irradiance in snow conditions. However, even the largest differences for diffuse and reflected irradiances lie within the uncertainty of measurements by standard Russian instrumentation [
7]. During summer conditions with high solar elevations (h), the agreement between measurements by the new complex and standard radiative measurements is much better (see
Table A1).
We analyzed the data over the two years period from September, 1, 2021 to August, 31, 2023. The hourly, daily and monthly datasets were generated using one minute resolution data. For analyzing the effects of different geophysical factors, radiative data were normalized to the average Sun-Earth distance.
For the estimation of the seasonal anomalies of the components of radiative budget and sunshine duration over 01.09.2021-31.08.2023 period, we used the database of standard radiative measurements over the 1955-2020 period [
17].
2.2. The description of the procedure for estimating aerosol characteristics
Using the collocated measurements of CIMEL CE-318 sun photometer, we estimated aerosol optical thickness (𝜏
aer) at different wavelengths and Angstrom exponent following the methods developed for the third version of Aerosol Robotic Network (AERONET) data [
18,
19]. Unfortunately, during this period the application of direct AERONET retrievals were impossible due to some formalities in maintaining the AERONET. The estimation of aerosol optical thickness (τ
aer λ,i) was made for 340, 380, 440, 500, 675, 870, and 1020 nm using the following equation:
where S
λ – the spectral direct irradiance at wavelength λ, S
0λ – the extraterrestrial spectral irradiance in relative units given in
Table A2, R
i – the correction on the Sun-Earth distance at i – day, m – the optical mass of the atmosphere, τ
H2O λ,i – the optical thickness due to water vapor, τ
O3 λ,i – the optical thickness due to ozone, τ
NO2 λ,i – the optical thickness due to nitrogen dioxide, τ
CO2 λ,i – the optical thickness due to carbon dioxide, τ
CH4 λ,i – the optical thickness due to methane, τ
Rayleigh λ,i – optical thickness due to Rayleigh scattering.
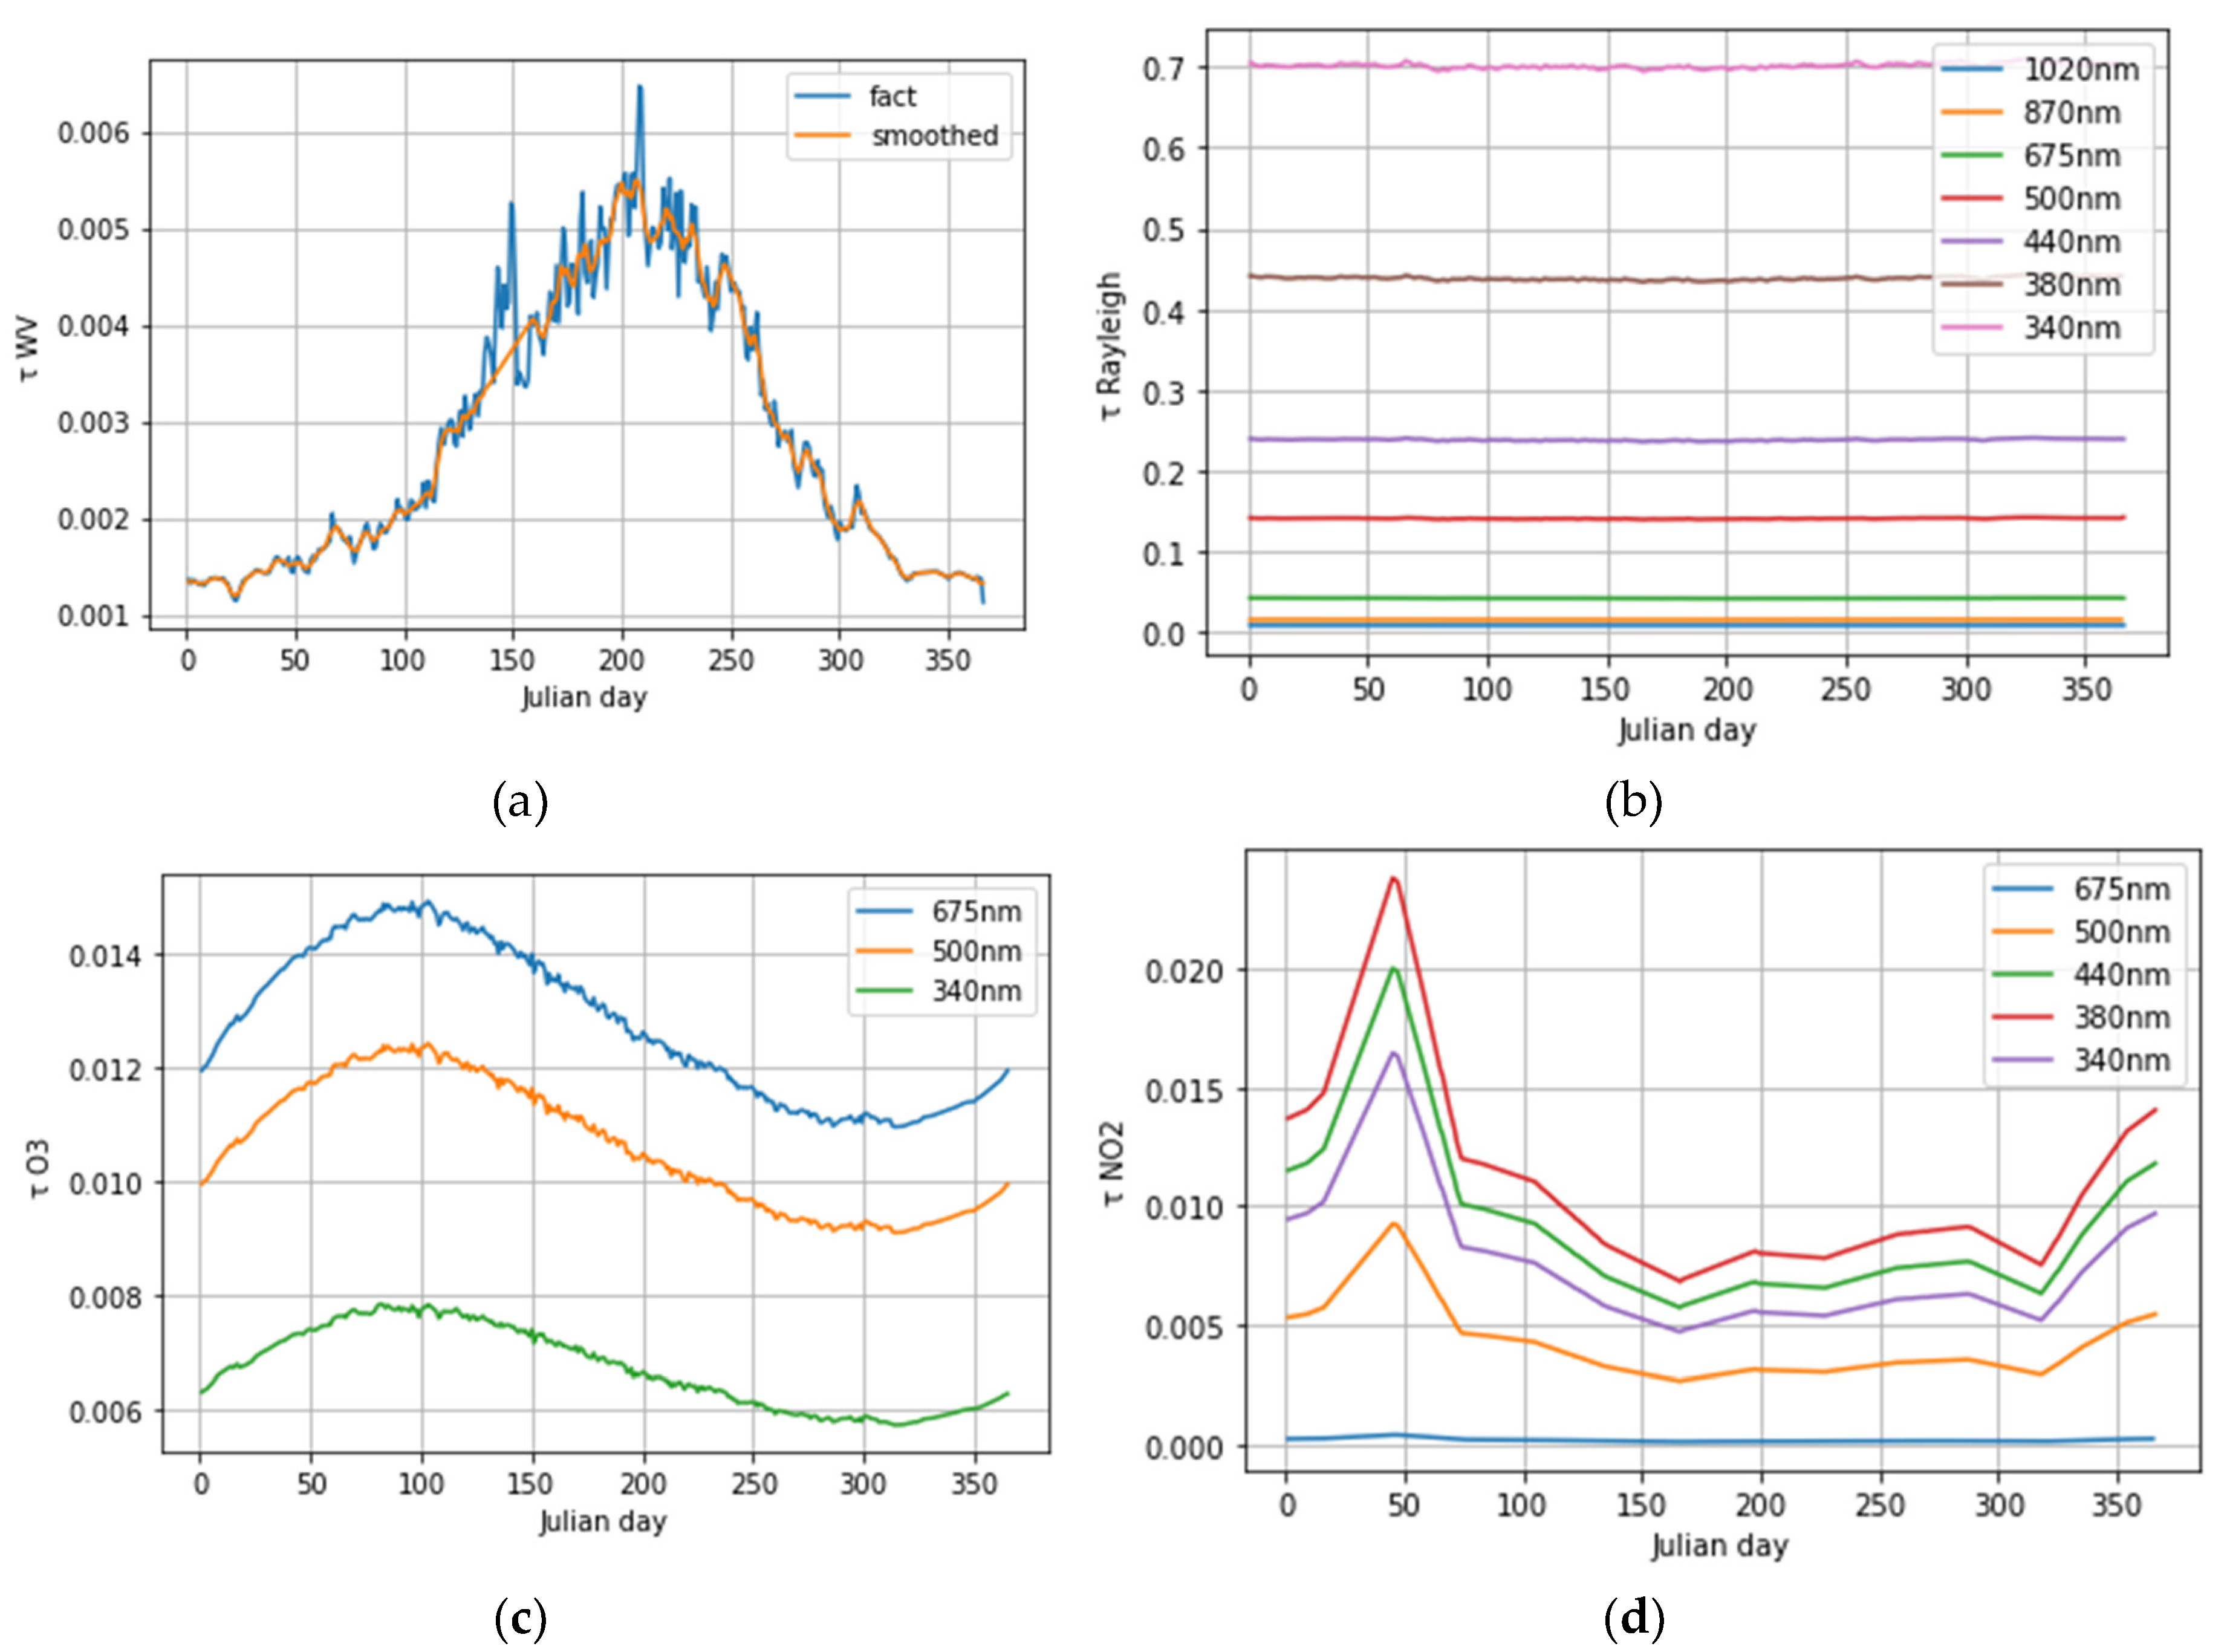
For obtaining the optical thickness for gas absorption and scattering, we evaluated their dependencies as a function of Julian day over the 2014 – 2020 period (
Figure A1). Using these regression equations we obtained an average optical thickness of a particular gas for i – day through linear interpolation. For testing we compared the results obtained from our approach with the data of the third version of AERONET for 2020 (
Table A3). The comparisons demonstrated the difference within the accuracy of measurements of about 0.01 for 380 – 875 nm intervals. The largest difference was observed for τ
aer λ at 340 nm and τ
aer λ at 1020 nm (up to 0.03) due to deviation of real water vapor content, which is important for τ
aer λ 1020, and the absence of atmospheric pressure correction, which is important for τ
aer λ 340. However, we do not use these wavelengths in the further analysis.
Since we need the aerosol optical thickness for attributing the aerosol effects on shortwave irradiance, we used only clear sky conditions, which were chosen using hourly visual cloud observations and situations with 100% sunshine duration during the examined hour.
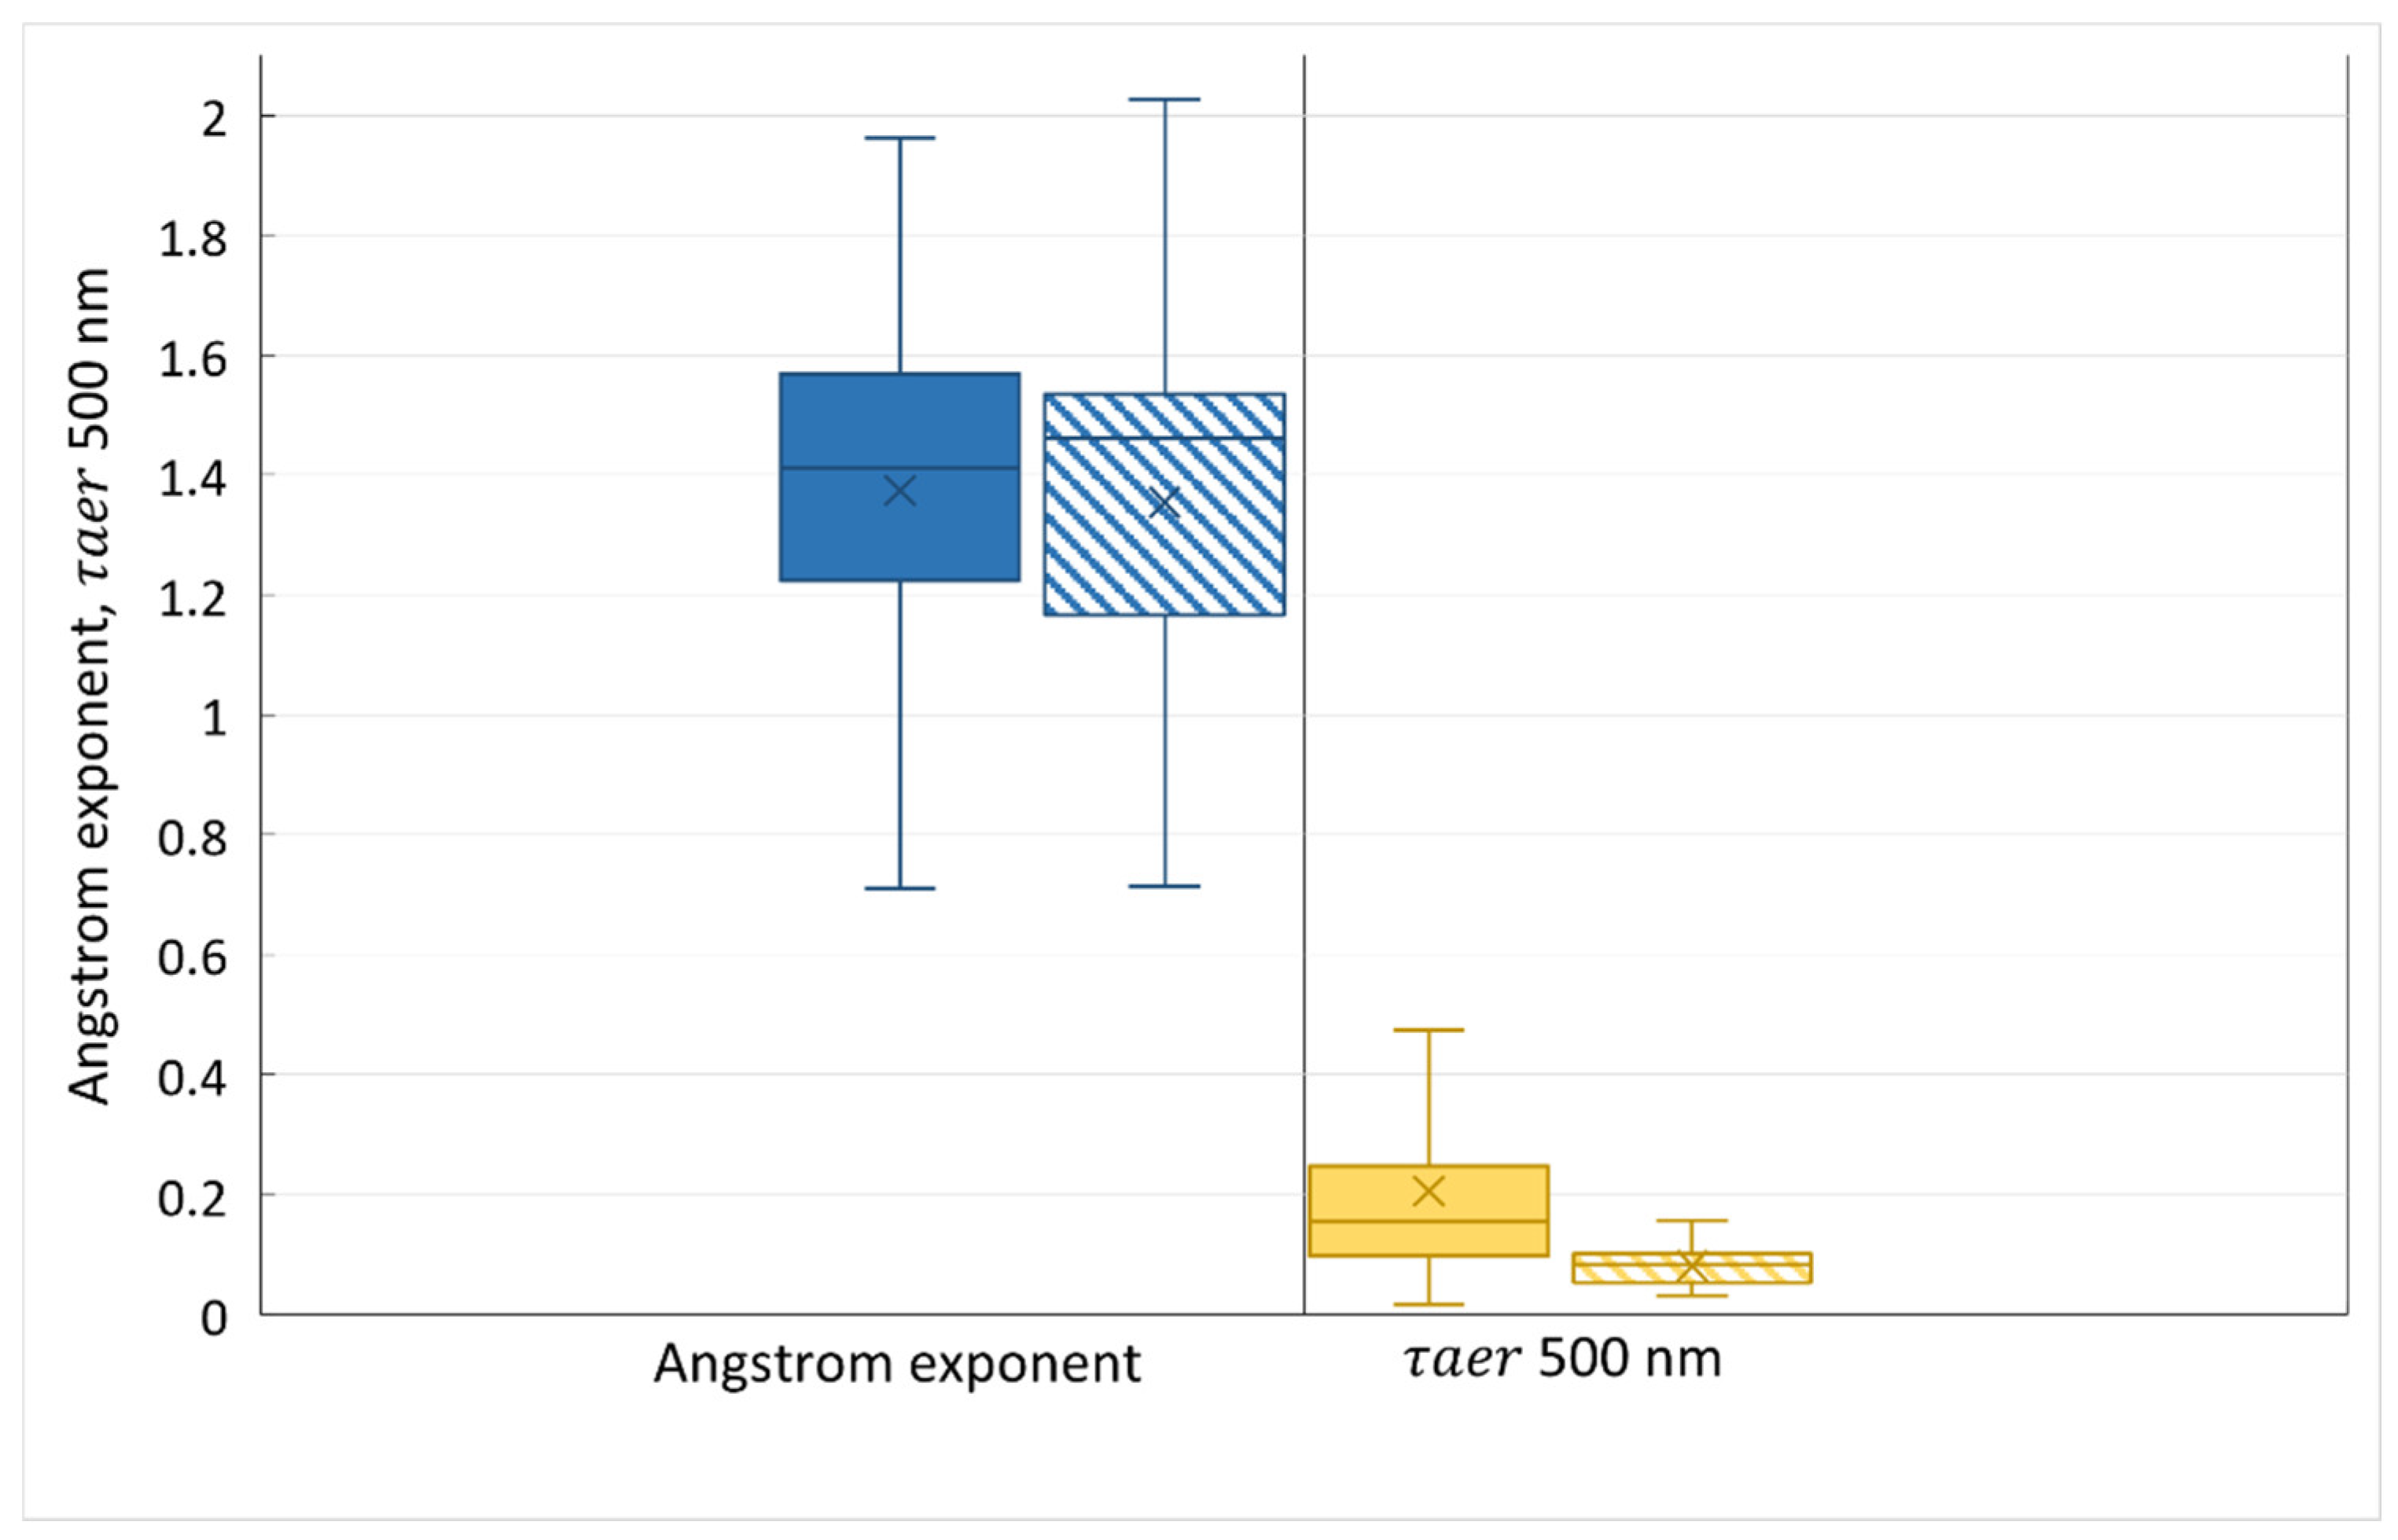
Main statistics for aerosol optical thickness at 500 nm (τ
aer) and Angstrom exponent within 440 – 870 nm over 2021-2022 period are presented in
Figure 2 together with their assessment over the 2001 – 2020 period. Angstrom exponent is a parameter, which describes the slope of log dependencies between τ
aer and wavelengths and is useful in attributing the particle size [
20].
One can see that during the 2021 – 2022 period of collocated measurements of BSRN(MSU) and CIMEL sun photometer, the atmosphere in Moscow was quite clean with τaer,500 not exceeding 0.2 and smaller than its climatological estimate. The Angstrom exponent 440 – 870 nm was close to the mean climatological value over the whole period of AERONET observations since 2001. So, this is in agreement with the whole tendency of brightening due to the decrease in aerosol content during the last decades in Moscow [
21].
3. Results and discussion
3.1. Factors affecting solar shortwave irradiance
3.1.1. Aerosol effects on shortwave radiation in snow and snow-free clear sky conditions
In order to evaluate the role of τ
aer on shortwave irradiance the sample of measurements was divided into two ranges: with τ
aer,500 < 0.15 and τ
aer,500 > 0.15.
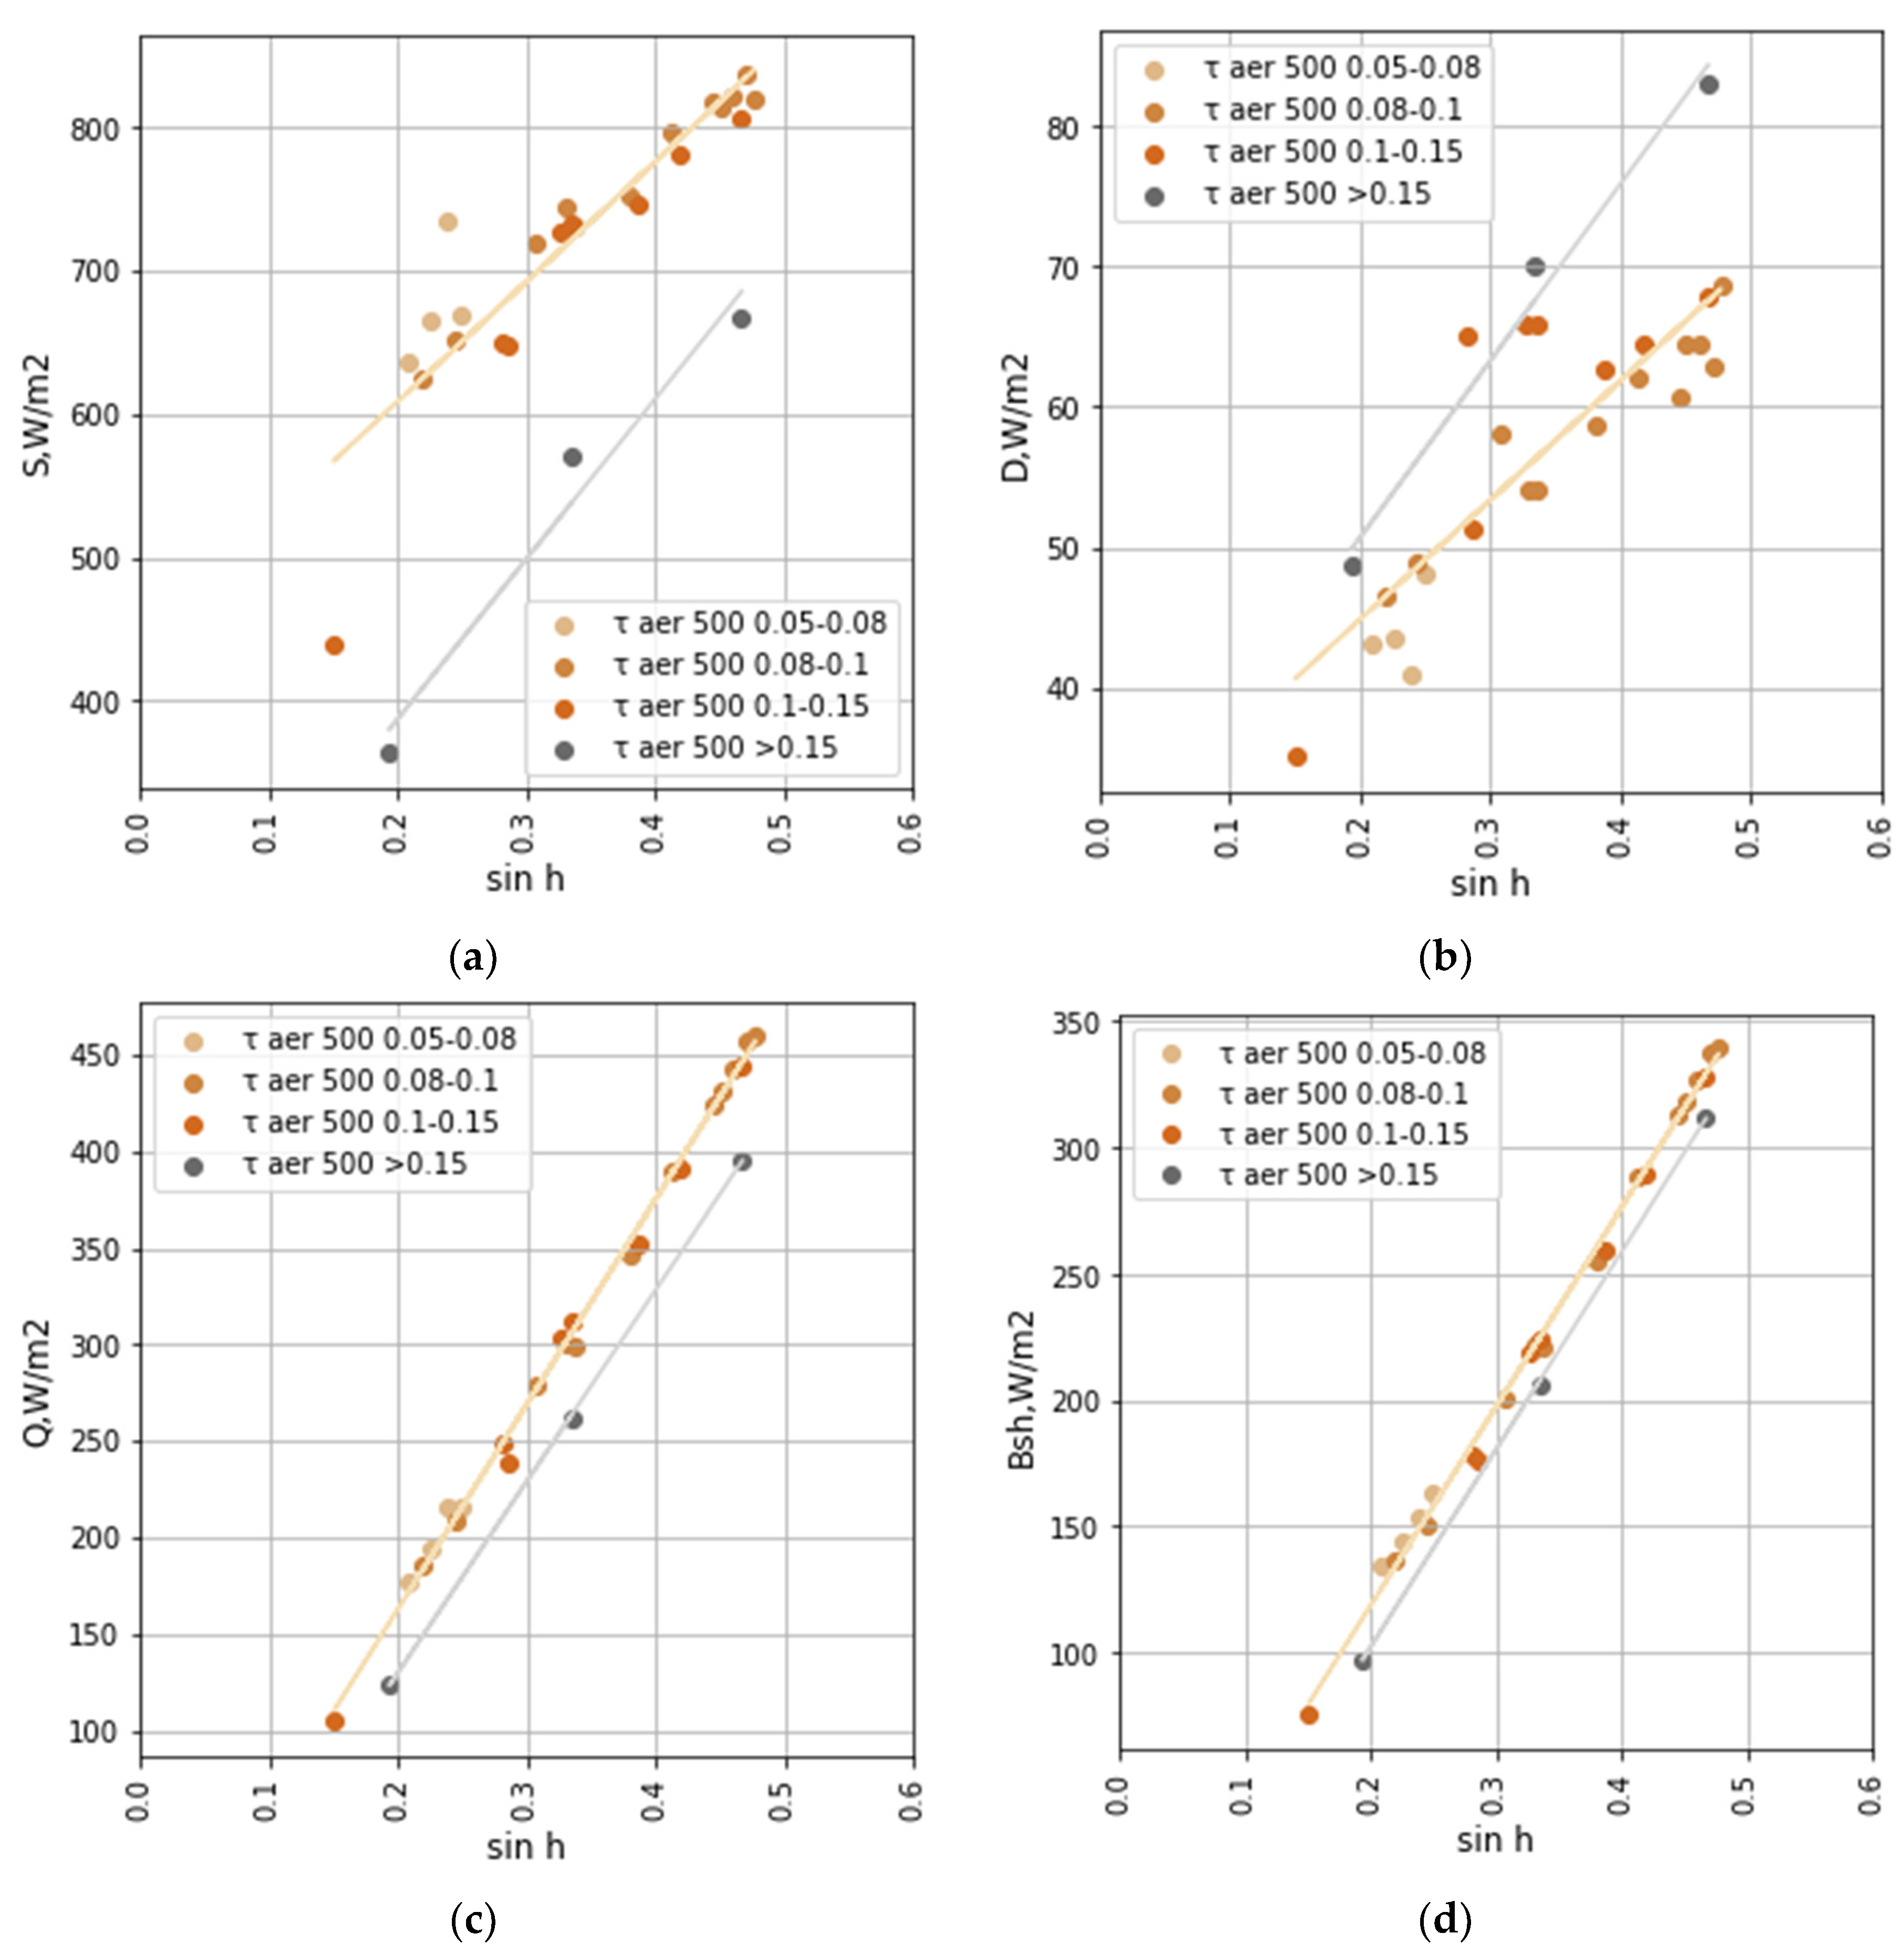
Figure 3 presents the dependence of the direct, diffuse, global shortwave irradiance and net shortwave irradiance on the sine of solar elevation (sin h) separately for each range.
There is a noticeable attenuation of direct irradiance with the increase of τaer, which is about 150 – 200 W/m2. On contrary, the changes in diffuse irradiance are opposite due to the effects of aerosol scattering, however, they are not so large in absolute magnitude (about 5 – 15 W/m2). We also see the attenuation of global and net shortwave irradiance, but it is not so strong as for direct irradiance due to its compensation by the increase in diffuse irradiance.
In order to qualify the loss of shortwave irradiance due to aerosol, we estimated the regression dependencies of global shortwave irradiance on τ
aer at different solar elevations (
Table A4). Using these dependencies, we estimated the mean difference between Q at the observed τ
aer and Q in aerosol-free conditions (τ
aer = 0) at different h.
Table 2 presents the calculated losses of global shortwave radiation due to τ
aer. One can see that τ
aer significantly affects global shortwave irradiance: from 8 to 36 W/m
2 at small solar elevation (h=10°) up to 42-187 W/m
2 at h = 50°. Note, that our range of τ
aer belongs to relatively clean atmosphere, so we can speak about the effects of the background aerosol conditions.
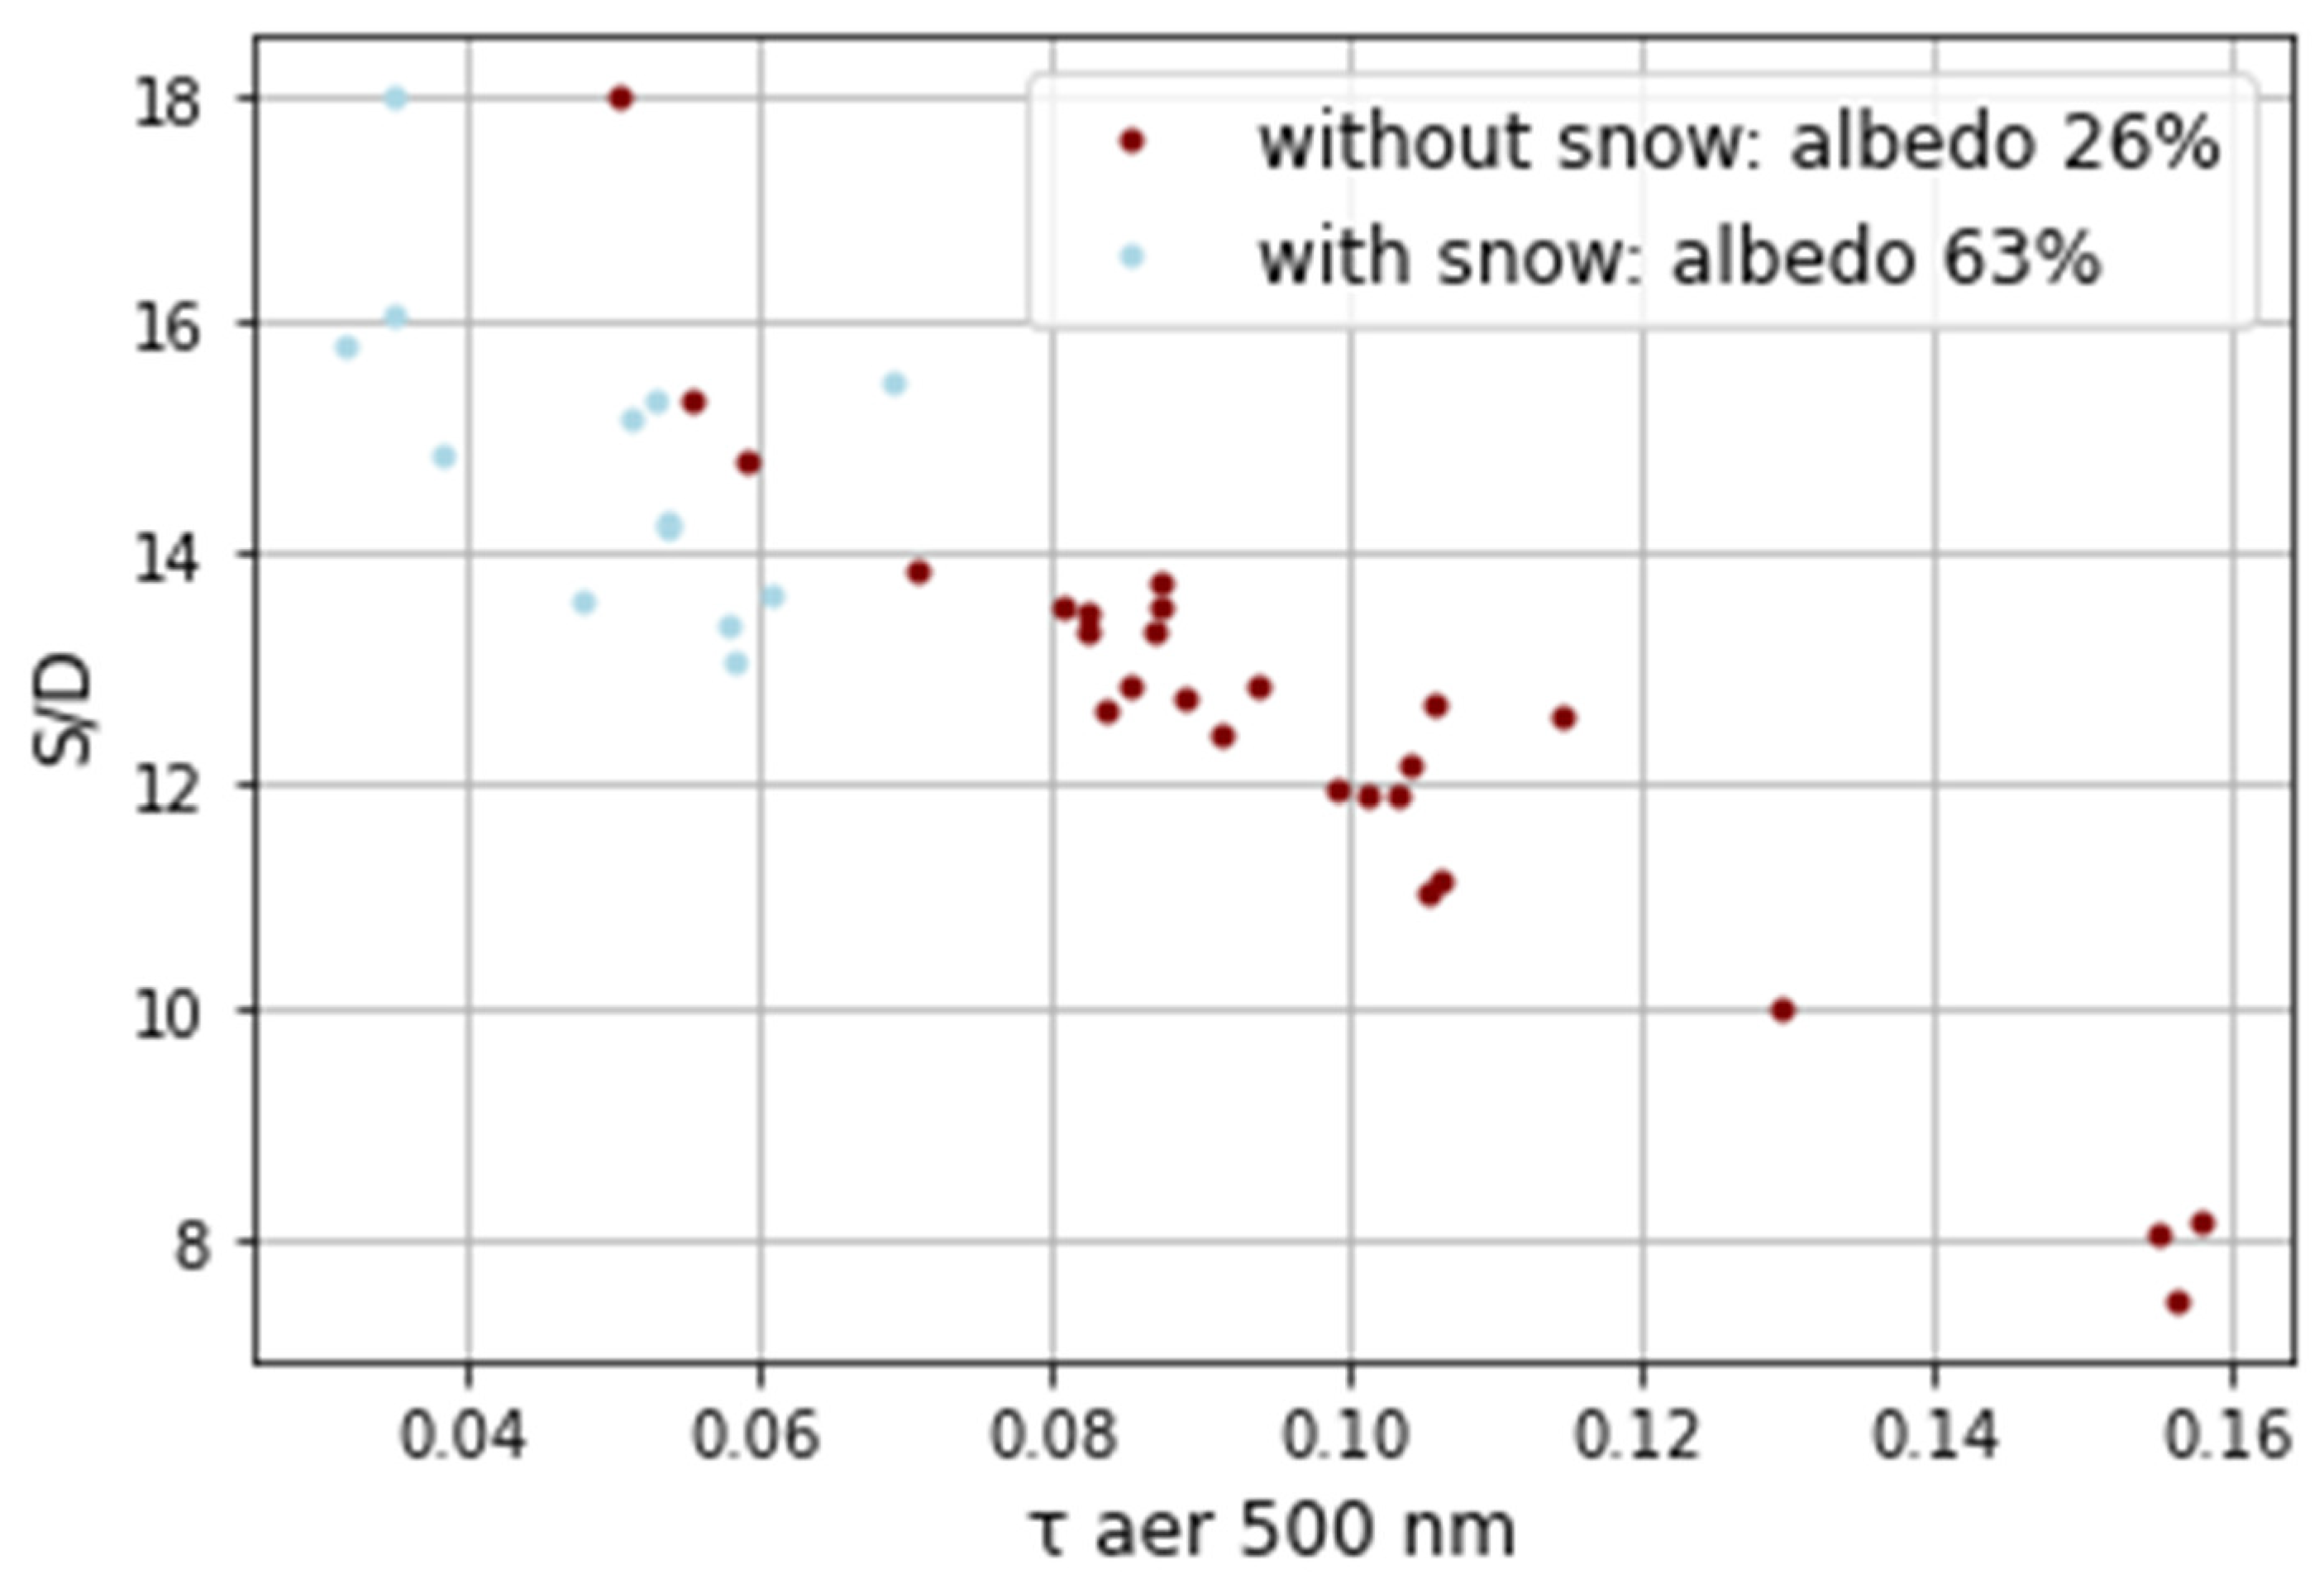
Figure 4.
The direct to diffuse irradiance (S/D) ratio as a function of τaer,500 in snow and snowless conditions.
Figure 4.
The direct to diffuse irradiance (S/D) ratio as a function of τaer,500 in snow and snowless conditions.
The S/D ratio decreases from 15 – 18 to 8 with an increase in τaer from 0.05 to 0.15 in snow-free conditions. However, in snow conditions, the ratio of direct to diffuse radiation is lower almost in all cases at similar τaer due to the increase of diffuse irradiance because of multiple reflection. In both snow and snow-free situations we see the decrease in S/D ratio as a function of τaer.
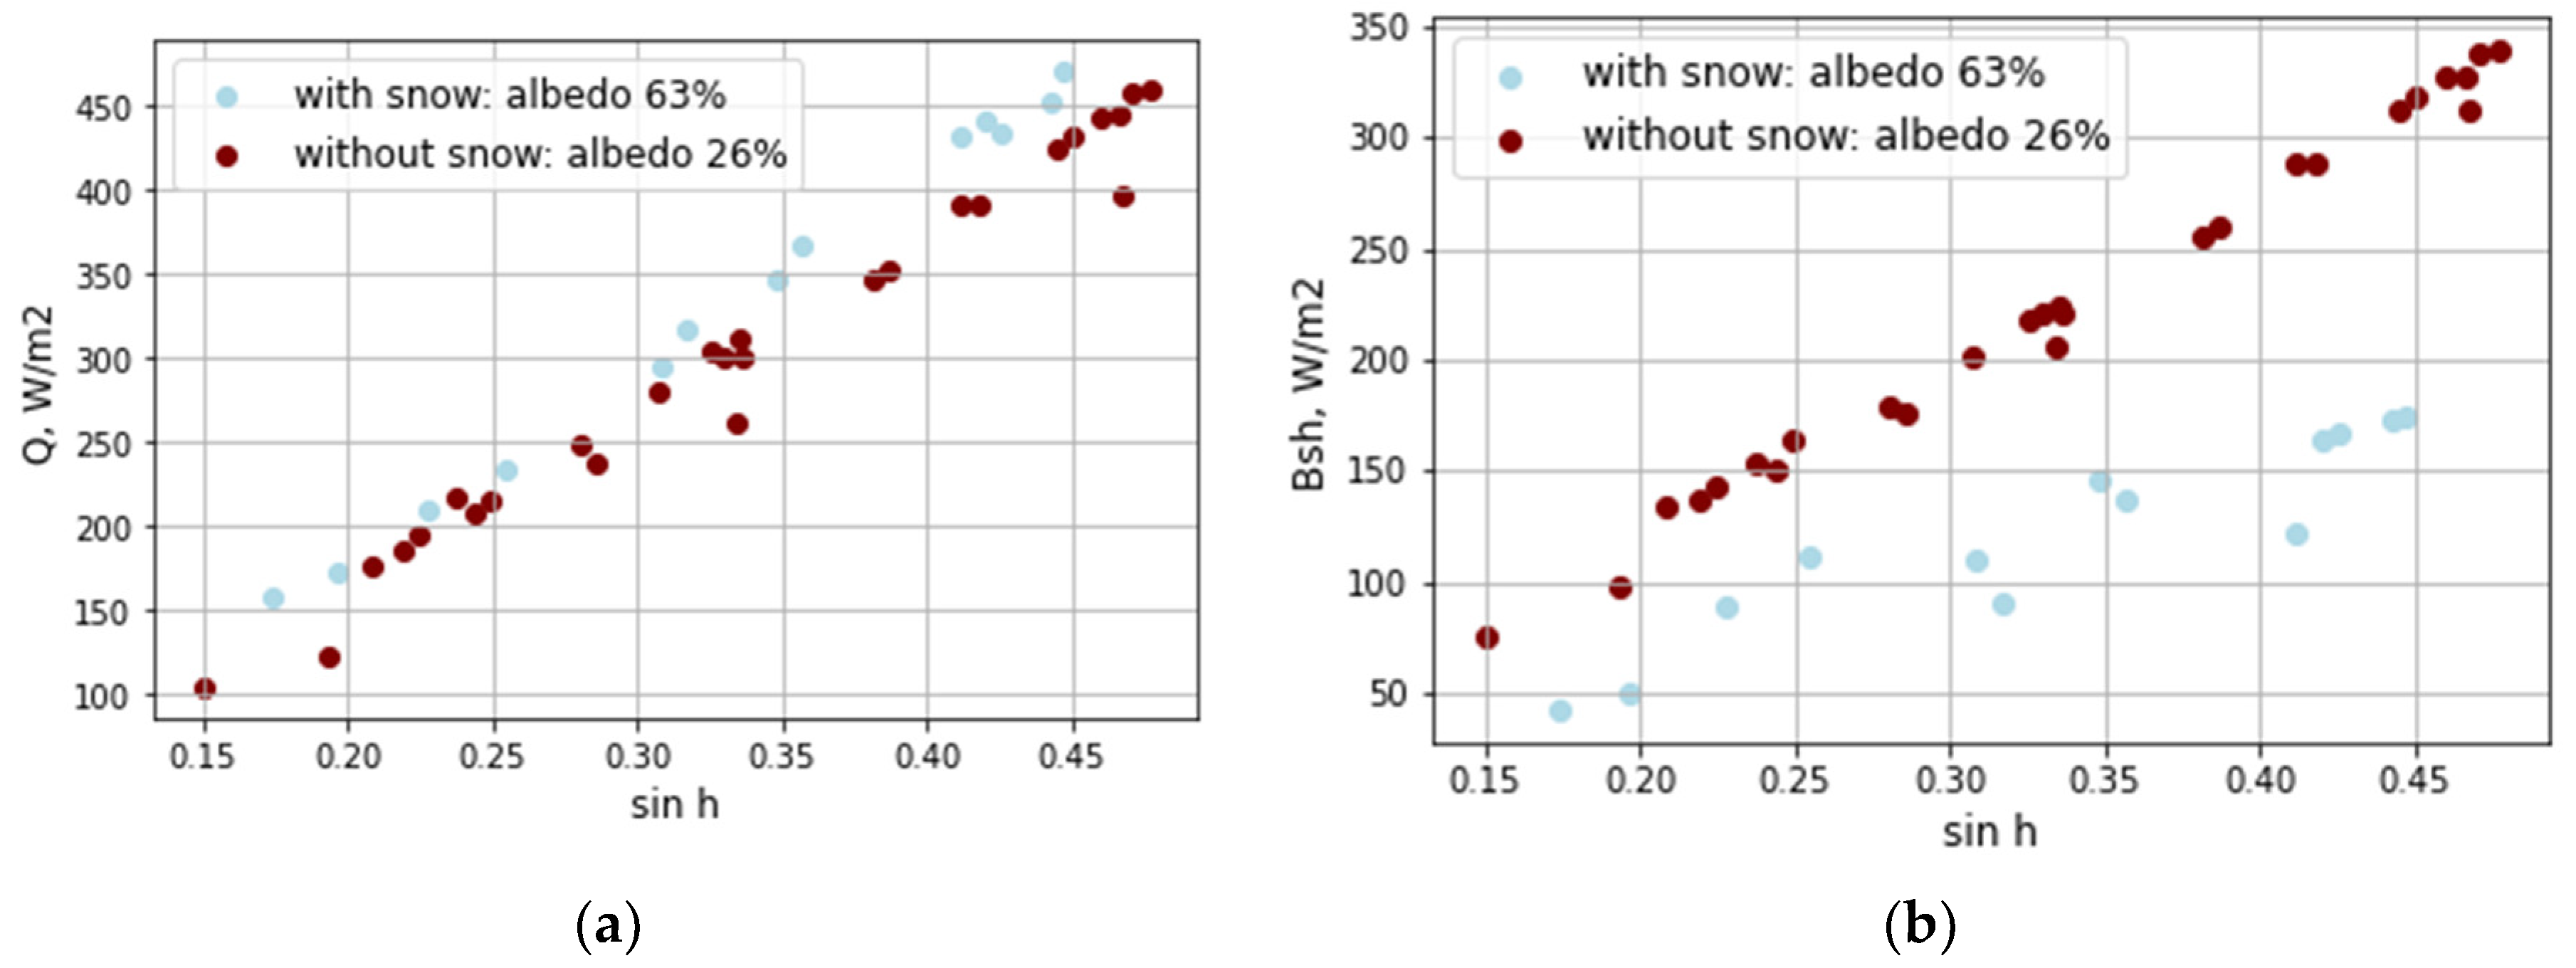
An additional analysis was made for estimating the role of surface albedo on global and net shortwave irradiance (
Figure 5). One can see significantly higher global solar irradiance during wintertime, when the solar elevation and cloud conditions are similar (
Figure 5a). This happens due to smaller aerosol loading, which increase direct irradiance, while diffuse irradiance also increases due to multiple reflection. The difference may exceed 40 W/m
2 for the relatively high solar elevations in winter conditions.
However, the significant seasonal difference in water vapor content could be also important in attributing this bias. According to our estimation using the CLIRAD(FC05)-SW radiative code [
22], the difference in Q due to typical water vapor content of 0.3 cm in winter and 2 cm in summer [
21] varies from 17.7 W/m
2 at solar elevation h=10° to 50 W/m
2 at h=30°. So, this means that low water vapor content in winter also makes a noticeable contribution into the effect of the increase in global shortwave irradiance.
The difference in net shortwave radiation (
Figure 5b) is of opposite sign due to a significant effect of surface albedo on reflected irradiance. The difference reaches 150 W/m
2 at maximum winter solar elevations in clear sky conditions. This is only partly compensated by the increase of global shortwave irradiance due to smaller aerosol, water vapor content and additional increase in diffuse component.
3.1.2. Cloud influence on shortwave irradiance
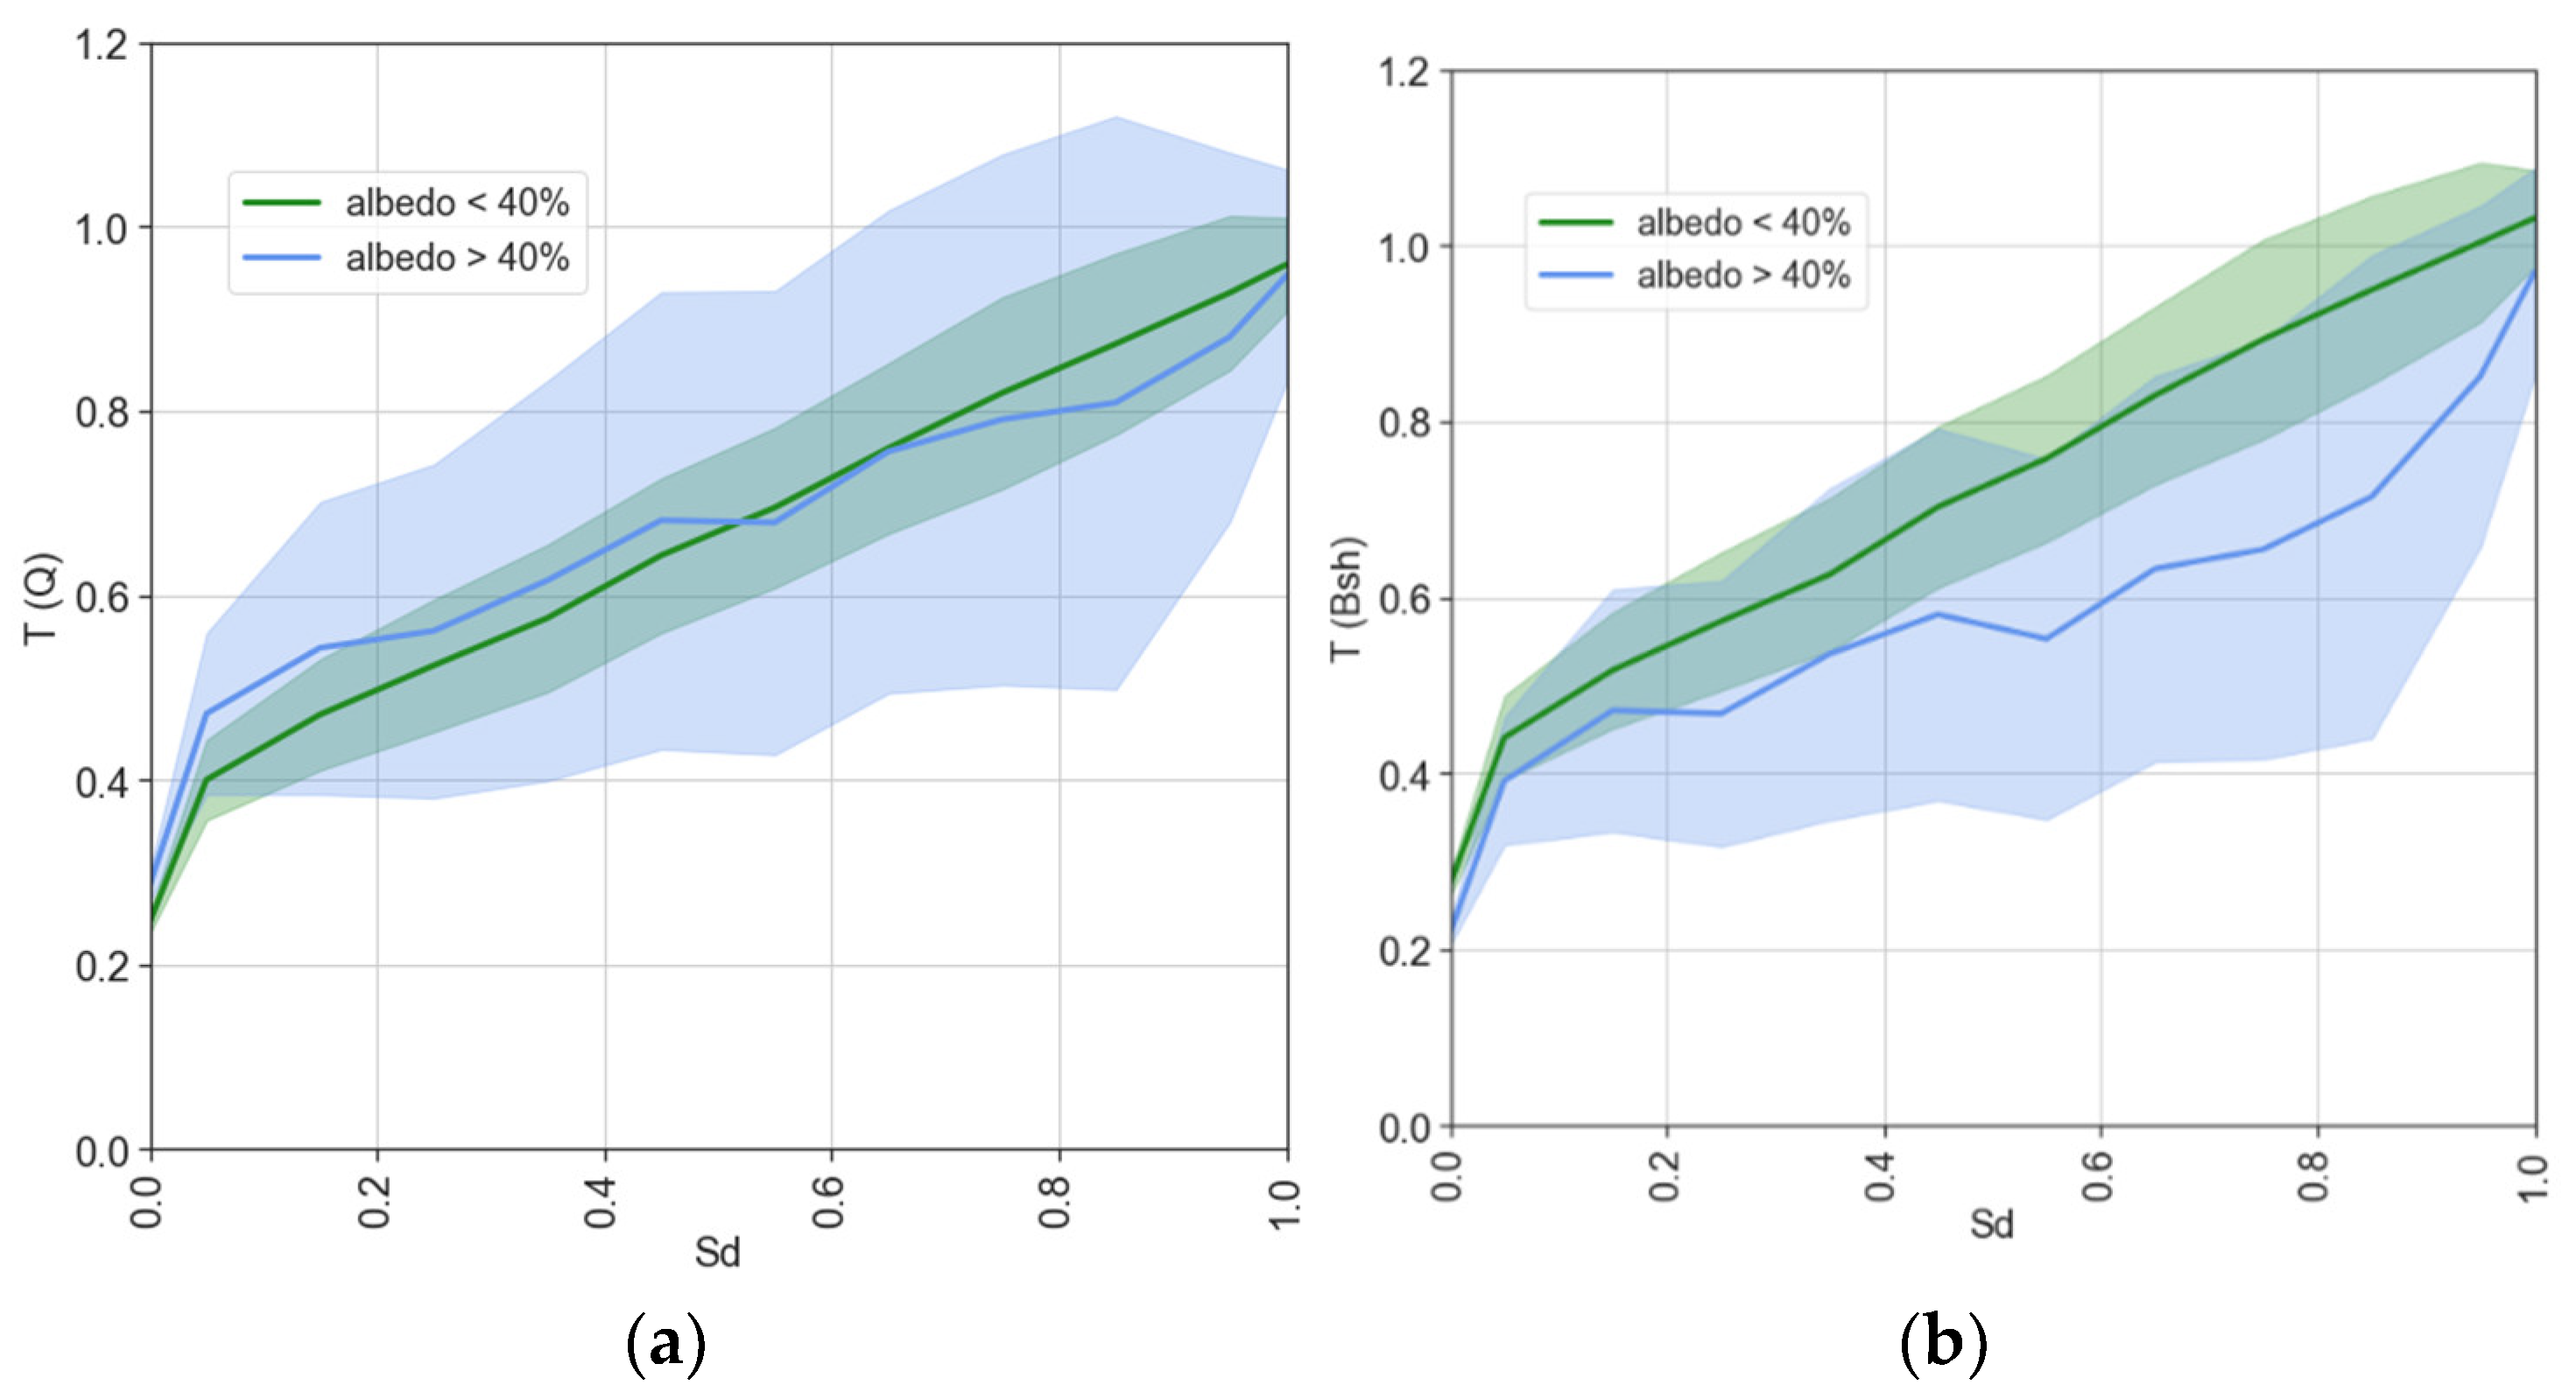
In order to evaluate the effect of cloudiness on shortwave irradiance we used the value of transmittance T(Q)=Q/Q
0, where Q is global irradiance in cloudy and Q
0 – in cloud-free conditions using the Q
0 parameterization, shown in
Table A5 at snow and snow-free surface. Similar procedure is made for simulating T(Bsh) for net shortwave irradiance. For characterizing cloudiness we used relative sunshine duration (Sd) values, where Sd=1 means the total absence of cloudiness and Sd=0 – the conditions with optically thick cloudiness. Note, that 1 hour averaging has been applied to the data, providing better description of cloud amount by Sd parameter according to the ergodicity approach.
Figure 6 presents the dependence of T(Q) and T(Bsh) on Sd. The statistics of these characteristics are shown in
Table 3.
Figure 6 shows the strong dependence of shortwave irradiance on sunshine duration and its nonlinear character especially at small Sd close to zero. The strong increase of T(Q) from 0.25 to 0.4 in summer and from 0.29 to 0.49 in winter occurs when sunshine duration became different from zero (see
Table 3). Values that exceed 1 in most cases are connected with the broken cloudiness, which provides additional increase in diffuse component and no attenuation of direct irradiance when the sun is only partly covered by clouds within the hour [
23]. In clear sky T(Q) is smaller 1, since the effect of thin cirrus cloud which are transparent for direct irradiance is accounted here.
The larger variation in the dependence of shortwave irradiance on Sd in winter can be observed due to much stronger influence of surface albedo (standard deviation is 0.16 against 0.12 in summer). Quite interesting nonlinear dependence was obtained for T(Bsh) for winter conditions. One can see that the T(Bsh) values are significantly lower than T(Q) at Sd=0.5-0.8. This may possibly happen due to a significant increase in reflected irradiance in broken cloud conditions due to multiple scattering.
The analysis of radiative effects of the atmospheric factors, described in this Section, allows us to better understand the reasons of shortwave irradiance variability shown in the
Section 3.2.
3.2. Annual cycle of net radiation and its components at the Earth’s surface
Since Moscow is located at 55.7N, the changes in solar elevation and the duration of the day are the key reasons, responsible for typical seasonal variability of the components of net irradiance.
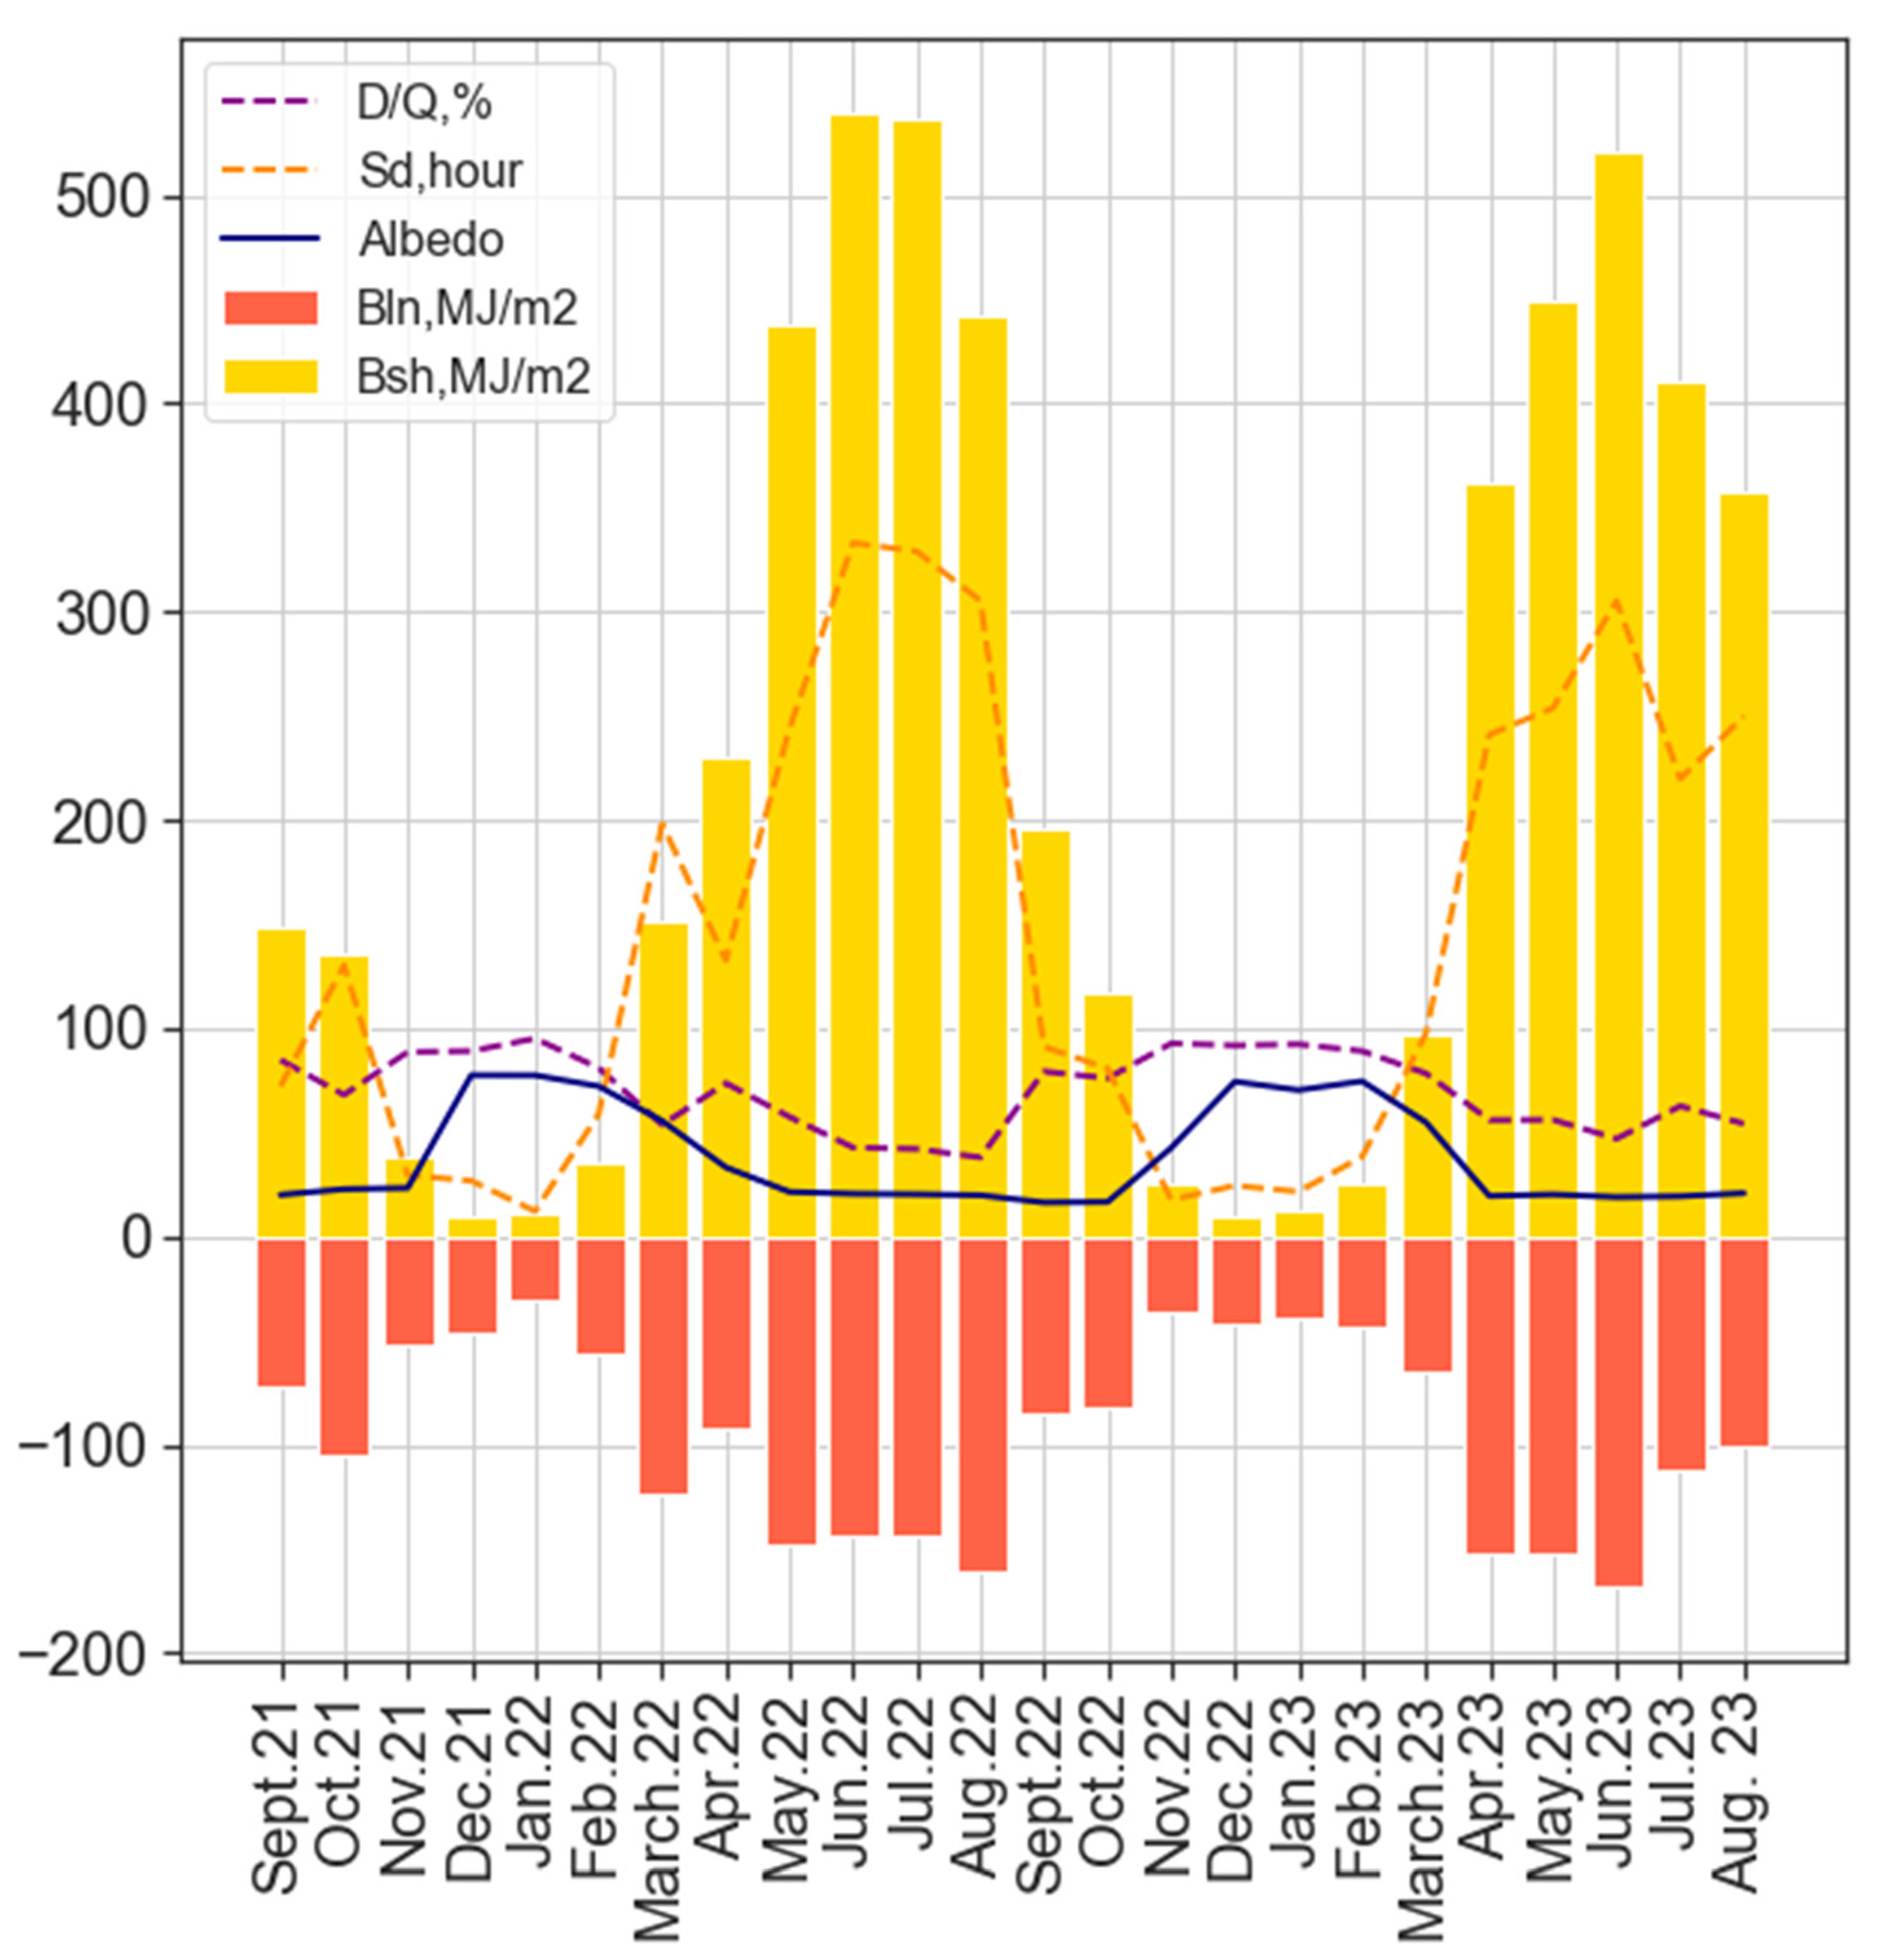
Figure 7 presents monthly doses of longwave and shortwave radiative components for the period of measurements, sunshine duration, monthly mean D/Q ratios and surface albedo. It is clearly seen that net shortwave irradiance is always positive, while net longwave irradiance is always negative. Both components of net irradiance are close to zero in winter. In summer net shortwave irradiance dominates in absolute magnitude over net longwave irradiance, while in winter we see an opposite picture.
In winter the shortwave net radiation is close to zero due to smaller solar elevation, shorter day duration, and higher occurrence of cloudy conditions [
24,
25]. The prevailing cloudy conditions in winter can be seen from the high D/Q ratio close to 1 (see
Figure 7). Similar tendency is typical in moderate climate of Eastern Europe with cyclone weather, prevailing in winter [
17,
26]. In addition, high surface albedo provides strong reflection and decreasing of net shortwave irradiance (see 3.1.1). This is only partly compensated by smaller aerosol optical thickness and small water vapor content. Net longwave irradiance in winter, on the contrary, is higher due to small surface temperatures compared to summer conditions. However, it is still below zero.
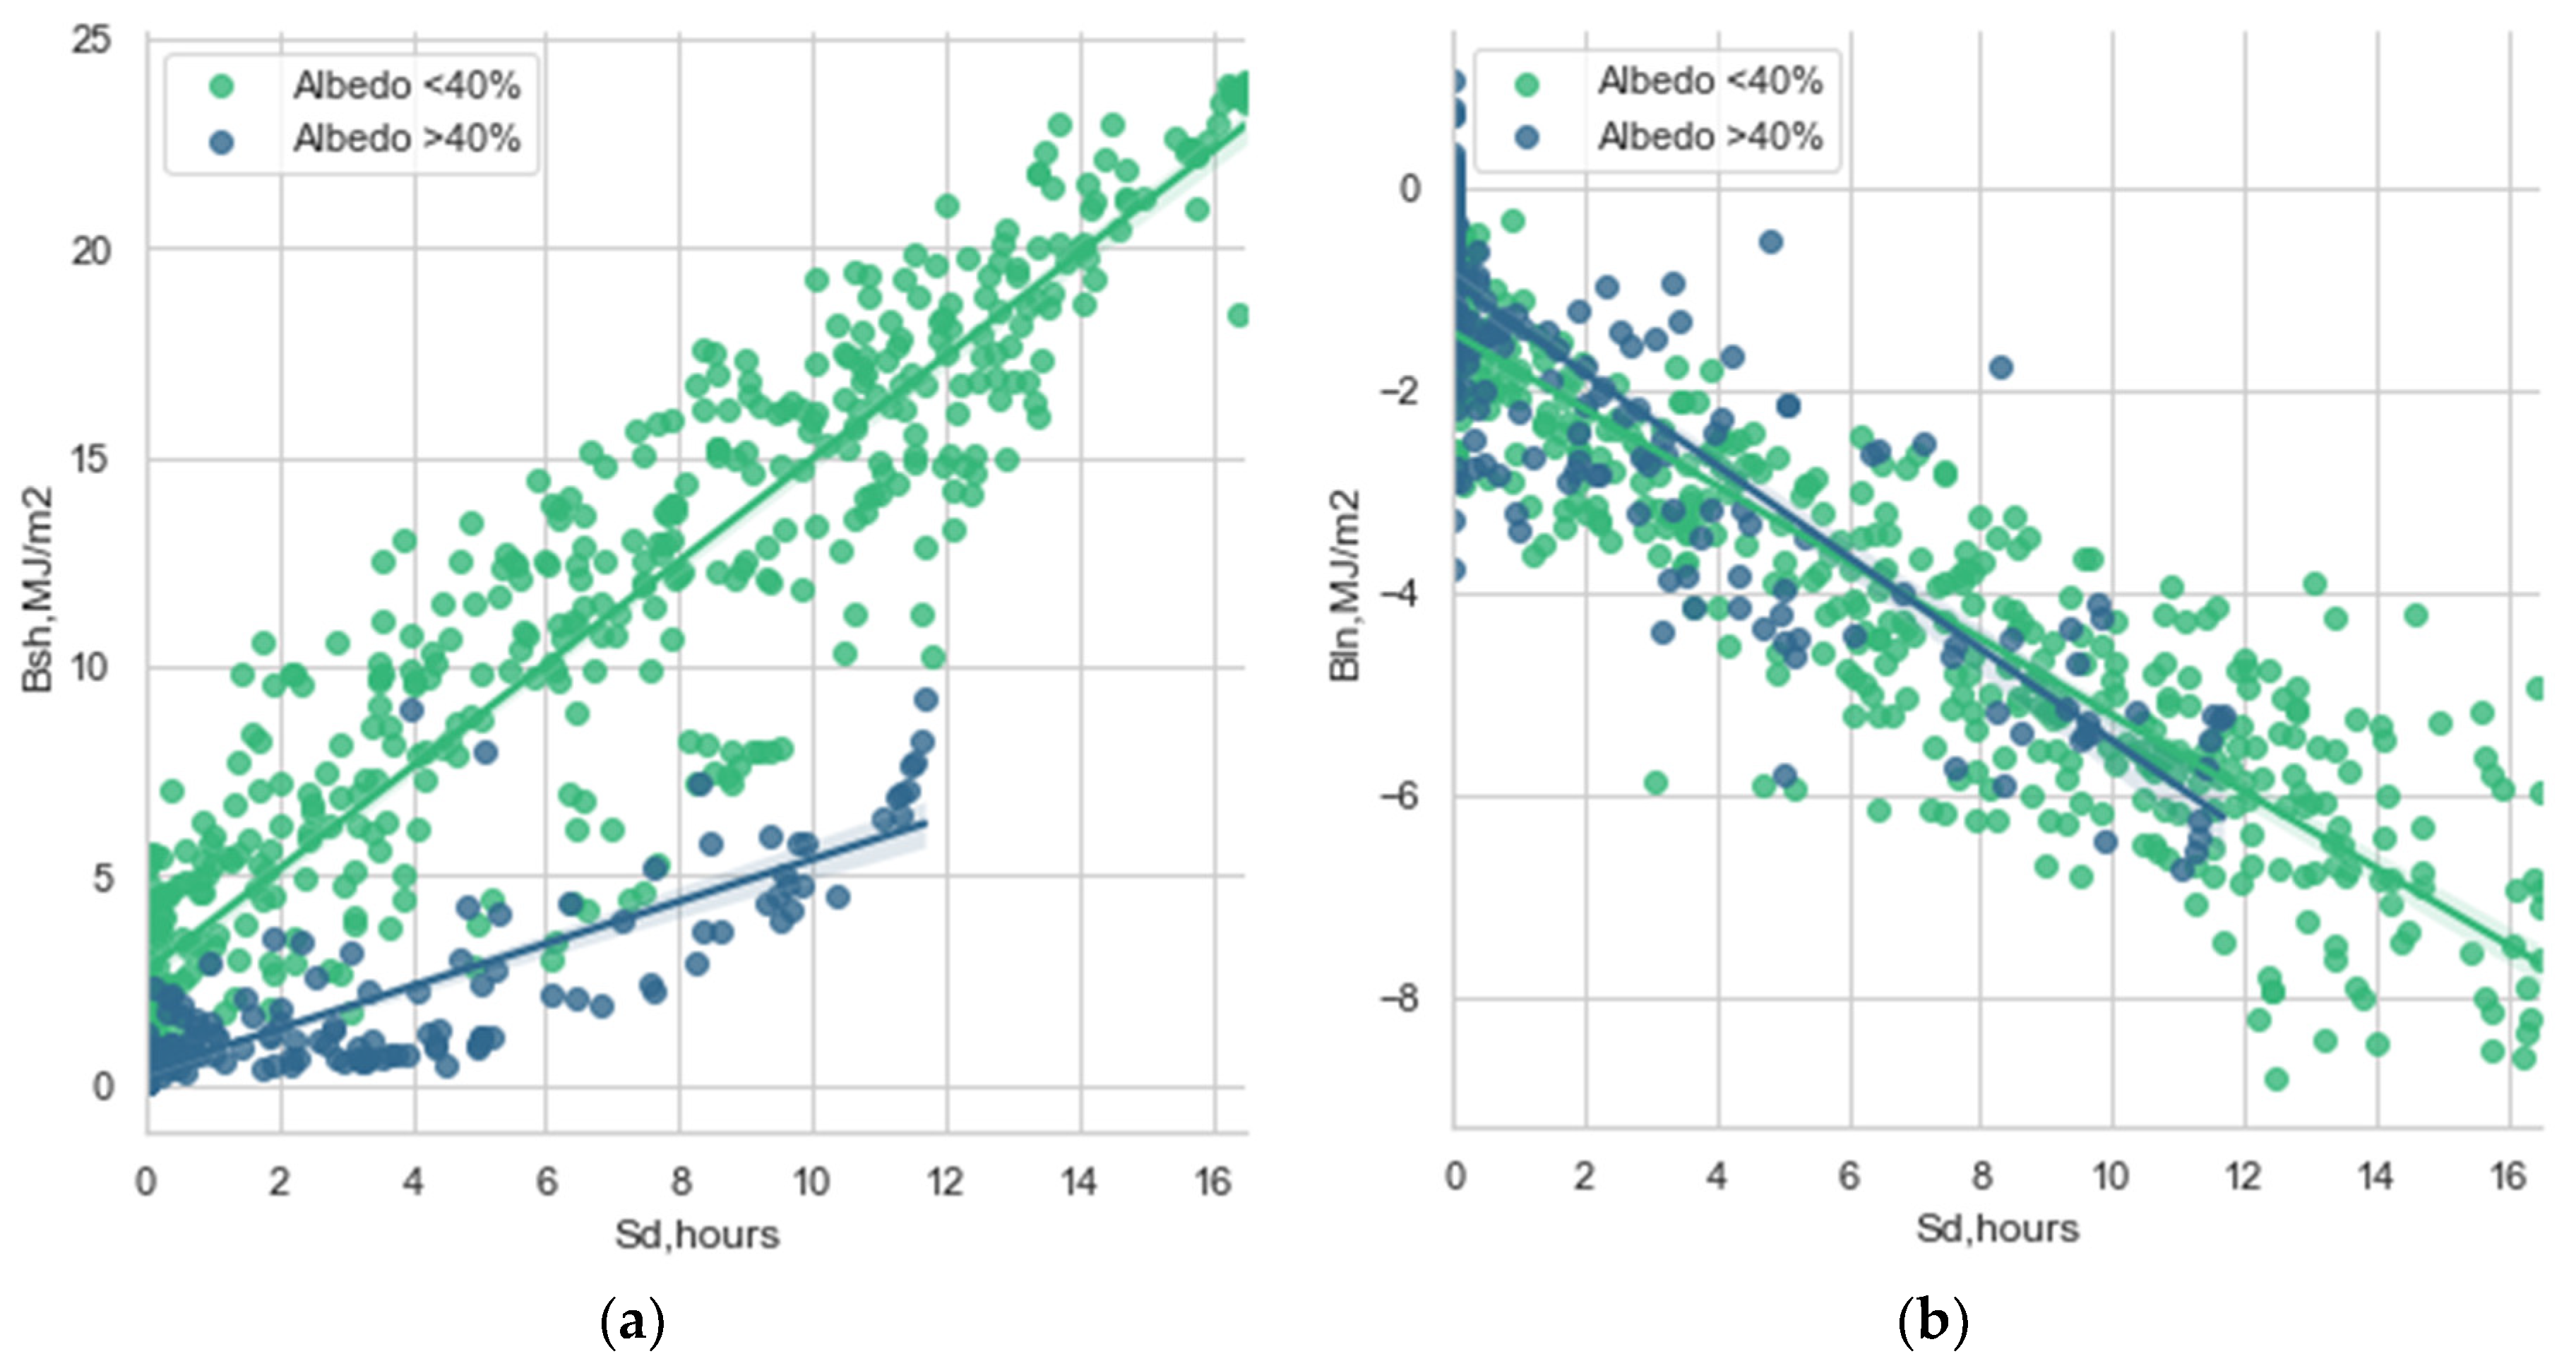
Figure 8 presents the dependence of daily doses of net shortwave irradiance and net longwave irradiance as a function of daily sums of sunshine duration. The latter parameter describes both the changes from the point of view of season (longer duration of the day in summer and shorter - in winter) and cloudiness. Hence, for net shortwave irradiance these factors provide positive dependence on Sd sums. For net longwave irradiance, on the contrary, larger sunshine duration leads to higher negative values due to a large contrast in temperature between the surface and the atmosphere, while the length of the day is not important.
3.3. Comparisons of MSU-RAD(BSRN) measurements against long-term observations
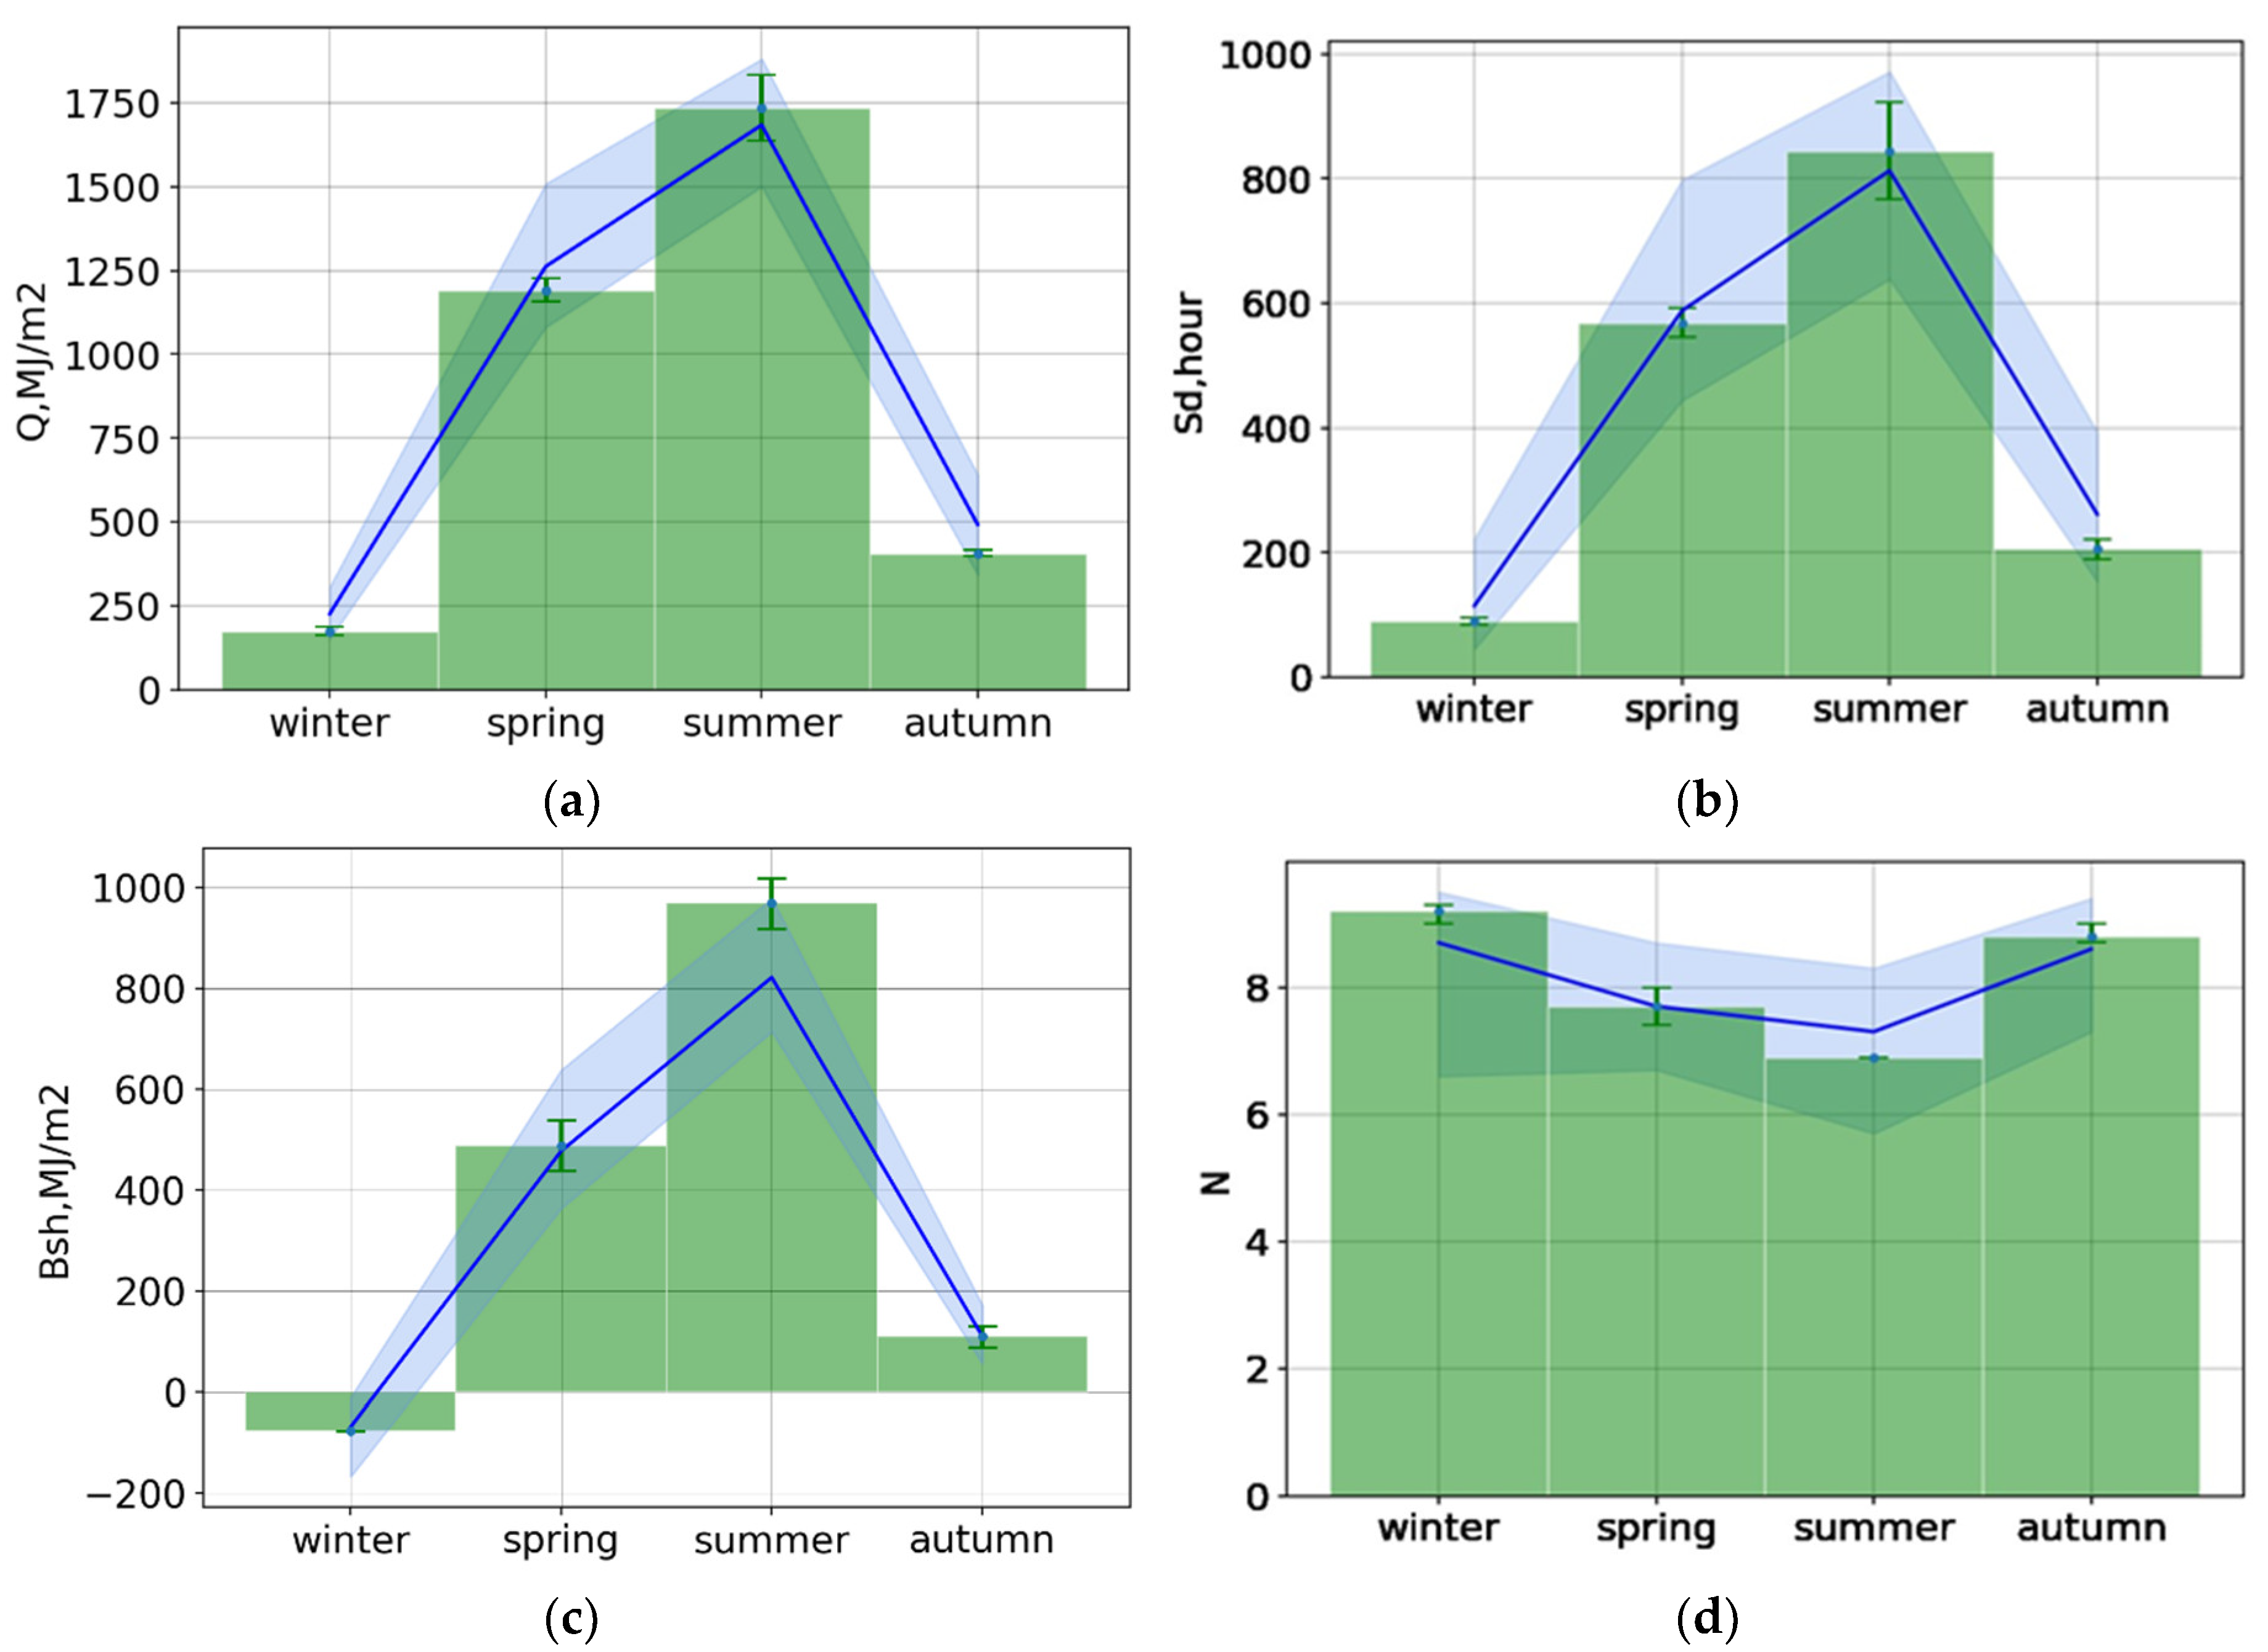
Figure 9 shows the mean seasonal sums for global shortwave irradiance, sunshine duration, net shortwave irradiance from MSU-RAD(BSRN) measurements, and total cloud amount N for the September, 2021 – August, 2023 period of observations. They are compared with the climatological values over the 1955 – 2020 period from standard observations [
17].
Seasonal doses of global shortwave irradiance for the period 2021-2023 are characterized by lower values in the cold period of year (anomalies relative to long-term average doses were -22% and -17%, respectively, for winter and autumn). The spring period was also characterized by a negative anomaly of about -5.5%. In summer, on the contrary, due to smaller total cloud amount N, positive Q anomalies of +3%, were observed. The net shortwave irradiance in summer exceeded the climatological values by 24% mainly due to a large increase in global shortwave irradiance and smaller surface albedo.
The increasing global solar irradiance in summer during the last years is a typical trend over the whole European territory [
2].
Winter negative anomalies in global shortwave irradiance are also forecasted by chemical- climate models at high latitudes [
27] in the 21 century. So, we could state that the tendencies, which are reported by the MSU-RAD(BSRN) measurements, reflect the main features of changing climate.
4. Conclusions
The MSU-RAD(BSRN) instruments provide high accuracy measurements, which allows us to characterize Moscow radiative climate in more details compared to the previous assessments. At the same time, the comparisons with shortwave radiation from the standard radiative observations, provided by the radiative instruments of Russian Hydrometeorological network, demonstrate a satisfactory agreement. The deviations lie within the instrumental uncertainties.
According to collocated aerosol measurements by CIMEL photometer we obtained that even in conditions of low aerosol loading (τaer,500 < 0.2) the loss of global irradiance in snow-free conditions varies as a function of solar elevation from 37 to 186 W/m2 (or about 18-22%) with a significant decrease in direct and increase in diffuse irradiance due to multiple scattering.
The S/D ratio decreases from 15 – 18 to 8 with an increase in τaer from 0.05 to 0.15 in snow-free conditions. However, in snow conditions, the ratio of direct to diffuse radiation is lower almost in all cases at similar τaer due to the increase of diffuse irradiance because of multiple reflection.
In winter, high snow surface albedo together with smaller aerosol and water vapor content provide an increase in global shortwave irradiance of about 45 W/m2 (or 9%) at h=30°. At the same time, net shortwave irradiance demonstrates a significant decrease due to prevailing effects of reflected irradiance at high snow albedo.
A nonlinear dependence of Q and Bsh cloud transmittance on relative sunshine duration was obtained. A significant increase in T(Q) from 0.25 to 0.4 in summer and from 0.29 to 0.49 in winter is observed, when Sd changes from 0 to 0-0.1. Similar changes are observed for Bsh cloud transmittance.
Mean seasonal changes in global shortwave irradiance against the climatological mean Q values over the 1955-2020 period are characterized by negative anomalies (-22%) in winter due to the cloud amount increase which is reflected in reduced Sd, while in summer the positive anomalies are observed (+3%) due to cloud reduction. This is in line with global tendencies in long-term changes of shortwave irradiance in moderate climate of eastern Europe during the last years.
Author Contributions
Chubarova, Natalia: Conceptualization, Methodology, Supervision, Editing; Piskunova, Daria: Data curation, Visualization, Validation, Investigation; Writing- Original draft preparation, Editing; Poliukhov, Aleksei: Software, Visualization, Investigation, Validation, Methodology, Editing; Zhdanova, Yekaterina: Visualization, Investigation, Methodology, Editing.
Funding
The work was carried out within the framework of the work of the MSU Collective Use Center (Monitoring of Atmospheric Radiation, №460191494), and supported by grant №075-15-2021-574.
Conflicts of Interest
The authors declare no conflict of interest.
Appendix A
Table A1.
Monthly mean doses (MJ/m2) of direct. diffuse. reflected and global shortwave irradiance from the new MSU-RAD(BSRN) instrumentation complex and standard observations at the MSU MO. Δ denotes the absolute and Δ% relative difference against the standard measurements. 2022.
Table A1.
Monthly mean doses (MJ/m2) of direct. diffuse. reflected and global shortwave irradiance from the new MSU-RAD(BSRN) instrumentation complex and standard observations at the MSU MO. Δ denotes the absolute and Δ% relative difference against the standard measurements. 2022.
| |
Direct irradiance |
Diffuse irradiance |
Reflected irradiance |
Global irradiance |
| |
BSRN |
standard |
Δ/Δ% |
BSRN |
standard |
Δ/Δ% |
BSRN |
standard |
Δ/Δ% |
BSRN |
standard |
Δ/Δ% |
| January |
17.3 |
17.3 |
0/0 |
41.1 |
46.3 |
-5.2/-12.7 |
33.7 |
30.4 |
3.3/9.7 |
44.5 |
49.7 |
-5.2/-11.7 |
| February |
122.5 |
116.0 |
6.5/5.3 |
77.8 |
81.5 |
-3.6/-4.7 |
78.3 |
78.2 |
0.1/0.1 |
116.4 |
118.2 |
-1.8/-1.5 |
| March |
502.1 |
476.6 |
25.5/5.1 |
124.5 |
128.1 |
-3.6/-2.9 |
169.2 |
163.6 |
5.6/3.3 |
321.8 |
316.1 |
5.7/1.8 |
| April |
249.7 |
246.1 |
3.5/1.4 |
200.0 |
208.9 |
-8.9/-4.4 |
103.8 |
104.4 |
-0.6/-0.6 |
333.8 |
340.7 |
-6.9/-2.1 |
| May |
516.4 |
516.9 |
-0.5/-0.1 |
274.4 |
278.8 |
-4.4/-1.6 |
127.5 |
130.4 |
-2.9/-2.3 |
578.3 |
582.2 |
-3.9/-0.7 |
| June |
739.3 |
738.6 |
0.8/0.1 |
237.9 |
248.6 |
-2.4/-1 |
149.0 |
154.1 |
-5.1/-3.4 |
666.0 |
677.4 |
-11.4/-1.7 |
| July |
697.4 |
681.0 |
16.4/2.4 |
264.4 |
264.0 |
0.5/0.2 |
139.8 |
148.7 |
-8.9/-6.4 |
676.2 |
667.5 |
8.7/1.3 |
| August |
554.2 |
558.4 |
-4.2/-0.7 |
245.9 |
248.8 |
-2.9/-1.2 |
110.1 |
120.4 |
-10.3/-9.3 |
552.8 |
557.1 |
-4.3/-0.8 |
| October |
156.7 |
155.2 |
1.6/1 |
87.2 |
91.8 |
-4.6/-5.3 |
24.9 |
27.2 |
-2.3/-9.2 |
139.7 |
145.2 |
-5.4/-3.9 |
| November |
34.7 |
33.8 |
0.9/2.7 |
35.0 |
37.5 |
-2.5/-7.1 |
16.9 |
17.8 |
-0.8/-4.9 |
42.0 |
44.9 |
-3/-7.1 |
| December |
36.7 |
36.8 |
-0.1/-0.2 |
26.3 |
29.0 |
-2.7/-10.3 |
22.8 |
23.9 |
-1.1/-4.8 |
32.3 |
35.4 |
-3.1/-9.5 |
| Year |
3627.0 |
3576.7 |
50.4/1.4 |
1623.0 |
1663.3 |
-40.3/-2.5 |
976.0 |
999.0 |
-23/-2.4 |
3503.7 |
3534.3 |
-30.5/-0.9 |
Table A2.
Calibration constants So.λ for different wavelengths (courtesy of Dr. T. Eck. NASA GSFC).
Table A2.
Calibration constants So.λ for different wavelengths (courtesy of Dr. T. Eck. NASA GSFC).
|
Calibration constants So.λ
|
1020 nm |
870 nm |
670 nm |
440 nm |
500 nm |
380nm |
340 nm |
| |
13902 |
19880 |
24785 |
18666 |
15967 |
36550 |
39394 |
Table A3.
Difference between τaer from the AERONET algorithm and τaer estimated in this work at different wavelengths. MSU MO. 2020.
Table A3.
Difference between τaer from the AERONET algorithm and τaer estimated in this work at different wavelengths. MSU MO. 2020.
| wavelengths |
340 nm |
380 nm |
440 nm |
500 nm |
675 nm |
870 nm |
1020 nm |
| Delta τaer
|
| Mean |
0.0023 |
0.0015 |
0.0014 |
0.0018 |
0.0000 |
-0.0002 |
-0.0090 |
| Max |
0.0258 |
0.0184 |
0.0136 |
0.0116 |
0.0056 |
0.0032 |
0.0132 |
| Min |
-0.0092 |
-0.0067 |
-0.0045 |
-0.0035 |
-0.0028 |
-0.0024 |
-0.0372 |
| Standard deviation |
0.0049 |
0.0035 |
0.0026 |
0.0025 |
0.0014 |
0.0013 |
0.0070 |
| τaer
|
| Mean |
-0.0009 |
-0.0008 |
0.0026 |
0.0022 |
0.0001 |
-0.0001 |
-0.0088 |
| Max |
0.0331 |
0.0228 |
0.0174 |
0.0131 |
0.0066 |
0.0034 |
0.0113 |
| Min |
-0.0172 |
-0.0108 |
-0.0040 |
-0.0028 |
-0.0025 |
-0.0025 |
-0.0357 |
| Standard deviation |
0.0071 |
0.0047 |
0.0032 |
0.0028 |
0.0016 |
0.0013 |
0.0068 |
Table A4.
Parametrizations of global solar irradiance (Q. W/m2) and net shortwave irradiance (Bsh. W/m2) on sine of solar elevation (sin h) and aerosol optical thickness (τaer) for snow-free conditions. .
Table A4.
Parametrizations of global solar irradiance (Q. W/m2) and net shortwave irradiance (Bsh. W/m2) on sine of solar elevation (sin h) and aerosol optical thickness (τaer) for snow-free conditions. .
|
a. Q dependence on sin h for differentτaer
|
| τaer range |
Q |
R2
|
| <0.05 |
19.148 * sin h – 43.074 |
1 |
| 0.05 – 0.08 |
19.064 *sin h – 49.633 |
0.99 |
| 0.08 – 0.1 |
17.596 *sin h – 41.954 |
1 |
| 0.1 – 0.12 |
17.804 *sin h – 50.009 |
1 |
| >0.12 |
16.208 * sin h – 41.939 |
0.98 |
|
b. Q dependence onτaer for different h
|
| h. ° |
Q |
R2
|
| 10 |
161.75* e -2.118*τaer
|
1 |
| 20 |
359.63* e -1.858*τaer
|
0.97 |
| 30 |
577.53* e -1.787*τaer
|
0.95 |
| 40 |
785.43* e -1.754*τaer
|
0.93 |
| 50 |
993.33* e -1.735*τaer
|
0.93 |
Table A5.
Q and Bsh dependence on sin h for snow and snow-free conditions.
Table A5.
Q and Bsh dependence on sin h for snow and snow-free conditions.
| |
Q |
Bsh |
| Q |
R2 |
Bsh |
R2 |
| Summer (albedo <40%) |
1063.2*sin h – 49.498 |
1 |
788.35*sin h – 38.755 |
1 |
| Winter (albedo >40%) |
1161.2*sin h – 53.915 |
1 |
434.33*sin h – 23.579 |
0.87 |
Figure A1.
Annual changes in optical thickness of different gases and Rayleigh scattering τRaileigh at different wavelengths. 2014-2020. Moscow.
Figure A1.
Annual changes in optical thickness of different gases and Rayleigh scattering τRaileigh at different wavelengths. 2014-2020. Moscow.
References
- Masson-Delmotte, V. P.; Zhai, A.; Pirani, S.L.; Connors, C.; Péan, S.; Berger, N.; Caud, Y.; Chen, L.; Goldfarb, M.I.; Gomis, M.; et al. (Eds.) IPCC, 2021: Climate Change 2021: The Physical Science Basis. Contribution of Working Group I to the Sixth Assessment Report of the Intergovernmental Panel on Climate Change; Cambridge University Press: Cambridge, UK; New York, NY, USA, 2021; Chapter 7, pp. 923–1055. [CrossRef]
- Wild, M. Decadal changes in radiative fluxes at land and ocean surfaces and their relevance for global warming. Wiley Interdiscip. Rev. Clim. Chang. 2016, 7, 91–107. [Google Scholar] [CrossRef]
- BSRN Home Page. Available online: https://bsrn.awi.de/ (accessed on 15 September 2023).
- Wild, M. The global energy balance as represented in CMIP6 climate models. Clim. Dyn. 2020, 55, 553–577. [Google Scholar] [CrossRef] [PubMed]
- Frolich, C.; London, J. (Eds.) Revised instruction menual on radiation instruments and measurements. WCRP Publication Series, 1986, 7, 140p. 7.
- MO MSU Home Page. Available online: http://www.momsu.ru (accessed on 10 July 2023).
- Lutsko, L.V; Makhotkina, E.L.; Bychkova, A.P; Sokolenko, S.A.; Lebedeva, K.D. GUIDANCE DOCUMENT. INSTRUCTION TO HYDROMETEOROLOGICAL STATIONS AND POSTS, Roshydromet, Moscow, 1997 (2020 eds.), 5, 221 p.
- Chubarova, N.Ye.; Zhdanova, Ye.Yu.; Androsova, Ye.Ye.; Kirsanov, A.A.; Shatunova, M.V. ; Khlestova, Yu.O.; Volpert, Ye.V.; Poliukhov, A.A.; Eremina, I.D.; Vlasov, D.V.; Popovicheva, O.B.; Ivanov, A.S.; Gorbarenko, Ye.V.; Nezval, Ye.I.; Blinov, D.V.; Rivin G.S.; The aerosol urban pollution and its effects on weather, regional climate and geochemical processes: Monograph; Chubarova N.Ye. (ed.), 2020, MAKS Press, Moscow, Russia, 2020, 339 p., ISBN 978-5-317-06464-8 (in Russian).
- Chubarova, N. E.; Nezval’, E. I.; Belikov, I. B.; Gorbarenko, E. V.; Eremina, I. D.; Zhdanova, E. Yu.; Korneva, I. A.; Konstantinov, P. I.; Lokoshchenko, M. A.; Skorokhod, A. I.; Shilovtseva, O. A. Climatic and Environmental Characteristics in Moscow Megalopolis According to Moscow State University Meteorological Observatory Data over 60 Years. Meteorol. Hydrol. 2014, 39, 49–64. [Google Scholar] [CrossRef]
- bakumova G.M., Gorbarenko E.V., Nezval E.I., Shilovtseva O.A. Fifty years of actinometrical measurements in Moscow. Int J Remote SENS, 2008, Taylor & Francis (United Kingdom), 29, № 9, p. 2629-2665.
- WRDC Home Page. Available online: http://wrdc.mgo.rssi.ru/ (accessed on 5 October 2023).
- Gorbarenko, E.V. Climate changes in atmospheric radiation parameters from the MSU meteorological observatory data. Meteorol. Hydrol. 2016, 41, 789–797 (in Russian).
- Volpert, E.V.; Chubarova N.E. Long-term Changes in Solar Radiation in Northern Eurasia during the Warm Season Accordingto Measurements and Reconstruction Model. Russian Meteorology and Hydrology, 2021, Allerton Press Inc. (United States), 46, p. 507-518 (In Russian).
- Chubarova, N. E.; Rozental, V. A.; Zhdanova, E. Yu.; Poliukhov, A. A. New radiation complex at the Moscow State University Meteorological Observatory of the BSRN standard: methodological aspects and first measurement results. Opt. Atmos. i Oc. 2022, 35, 670–678. [Google Scholar] [CrossRef]
- Kipp and Zonen Home Page. Available online: https://www.kippzonen.com/ (accessed on 19 November 2023).
- Long, C. N.; Shi, Y. An automated quality assessment and control algorithm for surface radiation measurements. The Open Atmos. Science Journal. 2008, 2, 23–37. [Google Scholar] [CrossRef]
- Gorbarenko, E.V. Extremes and general trends in long-term variability of atmospheric radiation parameters in Moscow. Vest Mos. Univ. Geogr. (in Russian). 2022, 6, 90–103. [Google Scholar]
- AERONET Home Page. Available online: https://aeronet.gsfc.nasa.gov/ (accessed on 15 March 2022).
- Giles, D. M.; Sinyuk, A.; Sorokin, M. G.; Schafer, J. S.; Smirnov, A.; Slutsker, I.; Eck, T. F.; Holben, B. N.; Lewis, J. R.; Campbell, J. R.; Welton, E. J.; Korkin, S. V.; and Lyapustin, A. I. Advancements in the Aerosol Robotic Network (AERONET) Version 3 database – automated near-real-time quality control algorithm with improved cloud screening for Sun photometer aerosol optical depth (AOD) measurements. Atmos. Meas. Tech. 2019, 12, 169–209. [Google Scholar] [CrossRef]
- Holben, B.N.; Esk, T.F.; Slutsker, I.; Tanre, D.; Buis, J.P. ; Setzer, A; Vermote, E.; Reagan, J.A.; Kaufman, Y.J.; Nakajimu, T.; Lavenu, F.; Jnnkowiak, I.; Smirnov, A. AERONET - A federated instrument network and data archive for aerosol characterization. Remote Sens. Environ 1998, 66, 1–16. [Google Scholar] [CrossRef]
- Chubarova, N. Y.; Poliukhov, A. A.; Gorlova, I. D. Long-term variability of aerosol optical thickness in Eastern Europe over 2001–2014 according to the measurements at the Moscow MSU MO AERONET site with additional cloud and NO2 correction. Atmos. Meas. Tech. 2016, 9, 313–334. [Google Scholar] [CrossRef]
- Tarasova, T. A.; Fomin, B. A. The use of new parameterizations for gaseous absorption in the CLIRAD-SW solar radiation code for models. Atm. Oc. Tech. 2007, 24, 1157–1162. [Google Scholar] [CrossRef]
- Chubarova, N. The Transmittance of the Global ultraviolet Radiation by Different Cloud Types. Phys. Atm. Oc. 1994, 29, 615–621. [Google Scholar]
- Gorbarenko, E. V.; Abakumova, G. M. Radiation balance variations of underlying surface from the long-term observations of the Meteorological Observatory of the Moscow State University. Russ. Meteorol. Hydrol. 2011, 36, 383–391. [Google Scholar] [CrossRef]
- Zhdanova, E.; Chubarova, N.; Blumthaler, M. Biologically active UV-Radiation and UV-resources in Moscow. Geography. Environment. Sustainability 2008, 71–85. [Google Scholar] [CrossRef]
- Tzallas, V.; Hünerbein, A.; Stengel, M.; Meirink, J.; Benas, N.; Trentmann, J.; Macke, A. CRAAS: A European Cloud Regime dAtAset Based on the CLAAS-2.1 Climate Data Record. Remote Sensing. 2022, 14, 5548. [Google Scholar] [CrossRef]
- Chubarova, N.; Pastukhova, A.; Zhdanova, E.; Volpert, E; Smyshlyaev, S.; Galin, V.; Effects of ozone and clouds on temporal variability of surface UV radiation and UV resources over northern eurasia derived from measurements and modeling. Atmosphere 2020, 11, 59. [CrossRef]
Figure 1.
The view of the RAD-MSU (BSRN) complex located at the roof of the MSU MO.
Figure 1.
The view of the RAD-MSU (BSRN) complex located at the roof of the MSU MO.
Figure 2.
Box-and-whiskers diagram with the comparisons of Angstrom exponent 440-870 nm and aerosol optical thickness τaer 500 nm over the 2021 – 2022 period (hatch) and their climatological estimates over the 2001 – 2022 period (fill). The cross represents mean value, line - median, box is interquartile range (from 1st to 3rd quartile), whiskers show minimum and maximum values without outliers.
Figure 3.
The dependence of direct (a), diffuse (b), global (c), and net shortwave irradiance (d) on sine of solar elevation (sin h) for different ranges of τaer at 500 nm; trend lines are shown for τaer at 500 nm < 0.15 and > 0.15. Snowless conditions.
Figure 3.
The dependence of direct (a), diffuse (b), global (c), and net shortwave irradiance (d) on sine of solar elevation (sin h) for different ranges of τaer at 500 nm; trend lines are shown for τaer at 500 nm < 0.15 and > 0.15. Snowless conditions.
Figure 5.
Global (a) and net (b) shortwave irradiance as a function of sinh in snow and snow-free clear sky conditions.
Figure 5.
Global (a) and net (b) shortwave irradiance as a function of sinh in snow and snow-free clear sky conditions.
Figure 6.
The dependence of cloud transmittance T(Q)(a) and T(Bsh) (b) on relative sunshine duration Sd. Confidence intervals are shown by fill. The сases at low solar elevations smaller than 5° were removed from the sample.
Figure 6.
The dependence of cloud transmittance T(Q)(a) and T(Bsh) (b) on relative sunshine duration Sd. Confidence intervals are shown by fill. The сases at low solar elevations smaller than 5° were removed from the sample.
Figure 7.
Monthly sums of sunshine duration Sd (hours), shortwave (Bsh) and longwave (Bln) net irradiance (MJ/m2), monthly mean ratio of diffuse to global shortwave irradiance (D/Q) and surface albedo (%) over the whole period of measurements. Moscow.
Figure 7.
Monthly sums of sunshine duration Sd (hours), shortwave (Bsh) and longwave (Bln) net irradiance (MJ/m2), monthly mean ratio of diffuse to global shortwave irradiance (D/Q) and surface albedo (%) over the whole period of measurements. Moscow.
Figure 8.
Dependence of daily doses of shortwave(a) and longwave(b) net irradiance as a function of sunshine duration at different surface albedo conditions. September, 2021 – July, 2023.
Figure 8.
Dependence of daily doses of shortwave(a) and longwave(b) net irradiance as a function of sunshine duration at different surface albedo conditions. September, 2021 – July, 2023.
Figure 9.
Comparison of mean seasonal doses for global shortwave irradiance (a), sunshine duration(b), net shortwave irradiance (c) and total cloud amount visual observations N (d) over the September, 2021– August, 2023 period of observations by RAD-MSU(BSRN) measurements (green histograms with error bars (min/max seasonal doses)) with long term observations over the 1955–2020 period (blue lines with min/max doses).
Table 1.
The set of observations and instrumentation of the RAD-MSU(BSRN) complex [
15].
Table 1.
The set of observations and instrumentation of the RAD-MSU(BSRN) complex [
15].
| Parameters |
Designations |
Instruments |
Measurement errors |
| Direct normal shortwave irradiance |
S |
CHP1 Pyrheliometer |
< 0.5 % |
| Diffuse shortwave irradiance |
D |
CMP21 Pyranometer |
< ±10 W/m² |
| Global shortwave irradiance |
Q |
CMP21 Pyranometer |
< ±10 W/m² |
| Downward longwave irradiance |
L_U |
CGR4 Pyrgeometer
on the roof |
< 1 % |
| Reflected shortwave irradiance |
R |
CMP21 Pyranometer |
< ±10 W/m² |
| Upward longwave irradiance |
L_L |
CGR4 Pyrgeometer
on the ground |
< 1 % |
| Ultraviolet irradiance in the range of 315 - 400 nm. |
UVA |
SUV-A UVA Radiometer |
< ±5 % |
| Erythemal UV irradiance |
ER |
SUV-E UVE Radiometer |
< ±5 % |
| Sunshine duration |
Sd |
CSD3 Sunshine Duration Sensor |
> 90% (monthly sunshine hours |
Table 2.
Mean losses of global shortwave irradiance (W/m2) due τaer,500 at different solar elevations. Clear sky snow-free conditions. .
Table 2.
Mean losses of global shortwave irradiance (W/m2) due τaer,500 at different solar elevations. Clear sky snow-free conditions. .
| solar elevation |
10° |
20° |
30° |
40° |
50° |
| W/m2 |
% |
W/m2 |
% |
W/m2 |
% |
W/m2 |
% |
W/m2 |
% |
|
τaer,500 < 0.05 |
8.3 |
5.1 |
16.3 |
4.5 |
25.1 |
4.4 |
33.6 |
4.3 |
42 |
4.2 |
τaer,500
0.05 – 0.1 |
22.2 |
13.7 |
43.8 |
12.2 |
67.8 |
11.7 |
90.5 |
11.5 |
113.3 |
11.4 |
τaer,500
0.1 – 0.15 |
36.3 |
22.4 |
71.8 |
20.0 |
111.3 |
19.3 |
148.9 |
19.0 |
186.5 |
18.8 |
Table 3.
The main statistics for cloud transmittance of hourly average global shortwave irradiance T(Q) and net shortwave irradiance T(Bsh). .
Table 3.
The main statistics for cloud transmittance of hourly average global shortwave irradiance T(Q) and net shortwave irradiance T(Bsh). .
| The Sd intervals |
Mean T (Q) |
Mean T(Bsh) |
Standard
deviation T (Q)
|
Standard
deviation T (Bsh)
|
Case number |
| Summer (albedo <40 %) |
Winter (albedo >40 %) |
Summer (albedo <40 %) |
Winter (albedo >40 %) |
Summer (albedo <40 %) |
Winter (albedo >40 %) |
Summer (albedo <40 %) |
Winter (albedo >40 %) |
Summer (albedo <40 %) |
Winter (albedo >40 %) |
| 0 |
0.25 |
0.29 |
0.27 |
0.22 |
0.13 |
0.12 |
0.14 |
0.11 |
1729 |
1092 |
| 0-0.1 |
0.40 |
0.47 |
0.44 |
0.39 |
0.12 |
0.11 |
0.13 |
0.11 |
326 |
112 |
| 0.1-0.2 |
0.47 |
0.54 |
0.52 |
0.47 |
0.10 |
0.11 |
0.11 |
0.15 |
236 |
45 |
| 0.2-0.3 |
0.52 |
0.56 |
0.57 |
0.47 |
0.10 |
0.08 |
0.11 |
0.12 |
205 |
37 |
| 0.3-0.4 |
0.58 |
0.62 |
0.63 |
0.54 |
0.09 |
0.08 |
0.11 |
0.12 |
199 |
31 |
| 0.4-0.5 |
0.64 |
0.68 |
0.70 |
0.58 |
0.10 |
0.11 |
0.11 |
0.16 |
226 |
29 |
| 0.5-0.6 |
0.70 |
0.68 |
0.76 |
0.55 |
0.09 |
0.09 |
0.12 |
0.12 |
246 |
28 |
| 0.6-0.7 |
0.76 |
0.76 |
0.83 |
0.63 |
0.12 |
0.11 |
0.15 |
0.11 |
259 |
32 |
| 0.7-0.8 |
0.82 |
0.79 |
0.89 |
0.65 |
0.12 |
0.12 |
0.14 |
0.19 |
238 |
29 |
| 0.8-0.9 |
0.87 |
0.81 |
0.95 |
0.71 |
0.11 |
0.10 |
0.13 |
0.19 |
303 |
26 |
| 0.9-1 |
0.93 |
0.88 |
1.00 |
0.85 |
0.11 |
0.13 |
0.12 |
0.30 |
472 |
74 |
| 1 |
0.96 |
0.95 |
1.03 |
0.97 |
0.09 |
0.07 |
0.10 |
0.26 |
1350 |
257 |
|
Disclaimer/Publisher’s Note: The statements, opinions and data contained in all publications are solely those of the individual author(s) and contributor(s) and not of MDPI and/or the editor(s). MDPI and/or the editor(s) disclaim responsibility for any injury to people or property resulting from any ideas, methods, instructions or products referred to in the content. |
© 2023 by the authors. Licensee MDPI, Basel, Switzerland. This article is an open access article distributed under the terms and conditions of the Creative Commons Attribution (CC BY) license (http://creativecommons.org/licenses/by/4.0/).
