Submitted:
22 November 2023
Posted:
26 November 2023
You are already at the latest version
Abstract
Keywords:
Introduction
Results
In vitro studies
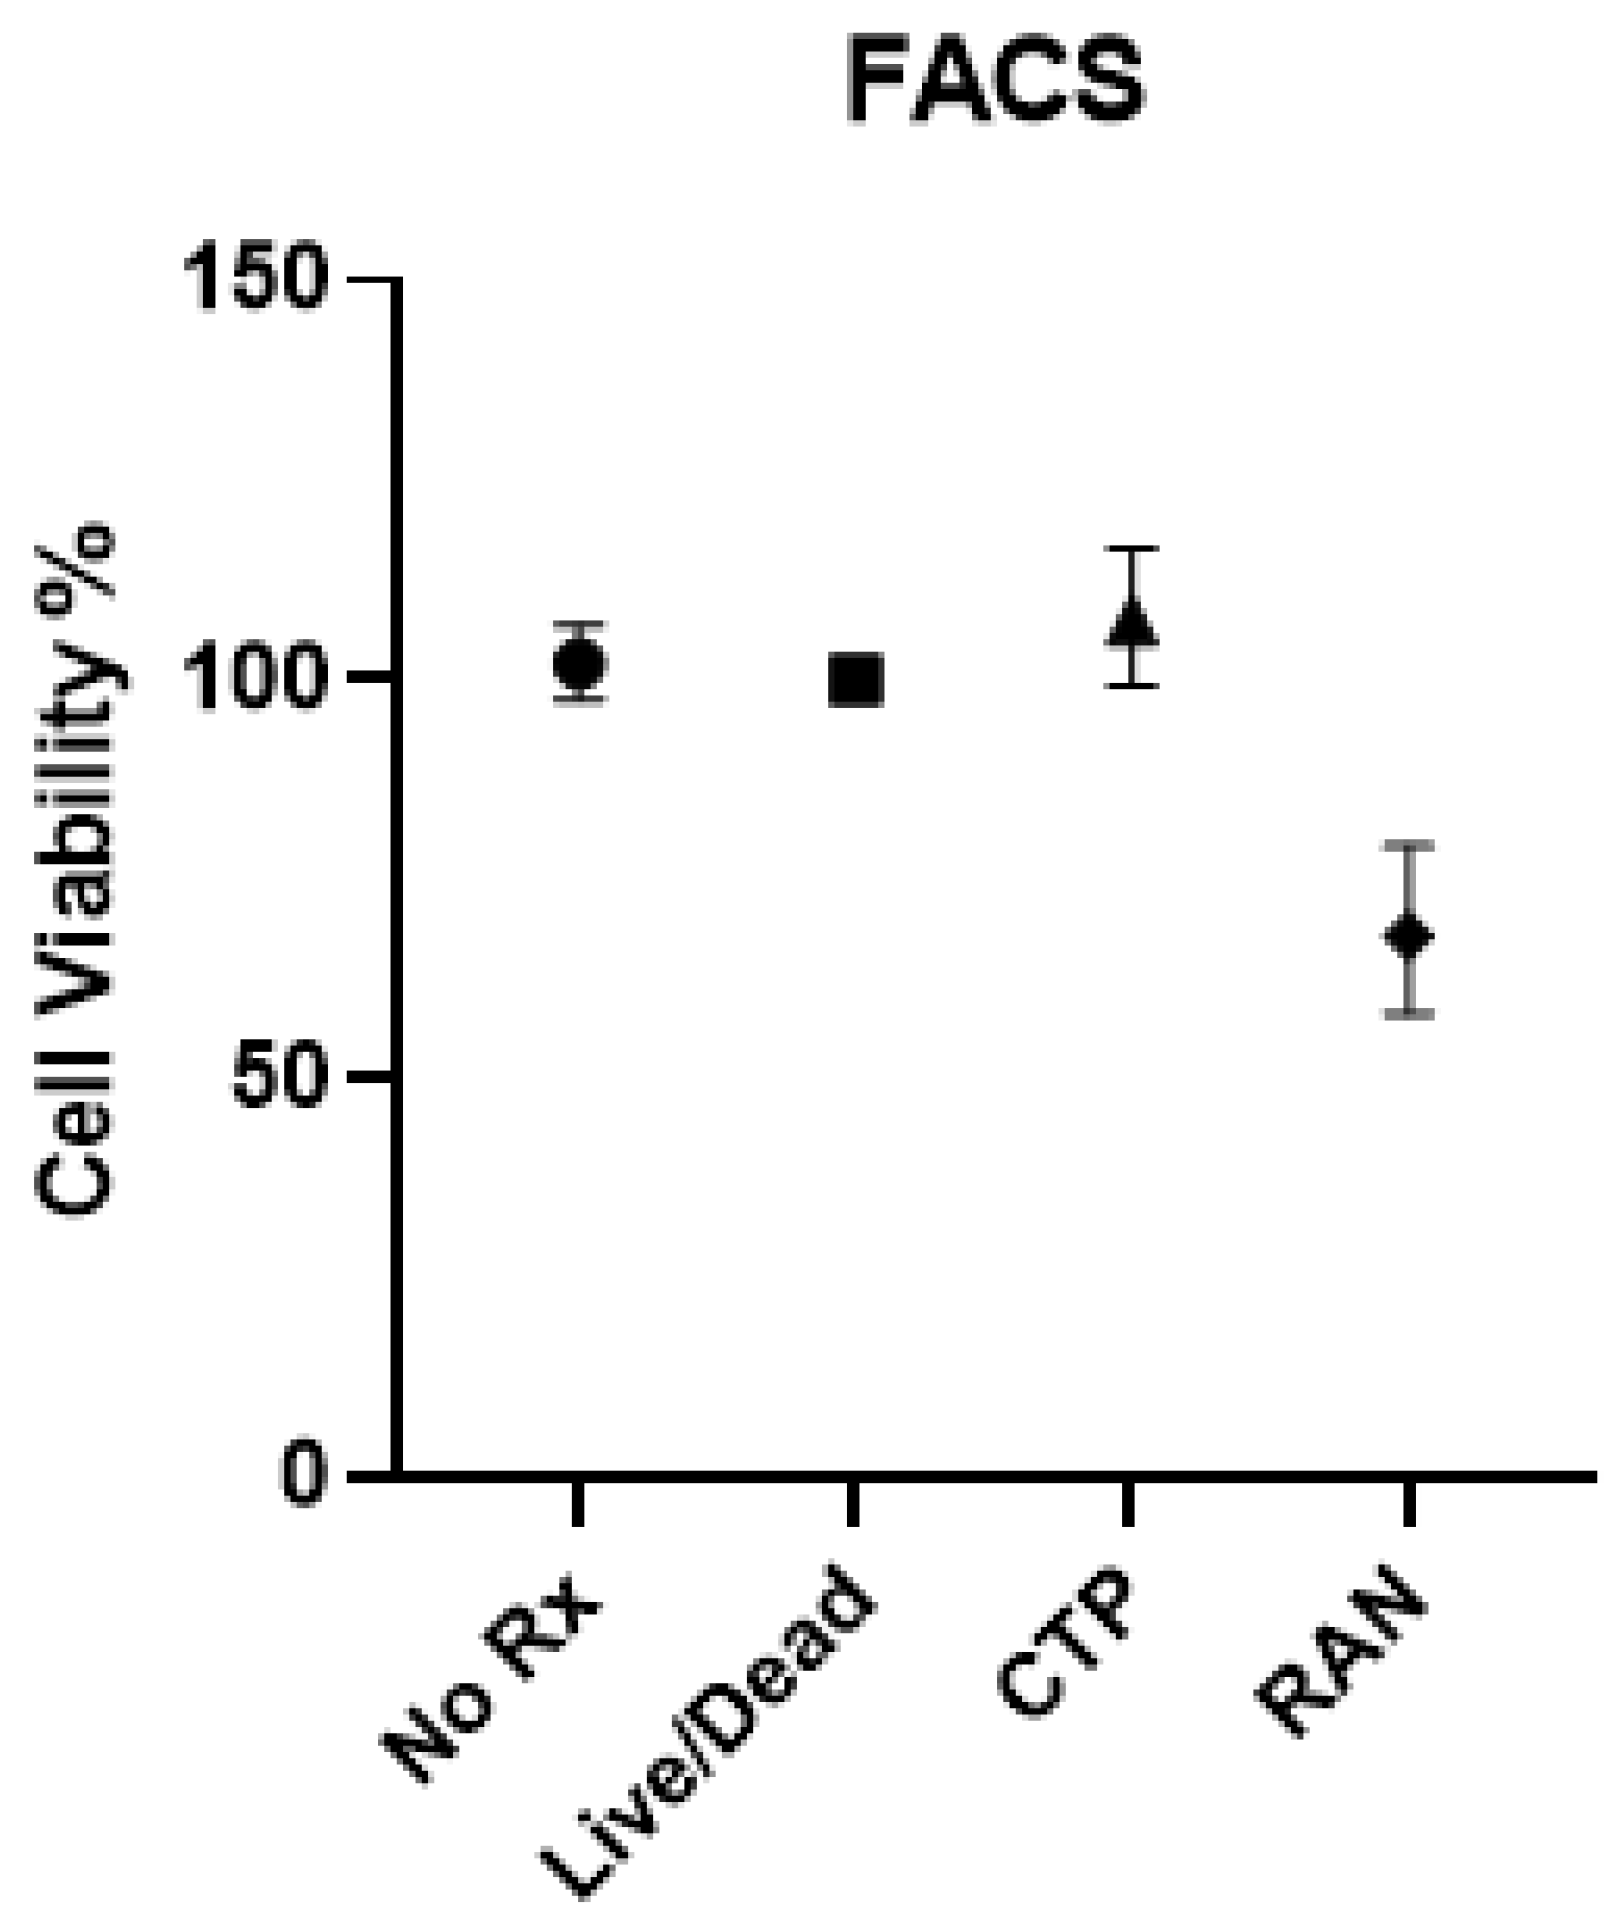
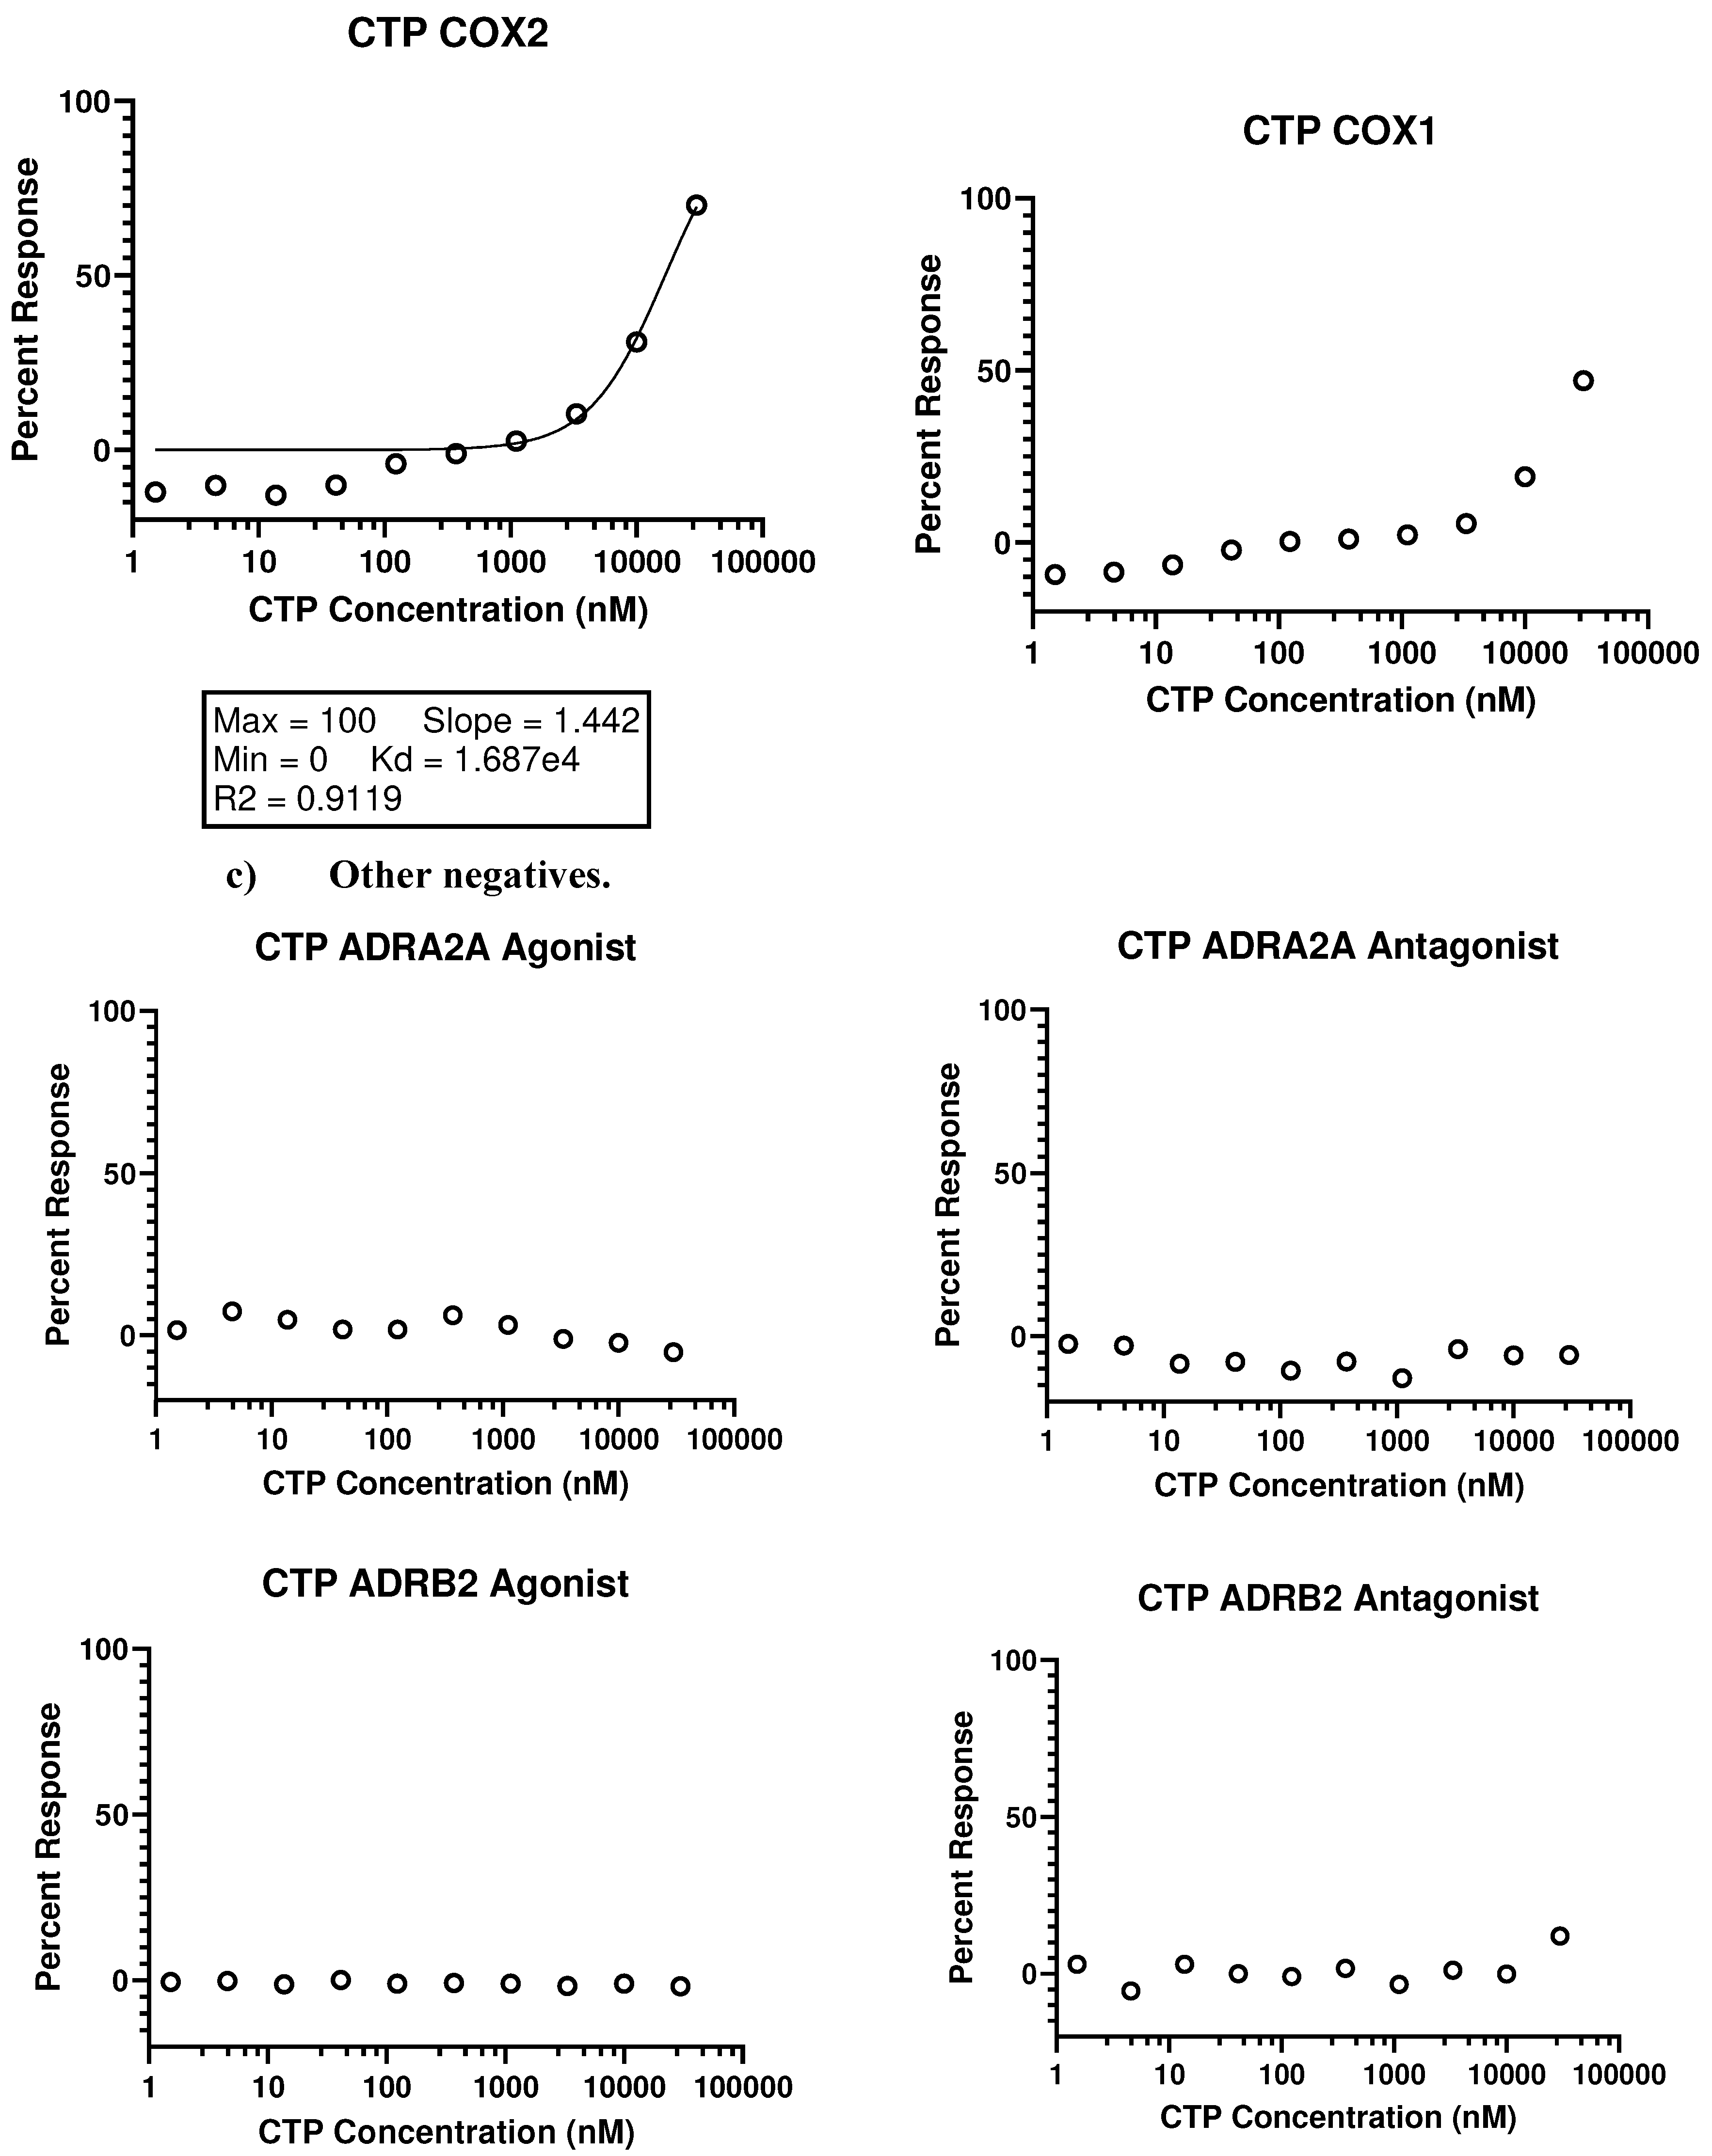
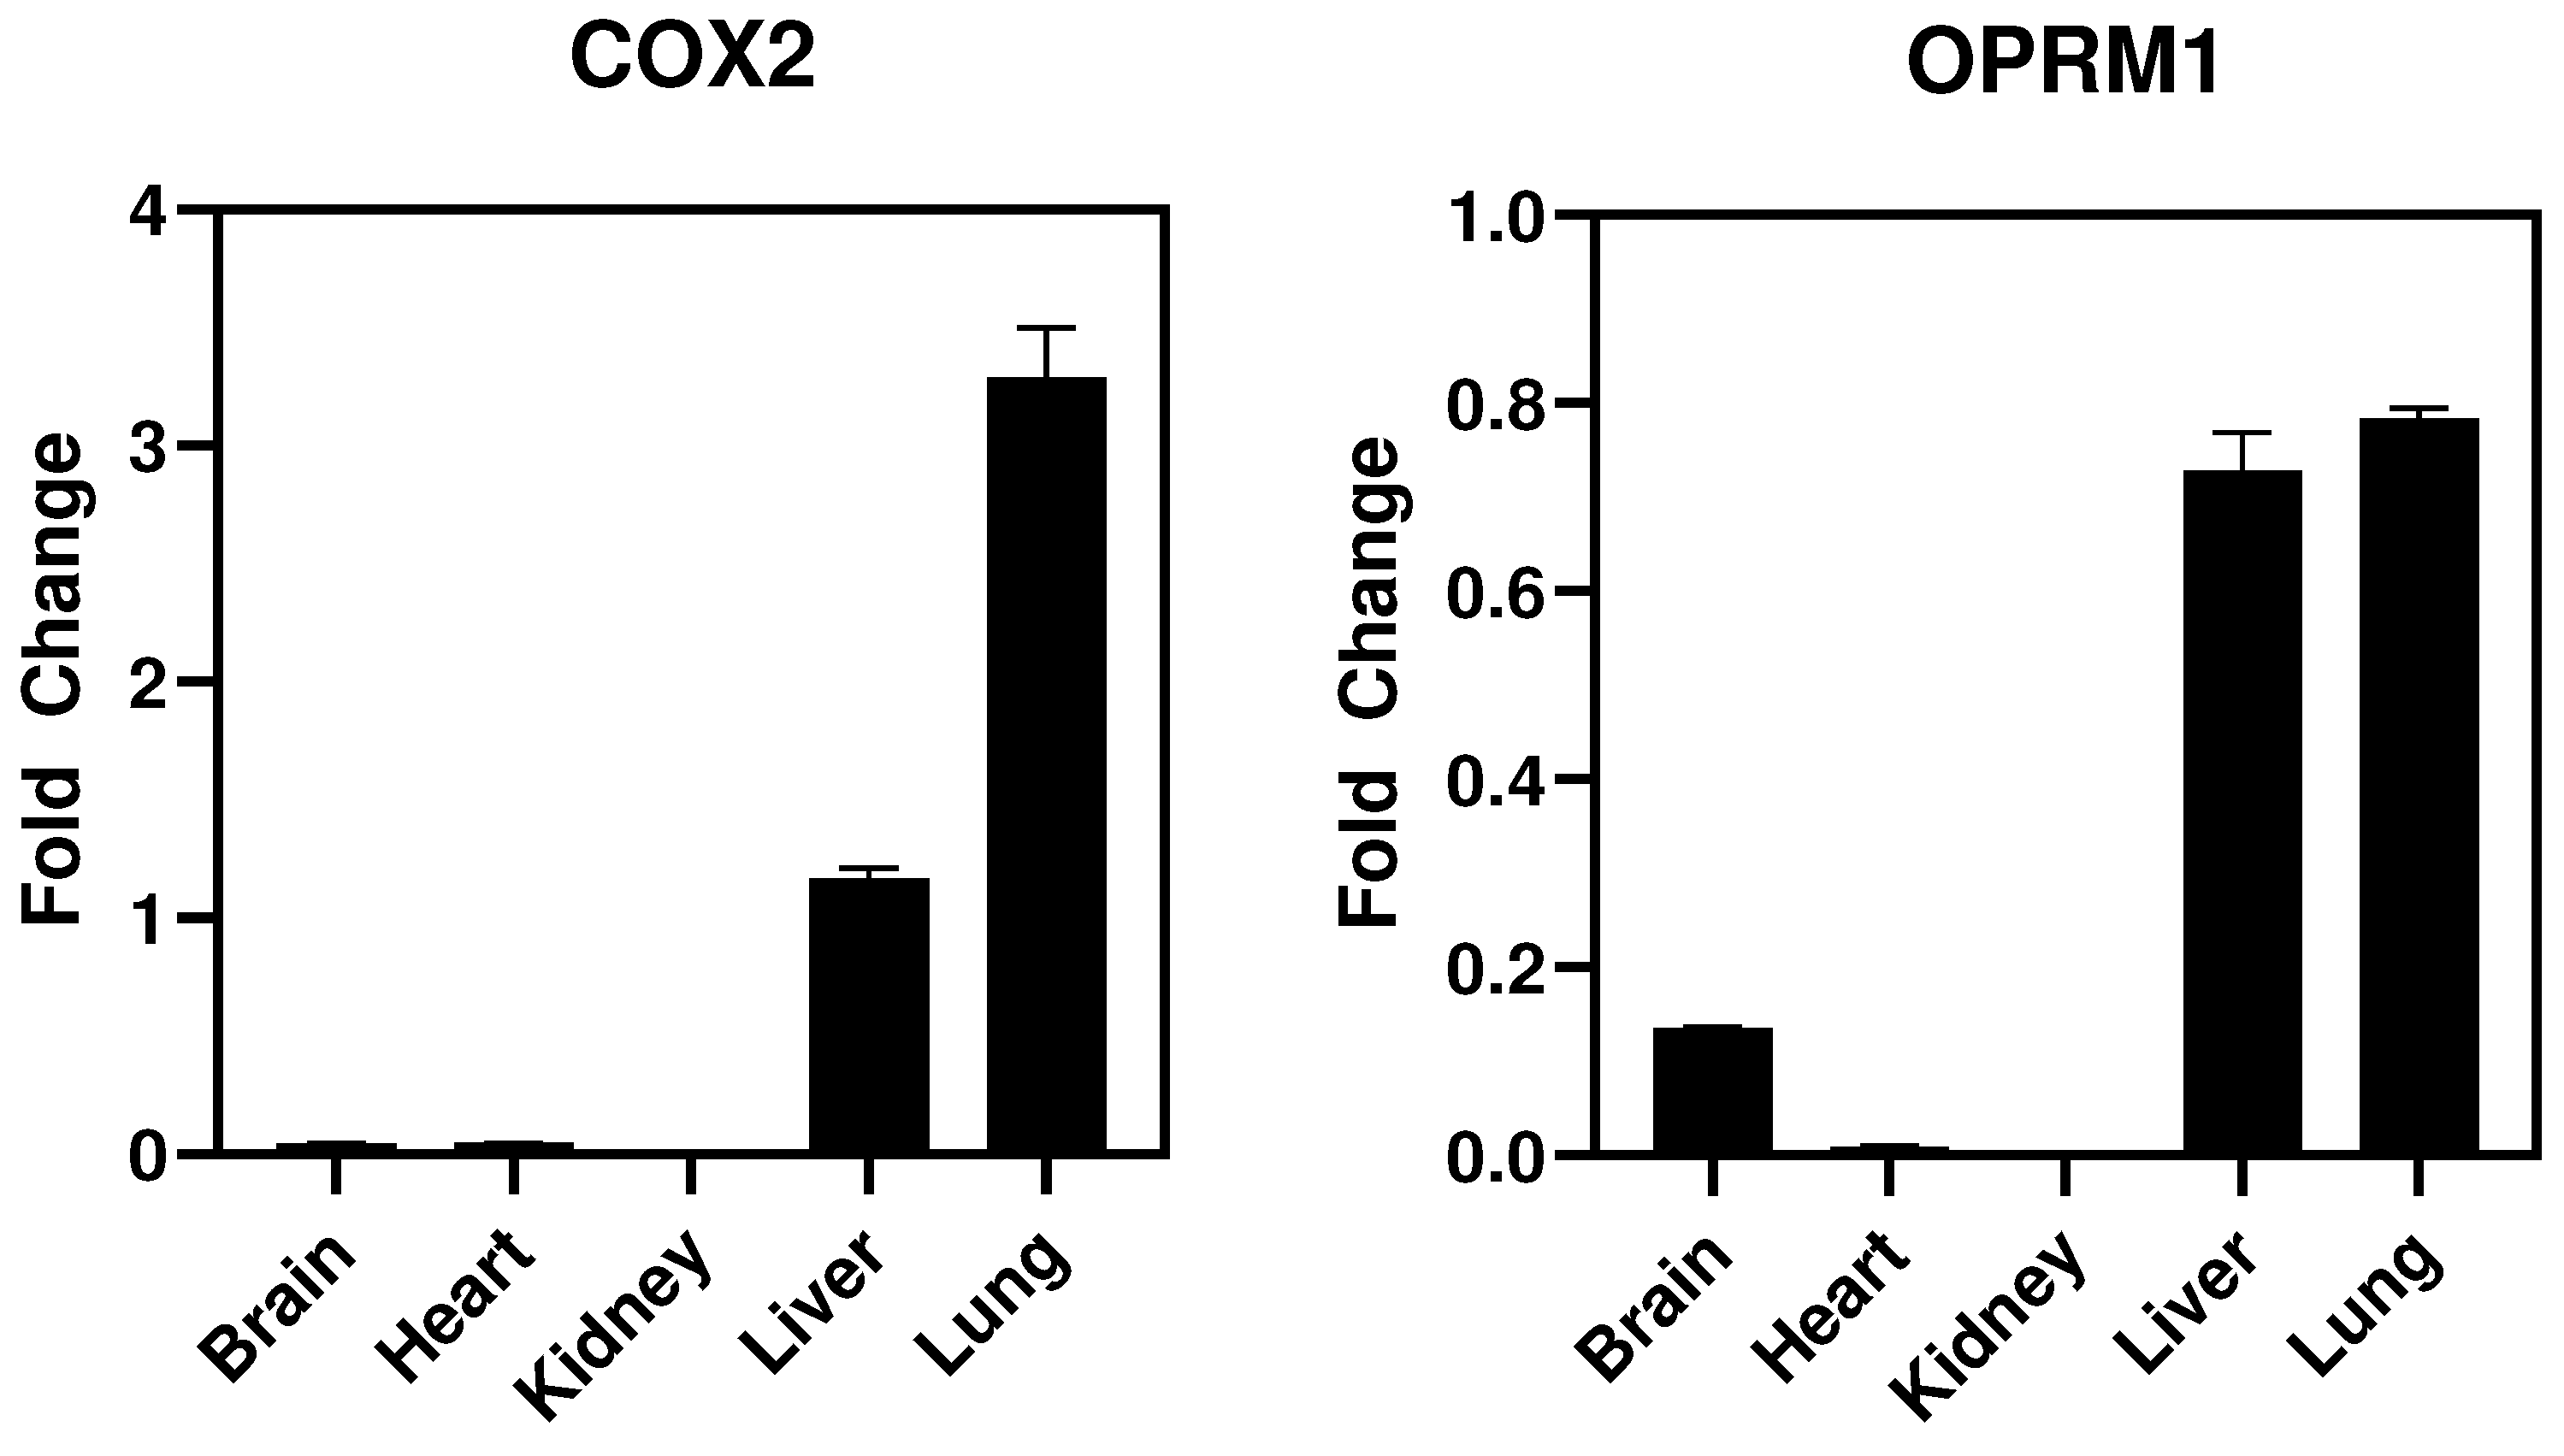
- Eurofins Toxicology Study
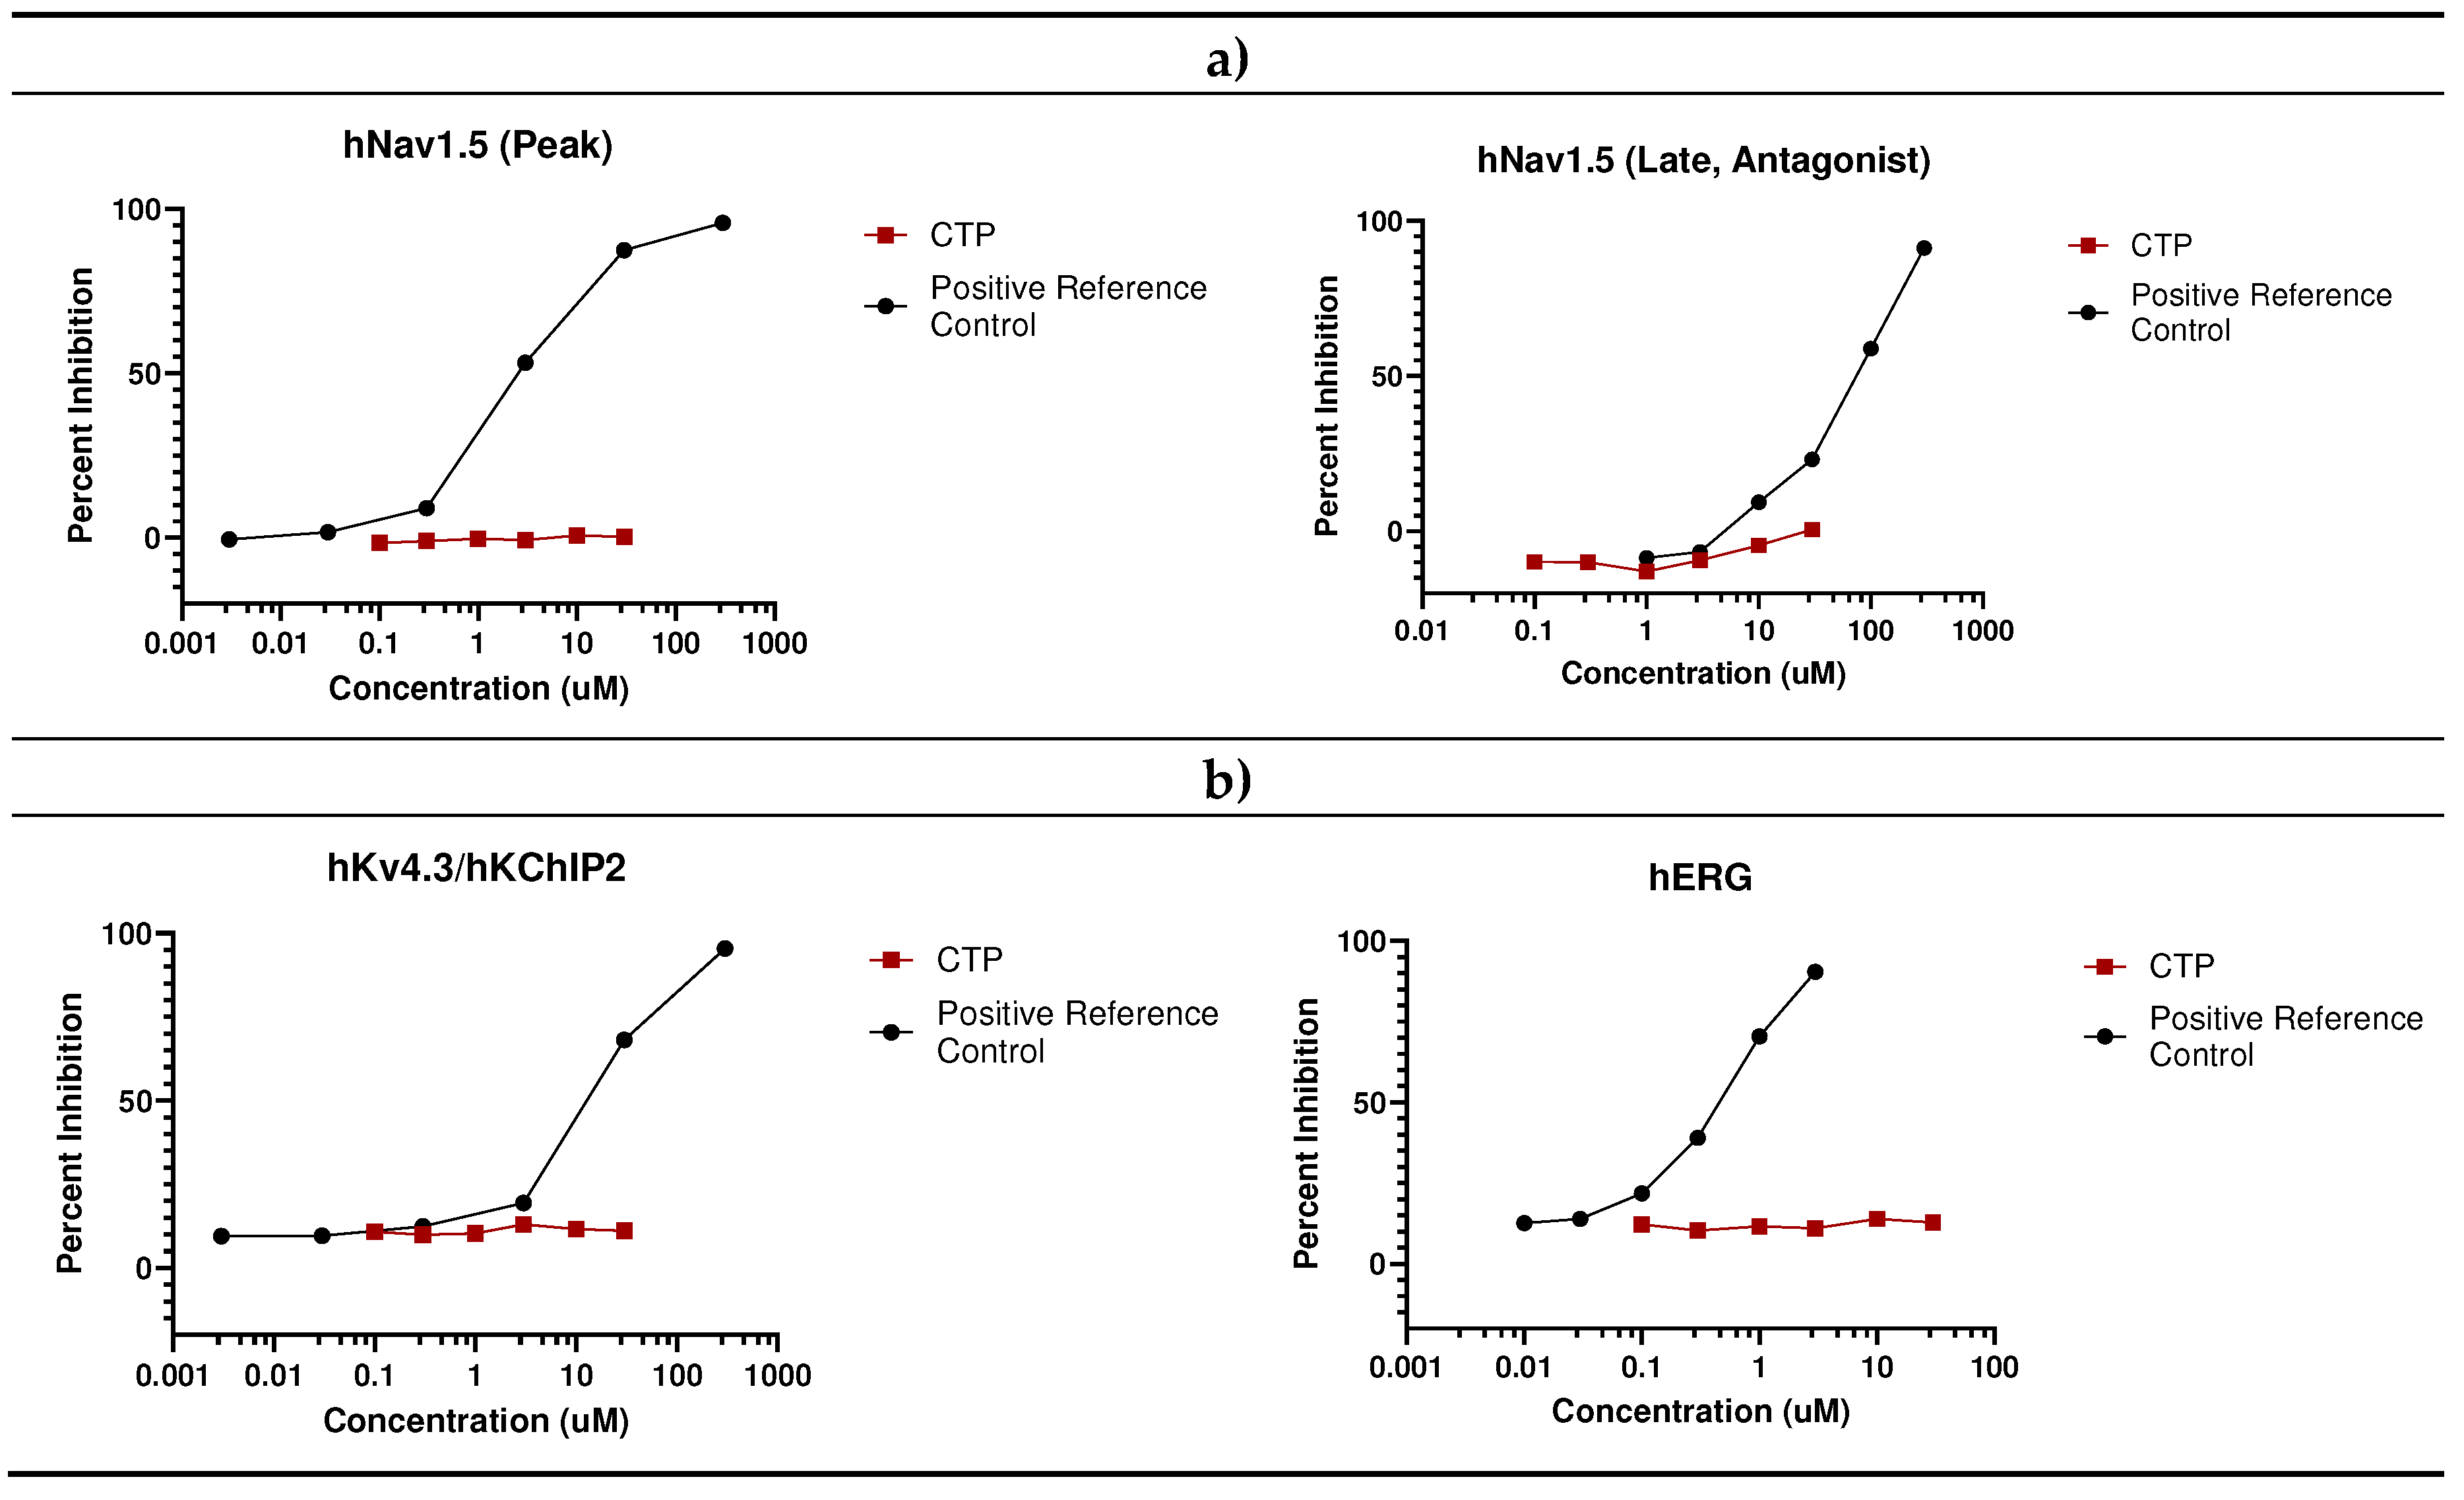
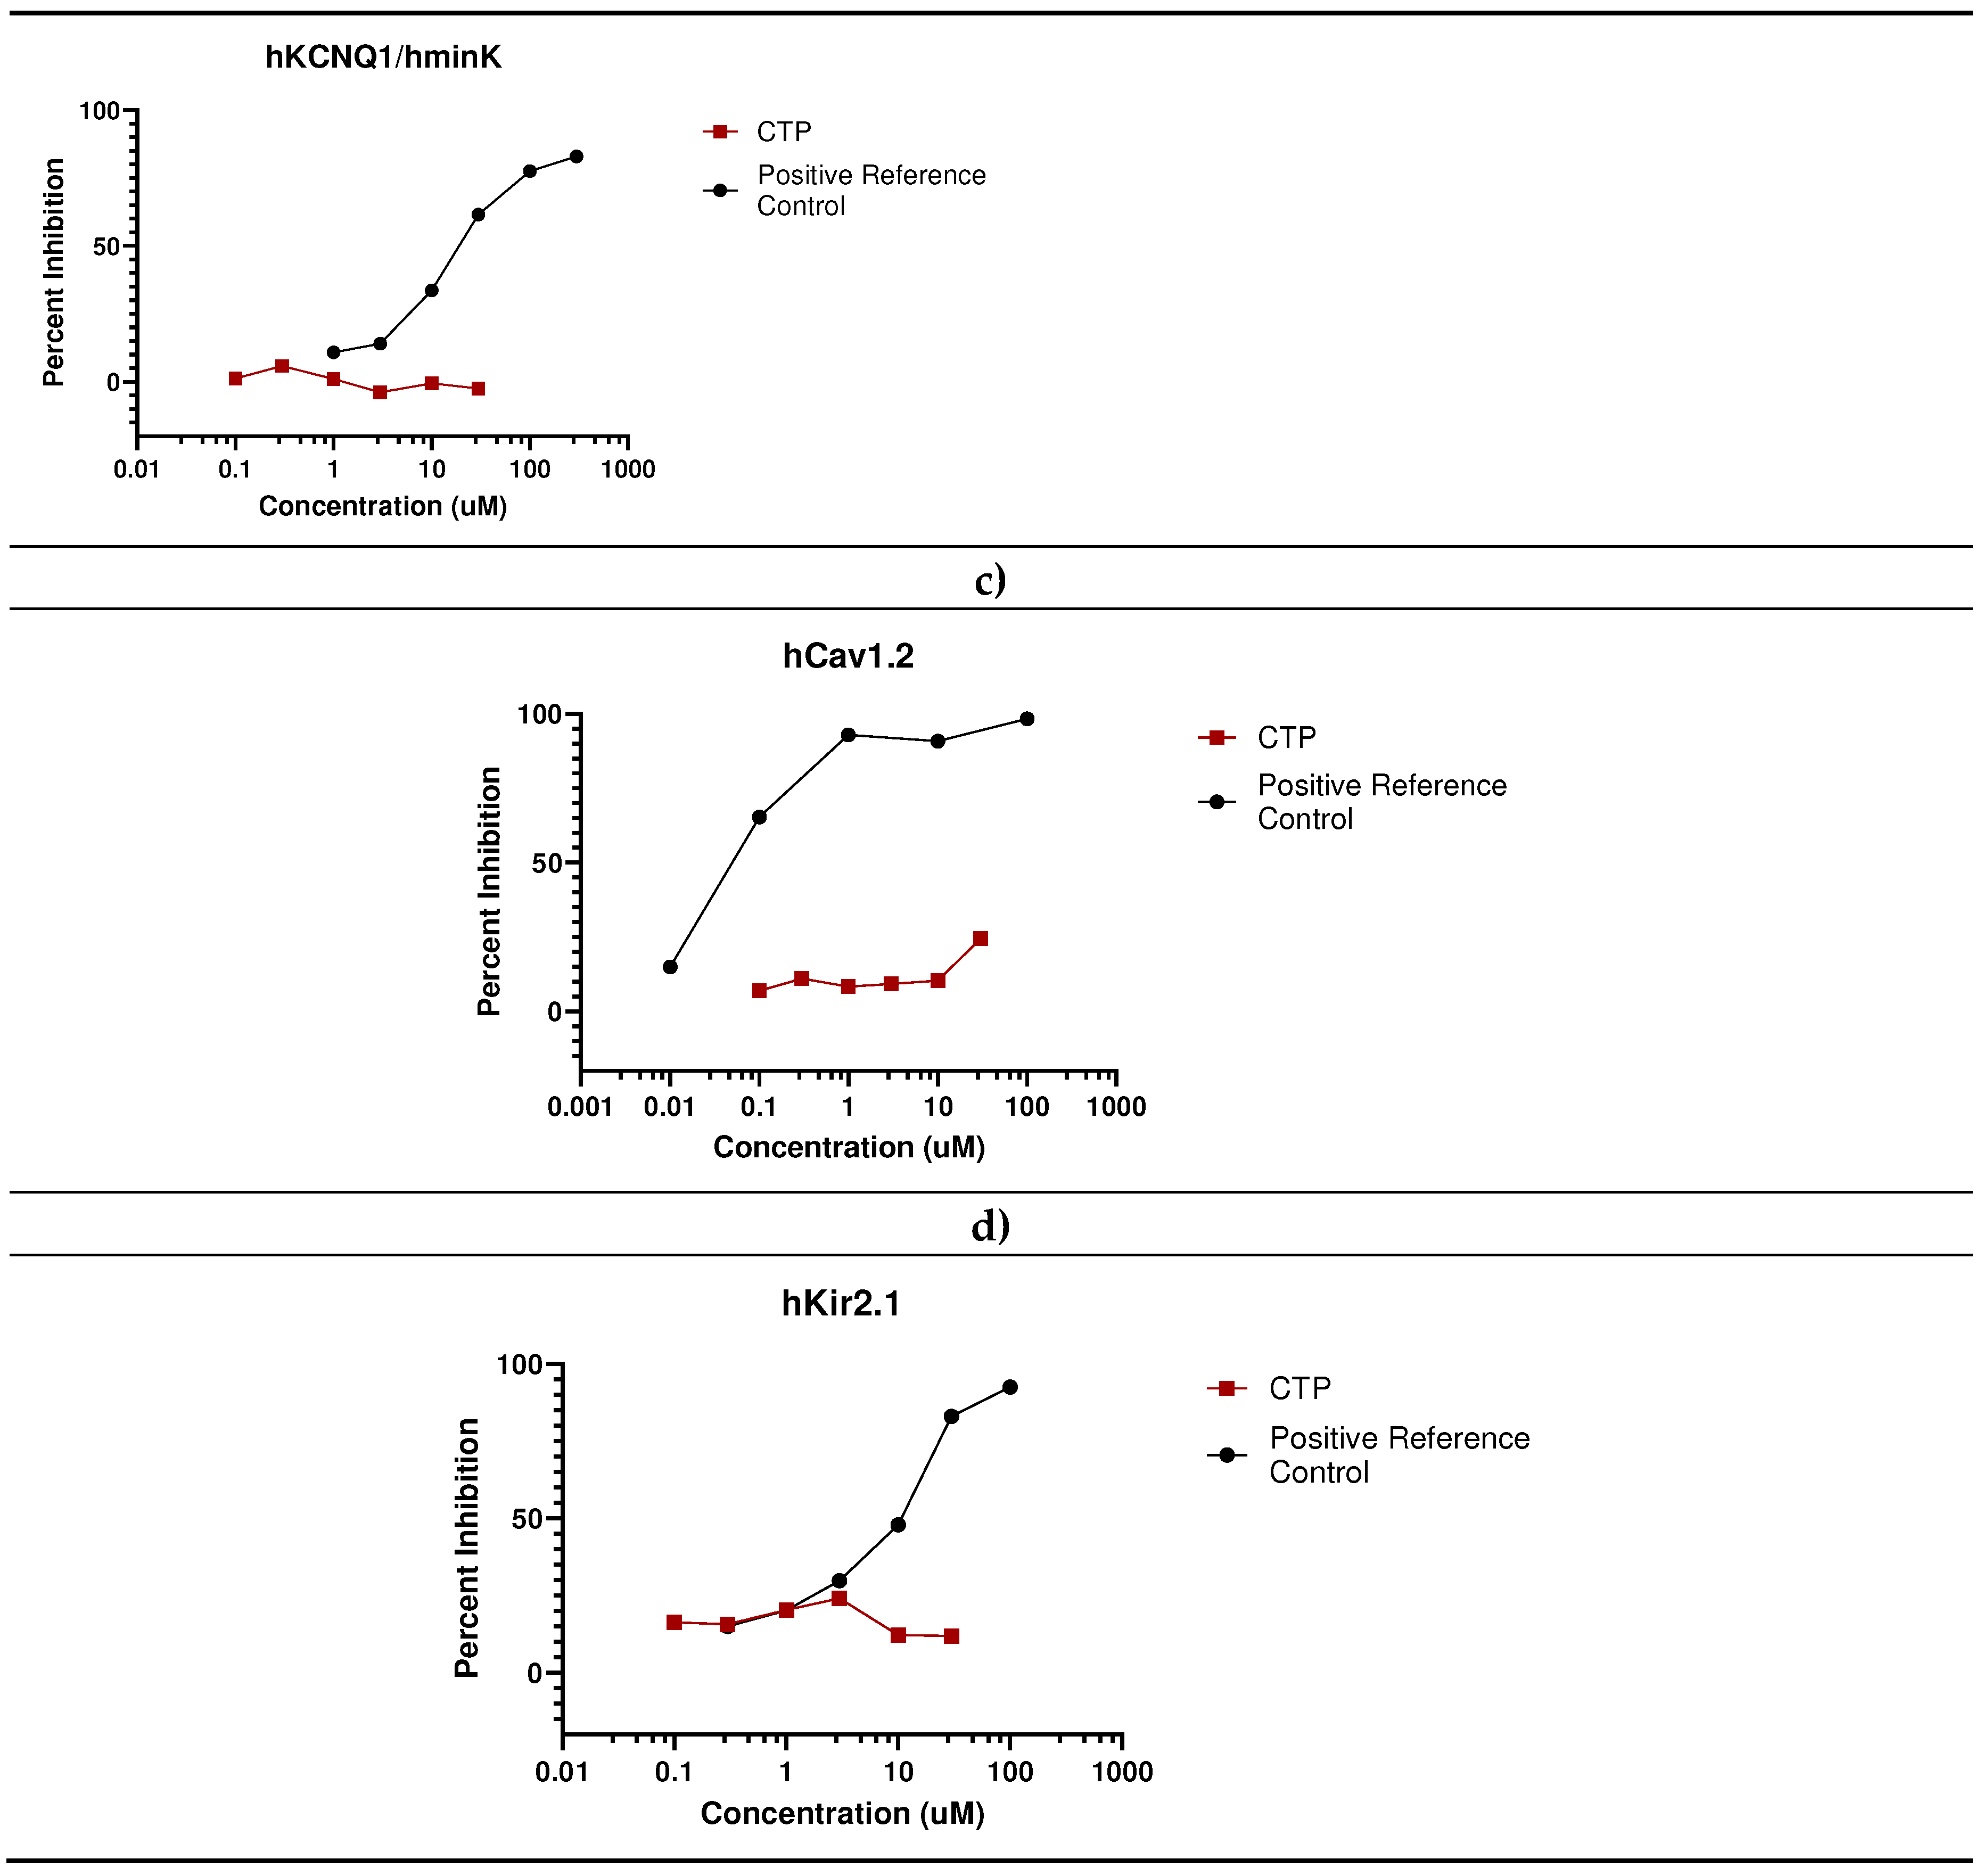
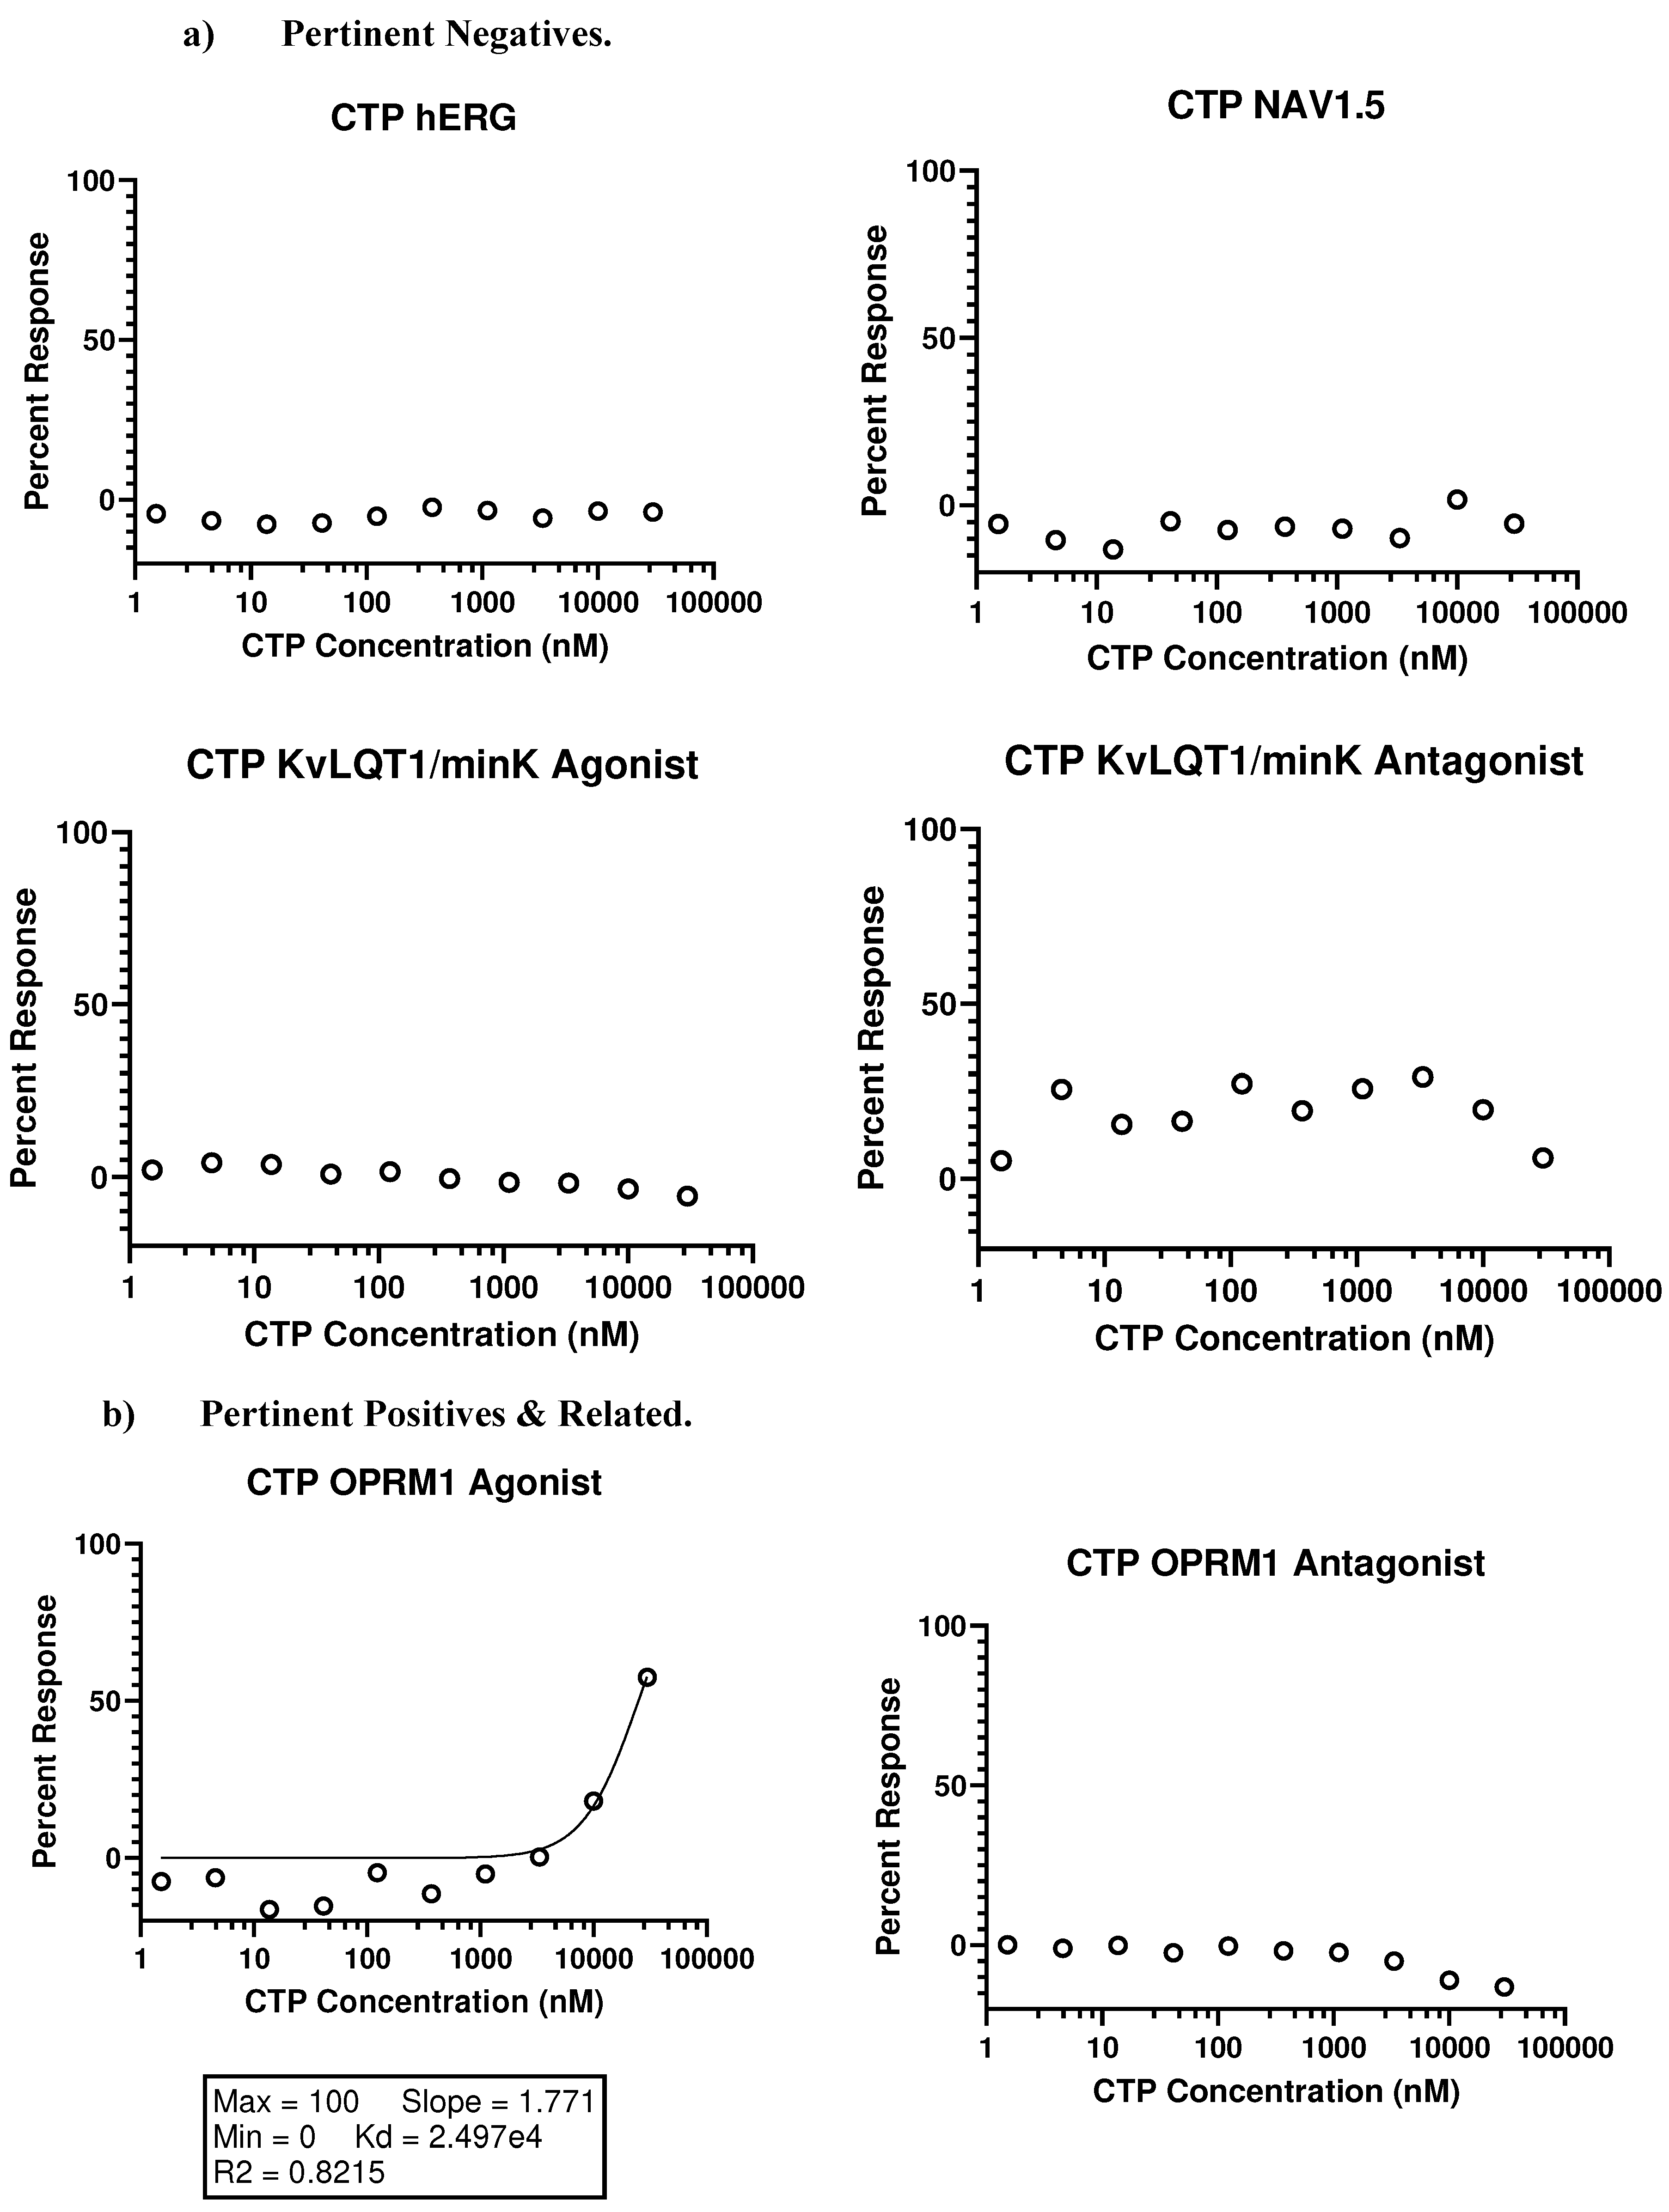
- In vivo studies
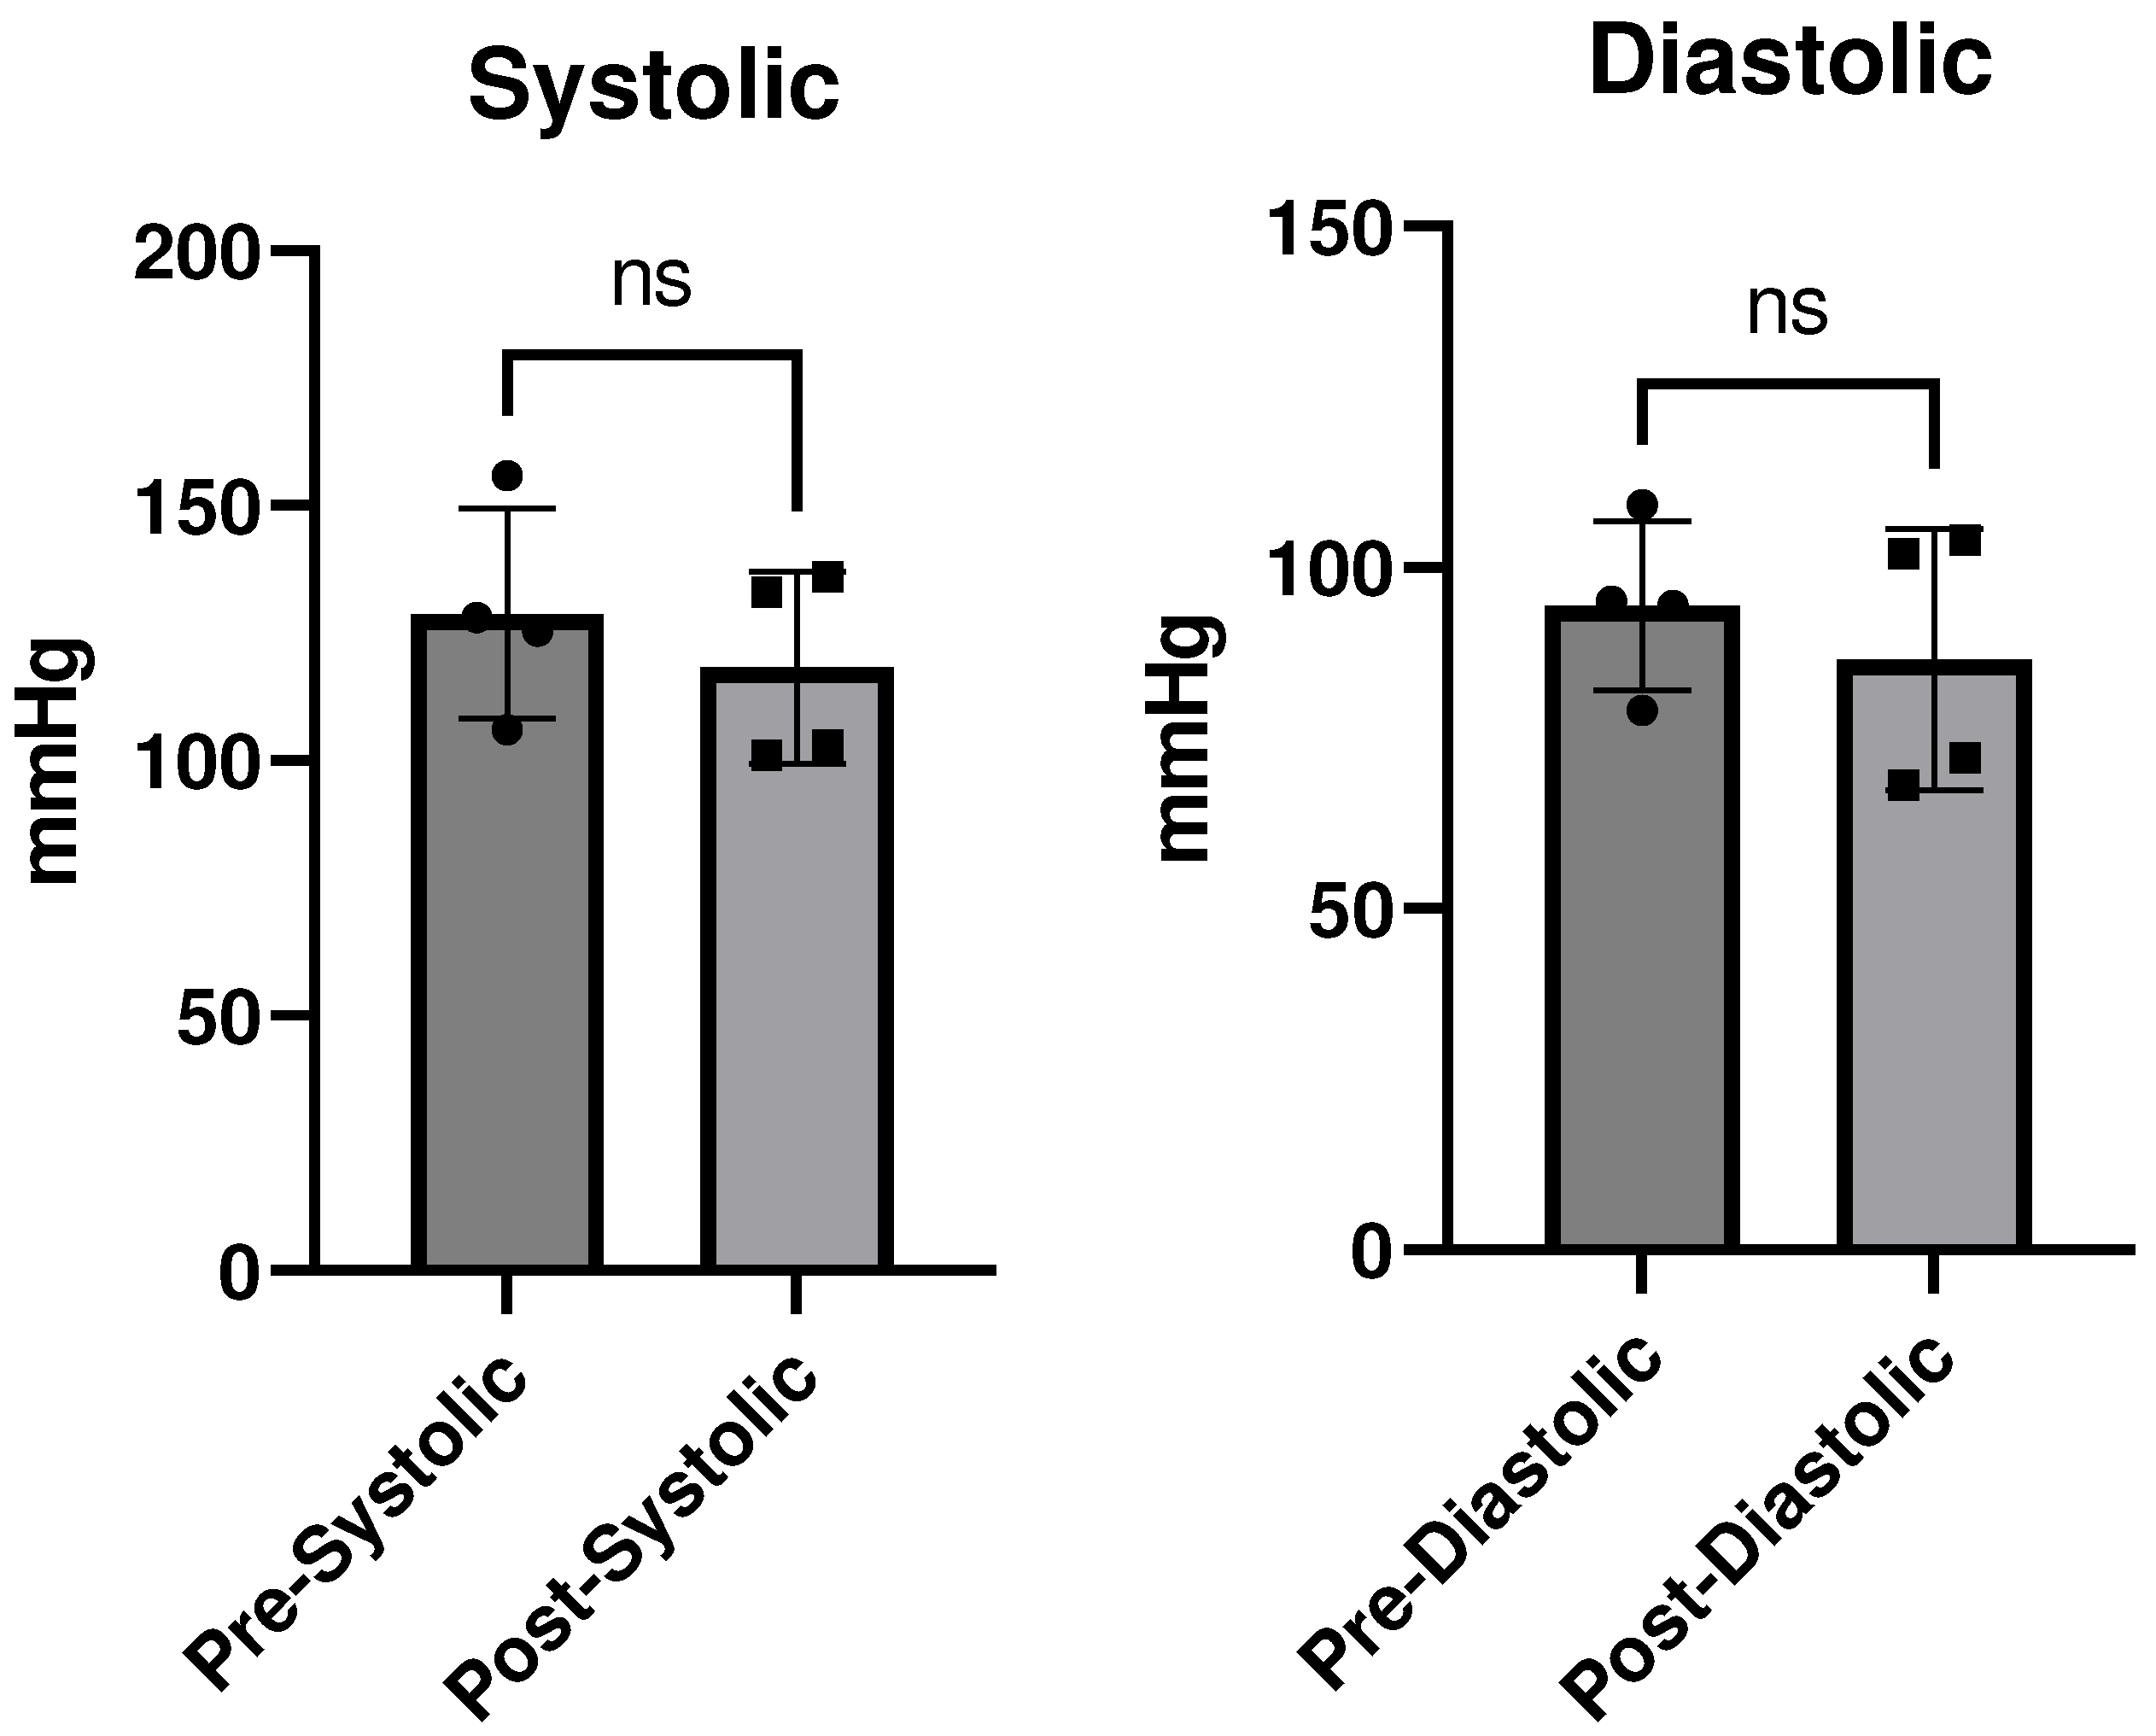
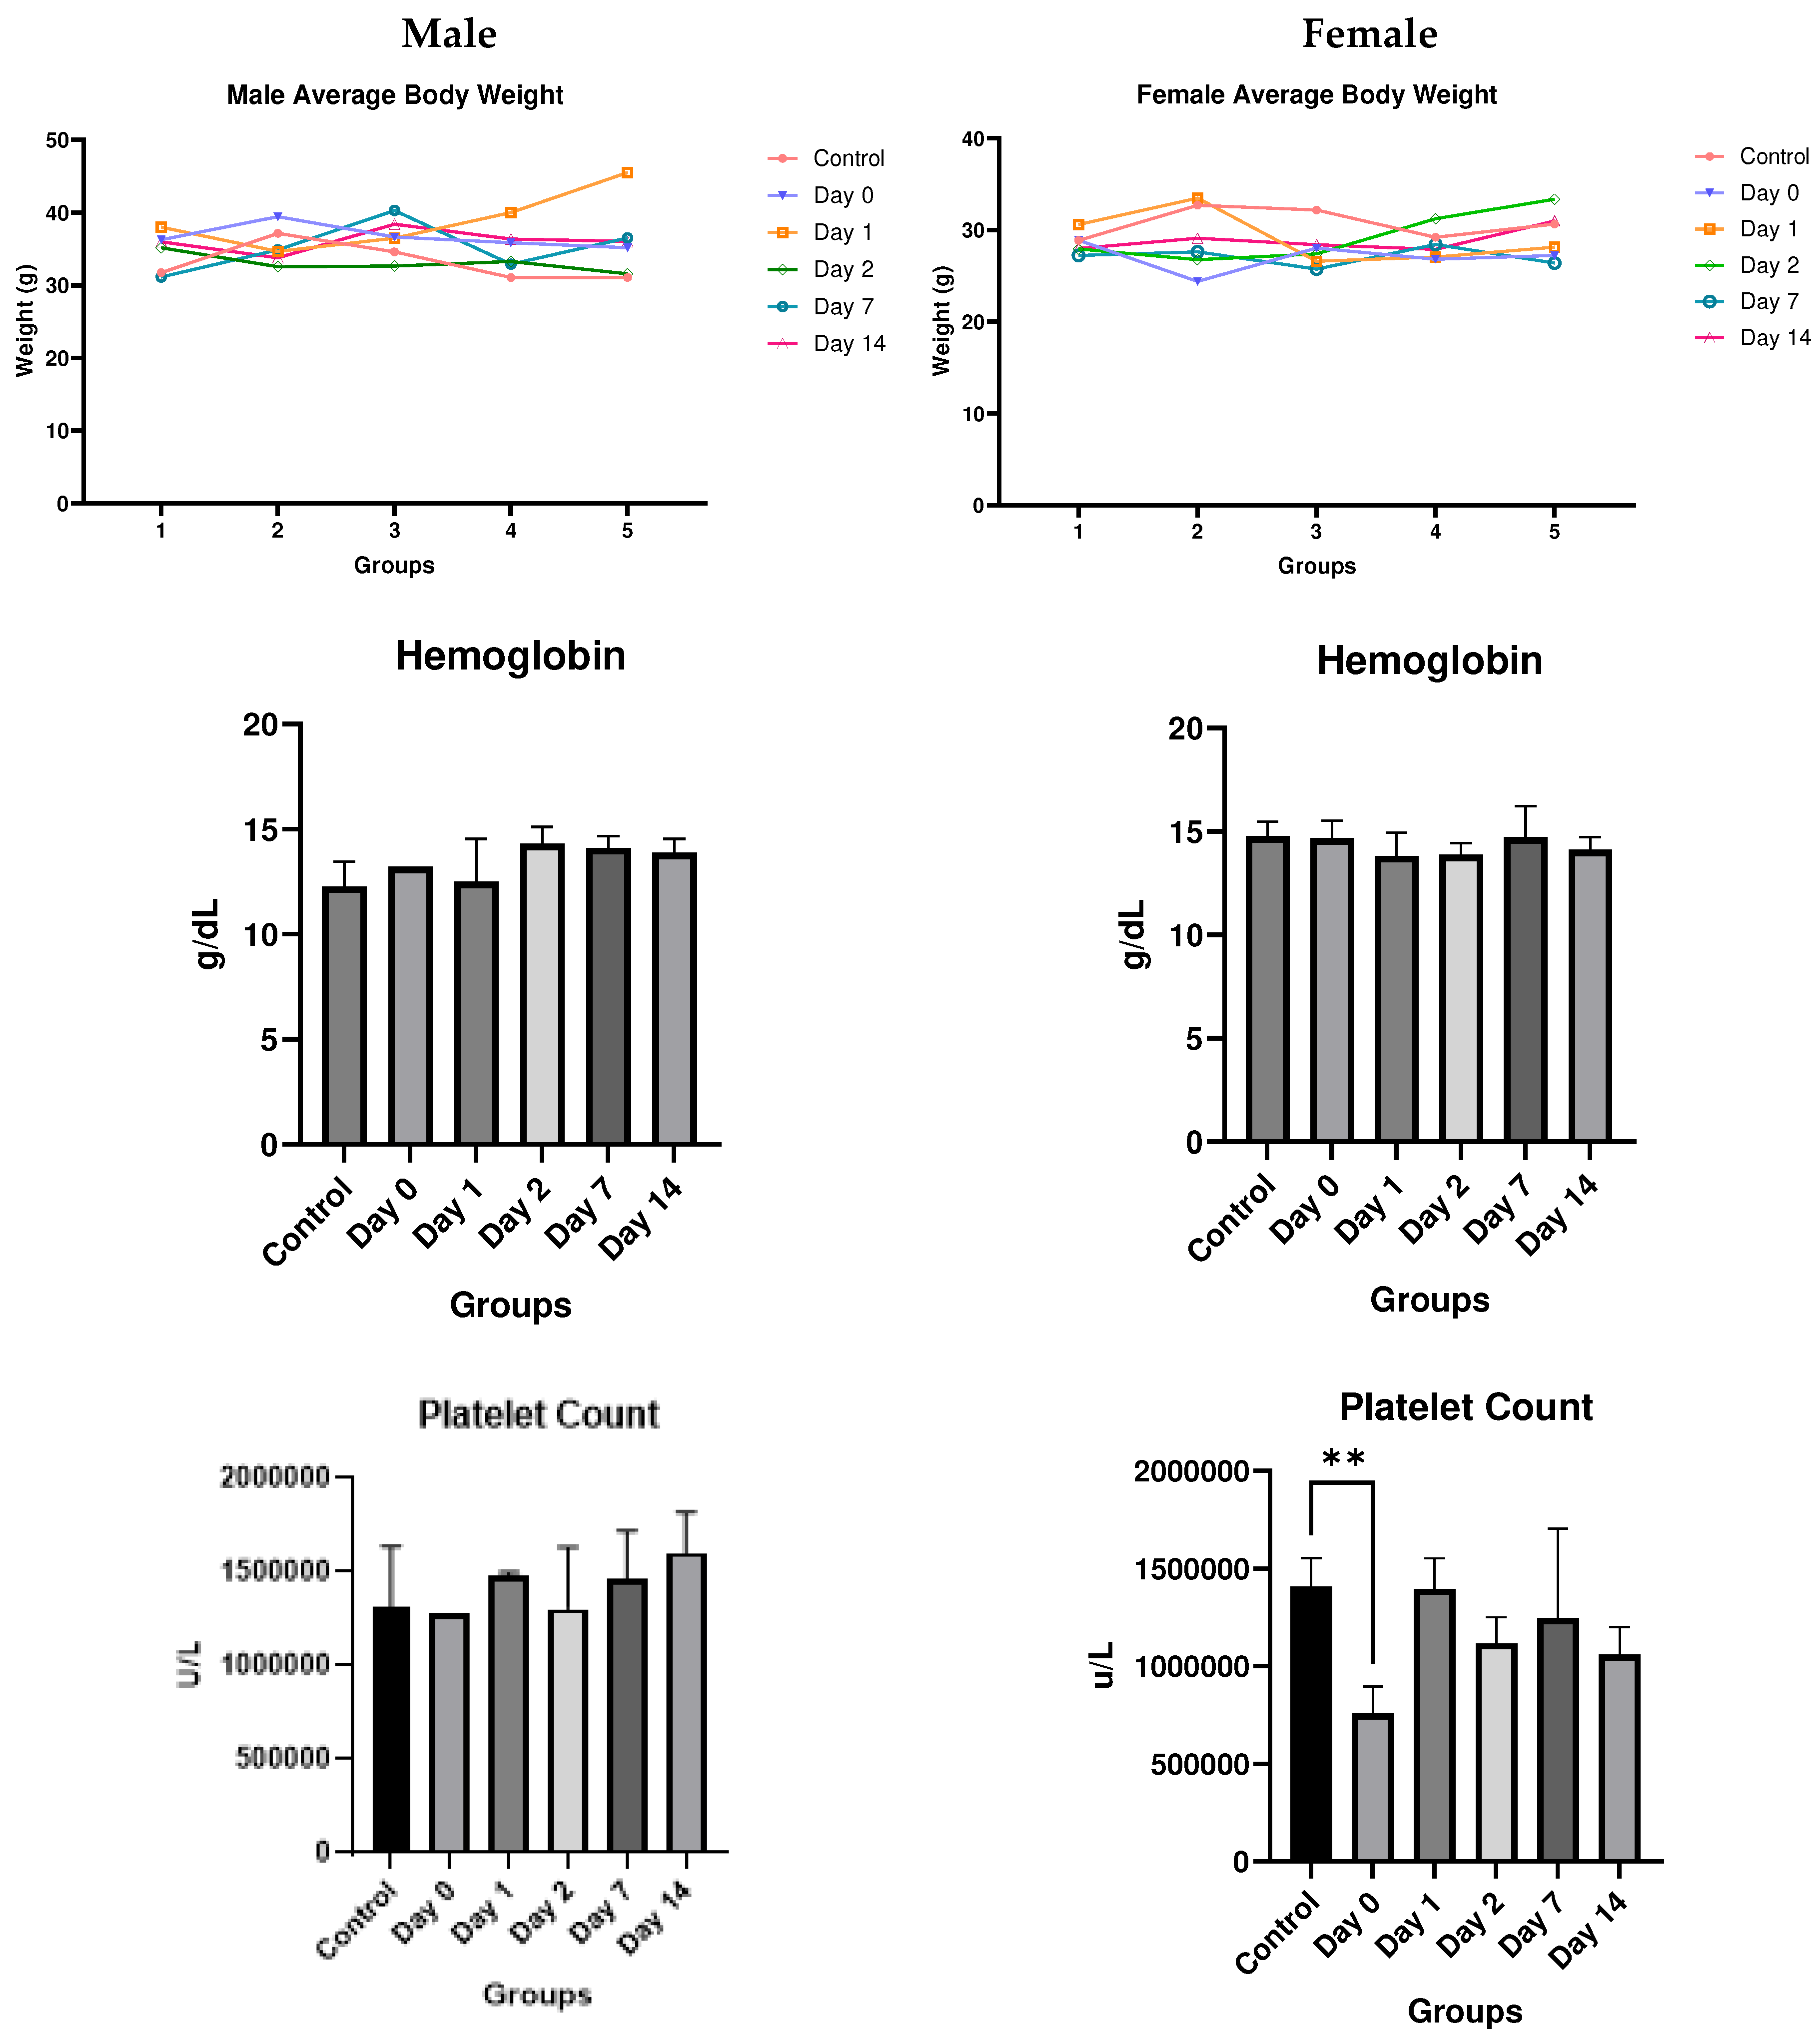
Discussion
Methods
In Vitro Studies
- Eurofins Ion Channel Cardiac Profiler Panel:
- Eurofins SAFETYscan E/IC50 ELECT Service:
In Vivo Studies
Conclusion
Supplemental Material Descriptions
Author Contributions
Funding
Conflict of Interest:
References
- Derakhshankhah, H.; Jafari, S. Cell penetrating peptides: A concise review with emphasis on biomedical applications. Biomed Pharmacother 2018, 108, 1090–1096. [Google Scholar] [CrossRef]
- Frankel, A.D.; Pabo, C.O. Cellular uptake of the tat protein from human immunodeficiency virus. Cell 1988, 55, 1189–1193. [Google Scholar] [CrossRef]
- Green, M.; Loewenstein, P.M. Autonomous functional domains of chemically synthesized human immunodeficiency virus tat trans-activator protein. Cell 1988, 55, 1179–1188. [Google Scholar] [CrossRef]
- Zahid, M.; Phillips, B.E.; Albers, S.M.; Giannoukakis, N.; Watkins, S.C.; Robbins, P.D. Identification of a cardiac specific protein transduction domain by in vivo biopanning using a M13 phage peptide display library in mice. PLoS One 2010, 5, e12252. [Google Scholar] [CrossRef]
- Pasqualini, R.; Koivunen, E.; Ruoslahti, E. A peptide isolated from phage display libraries is a structural and functional mimic of an RGD-binding site on integrins. J Cell Biol 1995, 130, 1189–1196. [Google Scholar] [CrossRef]
- Rajotte, D.; Arap, W.; Hagedorn, M.; Koivunen, E.; Pasqualini, R.; Ruoslahti, E. Molecular heterogeneity of the vascular endothelium revealed by in vivo phage display. J Clin Invest 1998, 102, 430–437. [Google Scholar] [CrossRef]
- Arap, W.; Pasqualini, R.; Ruoslahti, E. Cancer treatment by targeted drug delivery to tumor vasculature in a mouse model. Science 1998, 279, 377–380. [Google Scholar] [CrossRef]
- Zahid, M.; Robbins, P.D. Protein transduction domains: applications for molecular medicine. Curr Gene Ther 2012, 12, 374–380. [Google Scholar] [CrossRef]
- Zahid, M.; Feldman, K.S.; Garcia-Borrero, G.; Feinstein, T.N.; Pogodzinski, N.; Xu, X.; Yurko, R.; Czachowski, M.; Wu, Y.L.; Mason, N.S.; et al. Cardiac Targeting Peptide, a Novel Cardiac Vector: Studies in Bio-Distribution, Imaging Application, and Mechanism of Transduction. Biomolecules 2018, 8. [Google Scholar] [CrossRef]
- Ahmad, F.B.; Anderson, R.N. The Leading Causes of Death in the US for 2020. JAMA 2021, 325, 1829–1830. [Google Scholar] [CrossRef]
- Pandey, M.; Gundam, S.R.; Bansal, A.; Kethamreddy, M.; Lowe, V.; Zahid, M. Synthesis and evaluation of novel [68Ga]Ga-NOTA-CTP in normal CD-1 mice as a myocardial perfusion imaging PET probe. Journal of Nuclear Medicine 2023, 64, P1066–P1066. [Google Scholar]
- Kim, H.; Mun, D.; Kang, J.Y.; Lee, S.H.; Yun, N.; Joung, B. Improved cardiac-specific delivery of RAGE siRNA within small extracellular vesicles engineered to express intense cardiac targeting peptide attenuates myocarditis. Mol Ther Nucleic Acids 2021, 24, 1024–1032. [Google Scholar] [CrossRef]
- Avula, U.M.; Yoon, H.K.; Lee, C.H.; Kaur, K.; Ramirez, R.J.; Takemoto, Y.; Ennis, S.R.; Morady, F.; Herron, T.; Berenfeld, O.; et al. Cell-selective arrhythmia ablation for photomodulation of heart rhythm. Sci Transl Med 2015, 7, 311ra172. [Google Scholar] [CrossRef]
- Gallicano, G.I.; Fu, J.; Mahapatra, S.; Sharma, M.V.R.; Dillon, C.; Deng, C.; Zahid, M. Reversing Cardiac Hypertrophy at the Source Using a Cardiac Targeting Peptide Linked to miRNA106a: Targeting Genes That Cause Cardiac Hypertrophy. Pharmaceuticals (Basel) 2022, 15. [Google Scholar] [CrossRef]
- Yurko, R.; Islam, K.; Weber, B.; Salama, G.; Zahid, M. Conjugation of amiodarone to a novel cardiomyocyte cell penetrating peptide for potential targeted delivery to the heart. Front Chem 2023, 11, 1220573. [Google Scholar] [CrossRef]
- Zahid, M.; Weber, B.; Yurko, R.; Islam, K.; Agrawal, V.; Lopuszynski, J.; Yagi, H.; Salama, G. Cardiomyocyte-Targeting Peptide to Deliver Amiodarone. Pharmaceutics 2023, 15. [Google Scholar] [CrossRef]
- Janssen, B.J.; Smits, J.F. Autonomic control of blood pressure in mice: basic physiology and effects of genetic modification. Am J Physiol Regul Integr Comp Physiol 2002, 282, R1545–1564. [Google Scholar] [CrossRef]
- Schwarze, S.R.; Ho, A.; Vocero-Akbani, A.; Dowdy, S.F. In vivo protein transduction: delivery of a biologically active protein into the mouse. Science 1999, 285, 1569–1572. [Google Scholar] [CrossRef]
- Manosroi, J.; Lohcharoenkal, W.; Gotz, F.; Werner, R.G.; Manosroi, W.; Manosroi, A. Transdermal absorption and stability enhancement of salmon calcitonin by Tat peptide. Drug Dev Ind Pharm 2013, 39, 520–525. [Google Scholar] [CrossRef]
- Nguyen, T.V.; Lee, K.H.; Huang, Y.; Shin, M.C.; Park, Y.S.; Kim, H.; Moon, C. Topical Delivery of Cell-Penetrating Peptide-Modified Human Growth Hormone for Enhanced Wound Healing. Pharmaceuticals (Basel) 2023, 16. [Google Scholar] [CrossRef]
- Chen, X.; Liu, S.; Rao, P.; Bradshaw, J.; Weller, R. Topical application of superoxide dismutase mediated by HIV-TAT peptide attenuates UVB-induced damages in human skin. Eur J Pharm Biopharm 2016, 107, 286–294. [Google Scholar] [CrossRef]
- Mailhiot, S.E.; Thompson, M.A.; Eguchi, A.E.; Dinkel, S.E.; Lotz, M.K.; Dowdy, S.F.; June, R.K. The TAT Protein Transduction Domain as an Intra-Articular Drug Delivery Technology. Cartilage 2021, 13, 1637S–1645S. [Google Scholar] [CrossRef]
- Huang, J.; Zhang, Y.; Lin, T.; Yin, H.; Pan, Y.; Zhu, M.; Zhang, M. A cell-permeable peptide inhibitor of p55PIK signaling alleviates suture-induced corneal neovascularization and inflammation. Heliyon 2023, 9, e14869. [Google Scholar] [CrossRef]
- Ozaki, T.; Nakazawa, M.; Yamashita, T.; Sorimachi, H.; Hata, S.; Tomita, H.; Isago, H.; Baba, A.; Ishiguro, S. Intravitreal injection or topical eye-drop application of a mu-calpain C2L domain peptide protects against photoreceptor cell death in Royal College of Surgeons' rats, a model of retinitis pigmentosa. Biochim Biophys Acta 2012, 1822, 1783–1795. [Google Scholar] [CrossRef]
- Sanchez-Lopez, E.; Gomara, M.J.; Haro, I. Atorvastatin-loaded peptide amphiphiles against corneal neovascularization. Nanomedicine (Lond) 2023, 18, 1095–1108. [Google Scholar] [CrossRef]
- Olson, E.S.; Aguilera, T.A.; Jiang, T.; Ellies, L.G.; Nguyen, Q.T.; Wong, E.H.; Gross, L.A.; Tsien, R.Y. In vivo characterization of activatable cell penetrating peptides for targeting protease activity in cancer. Integr Biol (Camb) 2009, 1, 382–393. [Google Scholar] [CrossRef]
- Whitney, M.; Crisp, J.L.; Olson, E.S.; Aguilera, T.A.; Gross, L.A.; Ellies, L.G.; Tsien, R.Y. Parallel in vivo and in vitro selection using phage display identifies protease-dependent tumor-targeting peptides. J Biol Chem 2010, 285, 22532–22541. [Google Scholar] [CrossRef]
- Koivunen, E.; Arap, W.; Valtanen, H.; Rainisalo, A.; Medina, O.P.; Heikkila, P.; Kantor, C.; Gahmberg, C.G.; Salo, T.; Konttinen, Y.T.; et al. Tumor targeting with a selective gelatinase inhibitor. Nat Biotechnol 1999, 17, 768–774. [Google Scholar] [CrossRef]
- Pasqualini, R.; Ruoslahti, E. Organ targeting in vivo using phage display peptide libraries. Nature 1996, 380, 364–366. [Google Scholar] [CrossRef]
- Jones, S.W.; Christison, R.; Bundell, K.; Voyce, C.J.; Brockbank, S.M.; Newham, P.; Lindsay, M.A. Characterisation of cell-penetrating peptide-mediated peptide delivery. Br J Pharmacol 2005, 145, 1093–1102. [Google Scholar] [CrossRef]
- Patel, S.G.; Sayers, E.J.; He, L.; Narayan, R.; Williams, T.L.; Mills, E.M.; Allemann, R.K.; Luk, L.Y.P.; Jones, A.T.; Tsai, Y.H. Cell-penetrating peptide sequence and modification dependent uptake and subcellular distribution of green florescent protein in different cell lines. Sci Rep 2019, 9, 6298. [Google Scholar] [CrossRef]
- Hoffmann, K.; Milech, N.; Juraja, S.M.; Cunningham, P.T.; Stone, S.R.; Francis, R.W.; Anastasas, M.; Hall, C.M.; Heinrich, T.; Bogdawa, H.M.; et al. A platform for discovery of functional cell-penetrating peptides for efficient multi-cargo intracellular delivery. Sci Rep 2018, 8, 12538. [Google Scholar] [CrossRef]
- Saar, K.; Lindgren, M.; Hansen, M.; Eiriksdottir, E.; Jiang, Y.; Rosenthal-Aizman, K.; Sassian, M.; Langel, U. Cell-penetrating peptides: a comparative membrane toxicity study. Anal Biochem 2005, 345, 55–65. [Google Scholar] [CrossRef]
- Suhorutsenko, J.; Oskolkov, N.; Arukuusk, P.; Kurrikoff, K.; Eriste, E.; Copolovici, D.M.; Langel, U. Cell-penetrating peptides, PepFects, show no evidence of toxicity and immunogenicity in vitro and in vivo. Bioconjug Chem 2011, 22, 2255–2262. [Google Scholar] [CrossRef]
- Kilk, K.; Mahlapuu, R.; Soomets, U.; Langel, U. Analysis of in vitro toxicity of five cell-penetrating peptides by metabolic profiling. Toxicology 2009, 265, 87–95. [Google Scholar] [CrossRef]
Disclaimer/Publisher’s Note: The statements, opinions and data contained in all publications are solely those of the individual author(s) and contributor(s) and not of MDPI and/or the editor(s). MDPI and/or the editor(s) disclaim responsibility for any injury to people or property resulting from any ideas, methods, instructions or products referred to in the content. |
© 2023 by the authors. Licensee MDPI, Basel, Switzerland. This article is an open access article distributed under the terms and conditions of the Creative Commons Attribution (CC BY) license (http://creativecommons.org/licenses/by/4.0/).


