Submitted:
24 November 2023
Posted:
25 November 2023
You are already at the latest version
Abstract
Keywords:
1. Introduction
2. Results and Discussions
3. Materials and Methods
4. Conclusions
Supplementary Materials
Author Contributions
Funding
Institutional Review Board Statement
Informed Consent Statement
Data Availability Statement
Conflicts of Interest
References
- Li, C.X.; Lin, J. Rare Earth Fluoride Nano-/Microcrystals: Synthesis, Surface Modification and Application. J. Mater. Chem. 2010, 20, 6831–6847. [Google Scholar] [CrossRef]
- Gong, G.; Song, Y.; Tan, H.H.; Xie, S.W.; Zhang, C.F.; Xu, L.J.; Xu, J.X.; Zheng, J. Design of Core/Active-Shell NaYF4:Ln3+@NaYF4:Yb3+ Nanophosphors with Enhanced Red-Green-Blue Upconversion Luminescence for Anti-Counterfeiting Printing. Compos. Pt. B-Eng. 2019, 179, 107504. [Google Scholar] [CrossRef]
- Liu, Y.; Su, Q.Q.; Zou, X.M.; Chen, M.; Feng, W.; Shi, Y.B.; Li, F.Y. Near-Infrared in Vivo Bioimaging Using a Molecular Upconversion Probe. Chem. Commun. 2016, 52, 7466–7469. [Google Scholar] [CrossRef] [PubMed]
- Guan, Y.L.; Qu, S.N.; Li, B.; Zhang, L.M.; Ma, H.P.; Zhang, L.G. Ratiometric Fluorescent Nanosensors for Selective Detecting Cysteine with Upconversion Luminescence. Biosens. Bioelectron. 2016, 77, 124–130. [Google Scholar] [CrossRef] [PubMed]
- Liu, Y.W.; Yin, X.M.; Zhao, H.Z.; Shu, W.; Xin, F.Y.; Wang, H.; Luo, X.X.; Gong, N.; Xue, X.H.; Pang, Q.; Xing, M.M.; Tian, Y. Near-Infrared-Emitting Upconverting BiVO4 Nanoprobes for in Vivo Fluorescent Imaging. Spectroc. Acta Pt. A-Molec. Biomolec. Spectr. 2022, 270, 120811. [Google Scholar] [CrossRef] [PubMed]
- Chan, E.M.; Han, G.; Goldberg, J.D.; Gargas, D.J.; Ostrowski, A.D.; Schuck, P.J.; Cohen, B.E.; Milliron, D.J. Combinatorial Discovery of Lanthanide-Doped Nanocrystals with Spectrally Pure Upconverted Emission. Nano Lett. 2012, 12, 3839–3845. [Google Scholar] [CrossRef] [PubMed]
- Wang, H.B.; Lu, W.; Yi, Z.G.; Rao, L.; Zeng, S.J.; Li, Z. Enhanced Upconversion Luminescence and Single-Band Red Emission of NaErF4 Nanocrystals via Mn2+ Doping. J. Alloy. Compd. 2015, 618, 776–780. [Google Scholar] [CrossRef]
- Osseni, S.A.; Lechevallier, S.; Verelst, M.; Perriat, P.; Dexpert-Ghys, J.; Neumeyer, D.; Garcia, R.; Mayer, F.; Djanashvili, K.; Peters, J.A.; Magdeleine, E.; Gros-Dagnac, H.; Celsis, P.; Mauricot, R. Gadolinium Oxysulfide Nanoparticles as Multimodal Imaging Agents for T2-Weighted MR, X-Ray Tomography and Photoluminescence. Nanoscale 2014, 6, 555–564. [Google Scholar] [CrossRef]
- Pei, Y.B.; Wei, M.Y.; Cheng, B.B.; Liu, Y.; Xie, Z.W.; Nguyen, K.; Yuan, B.H. High Resolution Imaging Beyond the Acoustic Diffraction Limit in Deep Tissue via Ultrasound-Switchable NIR Fluorescence. Sci Rep 2014, 4, 4690. [Google Scholar] [CrossRef]
- Zeng, S.J.; Yi, Z.G.; Lu, W.; Qian, C.; Wang, H.B.; Rao, L.; Zeng, T.M.; Liu, H.R.; Liu, H.J.; Fei, B.; Hao, J.H. Simultaneous Realization of Phase/Size Manipulation, Upconversion Luminescence Enhancement, and Blood Vessel Imaging in Multifunctional Nanoprobes through Transition Metal Mn2+ Doping. Adv. Funct. Mater. 2014, 24, 4051–4059. [Google Scholar] [CrossRef]
- Li, X.X.; Liu, L.; Fu, Y.; Chen, H.D.; Abualrejal, M.M.A.; Zhang, H.; Wang, Z.X.; Zhang, H.M. Peptide-Enhanced Tumor Accumulation of Upconversion Nanoparticles for Sensitive Upconversion Luminescence/Magnetic Resonance Dual-Mode Bioimaging of Colorectal Tumors. Acta Biomater. 2020, 104, 167–175. [Google Scholar] [CrossRef]
- Tian, G.; Gu, Z.J.; Zhou, L.J.; Yin, W.Y.; Liu, X.X.; Yan, L.; Jin, S.; Ren, W.L.; Xing, G.M.; Li, S.J.; Zhao, Y.L. Mn2+ Dopant-Controlled Synthesis of NaYF4:Yb/Er Upconversion Nanoparticles for in Vivo Imaging and Drug Delivery. Adv. Mater. 2012, 24, 1226–1231. [Google Scholar] [CrossRef] [PubMed]
- Wang, F.; Liu, X.G. Recent Advances in the Chemistry of Lanthanide-Doped Upconversion Nanocrystals. Chem. Soc. Rev. 2009, 38, 976–989. [Google Scholar] [CrossRef] [PubMed]
- Hu, J.S.; Wang, R.N.; Wei, Z.Q.; Wu, X.; Wang, F.Y.; Liu, L.X.; Li, Y.Z.; Fu, H.; Xu, Q.H. Strong Red Upconversion Luminescence and Optical Thermometry of Yb3+/Er3+ Co-Doped β-Ba2ScAlO5 Phosphor. J. Alloy. Compd. 2022, 895, 162692. [Google Scholar] [CrossRef]
- Xu, D.K.; Xie, F.Y.; Yao, L.; Li, Y.J.; Lin, H.; Li, A.M.; Yang, S.H.; Zhong, S.L.; Zhang, Y.L. Enhancing Upconversion Luminescence of Highly Doped Lanthanide Nanoparticles through Phase Transition Delay. J. Alloy. Compd. 2020, 815, 152622. [Google Scholar] [CrossRef]
- Berry, M.T.; May, P.S. Disputed Mechanism for NIR-to-Red Upconversion Luminescence in NaYF4:Yb3+,Er3+. J. Phys. Chem. A 2015, 119, 9805–9811. [Google Scholar] [CrossRef]
- Haase, M.; Schafer, H. Upconverting Nanoparticles. Angew. Chem.-Int. Edit. 2011, 50, 5808–5829. [Google Scholar] [CrossRef]
- Liu, L.; Wang, S.F.; Zhao, B.Z.; Pei, P.; Fan, Y.; Li, X.M.; Zhang, F. Er3+ Sensitized 1530 nm to 1180 nm Second Near-Infrared Window Upconversion Nanocrystals for in Vivo Biosensing. Angew. Chem.-Int. Edit. 2018, 57, 7518–7522. [Google Scholar] [CrossRef] [PubMed]
- Saha, S.; Pala, R.G.S.; Siyakumar, S. Catalyzing Cubic-to-Hexagonal Phase Transition in NaYF4 via Ligand Enhanced Surface Ordering. Cryst. Growth Des. 2018, 18, 5080–5088. [Google Scholar] [CrossRef]
- Shang, Y.F.; Hao, S.W.; Lv, W.Q.; Chen, T.; Tian, L.; Lei, Z.T.; Yang, C.H. Confining Excitation Energy of Er3+-Sensitized Upconversion Nanoparticles through Introducing Various Energy Trapping Centers. J. Mater. Chem. C 2018, 6, 3869–3875. [Google Scholar] [CrossRef]
- Yin, X.M.; Wang, H.; Tian, Y.; Xing, M.M.; Fu, Y.; Luo, X.X. Three Primary Color Emissions from Single Multilayered Nanocrystals. Nanoscale 2018, 10, 9673–9678. [Google Scholar] [CrossRef] [PubMed]
- Zhao, X.; Zhang, L.; Yan, X.; Zhang, L.; Lu, Y.; Pan, J.L.; Zhang, M.L.; Wang, C.G.; Suo, H.; Jia, X.T.; Liu, X.M.; Lu, G.Y. A Near-Infrared Light Triggered Fluormetric Biosensor for Sensitive Detection of Acetylcholinesterase Activity Based on NaErF4:0.5%Ho3+@NaYF4 Upconversion Nano-Probe. Talanta 2021, 235, 122784. [Google Scholar] [CrossRef] [PubMed]
- Wang, H.; He, Z.; Cai, K.; Wei, L.M.; Xu, Y.; Fu, Y.; Xing, M.M.; Tian, Y. Designing Er3+ Single-Doped Ternary Sulfide for Highly Efficient Upconversion Luminescence under 1550 nm Excitation. Chem. Eng. J. 2023, 468, 143558. [Google Scholar] [CrossRef]
- Fábry, J.; Havlák, L.; Kuceráková, M.; Dusek, M. Redetermination of NaGdS2, NaLuS2 and NaYS2. Acta Crystallogr. Sect. C-Struct. Chem. 2014, 70, 533–535. [Google Scholar] [CrossRef]
- Wu, H.; Hao, Z.D.; Zhang, L.L.; Zhang, X.; Xiao, Y.; Pan, G.H.; Wu, H.J.; Luo, Y.S.; Zhang, L.G.; Zhang, J.H. Er3+/Yb3+ Codoped Phosphor Ba3Y4O9 with Intense Red Upconversion Emission and Optical Temperature Sensing Behavior. J. Mater. Chem. C 2018, 6, 3459–3467. [Google Scholar] [CrossRef]
- Yin, X.M.; Xu, W.; Zhu, G.; Ji, Y.A.; Xiao, Q.; Dong, X.Y.; He, M.; Cao, B.S.; Zhou, N.; Luo, X.X.; Guo, L.; Bin, D. Towards Highly Efficient NIR II Response Up-Conversion Phosphor Enabled by Long Lifetimes of Er3+. Nat. Commun. 2022, 13, 6549. [Google Scholar] [CrossRef] [PubMed]
- Brüesch, P.; Schüler, C. Raman and Infrared Spectra of Crystals with α-NaFeO2 Structure. J. Phys. Chem. Solids 1971, 32, 1025–1038. [Google Scholar] [CrossRef]
- Jary, V.; Havlak, L.; Barta, J.; Buryi, M.; Mihokova, E.; Rejman, M.; Laguta, V.; Nikl, M. Optical, Structural and Paramagnetic Properties of Eu-Doped Ternary Sulfides ALnS2 (A = Na, K, Rb; Ln = La, Gd, Lu, Y). Materials 2015, 8, 6978–6998. [Google Scholar] [CrossRef]
- Gerner, P.; Gudel, H.U. Absorption and Upconversion Light Emission Properties of Er3+ and Yb3+/Er3+ Codoped NaYS2. Chem. Phys. Lett. 2005, 413, 105–109. [Google Scholar] [CrossRef]


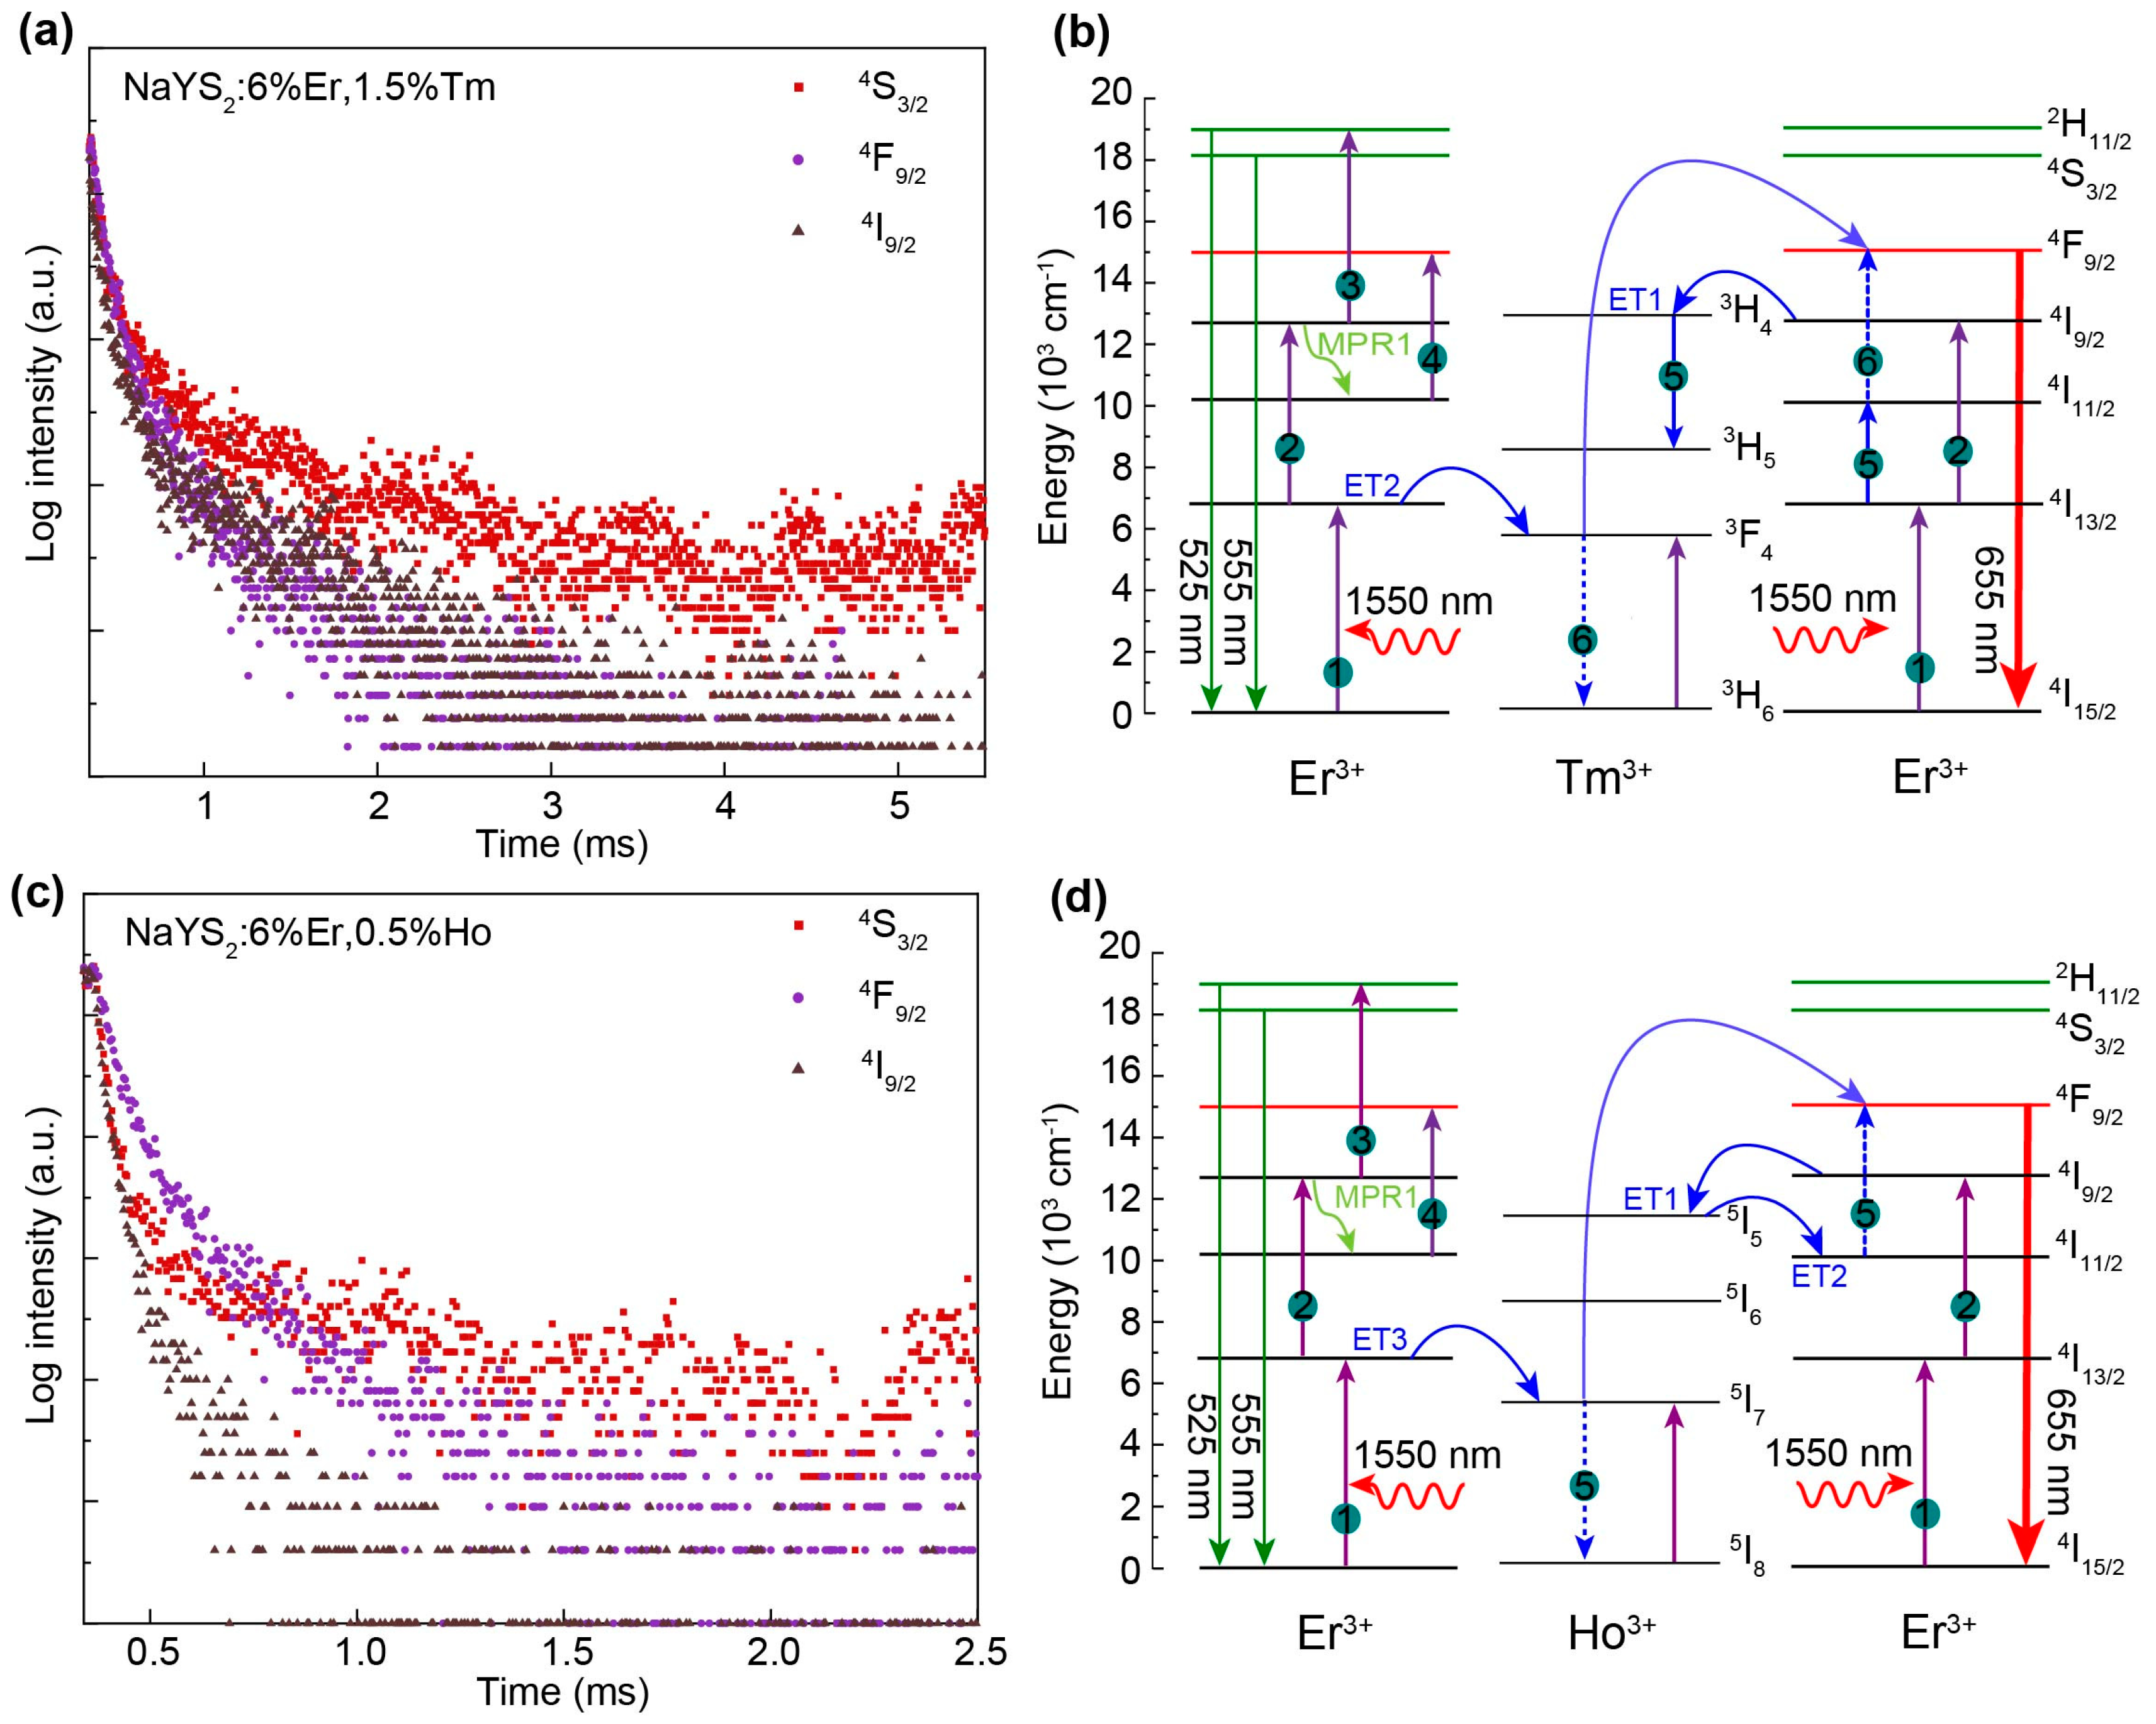
| Energy levels (nm) | NaYS2:Er3+(μs) | NaYS2:Er3+,Tm3+ (μs) | NaYS2:Er3+,Ho3+ (μs) |
|---|---|---|---|
| 555 (4S3/2) | 2173 | 465 | 466 |
| 655 (4F9/2) | 1346 | 481 | 347 |
| 800 (4I9/2) | 3432 | 636 | 423 |
Disclaimer/Publisher’s Note: The statements, opinions and data contained in all publications are solely those of the individual author(s) and contributor(s) and not of MDPI and/or the editor(s). MDPI and/or the editor(s) disclaim responsibility for any injury to people or property resulting from any ideas, methods, instructions or products referred to in the content. |
© 2023 by the authors. Licensee MDPI, Basel, Switzerland. This article is an open access article distributed under the terms and conditions of the Creative Commons Attribution (CC BY) license (http://creativecommons.org/licenses/by/4.0/).


