Preprint
Article

Asymmetry of Motifs Conservation within Homotypic Composite Elements Differentiates DNA-Binding Domains of Target Transcription Factors in ChIP-Seq Data

Altmetrics

Downloads

134

Views

100

Comments

0

Submitted:

24 November 2023

Posted:

27 November 2023

You are already at the latest version

Alerts
Abstract
(1) Background: Transcription factors (TFs) are main regulators of eukaryotic gene expression. The cooperative binding of at least two TFs to genomic DNA is the widespread mechanism of transcription regulation. Massive analysis of co-occurrence of overrepresented pairs of motifs (composite elements, CEs) for different target TFs studied in ChIP-seq experiments can clarify the mechanisms of TF cooperation. (2) Methods: We focused on homotypic CEs representing the same motif models and considered only CEs with spacers. We improved the capability of the Motifs Co-Occurrence Tool (MCOT) to predict asymmetric homotypic CEs in which one of par-ticipating motifs has higher conservation than the other. We categorized the target TFs from the data of M. musculus ChIP-seq and A. thaliana ChIP-seq/DAP-seq according to the structure of DNA-binding domains (DBDs) into classes. (3) Results: For all TF classes the predominance of asymmetric CEs over both symmetric and those with no enrichment in both directions was re-vealed. Target TFs from classes Basic helix-loop-helix factors (bHLH) and Basic leucine zipper factors (bZIP) showed the highest fractions of datasets with asymmetric CEs. We showed that pioneer TFs, despite their DBD types, have a higher significance of asymmetry within homotyp-ic CEs compared to other TFs. (4) Conclusion: Asymmetry within homotypic CEs is a promising new feature decrypting the mechanisms of gene transcription regulation.
Keywords: 
Subject: Biology and Life Sciences  -   Biochemistry and Molecular Biology

1. Introduction

Transcription factors (TFs) are crucial proteins with sequence-specific DNA binding activity allowing them to regulate the transcription of target genes. Regulatory elements that have functional TF binding activity are called TF binding sites (TFBSs). Common patterns in DNA that are thought to have this activity for certain TFs are called motifs. Currently, the most popular straightforward approach to deduce the context specificity of TFBS motifs for particular tissue-/cell line/stage-specific conditions in vivo is the chromatin immunoprecipitation (ChIP) based high throughput experiment ChIP-seq producing hundreds of binding loci (or peaks) for a given target TF [1,2]. Although this breakthrough approach has been widely used over the past 15 years [3], it still remains quite expensive and can be technically challenging for many TFs. To overcome these issues, and to map TFBS motifs in whole genomes directly, in vitro technology DAP-seq has been developed [4,5].
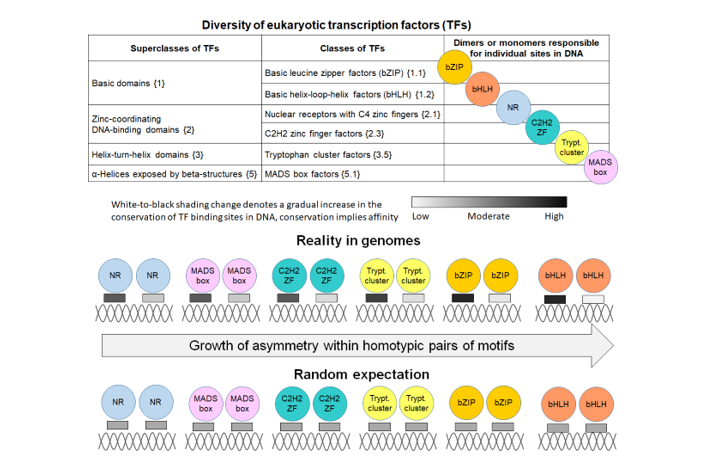
A stable framework for the systematic massive analysis of TFBS is the expandable hierarchical classification of TFs according to the structure of their DNA-binding domains (DBDs) (TFClass database, [6,7,8,9]). This framework has been consistently applied for mammals [7,8,9], and then for other eukaryotic taxa [10], including plants (Plant-TFClass database, [11]). The first level of the hierarchy consists of the nine distinct superclasses of TFs. They are distinguished according to the general topology of DBDs. At the second level, TF classes imply structural and sequence similarities in the DBDs of TFs. The third level of TF families relies on sequence similarities in the DBDs of TFs. For many lineages of eukaryotes, structurally similar TFs often are very conservative [12]. To date, no new superclasses have been identified in plant TFs compared to those found previously in mammals, and numerous TF classes are common to plants and mammals [11]. Here and below, we use the notations from the TFClass database [6,7,8,9]. Namely, for a superclass, the digit from 0 to 9 in curly brackets denotes its ordinal number, and for a class two digits separated by a dot mean the corresponding number of the parent superclass and the ordinal number of the class in the superclass. For instance, the first superclass Basic domain {1} contains the first class Basic leucine zipper factors (bZIP) {1.1}.
In eukaryotes, TFs generally function as part of multiprotein complexes. The tissue- and developmental stage-specific regulation of gene transcription is largely achieved through the inherently combinatorial binding and functions of multiple TFs [13,14,15]. Therefore, a mixture of binding sites assigned to either a target TF or to possible collaborative TFs and, moreover, possibly having various affinity, is critical to explain TF binding specificity in vivo [15,16]. Consequently, the ChIP-seq technology not only can find the major context specific pattern of a target TF, which is encoded as its most enriched motif; in addition, the analysis of co-occurring motifs can shed light on the cooperation of a target TF and possible collaborative TFs specific for given in vivo conditions. For example, the propensity to interact with closed chromatin is a particular feature of a special group of TFs, the pioneer TF [17,18,19,20]. Hence, pioneer and other TFs lacking pioneer function should bind cooperatively to DNA.
To unravel the intricate structure of the motifs grammar in the regulatory regions of genes, the term composite element (CE) is used as a simplest unit of the second level hierarchy above the first level of individual TFBS motifs. A CE is a pair of motifs of two TFs that co-occur more often than expected by chance close to each other in genomic DNA. Conventionally, three attributes of CEs have been considered [21,22,23,24,25]. Since ChIP-seq or other similar data have been used to detect and analyze CEs, each СE contains at least one motif of a target TF from the corresponding ChIP-seq experiment (Anchor motif). The second motif of CE represents either the same or distinct motif model. Therefore, the first attribute of CE defines it either as homotypic or heterotypic CEs. The former corresponds to two identical or structurally similar TFs, the latter implies two structurally distinct TFs, representing a pair of Anchor and Partner motifs. The second and third attributes are the reciprocal orientation and positioning of motifs. The orientation types include the head-to-tail case (Direct) with both motifs in the same DNA strand; the opposite strands of two motifs define the tail-to-tail (Invert) and head-to-head (Evert) cases. The positioning types discern CEs with an overlap of motifs and with a spacer. Finally, we earlier proposed the fourth attribute of CE [26], the presence or absence of systematic difference in the conservation of motifs within pairs, i.e. all CEs are divided into asymmetric and symmetric ones.
Numerous large-scale experimental and theoretical analyses have indicated that besides the evident exception of the class C2H2 zinc finger factors {2.3}, paralogous TFs from the same classes almost always have very similar DNA sequence preferences [10,12,16,27,28,29,30]. Therefore, in the present study we categorized homotypic CEs into classes of target TFs.
We recently proposed the Motifs Co-Occurrence Tool (MCOT) package for CEs prediction in ChIP-seq data [26,31,32]. Two particular features distinguish this approach from other similar tools [21,22,23,24,25]. First, it uses a single ChIP-seq dataset and detects both CEs with a spacer and with an overlap of motifs. Second, it applies several recognition thresholds for each motif within a CE; consequently, it differentiate asymmetric and symmetric CEs. For heterotypic CEs of Anchor and Partner TFs two motifs are certainly distinct, either an Anchor TF or Partner TF may have a more conservative motif. These two types of CEs are predominantly asymmetric. We have shown previously that CEs with more conserved Partner motifs are substantially more abundant compared to those with more conserved Anchor motifs; this phenomenon have been typical for the majority of tested target TFs [31]. Yet no one has tested whether the phenomenon of asymmetric CEs is also common for homotypic CEs.
The current study focuses on a massive analysis of ChIP-seq data to predict homotypic CEs with spacers and to test whether target TFs of certain classes show specificity to significant symmetry or asymmetry of motif conservation in homotypic CEs, or whether the real data show no significance in either direction. Notably, TFs from some classes, such as Basic leucine zipper factors (bZIP) {1.1} and Basic helix-loop-helix factors (bHLH) {1.2}, do not function as monomers. E.g., the degenerate motif of bHLH TFs, E-box CANNTG, already represents a TF dimer. However, pairs of E-box motifs implying a TF tetramer can form homotypic CEs [33]. There are no common rules even for the largest TF classes. For example, TFs of the NR (Nuclear receptors with C4 zinc fingers {2.1}) class, can function either as monomers, dimers, or multimers of several units arranged with various overlaps or spacers of different lengths [34,35]. Thus, CEs in DNA may correspond either TF dimers, or multimers with a greater number of subunits. To avoid issues with distinction between structurally variated homotypic CEs with an overlap of motifs, in this study we focused only on CEs with a spacer. We compiled for analysis the three benchmark collections: ChIP-seq data for M. musculus and A. thaliana, and DAP-seq data for A. thaliana.
Overall, our analysis showed that TFs from all classes tend to avoid significantly enriched symmetric homotypic CEs. Furthermore, we showed that the enrichment of the homotypic asymmetric CEs depends on the structural type of the DBD of a target TF. Among the large TF classes common for three benchmark collections, the classes of bHLH and bZIP TFs showed the highest significance of asymmetry within homotypic CEs. Thus, we have shown that different structural types of DBDs of target TFs are encoded in homotypic CEs that differ in the significance of enrichment of the asymmetry of motif conservation within their pairs.

2. Results

2.1. Definition and examples of asymmetry in the conservation of motifs within CEs

Here we develop an approach to reveal the asymmetry in the conservation of motifs within pairs of co-occurred motifs represented by the same motif models, i.e. homotypic CEs. We earlier proposed the MCOT software package for detection of spaced and overlapped pairs of co-occurred motifs for a single dataset of peaks [26,31,32]. The MCOT requires an input set of DNA sequences and a given motif of a target TF (Anchor) representing its DNA-binding specificity. Therefore, the abundance of homotypic CEs estimates the cooperative binding of a target TF. Although for ChIP-seq data, the context pattern of homotypic CEs may also be due to cooperative binding of a target TF with structurally similar partner TFs, since they possess similar DNA specificity. Here MCOT applies the traditional model of Position Weight Matrix (PWM) to recognize given motifs of target TFs.
Besides the classification of CEs by the orientation of participating motifs, MCOT categorized them into fully/partially overlapped and spaced. There are only three distinct orientations for homotypic CEs (Figure 1A). The analysis of homotypic CEs with an overlap of motifs may be more complicated due to possible full or partial self-complementarity of two motifs in a CE. E.g., full and partial cases refer to the E-box motifs CANNTG of TFs form the bHLH class, and the polyG motifs of TFs from the family Three-zinc finger Krüppel-related factors {2.3.1} from the class C2H2 zinc finger factors {2.3}, respectively [7]). Therefore, in the current study we consider only homotypic CEs with a spacer (Figure 1B). CE annotation requires recognition profiles for both participating motifs. For each sequence from an input set of peaks, each of these profiles provides a list of predicted sites for its motif. For each site, a profile indicates its start/end positions in a sequence, DNA strand, and conservation. The latter term means the common logarithm {−Log10(ERR)} of the expected recognition rate (ERR). This value denotes the frequency of a motif in the whole-genome set promoters of protein coding genes (see Materials and Methods, Section 4.3).
To define whether given CE is asymmetric or symmetric, we consider the difference between the conservation of two sites in this CE, |C2 – C1| =|−Log10[ERR2/ERR1]|. So, for any CE we compute the metrics Asymmetry Ratio (AR) as the ratio of conservations of sites ERR1 and ERR2 as follows: AR = Max(ERR1, ERR2) / Min(ERR1, ERR2). The threshold value of this metrics is the Threshold for Asymmetry Ratio (TAR). Two dashed lines corresponding to a fixed value of TAR divide the entire space of all pairs of conservation of two motifs (C1, C2) in a certain CE into the distinct areas of points near and far from the diagonal (Figure 1C). Thus, the metrics TAR divides all CEs into asymmetric and symmetric.
Next, we count the total numbers of asymmetric and symmetric CEs in the foreground and background sets (Figure 1D). The background set is generated separately for each peak through the permutation of the sequential order of the minimal non-overlapping groups of predicted sites, as well as a similar permutation of the spacers between these groups [26]. Finally, Fisher exact test assesses the significance of asymmetry in the conservation of motifs within CEs (Figure 1E).
Further, we show homotypic asymmetric CEs using the example of a gene promoter apparently regulated by a target TF. We consider TF ARF5, an important regulator of auxin-dependent gene transcription in plants [36]. This TF belongs to the plant-specific TF class B3 {9.*} of the superclass β-Barrel DNA-binding domains {9}; the asterisk here and below marks plant-specific clades in Plant-TFClass, i.e. those not previously known in mammals [11]. The enrichment of homotypic CEs of ARF5 motifs have been confirmed previously [4,37]. The functionality of homotypic CEs for ARF5 was proven experimentally [38]. A meta-analysis of multiple transcriptomic datasets revealed the AT1G15580 (IAA5) gene among the 20 top-ranked auxin-induced genes in A. thaliana [38].
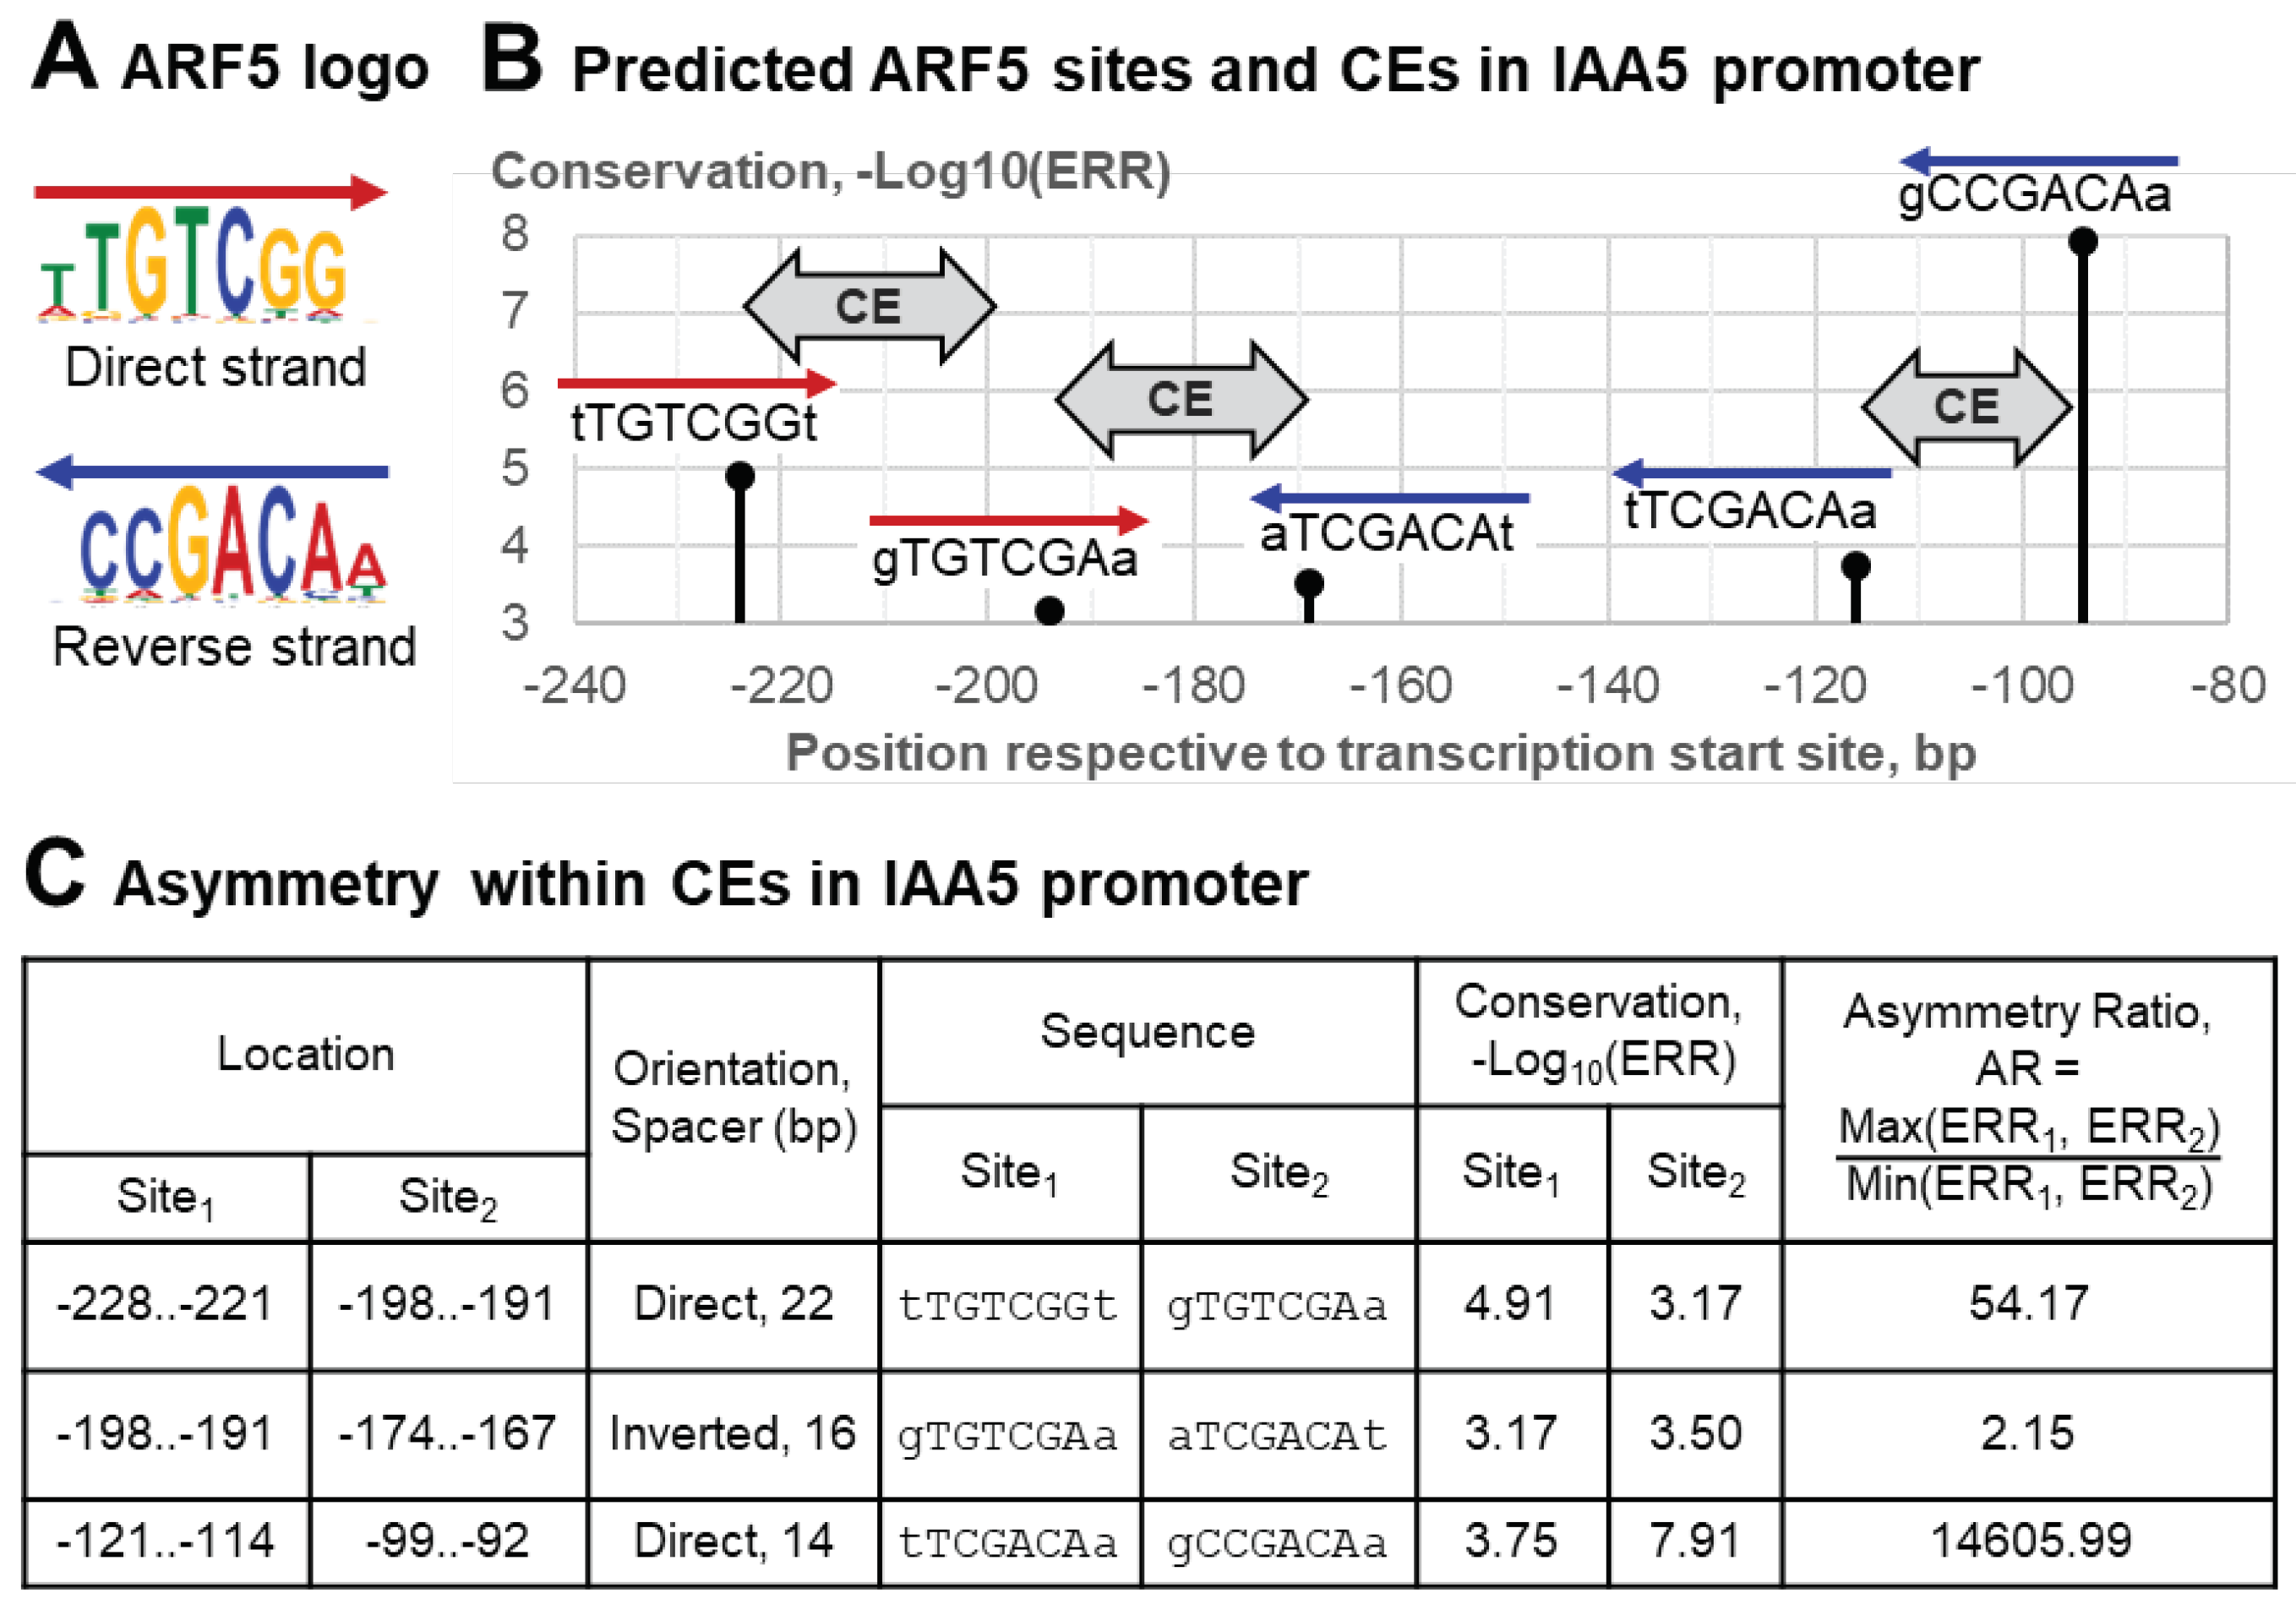
To derive a proper ARF5 motif we took in analysis the entire dataset of ARF5 peaks from DAP-seq (see Section 4.1, [4,39]), and applied de novo motif search [40]. Figure 2A depicts the logo of this motif for the direct and reverse strands. Next, we applied MCOT to the entire dataset of DAP-seq peaks for ARF5. We used the following parameters of MCOT: the thresholds of maximal spacer SpacerMAX = 30 bp, motif recognition ERR = 0.001 and asymmetry ratio TAR = 1.5 (see Section 4.3). Five predicted ARF5 sites in the promoter of IAA5 gene are partitioned into two clusters consisting of three and two sites (Figure 2B). Each cluster contains one site matching the perfect ARF5 consensus (TGTCGG/CCGACA in the forward/reverse strands, see Figure 2A). Each of these two TGTCGG hits form a CE with a substantially less conserved TGTCNN site (Figure 2B,C). The TAR value 1.5 marks these two CEs in Direct orientation with the perfect matches TGTCGG as highly asymmetric, and the third CE in Inverted orientation shows a moderate yet exceeding a threshold asymmetry.

2.2. Analysis of a whole dataset: example of significant asymmetry within CE

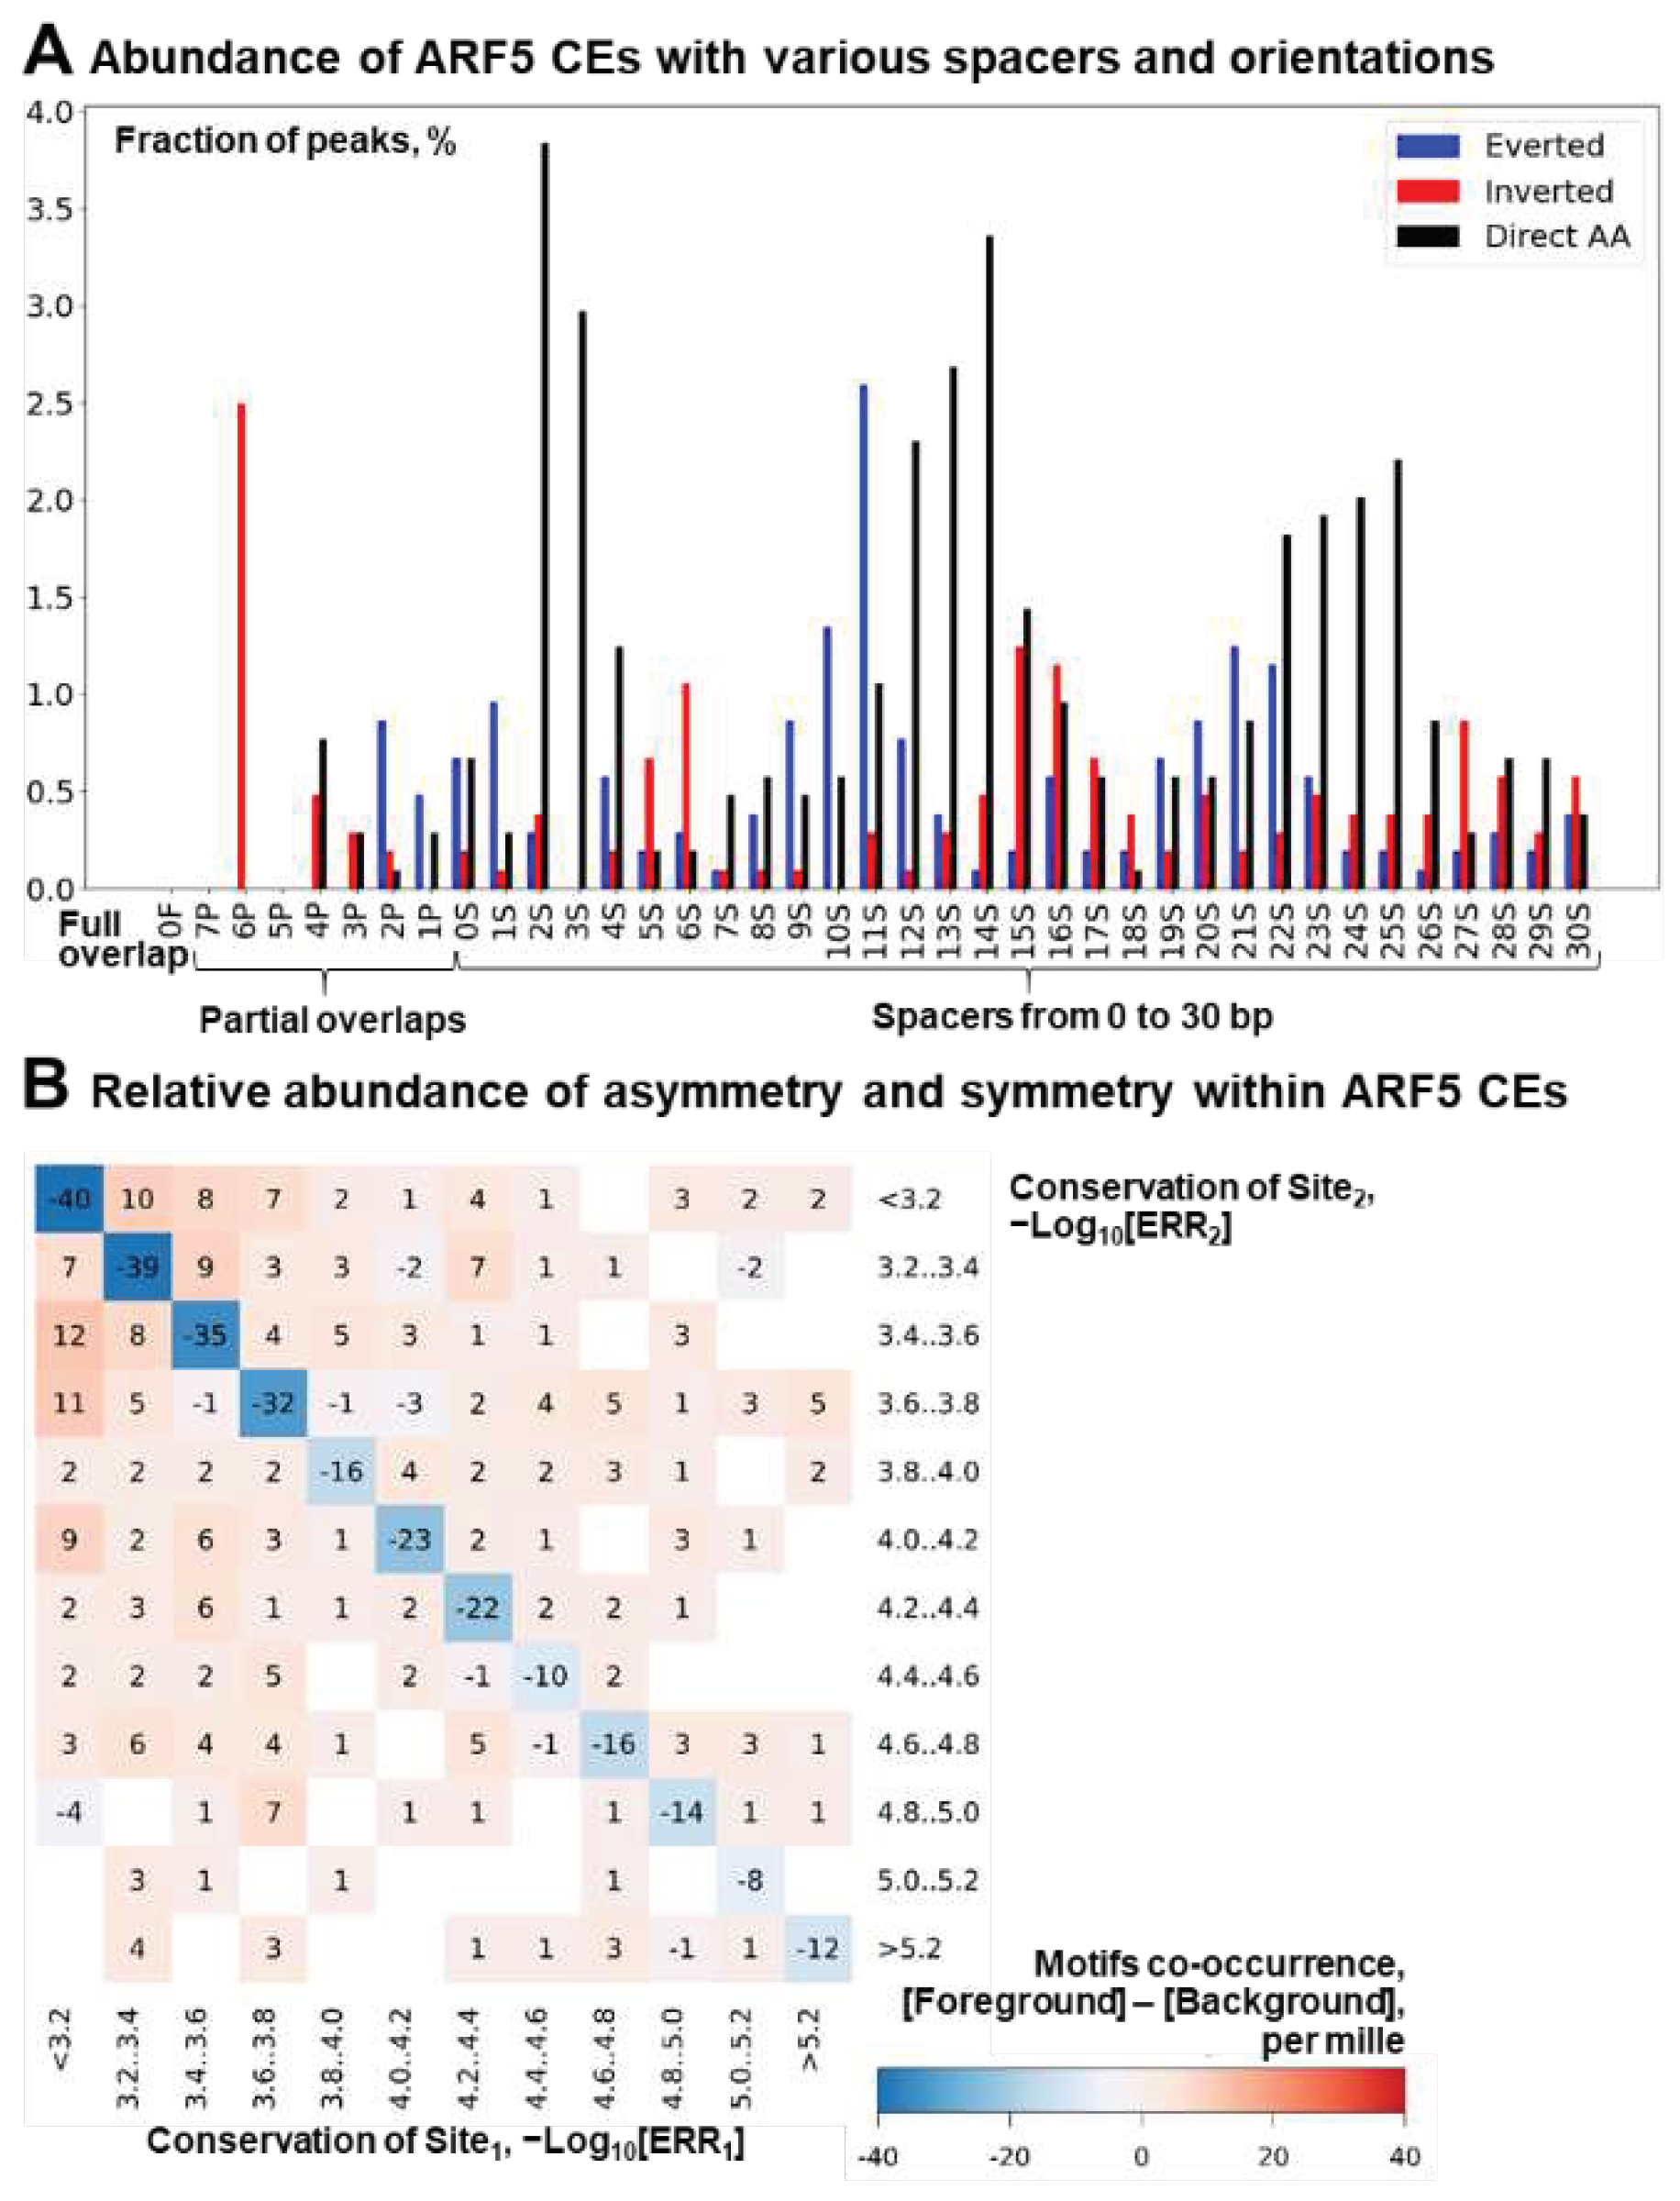
In this section, we check the abundance of homotypic asymmrtric CEs in the entire DAP-seq dataset of ARF5 peaks [4,39]. We have updated the source code of MCOT [26] and its web interface WebMCOT [32] to test asymmetry within homotypic CEs as described above (Figure 1C). We applied WebMCOT for the Anchor ARF5 motif (Figure 2A) with the same parameters as in the previous section: SpacerMAX = 30 bp, ERR = 0.001, and TAR = 1.5. The distribution of homotypic CEs for the entire dataset with respect to spacers and orientations of sites (Figure 3A) follows the known pattern of the co-occurrence of ARF5 motifs [4,37]. In particular, the Direct repeats are enriched at distances that are multiples of the DNA double helix turn length, 10-11 bp. Thus, three first peaks respect the spacer lengths of 2-4, 12-15 and 22-25 bp, and adding the 8 bp motif length (Figure 2A) to these values yields distances of 10-12, 20-23, and 30-33 bp, respectively. Peaks for Inverted and Everted orientations are found in the antiphase positions, proposing the contact of two ARF5 TFs interacting with the opposite DNA strands at the same side of a DNA double helix. Notably, we found that these enriched CEs are asymmetric (Figure 3B). Namely, for any conservation of the ARF5 motif, the pairs of sites ARF5-ARF5 with almost equal conservation are uniformly depleted (Figure 3B, blue cells on the diagonal). On the contrary, asymmetric CEs are enriched (other cells, light brown). Overall, in the ARF5 peaks the fraction of asymmetric CEs among all homotypic ones (545/713) substantially exceeds that found for the background set (41246/80209), the significance by Fisher exact test p-value < 2e-42. Thus, the asymmetry of motifs conservation is a specific feature of the homotypic CEs of ARF5 TF.

2.3. Massive Analysis of ChIP-seq/DAP-seq reveals that asymmery within homotypic CE depends on the class of target TF

As the previous section confirmed the significant enrichment of asymmetric homotypic CEs for one dataset of a particular target TF, it is tempting to test whether this phenomenon is widespread, species-specific, dependent on the type of experiment (in vitro or in vivo), and on the DBD type of a target TF. To find out the answers, we compiled the benchmark collections of massive sequencing data ChIP-seq and DAP-seq for a number of target TFs (see Section 4.1). ChIP-seq data are the results of in vivo sequencing, we extracted them for target TFs of M. musculus and A. thaliana from GTRD [41] (see Materials and Methods, Section 4.1). DAP-seq data were derived from an in vitro approach for A. thaliana, we took them from Plant Cistrome [4]. We categorized TFs according to their DBD into classes (TFClass, [7,8], JASPAR [10] and Plant-TFClass, [11]).
We performed several filtration steps for ChIP-seq data, and separately filtered DAP-seq data (see Materials and Methods, Section 4.1 and Section 4.2). For each ChIP-seq dataset, we required that a target TF matched at least one known motif in its class/family from JASPAR [10] or in its family from Cis-BP [28]. This match implied significant enrichment [42] in the foreground set (peaks) compared to the corresponding background set. The terms ‘foreground’ and ‘background’ here mean the sequence sets for subsequent de novo motif search. We used the genomic approach to prepare background sequences [43]. Further, we performed de novo motif search [40]. To control indirect binding of target TFs in ChIP-seq data, we retained only datasets with obtained de novo motifs that had the significant similarity [44] to at least one motif of a known TF that was assigned to the same family/class as the target TF (see Materials and Methods, Section 4.2). Finally, the benchmark collections of M. musculus / A. thaliana ChIP-seq data and of A. thaliana DAP-seq data amounted 1149/74 and 488 datasets, correspondingly (see Materials and Methods, Section 4.1 and Section 4.2, Tables S1-S3). Tables S4-S6 categorize these collections into classes of target TFs.
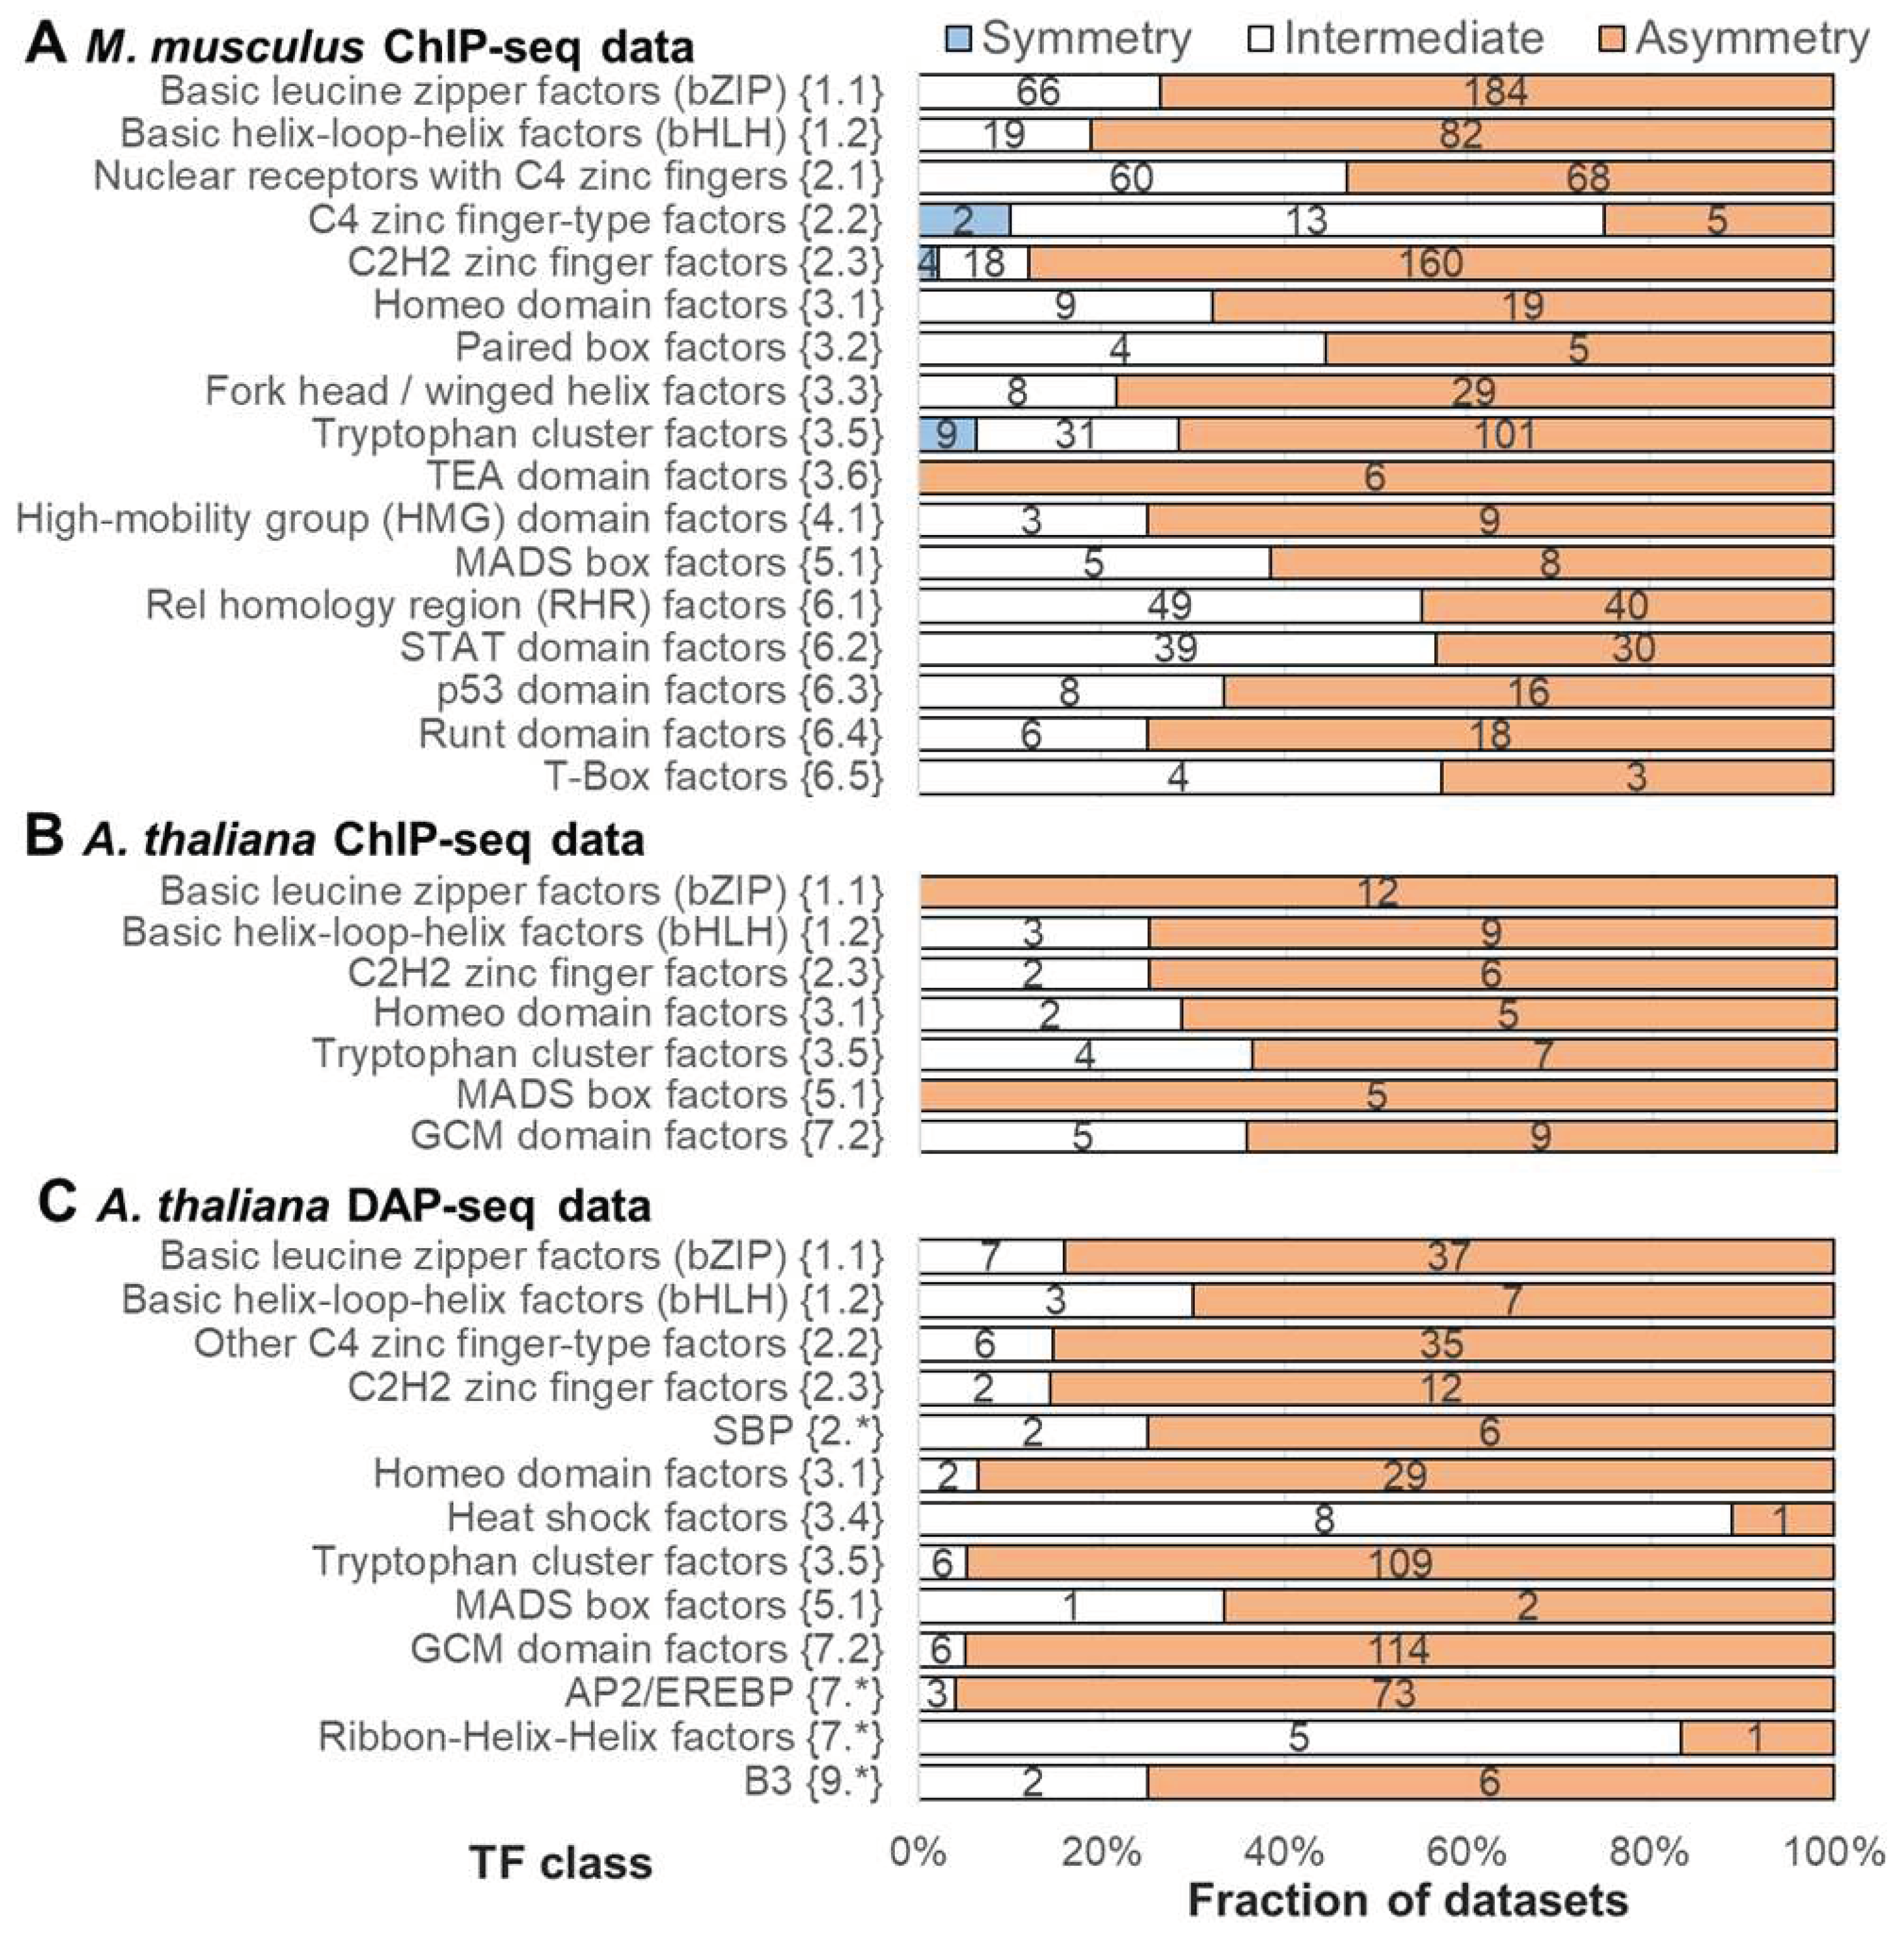
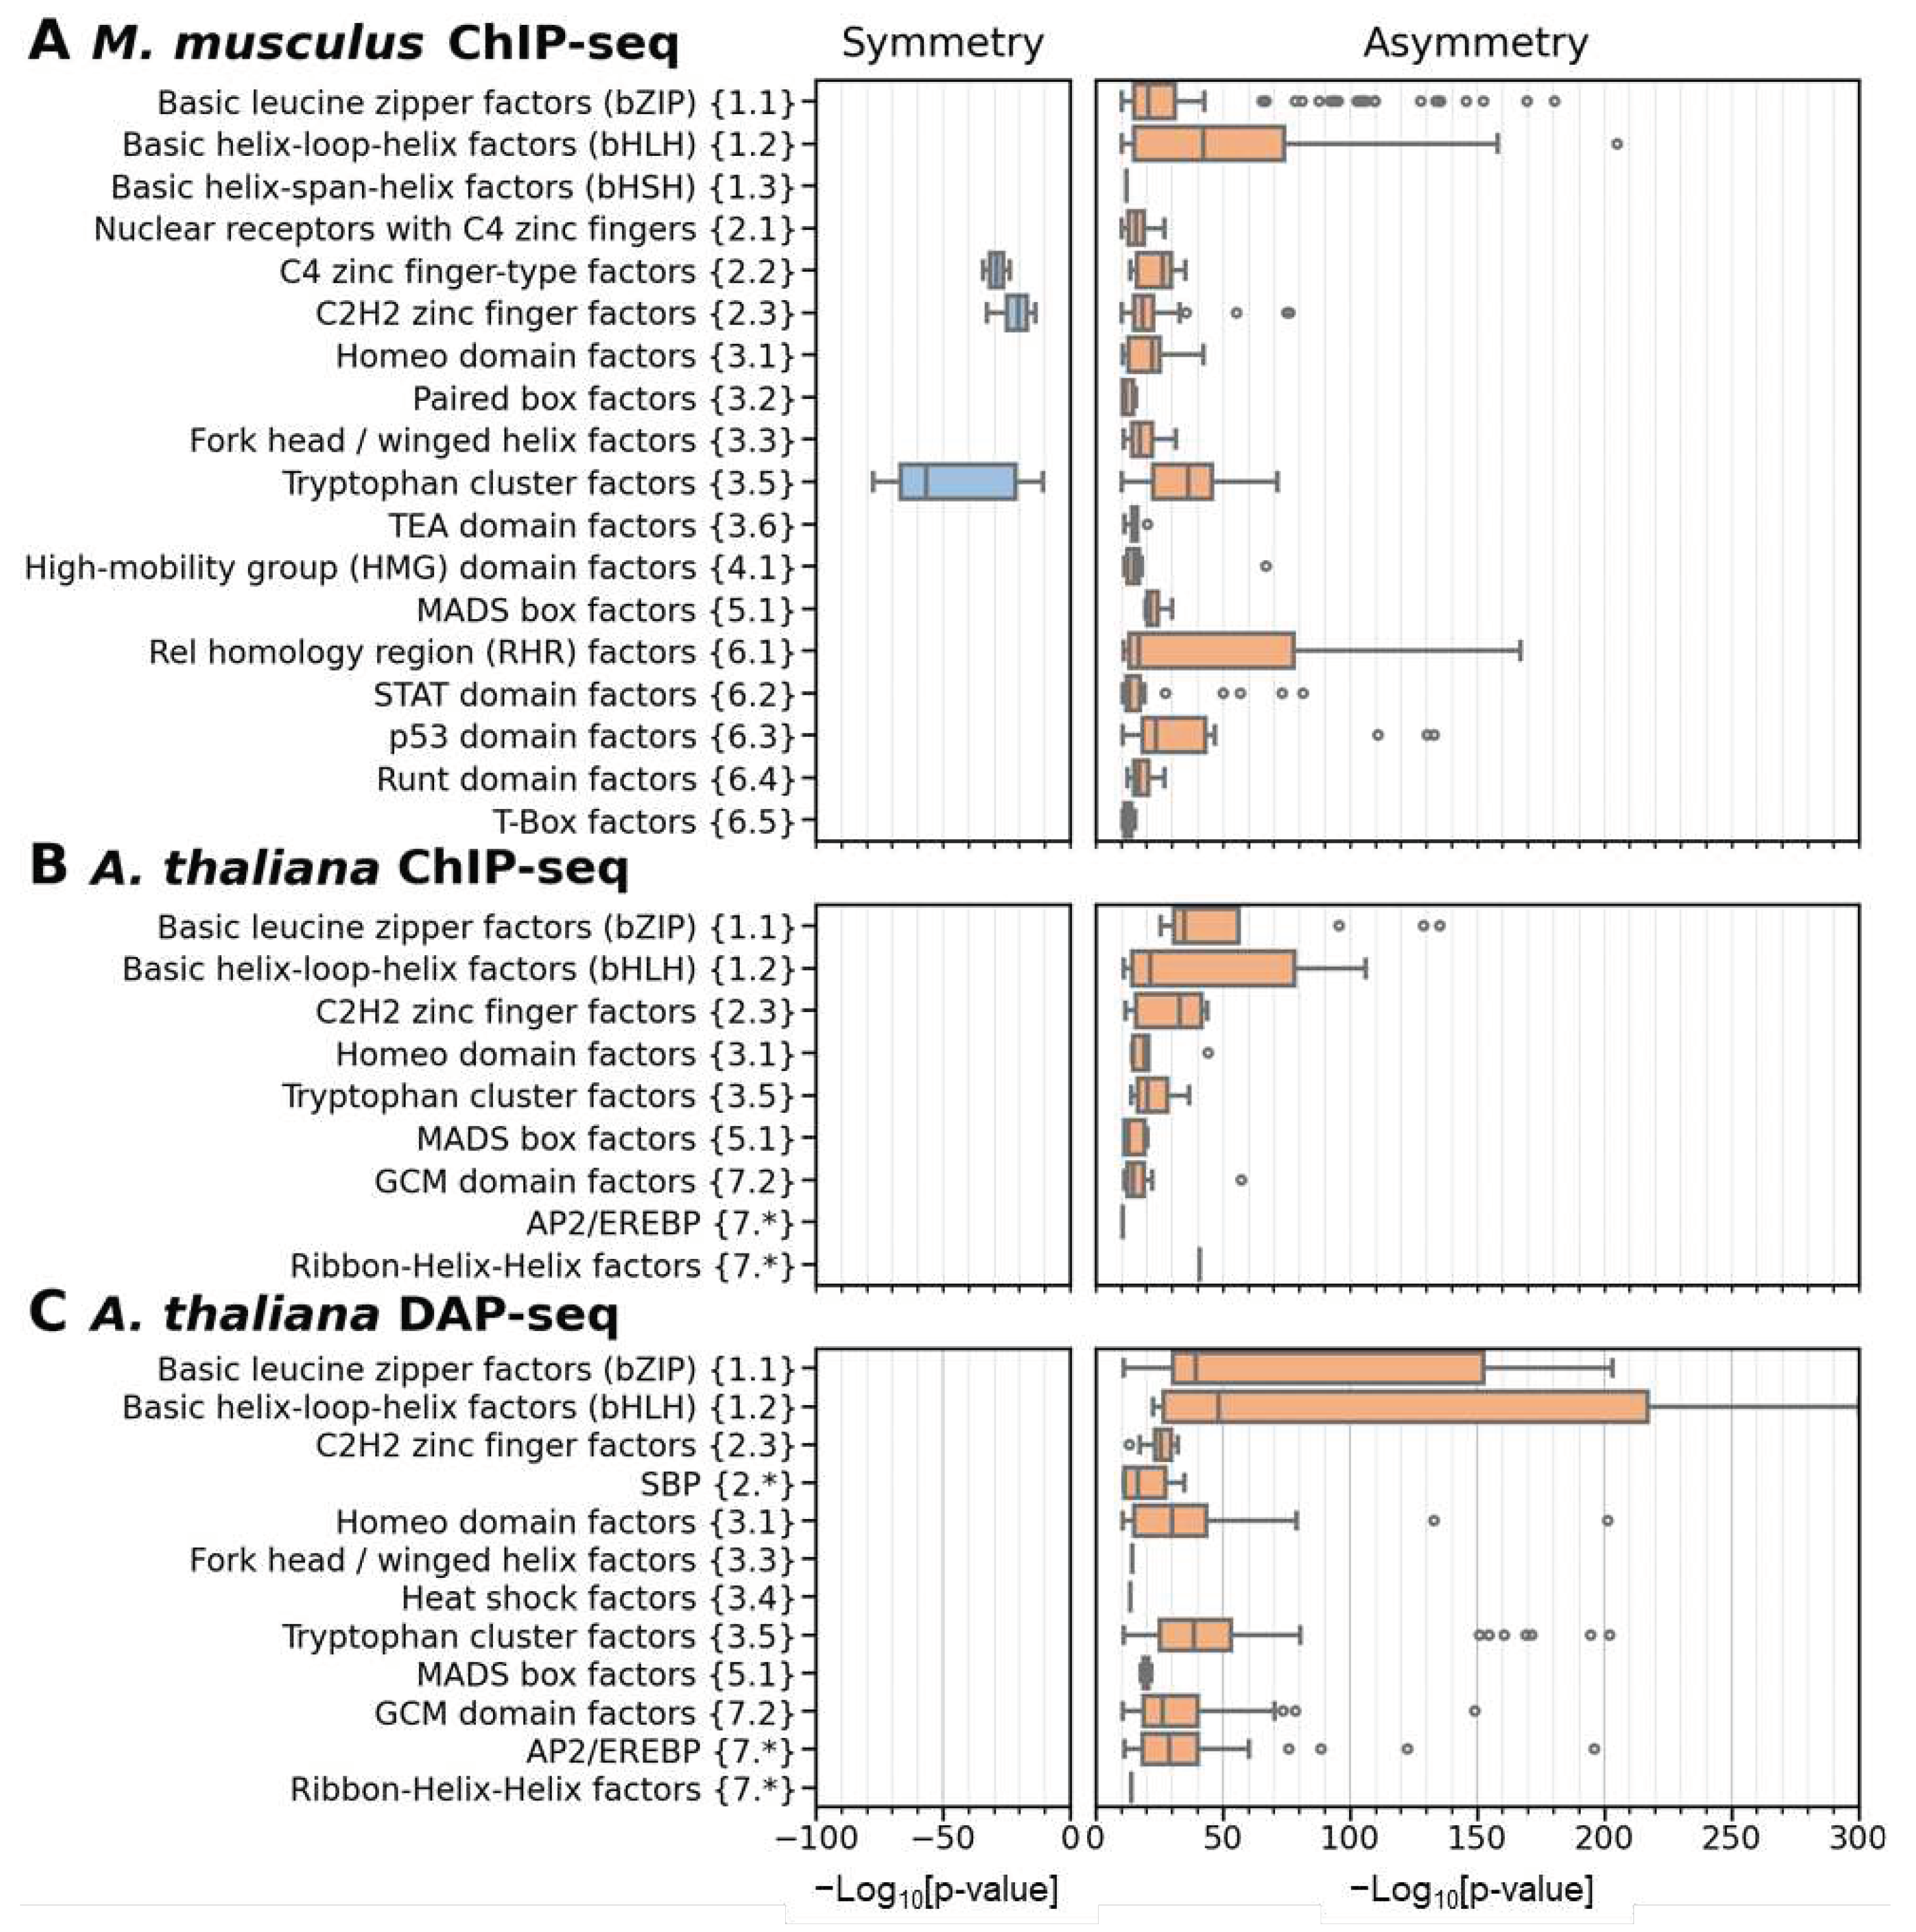
We applied MCOT to three benchmark collections to compare the abundance of significant homotypic symmetric or asymmetric CEs. In each collection, we separately considered datasets from various classes of target TFs, and set the threshold for the significance within homotypic asymmetric/symmetric CEs as p < 1E-10 (Figure 1E). This value respects a conventional criterion p < 0.05 with a number of multiple testing corrections we can apply for a single dataset [31]. Thus, we identified datasets with significant asymmetry or symmetry, and categorized all others as ‘Intermediate’ (Figure 4). These plots show the distributions of the significance of asymmetry for TF classes of the benchmark collections of M. musculus ChIP-seq data, A. thaliana ChIP-seq data and A. thaliana DAP-seq data, possessing at least 4, 2 and 3 datasets, correspondingly. Tables S7, S8 and S9 provide the respective significances for all TF classes of three benchmark collections. Remarkably, for all collections, and almost all classes we found a clear trend towards asymmetric CEs. Even more remarkably, the proportions of data following this trend differ notably for TFs from different classes. Hereinafter, we focus on the most numerous classes in each collection. First, we consider the collection of M. musculus ChIP-seq data as the greatest one (Figure 4A). Five largest classes of this collection are Basic leucine zipper factors (bZIP){1.1}, Basic helix-loop-helix factors (bHLH){1.2}, Nuclear receptors with C4 zinc fingers{2.1}, C2H2 zinc finger factors{2.3}, and Tryptophan cluster factors{3.5}. The bZIP and bHLH classes show the high fractions of datasets with the significant asymmetry. These fractions amount 184 and 82 datasets, out of total 250 and 101 datasets, respectively. Although, C2H2 zinc finger factors {2.3}) and Tryptophan cluster factors {3.5} classes show the similar fractions (160 out of 182, and 101 out of 141), each of them also reveals small fractions for the significant symmetry (4 and 9, respectively). Compared to all mentioned above classes, all the remaining ones tend to have a smaller fraction of datasets with significant asymmetry. The class Nuclear receptors with C4 zinc fingers{2.1} shows 60/68 datasets to the asymmetry/intermediate groups; the class C4 zinc finger-type factors {2.2} contain two/five datasets with significant symmetry/asymmetry, and the remaining 13 datasets were categorized to the intermediate group. Among the others, Rel homology region (RHR) factors {6.1} and STAT domain factors {6.2} have only 30 and 40 datasets with the significant asymmetry out of total 89 and 69 ones. These fractions are smaller than those for the classes of bHLH or bZIP TFs. ChIP-seq data for A. thaliana, in general, confirm the trends noted above for M. musculus (Figure 4B). Namely, among the most abundant classes, the bHLH and bZIP classes reveal the highest fractions of datasets with significant asymmetry within homotypic CEs (Figure 4B). However, we do not detect any datasets with significant symmetry in the A. thaliana ChIP-seq data. This can be explained by the substantially smaller size of this benchmark collection (74 /1149 ChIP-seq datasets for A. thaliana/M. musculus). As for the results for the DAP-seq data (Figure 4C), they are also in good agreement with those for two collections of ChIP-seq data. In particular, there are no datasets with significant symmetry, and the overall dominance of significant asymmetry over missing significance is even stronger than for any collection of ChIP-seq data.
To detect fine differences between target TFs of various classes in tendency towards asymmetric homotypic CEs, we computed the distribution of the significance of either asymmetry or symmetry within homotypic CEs for all TF classes from three benchmark collections. We took in this analysis only the datasets possessing the significant enrichment of either asymmetric or symmetric CEs (Figure 4, brown or blue colors, correspondingly, p-value < 1E-10). The distributions of the enrichment significance (Figure 5) strongly support the strong advantage of the bHLH and bZIP classes over all the remaining classes in the significance of asymmetry within homotypic CE. Tables S7-S9 provides the enrichment of asymmetric/symmetric homotypic CEs for the threshold of asymmetry ratio (TAR) of 1.1, 1.5 and 2, for all datasets of all three benchmark collections. Notably, the advantage of bHLH and bZIP classes is clearly seen for the distant eukaryotic species M. musculus and A. thaliana, as well as for ChIP-seq and DAP-seq data. The bHLH and bZIP classes show the first two ranks in the median significance of asymmetry within homotypic CEs among all abundant TF classes in all three benchmark collections. The class Ribbon-Helix-Helix factors {7.*} is scarce in the ChIP-seq data collection for A. thaliana, and, moreover, its high significance in ChIP-seq data (Table S8) does not supported by the DAP-seq data (Table S9, Figure 4C). Among the other largest TF classes common for all three benchmark collections, and possessing a notable tendency to asymmetric homotypic CEs, we may notice the class Tryptophan cluster factors {3.5}. Another competing class, p53 domain factors {6.3}, is specific to mammals.
Variation of the threshold for asymmetry ratio (TAR) have shown that the overall tendency of the enrichment of asymmetric homotypic CEs is kept for the smaller and larger thresholds of asymmetry ratio (TAR 1.1, Figures S1 and S2; TAR 2, Figures S3 and S4). Thus, highly symmetric homotypic CEs are strongly depleted for all tested thresholds (TAR 1.1, 1.5 and 2), all TF classes in all tested benchmark collections. The smaller and larger values of TAR (1.1 and 2) imply more loose and stringent filtration of asymmetric CEs, and on the contrary, more stringent and loose filtration of symmetric CEs. For small and moderate TAR values of 1.1 and 1.5 we found total dominance of the bHLH and bZIP classes (Figure 4, Figure 5, Figure S1 and Figure S2). Only in the M. musculus ChIP-seq data, and only for the large TAR value of 2, the other classes are arose at the top of overall ranking, e.g. NR and MADS-box (MADS-box factor {5.1}), whereas in both A. thaliana collections, the bHLH and bZIP classes retain the highest ranks (Figures S3 and S4). Therefore, the parameter TAR implying the width of the strip of the symmetric homotypic CEs in a scatterplot of the conservation of sites within CEs (Figure 1C) is critically important.
Hence, we may assume that certain structural properties in the DBDs of two major classes of the first superclass, bZIP and bHLH, potentiate their ability to bind DNA cooperatively, so that the first binding site with higher affinity promotes TF-DNA interaction for neighboring sites with lower affinity. Overall, our results suggest that the structure of the DBDs of different classes of TFs contributes differently to the formation of their multiprotein complexes and therefore predetermines the available flexibility of transcription regulation events involving these different complexes.

2.3. Homotypic CEs of target TF with proven pioneer activity show higher significance of asymmery compared to that of other TFs

The previous section demonstrated the general tendency of the asymmetry of motifs conservation within homotypic CEs of almost any target TF. A specific group of eukaryotic TFs, the pioneer TFs, initiates access of transcription machinery to regulatory regions of genes in closed chromatin [19]. These TFs recruit other TFs and, therefore, they should have a more pronounced ability to interact directly with DNA than other TFs. Hence, we asked whether homotypic CEs of pioneer TFs have higher asymmetry compared to those of other TFs. We considered only the benchmark collection of ChIP-seq data for M. musculus, since pioneer TFs substantially better known in mammals [19]. We compiled references to the experimental confirmation of pioneer activity for 63 human or murine TFs (Table S10).
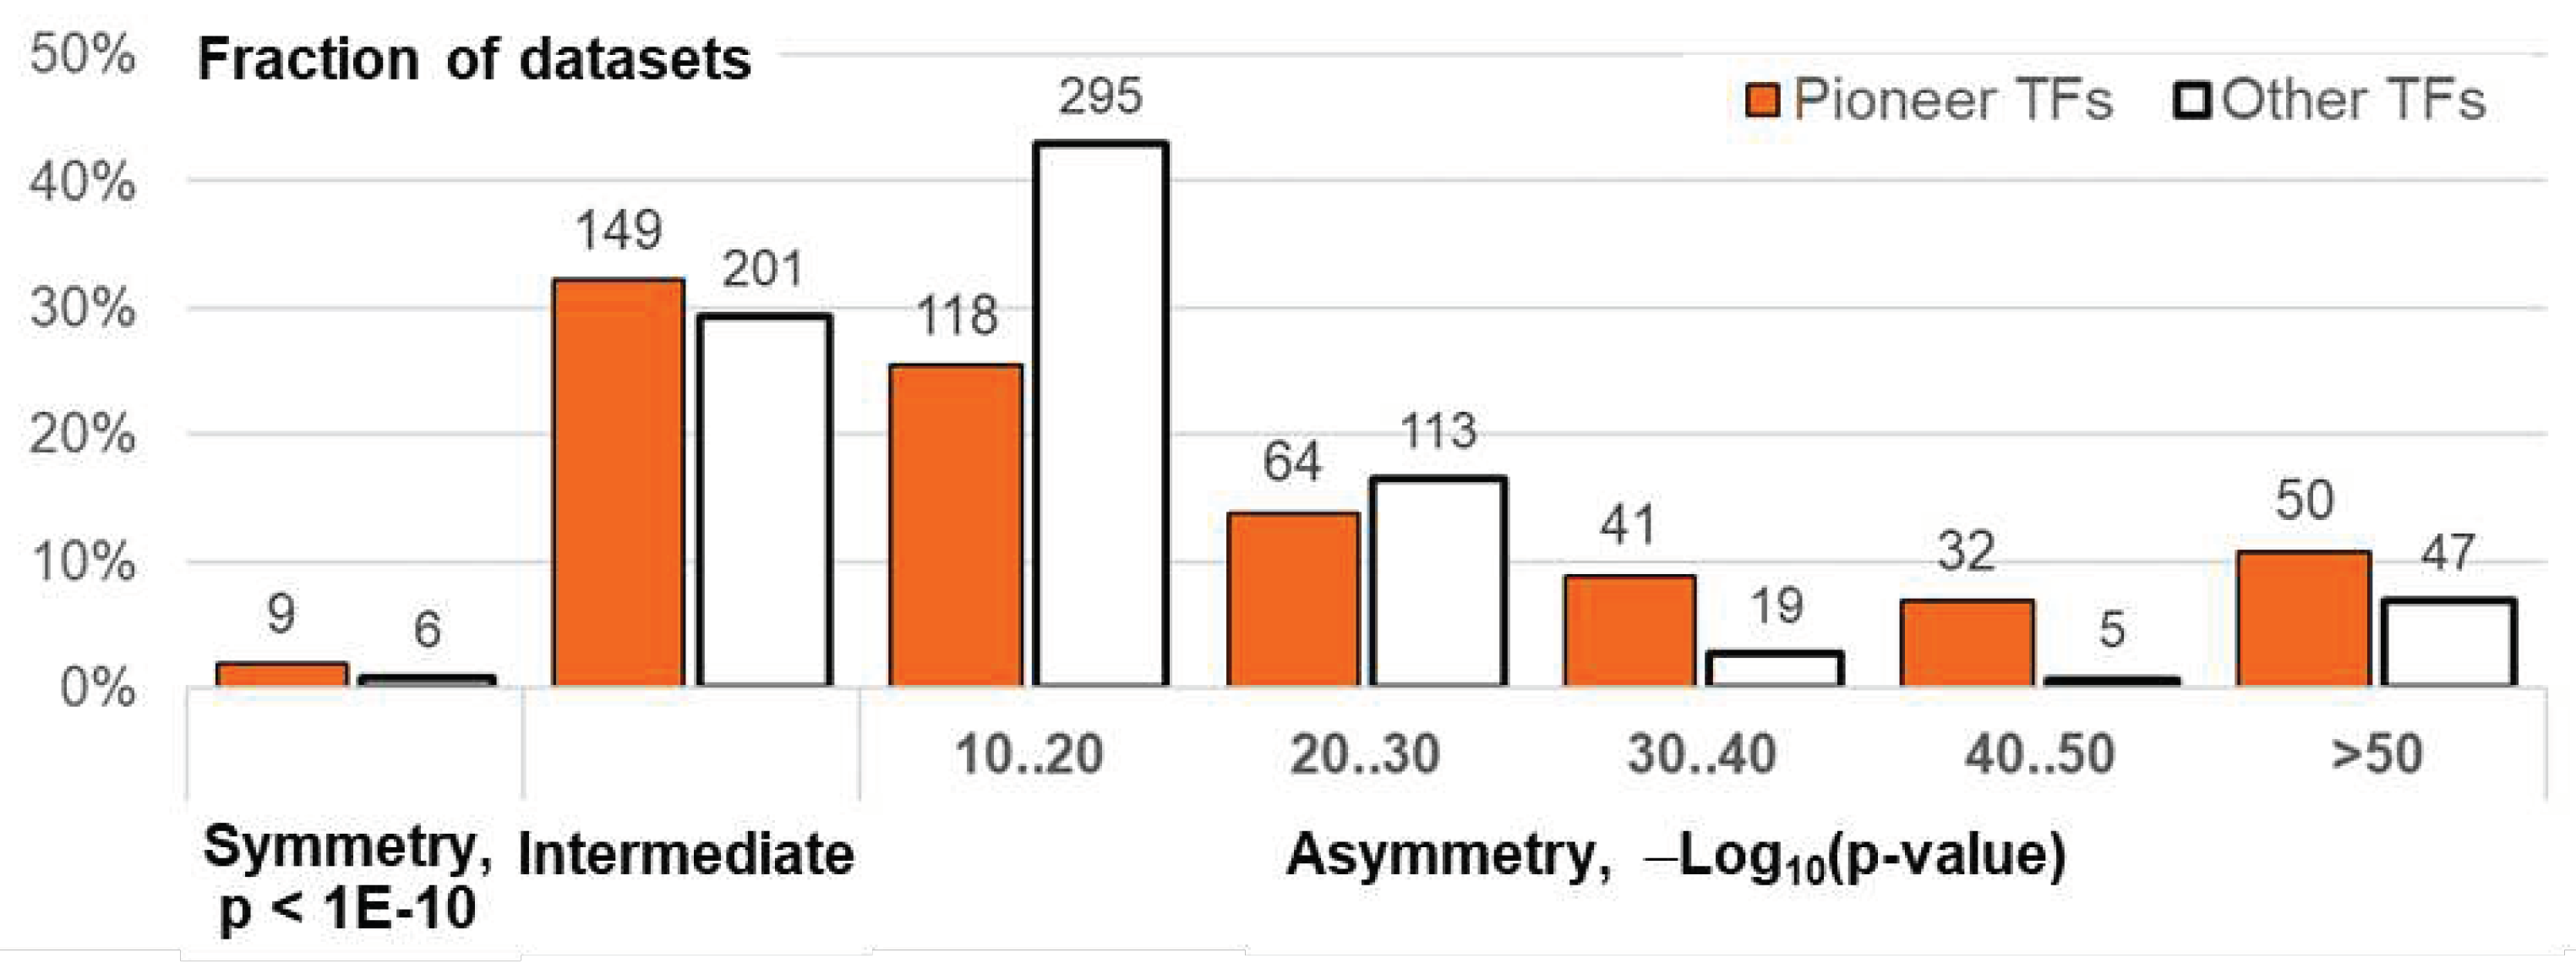
First, we compared the significance of asymmetry within homotypic CEs for target TFs with proven pioneer activity with that for other target TFs (Figure 6). In each TF class we identified datasets with significant enrichment of symmetric homotypic CEs (p-value < 1E-10), no apparent enrichment towards either symmetry or asymmetry (p-value > 1E-10), and finally, we partitioned all datasets with significances towards asymmetry into several groups as follows: 1E-10 < p-value < 1E-20, 1E-20 < p-value < 1E-30, etc. Described groups correspond to the notations Symmetry, Intermediate, Asymmetry 10..20, Asymmetry 20..30, etc. in Figure 6. We found that the groups Symmetry and Intermediate hardly differentiate between pioneer and other TFs. But, the separating of homotypic asymmetric CEs with high significance, p-value < 1E-30, is certainly very successful in distinguishing pioneer TFs from other TFs. Fisher exact test confirms the significance of differences for this threshold, p < 2E-12. The similar thresholds (p-value < 1E-30 and p-value < 1E-20), confirmed the significance of difference ‘pioneer TFs vs. other TFs’ separately for target TFs from the superclasses Basic domain {1} and Helix-turn-helix domains {3} (Figure S6A,C, Fisher exact test, p < 2E-7 and p < 7E-4, respectively). The correction for multiple comparison supports these significances. Namely, the Bonferroni’s correction requires p < 0.05/4/3/3 = 1.39E-3 because there are four abundant superclasses of pioneer TFs ({1}, {2}, {3} and {6}, Table S10), three thresholds for TAR (1.1, 1.5 and 2), and three thresholds for the significance of asymmetry, from p < 1E-30 to p < 1E-50 (Figure 6, Figure S5 and Figure S6).
We varied the asymmetry threshold TAR and found that a more stringent restriction of symmetric homotypic CEs kept the significant difference between pioneer and other TFs (TAR 1.1, Figure S5A). The difference between pioneer and other TFs is not observed for TAR value of 2 (Figure S5B). The significant differences ‘pioneer TFs vs. other TFs’ are maintained separately for the target TFs from the superclasses Basic domain {1} and Helix-turn-helix domains {3} (Figure S6E,H, Fisher exact test, p < 2E-8 and p < 1E-3, respectively).
Overall, pioneer TFs compared to other TFs show enrichment of homotypic CEs with high asymmetry.
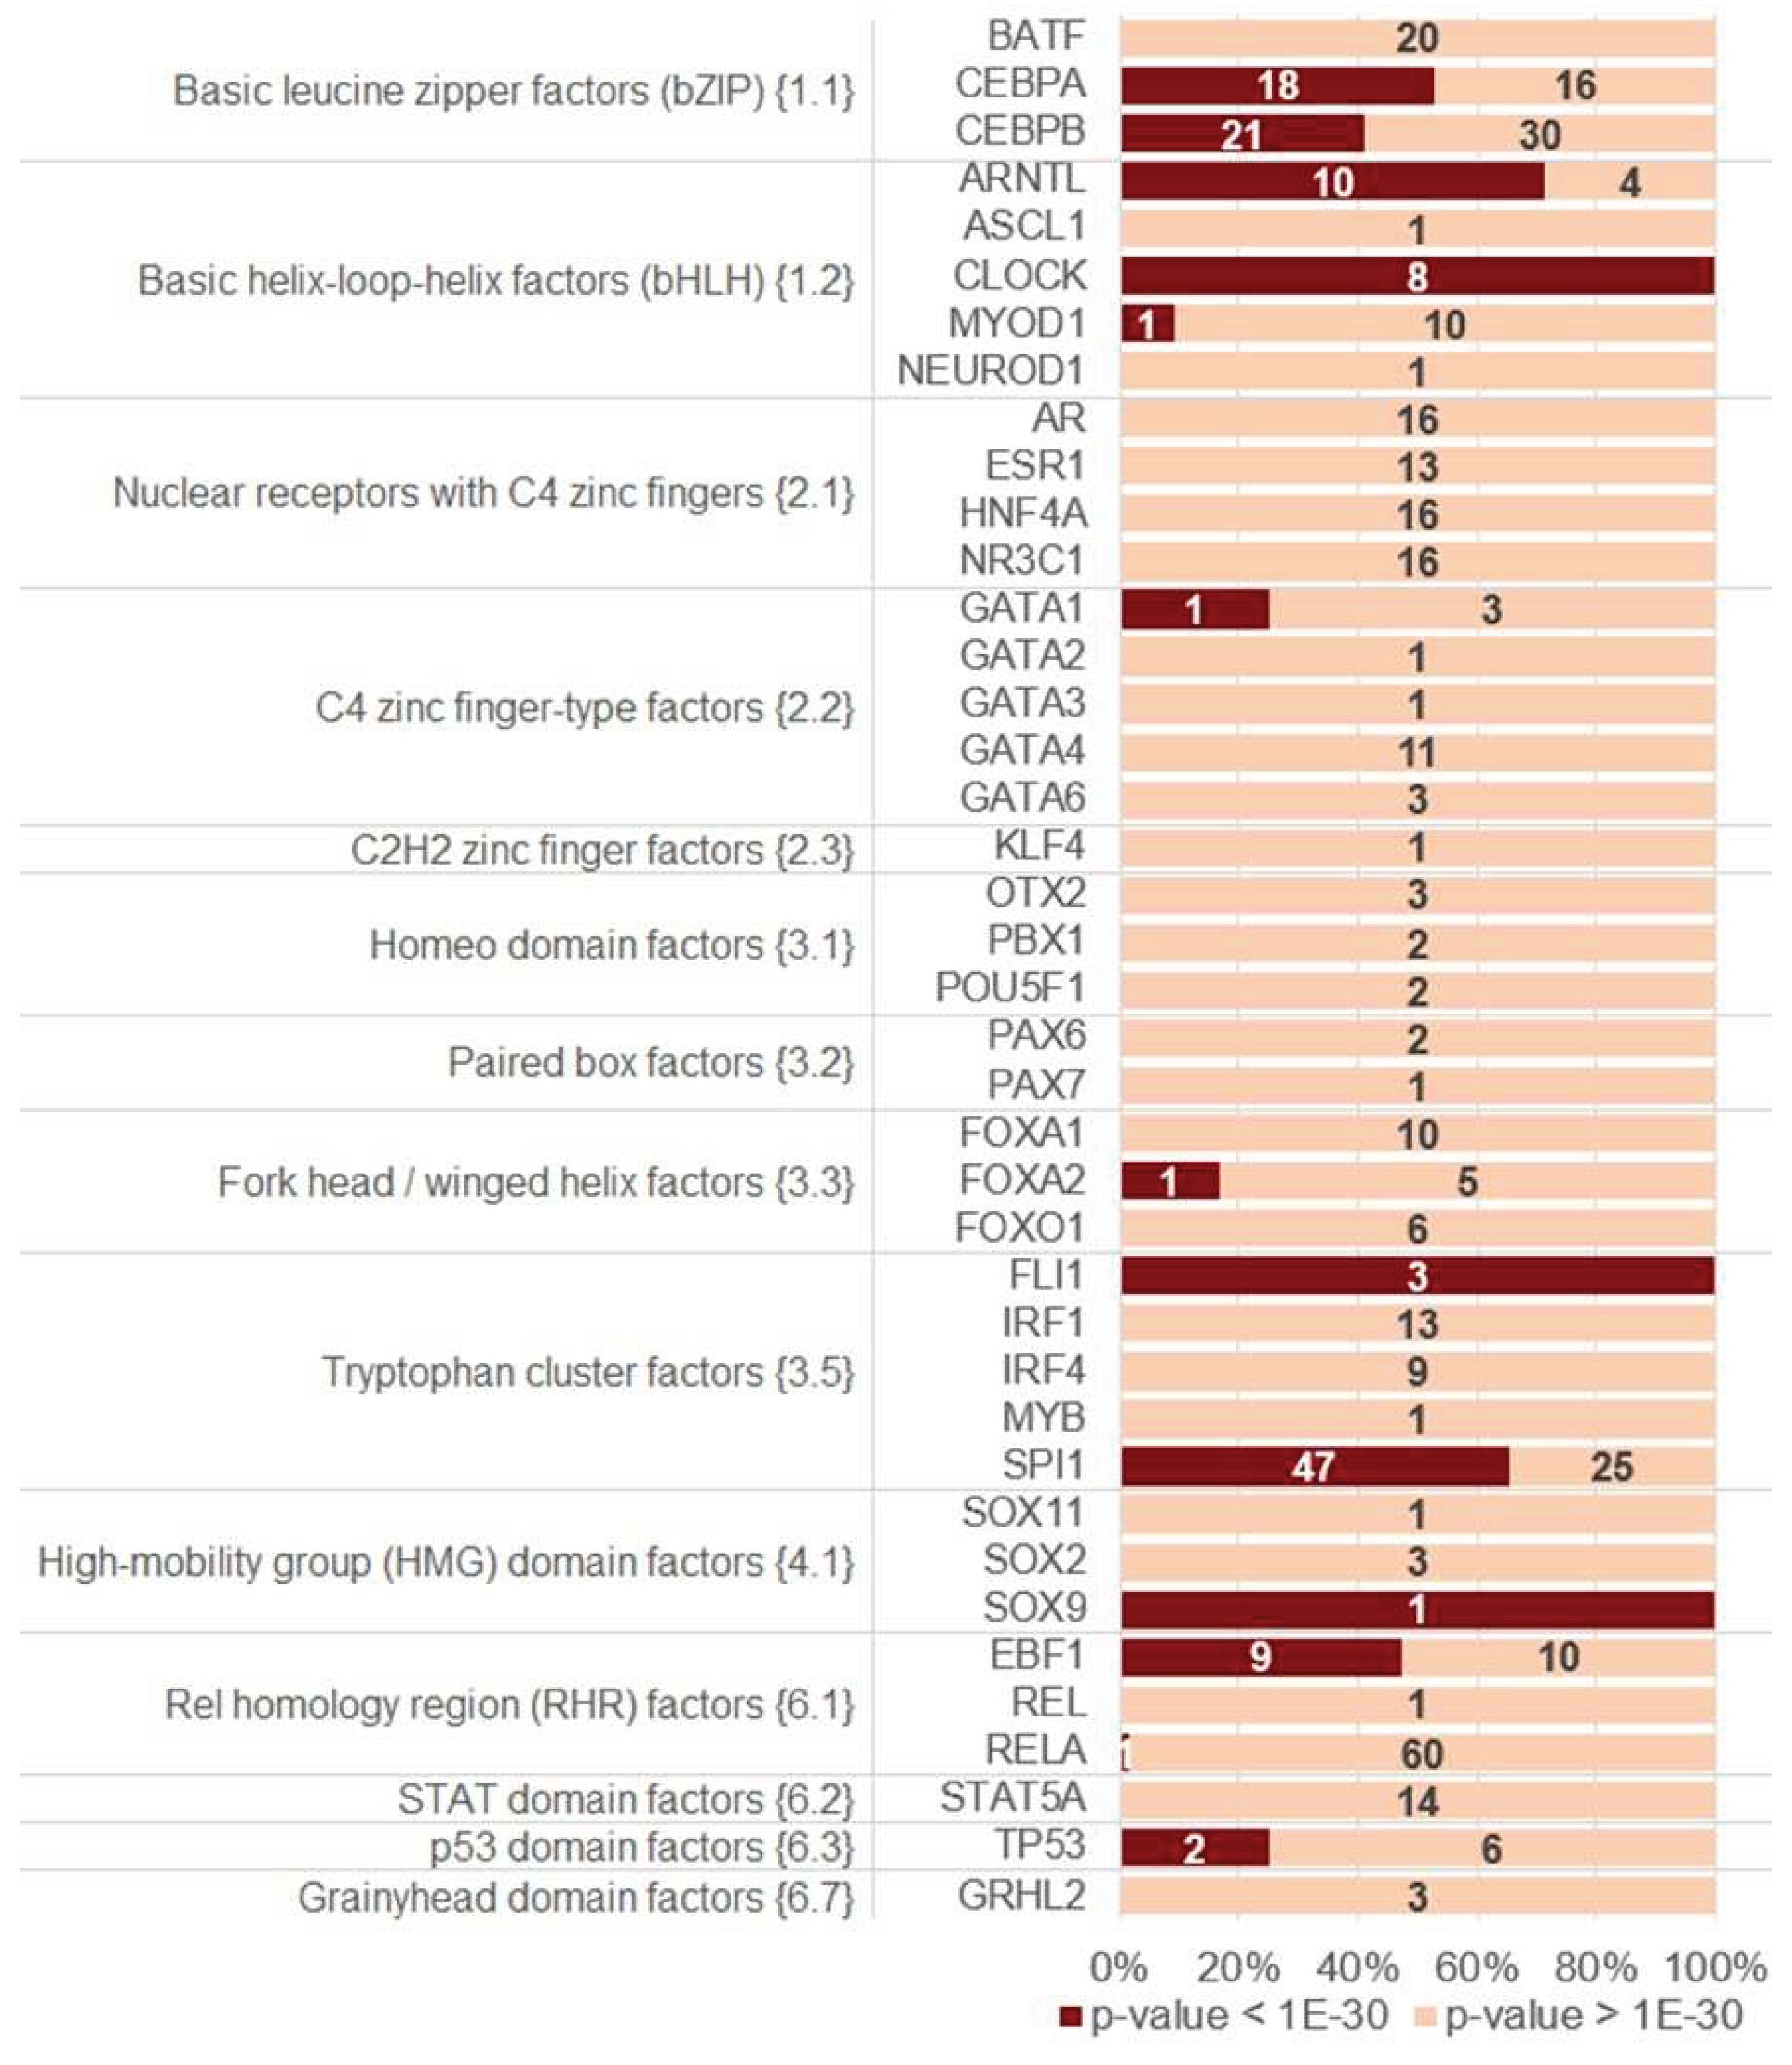
Finally, we consider only pioneer TFs, and asked which ones and from which classes have a higher significance of asymmetry within homotypic CEs. Figure 7 shows the distribution for the asymmetry ratio threshold TAR 1.5, pioneer TFs from all classes categorized according to presence/absence of highly significant asymmetry within homotypic CEs, threshold of the significance of asymmetric CEs p <1E-30. Although, as it is expected, pioneer TFs from bZIP and bHLH classes often have high significance, pioneer TFs from some other classes also show high significance of asymmetry within CEs. For instance, TFs SPI1 and EBF1 from the classes Tryptophan cluster factors {3.5} and Rel homology region (RHR) factors {6.1} also show high significance of asymmetry. However, even within the most prominent class, bHLH, various pioneer TFs can differ in asymmetry. Whereas TF CLOCK shows a high significance of asymmetry, but TF MYOD1 has only a moderate one. Figure S7 show the respective distribution for TAR values of 1.1 and 2. While overall patterns of distributions are similar for TAR values of 1.1 and 1.5 (Figure 7 and Figure S7A), one for TAR value of 2 is quite distinct from them, e.g. pioneer TF from the NR class can reveal highly significant asymmetry. In general, patterns of asymmetric homotypic CEs for motifs of pioneer TFs from various classes can be distinct.

3. Discussion

Prediction of TFBS motifs is an important step in deciphering of the nucleotide context responsible for transcription regulation. The next hierarchical level of gene regulatory regions above the level of individual TFBS motifs represents CEs as stable, recurring and overrepresented compared to a random expectation co-occurred pairs of TFBS motifs. The importance of this level is due to the basic cooperative nature of the action of TFs as major regulators of gene transcription.
Since the beginning of the next generation sequencing era, and, in particular, the massive application of ChIP-seq technology, many novel approaches have been proposed and consistently applied for CEs prediction [21,22,23,24,25]. To support these researches, we have continuously developed our approach MCOT [26,31,32]. So far, no CE prediction tool besides MCOT has been able to detect significant asymmetry, or symmetry, or lack of both within CEs. However, in the previous studies [26,31] we analyzed the asymmetry of motifs conservation only for heterotypic CEs. In this study, we extended the definition of asymmetric CEs to homotypic CEs (Figure 1C). This allowed massive analysis of the benchmark collections of ChIP-seq and DAP-seq data and, in addition, revealed clear differences in the structure of homotypic CEs for target TFs from various TF classes.
To start our analysis, we chose the TF ARF5, a well-known master regulator of plant growth and development [45], we took in analysis its well-known target gene IAA5 [46], detected previously as one of top-ranked auxin induced genes [38]. TF ARF5 belongs to the gene family of ARFs TFs, ARF5 is one of the most important master regulators in plants. It activates genes regulated by the plant hormone auxin, which is important in many processes of growth and development in plants. The IAA5 gene belongs to the gene family Aux/IAA of transcriptional repressors. At low concentrations of auxin, ARF5 occupies its binding sites in the promoters of auxin-responsive genes, but direct interaction of Aux/IAA with ARF5 represses the activity of ARF5. At high concentration of auxin, this direct interaction is disrupted, and ARF5 becomes functional. Such important process in plants, standing at the core of gene network have to be fine-tuned reliably and precisely. Therefore, we chose the homotypic CEs of the ARF5 TF as an example demonstrating the asymmetry in motifs conservation within homotypic CEs. Two highly asymmetric homotypic CEs in the promoter of IAA5 gene support effective regulation of the IAA5 gene under the action of ARF5. Further, the same trend to the asymmetry within homotypic CEs we confirmed for the entire dataset of DAP-seq peaks for ARF5 TF [4,39]. Whereas the specific pattern of spacer length distribution in homotypic CEs for ARF5 (Figure 3A) was noted previously [4,37], the asymmetry of motifs conservation within these homotypic CEs has not been identified yet (Figure 3B). The ARF5 TF belongs to the class B3 {9.*} (Table S3), the other seven members of this class have substantially less significant enrichment of asymmetric homotypic CEs (Table S9, p-value < 1-42 for ARF5, the median for the entire B3 class, p-value < 1E-12). This result for the particular DAP-seq dataset for the TF ARF5 motivated the analysis of the three benchmark collections of ChIP-seq and DAP-seq data (see Section 4.1). Our main goal was to identify the relationship between the structure and functions of target TFs, on the one hand, and the significance of asymmetry, symmetry or neither in homotypic CEs, on the other hand.
Remarkably, our results of massive analysis of the proportion between asymmetric and symmetric homotypic CEs (Figure 4 and Figure 5) clearly indicate that TFs with different types of DBD structures, categorized to various TF classes, have specific patterns of asymmetric homotypic CEs. First, symmetric CEs are substantially depleted compared to asymmetric CEs. We detected symmetric CEs only in several datasets in the ChIP-seq data of M. musculus (Figure 4A, Figure S1A and Figure S3A). Symmetric CEs are completely absent in both benchmark collections of A. thaliana (Figure 4B,C, Figure S1B,C and Figure S3B,C). Second, the fractions of datasets with significant asymmetry and the fraction with neither significant asymmetry nor significant symmetry compete with each other. Third, the fractions with significant asymmetry and significant symmetry, as well as that with neither, are clearly differ in magnitude for target TFs from various classes. The first two statements are quite expected, they are most likely reflect the widespread cooperative mechanism of action of eukaryotic TFs. The third statement is not so expected, and even slightly striking. Nevertheless, many earlier studies have indicated that this result is quite reasonable.
Possible stereochemical structure underlying both TF-TF and TF-DNA interactions defines the diversity of CE structures. For example, TFs of the bZIP class {1.1} function only as dimers. Their homotypic CEs of TFs do not show any variation in the orientation of motifs, and show only a small change in a spacer length, from 1 to 4 bp [35]. On the contrary, TFs from the NR class (Nuclear receptors with C4 zinc fingers {2.1)} can function as monomers or dimers, their homotypic CEs show diverse structure with various orientations and spacers [34,35] (Merkulov, Nagy). Therefore, a very important prerequisite to the analysis of the homotypic CEs is the propensity of TFs to the homotypic dimerization. This term was defined as the dimerization among members of the same TF class [47]. This review indicated only three conservative TF classes among human and Arabidopsis with this ability. Namely, TFs from bZIP {1.1}, bHLH {1.2}, and MADS-box factor {5.1} (MADS-box) classes, emerged before the divergence of eukaryotes into plants, fungi and animals. Whereas TFs from the bZIPs and bHLHs classes have undergone independent lineage-specific expansion in plants and animals, TFs of the MADS-box class have done so only in plants, this class is very scarce in mammals [48]. Besides these three classes, the review [47] distinguished following clades of TFs with homotypic dimerization propensity: the classes of NR (Nuclear receptors with C4 zinc fingers {2.1}) and STAT (STAT domain factors {6.2}) TFs, and the families of NF-κB and HD-ZIP TFs. The NR class is specific to metazoa [49]. The class STAT emerged early in the metazoan evolution [50]. The NF-κB family (NF-kappaB-related factors {6.1.1}) belongs to the class Rel homology region (RHR) factors {6.1}, this family also specific to metazoa. The plant-specific HD-ZIP family belongs to the class Homeo domain factors {3.1} [11]; this family emerged during the early chlorophyte evolution [51]. Taking into account the specific TF classes and families noticed for their dimerization ability [47], we may conclude that among them the bHLH class shows the highest asymmetry in the conservation of motifs in homotypic CEs with a spacer (Figure 4, Figure 5, Figure S1 and Figure S3). The structurally related bZIP class shows slightly less significant results, it is still superior to all other classes. The NF-κB family and MADS-box class reveal the moderate significance, whereas the NR and STAT classes achieve a relatively low significance of the asymmetry within homotypic CEs. Conclusion about the superiority of bZIP and bHLH classes holds for the asymmetry ratio thresholds TAR of 1.1 and 1.5 for the M. musculus ChIP-seq data (Figure 4A, Figure 5A, Figure S1A and Figure S2A), and for all three thresholds (TAR values of 1.1, 1.5 and 2) for the A. thaliana ChIP-seq and DAP-seq data (panels B and C in Figure 4, Figure 5 and Figures S1-S4). Curiously, for the M. musculus ChIP-seq data with a high value TAR of 2, first two ranks belong to other classes known for their dimerization propensity [47], NR and MADS-box (Figures S3 and S4). Although this enrichment requires further studies due to the significant differences between pioneer TFs and other TFs only for low and moderate asymmetry thresholds (TAR 1.1 and 1.5, Figure 6 and Figure S5A).
Regarding the mechanism underlying the asymmetry of motif conservation within homotypic CEs, an analogy with the mechanism of ternary complex formation from two subunits of dimeric TF and DNA can be pointed out [52]. Either one of the two subunits initially interacts with DNA independently and then it recruits the second subunit, or the two subunits initially interact with each other and then a TF dimer interacts with DNA. These two options were referred to as monomer and dimer pathways [52]. This study experimentally studied efficiency of these two pathways on the example of the dimerization of the cFos and cJun subunits. They both contain DBDs of the bZIP class. Their heterodimer AP1 activates transcription of many genes. It was demonstrated that although the dimerization of cFos and cJun occurred rapidly in the absence of DNA, its rate was enhanced in the presence of DNA. Therefore, it was concluded that the monomer pathway is favored. The monomer pathways implied sequential binding of two subunits to DNA. The sequential binding was shown for other bZIP TFs [53]. For bHLH TFs it was also shown that the monomer pathway showed a faster rate than the dimer pathway [54]. The sequential binding was approved for TFs with various DBDs, e.g. NR [55,56].
Based on the results of our study, we propose that the asymmetry in conservation of motifs in homotypic CEs reflects a sequential mode of cooperative binding of TFs from certain classes. Since cooperative action of closely related TFs belonging to the same classes is deciphered as homotypic CEs in genomic DNA, and we detected the strong depletion of symmetric CEs for all classes of TFs, the sequential mechanism of formation of multiprotein complexes on DNA is ubiquitous. The nucleotide context of homotypic CEs of TFs from bZIP and bHLH classes indicates that they are more prone to sequential binding than TFs of other classes.
The propensity to recruit cooperating partner TFs is a well-known fundamental property of TFs as principal gene transcription regulators. We suppose that the significant enrichment of asymmetric homotypic CEs for TFs of any class shows ability of all TFs as basic transcription regulators to recruit collaborative TFs. Obviously, among the diversity of TFs, pioneer TFs are exactly the first to demand this recruiting potential. The significant difference in asymmetry within homotypic CEs between pioneer TFs and TFs lacking pioneer function suggests that asymmetry within CEs signifies the ability of TFs to recruit their partners to contiguous regions of genomic DNA (Figure 6, Figure S5 and Figure S6). Although the higher recruitment capacity of pioneer TFs seems obvious, trying to decipher it as a part of the genomic regulatory code seems to be an open challenge.
Another explanation of weaker binding sites co-occurred with the stronger sites called the weaker ones as ‘traps’ [34] or ‘antenna’ [57]. These weaker sites operate as attractive intermediate elements providing a traffic of TF molecules towards binding sites of higher affinity. We recently combined the traditional motif model PWM neglecting the dependencies of various positions in motifs, and the alternative motif models BaMM and SiteGA allowing such dependencies in massive analysis of ChIP-seq data [43]. We found that the PWM model was successive in prediction of sites of high conservation, whereas both alternative models efficiently complements the predictions of PWM at the recognition thresholds of sites with low conservation. Thus, we hope that further application of alternative motif models may clarify the nucleotide context of weaker motifs from asymmetric homotypic CEs.

4. Materials and Methods

4.1. Benchmark collections of ChIP-seq and DAP-seq data, their preliminary filtration

We compiled the benchmark collections of ChIP-seq data for M. musculus and A. thaliana from the GTRD [41], and the benchmark collection of DAP-seq datasets for A. thaliana from the Plant Cistrome [4]. The M. musculus collection included the datasets that were prepared only for normal tissues/organs. Thus, we tried to maximize the presence of CEs functioning in mice in vivo. For each ChIP-seq dataset, we required an input control experiment to be present in the raw data processing [41]. ChIP-seq datasets were processed in GTRD by the MACS2 peak caller [58]. Raw DAP-seq data were also processed with this peak caller [39]. We used full-sized peaks for all benchmark collections. For all collections, we used the foreground sets of 1000 top-scoring full-length peaks not exceeding 3000 bp for subsequent analysis. We ensured that target proteins of ChIP-seq experiments were TFs. To confirm murine TFs we applied the list of 1639 human TFs [12], the high homology between human and murine TFs enabled this criterion [8]. To confirm plant TFs we applied the annotations from PlantRegMap [59] and TAIR [60]. Thus, we initially extracted 1553/121 ChIP-seq datasets for M. musculus / A. thaliana, and 512 DAP-seq datasets (Tables S1-S3). We used the hierarchical classification of M. musculus and A. thaliana TFs by the structure of their DBDs [6,7,8,9,10,11].

4.2. De novo motif search and final filtration of ChIP-seq/DAP-seq data

We used the realization STREME (Bailey, 2021) [40] of the traditional motif model PWM for de novo motif search to define the enriched motifs of target TFs. For de novo motif search, we extracted background sequence sets from reference genomes taking the A/T content of the foreground sequences into account and exactly preserving their lengths [43].
For each ChIP-seq dataset, we ensured the significant similarity (p < 0.001, TomTom tool, [44]) of the enriched motifs of the first ranks to known motifs from JASPAR [10] or CisBP [28] belonging to TFs from the family/class of a target TF. We removed from all collections datasets assigned to the superclass ‘Yet undefined DNA-binding domains {0}’ [7,8,11], or lacked the class specification. All ChIP-seq datasets passed the All ChIP-seq datasets passed the MCOT application criterion; it implied the presence of at least five distinct thresholds for the motif model [26]. This criterion rejected five DAP-seq datasets (ABI3VP1_tnt.VRN1_col_a, ARID_tnt.AT1G20910_col_a, BBRBPC_tnt.BPC1_colamp_a, ND_tnt.FRS9_col_a, ND_tnt.FRS9_colamp_a,) we marked them in Table S3. We removed from the analysis seven DAP-seq datasets from the C3H and GRF families (here designations of families from [4]). The C3H family was mentioned earlier as related to potentially lacking clear DNA specificity [11], and the GRF family respected ambiguous classification in JASPAR [10]. The final filtration provided 1149/74 M. musculus/A. thaliana ChIP-seq datasets, and 488 DAP-seq datasets for 148/34/305 target TFs, correspondingly. Tables S4-S6 show the abundance of TF classes for the finally compiled three benchmark collections.

4.3. Composite elements analysis

MCOT applied three basic attributes to describe CEs: mutual orientations of two sites, their location with a spacer or an overlap, and their conservation [26,31,32]. In this study, we considered only homotypic CEs with a spacer (Figure 1A, B). We used output motifs from the STREME tool [40] as Anchor motifs in MCOT. For each motif, MCOT applied the recognition threshold Thr according to the preliminary computed table ‘Thr (recognition thresholds) vs. ERRs (Expected Recognition Rates)’ for a whole-genome set of promoters of protein-coding genes [26,43]. The maximal ERR is the parameter of MCOT, here we accepted the value 1E-3 for it [43]. The conservation Ci of each of two sites in CE (i = 1, 2) is computed as follows, Ci = −Log10(ERRi). MCOT computes the asymmetry ratio (AR), a ratio between the largest and the smallest ERRs in a CE as a pair of sites, AR = Max(ERR1, ERR2) / Min(ERR1, ERR2), to define whether this CE is asymmetric or symmetric, see Figure 1C. With a given input parameter, the threshold for asymmetry ratio (TAR), either for a homo- or heterotypic CEs, the asymmetric and symmetric CEs are defined as follows: if AR ≤ TAR then a CE is symmetric, otherwise, if AR > TAR then a CE is asymmetric.
To estimate the significance of enrichment to either asymmetric or symmetric CE, MCOT performed the permutation procedure as described earlier (Figure 1D, [26]). Further, for each CEs total counts of the asymmetric and symmetric CEs in the foreground and background sequence sets were computed. Finally, the 2x2 contingency table (Figure 1E) provides the significance of Fisher exact test comparing the abundance of CEs in the foreground set with that for the background set. We assigned to the asymmetry significance -Log10[P-value] the sign ‘+’ in the case of enrichment of asymmetric CEs, otherwise, sign ‘-’ denoted the enrichment of symmetric CEs [31] (for instance, see Tables S7-S9).
Visualization of asymmetric/symmetric CEs was performed as described earlier [31] with small modifications. The options ‘Expected ERR’ and ‘Asymmetry ratio’ of MCOT [26,31,61] and its web-server WebMCOT [32,62] provided the threshold values of the maximal allowable ERRs for any motif and the TAR value for the threshold ratio of ERRs either for homotypic or heterotypic CEs [43] (see ‘Advanced options’ in the application page, [32]).
We drew asymmetry heatmaps (Figure 3B, [31]) as follows. For the foreground and background sets of sequences we compiled the full lists of predicted CEs, for each CE we computed the conservation of participant sites, {Ci} = {−Log10(ERRi)}, i = 1, 2. Total counts of CEs for the foreground and background sets were Obs and Exp, respectively. Below indices j and k denote the range of conservation of sites in CEs . For instance, for the ERR value of 0.001 we defined this range as follows, [<3.2], [3.2..3.4], [3.4..3.4] etc. up to [5.0..5.2] and [>5.2] (see Figure 3B), and counted CEs respecting all distinct combinations of conservation of sites in CEs for the foreground (Obsj,k) and background (Expj,k) sets. Finally, we plotted the per mille measure that transformed the absolute CE counts to relative ones, [Relative Abundance] = [Observed] – [Expected] = {1000*Obsj,k/Obs)} – {1000*Expj,k/Exp}.

5. Conclusions

We developed and applied a novel approach for detection of pairs of co-occurred TFBS motifs (composite elements, CEs) specific for the asymmetry in the conservation of motifs in pairs. We considered only pairs of sites predicted with the same motif model (homotypic CEs), and these pairs were located only with a spacer. We measured the asymmetry of a CE with the asymmetry ratio, equal to the ratio of the expected recognition rates of its two sites for a whole-genome set of promoters of protein-coding genes. We extracted ChIP-seq data for M. musculus/A. thaliana from GTRD, and DAP-seq data for A. thaliana from Plant Cistrome. We performed de novo motif search with the traditional PWM model. We left in analysis only the datasets with the enriched motifs significantly similar to known motifs of respective target TFs. Finally, we considered three benchmark collections: 1149/74 ChIP-seq datasets for M. musculus/A. thaliana and of 488 DAP-seq datasets for A. thaliana, they respected to 148/34/305 target TFs. We categorized the datasets in each collection into the classes of target TFs, according to the structure of their DNA-binding domains. We demonstrated that major parts of all collections revealed the significant asymmetry of motifs conservation within homotypic CEs, a minor part showed neither significant asymmetry, nor symmetry. Only several ChIP-seq datasets in the M. musculus collection showed the significant symmetry. Among the large TF classes common to M. musculus and A. thaliana, two classes, Basic leucine zipper factors (bZIP) {1.1} and Basic helix-loop-helix factors (bHLH) {1.2} ranked in the top two positions in terms of asymmetry significance for all three collections. We confirmed that target TFs with proven pioneer activity showed more significant asymmetry within homotypic CEs compared to other TFs for which such activity is not known. Overall, our results argue that detecting trends of significant enrichment of either asymmetric or symmetric homotypic CEs is a promising particular feature useful not only for their prediction but also for subsequent figuring out mechanisms of gene transcription regulation.

Supplementary Materials

The following supporting information can be downloaded at the website of this paper posted on Preprints.org. Figures S1-S7; Tables S1-S10.

Author Contributions

For research articles with several authors, a short paragraph specifying their individual contributions must be provided. The following statements should be used “Conceptualization, V.G.L. and T.I.M.; methodology, V.G.L.; software, V.G.L.; validation, V.G.L.; formal analysis, V.V.R. and A.V.T.; investigation, V.G.L.; resources, A.M.M; data curation, V.G.L.; writing—original draft preparation, V.G.L.; writing—review and editing, V.G.L. and T.I.M.; visualization, V.G.L., A.V.T. and A.M.M.; supervision, V.G.L.; project administration, V.G.L.; funding acquisition, V.G.L. All authors have read and agreed to the published version of the manuscript.

Funding

The development and implementation of bioinformatics software were supported by Russian Science Foundation project 21-14-00240, processing and analysis of data were performed using computational resources of the “Bioinformatics” Joint Computational Center supported by budget projects FWNR-2022-0020.

Acknowledgments

The bioinformatics data analysis was performed in part on the equipment of the Bioinformatics Shared Access Center within the framework of State Assignment Kurchatov Genomic Center of ICG SB RAS (FWNR-2022-0020).

Conflicts of Interest

The authors declare no conflict of interest

References

  1. Nakato, R.; Shirahige, K. Recent advances in ChIP-seq analysis: from quality management to whole-genome annotation. Brief Bioinform. 2017, 18, 279-290. [CrossRef]
  2. Lloyd, S.M.; Bao, X. Pinpointing the genomic localizations of chromatin-associated proteins: the yesterday, today, and tomorrow of ChIP-seq. Curr Protoc Cell Biol. 2019, 84, e89. [CrossRef]
  3. Johnson, D. S.; Mortazavi, A.; Myers, R. M.; Wold, B. Genome-wide mapping of in vivo protein-DNA interactions. Science 2007, 316(5830), 1497–1502. [CrossRef]
  4. O'Malley, R.C.; Huang, S.C.; Song, L.; Lewsey, M.G.; Bartlett, A.; Nery, J.R.; Galli, M.; Gallavotti, A.; Ecker, J.R. Cistrome and epicistrome features shape the regulatory DNA landscape. Cell 2016, 165, 1280–1292. [CrossRef]
  5. Zhang, Y.; Li, Z.; Zhang, Y.; Lin, K.; Peng, Y.; Ye, L.; Zhuang, Y.; Wang, M.; Xie, Y.; Guo, J.; et al. Evolutionary rewiring of the wheat transcriptional regulatory network by lineage-specific transposable elements. Genome Res. 2021, 31(12), 2276–2289. [CrossRef]
  6. Wingender, E. Criteria for an updated classification of human transcription factor DNA-binding domains. J Bioinform Comput Biol. 2013, 11(1), 1340007. [CrossRef]
  7. Wingender, E.; Schoeps, T.; Dönitz, J. TFClass: an expandable hierarchical classification of human transcription factors. Nucleic Acids Res. 2013, 41(Database issue), D165–D170. [CrossRef]
  8. Wingender, E.; Schoeps, T.; Haubrock, M.; Dönitz, J. TFClass: a classification of human transcription factors and their rodent orthologs. Nucleic Acids Res. 2015, 43(Database issue), D97–D102. [CrossRef]
  9. Wingender, E.; Schoeps, T.; Haubrock, M.; Krull, M.; Dönitz, J. TFClass: expanding the classification of human transcription factors to their mammalian orthologs. Nucleic Acids Res. 2018, 46, D343-D347. [CrossRef]
  10. Castro-Mondragon, J. A.; Riudavets-Puig, R.; Rauluseviciute, I.; Lemma, R. B.; Turchi, L.; Blanc-Mathieu, R.; Lucas, J.; Boddie, P.; Khan, A.; Manosalva Pérez, N.; et al. JASPAR 2022: the 9th release of the open-access database of transcription factor binding profiles. Nucleic Acids Res. 2022, 50(D1), D165–D173. [CrossRef]
  11. Blanc-Mathieu, R.; Dumas, R.; Turchi, L.; Lucas, J.; Parcy, F. Plant-TFClass: a structural classification for plant transcription factors. Trends Plant Sci. 2023, S1360-1385(23), 00227-3. [CrossRef]
  12. Lambert, S.A.; Jolma, A.; Campitelli, L.F.; Das, P.K.; Yin, Y.; Albu, M.; Chen, X.; Taipale, J.; Hughes, T.R.; Weirauch, M.T. The Human transcription factors. Cell 2018, 172, 650–665. [CrossRef]
  13. Morgunova, E.; Taipale, J. Structural perspective of cooperative transcription factor binding. Curr. Opin. Struct. Biol. 2017, 47, 1–8. [CrossRef]
  14. Reiter, F.; Wienerroither, S., Stark, A. Combinatorial function of transcription factors and cofactors. Curr. Opin. Genet. Dev. 2017, 43, 73–81. [CrossRef]
  15. Zeitlinger, J. Seven myths of how transcription factors read the cis-regulatory code. Curr Opin Syst Biol. 2020, 23, 22-31 . [CrossRef]
  16. Kribelbauer, J. F., Rastogi, C., Bussemaker, H. J., Mann, R. S. Low-affinity binding sites and the transcription factor specificity paradox in eukaryotes. Annu Rev Cell Dev Biol., 2019, 35, 357–379. [CrossRef]
  17. Mayran, A.; Drouin, J. Pioneer transcription factors shape the epigenetic landscape. J Biol Chem. 2018, 293, 13795-13804. [CrossRef]
  18. Bulyk, M. L.; Drouin, J.; Harrison, M. M.; Taipale, J.; Zaret, K. S. Pioneer factors - key regulators of chromatin and gene expression. Nature Rev. Genet. 2023. [CrossRef]
  19. Lai, X.; Verhage, L.; Hugouvieux, V.; Zubieta, C. Pioneer factors in animals and plants-colonizing chromatin for gene regulation. Molecules 2018, 23, e1914. [CrossRef]
  20. Zaret, K. S.; Carroll, J. S. Pioneer transcription factors: establishing competence for gene expression. Genes Dev. 2011, 25, 2227-2241. [CrossRef]
  21. Whitington, T.; Frith, M.C.; Johnson, J.; Bailey, T.L. Inferring transcription factor complexes from ChIP-seq data. Nucleic Acids Res. 2011, 39, 98. [CrossRef]
  22. Guo, Y.; Mahony, S.; Gifford, D.K. High resolution genome wide binding event finding and motif discovery reveals transcription factor spatial binding constraints. PLoS Comput Biol. 2012, 8, e1002638. [CrossRef]
  23. Kazemian, M.; Pham, H.; Wolfe, S.A.; Brodsky, M. H.; Sinha, S. Widespread evidence of cooperative DNA binding by transcription factors in Drosophila development. Nucleic Acids Res. 2013, 41, 8237-8352. [CrossRef]
  24. Jankowski, A.; Prabhakar, S.; Tiuryn, J. TACO: a general-purpose tool for predicting cell-type-specific transcription factor dimers. BMC Genomics 2014, 15, 208. [CrossRef]
  25. Toivonen, J.; Kivioja, T.; Jolma, A.; Yin, Y.; Taipale, J.; Ukkonen, E. Modular discovery of monomeric and dimeric transcription factor binding motifs for large data sets. Nucleic Acids Res. 2018, 46(8), e44. [CrossRef]
  26. Levitsky, V.; Zemlyanskaya, E.; Oshchepkov, D.; Podkolodnaya, O.; Ignatieva, E.; Grosse, I.; Mironova, V.; Merkulova, T. A single ChIP-seq dataset is sufficient for comprehensive analysis of motifs co-occurrence with MCOT package. Nucleic Acids Res. 2019, 47, e139. [CrossRef]
  27. Jolma, A.; Yan, J.; Whitington, T.; Toivonen, J.; Nitta, K. R.; Rastas, P.; Morgunova, E.; Enge, M.; Taipale, M.; Wei, G.; et al. DNA-binding specificities of human transcription factors. Cell 2013, 152, 327–339. [CrossRef]
  28. Weirauch, M.T.; Yang, A.; Albu, M.; Cote, A.G.; Montenegro-Montero, A.; Drewe, P.; Najafabadi, H.S.; Lambert, S.A.; Mann, I.; Cook, K.; et al. Determination and inference of eukaryotic transcription factor sequence specificity. Cell 2014, 158, 1431–1443. [CrossRef]
  29. Kulakovskiy, I.V.; Vorontsov, I.E.; Yevshin, I.S.; Sharipov, R.N.; Fedorova, A.D.; Rumynskiy, E.I.; Medvedeva, Y.A.; Magana-Mora, A.; Bajic, V.B.; Papatsenko, D.A.; et al. HOCOMOCO: expansion and enhancement of the collection of transcription factor binding sites models. Nucleic Acids Res. 2018, 46, D252-D259. [CrossRef]
  30. Ambrosini, G.; Vorontsov, I.; Penzar, D.; Groux, R.; Fornes, O.; Nikolaeva, D. D.; Ballester, B.; Grau, J.; Grosse, I.; Makeev, V.; Kulakovskiy, I.; Bucher, P. Insights gained from a comprehensive all-against-all transcription factor binding motif benchmarking study. Genome Biol 2020, 21, 114. [CrossRef]
  31. Levitsky, V.; Oshchepkov, D.; Zemlyanskaya, E.; Merkulova, T. Asymmetric conservation within pairs of co-occurred motifs mediates weak direct binding of transcription factors in ChIP-seq data. Int. J. Mol. Sci. 2020, 21, 6023. [CrossRef]
  32. Levitsky, V.G.; Mukhin, A.M.; Oshchepkov, D.Y.; Zemlyanskaya, E.V.; Lashin, S.A. Web-MCOT Server for Motif Co-Occurrence Search in ChIP-Seq Data. Int. J. Mol. Sci. 2022, 23, 8981. [CrossRef]
  33. Casey, B. H.; Kollipara, R. K.; Pozo, K.; Johnson, J. E. Intrinsic DNA binding properties demonstrated for lineage-specifying basic helix-loop-helix transcription factors. Genome Res. 2018, 28(4), 484–496. [CrossRef]
  34. Merkulov, V.M.; Merkulova, T.I. Structural variants of glucocorticoid receptor binding sites and different versions of positive glucocorticoid responsive elements: Analysis of GR-TRRD database. J Steroid Biochem Mol Biol. 2009, 115(1-2), 1-8. [CrossRef]
  35. Nagy, G.; Nagy, L. Motif grammar: the basis of the language of gene expression. Comput Struct Biotec. 2020, 18, 2026-2032. [CrossRef]
  36. Roosjen, M.; Paque, S.; Weijers, D. Auxin Response Factors: output control in auxin biology. J Exp Bot. 2018, 69(2), 179-188. [CrossRef]
  37. Stigliani, A.; Martin-Arevalillo, R.; Lucas, J.; Bessy, A.; Vinos-Poyo, T.; Mironova, V.; Vernoux, T.; Dumas, R.; Parcy, F. Capturing auxin response factors syntax using DNA binding models. Mol Plant 2019, 12(6), 822–832. [CrossRef]
  38. Freire-Rios, A.; Tanaka, K.; Crespo, I.; van der Wijk, E.; Sizentsova, Y.; Levitsky, V.; Lindhoud, S.; Fontana, M.; Hohlbein, J.; Boer, D. R.; et al., Architecture of DNA elements mediating ARF transcription factor binding and auxin-responsive gene expression in Arabidopsis. . Proc Natl Acad Sci U S A, 2020, 117(39), 24557–24566. [CrossRef]
  39. Lavrekha, V. V.; Levitsky, V. G.; Tsukanov, A. V.; Bogomolov, A. G.; Grigorovich, D. A.; Omelyanchuk, N.; Ubogoeva, E. V.; Zemlyanskaya, E. V.; Mironova, V. (2022). CisCross: A gene list enrichment analysis to predict upstream regulators in Arabidopsis thaliana. Front Plant Sci. 2022, 13, 942710. [CrossRef]
  40. Bailey, T.L. STREME: Accurate and versatile sequence motif discovery. Bioinformatics 2021, 37, 2834–2840. [CrossRef]
  41. Kolmykov, S.; Yevshin, I.; Kulyashov, M.; Sharipov, R.; Kondrakhin, Y.; Makeev, V.J.; Kulakovskiy, I. V.; Kel, A.; Kolpakov, F. GTRD: An integrated view of transcription regulation. Nucleic Acids Res. 2021, 49, D104–D111. [CrossRef]
  42. McLeay, R.C.; Bailey, T.L. Motif Enrichment Analysis: a unified framework and an evaluation on ChIP data. BMC Bioinformatics 2010, 11, 165. [CrossRef]
  43. Tsukanov, A. V.; Mironova, V. V.; Levitsky, V. G. Motif models proposing independent and interdependent impacts of nucleotides are related to high and low affinity transcription factor binding sites in Arabidopsis. Front Plant Sci. 2022, 13, 938545. [CrossRef]
  44. Gupta, S.; Stamatoyannopolous, J. A.; Bailey, T. L.; Noble, W. S. Quantifying similarity between motifs. Genome Biol. 2007, 8, R24. [CrossRef]
  45. Wójcikowska, B.; Belaidi, S.; Robert, H. S. Game of Thrones among AUXIN RESPONSE FACTORs - over thirty years of MONOPTEROS research. J Exp Bot. 2023. [CrossRef]
  46. Ma, J.; Liu, Y.; Zhou, W.; Zhu, Y.; Dong, A.; Shen, W. H. Histone chaperones play crucial roles in maintenance of stem cell niche during plant root development. Plant J. 2018, 95(1), 86–100. [CrossRef]
  47. Amoutzias, G. D.; Robertson, D. L.; Van de Peer, Y.; Oliver, S. G. Choose your partners: dimerization in eukaryotic transcription factors. Trends Biochem Sci. 2008, 33(5), 220–229. [CrossRef]
  48. Gramzow, L.; Ritz, M. S.; Theissen, G. On the origin of MADS-domain transcription factors. Trends Genet. 2010, 26(4), 149–153. [CrossRef]
  49. Escrivá García, H.; Laudet, V.; Robinson-Rechavi, M. Nuclear receptors are markers of animal genome evolution. J Struct Funct Genomics, 2003, 3(1-4), 177–184. [CrossRef]
  50. Wang, Y.; Levy, D. E. Comparative evolutionary genomics of the STAT family of transcription factors. JAK-STAT, 2012, 1(1), 23–33. [CrossRef]
  51. Żyła, N.; Babula-Skowrońska, D. Evolutionary consequences of functional and regulatory divergence of HD-Zip I transcription factors as a source of diversity in protein interaction networks in plants. J Mol Evol. 2023. [CrossRef]
  52. Kohler, J. J.; Metallo, S. J.; Schneider, T. L.; Schepartz, A. DNA specificity enhanced by sequential binding of protein monomers. Proc Natl Acad Sci U S A, 1999, 96(21), 11735–11739. [CrossRef]
  53. Metallo, S.J.; Schepartz, A. Certain bZIP peptides bind DNA sequentially as monomers and dimerize on the DNA. Nat Struct Biol. 1997, 4(2), 115-117. [CrossRef]
  54. Ecevit, O.; Khan, M. A.; Goss, D. J. Kinetic analysis of the interaction of b/HLH/Z transcription factors Myc, Max, and Mad with cognate DNA. Biochemistry 2010, 49(12), 2627–2635. [CrossRef]
  55. Holmbeck, S.M.; Dyson, H.J.; Wright, P.E. DNA-induced conformational changes are the basis for cooperative dimerization by the DNA binding domain of the retinoid X receptor. J Mol Biol. 1998, 284, 533–539. [CrossRef]
  56. Tiwari, M.; Oasa, S.; Yamamoto, J.; Mikuni, S.; Kinjo, M. A quantitative study of internal and external interactions of homodimeric glucocorticoid receptor using fluorescence cross-correlation spectroscopy in a live cell. Sci Rep. 2017, 7(1), 4336. [CrossRef]
  57. Castellanos, M.; Mothi, N.; Muñoz, V. Eukaryotic transcription factors can track and control their target genes using DNA antennas. Nature comm. 2020, 11(1), 540. [CrossRef]
  58. Zhang, Y.; Liu, T.; Meyer, C. A.; Eeckhoute, J.; Johnson, D. S.; Bernstein, B. E.; Nusbaum, C.; Myers, R. M.; Brown, M.; Li, W.; Liu, X. S. Model-based analysis of ChIP-Seq (MACS). Genome Biol. 2008, 9(9), R137. [CrossRef]
  59. Tian, F.; Yang, D. C.; Meng, Y. Q.; Jin, J.; Gao, G. PlantRegMap: charting functional regulatory maps in plants. Nucleic Acids Res. 2020, 48(D1), D1104–D1113. [CrossRef]
  60. Lamesch, P.; Berardini, T. Z.; Li, D.; Swarbreck, D.; Wilks, C.; Sasidharan, R.; Muller, R.; Dreher, K.; Alexander, D. L.; Garcia-Hernandez, M.; et al. The Arabidopsis Information Resource (TAIR): improved gene annotation and new tools. Nucleic Acids Res. 2012, 40(Database issue), D1202–D1210. [CrossRef]
  61. MCOT. Available online: https://github.com/academiq/mcot-kernel (accessed on 30 October 2023).
  62. WebMCOT. Available online: https://webmcot.sysbio.cytogen.ru/ (accessed on 30 October 2023).
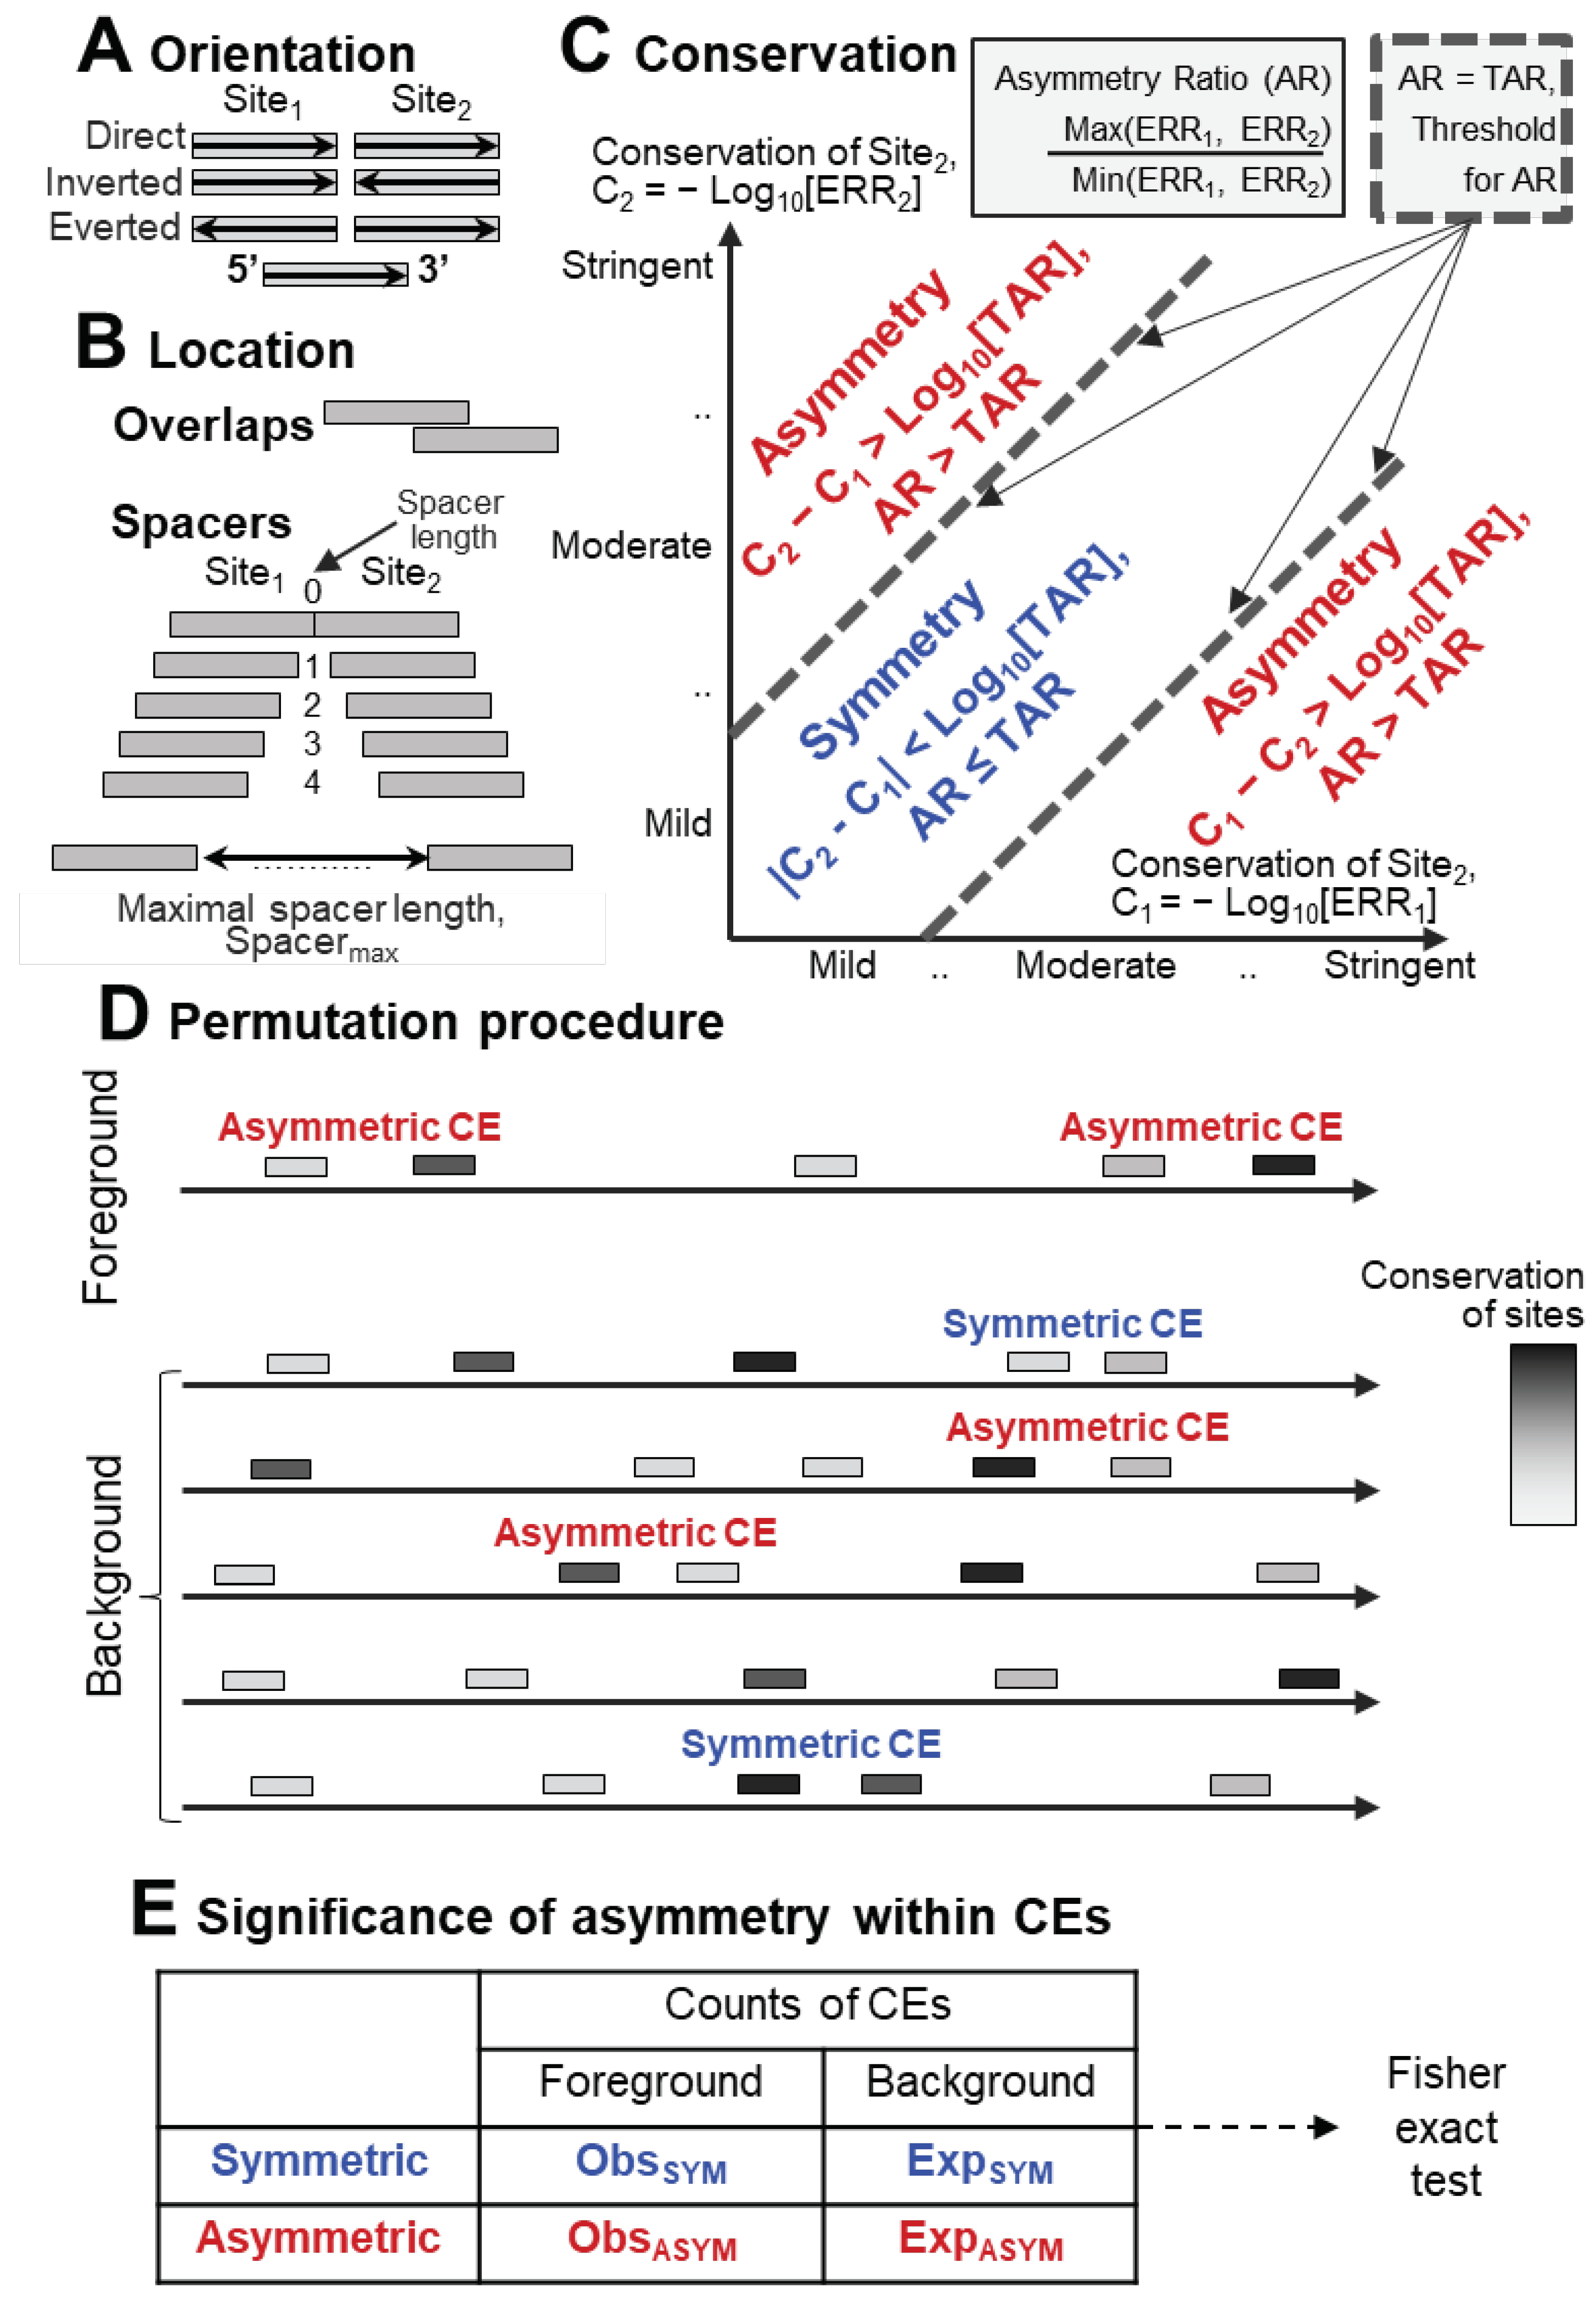
Figure 1. Classification and detection of CEs. CEs are classified according to their mutual orientations (A), overlaps or spacers (B). To distinguish asymmetric and symmetric CEs (C) we compute for each its site the conservation, as the common logarithm of the expected recognition rate (ERR) (see Materials and Methods. Section 4.3). The notations Site1 and Site2 imply that the first site located to the left, i.e. closer to the 5’end of a DNA sequence than the second site. The asymmetry ratio (AR) for the СE is the ratio of the conservation of the two sites of CE, the largest to the smallest. Further, the permutation procedure prepares a background set of sequences (D). Finally, we count the numbers of asymmetric and symmetric CEs in the entire foreground and background sets, and apply Fisher exact test (E) for the 2x2 contingency table to estimate the significance of asymmetry within a CE.
Preprints 91379 g001
Figure 2. Asymmetric Homotypic CEs of the ARF5 TF in the promoter of the A. thaliana auxin-induced gene IAA5. (A) The ARF5 motif derived from DAP-seq dataset for ARF5 TF [4,39]. (B) Predicted ARF5 sites and homotypic CEs in the promoter of IAA5 gene; in total, five sites form three homotypic CEs. (B) Analysis of the conservation of sites within these CEs shows that they are all asymmetric. The first and third CEs have a strong asymmetry; the second CE has a moderate one. The last column shows the metrics TAR reflecting the ratio between the maximal and minimal ERRs values within each CE. CEs have the maximal spacer length SpacerMAX of 30 bp, maximal ERR (motif recognition rate) of 0.001 and the threshold TAR for the ERR ratio of 1.5.
Preprints 91379 g002
Figure 3. Structural heterogeneity of homotypic CEs for TF ARF5 according to DAP-seq data [4,39]. (A) Abundance of structural variants of CEs with various orientations, overlaps and spacers. Blue, red and black colors denote Everted, Inverted and Direct orientations of motifs in pairs. The letters in the X axis labels from left to right mean full overlap (‘F’), partial overlap (‘P’), and spacer (‘S’). The numbers preceding these letters denote, respectively, the distance between nearest borders of two motifs, the length of overlap and the length of spacer. Axis Y shows the percentage of peaks containing CEs with a particular orientation and location. (B) Relative abundance of asymmetric and symmetric CEs. Red/blue colors mark enrichment/depletion according the per-mille measure, see its definition in Materials and Methods, Section 4.3. The diagonal cells show symmetric CEs, all other cells rather refer to asymmetric CEs. Axes X/Y show ranges of the conservation in pairs Site1/ Site2, here indices 1/2 mean sites located closer to 5’/3’ ends of DNA sequences.
Preprints 91379 g003
Figure 4. Abundances of homotypic asymmetric/symmetric CEs in the benchmark collections of ChIP-seq and DAP-seq data. TAR value of 1.5 was applied to compute the significance of asymmetry within homotypic CEs. (A) ChIP-seq data for M. musculus. (B) ChIP-seq data for A. thaliana. (C) DAP-seq data for A. thaliana. Axes X show the number of datasets in a TF class. Blue/brown colors count datasets possessing a high significance of enrichment within homotypic symmetric/asymmetric CEs, p < 1E-10. White color respects absence of a high significance, p > 1E-10, neither symmetric nor asymmetric CEs have high significance. Axes Y display TF classes according to TFClass [7,8] (A) and Plant-TFClass [11], (B) and (C).
Preprints 91379 g004
Figure 5. Distribution of the significance of enrichment of homotypic asymmetric/symmetric CEs as a function of the DBD structure of target TFs. TAR value of 1.5 was applied to compute the significance of asymmetry within homotypic CEs (A) ChIP-seq data for M. musculus. (B) ChIP-seq data for A. thaliana. (C) DAP-seq data for A. thaliana. Hierarchical classifications of M. musculus and A. thaliana target TFs by the structure of DBDs were derived from TFclass [7,8] and Plant-TFclass [11], see Section 4.1. Axes X mark the significance of enrichment by Fisher exact test (Figure 1E), −Log10(p-value), calculated by MCOT [21]. Brown/blue colors imply enrichment towards asymmetry/symmetry, for each TF class we considered only datasets possessing the significant enrichment towards asymmetry or symmetry according to the results from Figure 4. Axis Y mark TF classes. The boxplots depict the distributions of the Q1, Q2 and Q3 quartiles of the fractions of the considered datasets with certain values of the significance, −Log10(p-value). Whiskers on either side of the Q1/Q3 respect the minimum/maximum values if they were located within 1.5 interquartile ranges (IQR = Q3 – Q1) from Q1/Q3, otherwise they are equal to {Q1 - 1.5 * IQR} / {Q3 + 1.5 * IQR}, respectively. In the latter case, we marked all other points as outliers.
Preprints 91379 g005
Figure 6. Comparison of homotypic asymmetric CEs of pioneer TFs and other TFs. Target TFs from the benchmark collection for M. musculus ChIP-seq data were considered. TAR value of 1.5 was applied to compute the significance of asymmetry within homotypic CEs. Distribution of the significance of asymmetry within CEs for ChIP-seq datasets of target TFs with and without proven pioneer activity. Orange and white colors mark TFs with proven pioneer activity and the other TFs. Axis X denotes the significance of enrichment. The groups Symmetry, Intermediate, Asymmetry 10..20, Asymmetry 20..30, etc. imply the significant enrichment towards symmetric CEs (p-value < 1E-10), lack of pronounced significance in either direction (p > 1E-10), the significant enrichment towards asymmetric CEs (1E-10 < p-value < 1E-20, 1E-20 < p-value < 1E-30, etc.), respectively. Axis Y means fractions of datasets, labels above columns show the number of datasets.
Preprints 91379 g006
Figure 7. Homotypic asymmetric CEs of pioneer TFs. Target TFs from the benchmark collection for M. musculus ChIP-seq data were considered. TAR value of 1.5 was applied to compute the significance of asymmetry within homotypic CEs. Distribution of the significance of asymmetry within CEs for ChIP-seq datasets of target TFs with proven pioneering activity (Table S10). Axis X marks the number of ChIP-seq datasets. Axis Y shows TF classes and TF names. The maroon color indicates the high significance of asymmetry in homotypic CEs, p-value < 1E-30; the apricot color implies all remaining cases, p-value > 1E-30.
Preprints 91379 g007
Disclaimer/Publisher’s Note: The statements, opinions and data contained in all publications are solely those of the individual author(s) and contributor(s) and not of MDPI and/or the editor(s). MDPI and/or the editor(s) disclaim responsibility for any injury to people or property resulting from any ideas, methods, instructions or products referred to in the content.
Copyright: This open access article is published under a Creative Commons CC BY 4.0 license, which permit the free download, distribution, and reuse, provided that the author and preprint are cited in any reuse.
Prerpints.org logo

Preprints.org is a free preprint server supported by MDPI in Basel, Switzerland.

Subscribe

© 2024 MDPI (Basel, Switzerland) unless otherwise stated