1. Introduction
Polysaccharides from edible fungi and medicinal fungi are important components of endogenous bioactive molecules, and also involved in the cytoskeleton formation. In the past 20 years, research reports on the polysaccharides biological activities of edible and medicinal fungi have mainly focused on immune regulation, antiviral, antioxidant and hypoglycemic aspects, and their effects are multi-channel, multi-link and multi-target [1-4]. Immune experiments have proved that polysaccharides from edible and medicinal fungi could not only activate natural killer cells (NK), B cells and T cells, but also promote the production of cytokines, activate complement and play a multifaceted regulatory role on the immune system [5-7]. However, the complexity and diversity of polysaccharides pose significant challenges to the structural determination and characterization of polysaccharides, as well as the molecular mechanisms underlying their biological activities [8-10].
Agrocybe aegerita belongs to the
Agrocybe,
Bolbitiaceae,
Agaricales,
Basidomycetes, which mainly grows in tropical or subtropical areas and distributed in Sichuan, Fujian, Yunnan province in China. Fang et al. found that the average molecular weight of
Agrocybe aegerita polysaccharide (ACPS) was 11 863 Da. The animal experiment results showed that polysaccharide ACPS can improve phagocytosis rate and phagocytosis index of macrophages, the spleen index and thymus index in mice [
11]. Yi et al. reported the molecular weight of
Agrocybe aegerita lectin (AAL) was 15.18 kDa. The results of antitumor activities
in vitro indicated AAL has strong antitumor inhibition and apoptosis inducing effects on SGC7901, MGC80-3, SW480, HL-60, BGC-823, HeLa cell lines and mouse sarcoma S-180 cell line [
12]. Ji et al. extracted polysaccharide (AAP) from
Agrocybe aegerita, and found that AAP decreased TNF-α and increased IFN-β to regulate the immune function of endothelial cells and enhance the anti-tumor ability [
13]. Jing et al. extracted two polysaccharides (Al-MPS and AC-MPS) from the fruiting body of
Agrocybe aegerita. Al-MPS and AC-MPS had antioxidant and anti-aging effects by scavenging ability of hydroxyl radical and DPPH radical [
14].
Hygrophorus olivaceoalbus belongs to Umbelliferae, Umbelliferae, Agaricales, Basidiomycetes, which is scattered or clustered in the forest in autumn and summer, and are widely distributed in Jilin, Sichuan, Heilongjiang province in China. Yajiang County is located in the south of Garzê Tibetan Autonomous Prefecture. The natural geographical advantages of Yajiang County make it rich in forest resources and agricultural resources, and provide a superior growth environment for large fungi. At present, the structure and activities of Agrocybe aegerita and Hygrophorus olivacoalbus polysaccharides from Yajiang County have not been reported. In this study, Agrocybe aegerita and Hygrophorus olivaceoalbus were collected in Yajiang county, Sichuan Province, China, and two new polysaccharides AA-P and HO-P were extracted from them, respectively. The structure and activities of AA-P and HO-P were also studied to provide a data foundation for the further application of polysaccharide.
2. Materials and Methods
2.1. Polysaccharide Extraction and Purification
Polysaccharides were extracted from 300 g of dry fruiting body of Agrocybe aegerita and Hygrophorus olivaceoalbus, which were named AA-P and HO-P, using hot water extraction method and purified by DEAE cellulose (DE-52) column.
2.2. Polysaccharide Structure Characterization
The molecular weight was tested via HPGPC [
15]. Fourier transform infrared spectrometer (Nicolet 5700, Thermo Scientific) was used to get the FT-IR data. The methylation derivatized polysaccharide product was determined by GC-MS (Agilent 7890A, USA). The NMR spectra was determined by the Varian Unity INOVA 400/45 (Varian Medical Systems, USA).
2.3. Effects of Polysaccharide on T Cells, B Cells and RAW264.7 Cells
Proliferation effects of polysaccharide on cells was determined via CCK-8 method [
25]. The cells cycle were measured at 488 nm in BD Flow Cytometry. The cytokines was detected by the ELISA kit (Wuhan BOSTER Biological Technology Co., Ltd.; Wuhan).
2.4. Statistical Analysis
All statistical comparisons were analyzed using a one-way analysis of variance (ANOVA) test followed by Student-Newman-Keuls test. *: P < 0.05; **: P < 0.01.
3. Results and Discussion
3.1. Molecular Weight of AA-P and HO-P
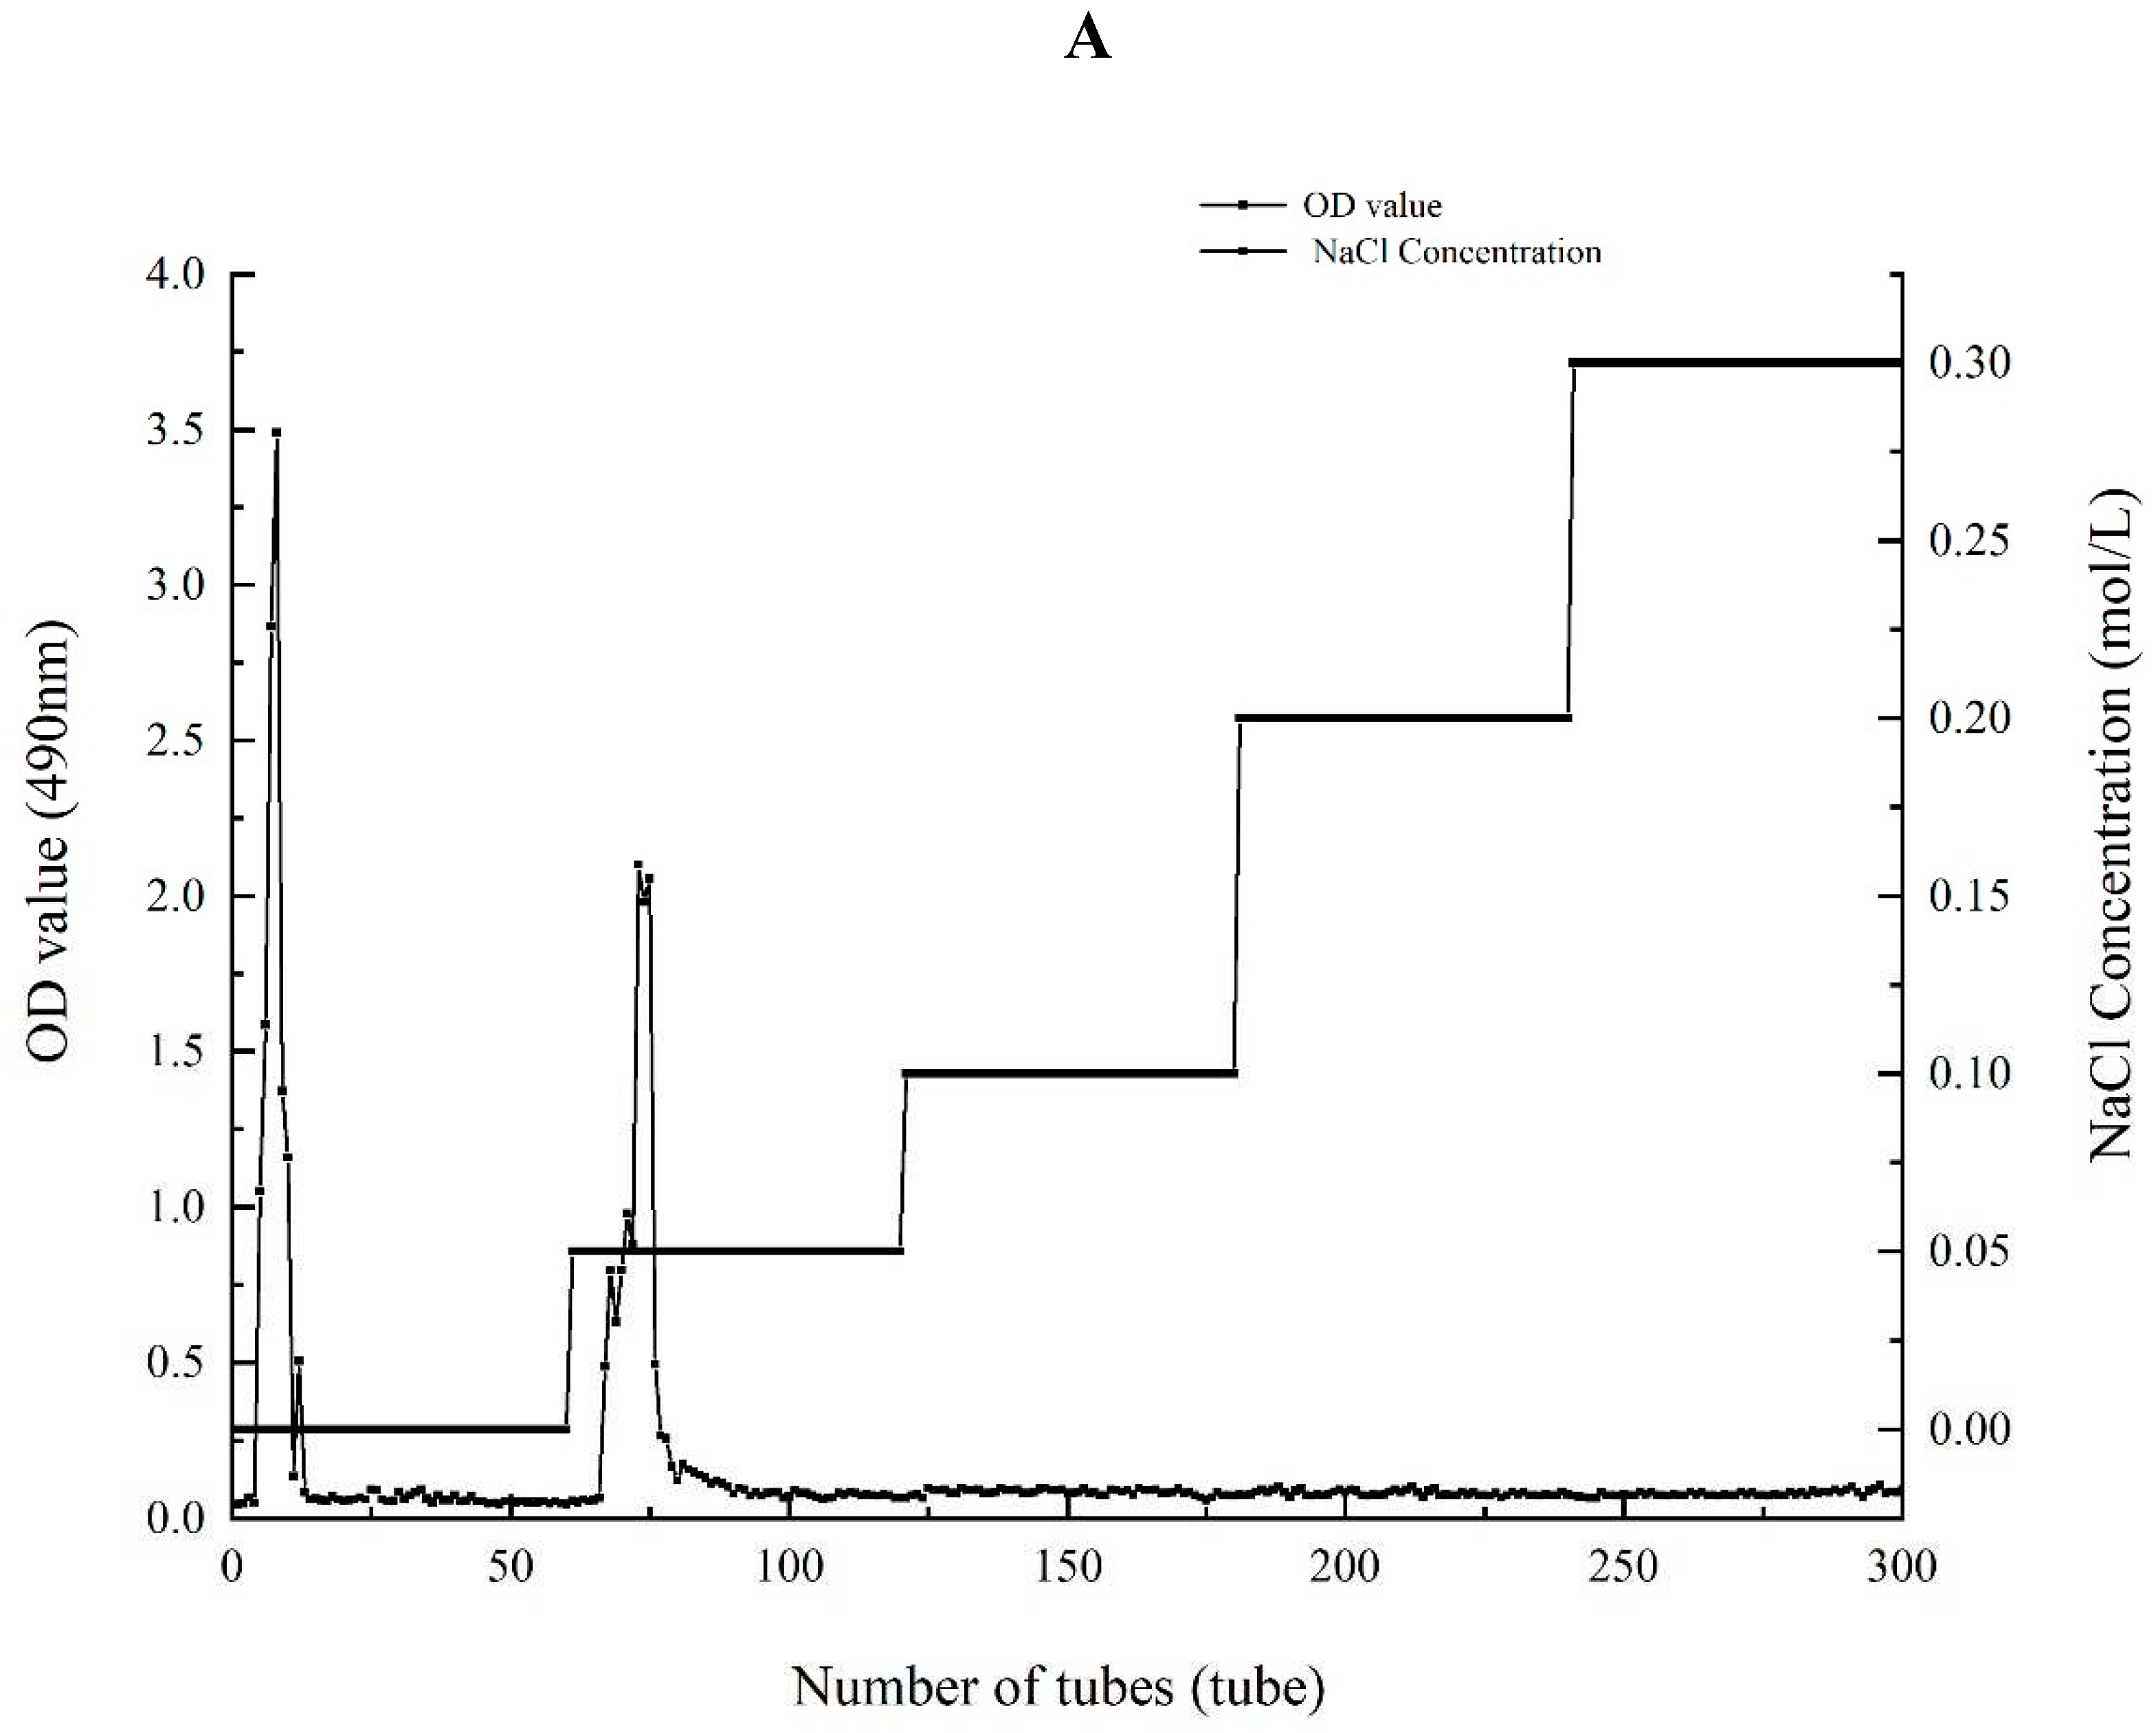
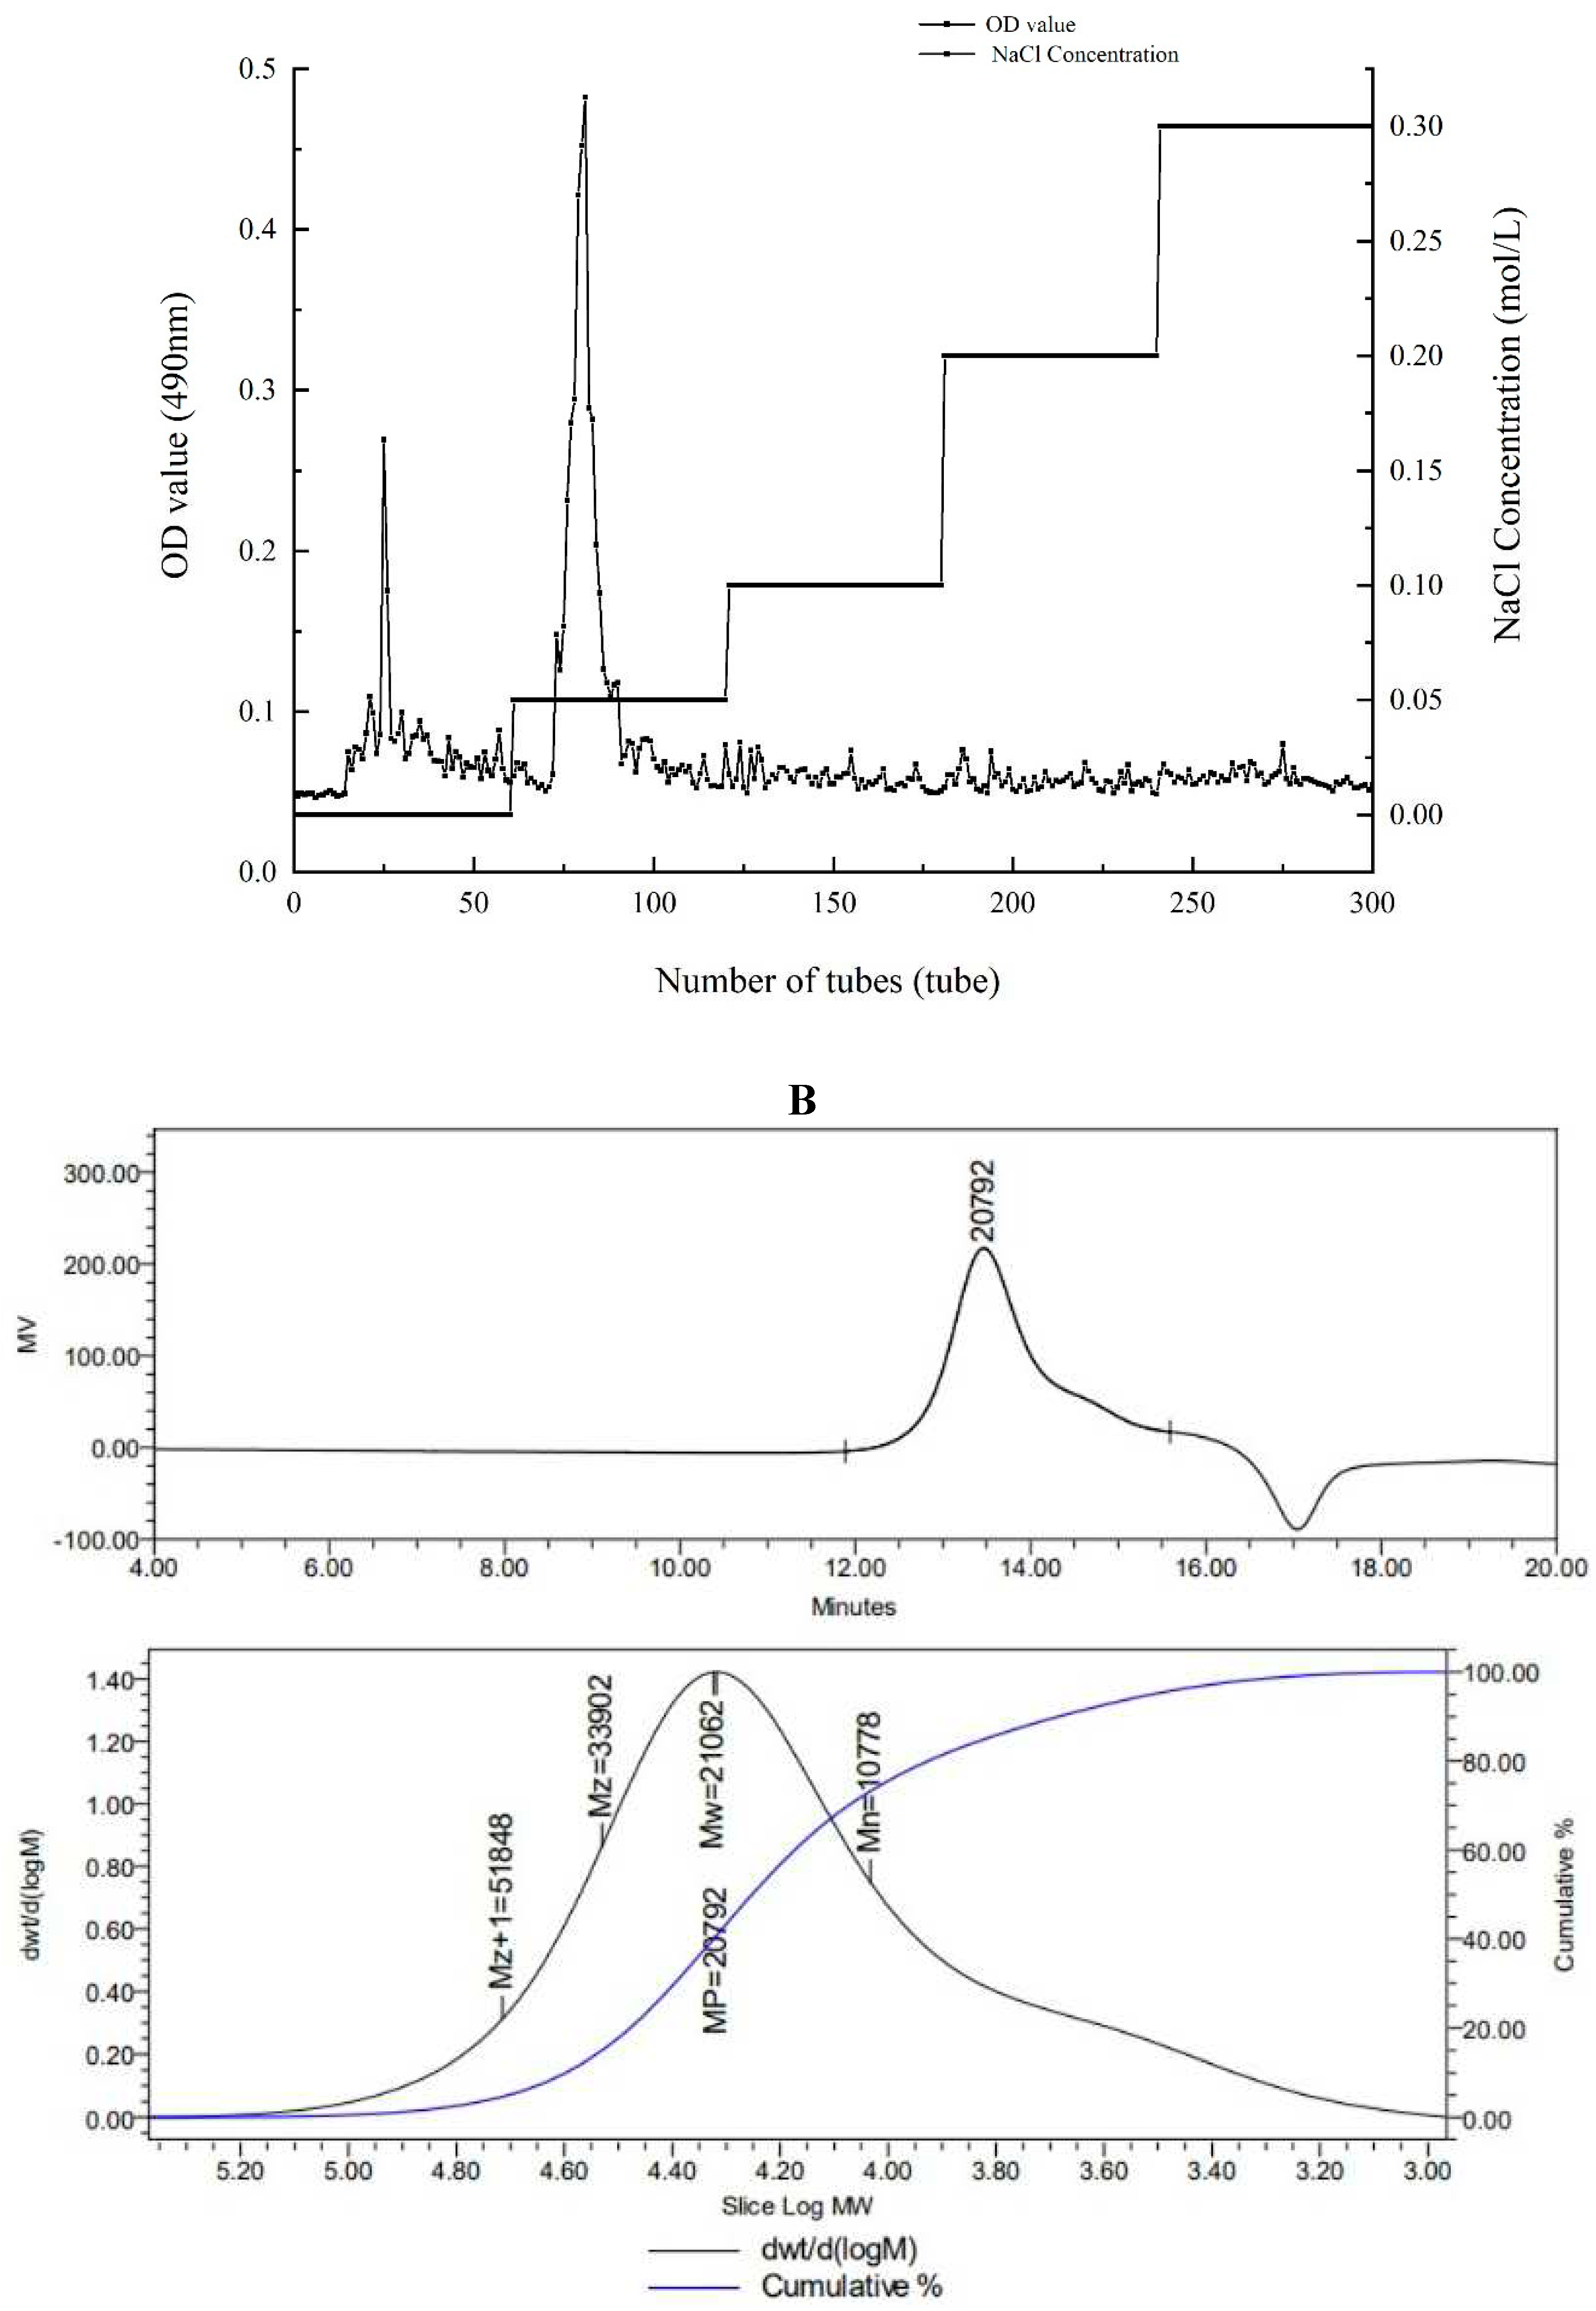
There were both two main elution peaks, respectively, with the NaCl concentration increased. The neutral polysaccharide in distilled water were collected as the subject of research. The yield of AA-P and HO-P in the total fruiting body were 0.2% and 0.3%, respectively (
Figure 1A,B). The weight-average molecular weight (Mw) of AA-P and HO-P were 21062 Da and 24481 Da, respectively (
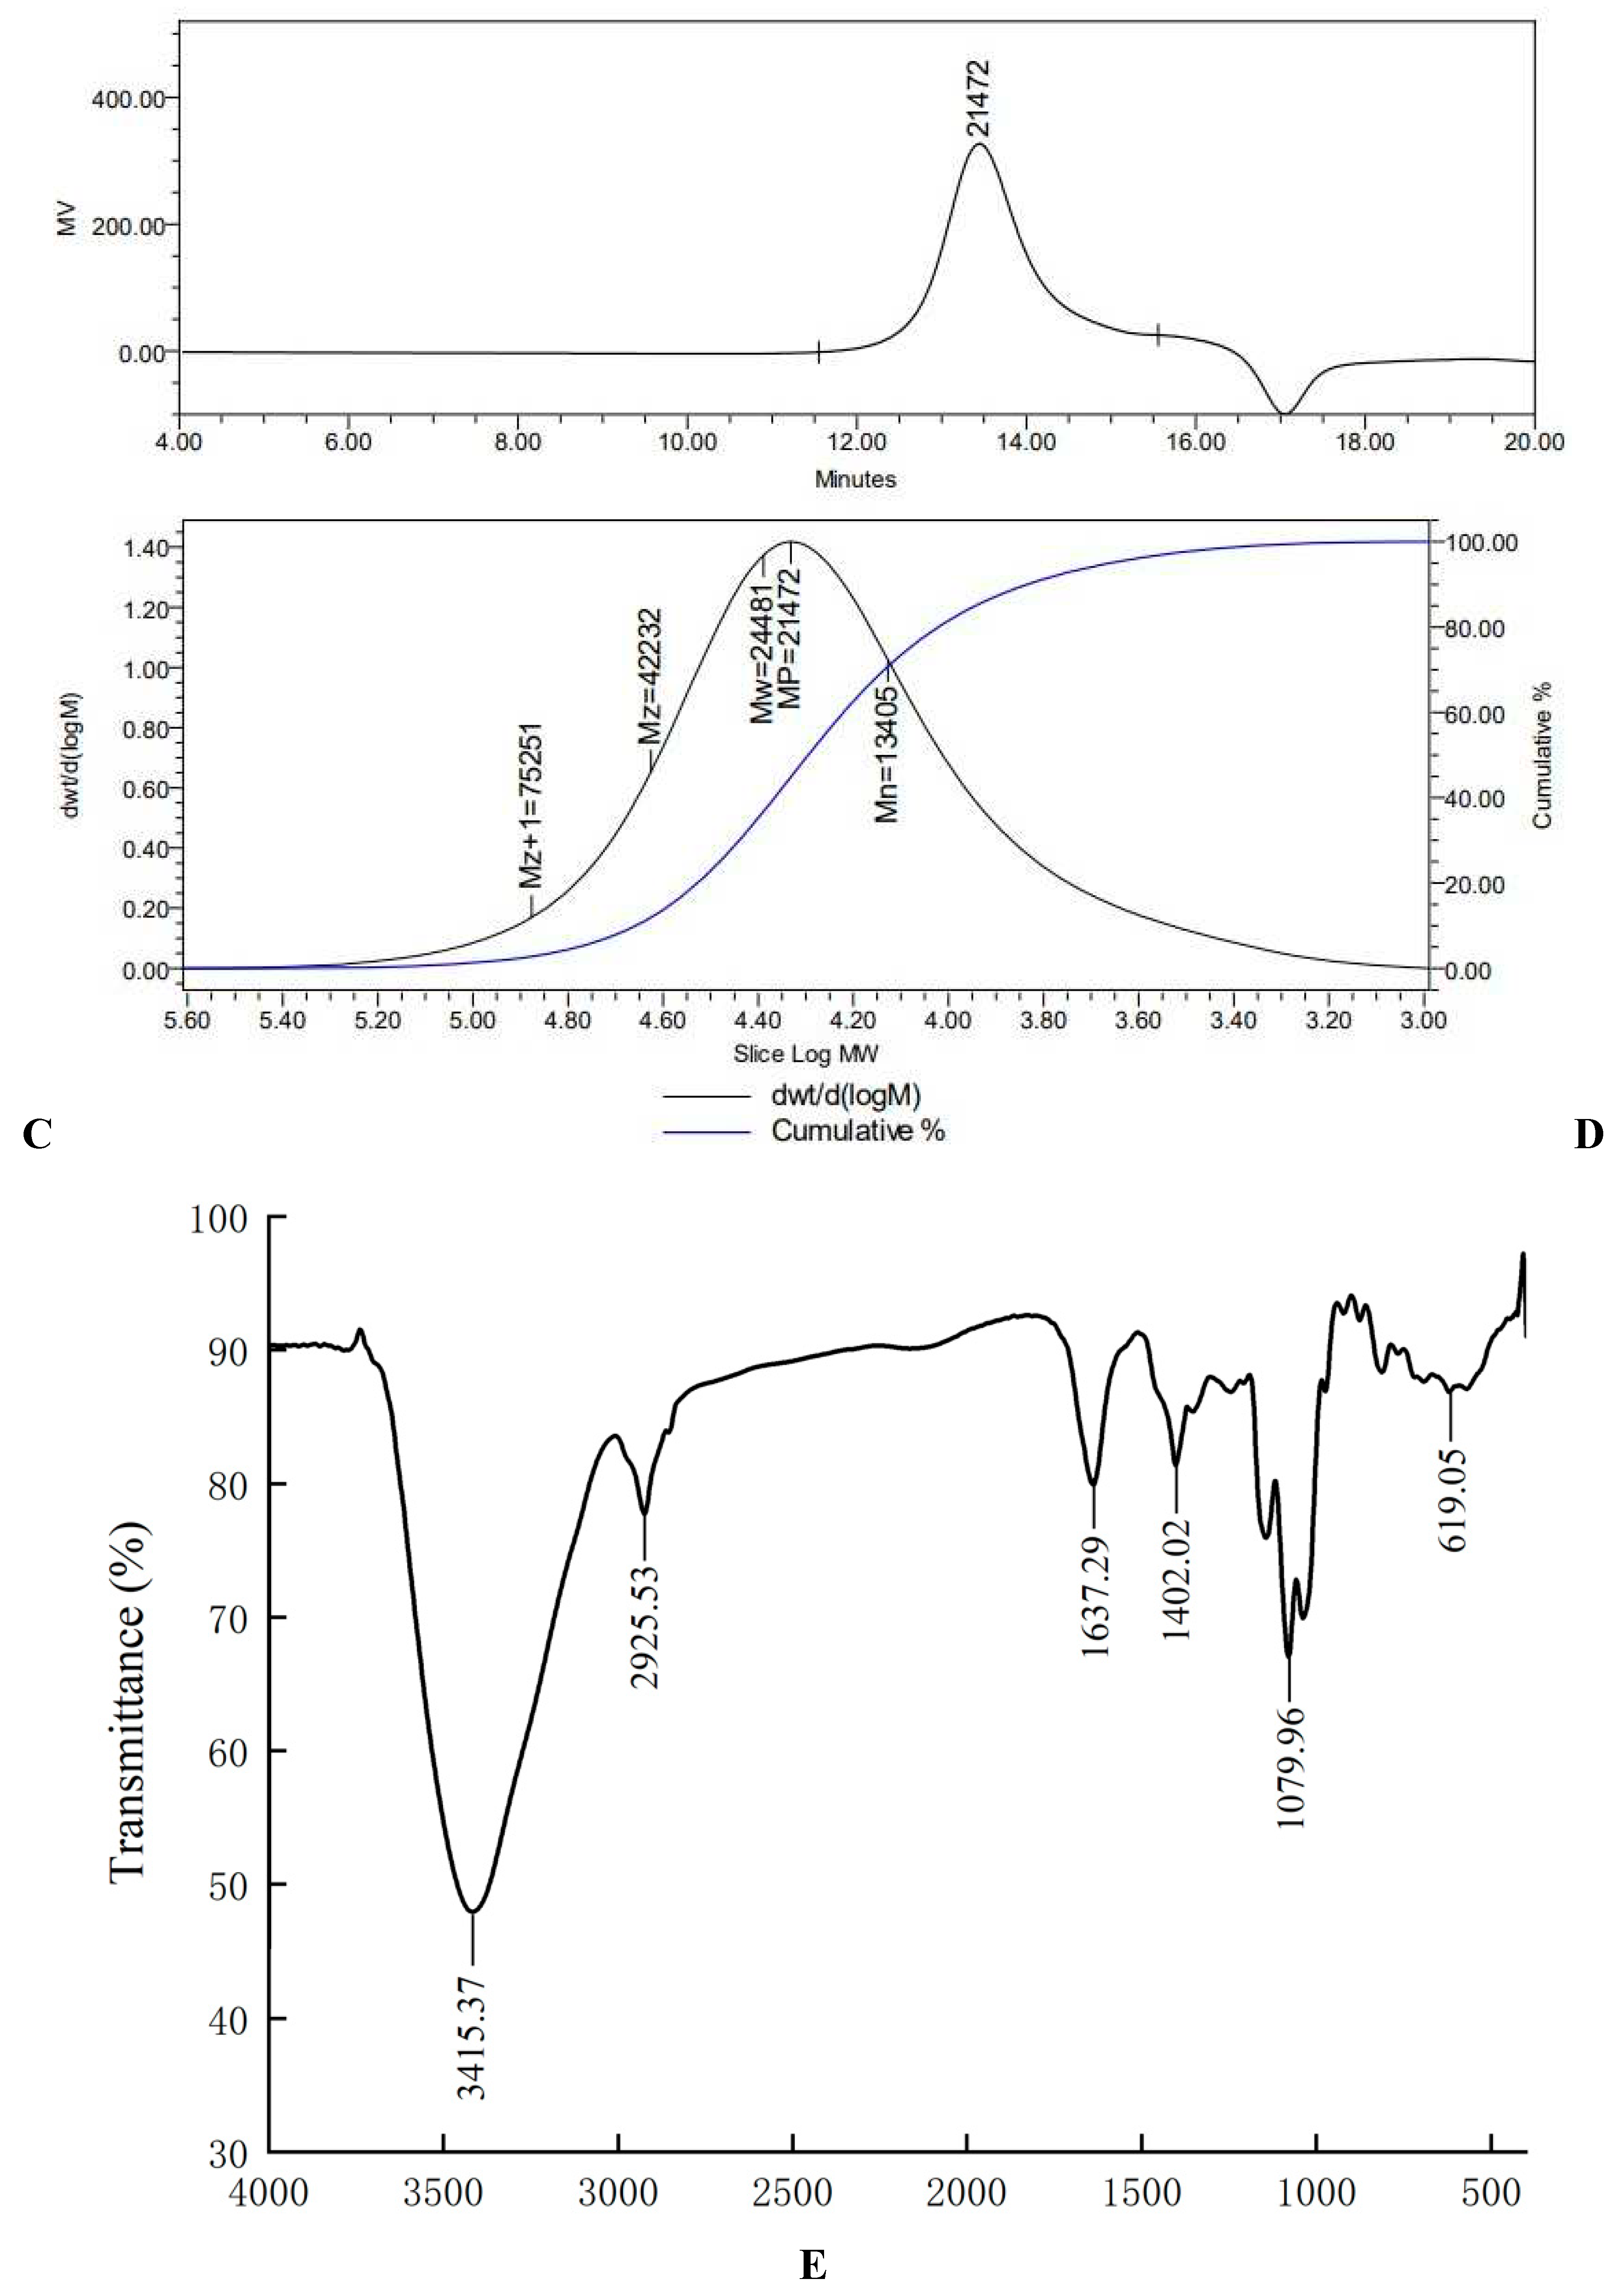
Figure 1C,D).
3.2. FT-IR Analysis of AA-P and HO-P
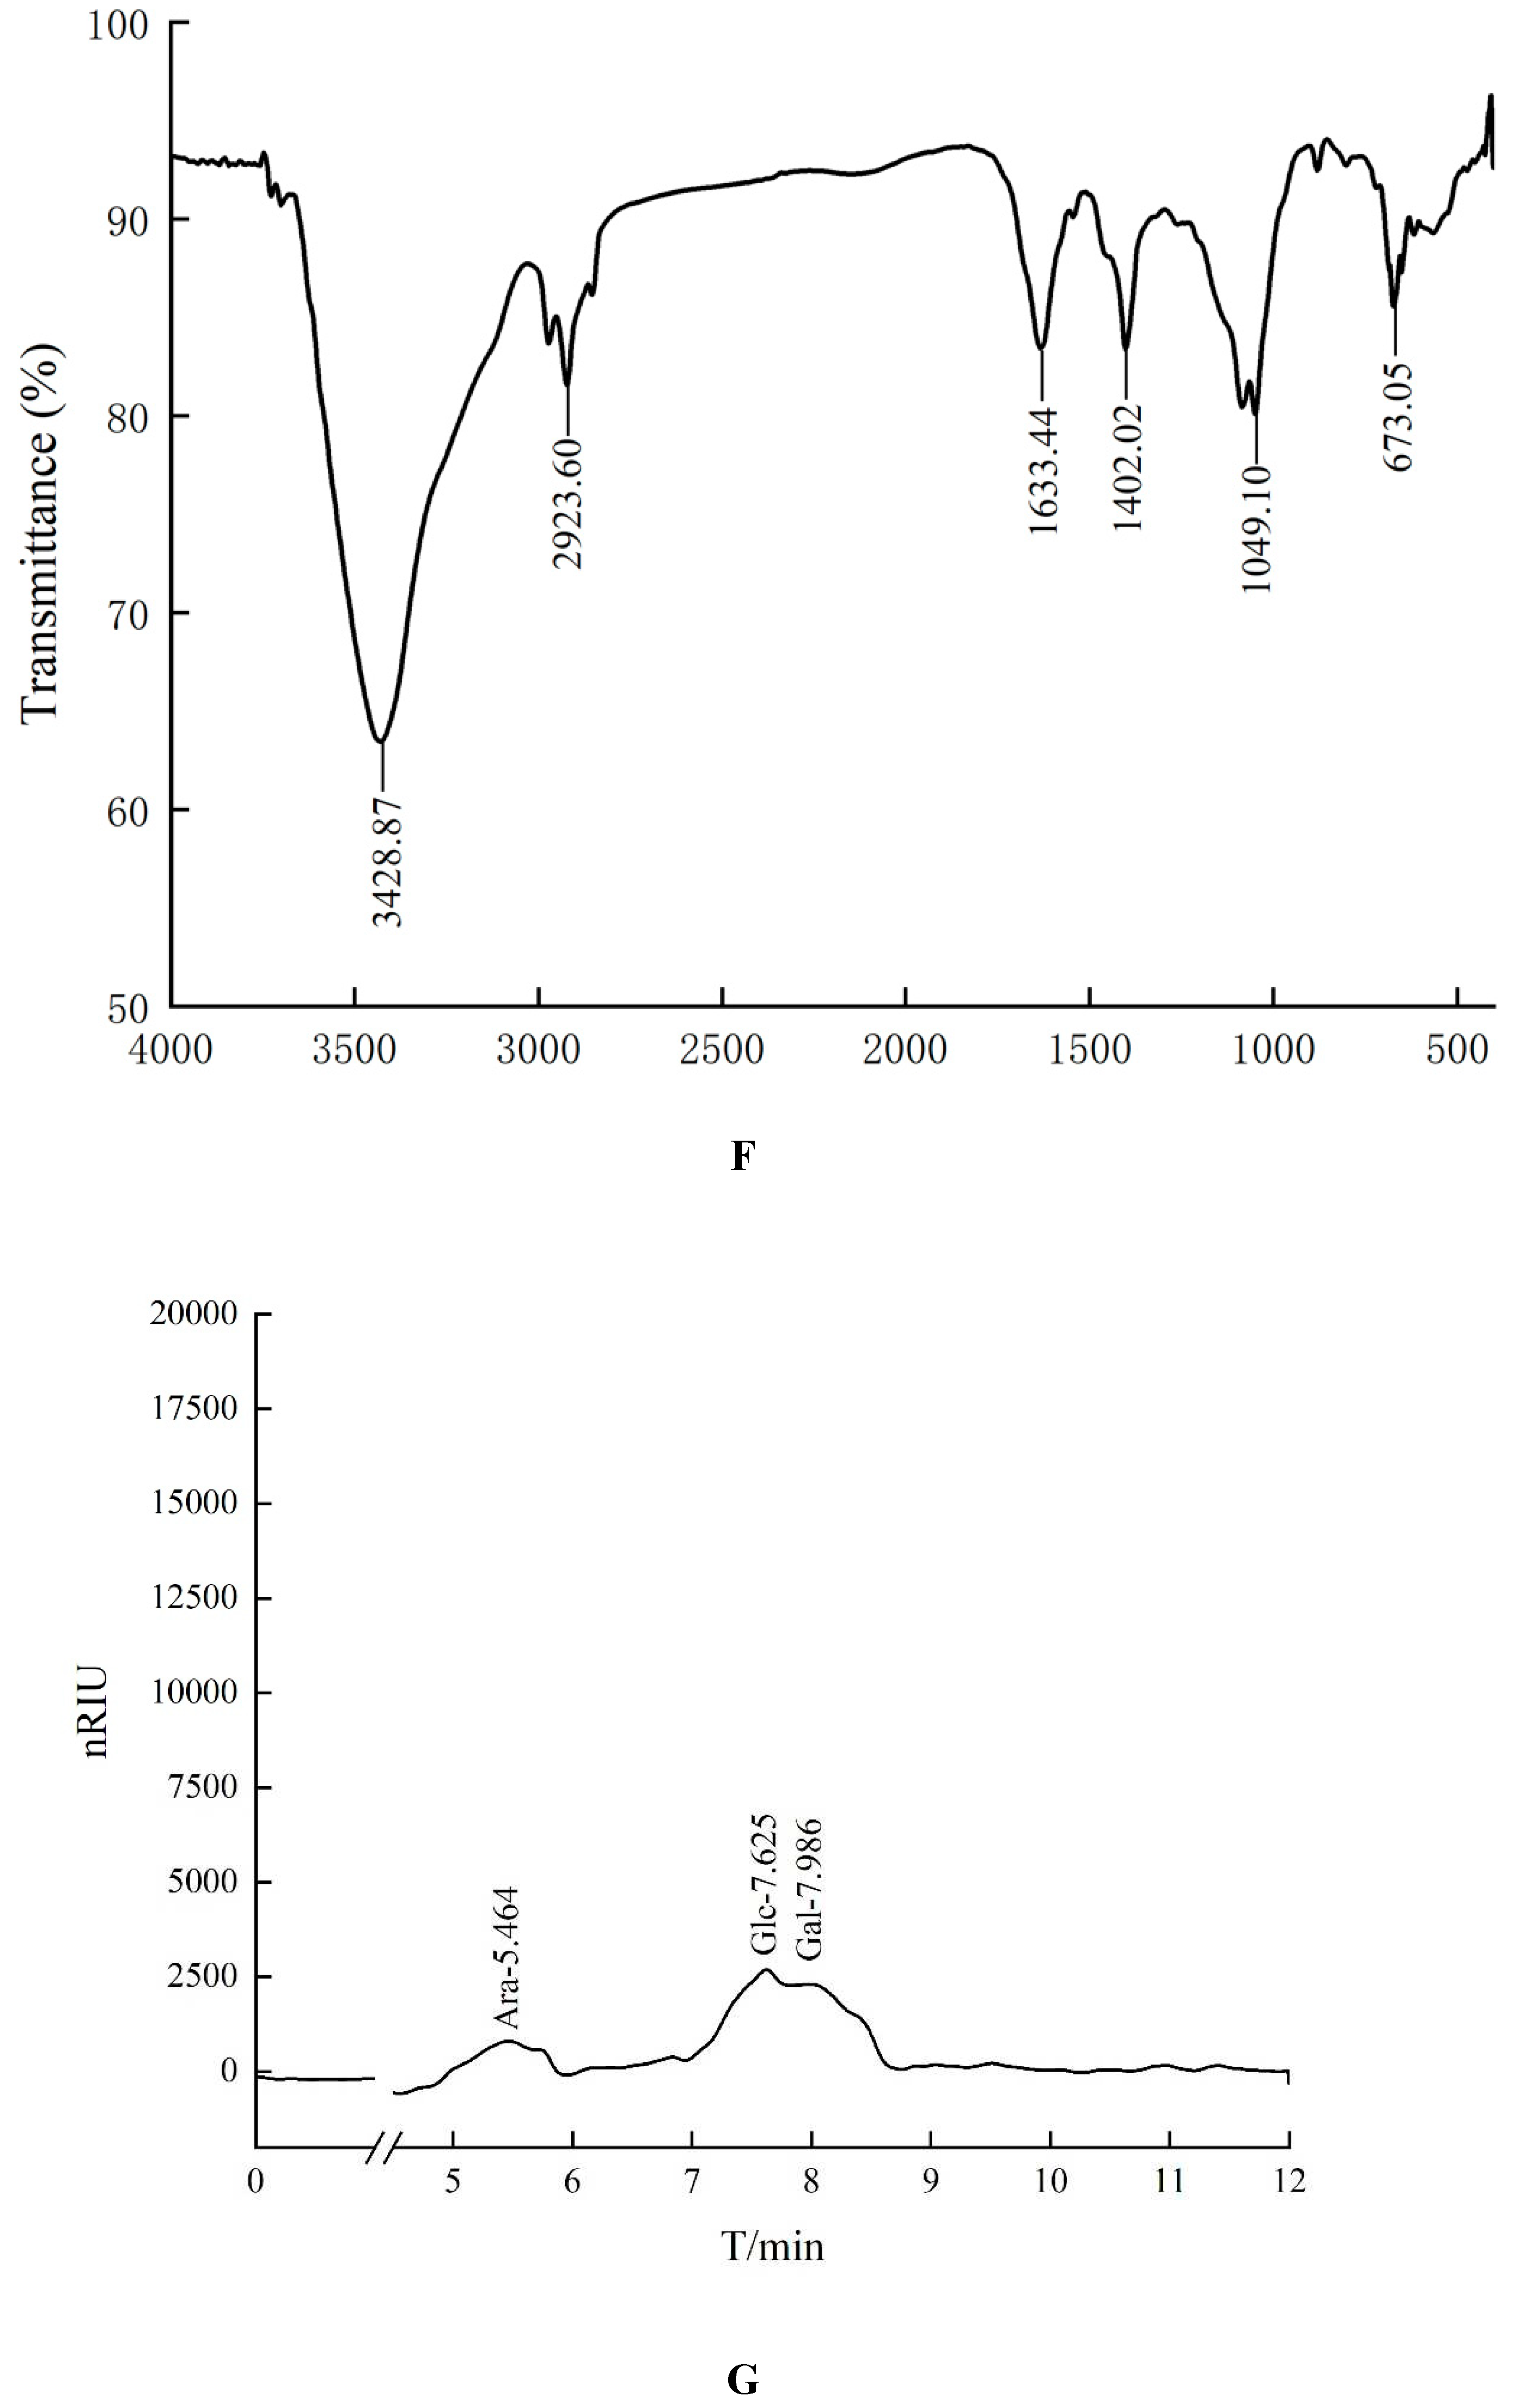
In the Fourier transform infrared spectrum of AA-P (
Figure 1E), the O-H stretching vibration peak was the broad absorption peak at 3415.37 cm
-1, the -CH
2 stretching vibration peak was at 2925.53 cm
-1, the C=O stretching vibration peak was at 1637.29 cm
-1, the C-H in-plane bending vibration peak of - CHO was at 1402.02 cm
-1, the C-O stretching vibration peak was at 1079.96 cm
-1, and the C-H rocking vibration peak was at 619.05 cm
-1.
In the Fourier transform infrared spectrum of HO-P (
Figure 1F), the O-H stretching vibration peak was the broad absorption peak at 3428.87 cm
-1, the -CH
2 stretching vibration peak was at 2923.60 cm
-1, the C=O stretching vibration peak was at 1633.44 cm
-1, the C-H in-plane bending vibration peak of - CHO was at 1402.02 cm
-1, the C-O stretching vibration peak was at 1049.10 cm
-1, and the C-H rocking vibration peak was at 673.05 cm
-1. In addition, there was no signal near 1730 cm
-1 in both FT-IR spectrum of AA-P and HO-P, indicating that these two polysaccharide didn’t contain uronic acid.
3.4. Monosaccharide Composition Results of AA-P and HO-P
The monosaccharide composition of AA-P and HO-P were analyzed using HPLC. The retention time of seven standards is as follows: Rhamnose: 4.581 min, Xylose: 5.419 min, Arabinose: 5.954 min, Fructose: 6.489min, Mannose: 6.751 min, Glucose: 7.574 min, Galactose: 7.934 min. According to the peak time of monosaccharide standard, the peaks with retention time of 5.464 minutes, 7.625 minutes and 7.986 minutes were arabinose (Ara), glucose (Glc) and galactose (Gal) respectively. The ratio of arabinose: galacto: seglucose was about 1:3:2 (
Figure 1G).
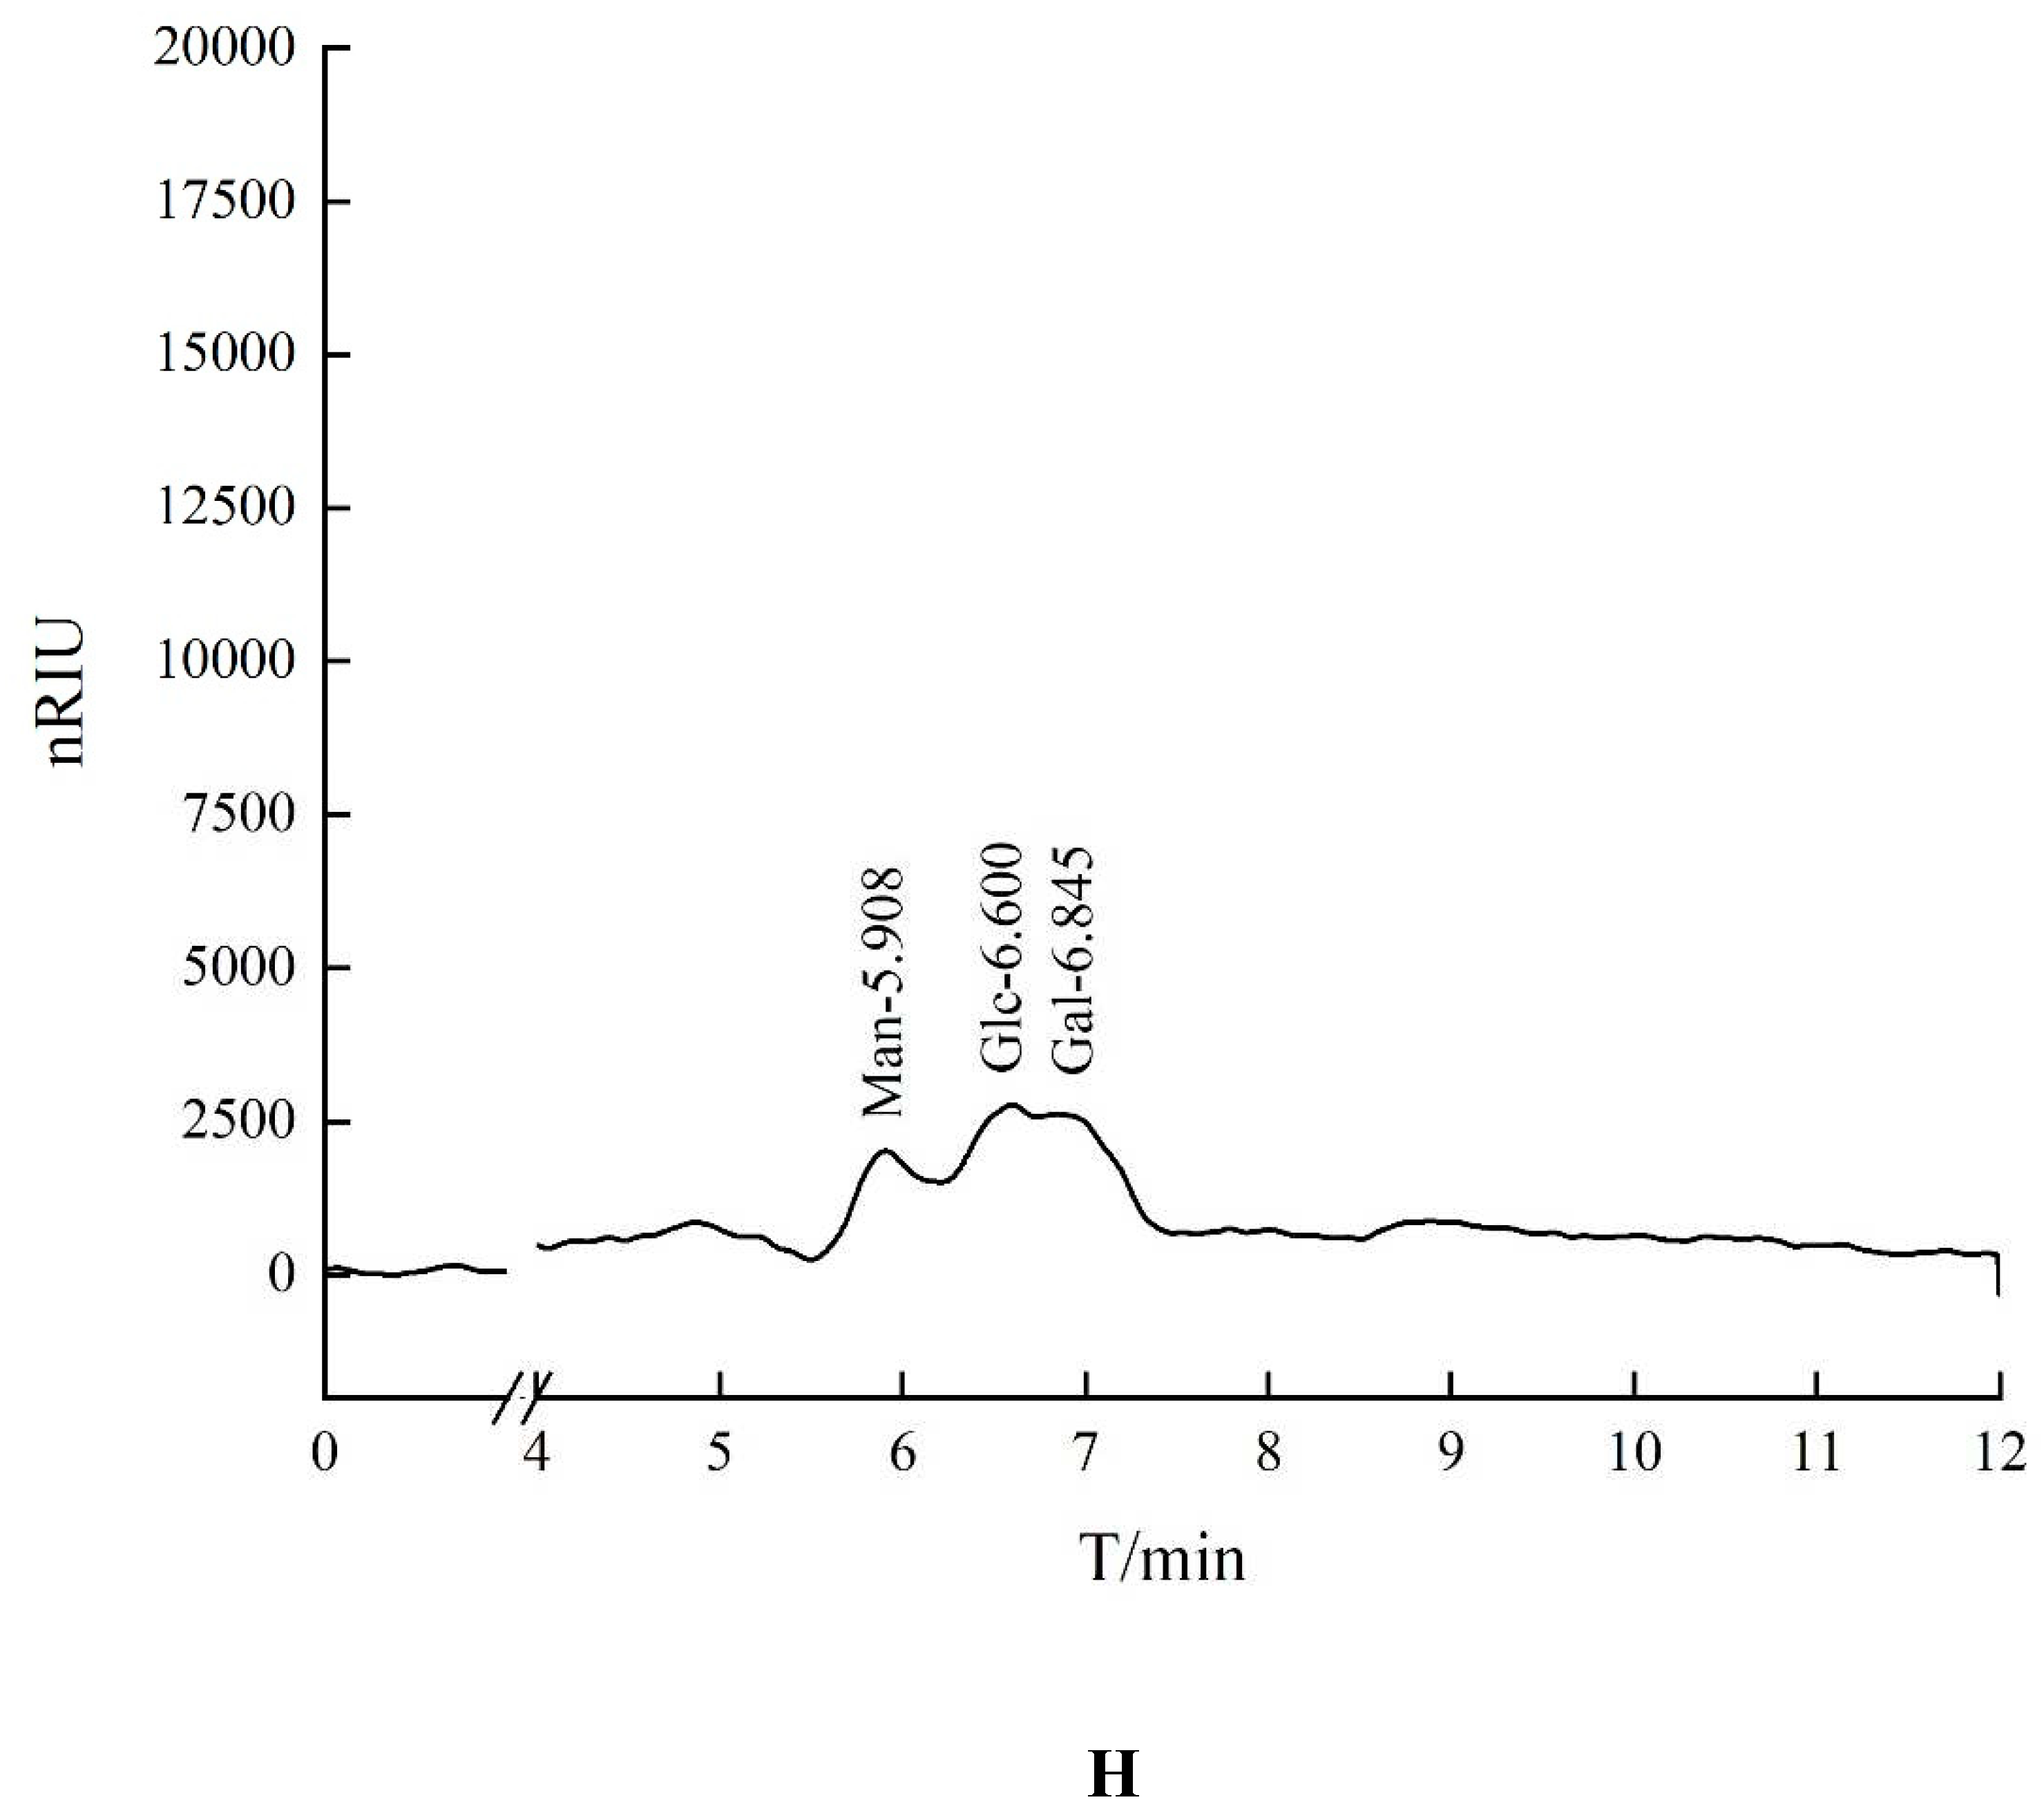
The retention time of seven standards in HO-P experimentis as follows: Rhamnose: 4.253 min, Xylose: 4.894 min, Arabinose: 5.364 min, Fructose: 5.763 min, Mannose: 5.931 min, Glucose: 6.589 min, Galactose: 6.847 min. The peaks with retention time of 5.908 minutes, 6.600 minutes and 6.845 minutes were mannose (Man), glucose (Glc) and galactose (Gal) respectively. The ratio of glucose: galactose: xylose was about 2:1:1 (
Figure 1H).
3.5. GC-MS Analysis of AA-P and HO-P
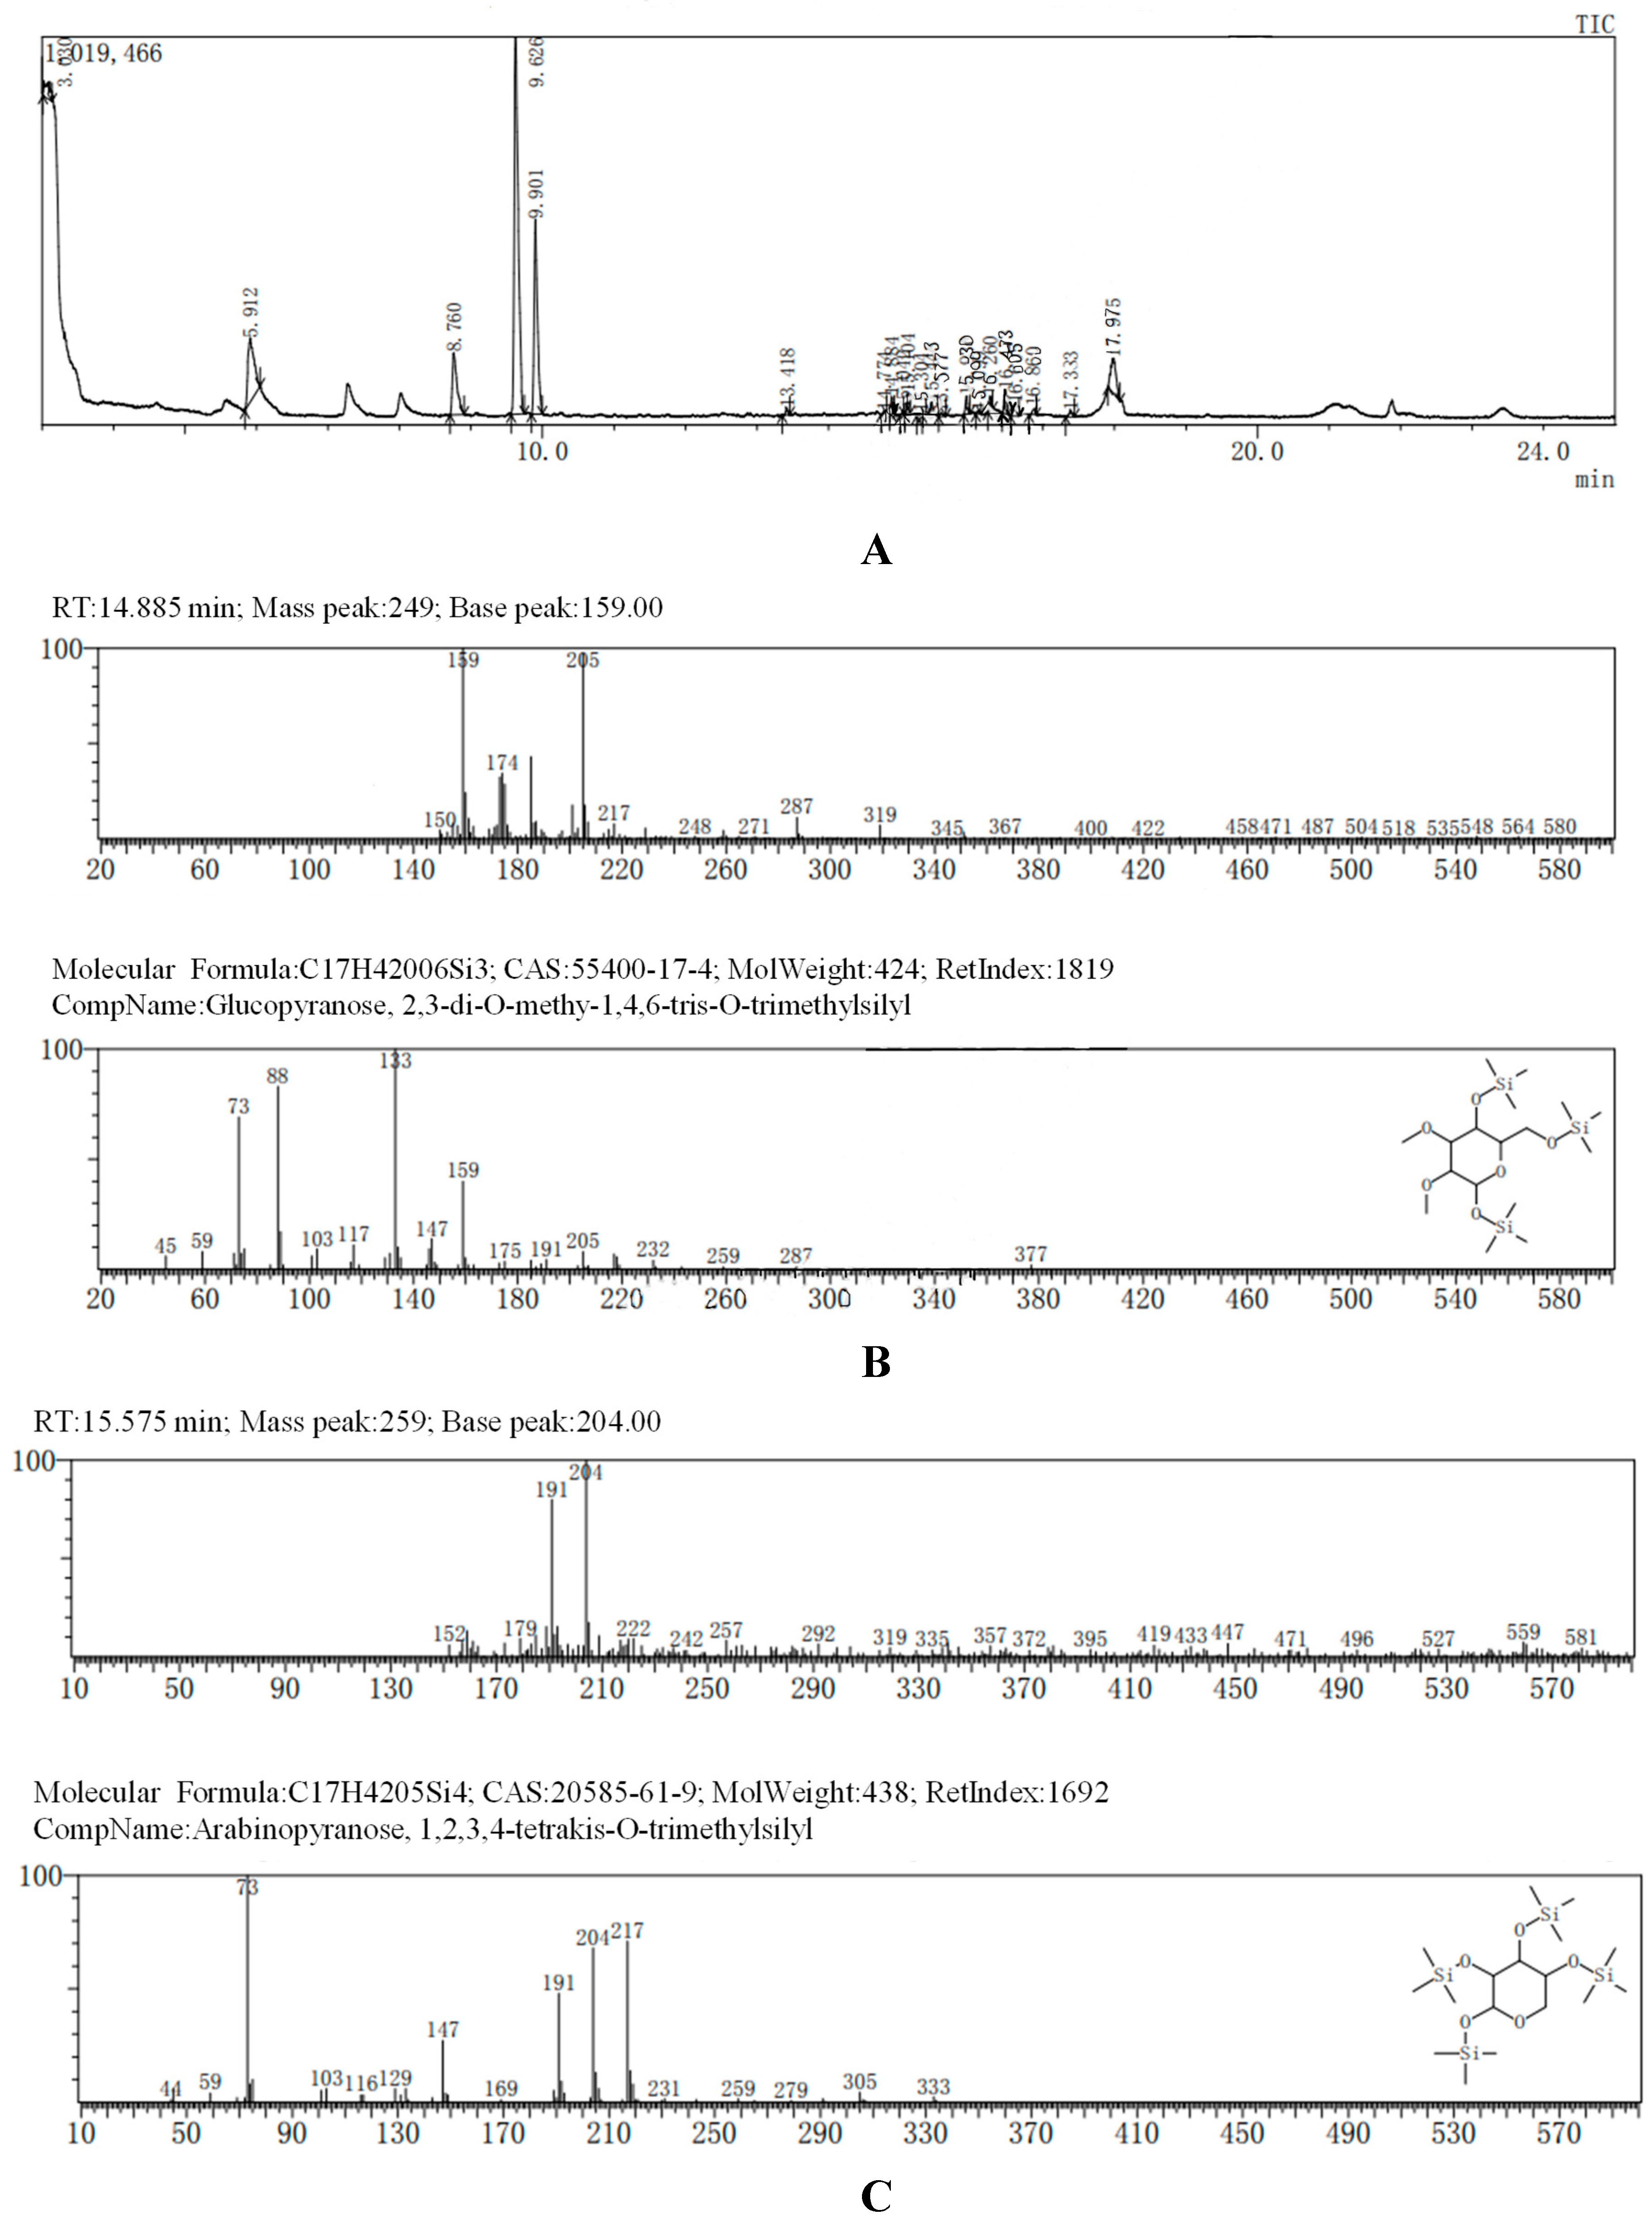
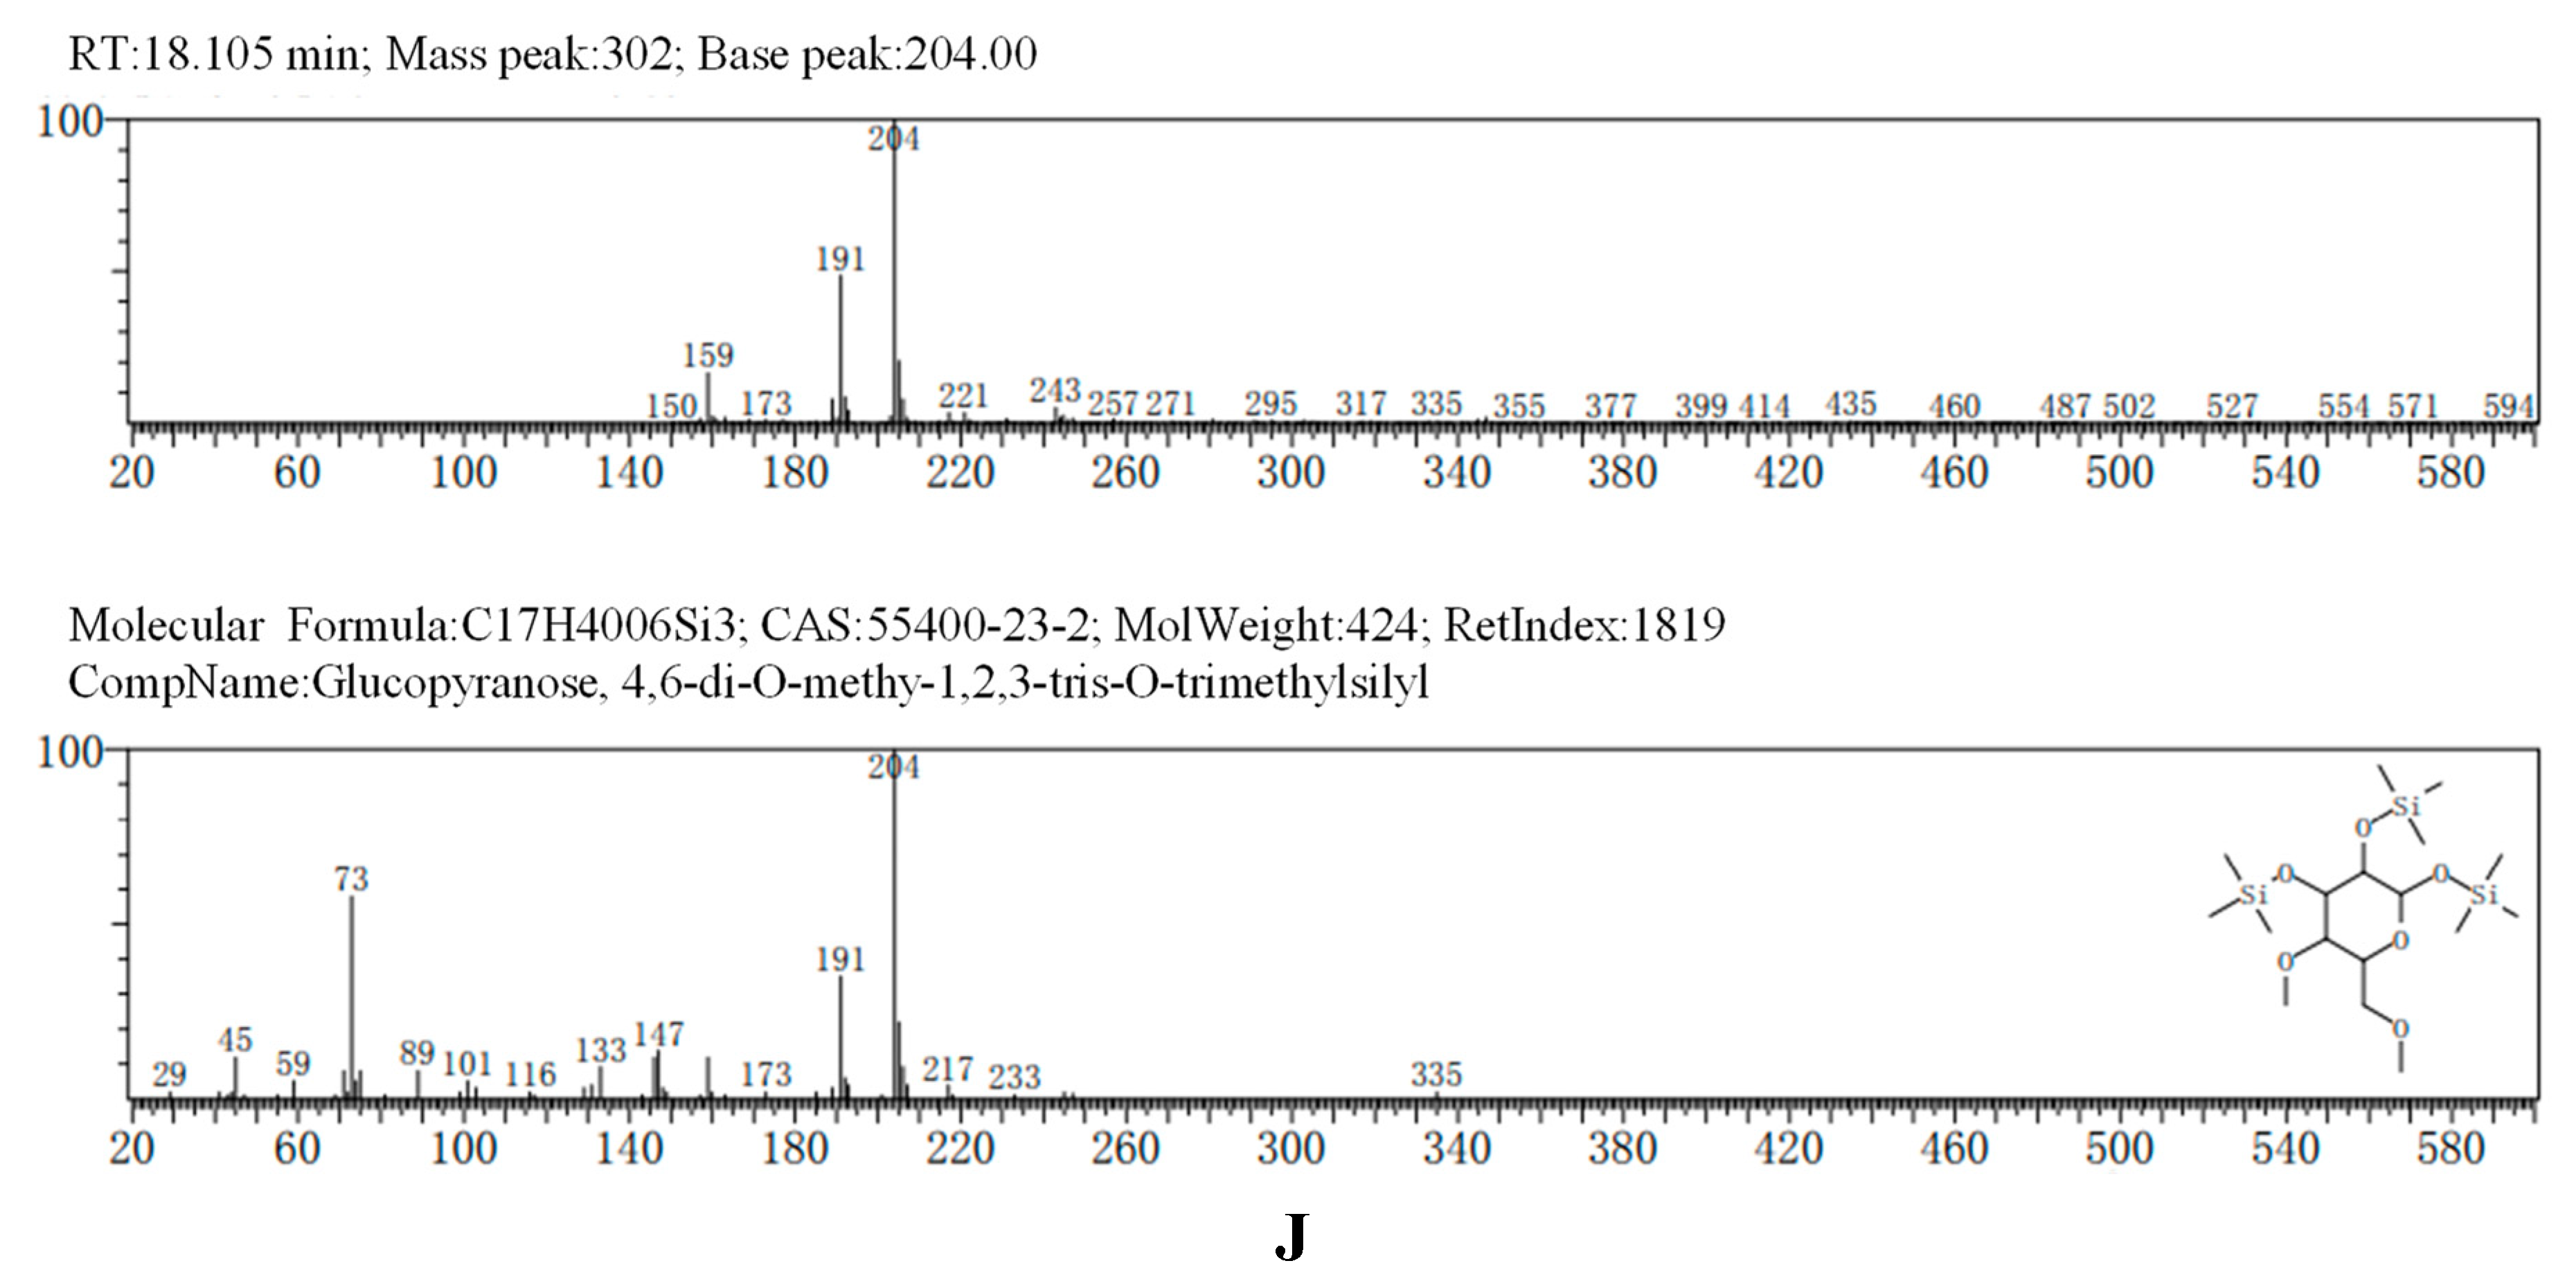
The GC-MS results, consistent with the results of HPLC, indicated that AA-P was consisted of three kind of monosaccharides: Ara, Glc and Gal, with the ratio of Ara: Glc: Gal was 1:2:3. The glucose residues were 4,6-di-O-methy-1,2,3-tris-O-trimethylsilyl-Glcp and 2,3-di-O-methy-1,4,6-tris-O-trimethylsilyl-Glcp, which indicating glucose residues were 1,2,3-linked and 1,4,6-linked in AA-P. The galactose residues were 2,4-di-O-methyl-1,3,6-tris-O-trimethylsilyl-Galp and 3,4-di-O-methyl-1,2,6-tris-O-trimethylsilyl-Galp, which indicating galactose residues were 1,3,6-linked and 1,2,6-linked in AA-P. The arabinose residues was 1,2,3,4-tetrakis-O-trimethylsilyl-Arap, which indicating arabinose residues were 1,2,3,4-linked in AA-P. Considering incomplete methylation caused by the steric hindrance of C2 and C3 on the monosaccharide ring, it indicated that glucose residues were 1-linked and 1,4,6-linked, the galactose residues were 1,6-linked, and the arabinose residues were 1,4-linked in AA-P (
Figure 2A-I).
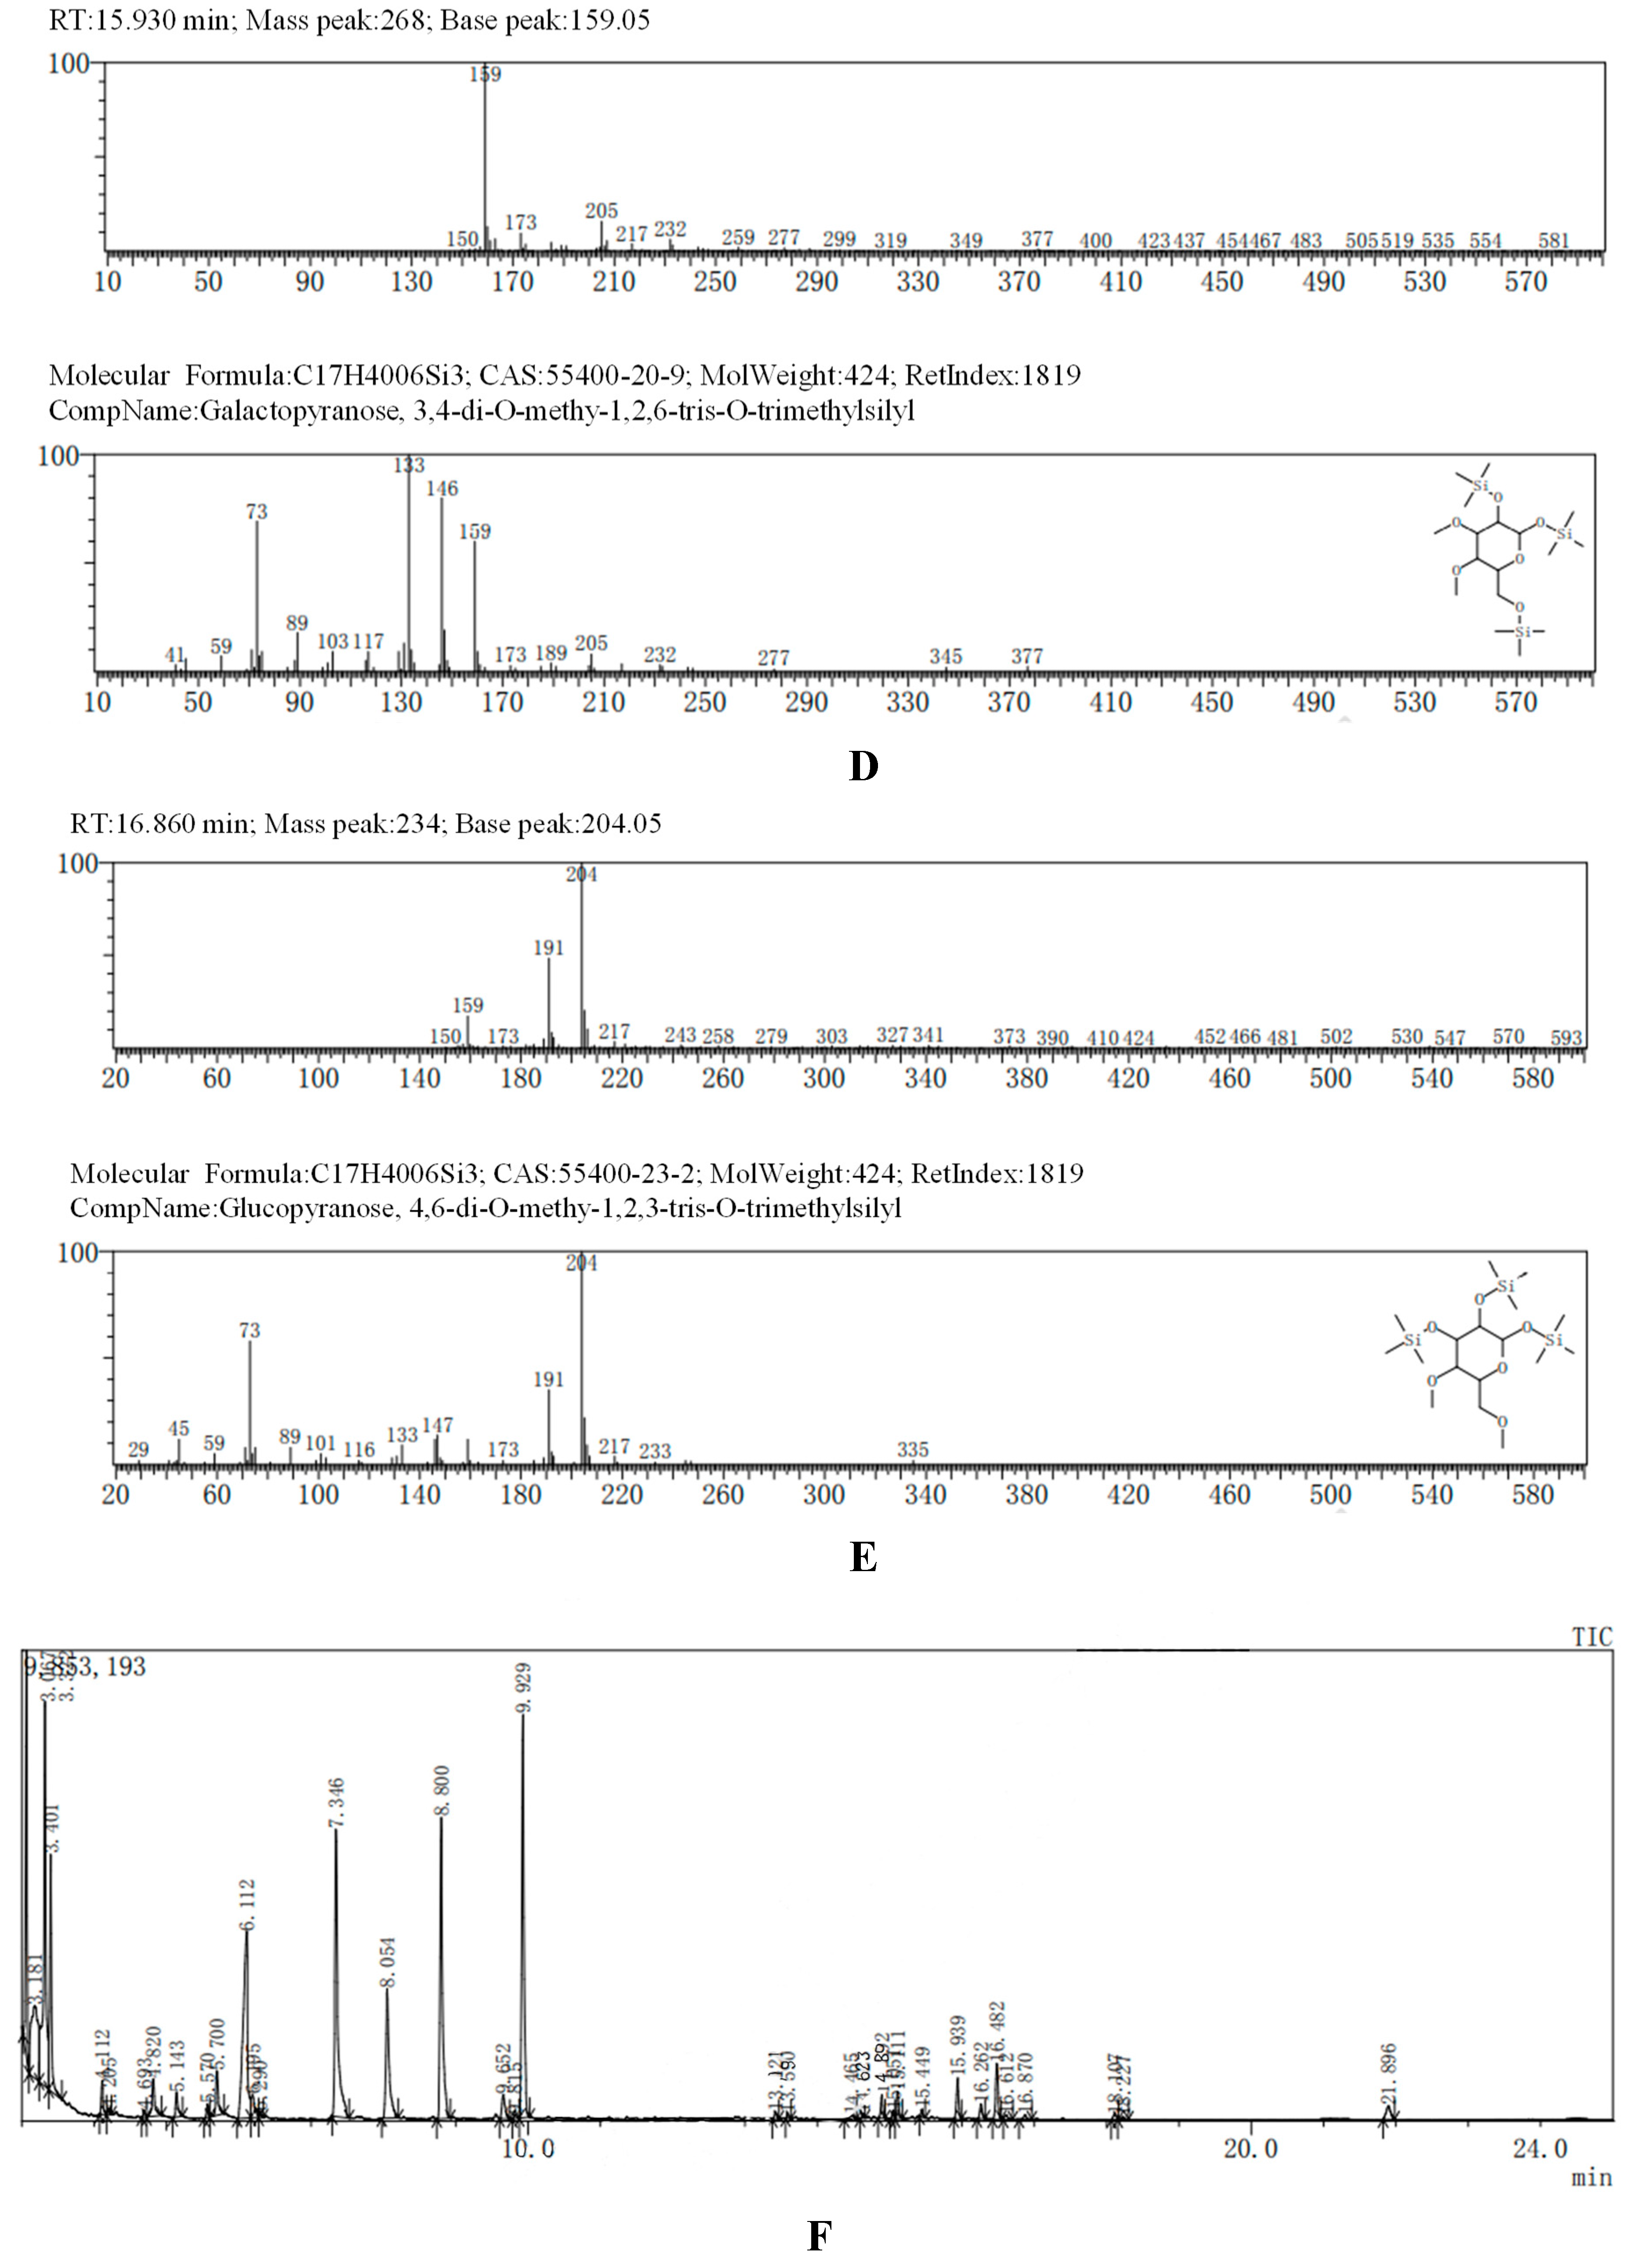
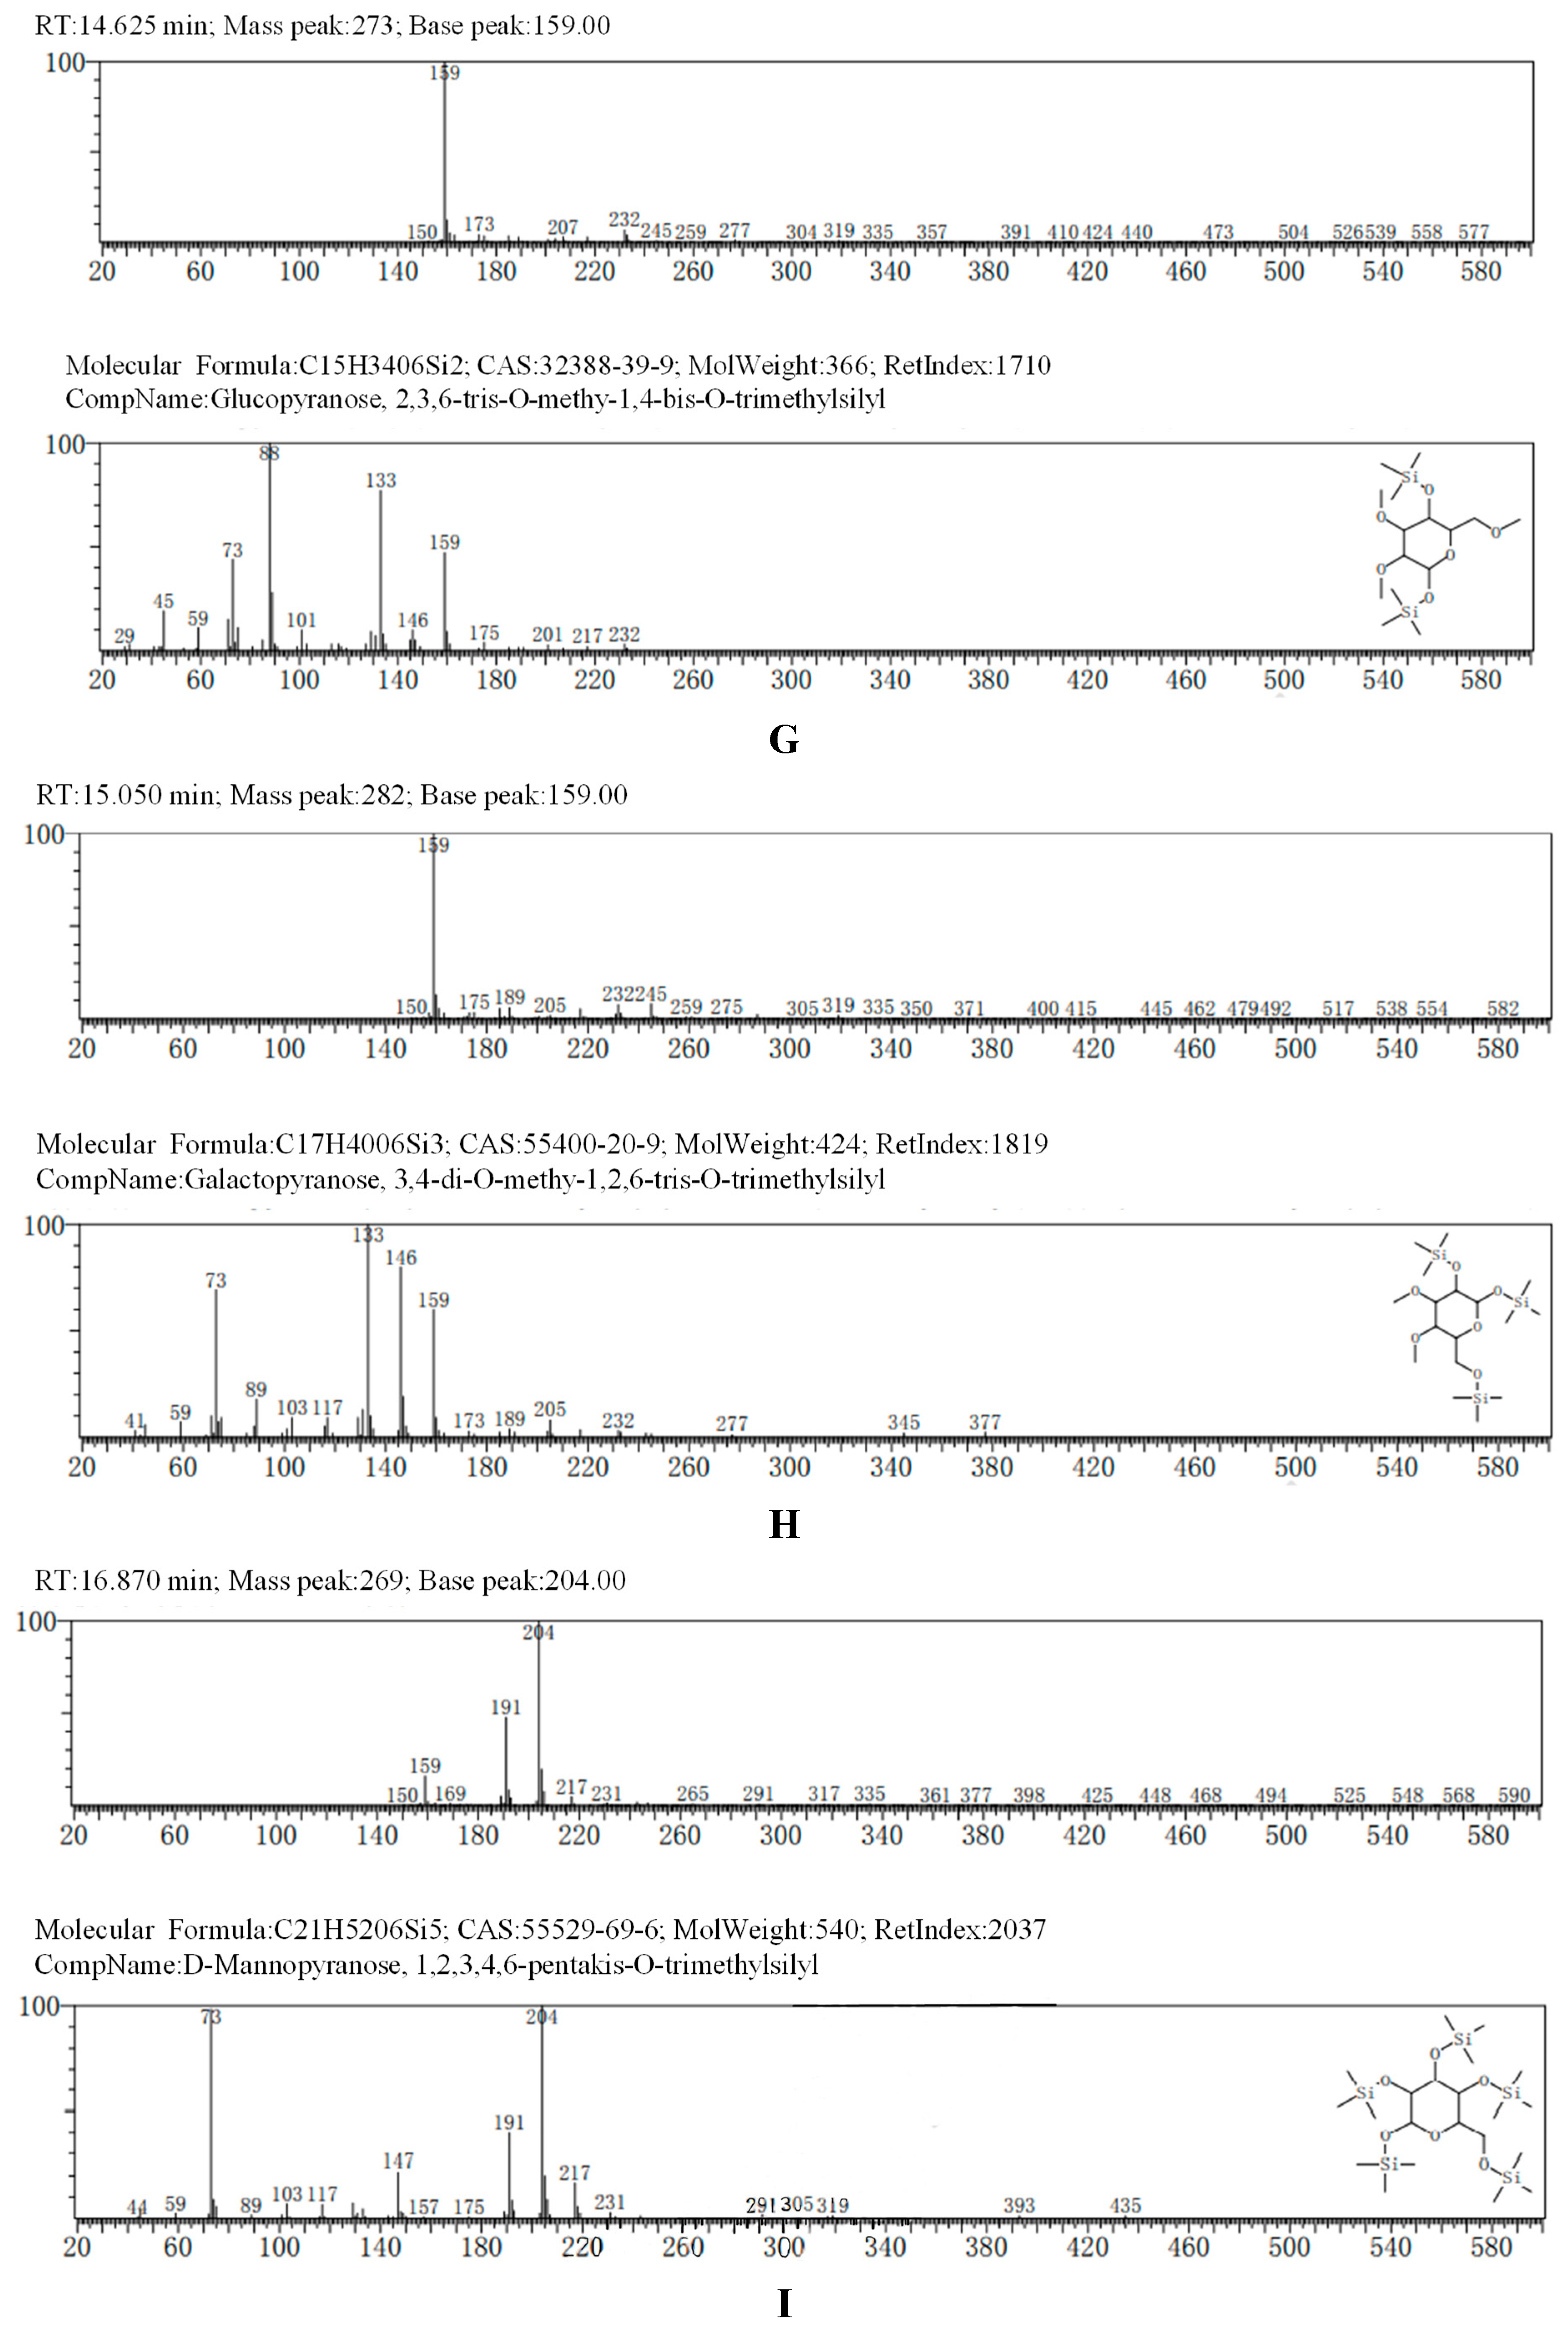
The GC-MS results of HO-P showed glucose residue were 2,3,4,6-tet-O-methyl-1-O-trimethylsilyl-Glcp, 2,3,4-tri-O-methyl-1,6-bis-O-trimethylsilyl-Glcp and 2,3,4-tri-O-methyl-1,4-bis-O-trimethylsilyl-Glcp, indicating glucose residue in HO-P was 1-linked, 1,6-linked and 1,4,6-linked. The galactose residues were 3,4-di-O-methyl-1,2,6-tris-O-trimethylsilyl-Galp and 6-di-O-methyl-1,2,3,4-tetrakis-O-trimethylsilyl-Galp indicated galactose residues in HO-P were 1,2,6-linked and 1,2,3,4-linked. The mannose residue was 1,2,3,4,6-pentakis-O-trimethylsilyl-D-Manp indicated mannose residue was 1,2,3,4,6-linked. Considering incomplete methylation caused by the steric hindrance of C2 and C3 on the monosaccharide ring, it indicated that glucose residues were 1-linked, 1,6-linked and 1,4,6-linked, the galactose residues were 1,6-linked and 1,4-linked, and the mannose residues were 1,4,6-linked in HO-P (
Figure 2B–J).
3.6. 1H-NMR Analysis of AA-P and HO-P
Nuclear magnetic resonance spectroscopy (NMR) is a powerful tool for analyzing the exact structure of how functional groups within molecules are connected [
16,
17].
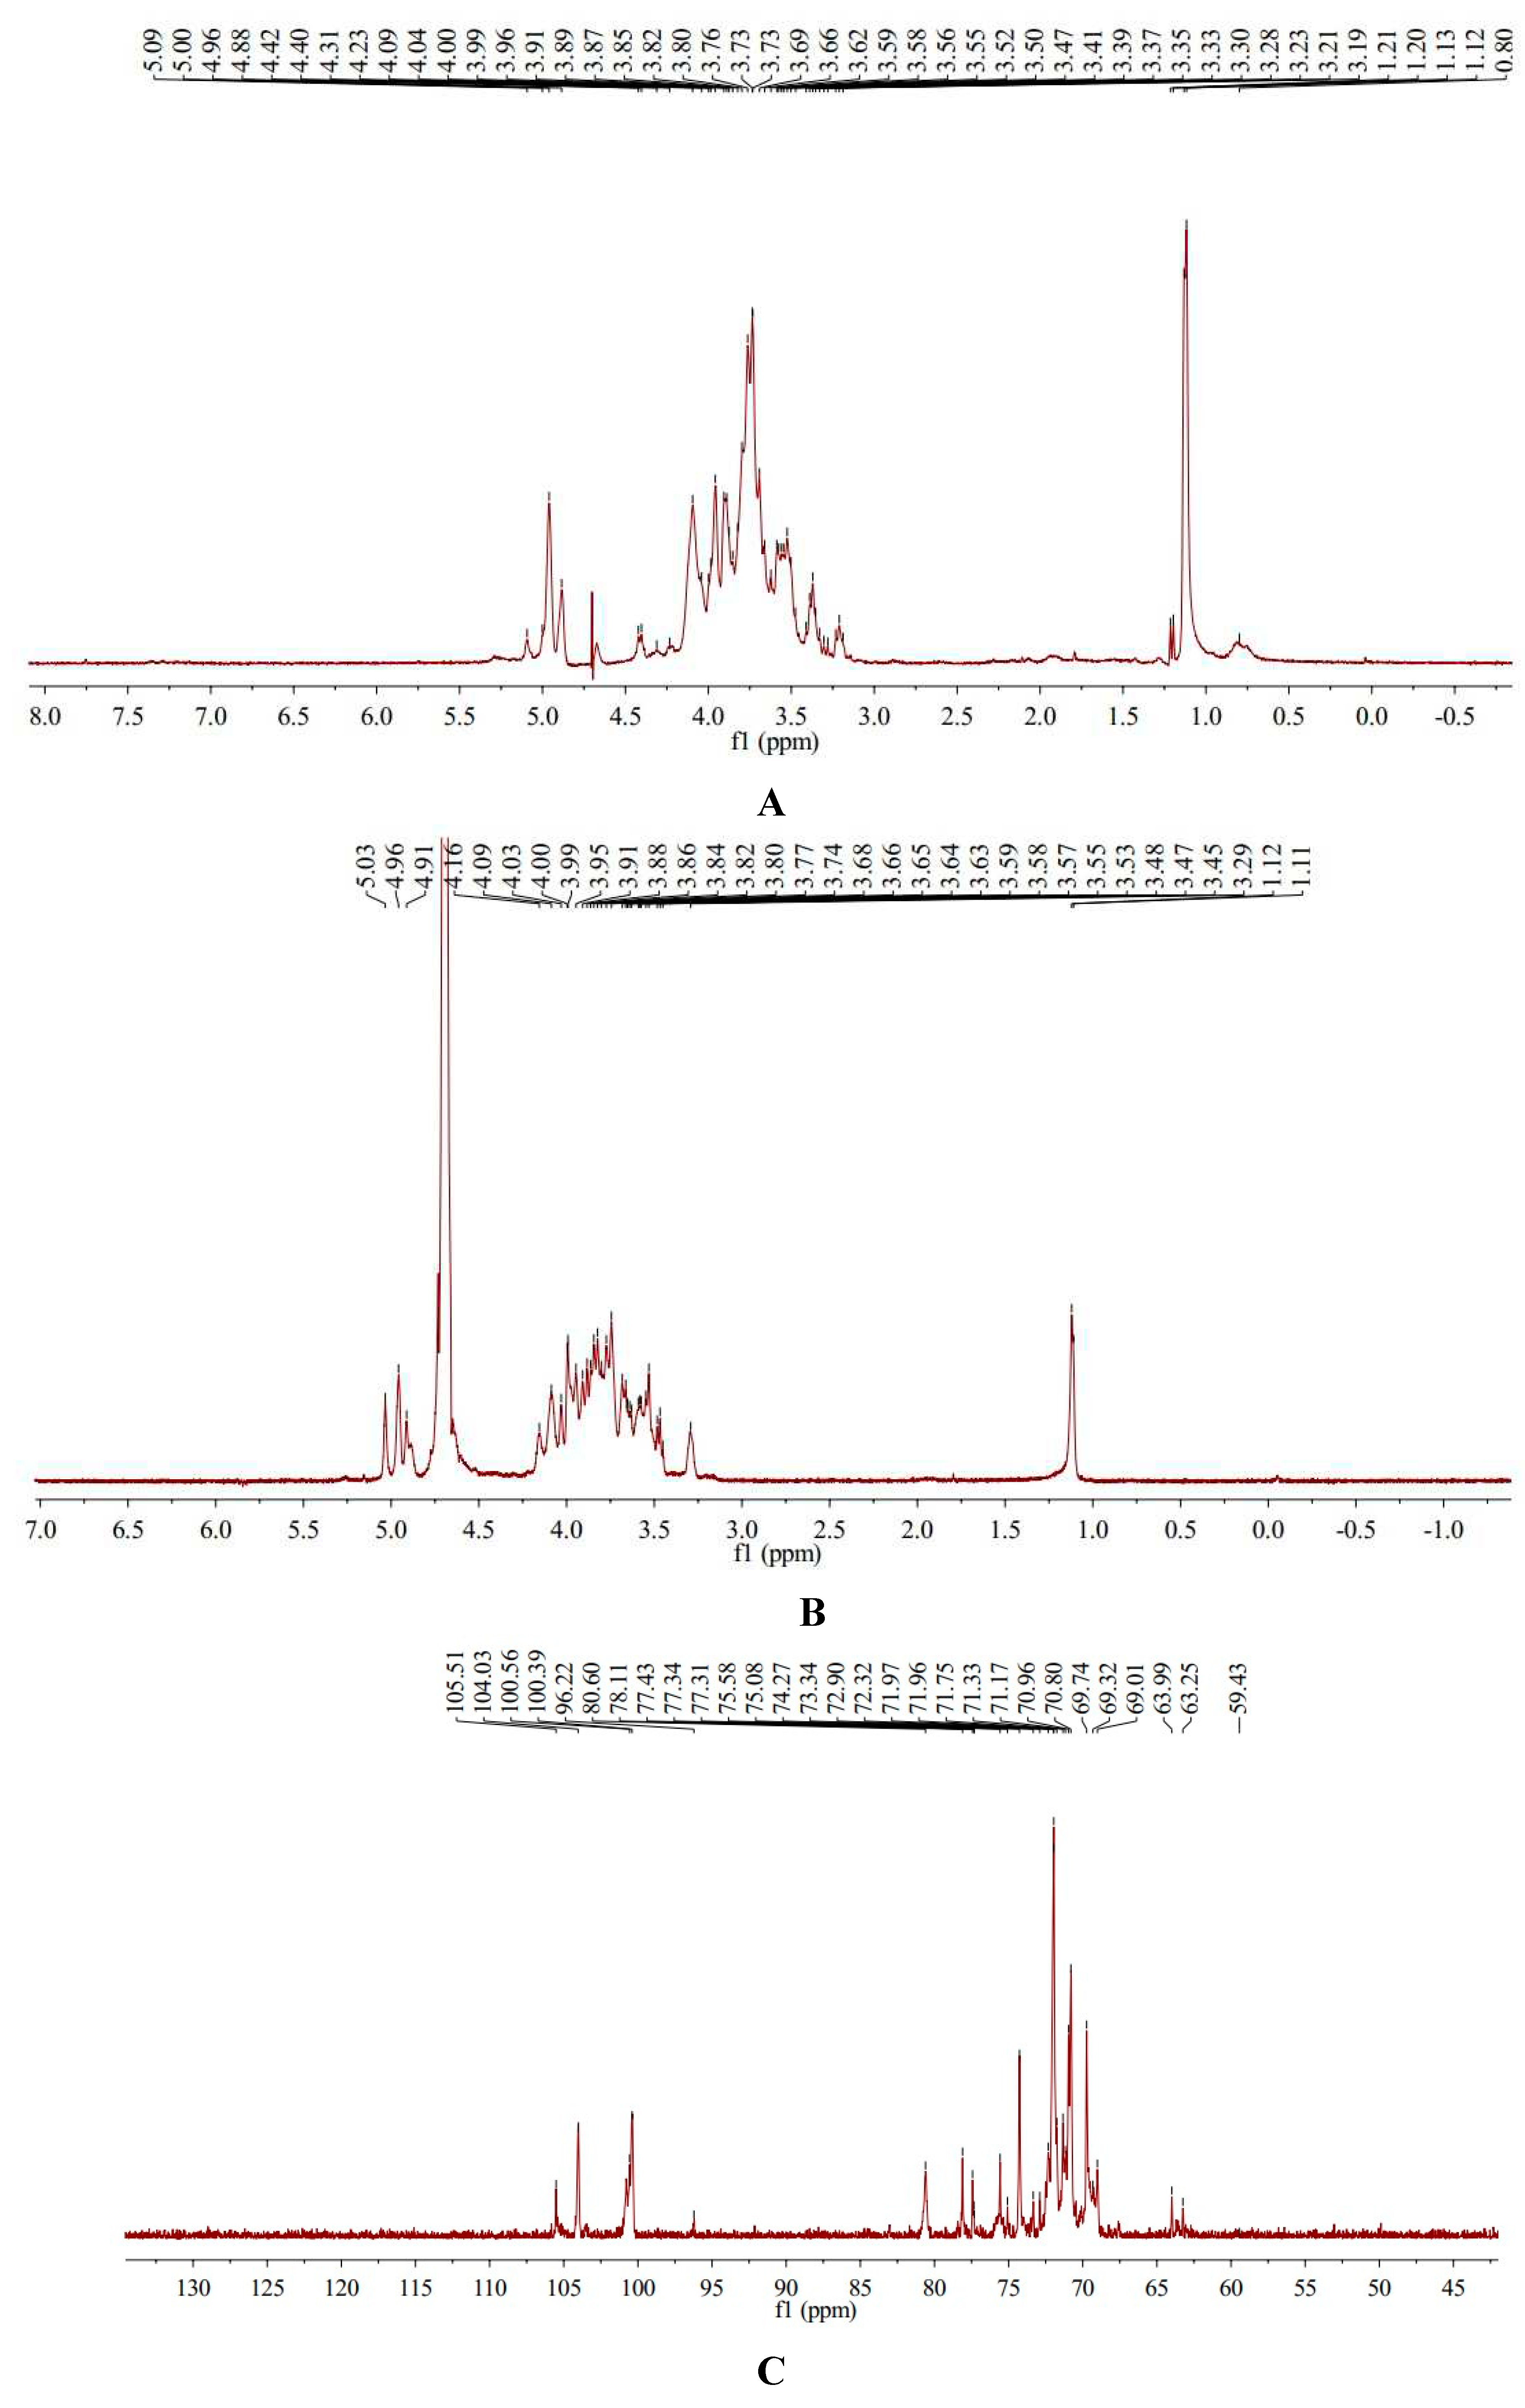
1H-NMR spectra of AA-P showed AA-P had five anomeric protons signals which were at δ 5.09, δ 5.00, δ 4.96, δ 4.88 and δ 4.42, respectively. Anomeric protons signals at δ 5.09, δ 5.00, δ 4.96, δ 4.88 and δ 4.42 belong to (A) (1→6)-Galp, (B)(1→4,6)-Glcp, (C)(1→6)-Galp, (D)(1→4)-Arap, (E)(→1)-Glcp, respectively. The hydrogen signals of H2-H6 in monosaccharides overlapped between δ 3.09 and δ 4.31(
Table 1,
Figure 3A).
1H-NMR spectra of HO-P showed HO-P had three anomeric protons signals, which were at δ 5.03, δ 4.96 and δ 4.91, respectively. Anomeric protons signals at δ 5.03 and δ 4.91 belong to (A)(1→4,6)-D-Manp and (D)(1→6)-Galp, respectively, and signals at δ 4.96 belong to (B)(1→4)-Glcp and (C)(→1)-Glcp. The hydrogen signals of H2-H6 in monosaccharides overlapped between δ 3.29 and δ 4.16 (
Table 2,
Figure 3B).
3.7. 13C-NMR Analysis of AA-Pand HO-P
13C-NMR spectra of AA-P showed that AA-P had five anomeric carbon signals at δ 105.51, δ 104.03, δ 100.56, δ 100.39 and δ 96.22, which belong to anomeric carbon signals of (A)(1→6)-Galp, (B)(1→4,6)-Glcp, (C)(1→6)-Galp, (D)(1→4)-Arap , and (E)(→1)-Glcp, respectively. The signals of C2-C6 in monosaccharide residues appeared between δ 59.43-80.60 (
Table 1,
Figure 3C).
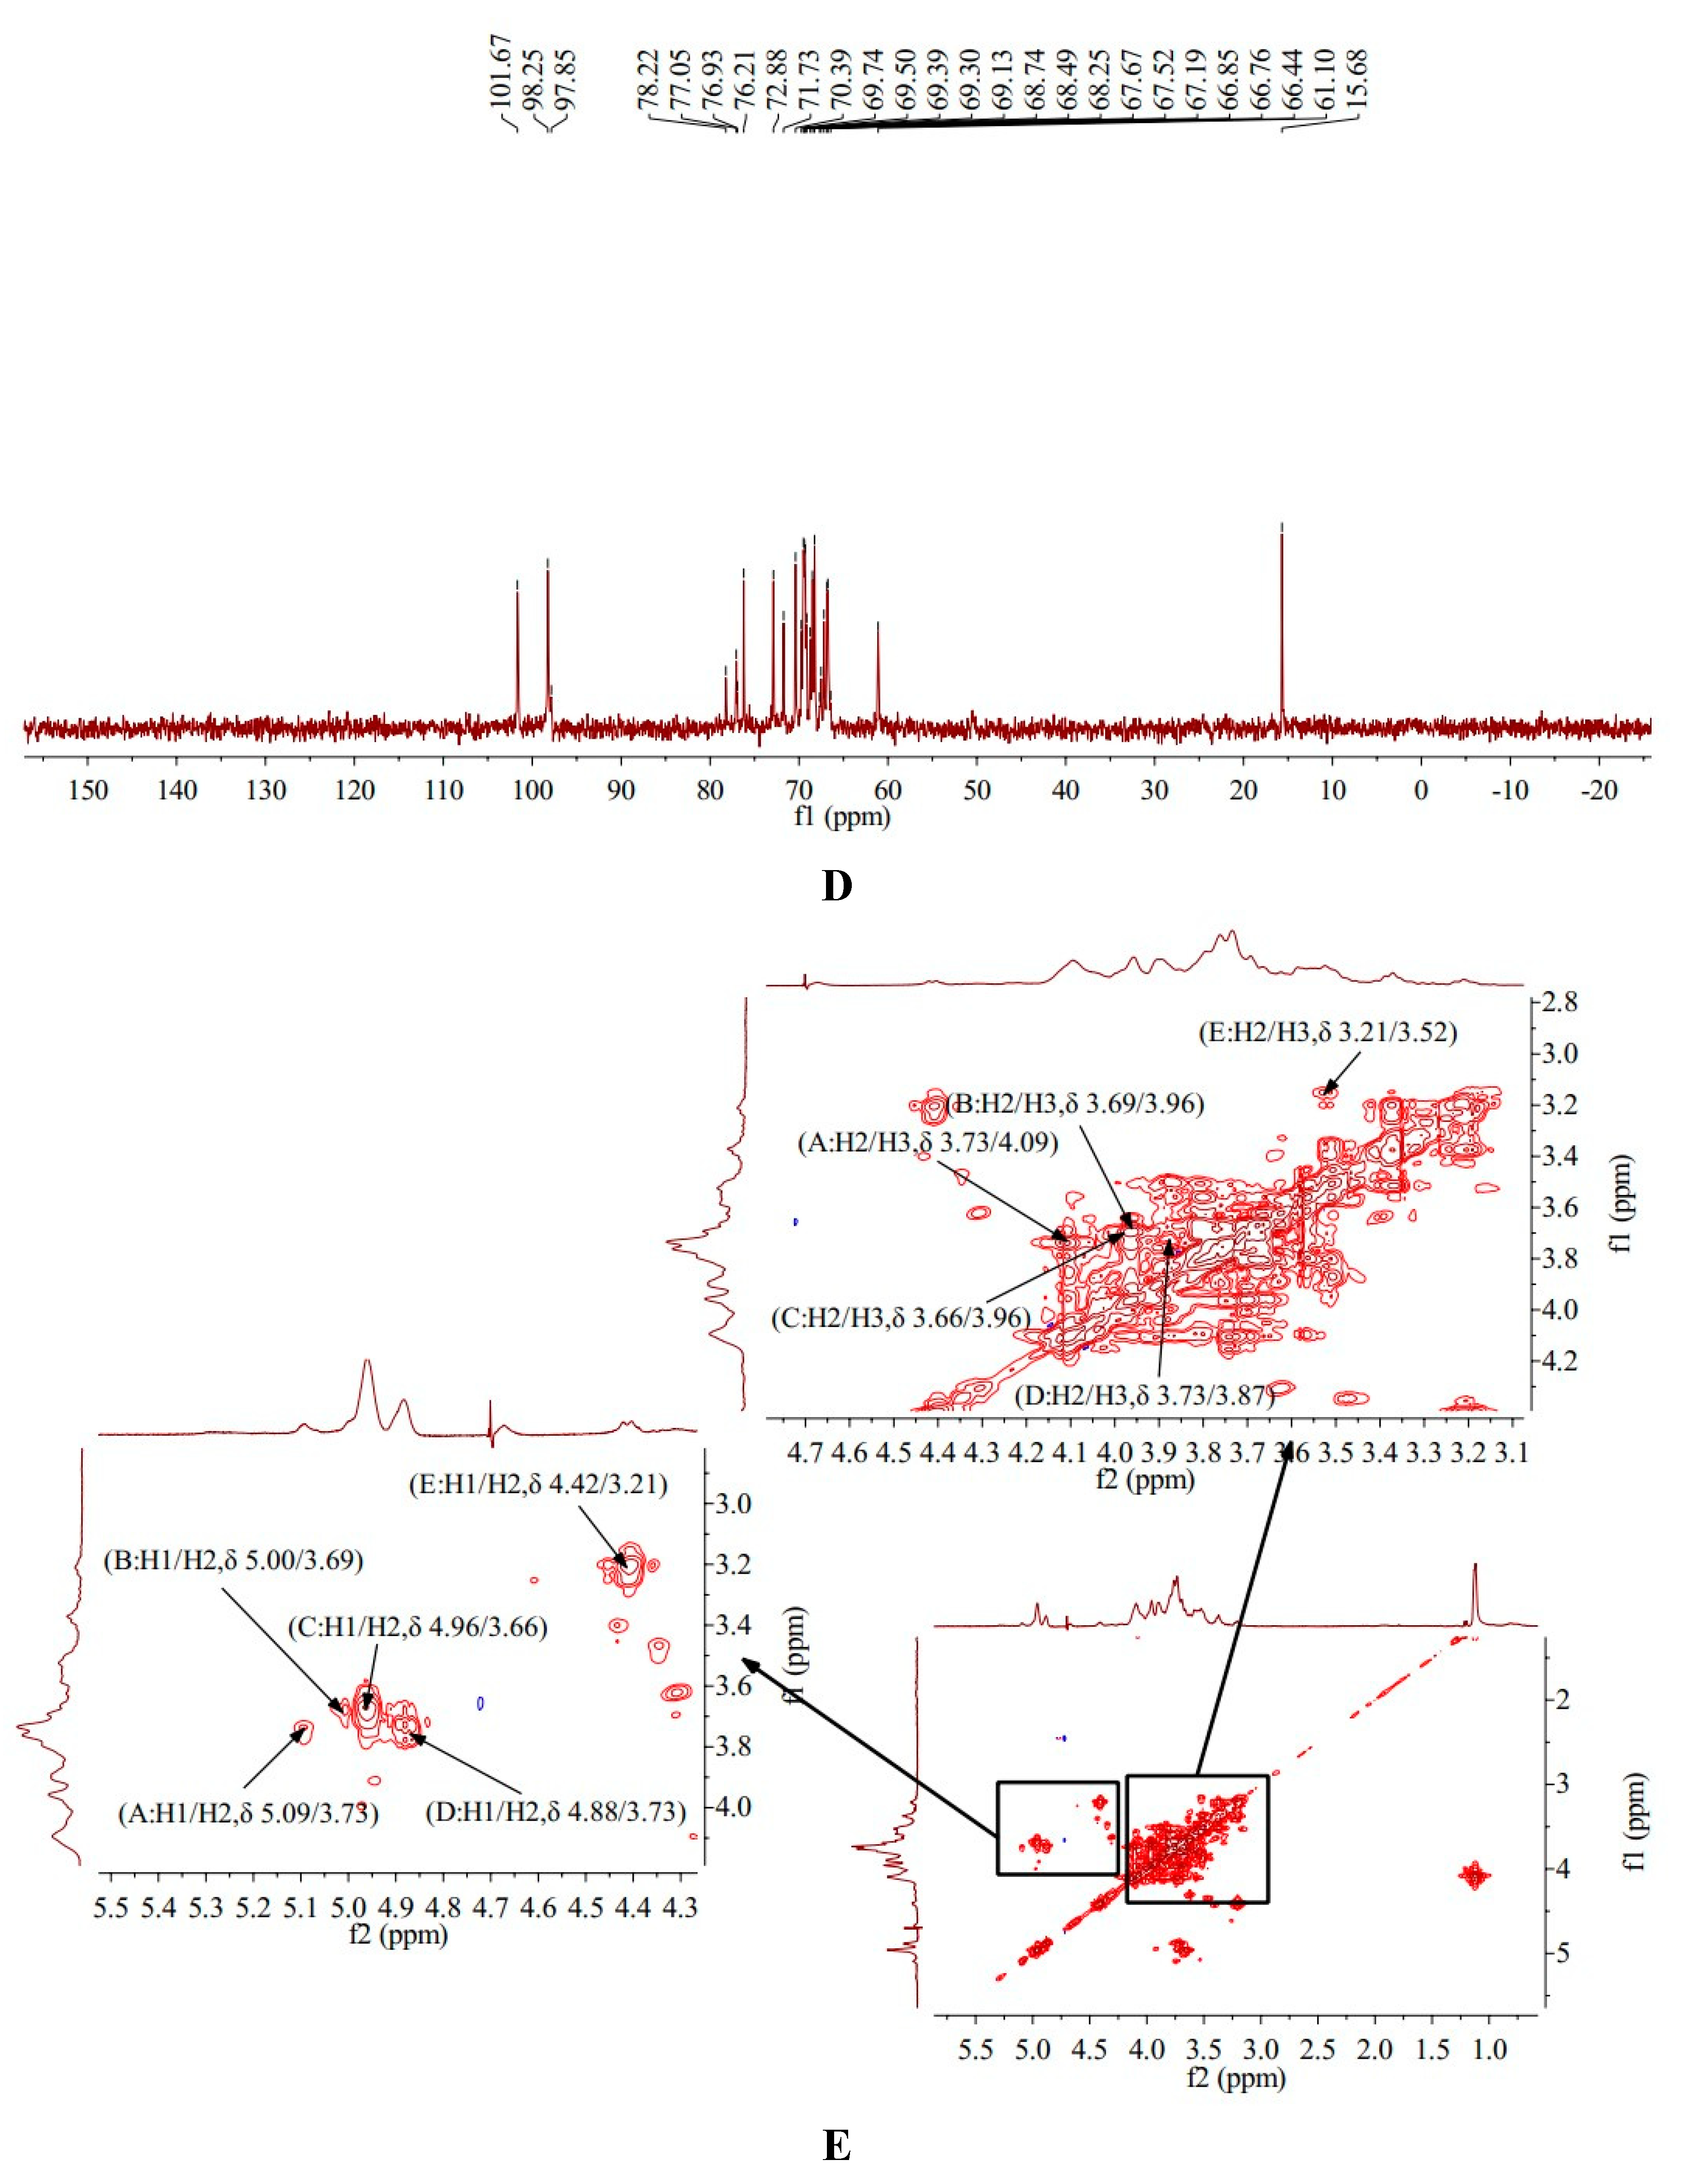
13C-NMR spectra of HO-P showed that HO-P had three anomeric carbon signals at δ 101.67, δ 98.25 and δ 97.85. The signals at δ 98.25 belong to (A)(1→4,6)-D-Manp and (B)(1→4)-Glcp, and signals at δ 101.67 and δ 97.85 belong to (C)(→1)-Glcp and (D)(1→2,6)-Galp, respectively. The signals of C2-C6 in monosaccharide residues appeared between δ 61.10-78.22 (
Table 2,
Figure 3D).
3.8. 1H-1H COSY Analysis of AA-Pand HO-P
1H-
1H COSY is mainly a technique for determining the coupling relationship between adjacent hydrogen in molecules [
18]. The
1H-
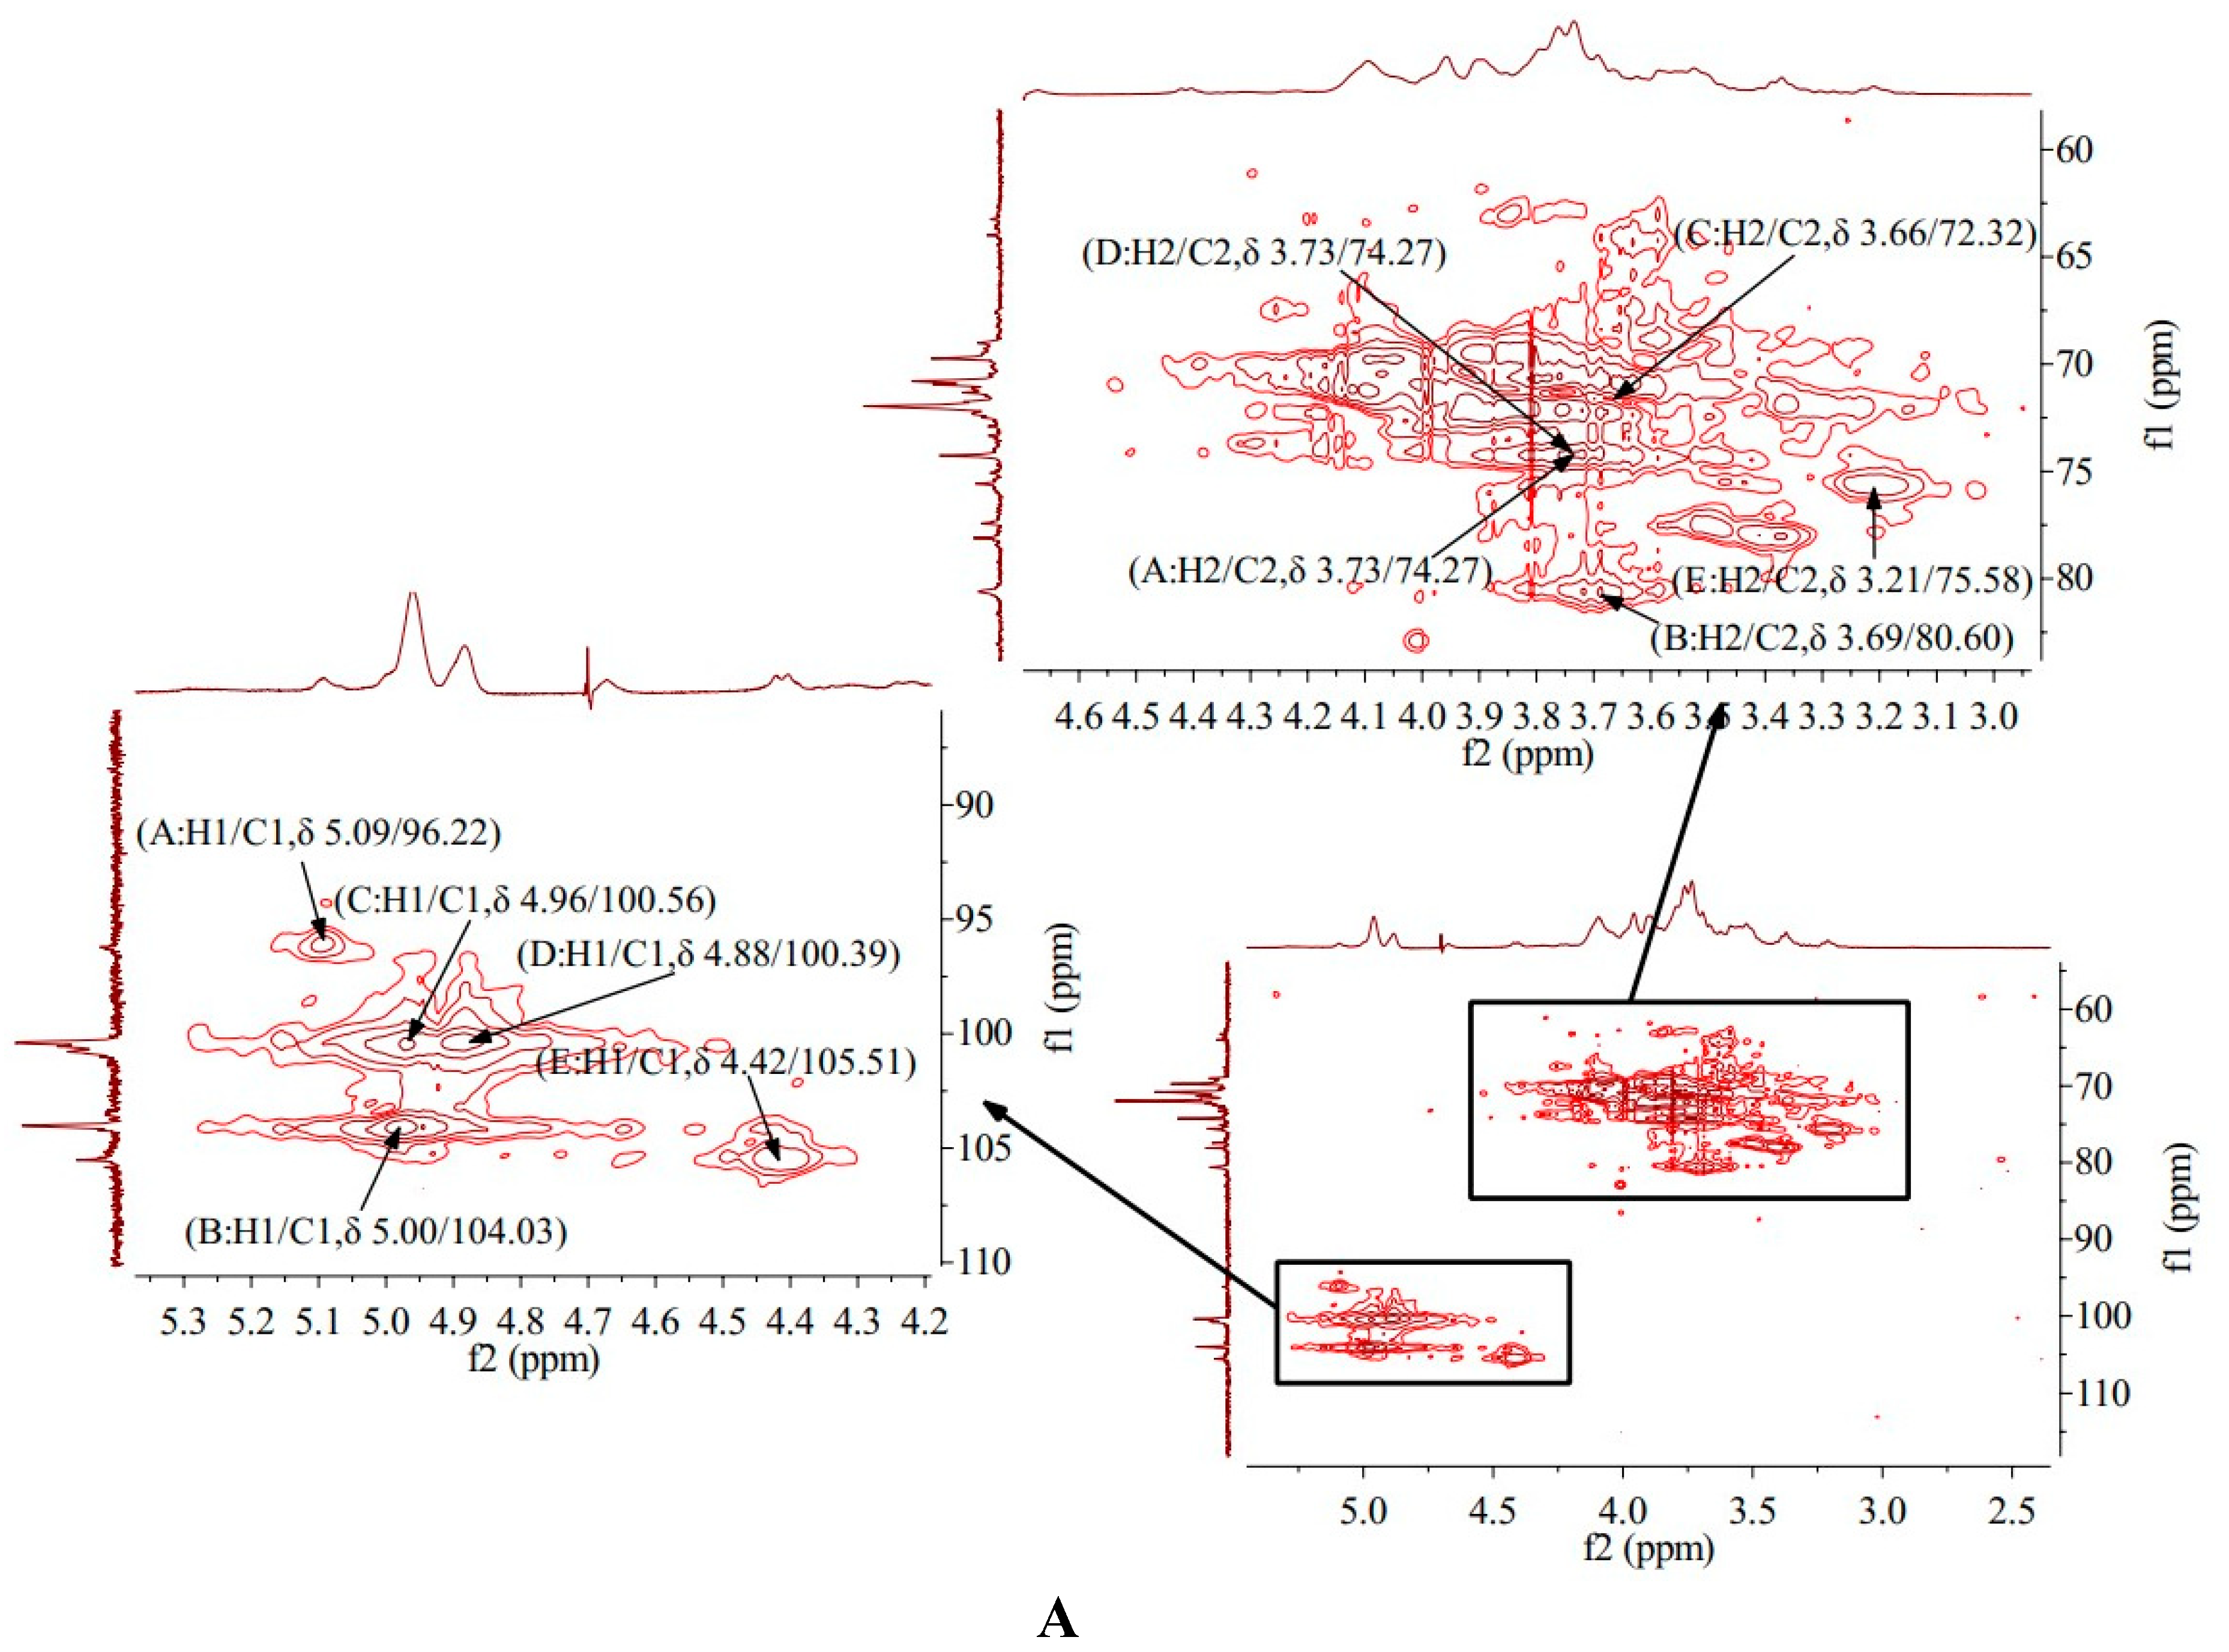
1H COSY spectrum of AA-P showed the signal A (δ 5.09/3.73), B (δ 5.00/3.69), C (δ 4.96/3.66), D (δ 4.88/3.73) and E (δ 4.42/3.21) belong to the resonant coupling signal between H-1 and H-2 of the (A)(1→6)-Galp, (B)(1→4,6)-Glcp, (C)(1→6)-Galp, (D)(1→4)-Arap, and (E)(→1)-Glcp groups, respectively. According to the resonant coupling signal between adjacent hydrogen in molecules, the signals of H2-H6 of the A group are δ 3.73, δ 4.09, δ 3.58, δ 3.87, and δ 3.50, respectively. The
1H signals of B-E groups were also deduced (
Figure 3E).
The
1H-
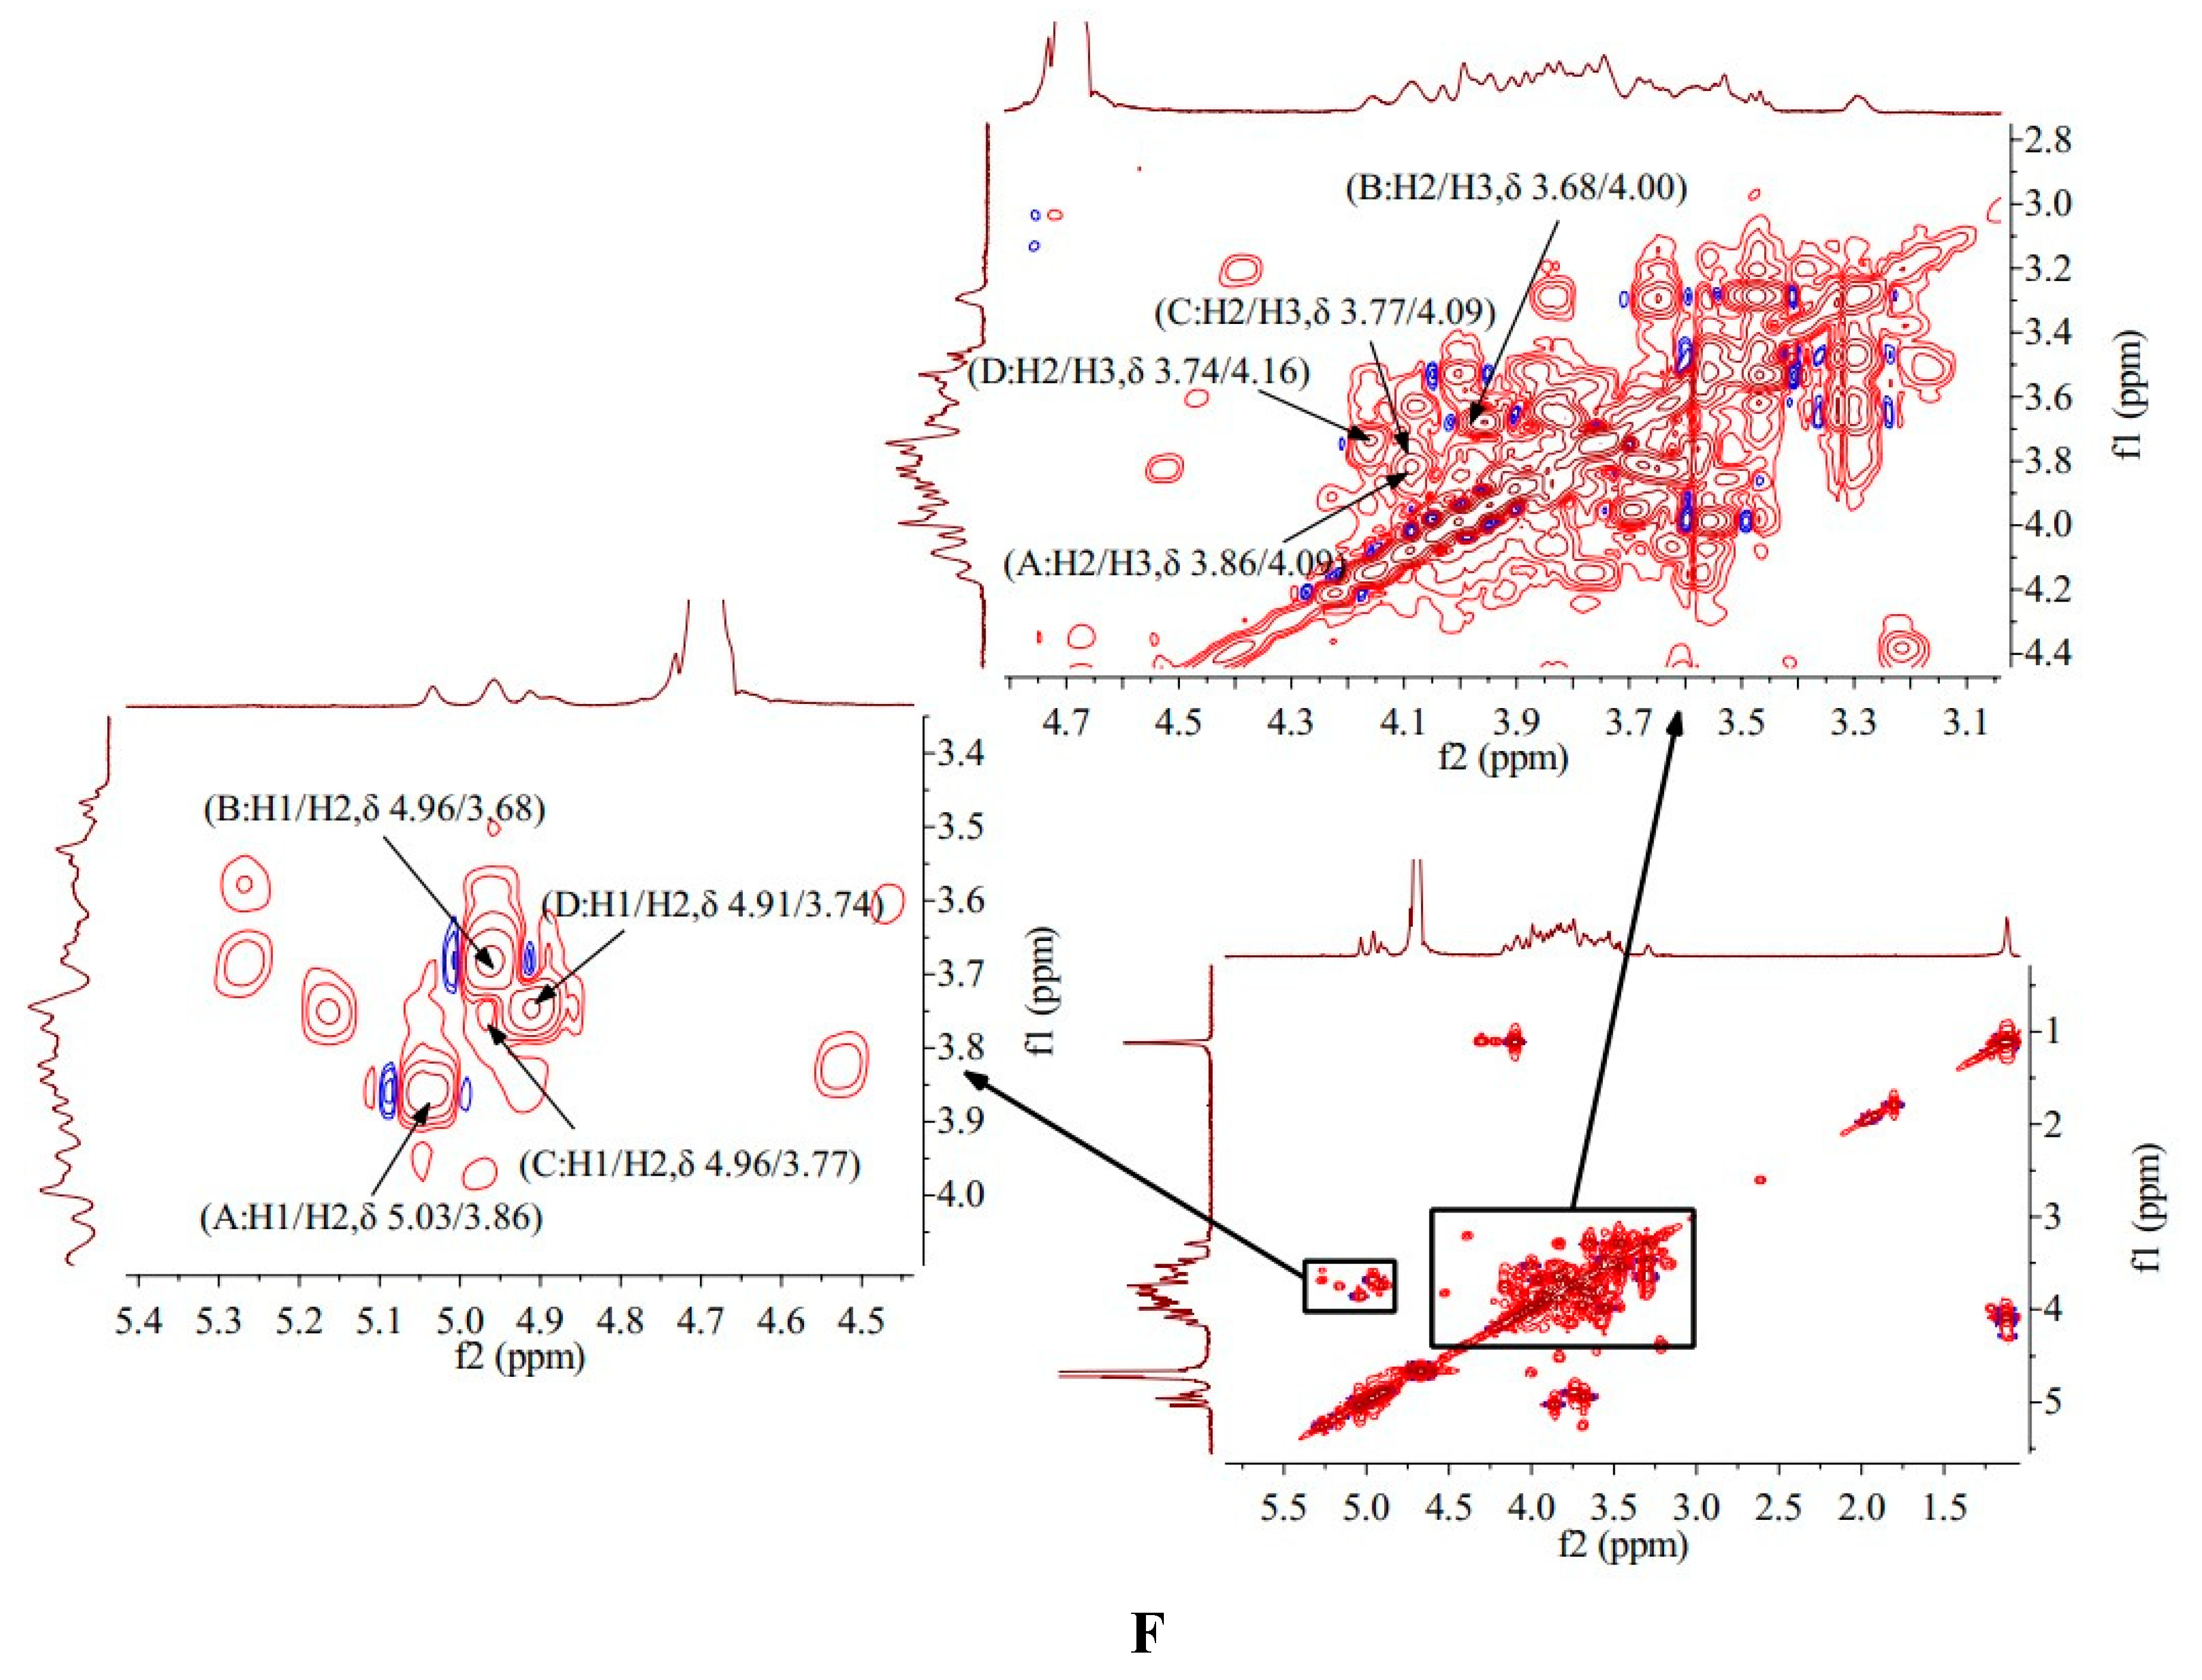
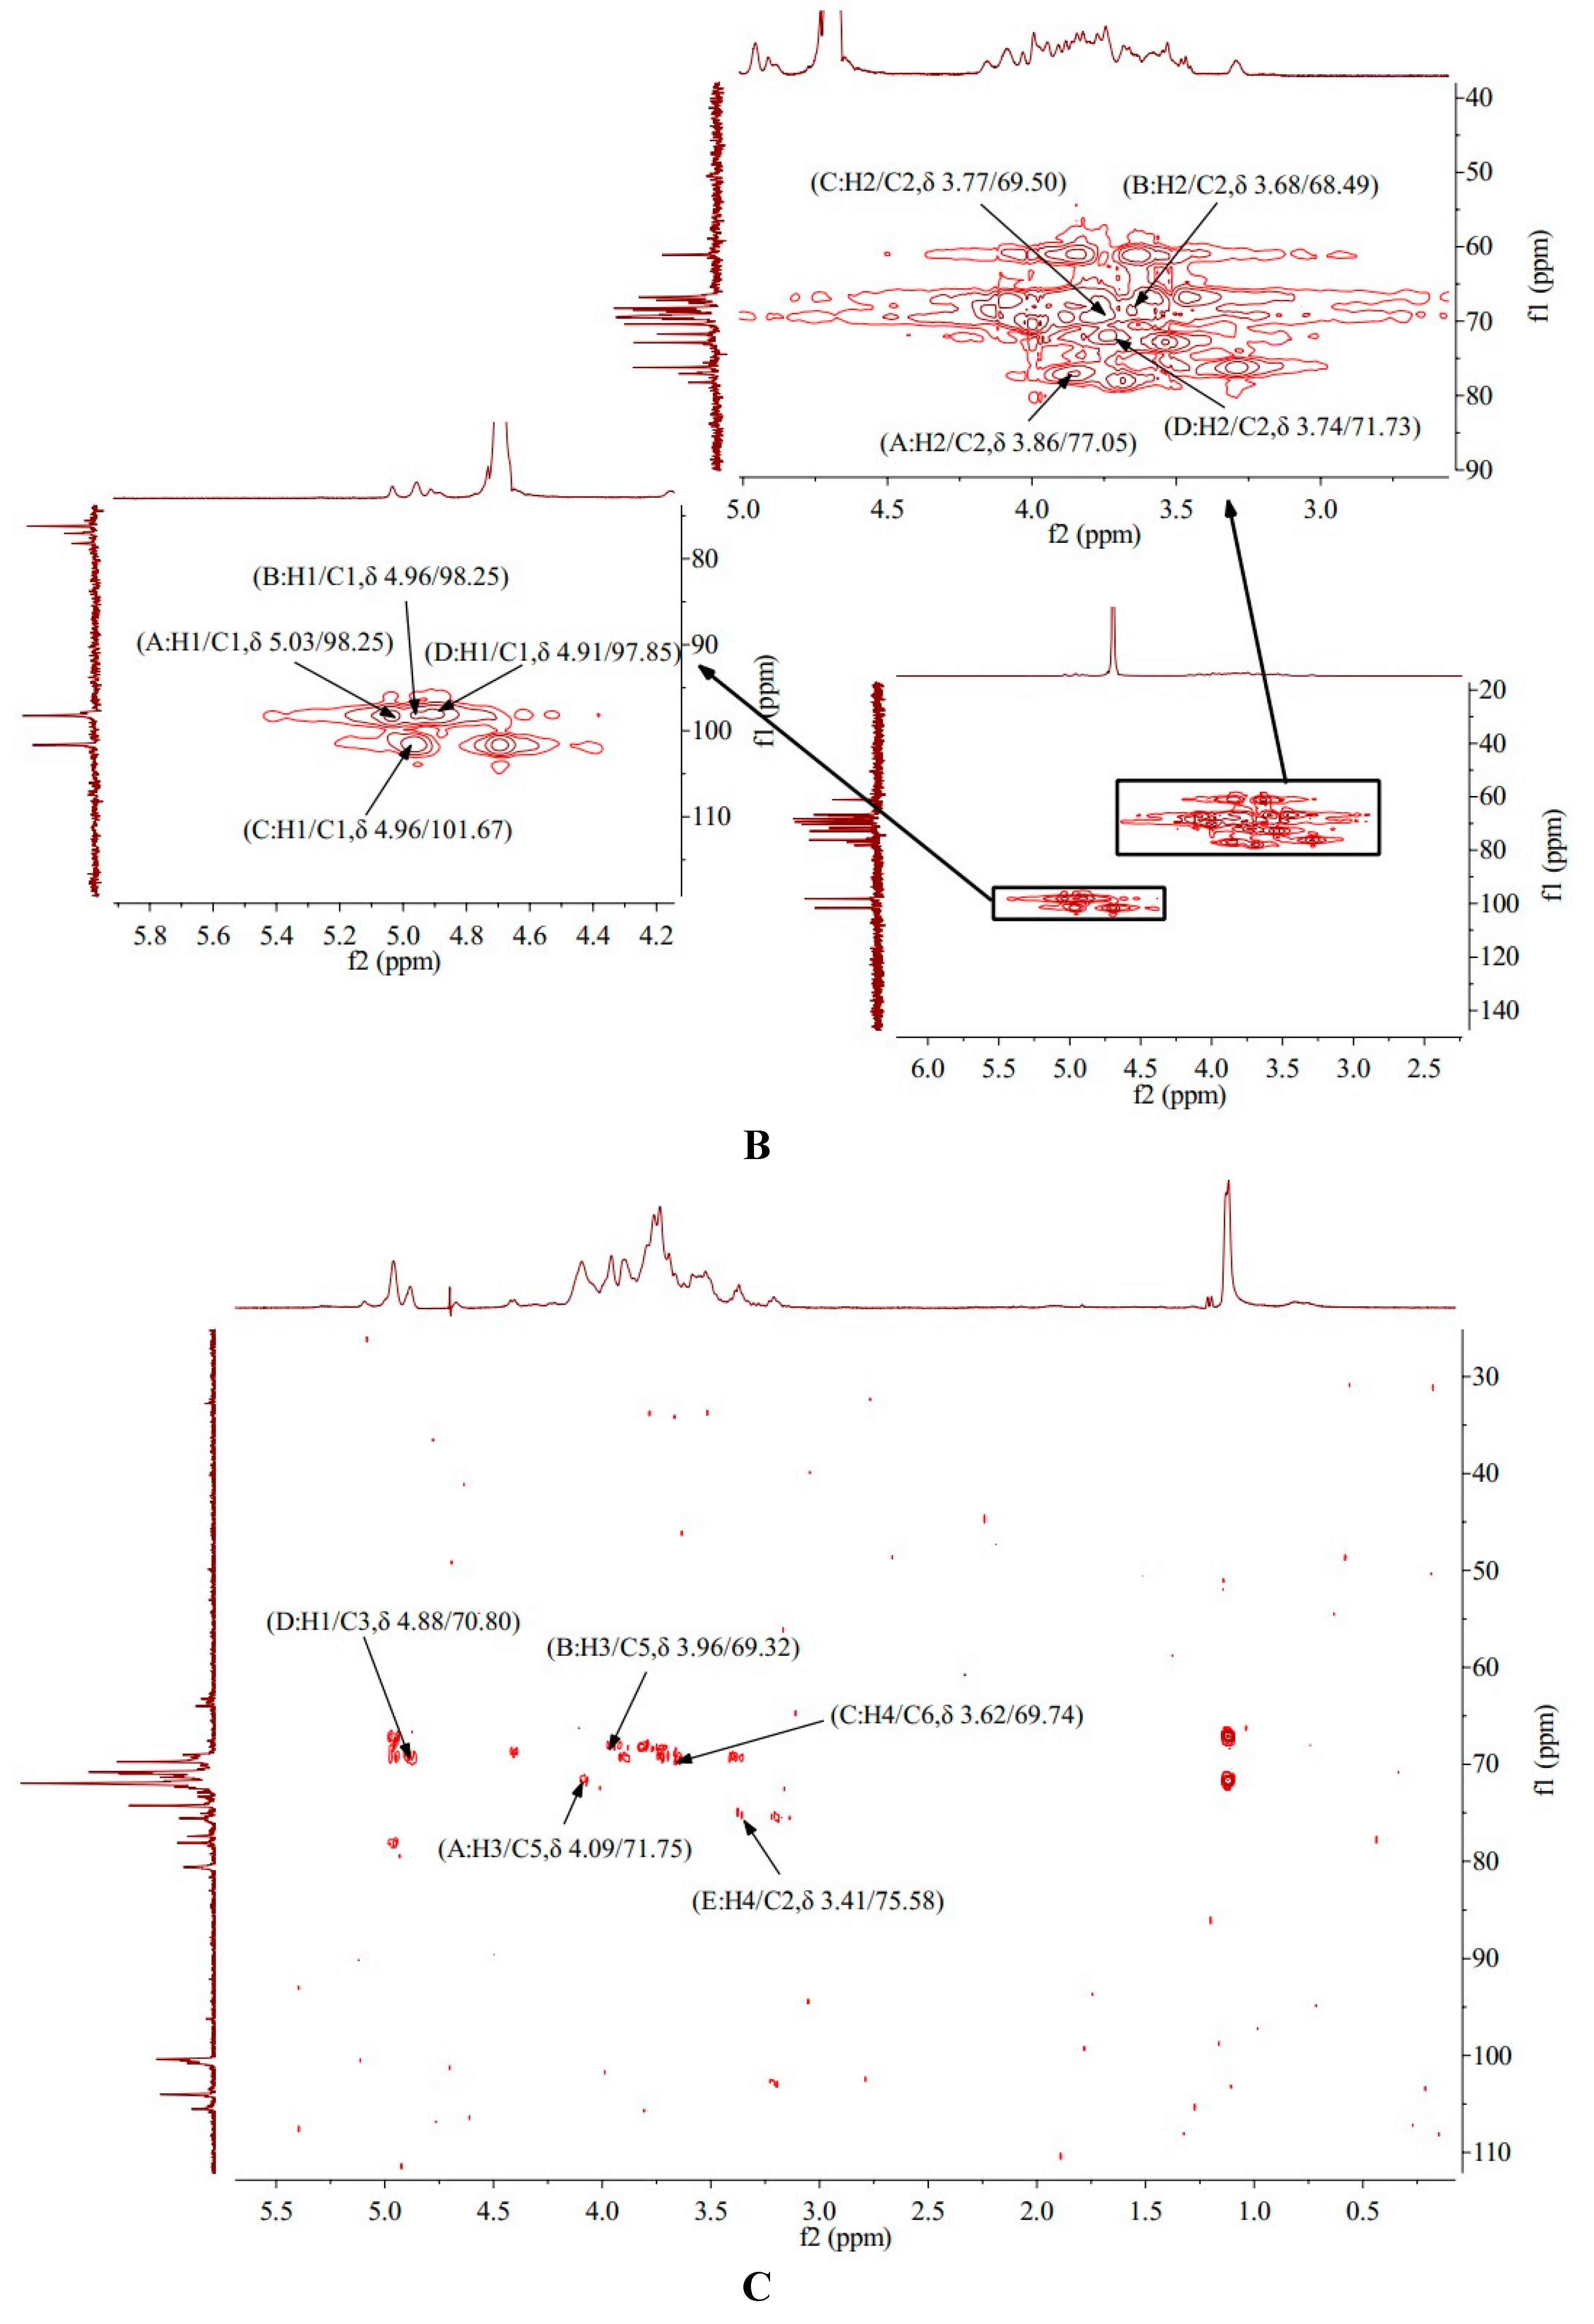
1H COSY spectrum of HO-P showed that signal A (δ 5.03/3.86), B (δ 4.96/3.68), C (δ 4.96/3.77) and D (δ 4.91/3.74) belong to the resonant coupling signal between H-1 and H-2 of the (A) (1→4,6)-Manp, (B)(1→4)-Glcp, (C)(→1)-Glcp, (D)(1→6)-Galp groups, respectively. The signals of H2-H6 of the A group are δ 3.86, δ 4.09, δ 3.63, δ 3.87 and δ 3.29, respectively (
Figure 3F).
3.9. HMQC Results of AA-P and HO-P
HMQC spectrum reflects the direct correlation between hydrogen and carbon signals, from which the correlation between
1H and
13C can be obtained [
19]. HMQC spectrum of AA-P showed that signal A (δ 5.09/96.22), B (δ 5.00/104.03), C (δ 4.96/100.56), D (δ 4.88/100.39) and E (δ 4.42/105.51) belong to the resonant coupling signal between C-1 and H-1 of the (A)(1→6)-Galp, (B)(1→4,6)-Glcp, (C)(1→6)-Galp , (D)(1→4)-Arap and (E)(→1)-Glcp groups, respectively. According to the resonant coupling signal between directly connected
1H and
13C, the signals of C2-C6 in (A)(1→6)-Galp group are δ 74.27, δ 69.74, δ 69.01, δ 71.75 and δ 77.43, respectively (
Figure 4A).
HMQC spectrum of HO-P showed that signal A (δ 5.03/98.25), B (δ 4.96/98.25), C (δ 4.96/101.67) and D (δ 4.91/97.85) belong to the resonant coupling signal between H-1 and C-1 of (A) (1→4,6)-D-Manp, (B)(1→4)- Glcp, (C)(→1)-Glcp and (D)(1→6)-Galp groups, respectively. According to the resonant coupling signal between directly connected
1H and
13C, the signals of C2-C6 in (A) (1→4,6)-D-Manp group are δ 77.05, δ 68.25, δ 70.39, δ 66.85 and δ 76.21, respectively (
Figure 4B) .
3.10. HMBC Analysis of AA-P and HO-P
HMBC provides a hydrocarbon relationship for remote coupling [
20]. The HMBC spectrum of AA-P showed the signal (δ 4.09/71.75) and (δ 3.96/69.32) belong to the resonance signal between H-3 and C-5 of (A)(1→6)-Galp and (B)(1→4,6)-Glcp , respectively. The signal (δ 3.62/69.74) belong to the resonance signal between H-4 and C-6 of (C)(1→6)-Galp, the signal (δ 4.88/70.80) belong to the resonance signal between H-1 and C-3 of (D)(1→4)-Arap, and the signal (δ 3.41/75.58) belong to the resonance signal between H-4 and C-2 of (E)(→1)-Glcp (
Figure 4C).
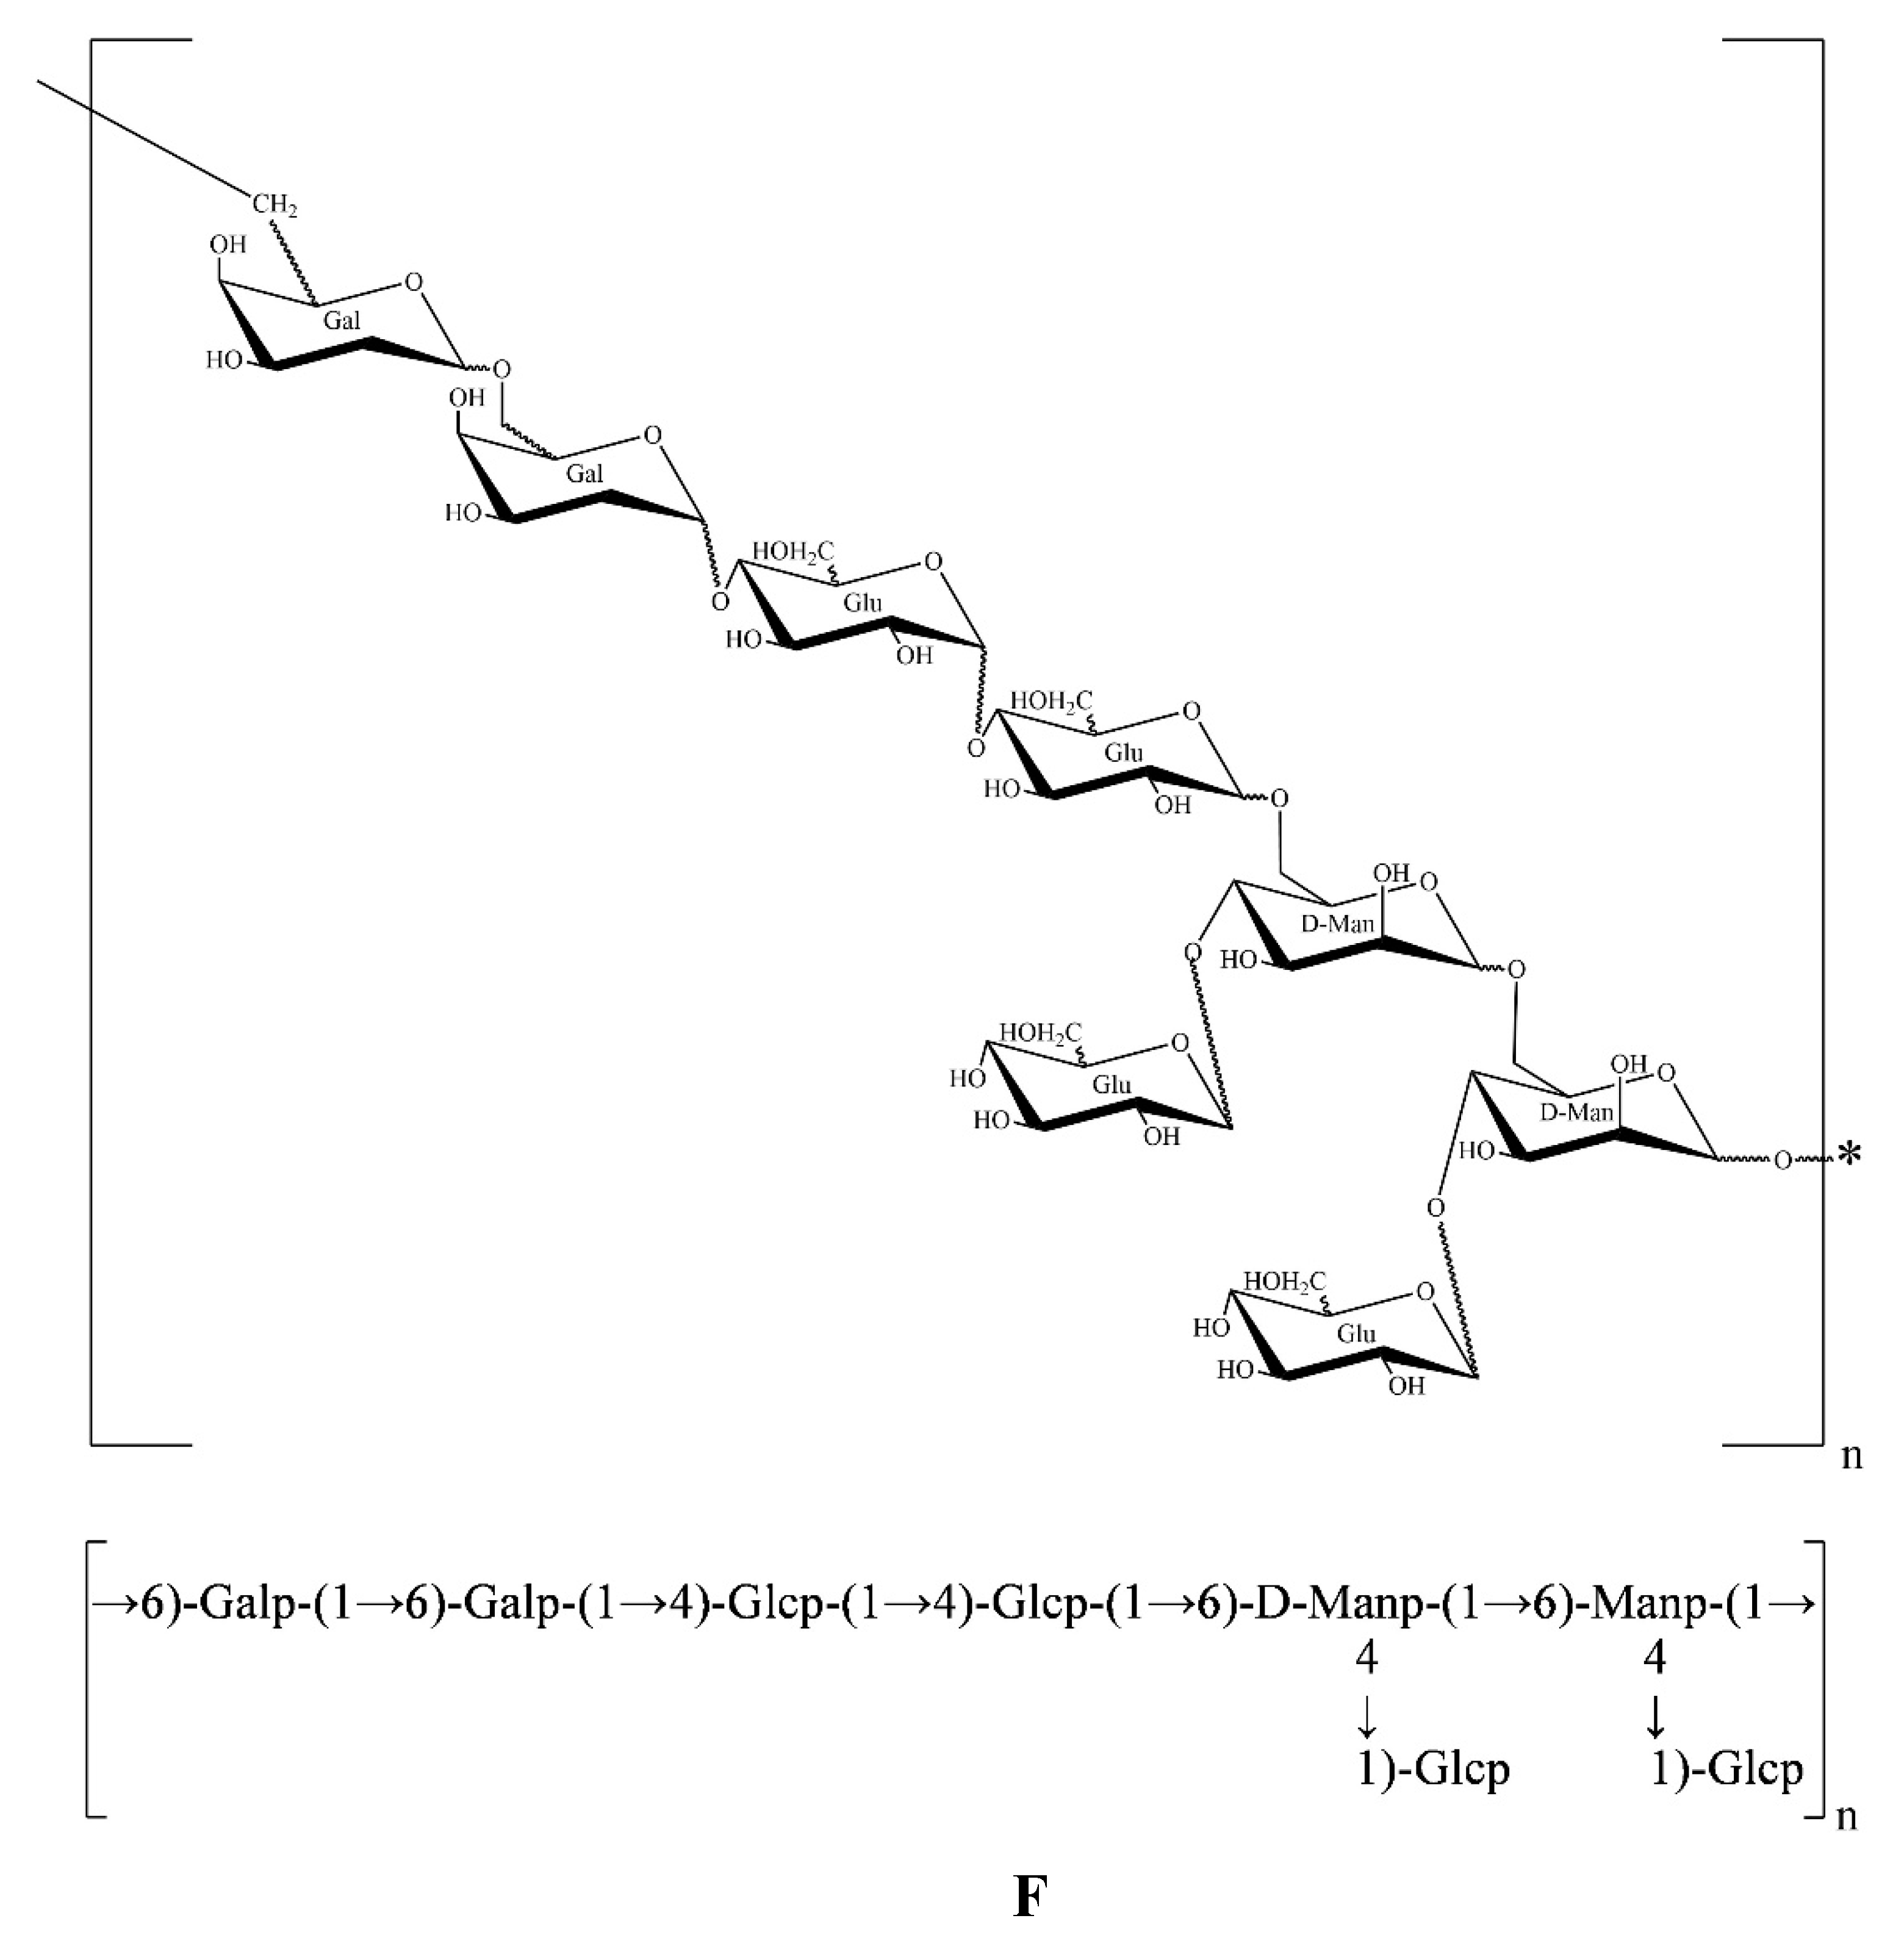
The HMBC spectrum of HO-P showed that the signal (δ 5.03/68.25), (δ 4.96/68.74) and (δ 4.91/69.13) belong to the resonance signal between H-1 and C-3 of (A)(1→4,6)-D-Manp, (C)(→1)-Glcp and (D)(1→6)-Galp, respectively, and the signal (δ 4.00/72.88) belong to the resonance signal between H-3 and C-5 of (B)(1→4)-Glcp (
Figure 4D).
All the results above showed that AA-P was composed of Arabinose, Galactose and Glucose in the ratio of 1:3:2, and its skeleton structure was consisted of (1→4)-Arap, (1→4,6)-Glup and (1→6)-Galp. The 4-O of the (1→4,6)-glucose residue of the AA-P main chain is connected to a 1→)-Glup (
Figure 4E).
The HO-P was composed of mannose, galactose and glucose in a ratio of 1:1:2. Its skeleton structure was consisted of (1→4)-Arap, (1→4,6)-Glup and (1→6)-Galp. Two mannose residues 4-O on the main chain are each connected to a →1) glucose residue (
Figure 4F).
3.11. Effect of AA-P and HO-P on T Cells Activity In Vitro
Polysaccharides activated immune cells including B cells, T cells, macrophages and natural killer cells to produce cytokines. Immunomodulatory effect can be used as a preventive means for metastatic tumors [
21]. T cells was a type of lymphocytes developed in the thymus and regulated the immune activity of the body [
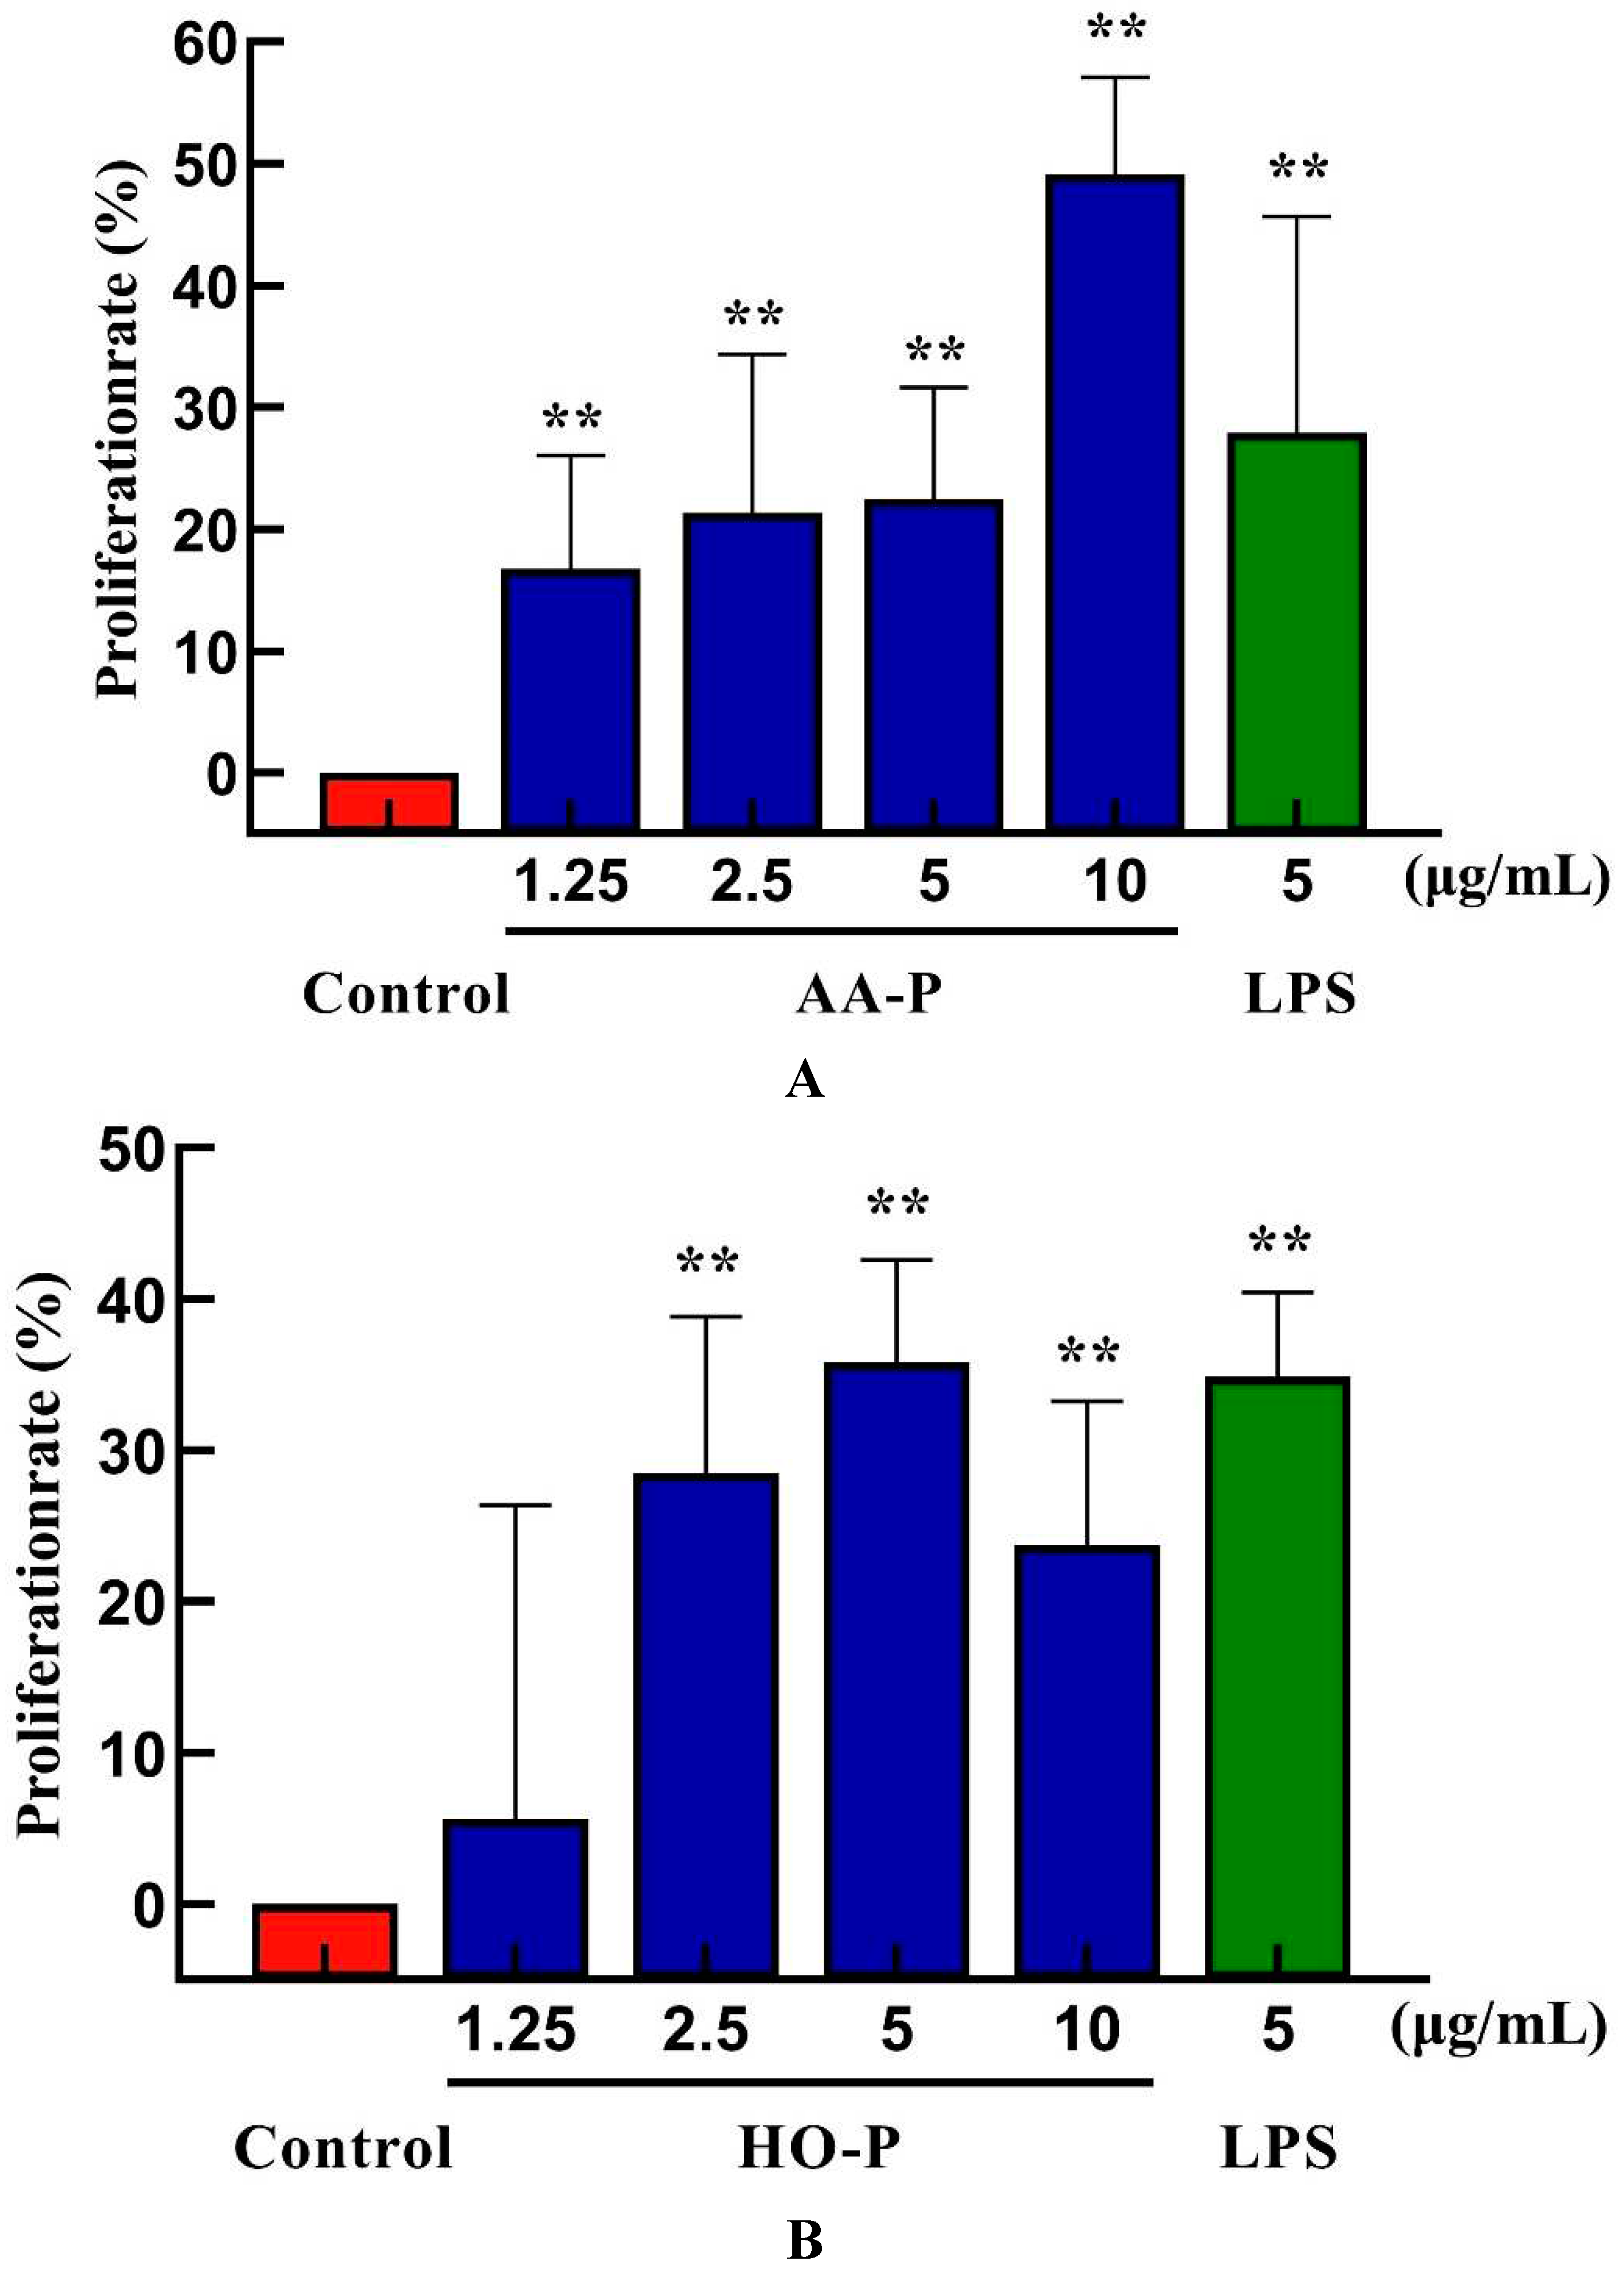
22]. The T cells proliferation efficiency increased by 49.12 % and 35.80 %, respectively, when the concentration of AA-P was 10 μg/mL and HO-P was 15 μg/mL(
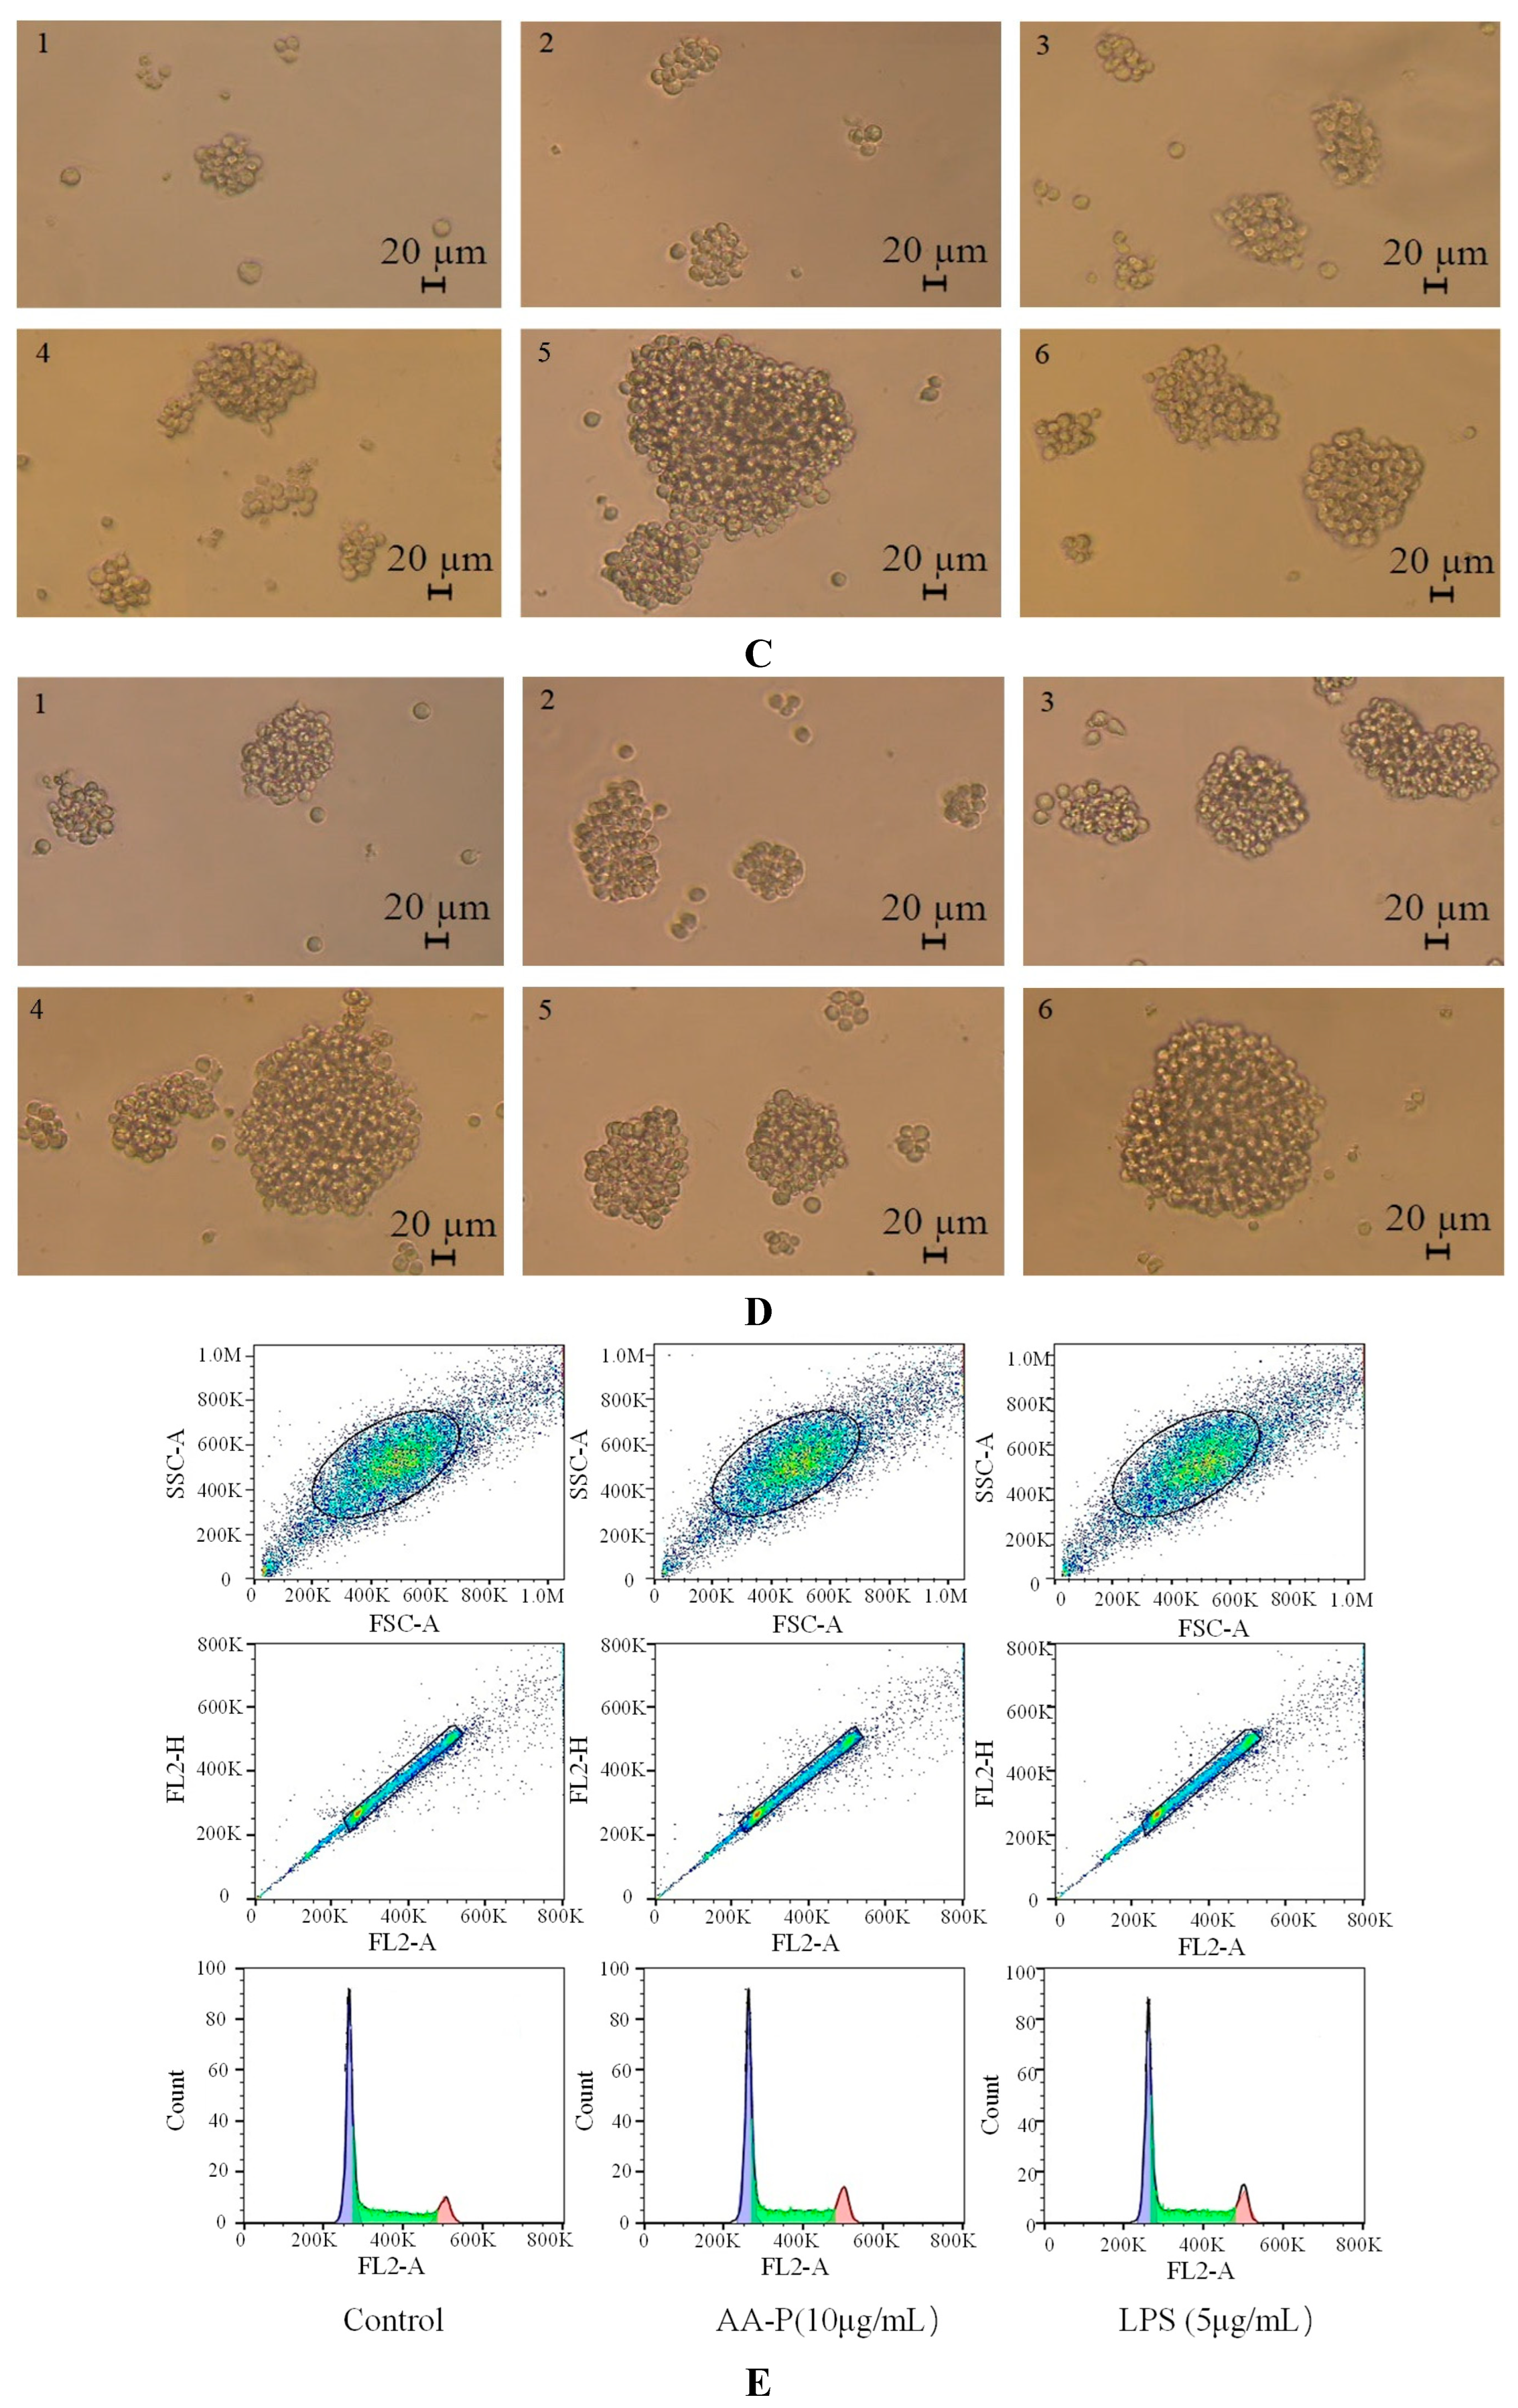
Figure 5A,B). The morphological changes of T cells activitied by AA-P and HO-P showed that the T cells grew well and the cell shape was round. The number of T cells clusters also increased, which was the same in the positive group (
Figure 5C,D).
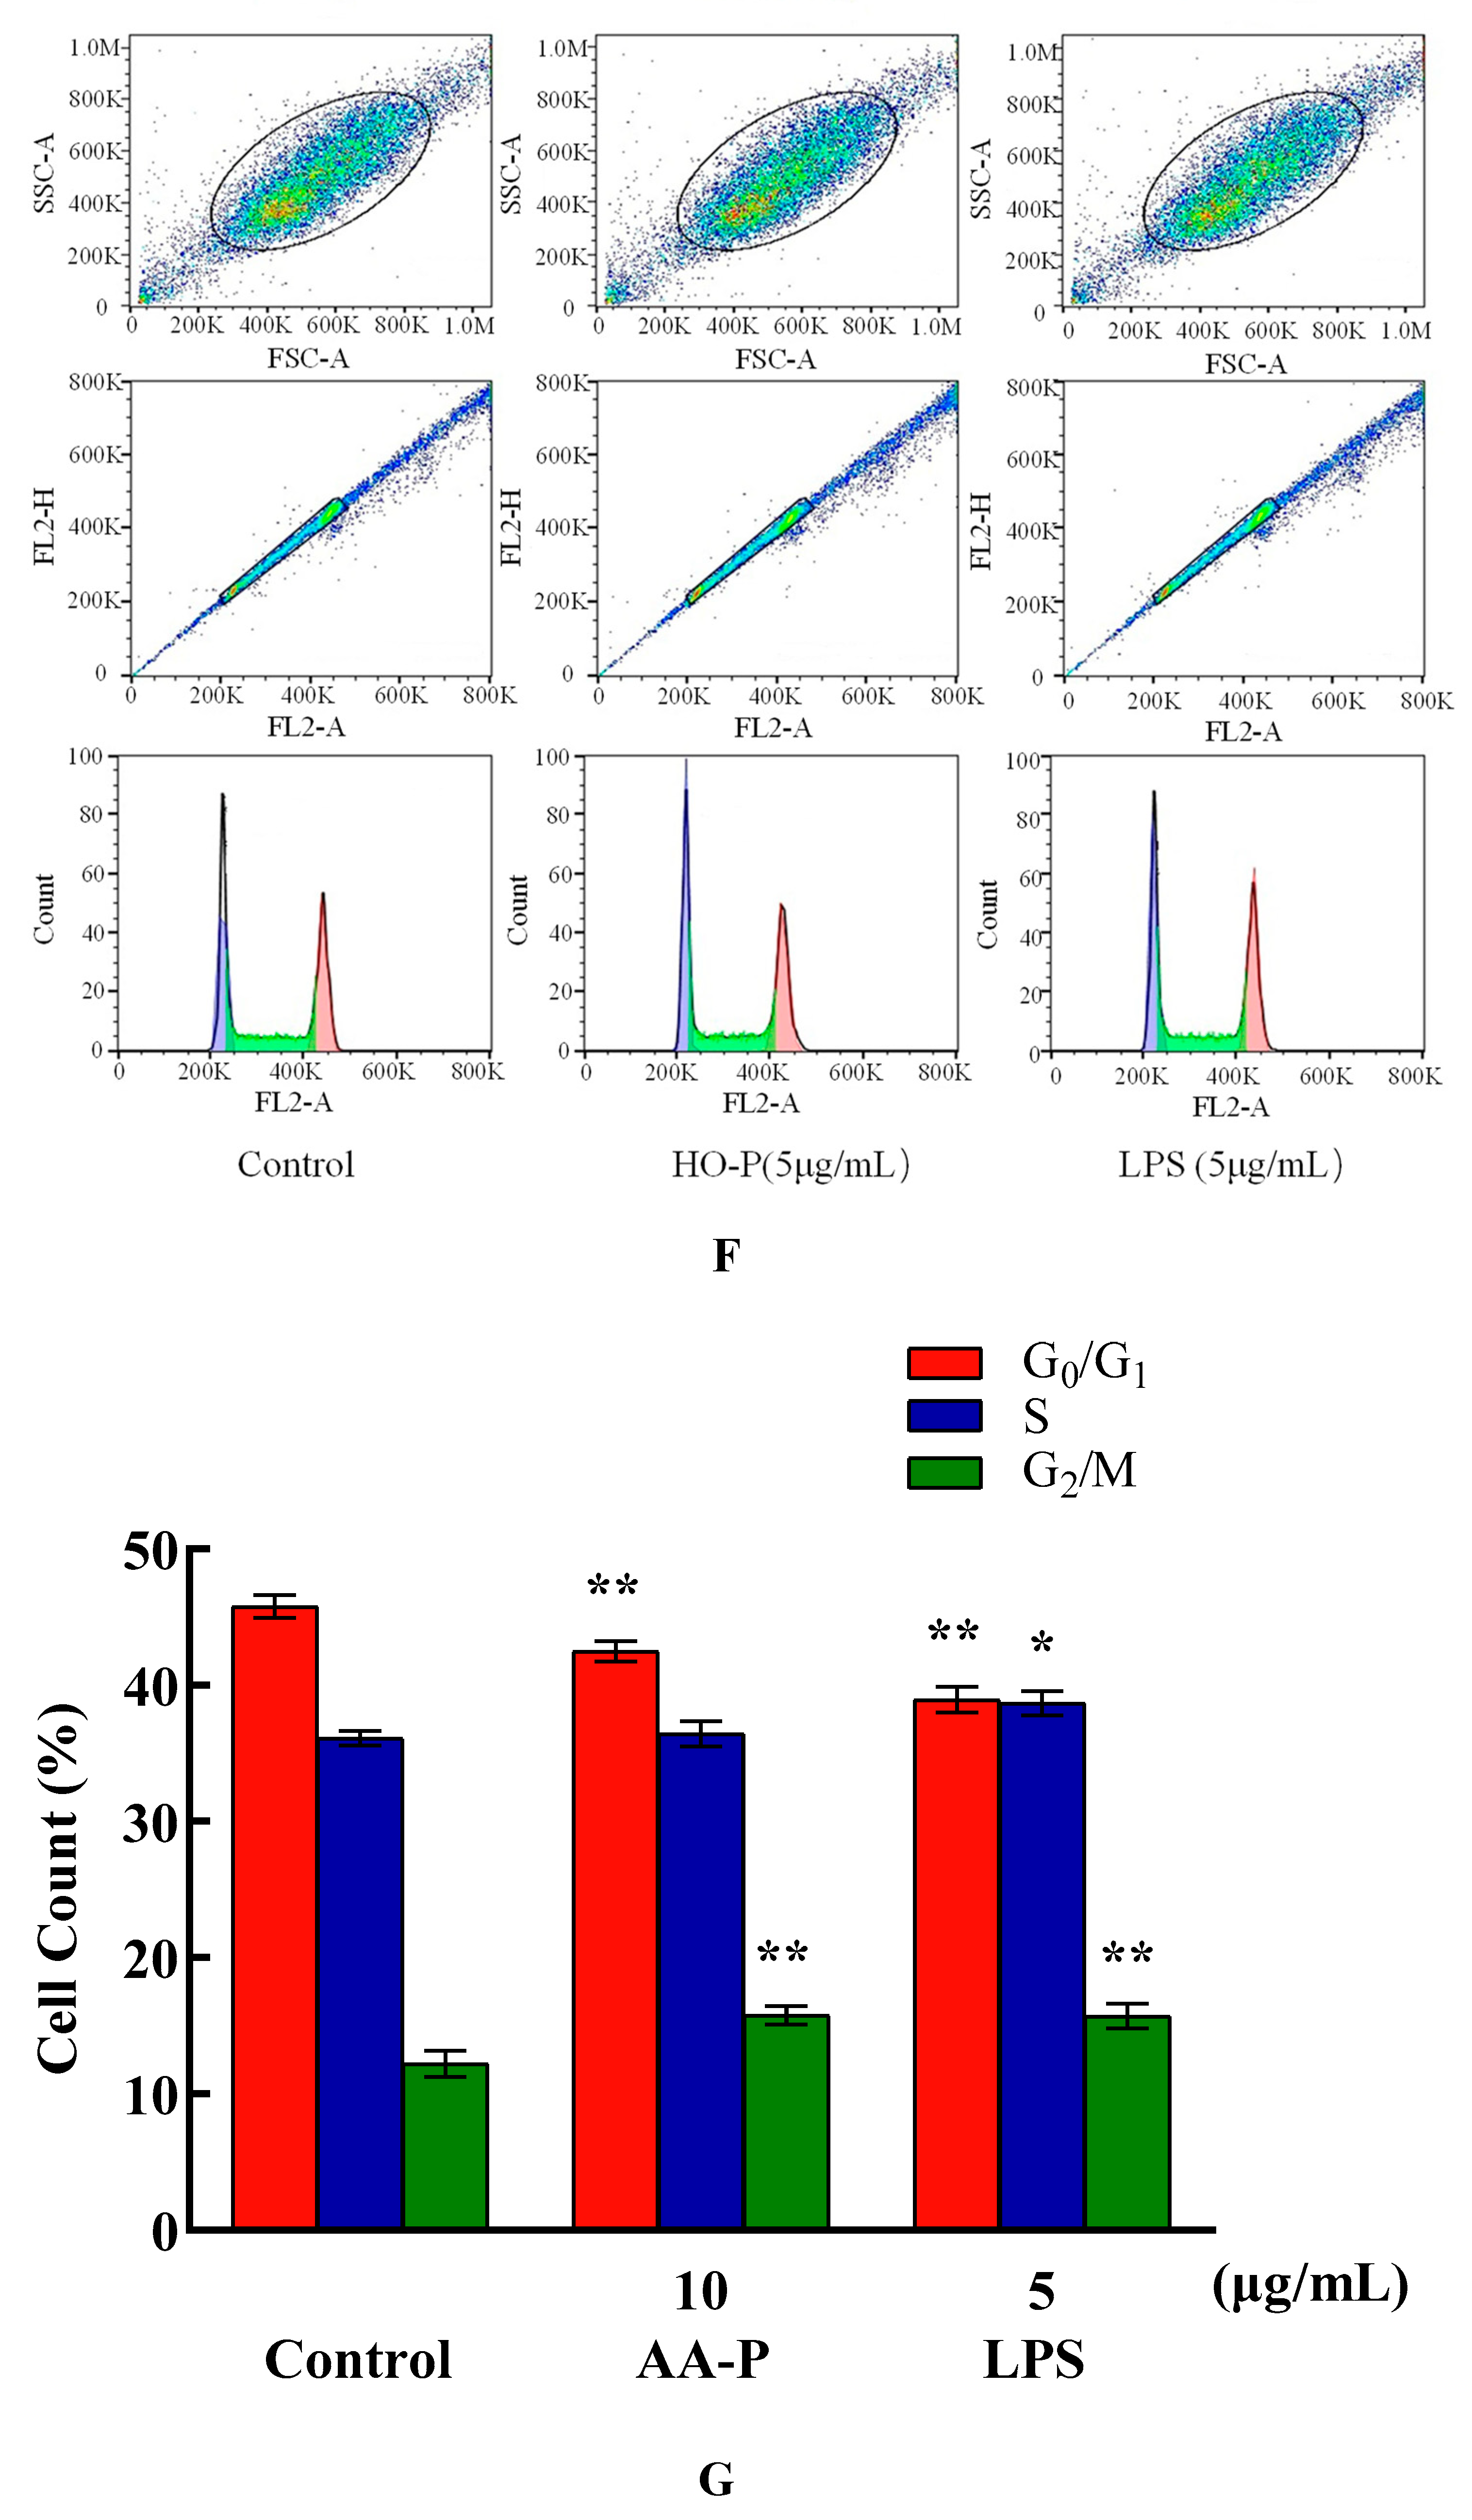
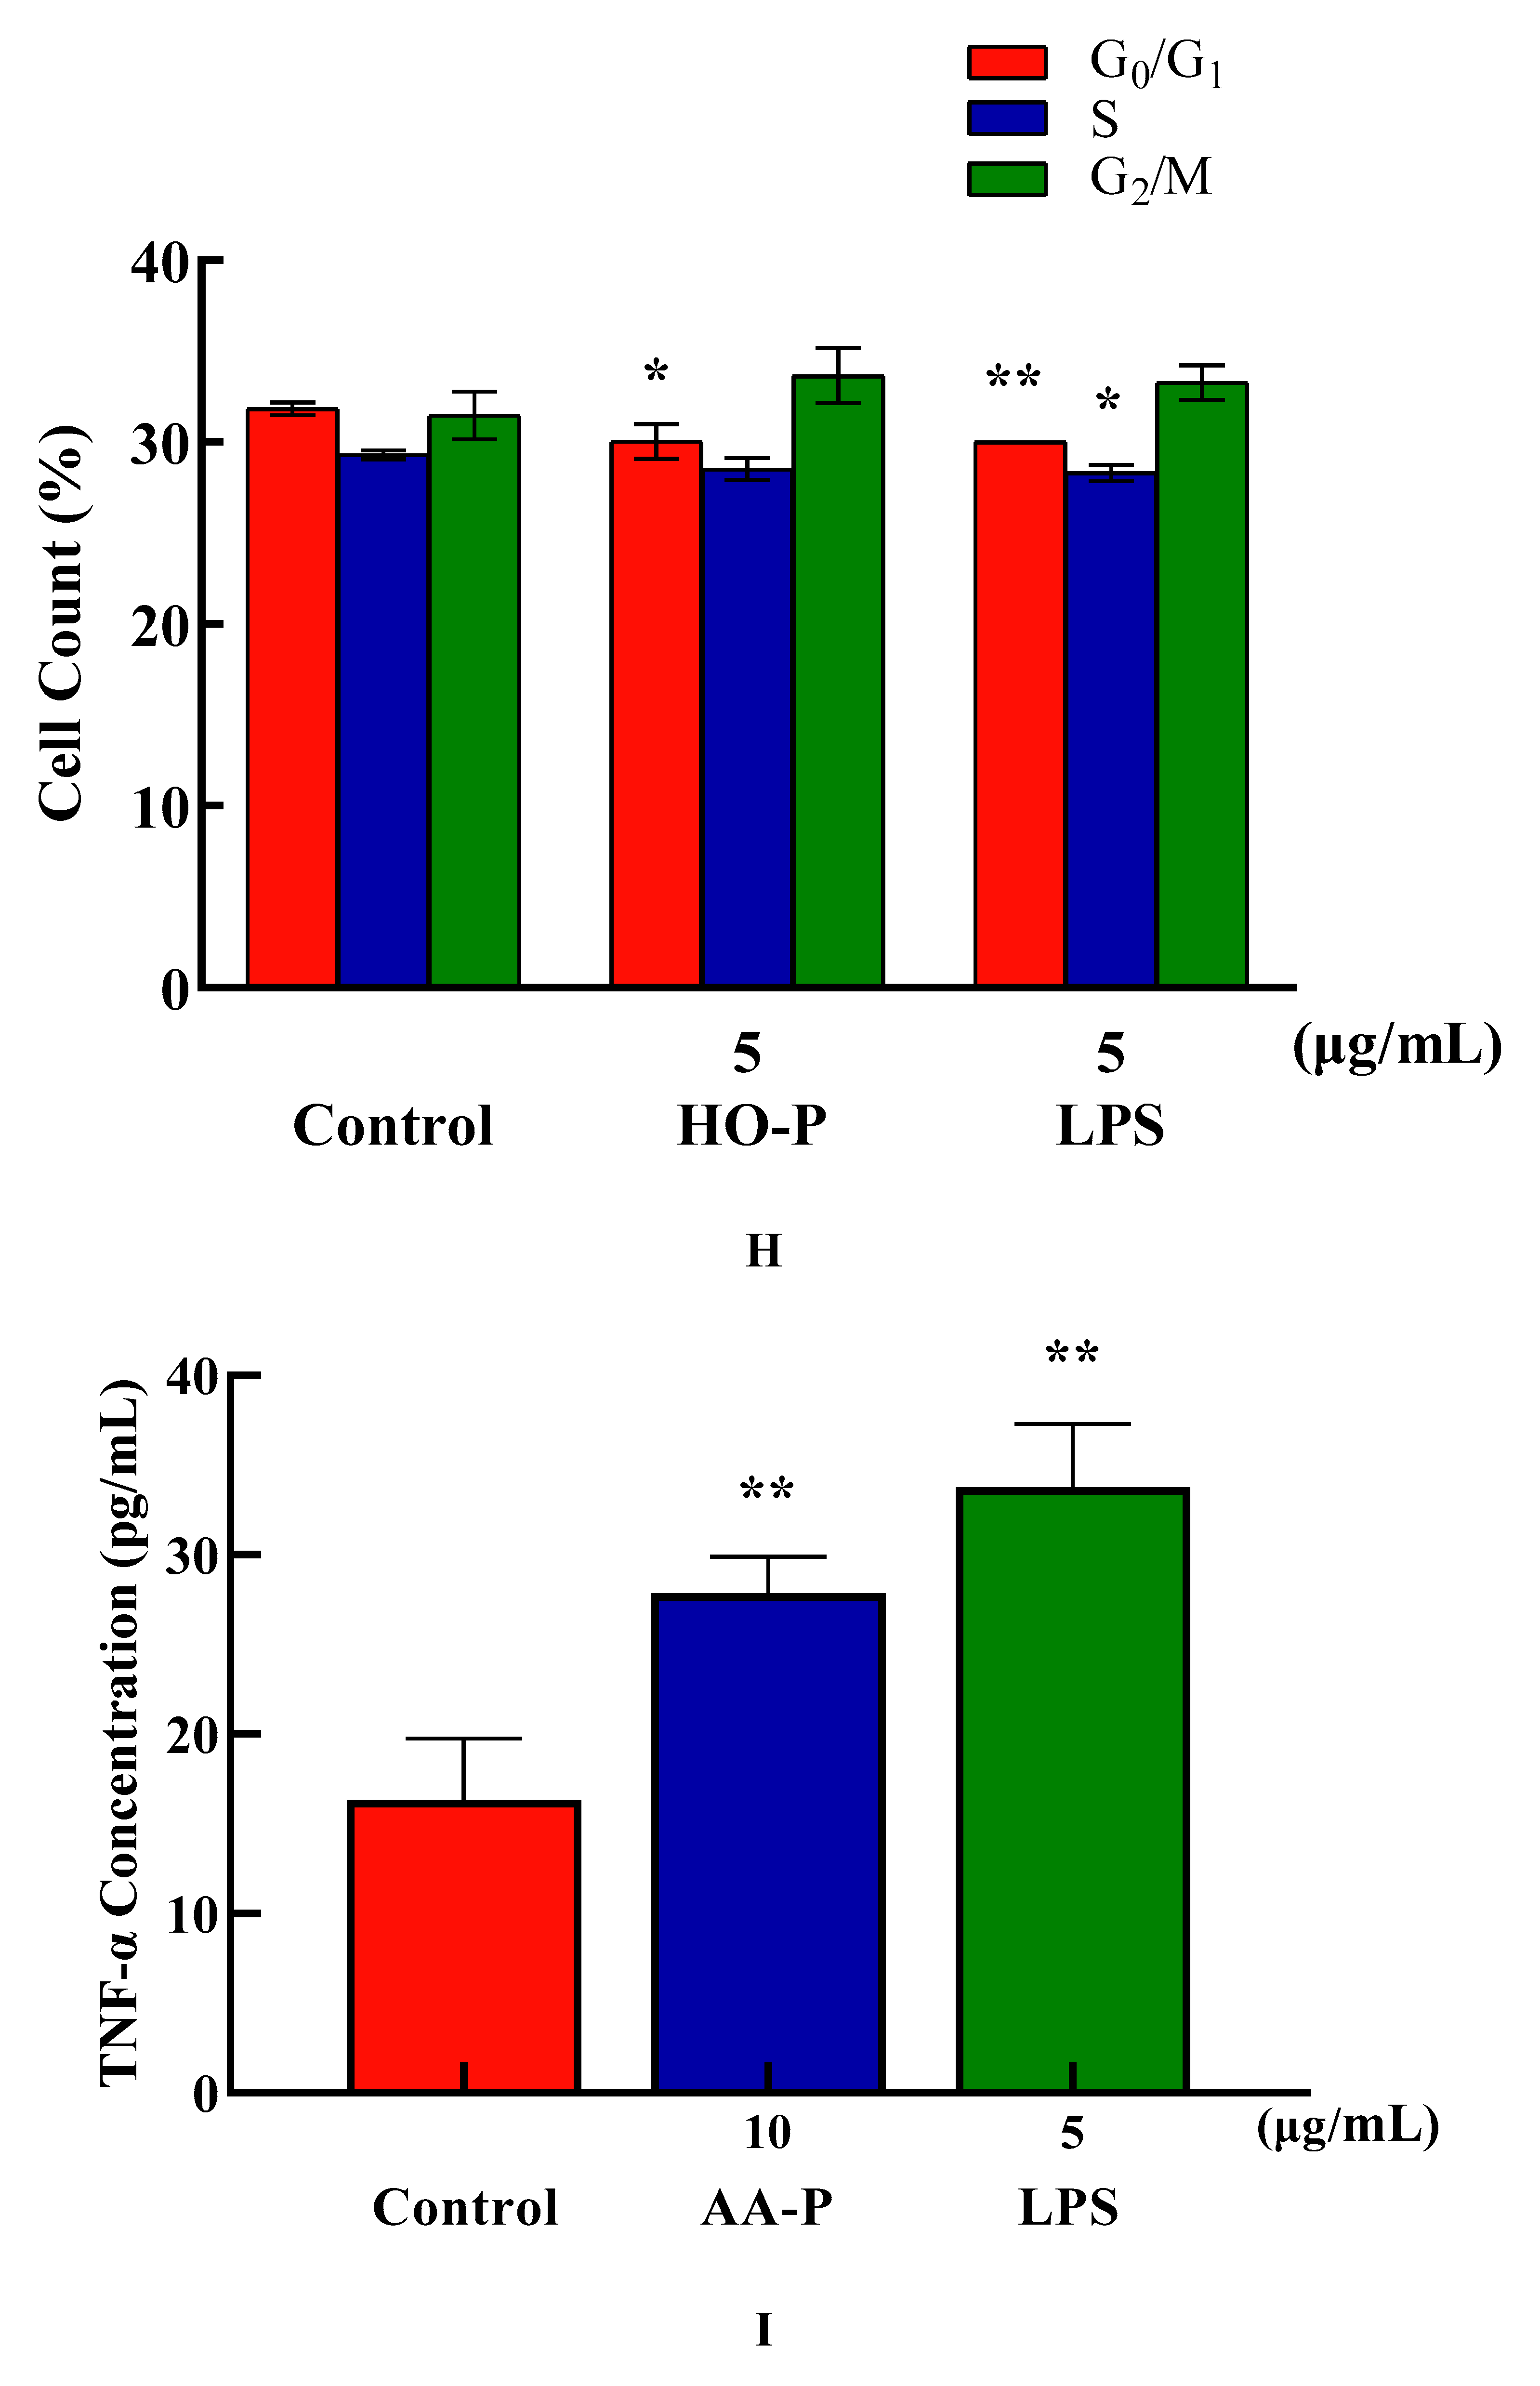
The percentage of cells number of G
0/G
1 phase in AA-P group (10 μg/mL) and positive group both significantly reduced (
P < 0.01), which were 42.47 % and 38.93 %, respectively, while cell number in G
0/G
1 phase of blank group was 45.77 %. Meanwhile, the percentage of cell number in G2/M phase of AA-P group and positive group increased to 15.77 % and 15.73 %, respectively (
P < 0.01), while cell number in G2/M phase in blank group was 12.23 %. These results indicated AA-P could promote T cells entering G2/M phase from the G0/G1 phase. The percentage of cells number of G
0/G
1 phase in HO-P group (5 μg/mL) and positive group both significantly reduced (
P < 0.01), which were 30.03 % and 30.00 %, respectively, while cell number in G
0/G
1 phase in blank group was 31.83 %. HO-P could only affect G
0/G
1 phase and had no significant effect on the G2/M phase and S phase of T cells (
Figure 5E–H).
Cytokine (CK) is a low molecular weight soluble protein produced by a variety of cells induced by immunogen, mitogen or other stimulators. It has many functions such as regulating innate and adaptive immunity, hematopoiesis, cell growth, APSC pluripotent cells and repairing damaged tissues [
23]. The proliferation results showed that when final concentration of AA-P and HO-P were 10 and 5 μg/mL, respectively, the T cells stimulating effect were the best. The results showed AA-P (10 μg/mL) could stimulate T cells to secrete TNF-α with amount of 27.86 pg/mL(
P < 0.01), which was lower than positive group (33.74 pg/mL) (
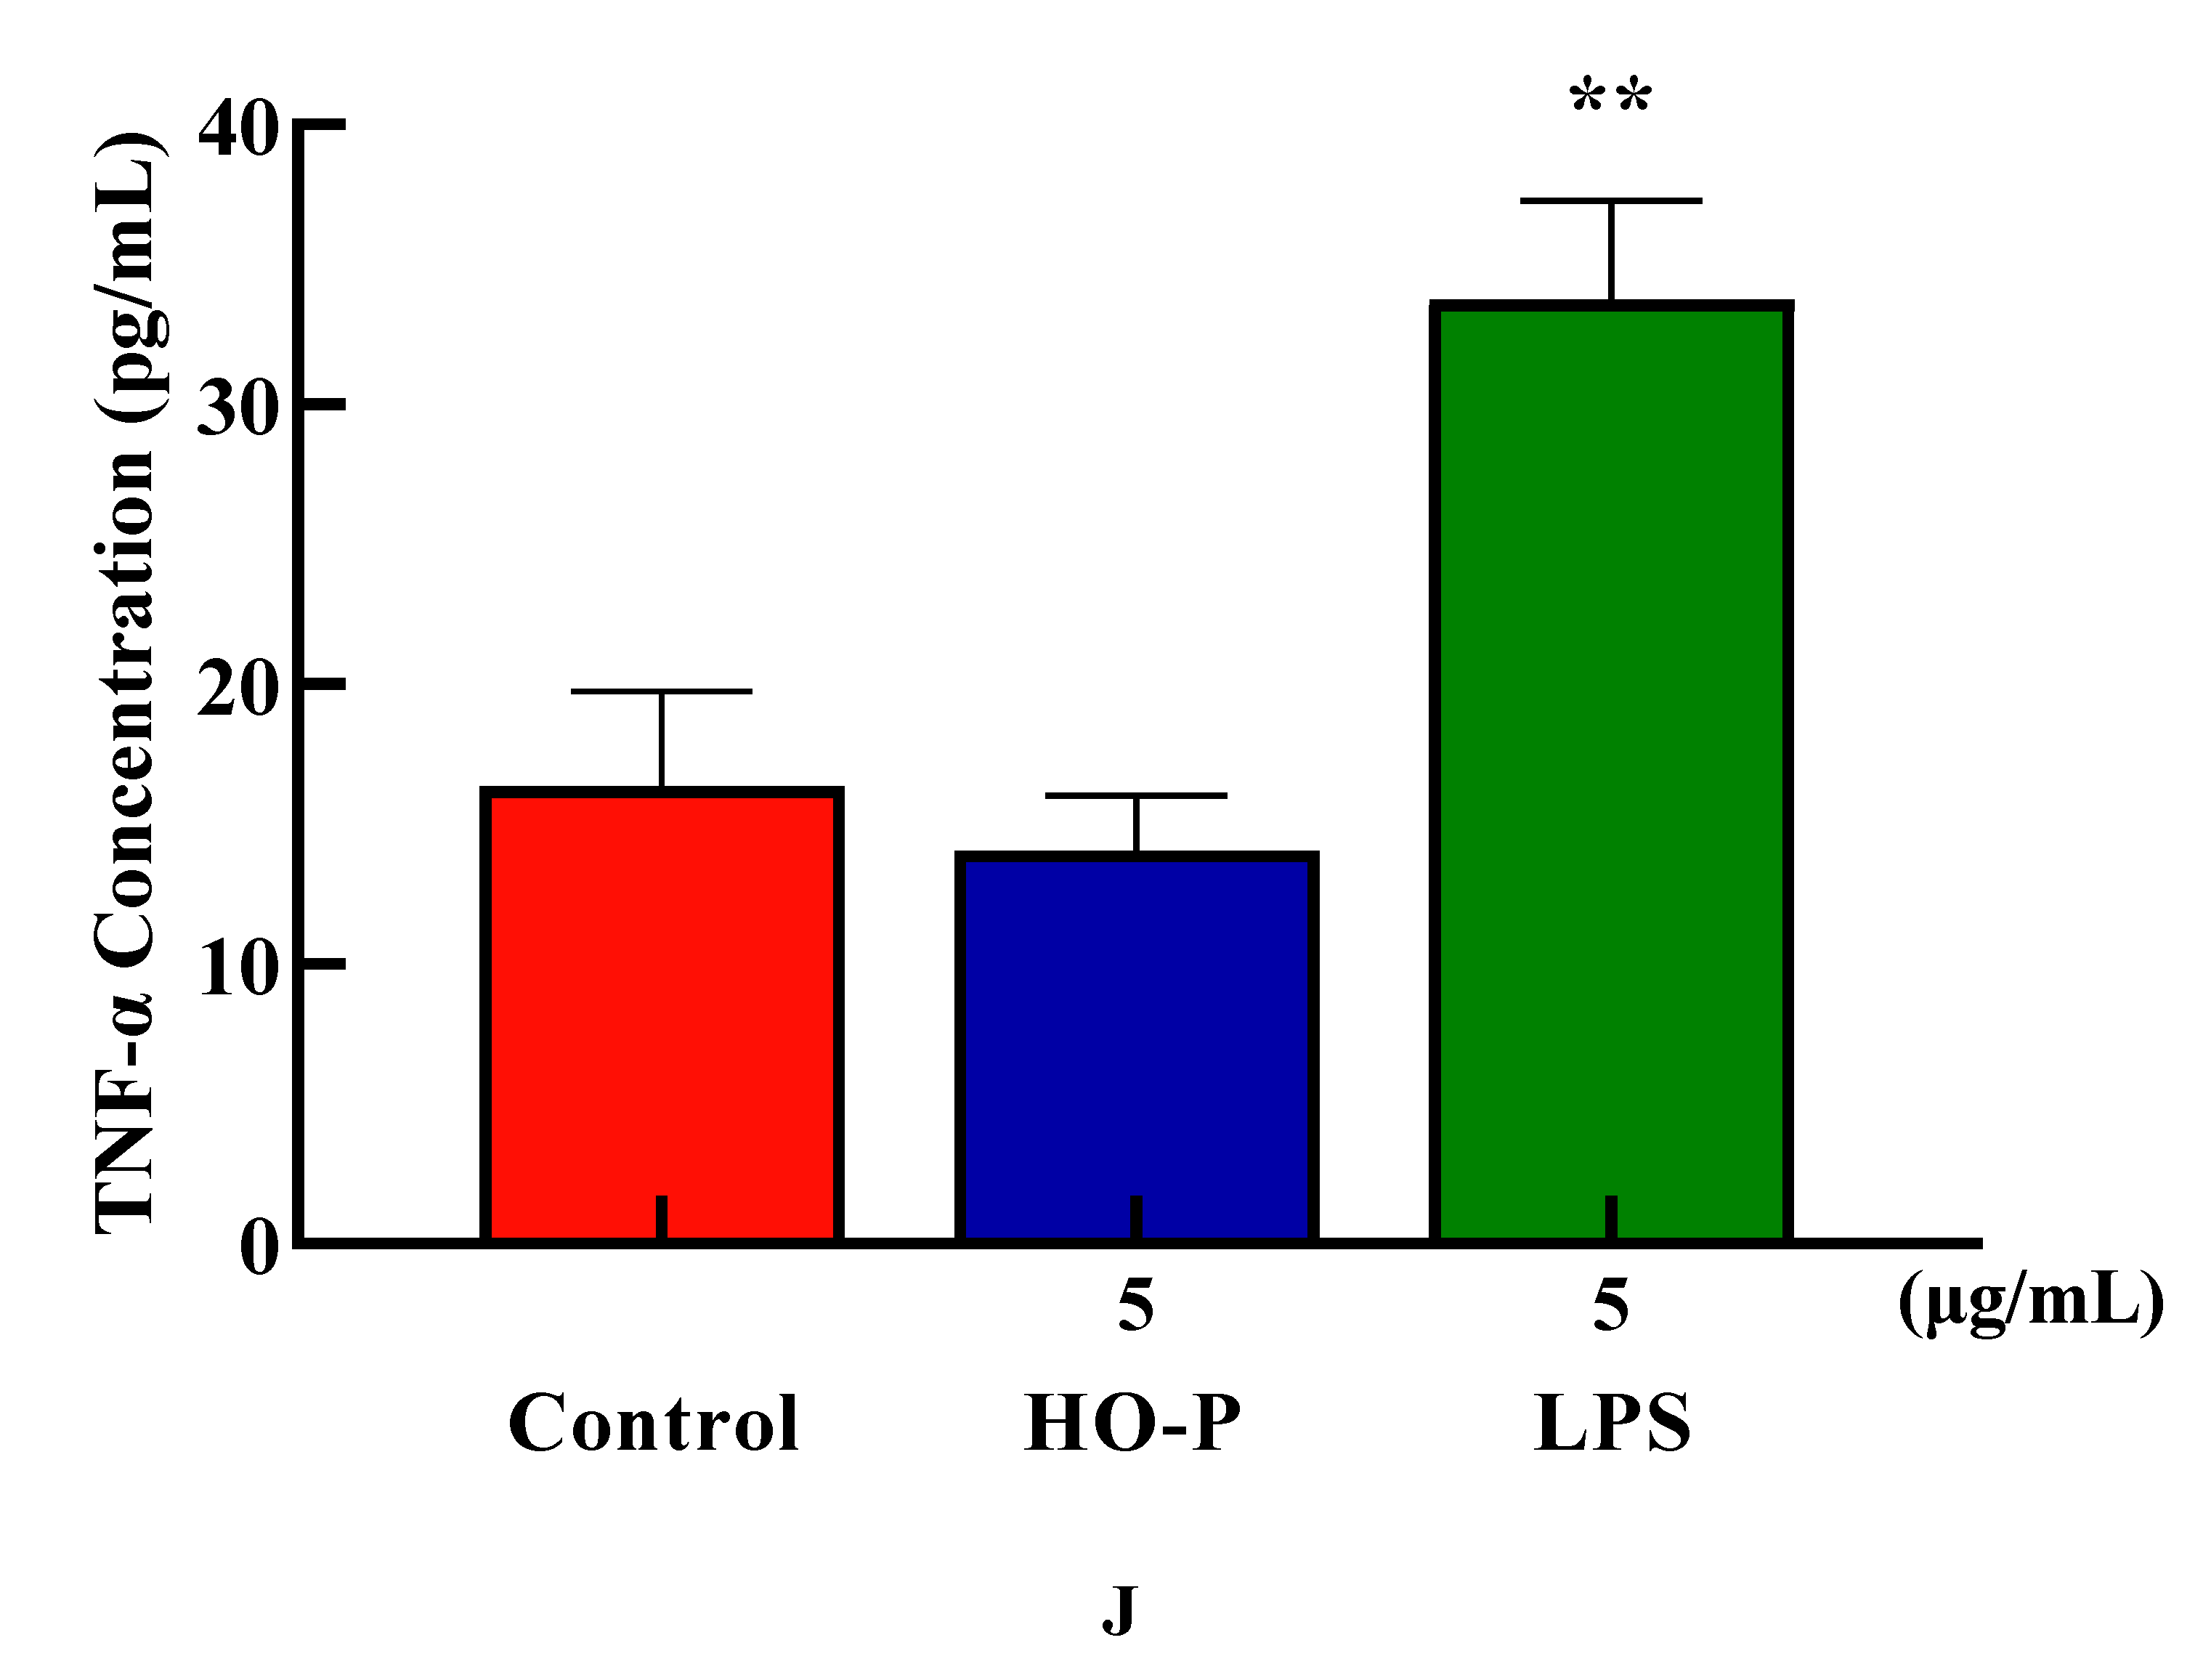
Figure 5I). But when concentration of HO-P was 5 μg/mL, it could not stimulate T cells to secrete TNF-α (
Figure 5J).
3.12. Effect of AA-P and HO-P on B Cells Activity In Vitro
B lymphocytes can also be abbreviated as B cells which was pluripotent stem cells and played an important role in the immune activity of the body [
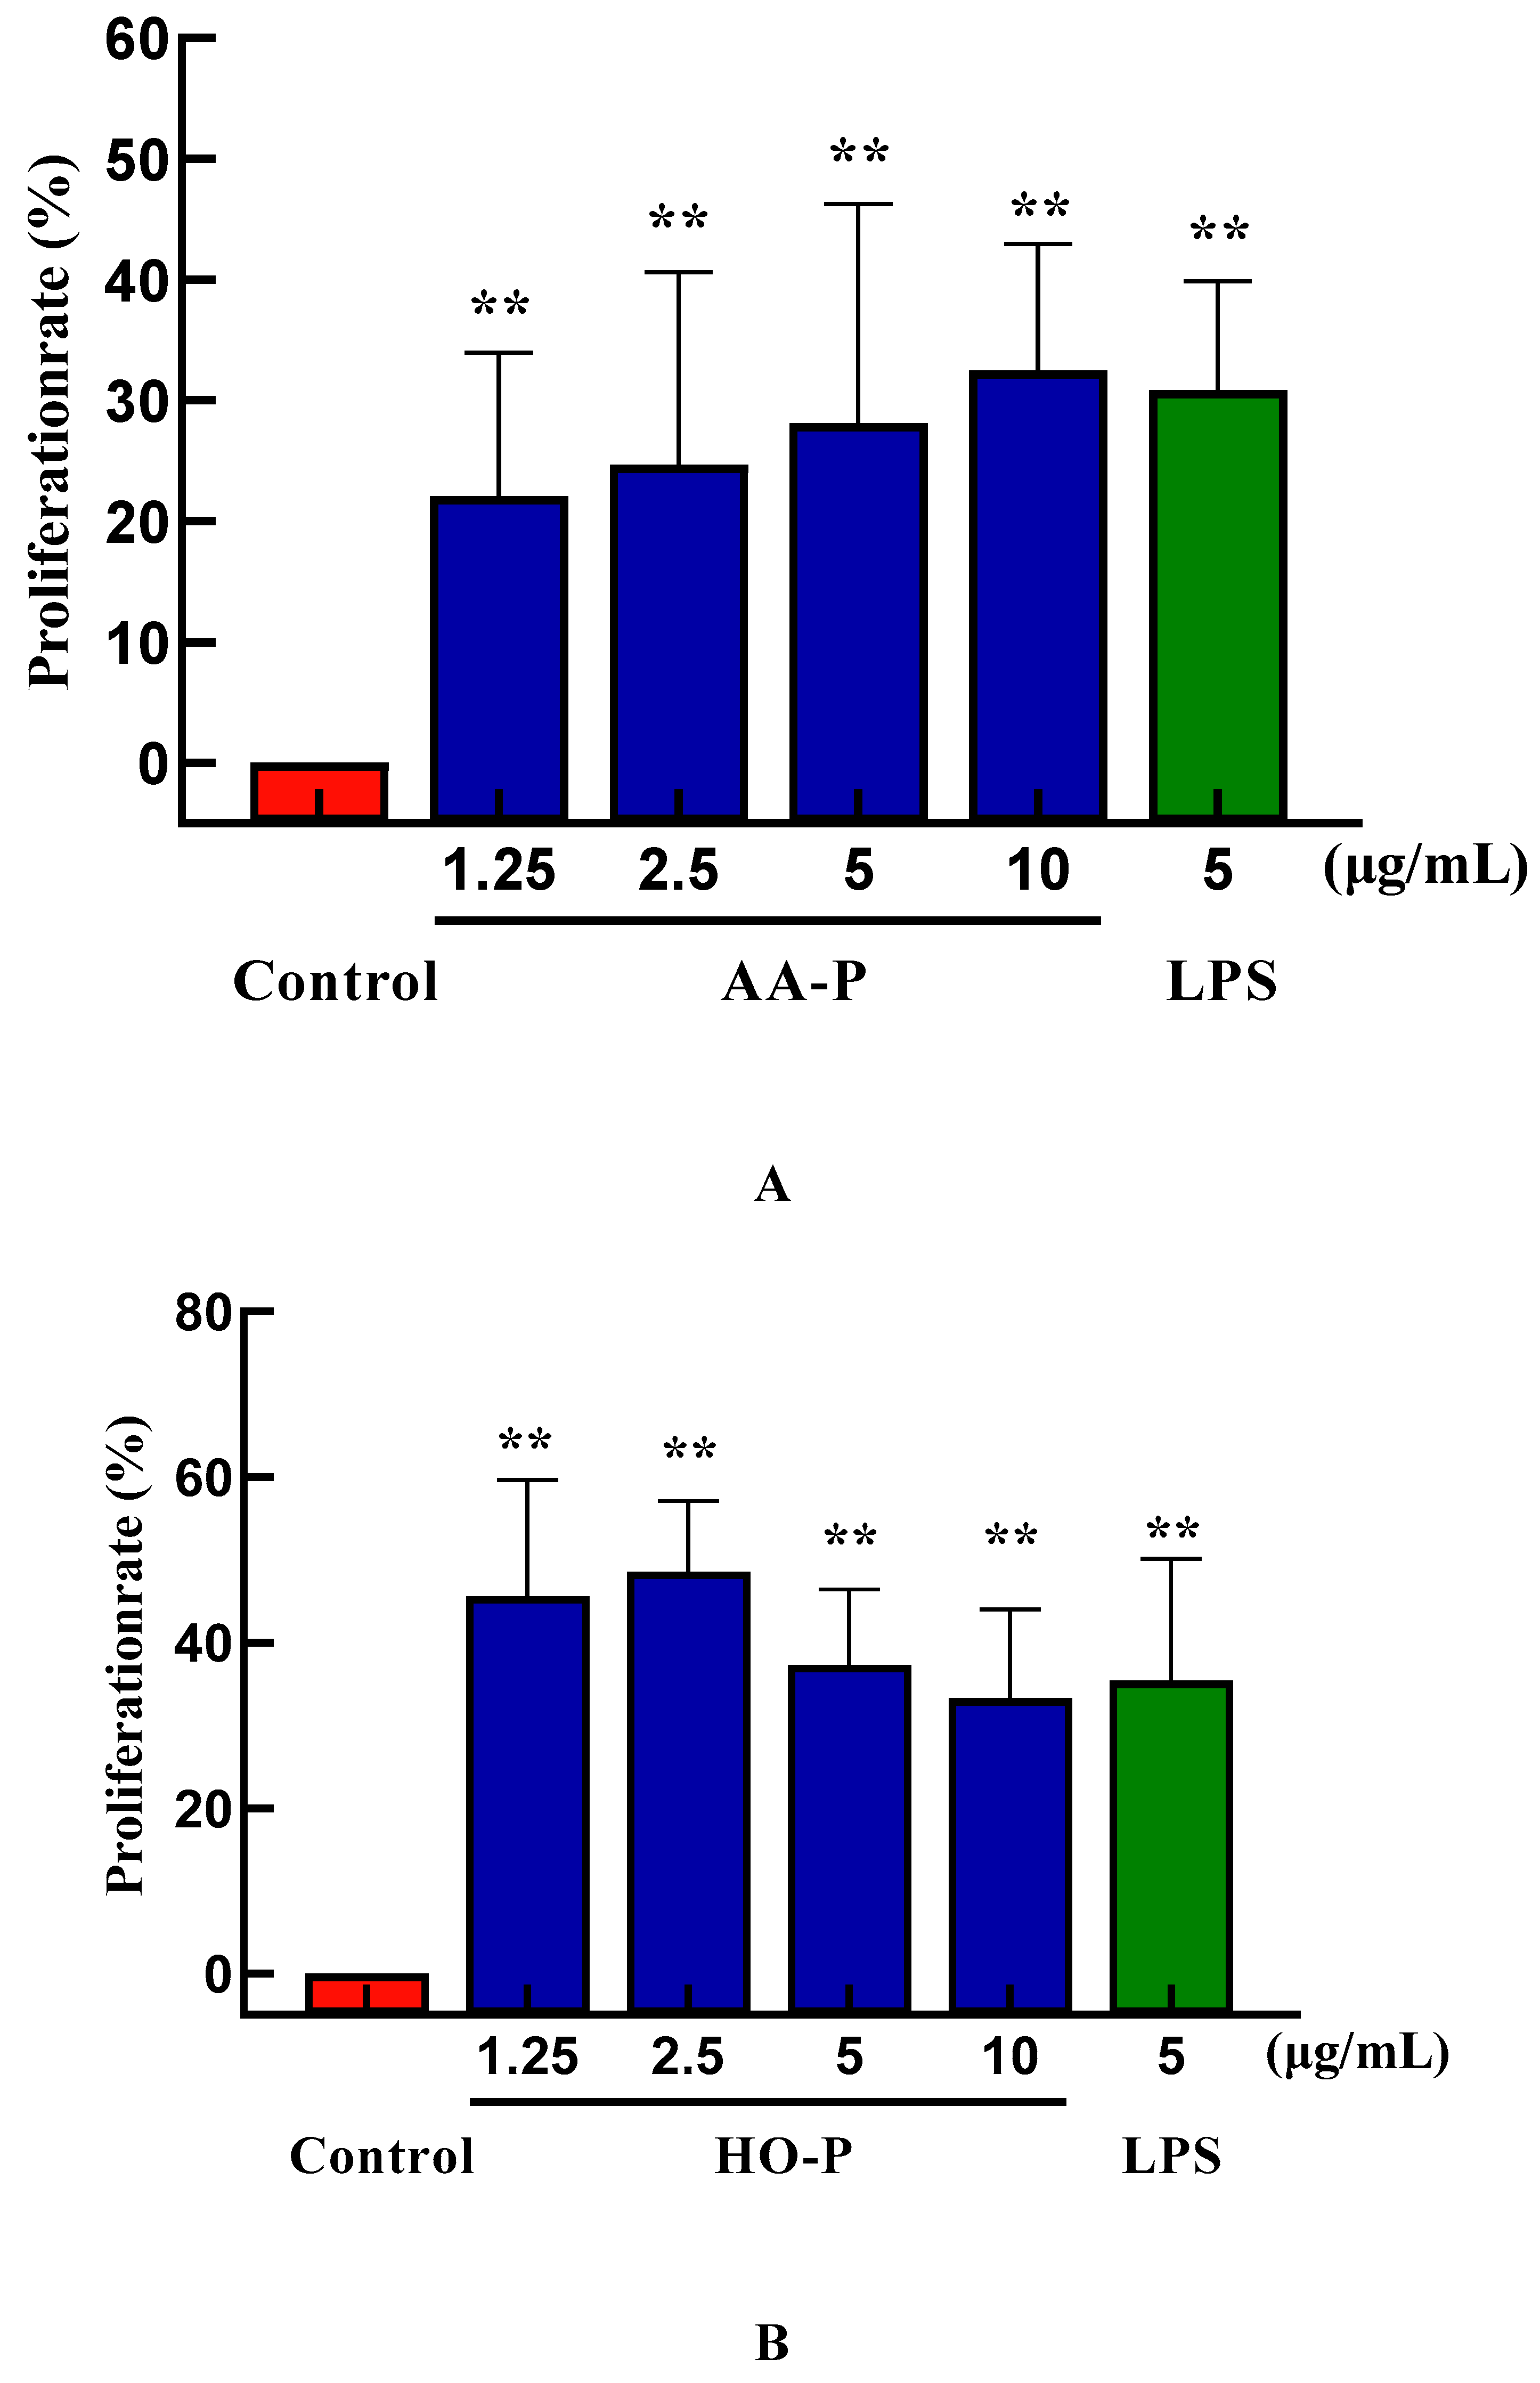
24]. The results showed that polysaccharide AA-P (1.25, 2.5, 5, 10 μg/mL, respectively) could lead to the proliferation of B cells, and the proliferation rates were 22.06 %, 24.66 %, 28.13 % and 32.47 %, respectively. When the concentration of AA-P was 10 μg/mL, The proliferation efficiency of B cells increased by 32.47 % (AA-P: 10 μg/mL), and was higher than positive control group (LPS was 5 μg/mL, 30.86 %) (
Figure 6A). The B cell proliferation rate were 37.35% and 35.38%, respectively, when the final concentration of LPS and HO-P were both 5 μg/mL. When the concentration of HO-P is 2.5 μg/mL, the B cell proliferation efficiency reached the maximum by 48.61% (
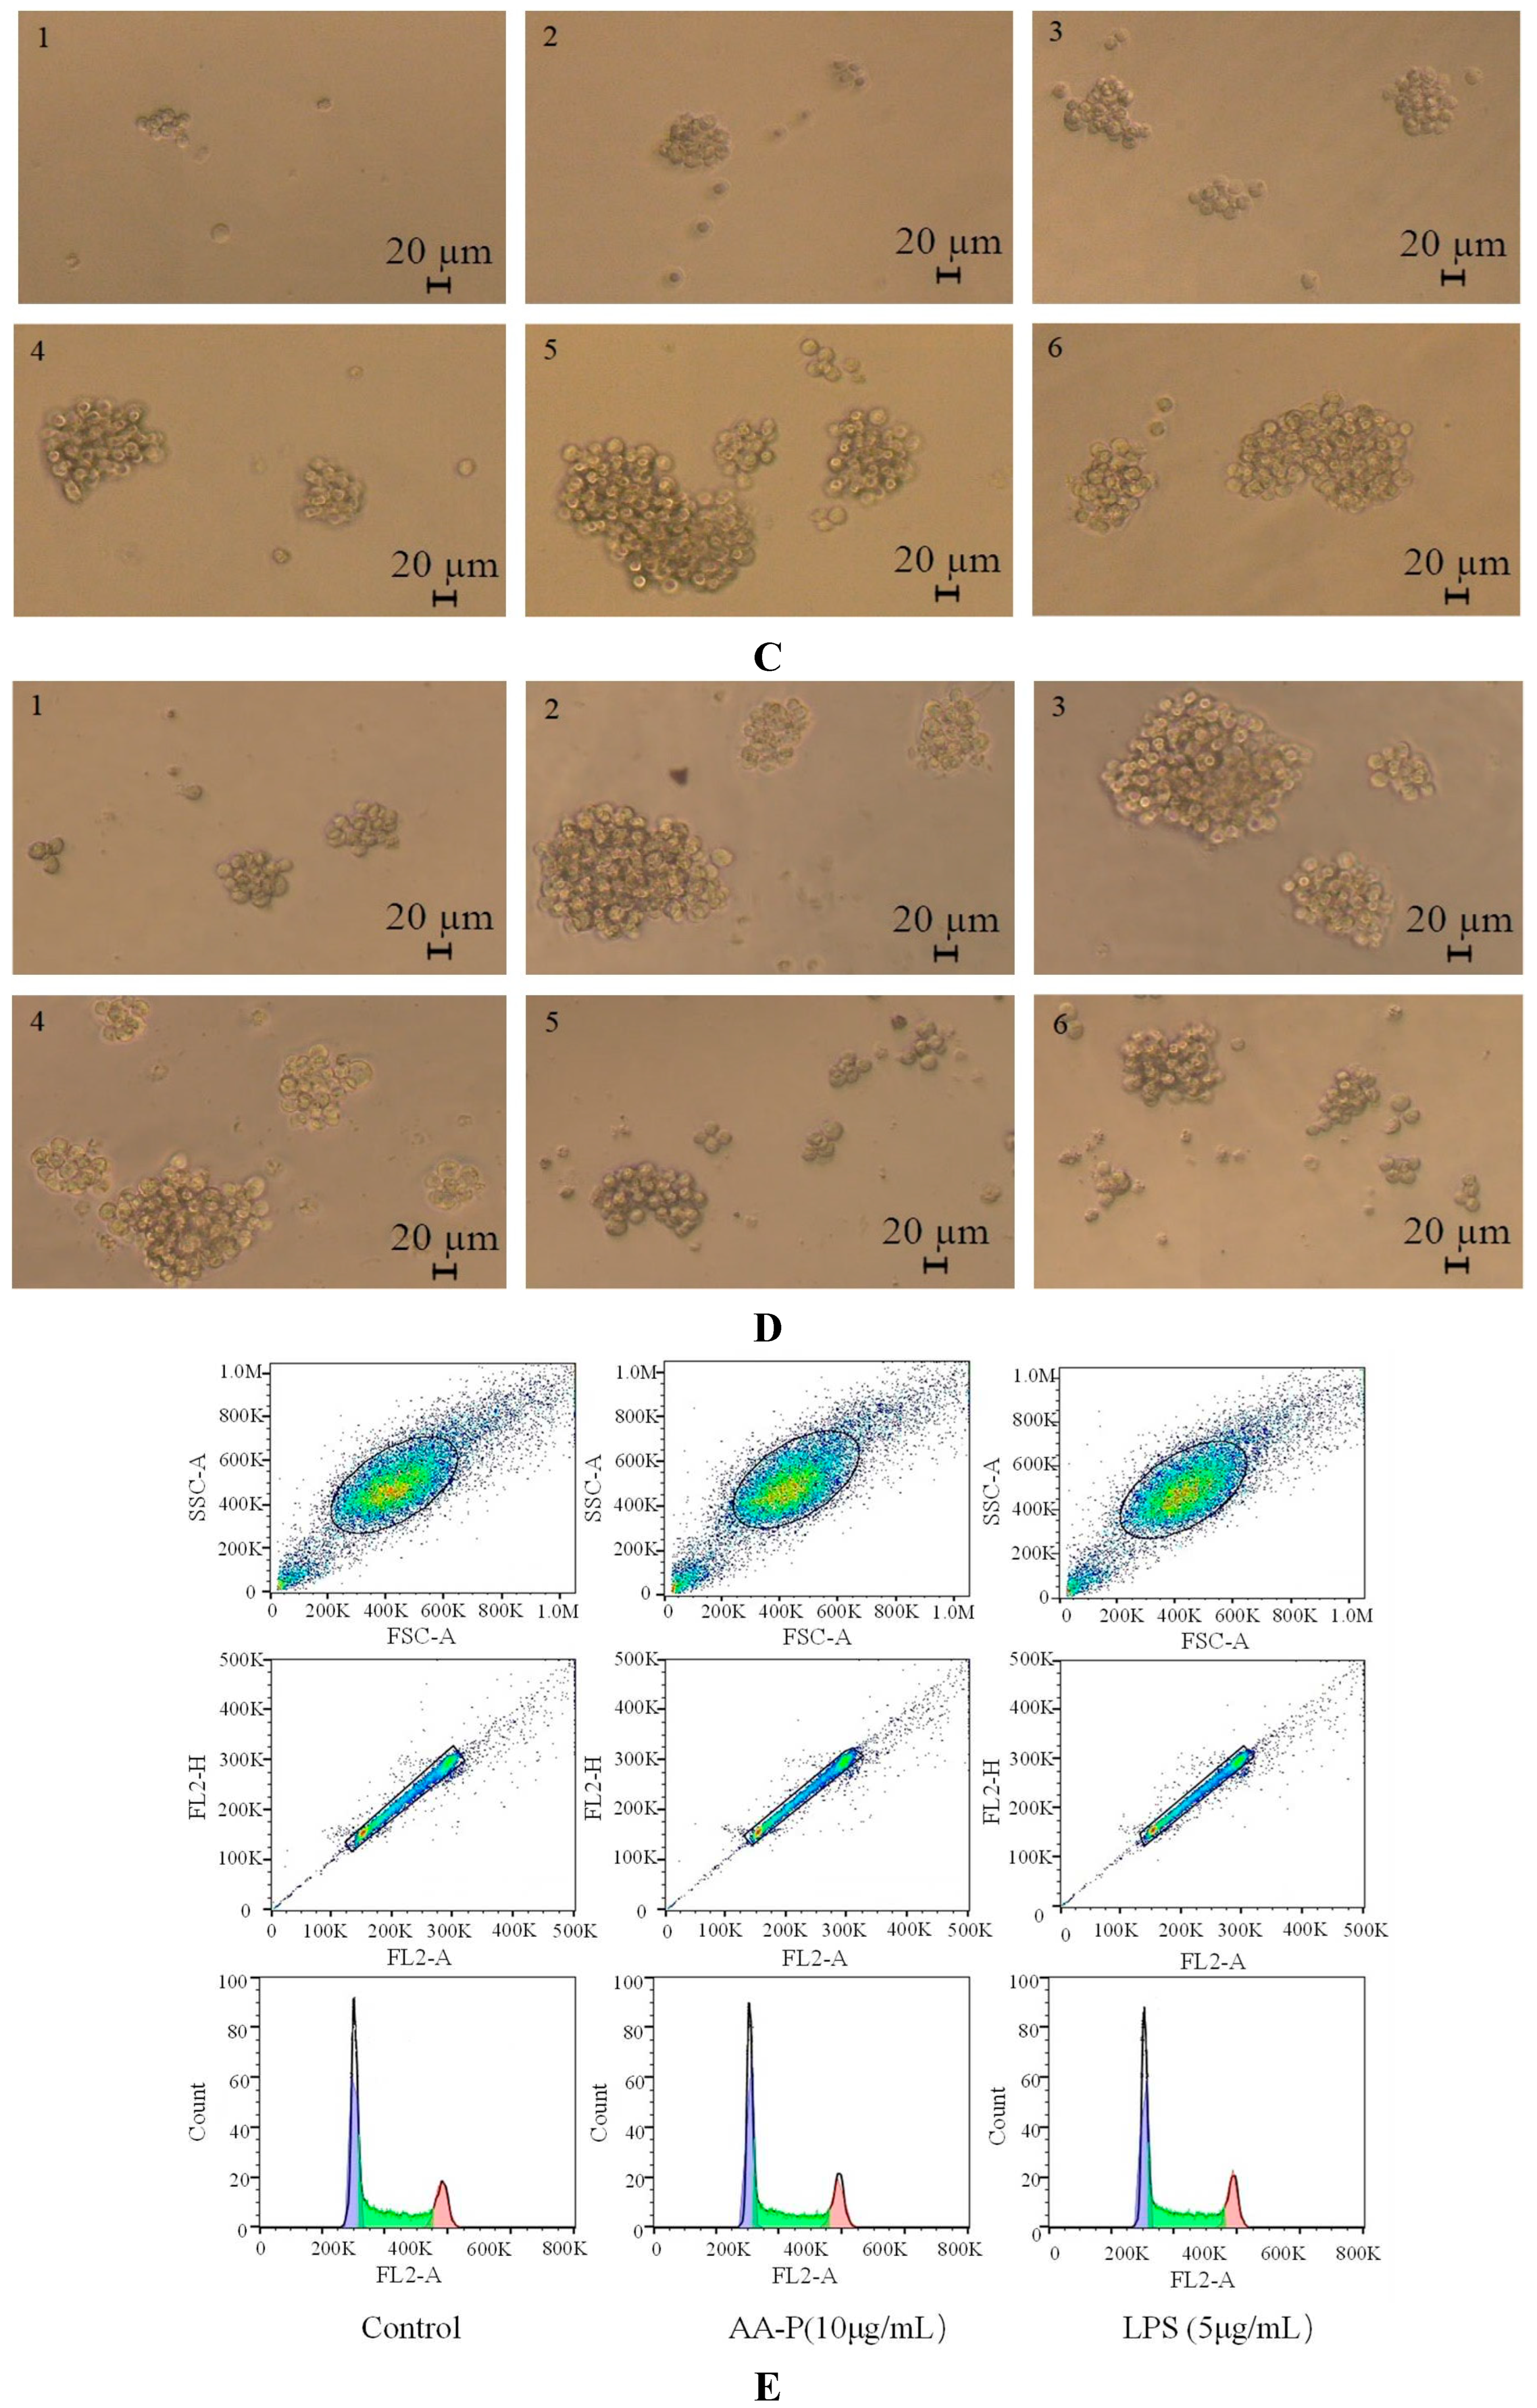
Figure 6B). The results also showed that the B cells morphological changed in AA-P and HO-P group(
Figure 6C,D).
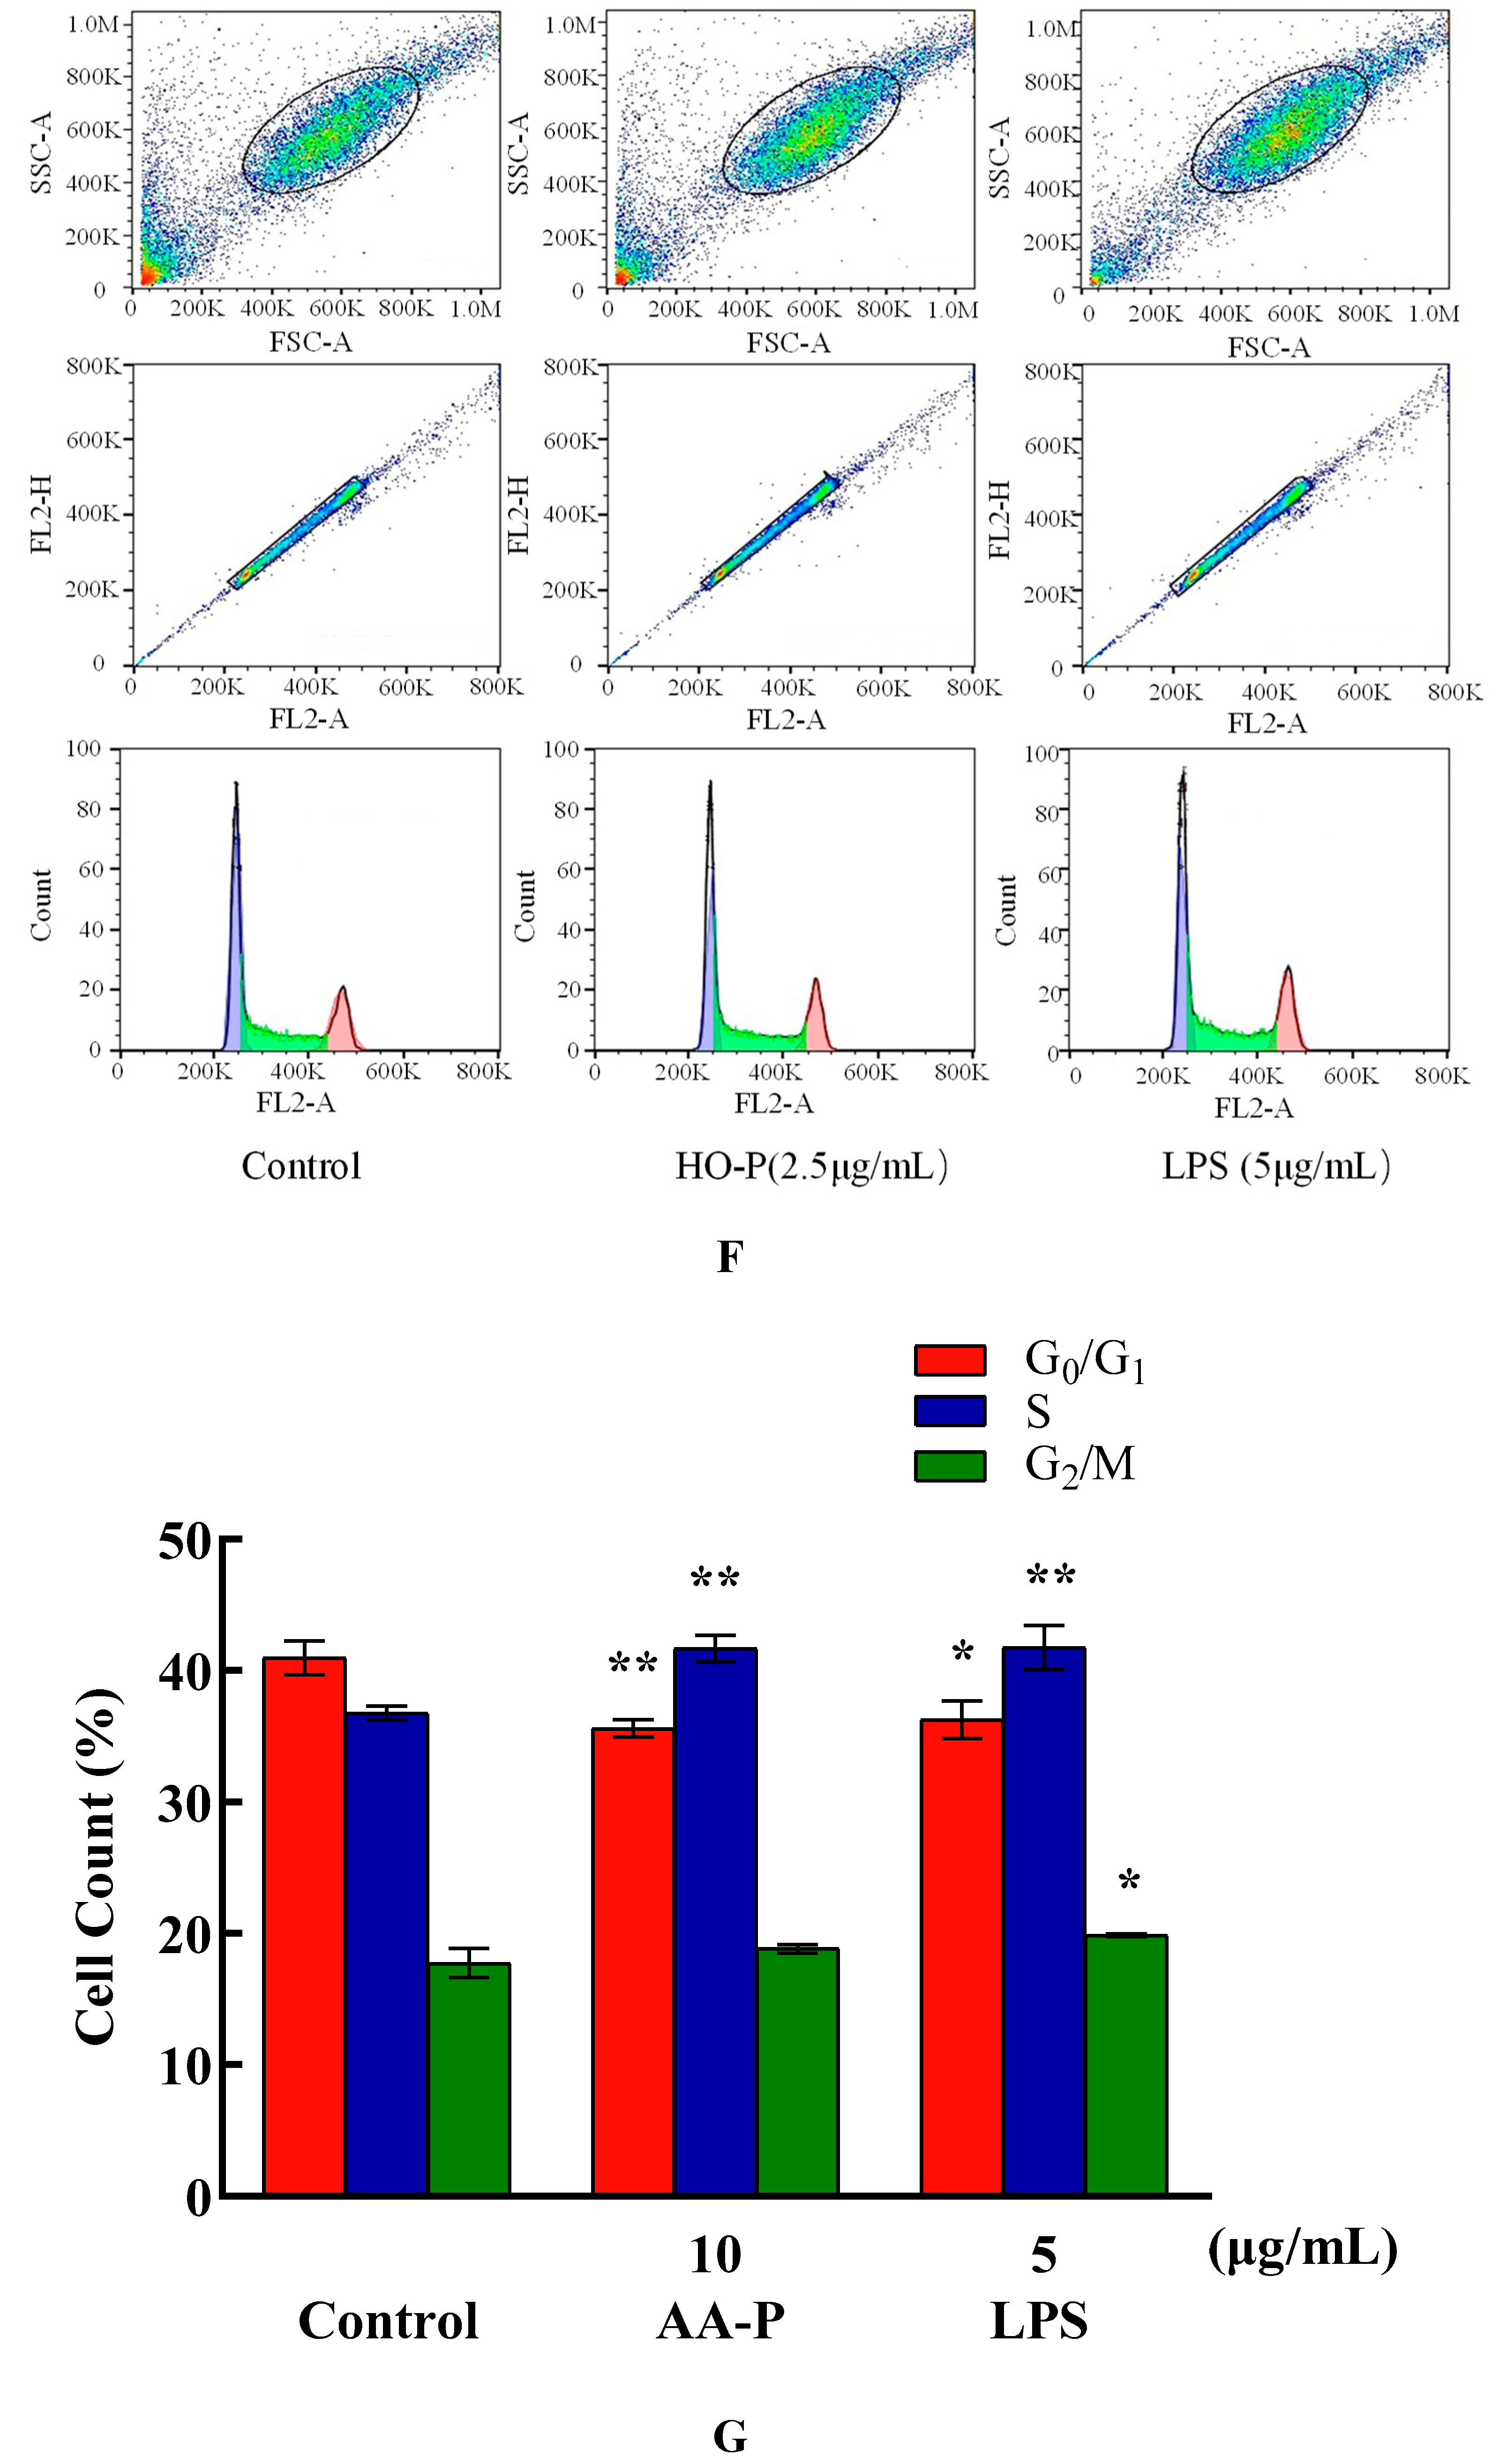
Compared with blank group (cell number in G
0/G
1 phase: 40.97 %), the percentage of cells number of G
0/G
1 phase in AA-P group and positive group both reduced (
P < 0.01), which were 35.60 % and 36.27 %, respectively. Meanwhile, compared with blank group of cell number in S phase (36.77 %), the cell number percentage in S phase of AA-P group and positive group increased to 41.67 % and 41.47 %, respectively (
P < 0.01). However, AA-P had little impact on G2/M phase of B cells. These results indicated AA-P could promote B cells entering S phase from the G0/G1 phase. Compared with blank group of cell number in G
0/G
1 phase (40.43 %), the cells number percentage of G
0/G
1 phase in HO-P group and positive group both significantly reduced (
P < 0.01), which were 35.30 % and 36.77 %, respectively. Meanwhile, compared with blank group of cell number in G
2/M phase (19.07 %), cell number percentage in G
2/M phase of AA-P group and positive group increased to 20.70 % and 22.33 %, respectively (
P < 0.01). And compared with blank group of cell number in S phase (35.00 %), cell number percentage in S phase of HO-P group increased to 38.07 % (
P < 0.01). These results indicated HO-P could promote B cells entering S phase and G
2/M phase from the G0/G1 phase (
Figure 6E–H).
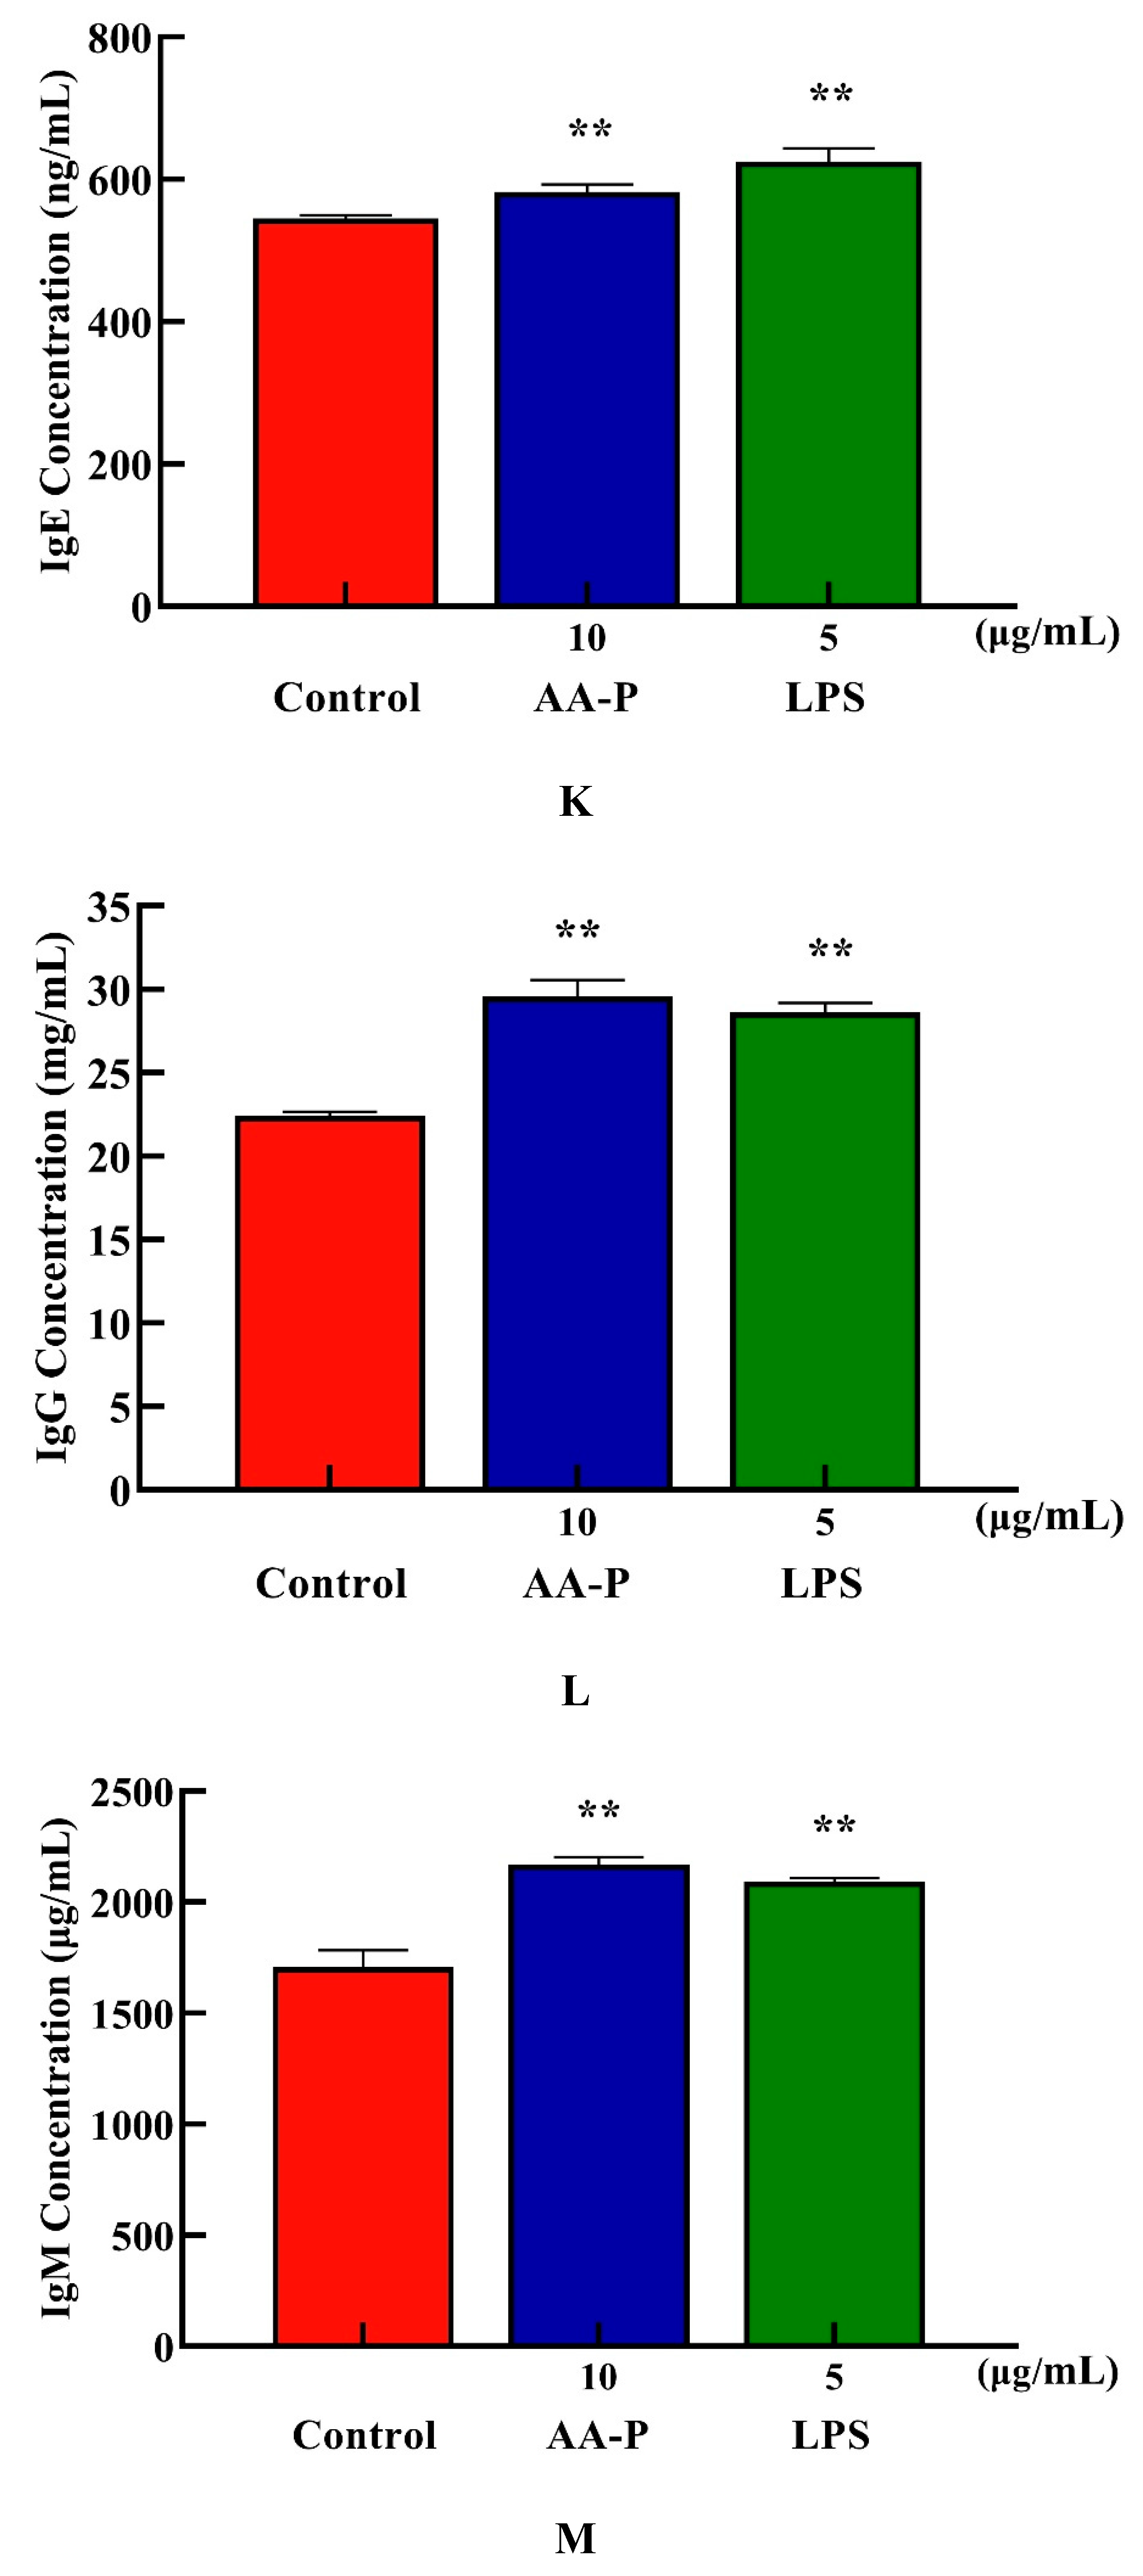
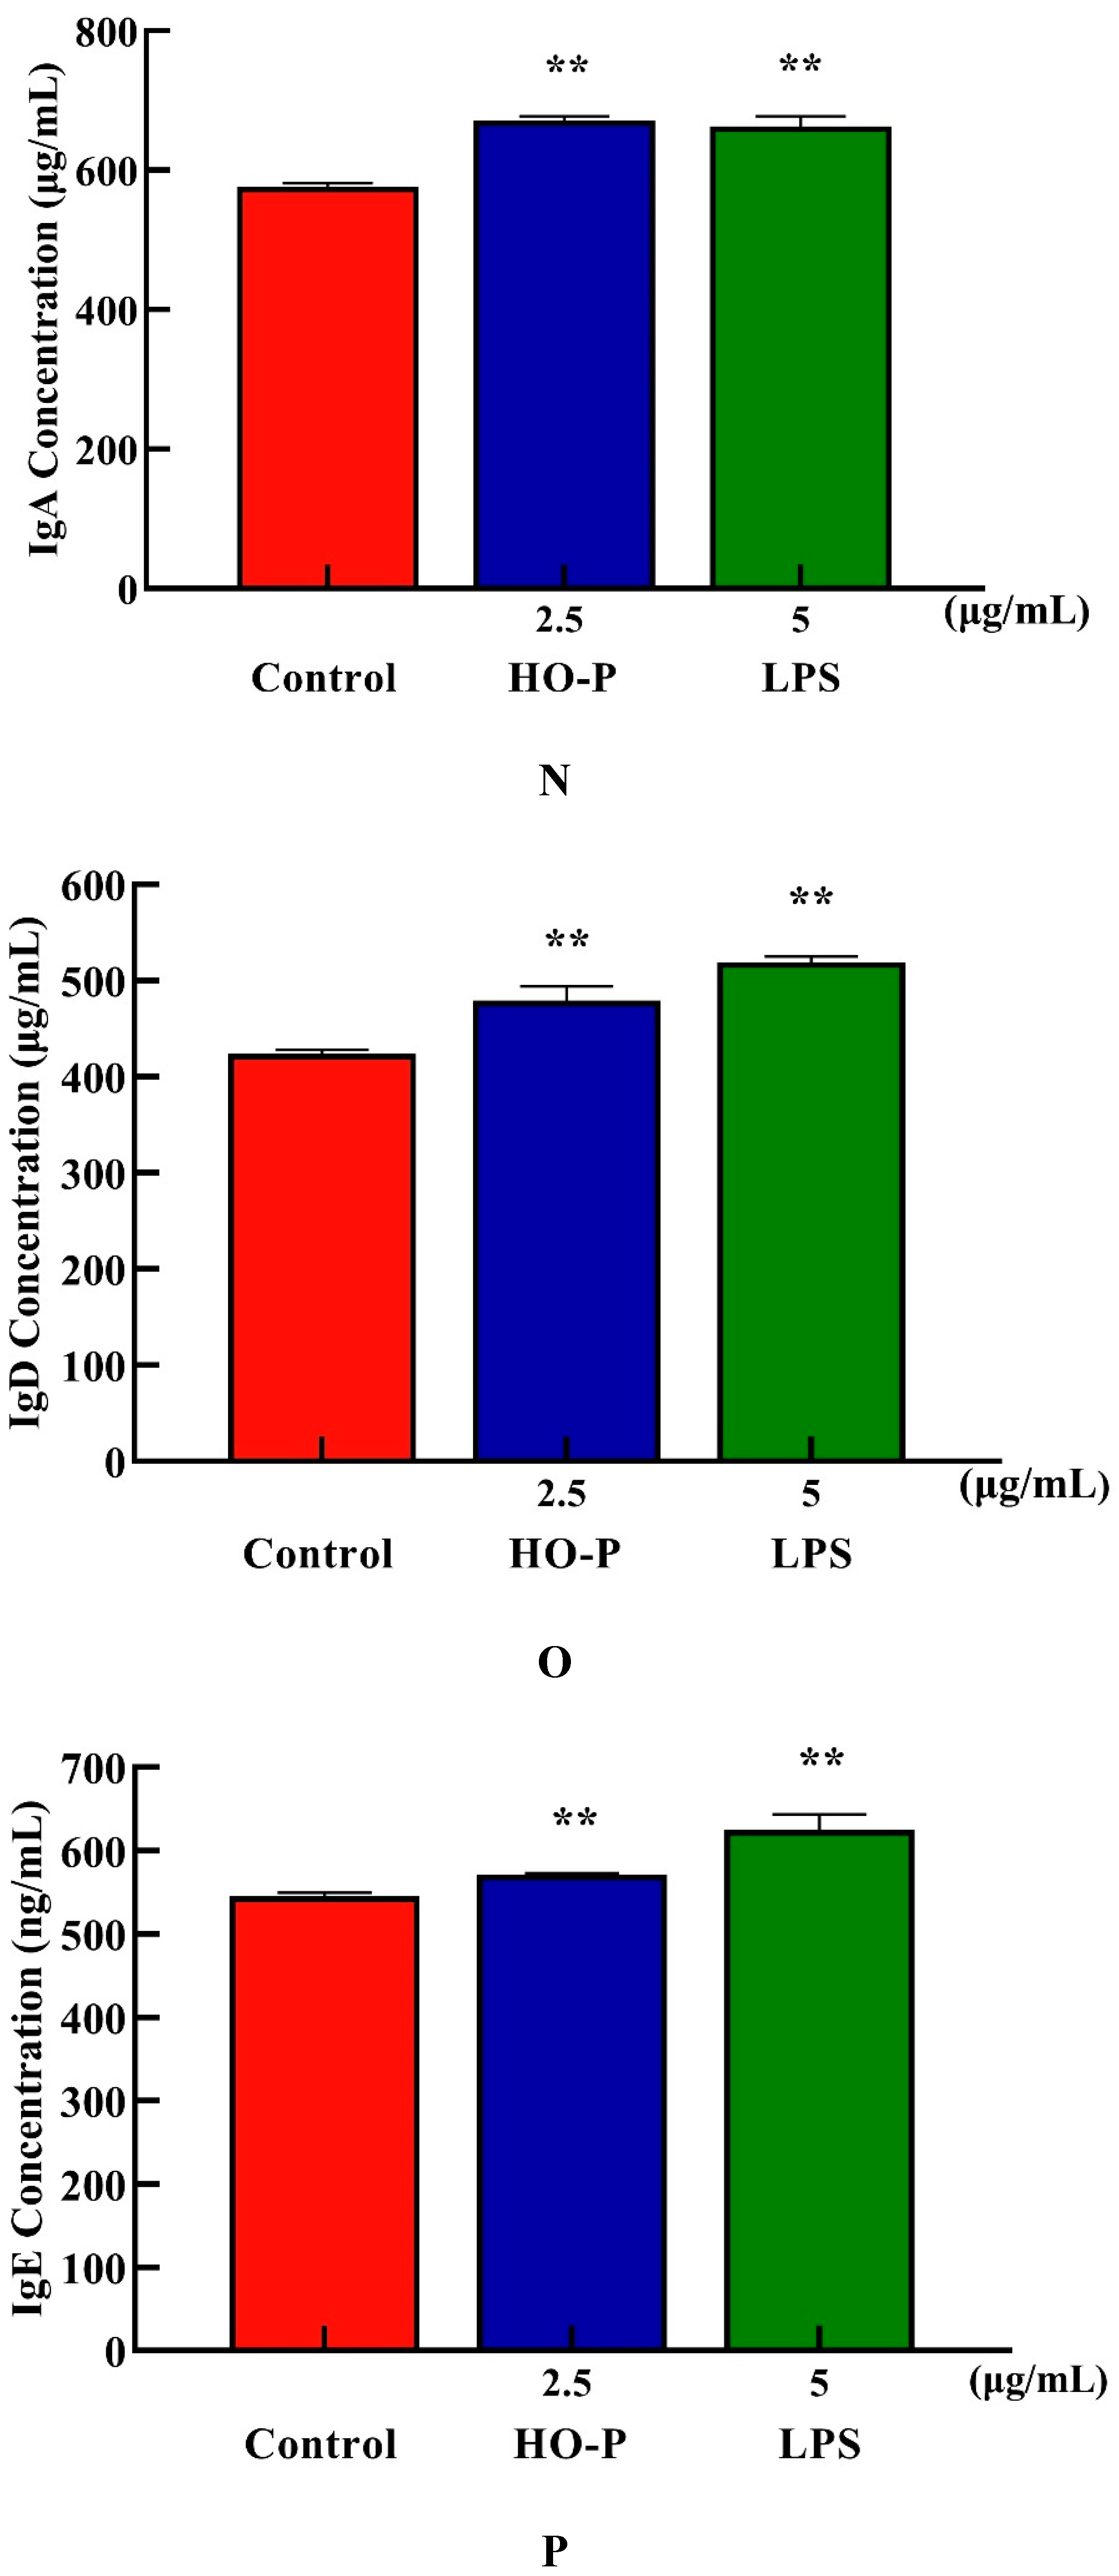
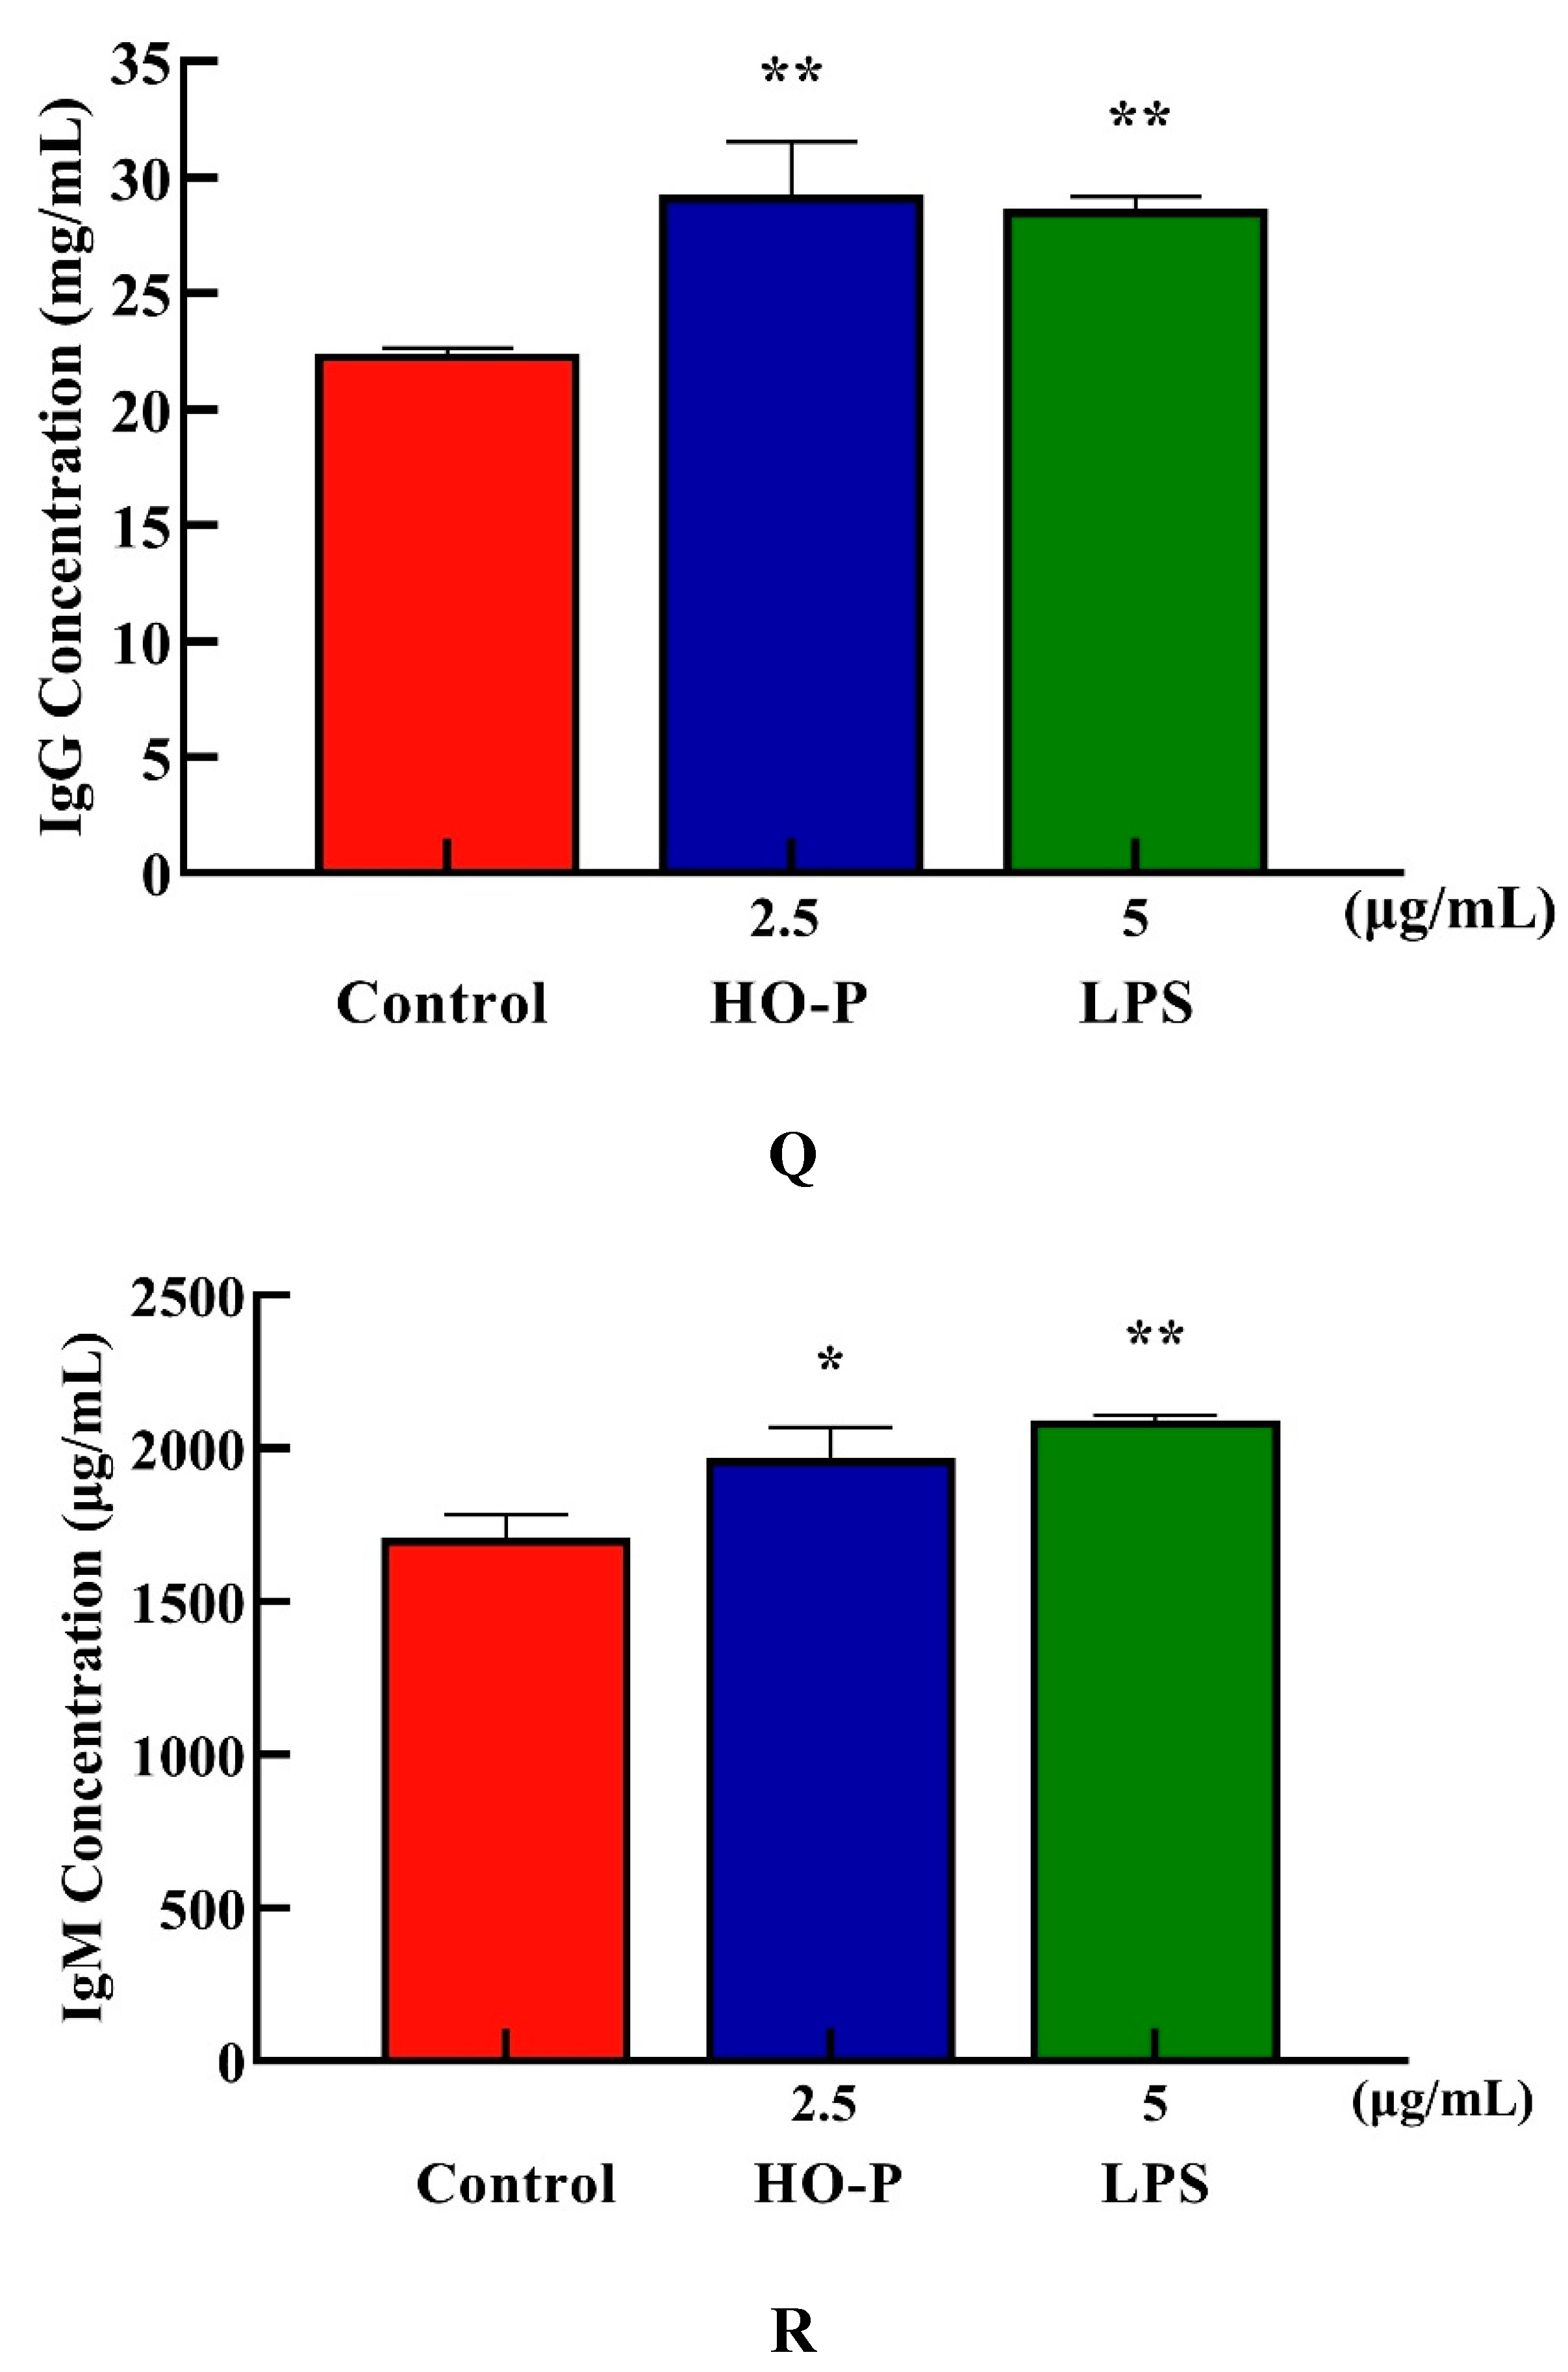
Both AA-P and positive groups could promote the secretion of IgA, IgD, IgE, IgG and IgM from B cells(
P < 0.01) , with secretion amounts were 694.39 μg/mL, 477.68 μg/mL, 582.66 ng/mL, 29.57 mg/mL and 2169.18 μg/mL, respectively (
Figure 4I–M), and both HO-P and positive groups could also significantly (
P < 0.01) promote the secretion of IgA, IgD, IgE, IgG and IgM with secretion amounts were 671.81 μg/mL, 479.15 μg/mL, 571.11 ng/mL, 29.23 mg/mL and 1966.69 μg/mL, respectively, and the amount of IgA, IgM and IgG in AA-P was higher than positive group (
Figure 6N–R).
3.13. Effect of AA-P and HO-P on RAW264.7 Cells Activity In Vitro
Macrophages are cells differentiated from monocytes. They can participate both in the specific and the non-specific immunity of the body [
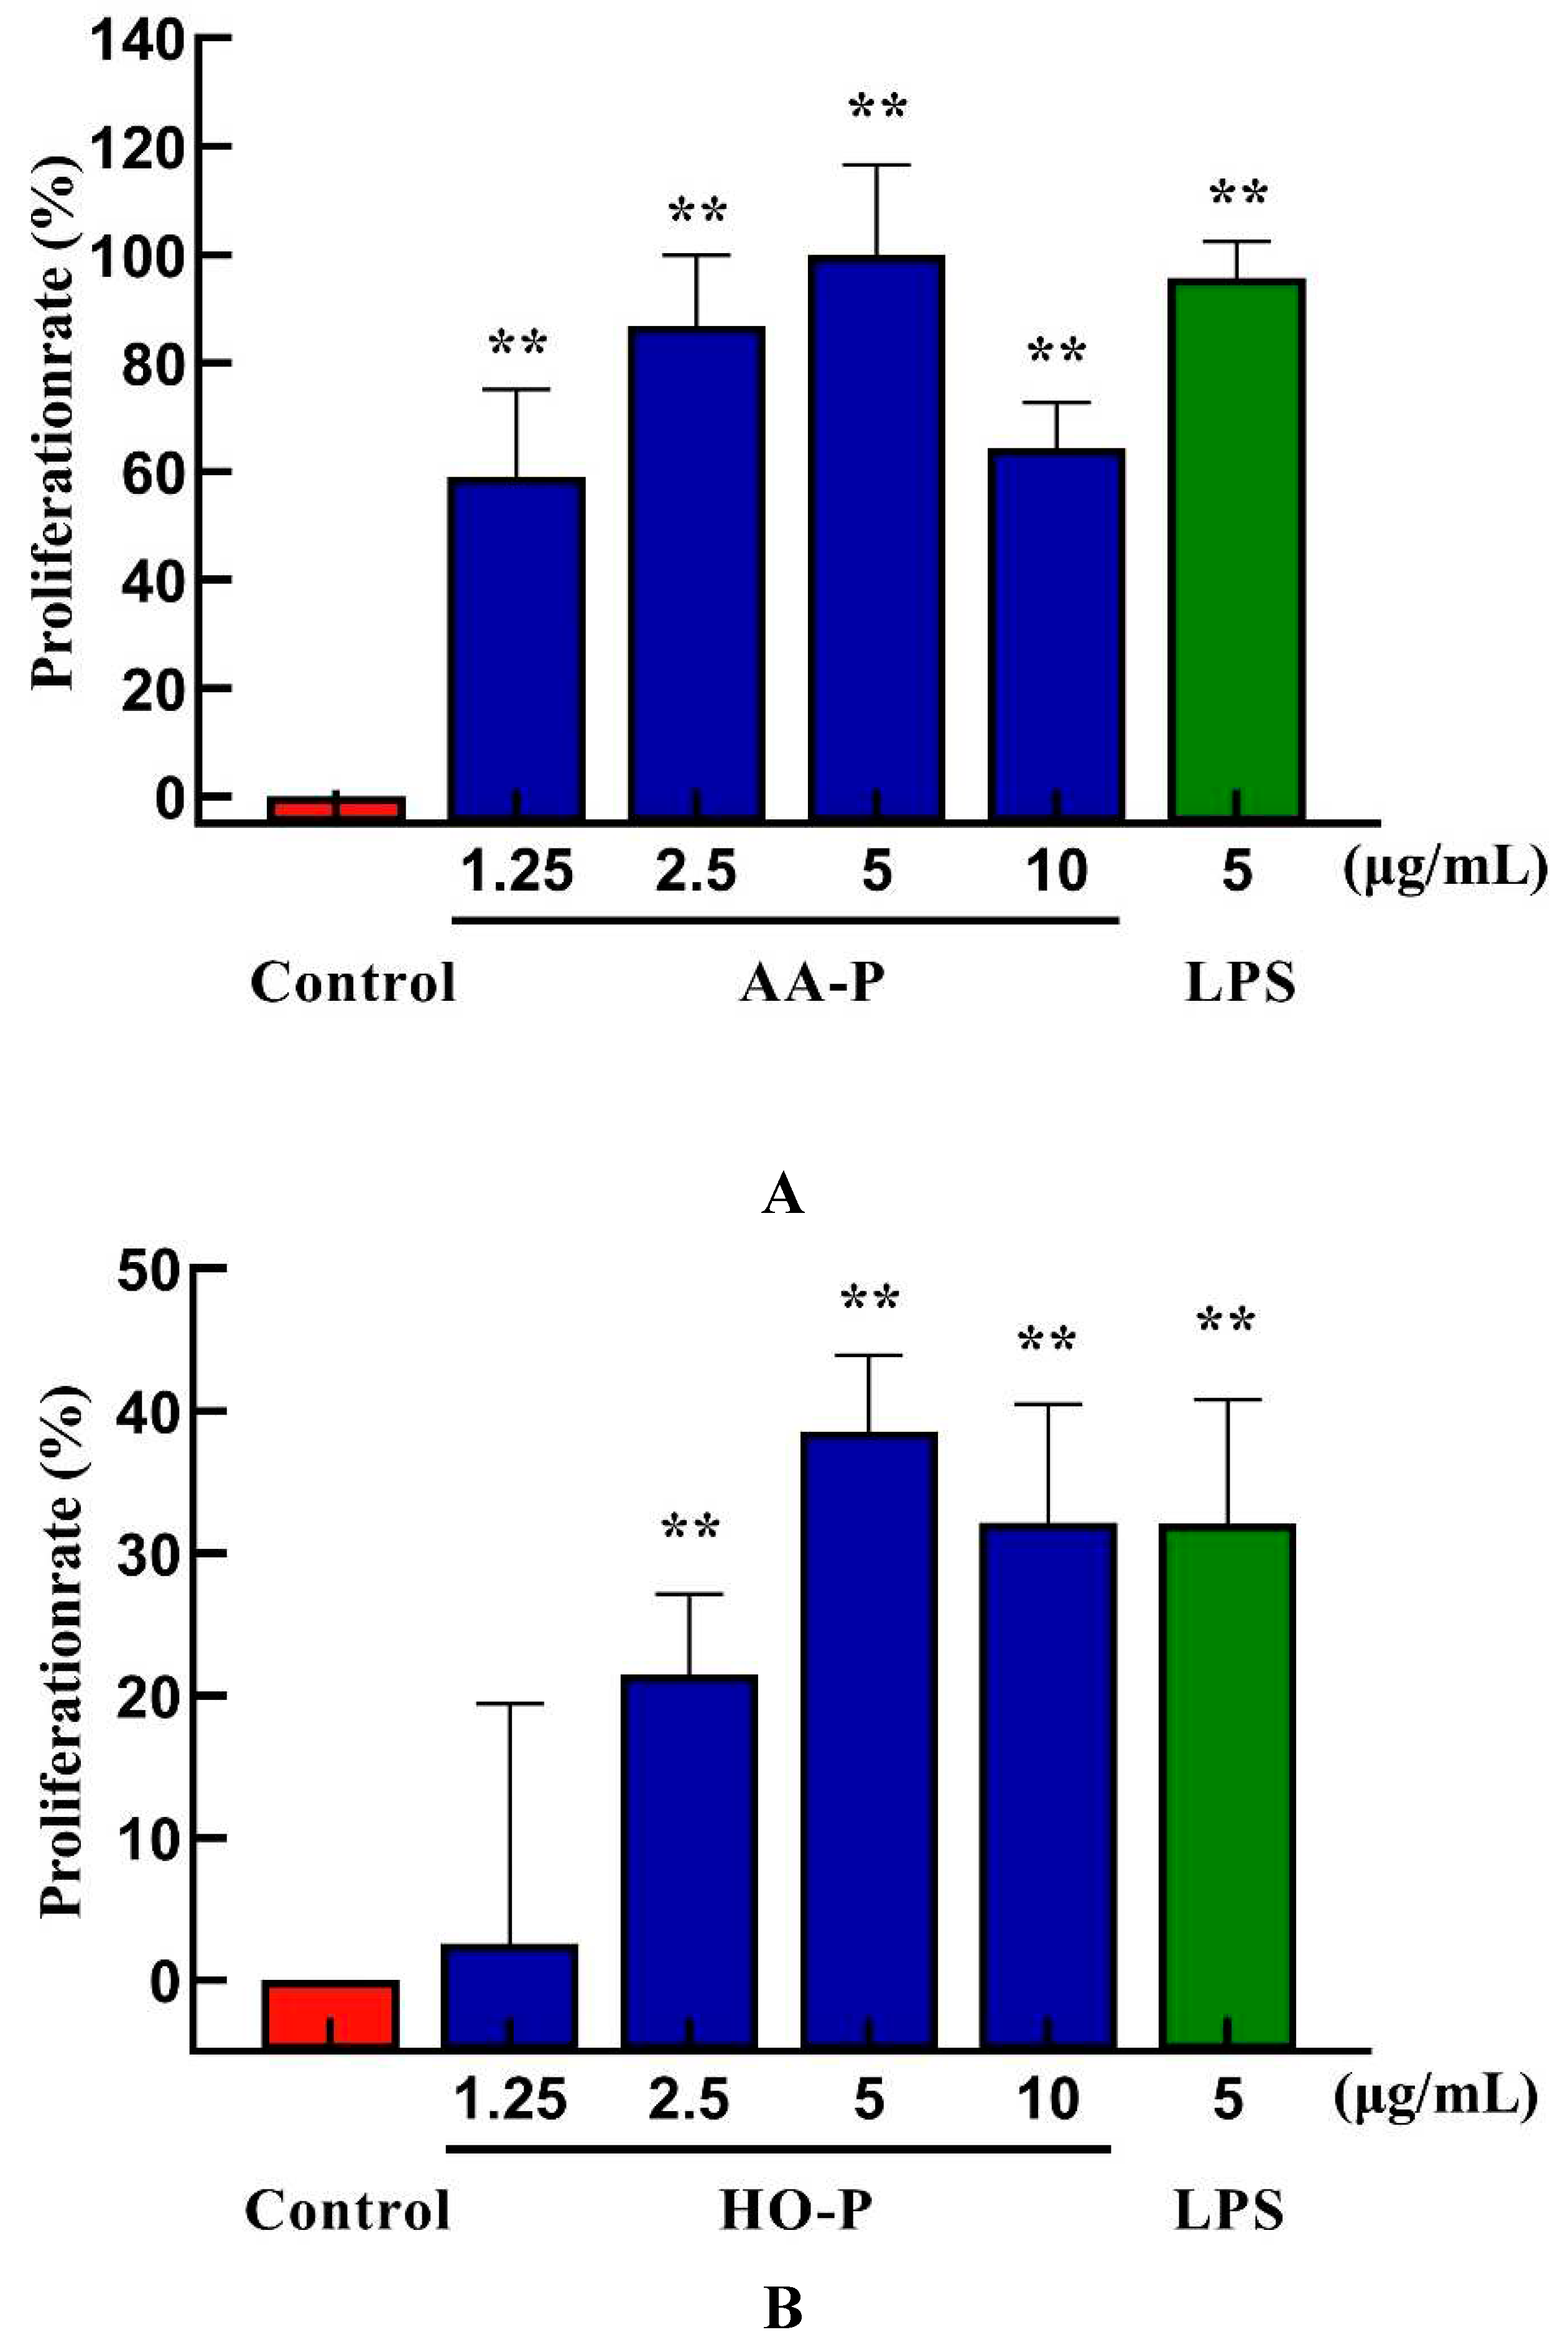
25]. AA-P (5 μg/mL) could promote RAW264.7 cells proliferation (
P < 0.01)(the maximum proliferation rate: 99.90 %) and it was higher than in positive group (
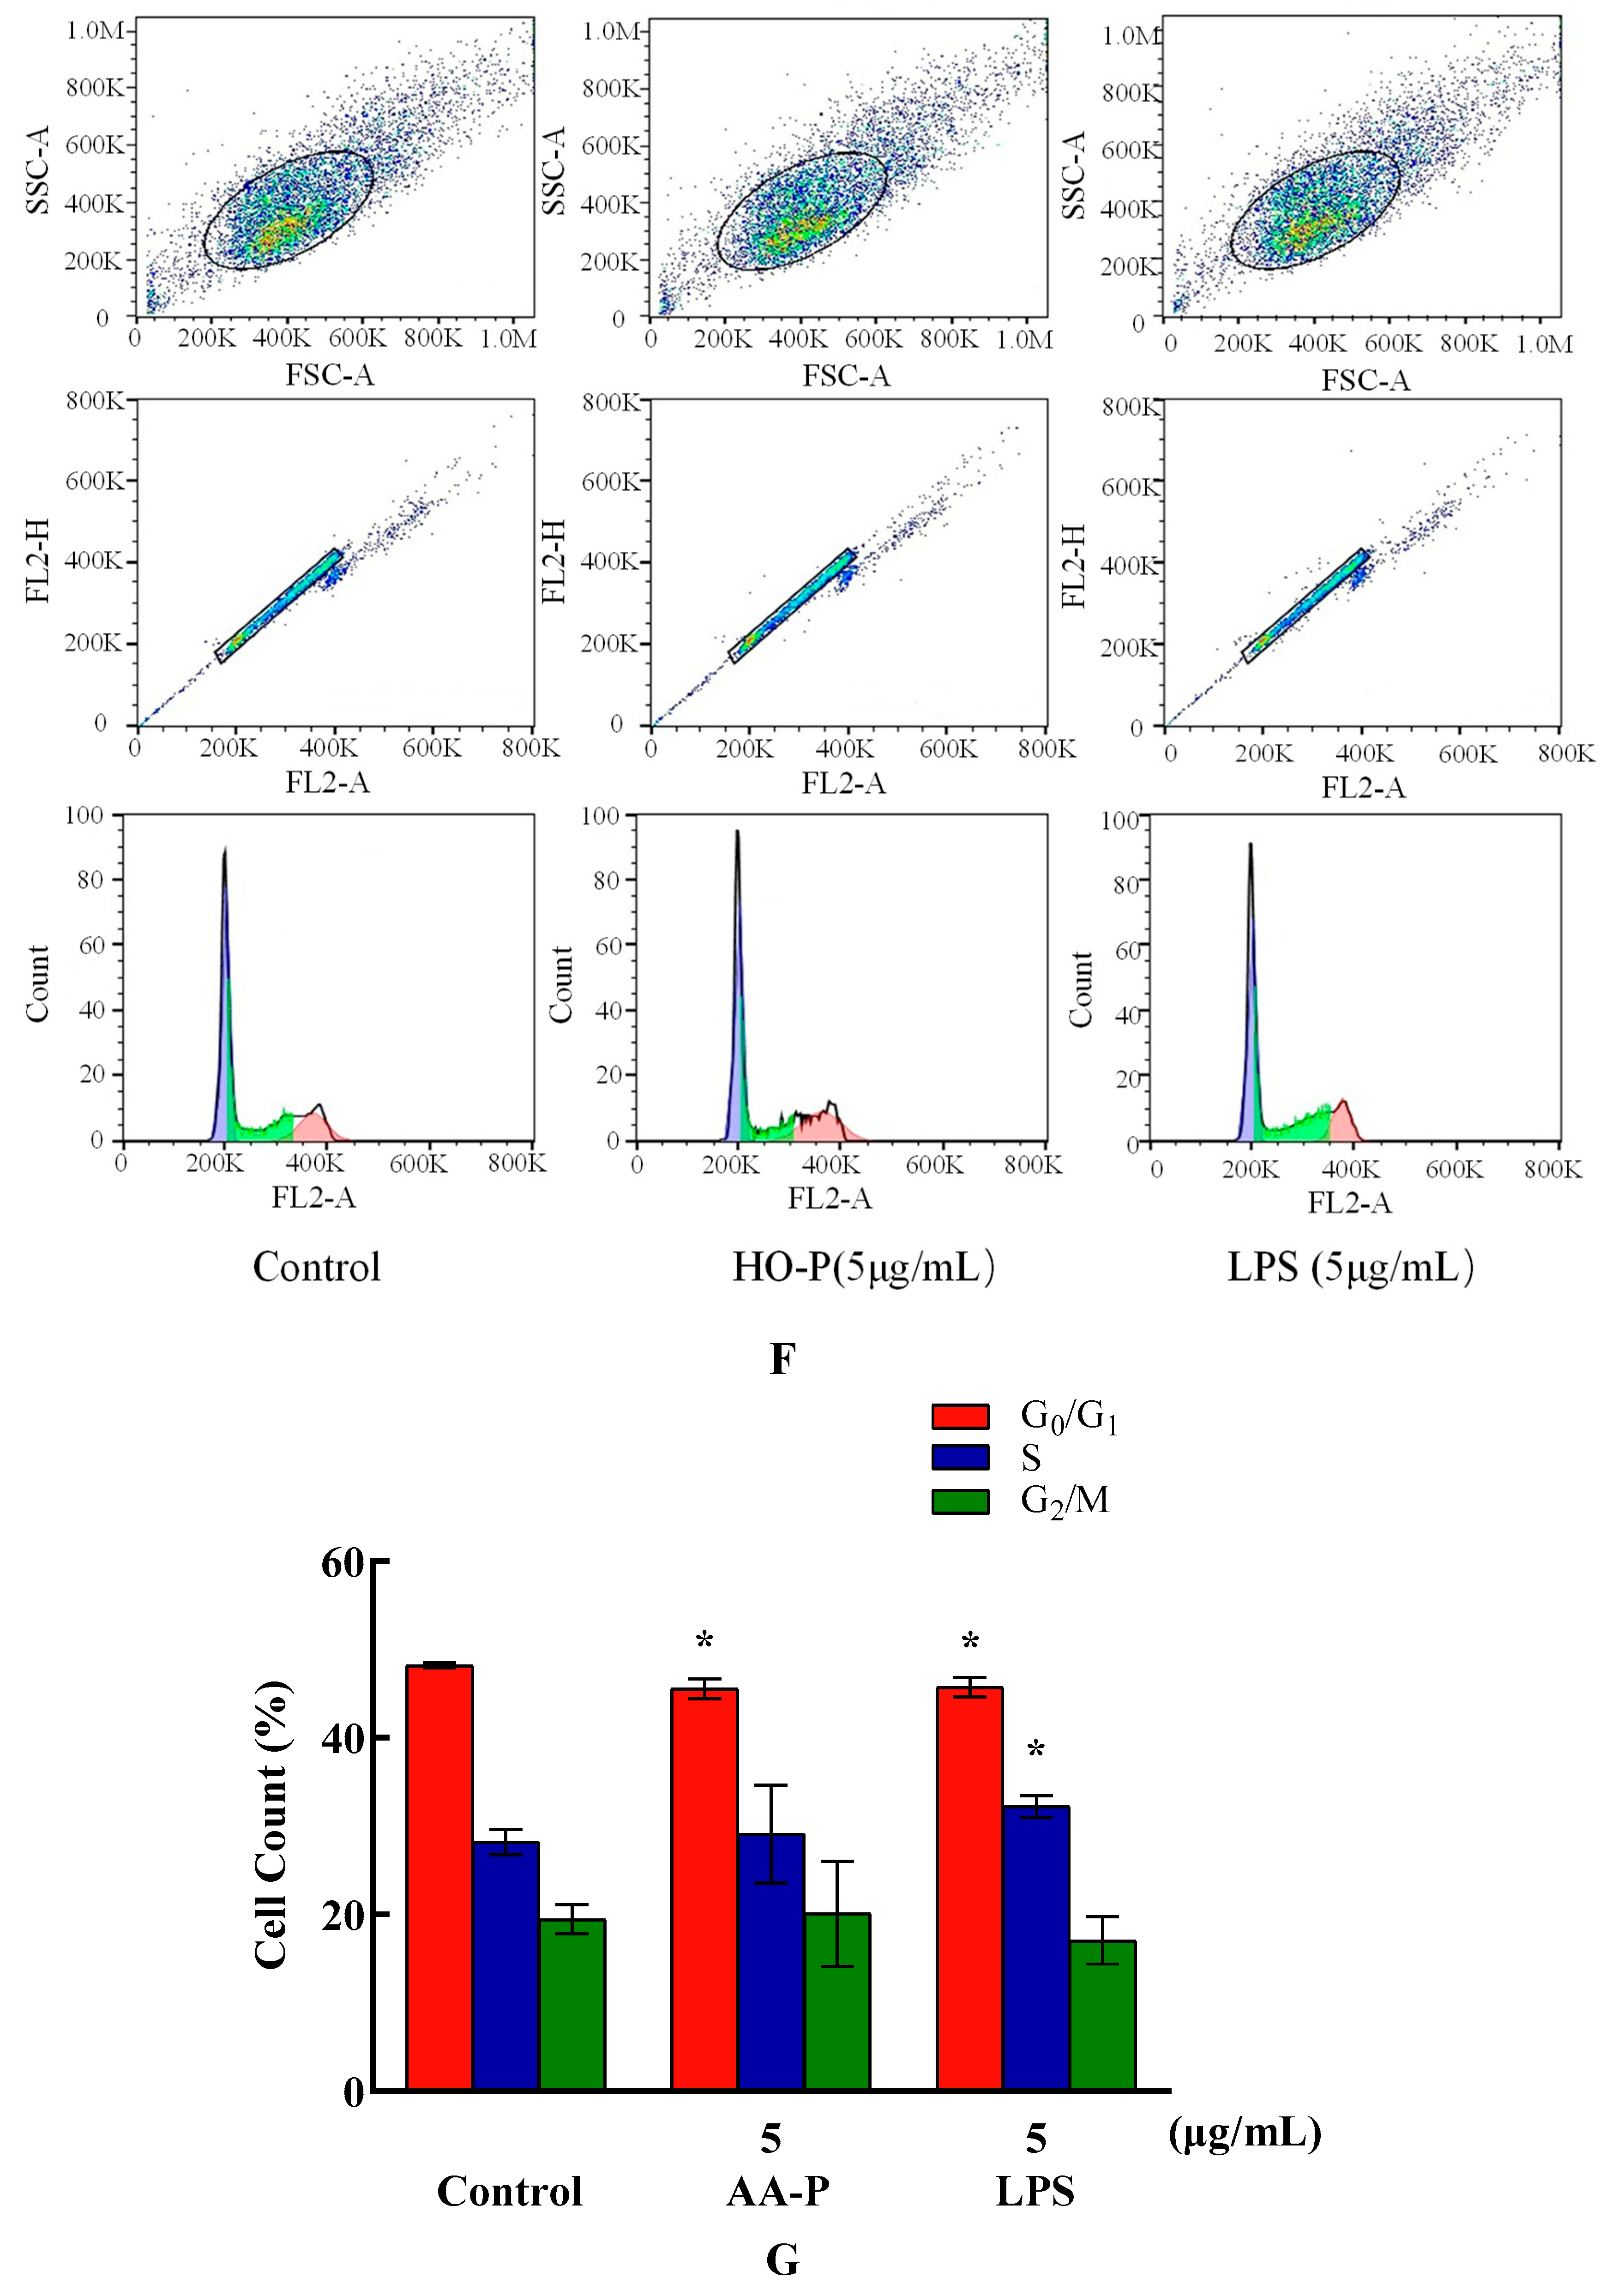
Figure 7A). Compared with the blank group, when the final concentration of HO-P were 2.5, 5, 10 μg/mL, the proliferation rate of RAW264.7 cells were also increased (P<0.01) (the proliferation rate were 21.45%, 38.59% and 32.14% respectively). When both the concentration of LPS and HO-P were 5 μg/mL, the proliferation efficiency were 38.59% and 32.09%, respectively (
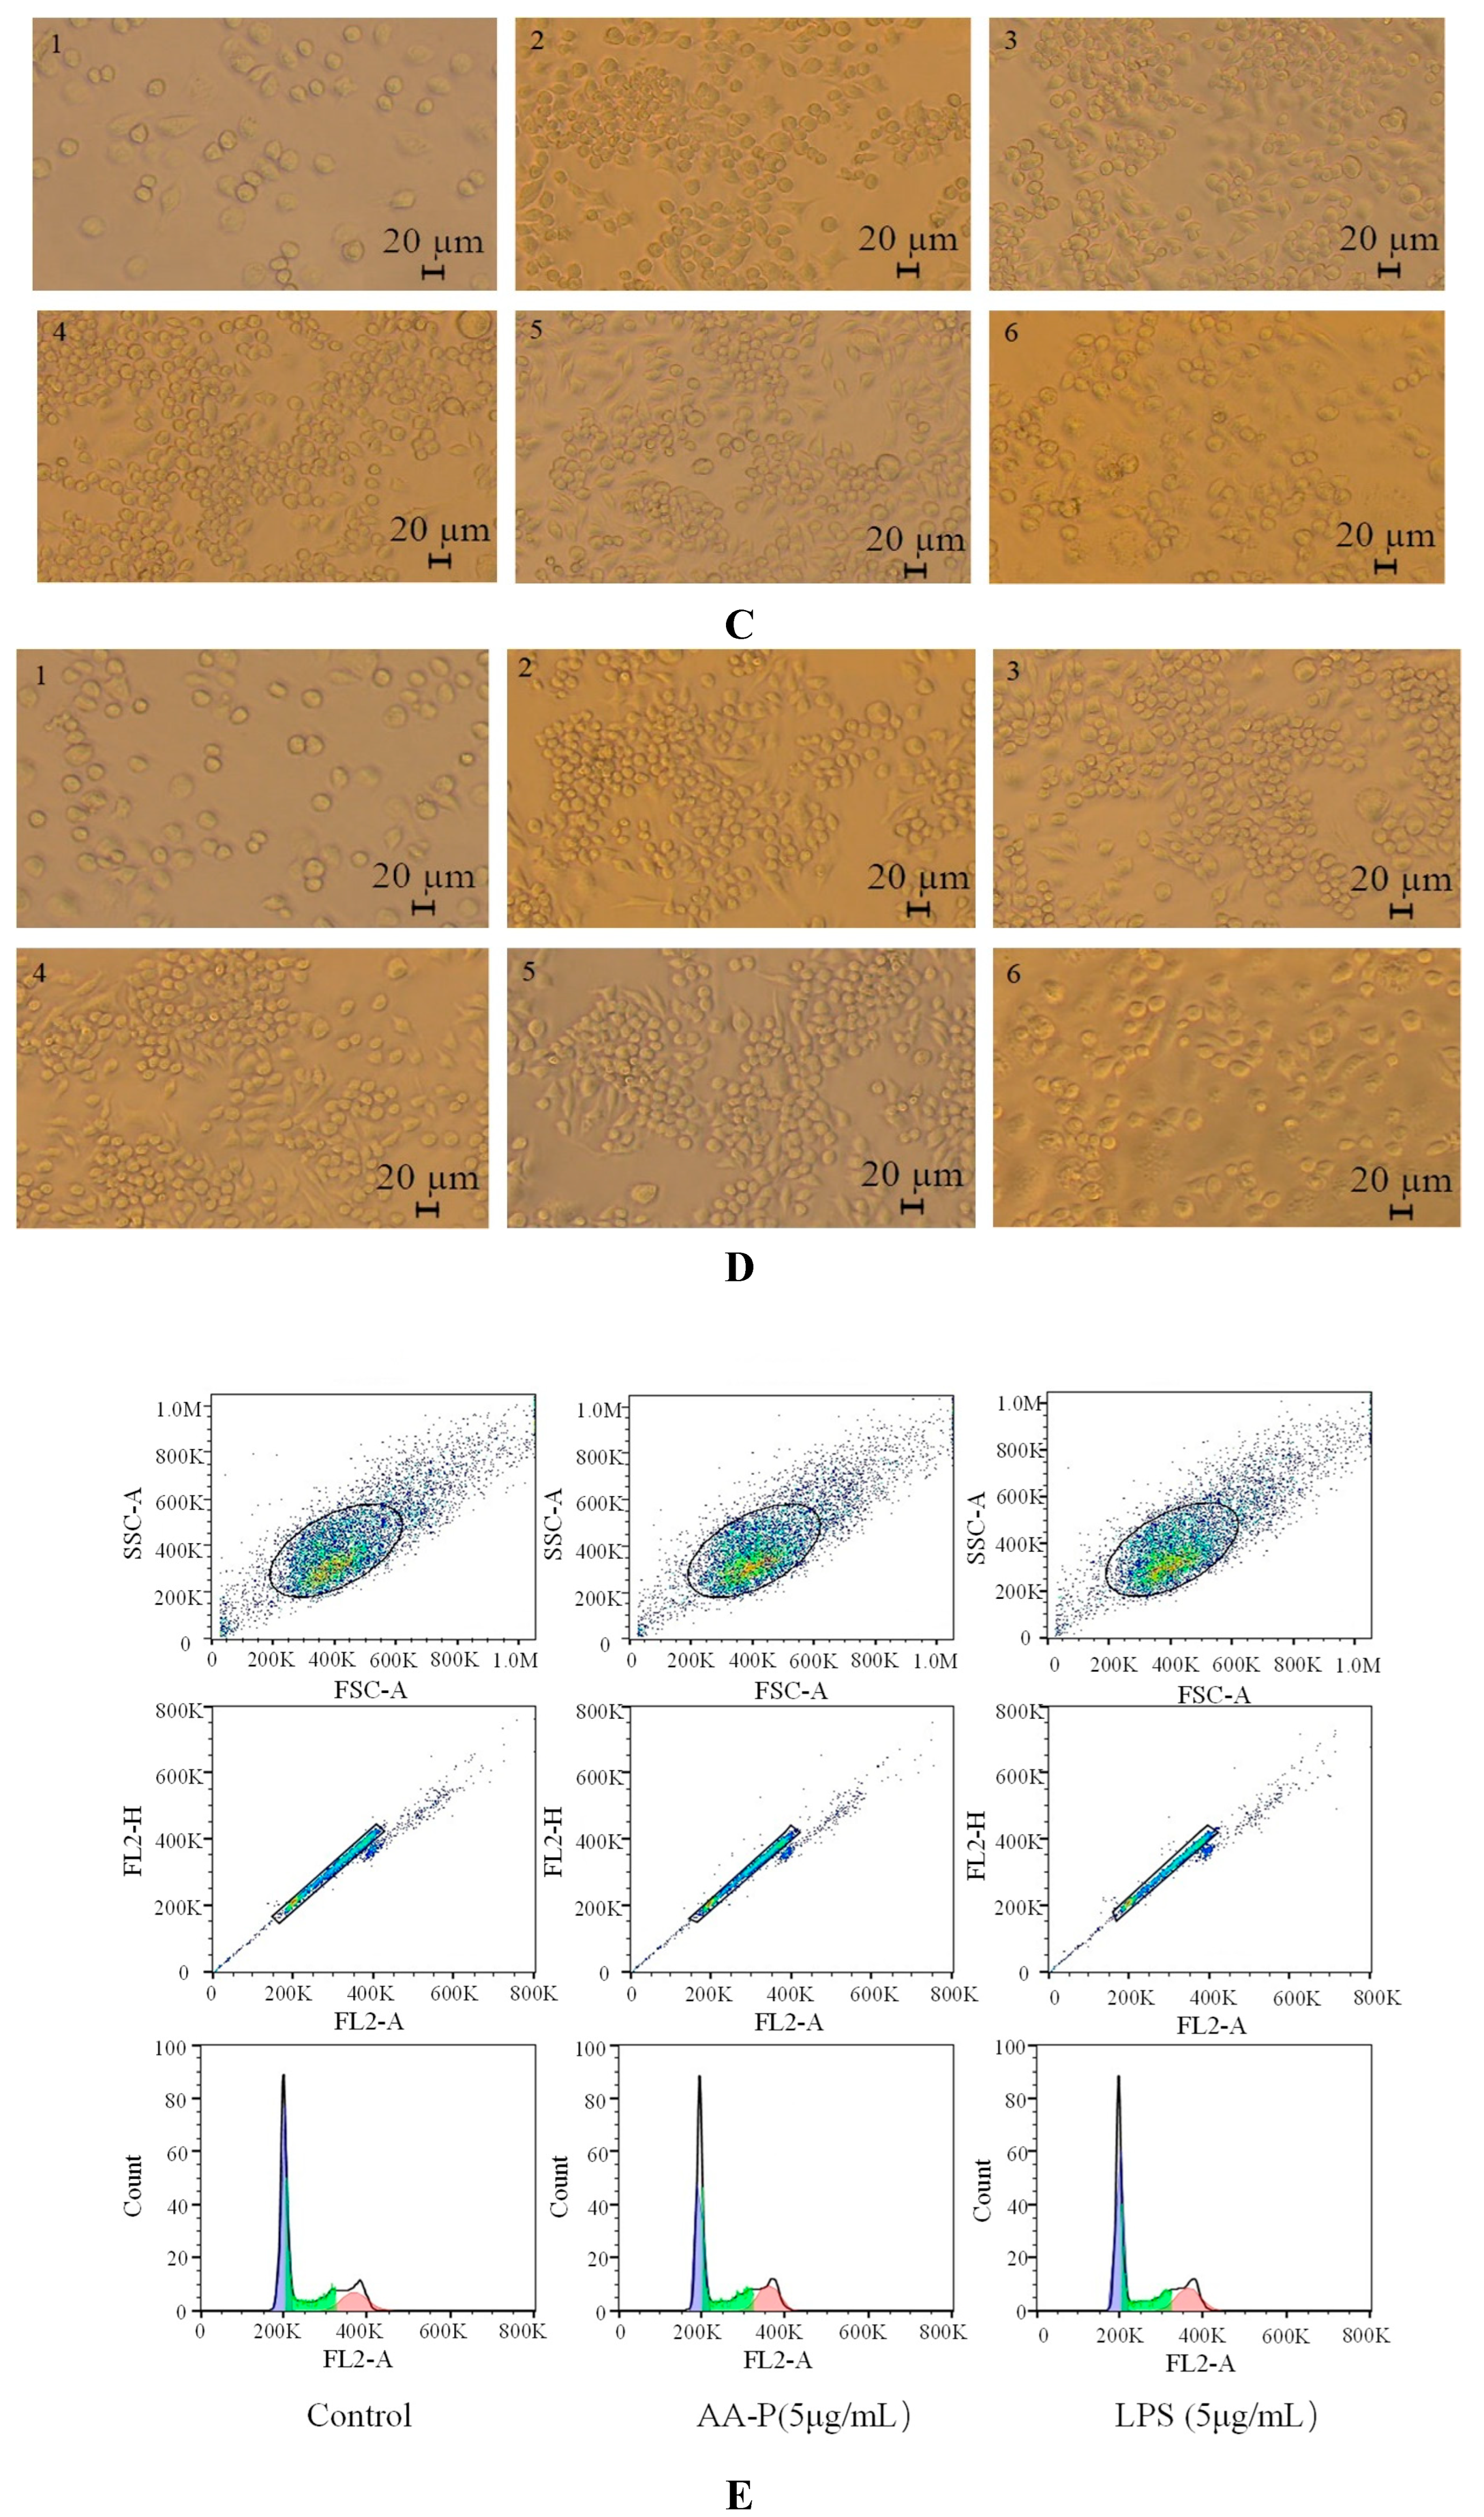
Figure 7B). Morphological changes of RAW264.7 cells under AA-P and HO-P stimulation showed the number of RAW264.7 cells in polysaccharide group and LPS group increased and the cell space became smaller (
Figure 7C,D).
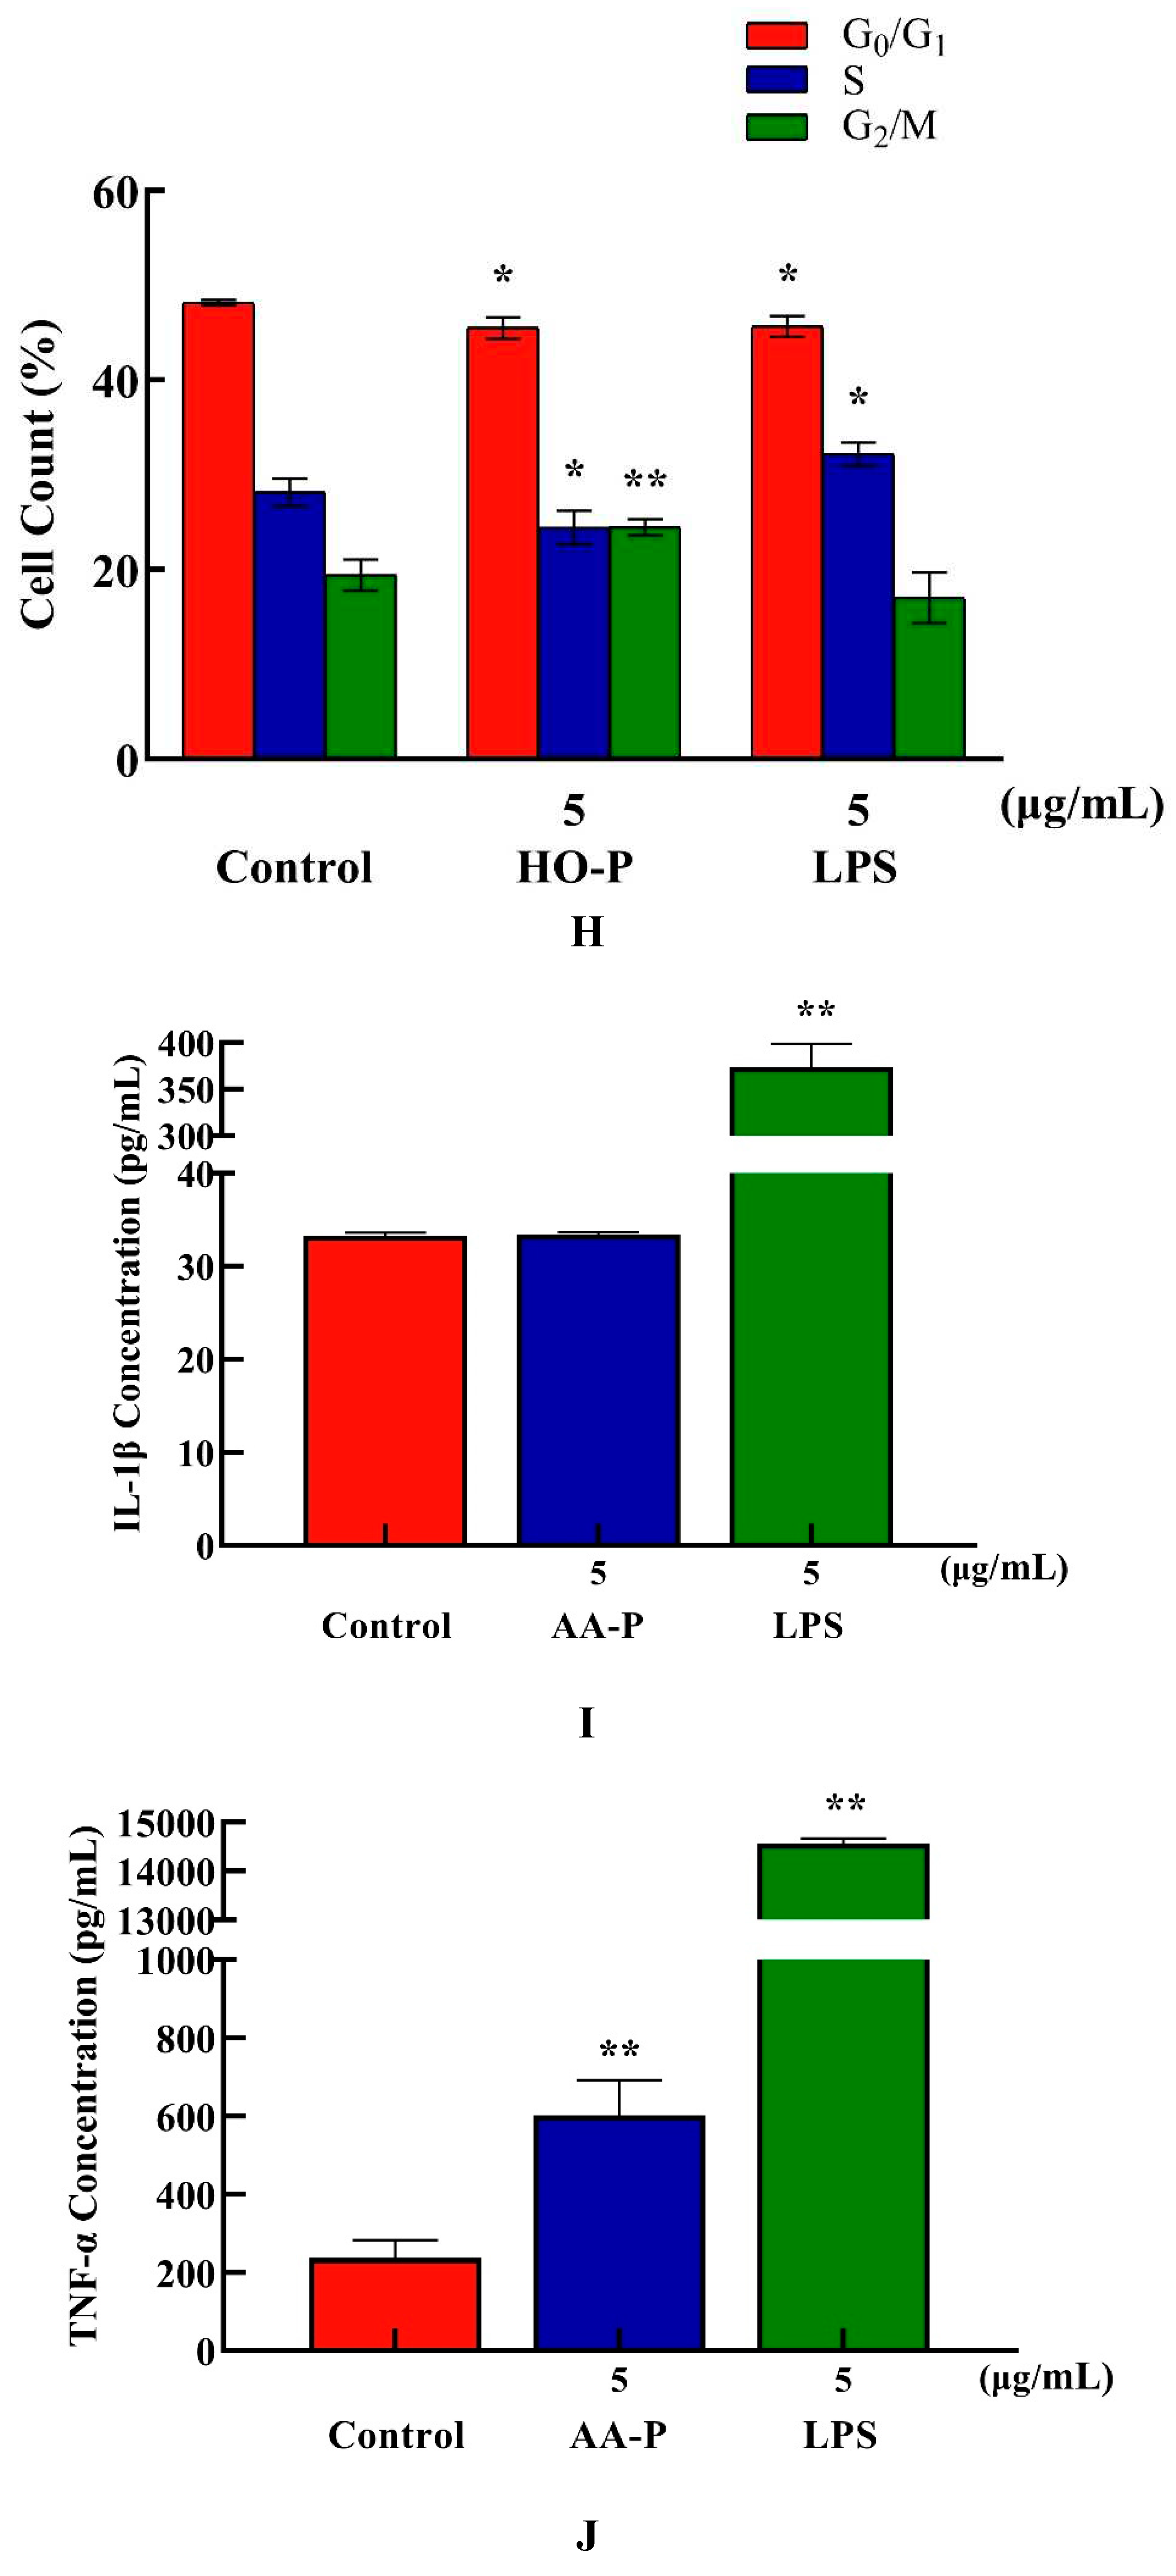
Compared with blank group cell number in G
0/G
1 phase (48.17%), the cells number percentage of G
0/G
1 phase in AA-P group and positive group both significantly reduced (
P < 0.01), which were 45.50 % and 45.67 %, respectively. AA-P had no significant effect on the G2/M phase and S phase of RAW264.7 cells. These results indicated AA-P could promote RAW264.7 cells quickly finish the G0/G1 phase in cell cycle. Compared with blank group cell number in G
0/G
1 phase (48.17 %), cells number percentage of G
0/G
1 phase in HO-P group and positive group both reduced (
P < 0.01), which were 45.50 % and 45.67 %, respectively. Meanwhile, compared with blank group of cell number in G
2/M phase (19.43 %), the cell number percentage in G
2/M phase of AA-P group increased to 24.47 % (
P < 0.01). These results indicated HO-P could promote RAW264.7 cells quickly entering G
2/M phase from the G0/G1 phase and S phase in RAW264.7 cell cycle(
Figure 7E–H).
Both AA-P (5 μg/mL) and the positive group could promote the TNF-α secretion of RAW264.7 cells (
P < 0.01) , and secretion amounts were 602.12 pg/mL and 14558.57 pg/mL, respectively, that were 2.55 and 61.55 times of blank group, respectively, but IL-1β secretion in AA-P group was not statistically significant, while the positive group could significantly promote IL-1β secretion in RAW264.7 cells, with secretion amount of 373.75 pg/mL(
P < 0.01) (
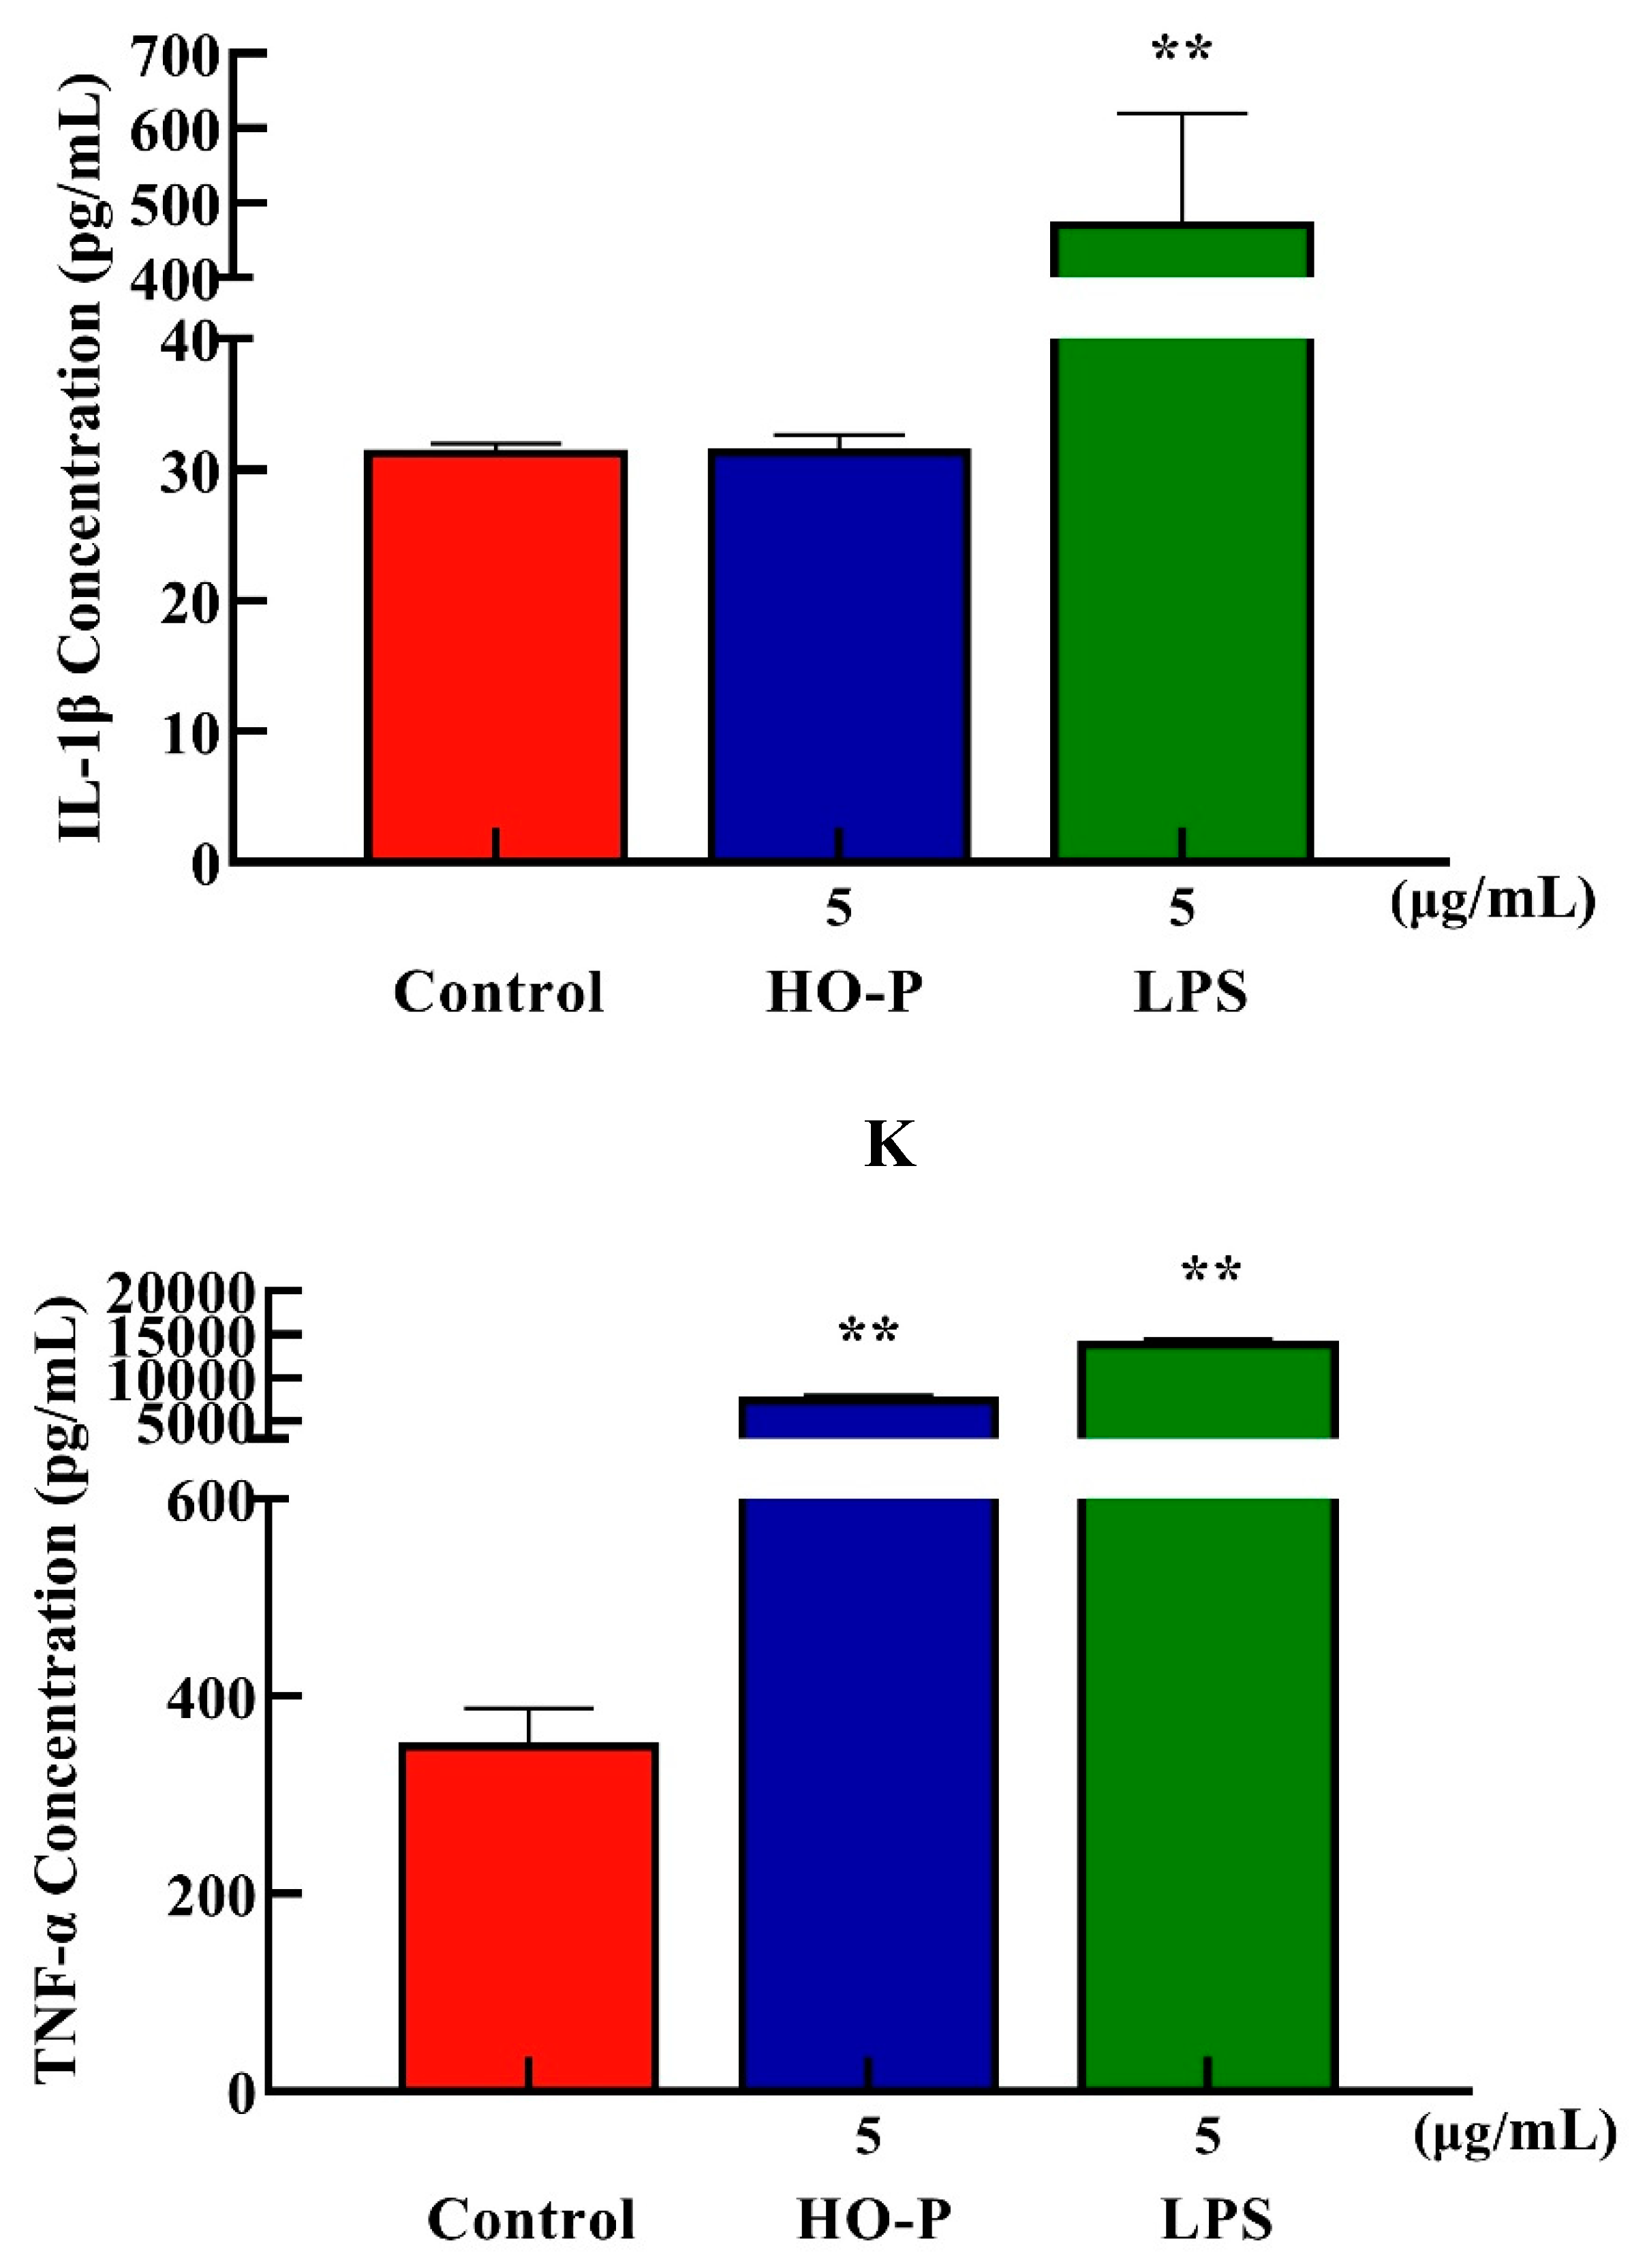
Figure 7I,J). Both HO-P (5 μg/mL) and the positive group could promote the secretion of TNF-α from RAW264.7 cells (
P < 0.01) with secretion amounts of 7819.30 pg/mL and 14182.14 pg/mL, respectively, that were 22.16 and 40.20 times of blank group, respectively, but IL-1β secretion in HO-P group was not statistically significant neither, while the positive group could significantly (
P < 0.01) promote the secretion of IL-1β by RAW264.7 cells with secretion amount of 475.79 pg/mL (
Figure 7K,L).
4. Conclusions
The structure and activities of Agrocybe aegerita polysaccharide (AA-P) and Hygrophorus olivaceoalbus polysaccharide (HO-P) were first studied. The molecular weight of AA-P and HO-P were 14 552 Da and 26 606 Da, respectively. AA-P was composed of Galactose, Glucose and Arabinose, in the ratio of 3:2:1. Its skeleton structure was consisted of (1→4)-Arap, (1→4,6)-Glup and (1→6)-Galp with one branched chain. The HO-P was consisted of mannose, galactose and glucose in a ratio of 1:1:2. Its skeleton structure was consisted of (1→6)-Galactose residues, (1→6)-Galactose residues, (→1)-glucose residues, (1→4)-glucose residues and (1→4,6)-D-mannose residues. There were three branched chains connected to the main chain. The immunoassay showed that AA-P and HO-P had the best stimulation effect on RAW264.7 cells and B cells, respectively. AA-P could promote T cells entering G2/M phase, promote B cells entering S phase and promote RAW264.7 cells finish the G0/G1 phase, respectively. HO-P could only affect G0/G1 phase and had little impact on the S phase and G2/M phase of T cells, could promote B cells entering S phase and G2/M phase, and promote RAW264.7 cells entering G2/M phase, respectively. In addition, AA-P and HO-P could significantly promote TNF-α secretion in T cells, IgA, IgD, IgE, IgG, IgM secretion in B cells, and TNF-α secretion in RAW264.7 cells, but neither of them could impact IL-1β secretion in RAW264.7 cells.
Author Contributions
Conceptualization, X.D. and Y.H.; methodology, X.D. and Y.H.; software, T. Y.; validation, X.D. and Y.H.; formal analysis, T. Y., X. C., H. Z., X. Y., X.D. and Y.H.; investigation, T. Y., X. C., H. Z., X. Y., X.D. and Y.H.; resources, T. Y., X. C., H. Z., X. Y., X.D. and Y.H.; data curation, T. Y., X. C., H. Z., X. Y., X.D. and Y.H.; writing—original draft preparation, T. Y., X.D. and Y.H.; writing—review and editing, X.D. and Y.H.; visualization, X.D. and Y.H.; supervision, X.D. and Y.H.; project administration, Y.H. and X.D.; funding acquisition, Y.H. and X.D.; All authors agreed to the manuscript published version.
Funding
This research was funded by the Sichuan Province Science and Technology Support Project (2022NZZJ0003, 22ZYZFSF0009, 2022NSFSC0107and 23ZHSF0082), and the Dazhou city-school cooperation project (2021-S05).
Institutional Review Board Statement
Not applicable.
Data Availability Statement
The data presented in this study are available on request from the corresponding author.
Conflicts of Interest
All authors declare that there is no conflict of interest.
References
- Ishii, T. Structure and functions of feruloylated polysaccharides, Plant. Science, 1997, 127, 111–127. [Google Scholar]
- Rougon, G. A monoclonal antibody against meningococcus group B polysaccharides distinguishes embryonic from adult N-CAM, J. Cell Bio. 1986, 103, 2429–2437. [Google Scholar] [CrossRef] [PubMed]
- Wijesekara, I. , Pangestuti, R. , Kim, S. K. Biological activities and potential health benefits of sulfated polysaccharides derived from marine algae, Carbohydr. Polym. 2011, 84, 14–21. [Google Scholar]
- Rief, M. Single Molecule Force Spectroscopy on Polysaccharides by Atomic Force Microscopy. Science, 1997, 275, 1295–1297. [Google Scholar] [CrossRef] [PubMed]
- Kozarski, M. , Klaus, A. , Niksic, M., Jakovljevic, D., Helsper, J. P., Van Griensven, L. J. Antioxidative and immunomodulating activities of polysaccharide extracts of the medicinal mushrooms Agaricus bisporus, Agaricus brasiliensis, Ganoderma lucidum and Phellinus linteus, Food. Chem. 2011, 129, 1667–1675. [Google Scholar]
- Kouakou, K. , Schepetkin, I. A., Yapi, A., Kirpotina, L.N., Quinn, M.T. Immunomodulatory activity of polysaccharides isolated from Alchornea cordifolia, J. Ethnopharm. 2013, 146, 232–242. [Google Scholar]
- Lee, H. H. , Lee, J. S., Cho, J.Y., Kim, Y.E., Hong, E.K. Study on Immunostimulating Activity of Macrophage Treated with Purified Polysaccharides from Liquid Culture and Fruiting Body of Lentinus edodes, J. Microbio. Biotech. 2009, 19, 566–572. [Google Scholar]
- Sullivan, R. , Smith, J. E., Rowan, N.J. Immunomodulatory Activities of Mushroom Glucans and Polysaccharide–Protein Complexes in Animals and Humans (A Review), Int. J Med. Mushrooms. 2003, 5, 16–16. [Google Scholar]
- Samuelsen, A.B. , Rieder, A. , Grimmer, S., Michaelsen, T.E., & Knutsen, S.H. Immunomodulatory Activity of Dietary Fiber: Arabinoxylan and Mixed-Linked Beta-Glucan Isolated from Barley Show Modest Activities in Vitro, Int. J. Mol. Sci. 2011, 12, 570–587. [Google Scholar] [PubMed]
- Sheu, S.C. , Ying, L. , Lee, M.S., Cheng, J.H. Immunomodulatory effects of polysaccharides isolated from Hericium erinaceus on dendritic cells, Process. Biochem. 2013, 48, 1402–1408. [Google Scholar]
- Fang, Y.H. , Ping, Y. U., & Wei, L.I. Isolation, Purification and Immunological Activities of a Polysaccharide Fraction from Agrocybe aegerita Fruit bodies, J. edible. Fungi. 2006, 13, 72–76. [Google Scholar]
- Yi, L. , Jia, C. L., Wang, Yi, J.C., Hong, H.L., Rong, L., Shuai, J., Tao, C., Zhao, Y., Li, D.F. A nuclear ligand MRG15 involved in the proapoptotic activity of medicinal fungal galectin AAL (Agrocybe aegerita lectin), Biophysica. Acta. 2010, 1800, 474–480. [Google Scholar]
- Ji, Y. , Zheng, M. F., Ye, S.G., Wu, X.B., Chen, J.Y. Agrocybe aegerita polysaccharide combined with chemotherapy improves tumor necrosis factor-α and interferon-β levels in rat esophageal carcinoma, Diseases. Esophagus. 2013, 26, 859–863. [Google Scholar]
- Jing, H. , Li, J. , Zhang, J., Wang, W., Li, S., Ren, Z., Gao, Z., Song, X., Wang, X., Jia, L. The antioxidative and anti-aging effects of acidic- and alkalic-extractable mycelium polysaccharides by Agrocybe aegerita (Brig.) Sing, J. Bio. Macromol. 2018, 106, 1270–1278. [Google Scholar]
- Charlton, A.J.A. , Jones, A. Determination of imidazole and triazole fungicide residues in honeybees using gas chromatography-mass spectrometry, J. Chromatography. A. 2007, 1141, 117–122. [Google Scholar]
- Speciale, I. , Notaro, A. , Garcia-Vello, P., Di Lorenzo, F., Armiento, S., Molinaro, A.,Marchetti, R., Silipo,Alba., De Castro,Cristina. Liquid-state NMR spectroscopy for complex carbohydrate structural analysis: A hitchhiker’s guide, Carbohydr Polym. 2022, 277, 118885–118905. [Google Scholar]
- Fontana, C. , Widmalm, Göran. Primary Structure of Glycans by NMR Spectroscopy. Chem Rev. 2023, 123, 1040−1102. [Google Scholar] [CrossRef] [PubMed]
- Okuom, M.O. , Wilson, M. V., Jackson, A., Holmes, A.E. Intermolecular Interactions between Eosin Y and Caffeine Using 1H-NMR Spectroscopy, Int. J. Spectrosc. 2013, 2013, 1–6. [Google Scholar]
- Kim, H. , Ralph, J. Solution-state 2D NMR of ball-milled plant cell wall gels in DMSO-d6/pyridine-d5, Bioenergy. Res. 2010, 8, 576–591. [Google Scholar]
- Claridge, T.D.W. , Pérez-Victoria, I. Enhanced 13C resolution in semi-selective HMbC: a band-selective, constant-time HMBC for complex organic structure elucidation by NMR, Org. Biomol. Chem. 2003, 1, 3632–3634. [Google Scholar]
- Makino, S. Ikegami, S. , Kano, H., Sashihara, T., Sugano, H., Horiuchi, H., Saito, T., Oda, M. Immunomodulatory Effects of Polysaccharides Produced by Lactobacillus delbrueckii ssp. bulgaricus OLL1073R-1, J. Dairy. Sci. 2006, 89, 2873–2881. [Google Scholar]
- Park, H. , Zhaoxia, L. , Xuexian, Y., Seon, O., Chang, H. A distinct lineage of CD4 T cells regulates tissue inflammation by producing interleukin 17, Nature. Immu. 2005, 6, 1133–1141. [Google Scholar]
- Miller, A. H. , Maletic, V. , Raison, C. L. Inflammation and Its Discontents: The Role of Cytokines in the Pathophysiology of Major Depression, Biol. Psychiatry. 2009, 65, 732–741. [Google Scholar] [PubMed]
- Lin, K.I. , Angelin-Duclos, C. , Kuo, T.C., Calame, K. Blimp-1-Dependent Repression of Pax-5 Is Required for Differentiation of B Cells to Immunoglobulin M-Secreting Plasma Cells, Mol. Cell. Bio. 2002, 22, 4771–4780. [Google Scholar]
- Lewis, C.E. , Pollard, J. W. Distinct Role of Macrophages in Different Tumor Microenvironments, Cancer. Res. 2006, 66, 605–612. [Google Scholar]
- Wang, X.M. , Ji, Z. , Wu, L.H., Zhao, Y.L., Li, T., Li, J.Q., Wang, Y.Z., Liu, H.G. A mini-review of chemical composition and nutritional value of edible wild-grown mushroom from China, Food. Chem. 2014, 151, 279–285. [Google Scholar]
- Suh, J.K.F. Matthew, H. Application of chitosan-based polysaccharide biomaterials in cartilage tissue engineering: a review, Biomaterials. 2000, 21, 2589–2598. [Google Scholar]
- Conway, J.G. , Andrews, R. C., Beaudet, B., Bickett, D.M., Becherer, J.D. Inhibition of Tumor Necrosis Factor-α (TNF-α) Production and Arthritis in the Rat by GW3333, a Dual Inhibitor of TNF-α-Converting Enzyme and Matrix Metalloproteinases, J. Pharm. Experim. Therapeutics. 2001, 298, 900–908. [Google Scholar]
- Elkayam, O. , Dan, C. , Reitblatt, T., Charboneau, D., Rubins, J.B. The effect of tumor necrosis factor blockade on the response to pneumococcal vaccination in patients with rheumatoid arthritis and ankylosing spondylitis, Semin. Arthritis. Rheum. 2004, 33, 283–288. [Google Scholar]
- Reddy, K. , Mohan, GK., Satla, S., Gaikwad, S. Natural polysaccharides: versatile excipients for controlled drug delivery systems, Asian. J. Pharm. Sci. 2011, 6(6): 275-286.
- Xiao, J.B. , Jiang, H. A review on the structure-function relationship aspect of polysaccharides from tea materials, Crit. Rev. Food Sci. Nutri. 2015, 55 (7): 930-938.
- Supatra, K. , SangGuan, Y. Molecular characteristics of sulfated polysaccharides from Monostroma nitidum and their in vitro anticancer and immunomodulatory activities, Int. J. Biol. Macromol. 2011, 48(2): 311-318.
Figure 1.
(A-B) Column chromatography results of AA-P and HO-P, respectively. (C-D) The molecular weight of AA-P and HO-P, respectively. (E-F) The fourier transform infrared spectra of AA-P and HO-P, respectively. (G-H) Monosaccharide composition results of AA-P and HO-P, respectively.
Figure 1.
(A-B) Column chromatography results of AA-P and HO-P, respectively. (C-D) The molecular weight of AA-P and HO-P, respectively. (E-F) The fourier transform infrared spectra of AA-P and HO-P, respectively. (G-H) Monosaccharide composition results of AA-P and HO-P, respectively.
Figure 2.
(A-I) The methylation results of AA-P. (B-J) The methylation results of HO-P.
Figure 2.
(A-I) The methylation results of AA-P. (B-J) The methylation results of HO-P.
Figure 3.
(A-B) The 1H NMR spectra of AA-P and HO-P, respectively. (C-D) The 13C NMR spectra of AA-P and HO-P, respectively. (E-F) 1H-1H COSY spectrum of AA-P and HO-P, respectively.
Figure 3.
(A-B) The 1H NMR spectra of AA-P and HO-P, respectively. (C-D) The 13C NMR spectra of AA-P and HO-P, respectively. (E-F) 1H-1H COSY spectrum of AA-P and HO-P, respectively.
Figure 4.
Figure 4. (A-B) HMQC spectrum of AA-P and HO-P, respectively. (C-D) HMBC spectrum of AA-P and HO-P, respectively. (E-F) Predicted chemical structure of AA-P and HO-P, respectively.
Figure 4.
Figure 4. (A-B) HMQC spectrum of AA-P and HO-P, respectively. (C-D) HMBC spectrum of AA-P and HO-P, respectively. (E-F) Predicted chemical structure of AA-P and HO-P, respectively.
Figure 5.
Figure 5. (A-B) Cells proliferation of T cells in AA-P and HO-P group, respectively. (C-D) Cells morphology of T cells in AA-P and HO-P group, respectively. Notes: LPS: 5 μg/mL. (E-F) Cells cycle of T cells in AA-P and HO-P group, respectively. (G-H) Statistic results of T cells cycle in AA-P and HO-P group, respectively. (I-J) TNF-α secretion of T cells in AA-P and HO-P group, respectively.
Figure 6.
Figure 6. (A-B) Cells proliferation of B cells in AA-P and HO-P group, respectively. (C-D) Cells morphology of B cells in AA-P and HO-P group, respectively. Notes: LPS: 5 μg/mL. (E-F) Cells cycle of B cells in AA-P and HO-P group, respectively. (G-H) Statistic results of B cells cycle in AA-P and HO-P group, respectively. (I-R) IgA, IgG, IgE, IgD, IgM secretion of B cells in AA-P and HO-P group, respectively. .
Figure 7.
Figure 7. (A-B) Cells proliferation of RAW264.7 cells in AA-P and HO-P group, respectively. (C-D) Cells morphology of RAW264.7 cells in AA-P and HO-P group, respectively. Notes: LPS: 5 μg/mL. (E-F) Cells cycle of RAW264.7 cells in AA-P and HO-P group, respectively. (G-H) Statistic results of RAW264.7 cells cycle in AA-P and HO-P group, respectively. (I-L) TNF-α, IL-1β secretion of T cells in AA-P and HO-P group, respectively.
Table 1.
Chemical shifts of hydrogen and carbon atoms in Agrocybe aegerita polysaccharide (AA-P).
Table 1.
Chemical shifts of hydrogen and carbon atoms in Agrocybe aegerita polysaccharide (AA-P).
Glycosyl residues
(AA-P) |
Chemical shifts (ppm) |
| H1/C1 |
H2/C2 |
H3/C3 |
H4/C4 |
H5/C5 |
H6/C6 |
| (1→6)-Galp (A) |
5.09/96.22 |
3.73/74.27 |
4.09/69.74 |
3.58/69.01 |
3.87/71.75 |
3.50/77.43 |
| (1→4,6)-Glcp (B) |
5.00/104.03 |
3.69/80.60 |
3.96/71.33 |
3.52/69.74 |
3.80/69.32 |
3.56/77.34 |
| (1→6)-Galp (C) |
4.96/100.56 |
3.66/72.32 |
3.96/69.32 |
3.62/70.96 |
3.85/74.27 |
3.50/69.74 |
| (1→4)-Arap (D) |
4.88/100.39 |
3.73/74.27 |
3.87/70.80 |
3.50/77.43 |
3.80/70.80 |
-- |
| →1)-Glcp (E) |
4.42/105.51 |
3.21/75.58 |
3.52/74.27 |
3.41/75.08 |
3.62/70.96 |
3.33/69.01 |
Table 2.
Chemical shifts of hydrogen and carbon atoms in Hygrophorus olivaceoalbus polysaccharide (HO-P).
Table 2.
Chemical shifts of hydrogen and carbon atoms in Hygrophorus olivaceoalbus polysaccharide (HO-P).
| Glycosyl residues |
Chemical shifts (ppm) |
| H1/C1 |
H2/C2 |
H3/C3 |
H4/C4 |
H5/C5 |
H6/C6 |
| (1→4,6)-D-Manp (A) |
5.03/98.25 |
3.86/77.05 |
4.09/68.25 |
3.63/70.39 |
3.87/66.85 |
3.29/76.21 |
| (1→4)-Glcp (B) |
4.96/98.25 |
3.68/68.49 |
4.00/70.39 |
3.53/69.30 |
3.86/72.88 |
3.29/66.85 |
| →1)-Glcp (C) |
4.96/101.67 |
3.77/69.50 |
4.09/68.74 |
3.65/68.49 |
3.84/61.10 |
3.53/72.88 |
| (1→6)-Galp (D) |
4.91/97.85 |
3.74/71.73 |
4.16/69.13 |
3.63/68.74 |
4.09/61.10 |
3.84/67.67 |
|
Disclaimer/Publisher’s Note: The statements, opinions and data contained in all publications are solely those of the individual author(s) and contributor(s) and not of MDPI and/or the editor(s). MDPI and/or the editor(s) disclaim responsibility for any injury to people or property resulting from any ideas, methods, instructions or products referred to in the content. |
© 2023 by the authors. Licensee MDPI, Basel, Switzerland. This article is an open access article distributed under the terms and conditions of the Creative Commons Attribution (CC BY) license (http://creativecommons.org/licenses/by/4.0/).
