Preprint
Review

Smoke Toxicity: A Review of Bench‐to‐Large‐Scale Comparisons

Altmetrics

Downloads

92

Views

85

Comments

0

This version is not peer-reviewed

Submitted:

27 November 2023

Posted:

29 November 2023

You are already at the latest version

Alerts
Abstract
A significant amount of data is available for bench-scale fire assessments. However, there is little surrounding large-scale tests and even less so for bench-to-large scale comparisons. Large-scale tests require more material, time and preparation, making them more expensive than bench-scale assessments. However, large-scale testing is an essential component to bench-scale fire testing. The bench-scale tests must be representative of both large-scale and real fire behaviour to provide an insight into how a material or product will behave in the event of a fire during its end use application. The few existing studies reviewed in this study show more guidance and data is needed, especially on a large-scale. Unfortunately, the data that is presented is done so in an inconsistent manner using various means of presentation, statistical analysis, and modelling that doesn’t show clear comparisons between bench and large scale. Currently, no bench-scale method shows good agreement with large-scale fire behaviour. Overall, there is a need for more large-scale testing and data for direct comparisons to be made.
Keywords: 
Subject: Chemistry and Materials Science  -   Physical Chemistry

Introduction

While a significant amount of data is available for bench-scale fire assessments, there is little surrounding large-scale tests and even less so for bench-to-large scale comparisons. Large-scale tests require more material, time and preparation, making them more expensive than bench-scale assessments. However, large-scale testing is an essential component to bench-scale fire testing. The bench-scale tests must be representative of both large-scale and real fire behaviour to provide an insight into how a material or product will behave in the event of a fire during its end use application. Currently, large-scale fire tests predominantly focus on the materials flammability and do not often contain information regarding the materials smoke toxicity.
A ‘real fire’, is defined as a fire that simulates a given application with end use environment, with end use and installation being taken into consideration [1]. Large-scale fires are the closest measurements to a real fire as possible, but are both expensive to conduct and rarely used for toxicity measurements. This document will provide an explanation to the regulatory processes and information regarding large-scale tests and bench-to-large scale comparisons. It will also summarize and critique published large-scale tests that have measured smoke toxicity, providing a starting post for future research in the field of smoke toxicity.

A Summary ISO 29903

ISO 29903 [2] provides the guidance for the comparison of toxic gas yields produced on a bench-scale to those produced on a large-scale, in addition to comparing bench-scale methods with each other. The document focuses on comparisons made to large-scale tests conducted using the ISO 9705 room corner test, defined as the reference scenario in Guidance document G [3].
ISO 29903 [2] notes the need to define the combustion condition in which the bench-scale test is conducted to enable two or more bench-scale test methods to be compared with each other. Without this, an accurate comparison is not possible. During the process of combustion, if more than one fire stage is encompassed then the duration of the combustion stage that will be used for comparison will need to be known. The most reliable means of identifying combustion conditions on a large-scale is by measuring the equivalence ratio during the test. Most fires are in enclosures, and the geometry remains fixed for the duration of the fire. Exceptions include windows breaking, which would change the burning rate.
Agreement between bench and large-scale data is affirmed when all toxicant yields measured are reflective of each other. All toxicants measured must be in agreement. If one toxicant outlies, an explanation must be given as to why the particular toxicant is not in agreement –an explanation can often be found after conducting repeat experiments evaluating the sampling and mode of analysis. If the outlier is a result of differences in combustion condition, the comparison is rendered invalid. The bench-scale method used in the comparison must therefore be able to accurately and repeatably generate smoke at definitive fire conditions. The criteria for assessing the validity of a test method is described in ISO 16312-1 [4]. This means that the bench-scale method used needs to be able to accurately measure smoke toxicity in order for the data produced to be valid in terms of bench to large-scale comparisons.
The standard suggests the smoke toxicity comparisons are made by looking at the gas yields as a function of CO/CO2 ratio or equivalence ratio. Using the CO/CO2 ratio as a means of comparison is only suitable for materials which do not contain halogens or other gas phase flame retardants. While the CO/CO2 ratio is representative of the oxygen availability and hence provides details of the combustion condition of the fire, valid comparisons cannot be made when the burning material contains additives which interfere with the process of gas phase combustion. Halogenated flame retardants have also been shown to interfere with the production of CO2 [5,6] irrespective of combustion conditions and so this renders comparisons from bench to large-scale using CO/CO2 ratios unusable. Combustion temperatures also influence the production of toxic species and should be taken into consideration when using CO/CO2 ratio as a method of comparison. The sampling position can also have an effect on the yields measured. This further complicates the comparison process and so it is not recommended to use CO/CO2 ratio for bench to large-scale comparisons.

Review of existing bench-to-large scale comparisons

There are few large-scale test research published in literature. As smoke toxicity is unregulated outside of mass transport industry, there is little agreement on the best methods of quantifying it on a large-scale. The available literature has therefore been reviewed in terms of the methodologies used and the data presented, and how reliable the comparison is.
The US National Institute for Science and Technology (NIST) undertook a series of large-scale experimental studies on different products: a bookcase a sofa and domestic cables. Material from each product was tested in the radiant test apparatus (NFPA 269 and ASTM E 1678) (NIST Technical Note 1760 [7]), SSTF (NIST Technical Note 1761 [8]), CACC (NIST Technical Note 1762 [9]) and SDC (included in NIST Technical Note 1763 [10]). The 3 materials were tested under conditions designed to simulate pre-flashover and post-flashover. NIST Technical note 1763 focused on comparing the data obtained from each apparatus to large-scale room corner data. None of the test data from bench or large-scale had CO yields representative of under-ventilated flaming (around 0.2 g/g).
Table 1 shows example data taken from NIST Technical Note 1761 [8]. The data showed large variation between repeat tests for each condition shown. In addition, only the “Sofa” material came close to the CO yield typical of under-ventilated flaming. Average gas concentrations were taken “over a period of time between 4 min and 12 min from the beginning of the experiment”. Average gas concentrations were taken for approximately 3 minutes (200 seconds).
The findings from NISTs experiments were in direct contradiction to the recommendations made by Sandinge and Blomqvist [11]. NIST suggested the use of the CACC, operated at 50 kW m- [2], with reduced oxygen atmosphere as the best apparatus for testing under-ventilated flaming. However, under-ventilated conditions were never reached. The study recommends altering the CO yields obtained to 0.2 g/g for use in physical fire models pertaining to under-ventilated conditions.
The TOXFIRE project [12] tested 5 different materials in the ISO 9705 room corner test, using FTIR for gas analysis. The equivalence ratio was monitored during the tests using a phi meter, and the size of the door opening was varied in attempt to simulate under-ventilated flaming. Gas sampling was taken from the upper layer of the room close to the doorway as well as in the main ventilation duct.
The TOXFIRE project is one of the few large-scale tests that monitored the equivalence ratio throughout. During large-scale testing, there is much less control over the burning conditions your material is subject to in comparison to bench-scale assessments. The project used a phi-meter, an apparatus specifically designed to quantify equivalence ratio, to monitor this parameter [13]. This allowed the project to identify the fire scenarios throughout their tests and allow the yields of toxicants measured to be compared directly to bench-scale data. The equivalence ratio measurements were taken from the upper layer of the room close to the doorway, as this was the only air inlet into the room, with a probe of varying length being placed in the doorway to sample from the fire plume.
In 3 of the 5 tests conducted, flashover was reached. The toxicants measured at this point were representative of under-ventilated conditions, with high yields of CO and HCN being produced. Although flash-over was achievable in these cases, it proved difficult to maintain a constant equivalence ratio once under-ventilation was reached. In some tests, additional burning outside of the opening occurred. In these cases, a lower equivalence was measured with more products of complete combustion being measured. The additional flaming will cause further changes to the chemistry of the effluent, causing the measurements to be less reliable than in tests where no secondary flaming occurred. Large-scale tests conducted must be careful to control the occurrence of secondary flaming where possible as this could produce misleading data whereby the measured toxicity could be lower than it actually is.
The uncertainties and variation observed in some results of this study can be explained by the high intensity of the fires. The intensity of the fire caused turbulence in the air flow both in and out of the room, affecting the air flow measurements and also the mass loss measurements. In tests where the fire was noticeably intense, a very noisy mass loss signal was obtained. This turbulence would have an effect on the yields measured as the yields are dependant on both the air flow and the mass loss throughout the test. It would also have an effect on how representative the gas sampling was throughout the tests. Tests where there was significant water and soot production were detrimental to the analysis and could not be included in the overall data set.
The data reported for these tests were used to make bench-scale comparisons to highlight the bench-scale test that is most representative of large-scale fire behaviour. As the equivalence ratio was monitored during these large-scale tests, it was used as a basis for the comparison of the data.
The CO yields obtained in the project were plotted as a function of equivalence ratio, as seen in Figure 1 [14]. The data was compared to that obtained using: the SSTF, CACC (as a function of equivalence ratio) and the FPA. Four data sets were obtained from the SSTF by a) Blomqvist using PA 6.6 (the same material and batch as used in the TOXFIRE project) [15], b) Stec using PA 6.6 (the same material but different batch used to the TOXFIRE project) [16] and c) Purser using PA 6 (a different material). All methods showed an increased scatter as the fire reaches higher equivalence ratios but show a general trend of increasing CO yields as the equivalence ratio increases.
The SSTF seemed to consistently under-predict the CO yield at lower equivalence ratios, and over-predict at equivalence ratios surpassing 1. The ISO room data stops at an equivalence ratio of 1.2, and so comparisons for under-ventilated flaming (where the equivalence ratio is greater than 1.2) are not possible using the available graphs. The FPA produced the highest yields of CO, but was not representative of the ISO room data shown. The CACC over-predicted CO yields below 1, and had very low yields of CO at higher equivalence ratios. This has also been shown in previous literature [17].
While the comparison presented in Figure 1 is good for well-ventilated flaming, as the ISO room data did not surpass 1.2, comparisons for under-ventilated flaming are not possible. It would be beneficial to view the data to a maximum value of 1.2 to prevent the excess data from skewing the results presented. When studying the data closely, the similarity between bench and large-scale data is much less prevalent.
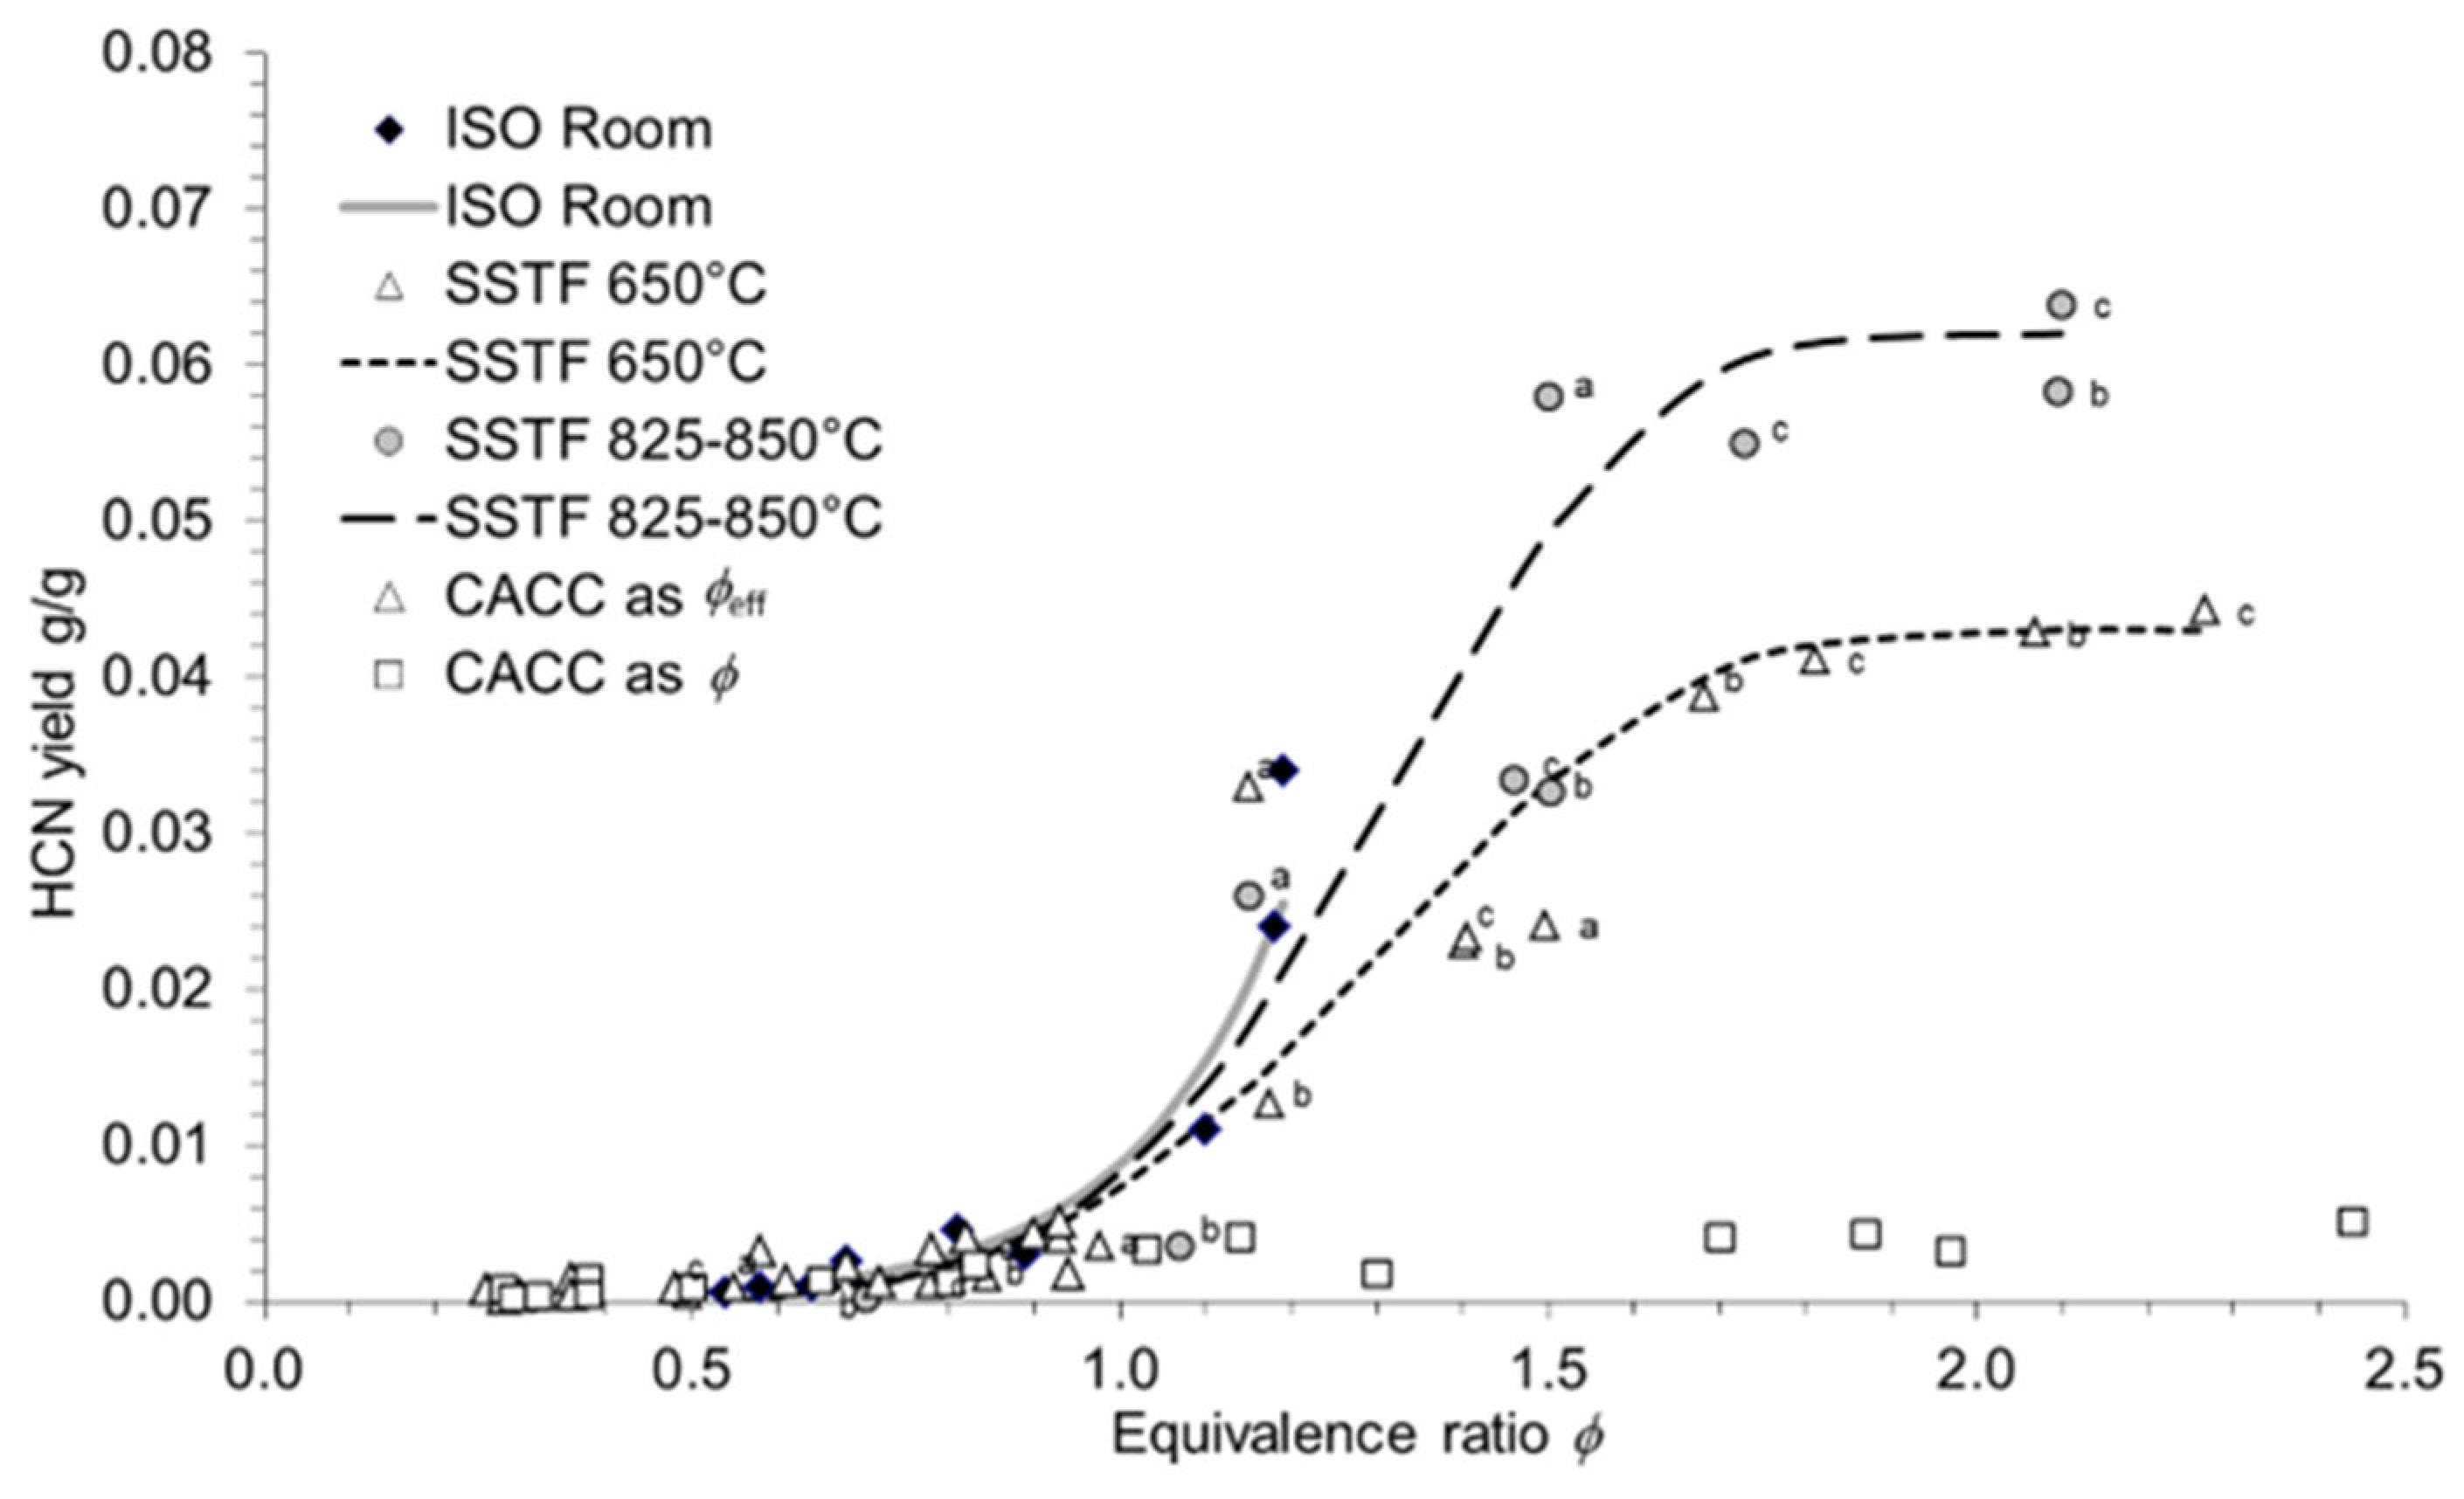
Figure 2 shows the same comparison of HCN yields produced in the ISO room with those produced by the SSTF and CACC. The CACC fails to replicate the yields produced in the ISO room, with very small changes in HCN yield occurring as the reported equivalence ratio increases. At φ=1, the CACC was able to predict similar HCN yields as produced in the ISO room. While the SSTF showed better agreement with the ISO room data than the CACC, the data from the SSTF consistently under-predicts the ISO room data at equivalence ratios below 1. at equivalence ratios above 1, the SSTF mostly under-predicted HCN yields, with the exception of 2 data points over-predicting the yields. No comparison can be made above equivalence ratio 1.2 as the large-scale test data ends here.
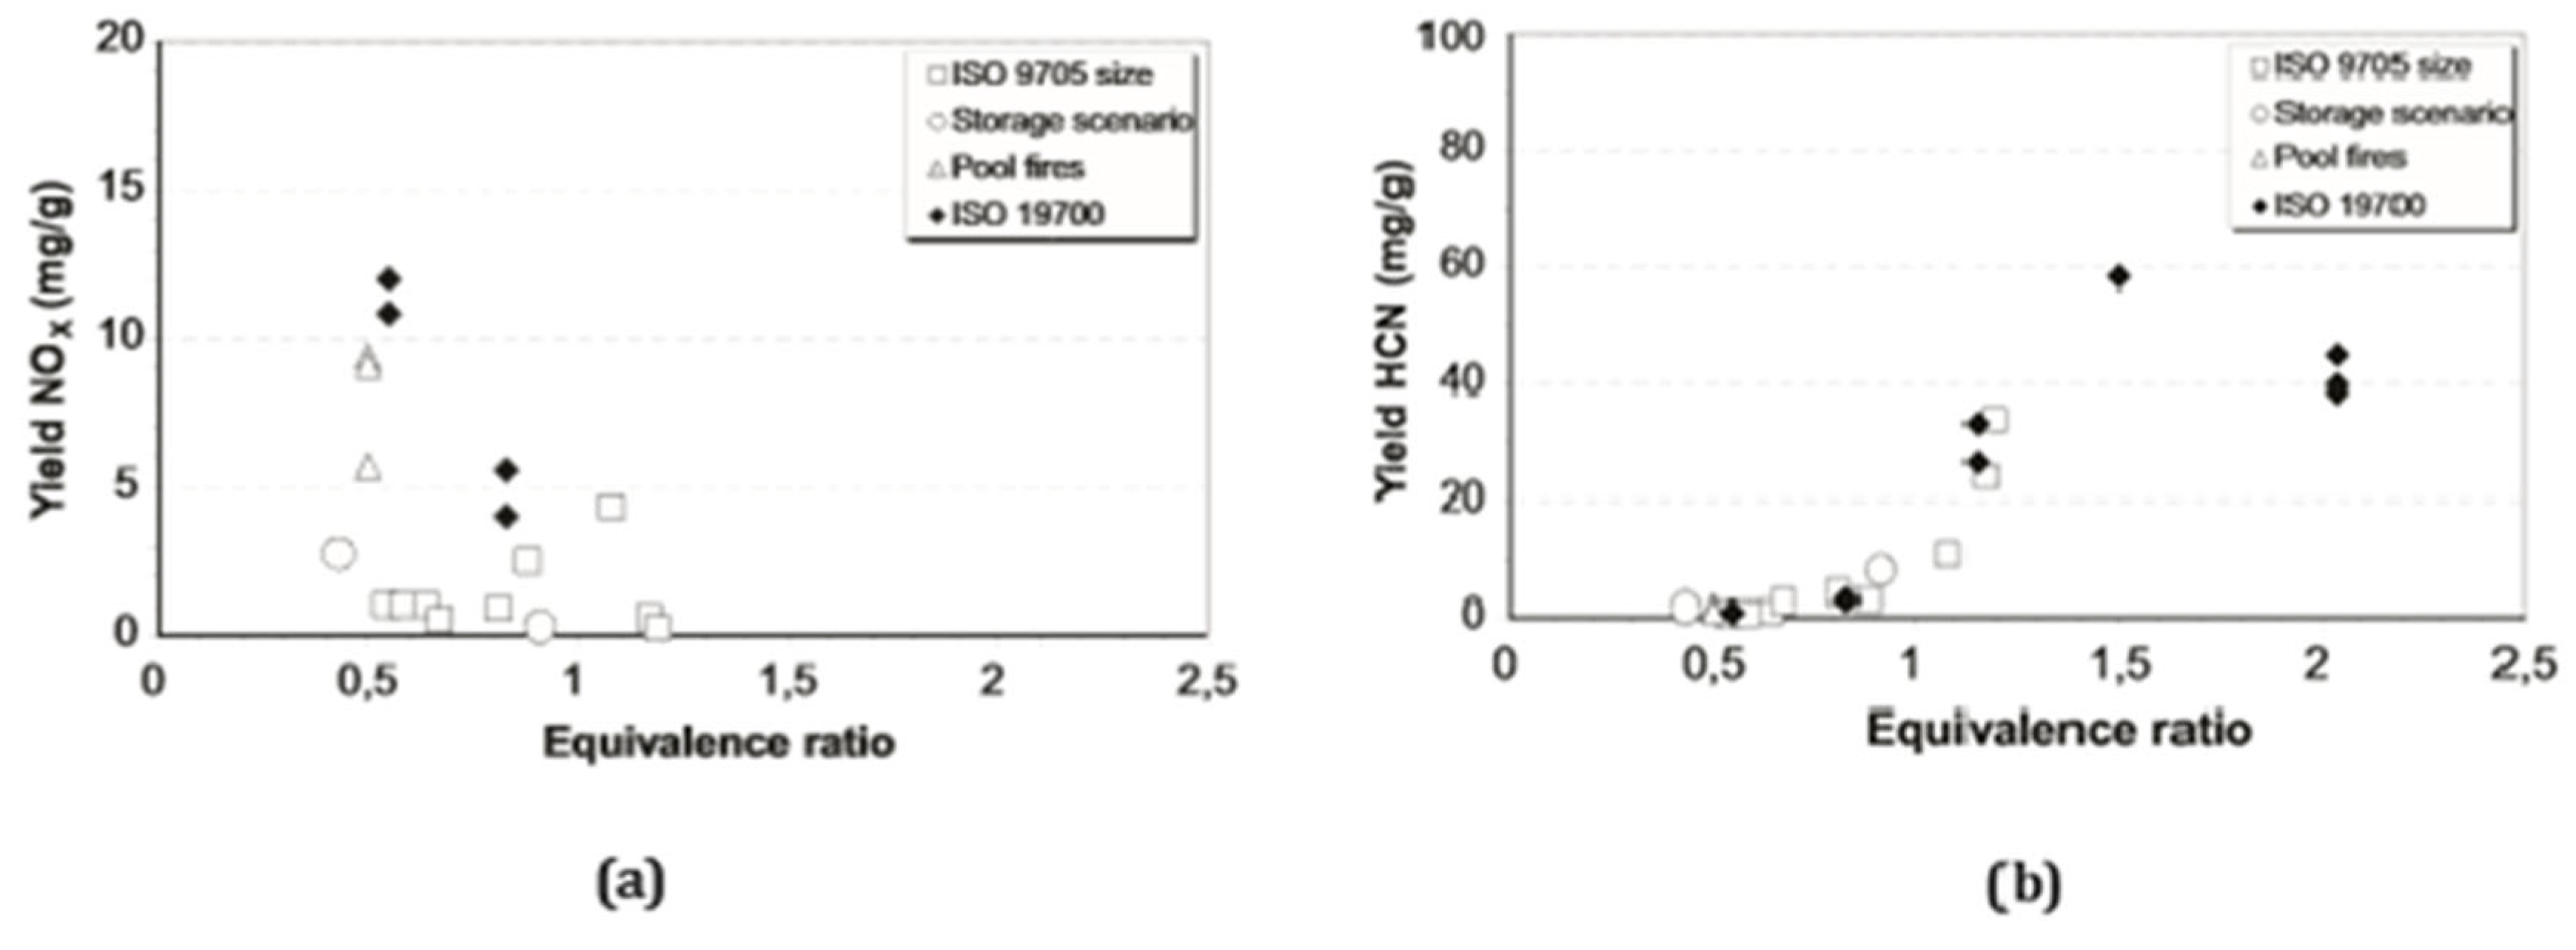
NOx (a) and HCN (b) yields produced by the SSTF were also plotted as a function of equivalence ratio as a means of bench-to-large-scale comparison between different large-scale fire tests shown in Figure 3 [64]. The data show a poor correlation between the SSTF and the large-scale tests. At low equivalence ratios, the SSTF greatly over-predicted the yield of NOx. The data is not comparable for equivalence ratios over 1.2. The use of an extended axis potentially skews the data, making comparison difficult. When comparing the HCN yields, a better correlation between the SSTF and the large-scale tests is observed, however this could be due to the axis being much higher than needed and again, skewing the results. The data in the equivalence ratio range of 0.5 to 1 shows good agreement. No comparison can be made at equivalence ratios above 1.2 as there is no large-scale data provided for comparison.
A series of large-scale tests were compared to the SSTF by Purser et. al [18]. Of the 8 materials tested in the TOXFIRE project, two were selected for comparison: Polyamide 6.6 (PA66) and Polypropylene (PP). Data obtained for comparison from bench-scale assessments on the same materials, with the PP sourced separately [19,20]. The LDPE had the same empirical formula as PP but a different structure [21,22].
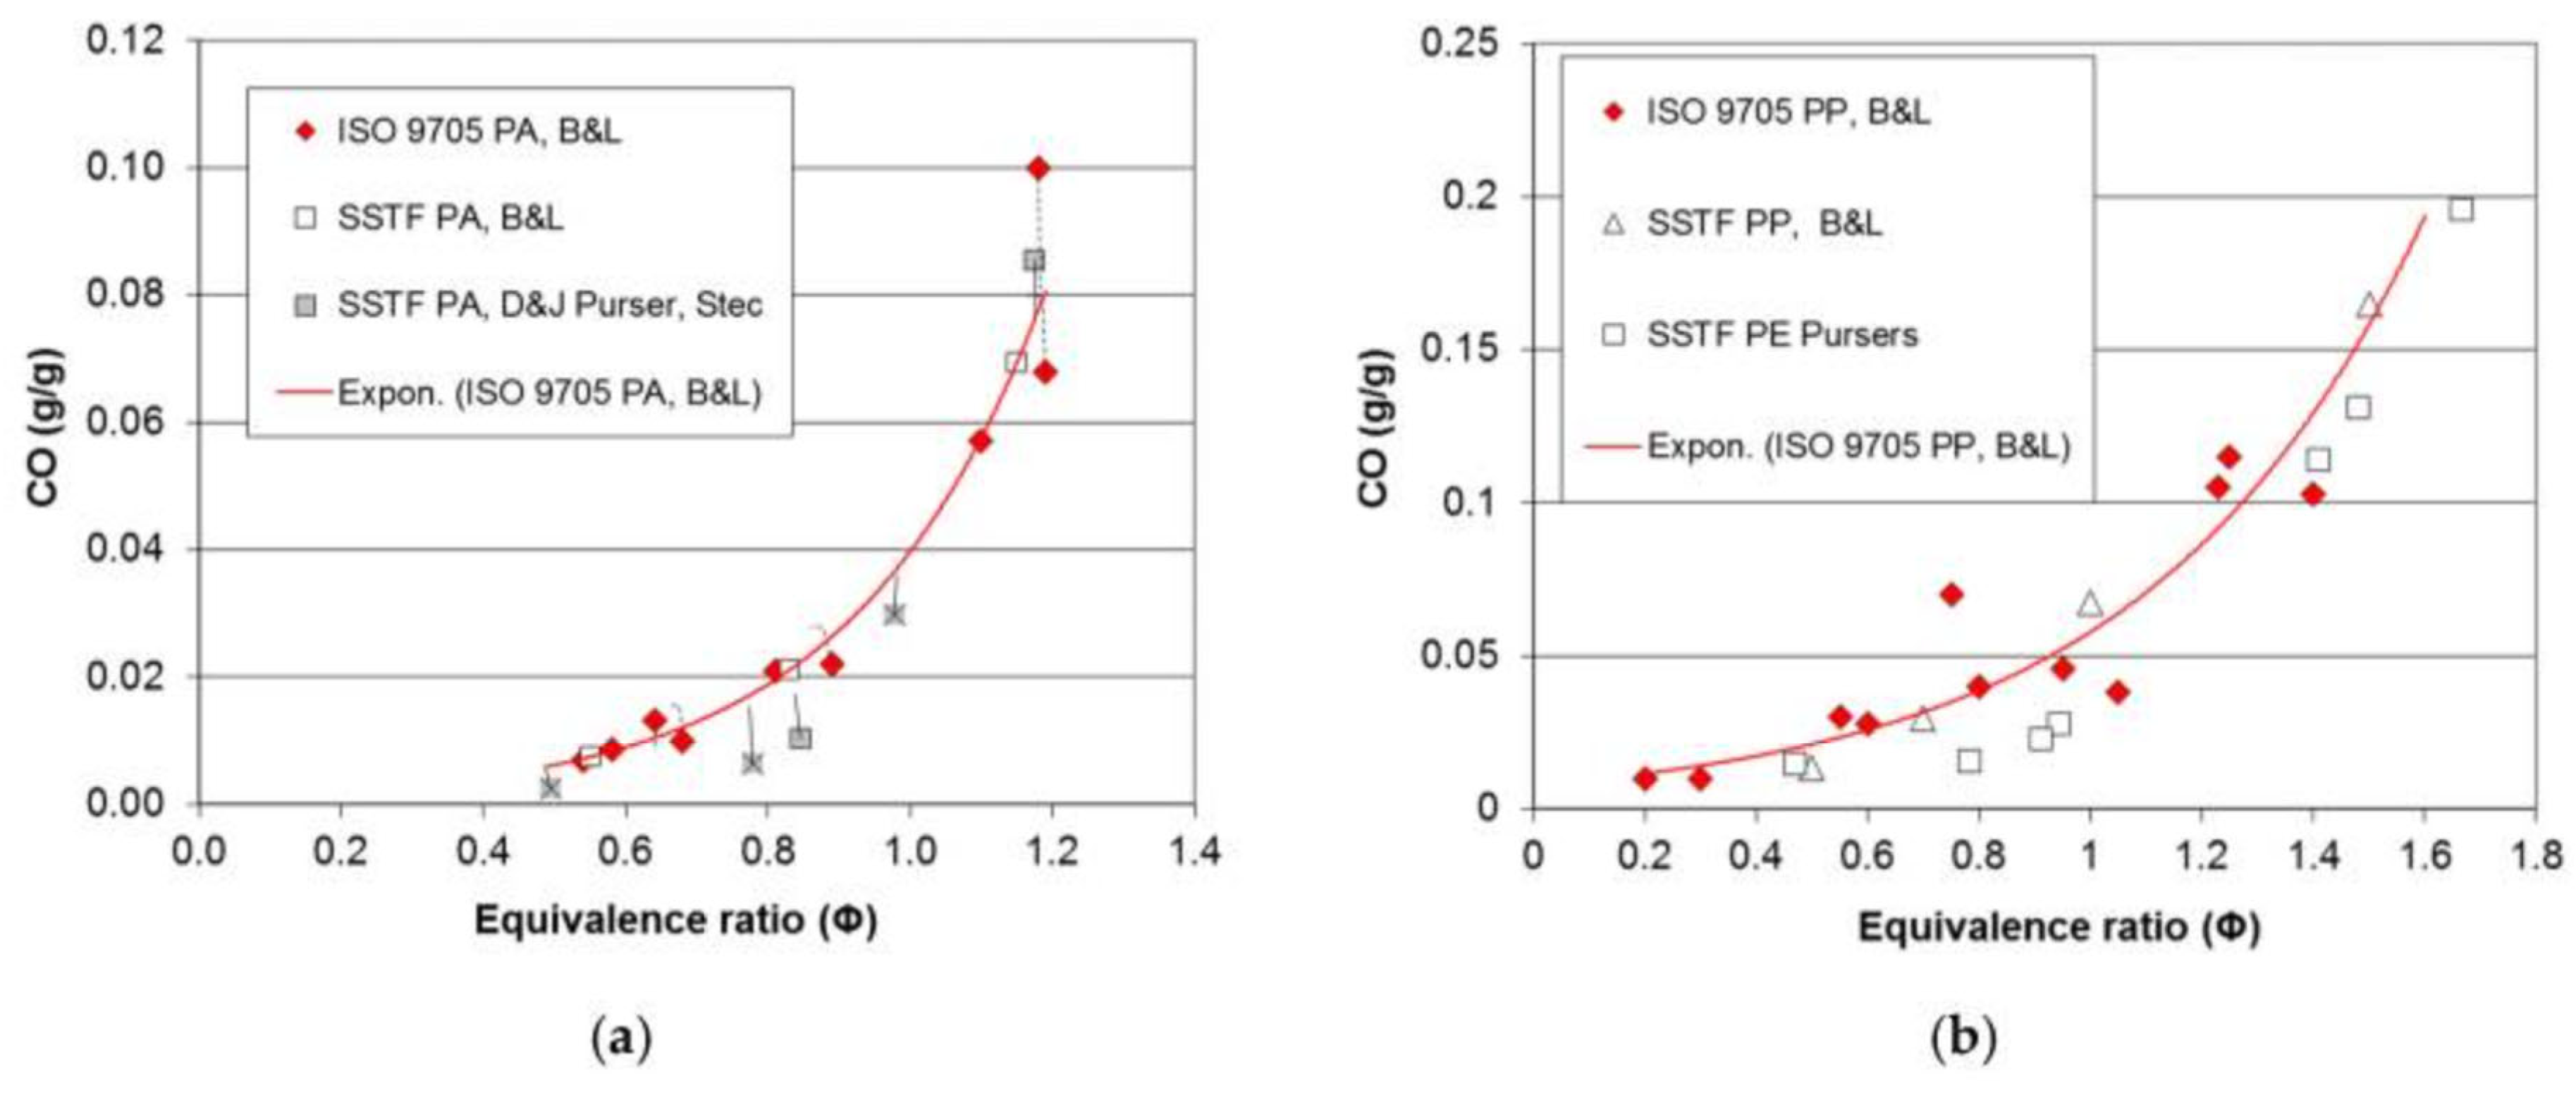
Figure 4 shows a comparison of CO yields as a function of the equivalence ratio using data taken from literature [12] and compared to bench-scale SSTF data [16], where points marked ‘X’ indicate PA6 was used. Graph a is shown using a least squares fit curve as a trendline.
At higher equivalence ratios, the SSTF data showed good agreement. At lower equivalence ratios, the SSTF under-predicts CO yield compared to the large-scale ISO room data. No data shown reached CO yields of 0.2 g/g, which would be expected of under-ventilated flaming conditions. Graph b shows more scattered data, however at lower equivalence ratios, the SSTF under-predicts CO yields. On few occasions the data shows good agreement, but overall the SSTF data compared shows under-predicted CO yields. On no occasion did the CO yields reach 0.2 g/g suggesting that while the calculated equivalence ratio was indicative of under-ventilated flaming, the CO yields were not. A further set of comparisons were made using other materials, such as wood, MDF and PIR.
However, the comparisons made in this paper have been presented after extreme statistical processing rather that using a direct comparison of gas yields as a function of equivalence ratio, as recommended in ISO 29903 [2]. This was likely done to present the data in such a way that the comparison seems representative, while discussing the statistical processing in a way that is irreproducible and difficult to follow. The report did not define the certain variables of the statistical functions or parameters used, or discuss the selection process for the statistical manipulations.
The comparison did not directly compare gas yields. For unknown reasons, the comparison shown in this paper used a least squares best fit curve to the compartment fire data set. A least squares best fit curve is used to find the best fitting curve to a given set of data points by minimising the sum of the squares of the offsets (the residuals) of the points from the curve created. The point of a bench-to-large-scale comparison study is to directly compare the toxicant yields as a function of equivalence ratio. If the data is in good agreement, there should be no need to fit curves to data points for direct comparison. To appropriately assess if the bench-scale data is representative of large-scale data, the absolute values should be presented.
Additionally, the comparison applied “best fit curves” that were “right shifted where appropriate to align with SSTF curves before measuring the deviations”. The shifts applied were not consistent and seemingly chosen at random. There was an equivalence max shift on MDF and PIR, PMMA had a 0.053 shift applied, wood had a 0.13 shift applied, and no shift was applied to PA66 or PP. The only reasoning for the adjustments is to adjust the data to more closely align and show better agreement.
In particular, the use of different functions for best fit curves for comparisons using the same toxicant for the basis of comparison is unnecessary, particularly as ISO 29903 requires a direct comparison to be made. An example of this is the studies use of a Weibull function on select data sets. A Weibull function is used when the data is a broad range of random variables, not for continuous interval data sets such as those used for comparison [23,24]. A Weibull function is only used on data comparisons when using extreme value theory. This is a branch of statistics used for extreme deviations [25], a direct contradiction to what the study claims. This is reinforced by the use of different expression functions on different materials, suggesting the functions were chosen to make the data appear less deviated and random. This may be why the study presented the values after processing rather than using a direct comparison.
While a bench-to-large-scale comparison has been made, it is unfortunate that the results presented were statistically processed and manipulated rather than directly compared.

Conclusions

There are few large-scale data sets available for comparison, and fewer bench-to-large scale comparison reports available for review. The few existing studies reviewed in this study show more guidance and data is needed, especially on a large-scale. Unfortunately, the data that is presented is done so in an inconsistent manner using various means of presentation, statistical analysis, and modelling that doesn’t show clear comparisons between bench and large scale. Future work should strive to transparently present the collected data, and follow the guidance of comparison in ISO 29903. The series of studies conducted by NIST have shown the need for the equivalence ratio to be adopted as the parameter of comparison between datasets, otherwise fire conditions are difficult to define and comparisons are challenging.
The equipment and methodologies for measuring smoke toxicity also need refinement. The CACC has been shown to need further method development in order to be able to produce data representative of large-scale fire behaviour, with under-ventilated test conditions proving difficult to achieve. The SSTF is commonly cited as a reproducible and accurate bench-scale method of measuring smoke toxicity [26]. However, comparative analysis has shown under-predicted CO yield data at lower equivalence ratios, and over-predicted CO yields at higher equivalence ratios. This suggests further research is required to produce a bench-scale test capable of reproducible data that is representative of large-scale fires. Currently, no bench-scale method shows good agreement with large-scale fire behaviour.
Overall, there is a need for more large-scale testing and data for direct comparisons to be made, which is difficult given the expense and complexity of performing such tests. Furthermore, the use of multiple apparatuses for bench-scale testing would be useful, enabling the best bench-scale method to be identified via a direct comparison. Before smoke toxicity can move forward as a field of research, the issues raised in this paper need to be addressed so that accurate, reliable measures can be taken using the well-defined methodology outlined in ISO 29903, thus making the smoke toxicity research more accessible to broader academic parties.

References

  1. International Standard Organisation (ISO). ISO 29903-1: Guidance for comparison of toxic gas data between different physical fire models and scales (2012).
  2. BS ISO 29903:2012. Guidance for comparison of toxic gas data between different physical fire models and scales.
  3. European Commission. Guidance Paper G: The European Classification System for the Reaction to Fire Performance of Construction Products (2003), European Commission enterprise directorate-general.
  4. ISO 16312-1:2016 Guidance for assessing the validity of physical fire models for obtaining fire effluent toxicity data for fire hazard and risk assessment.
  5. Liu. X., Hao. J., Gaan. S. Recent studies on the decomposition and strategies of smoke and toxicity suppression of polyurethane based materials (2016), Royal Society of Chemistry Advances (22), pp. 74742-74756. [CrossRef]
  6. Hull. T. R., Paul. K. T., Stec. A. A. Hydrogen chloride in fires (2008). Fire Safety Science- Proceedings of the ninth international symposium, pp. 665-676. [CrossRef]
  7. Marsh. N. D., Gann. R. G. NIST Technical note 1760: Smoke Component Yields from Bench-scale Fire Tests: 1. NFPA 269/ ASTM EN 1678 (2013), NIST Fire Research Division Engineering Laboratory, pp 1-57.
  8. Marsh. N. D., Gann. R. G. NIST Technical note 1761: Smoke component yields from bench-scale fire tests: 2. ISO 19700 Controlled Equivalence ratio tube furnace (2013), NIST Fire Research Division Engineering Laboratory, pp. 1-45.
  9. Marsh. N. D., Gann. R. G. NIST Technical note 1762: Smoke Component yields from bench-scale fire tests: 3. ISO 5660-1 /ASTM E 1354 with Enclosure and variable oxygen concentration (2013), NIST Fire Research Division Engineering Laboratory, pp. 1-37.
  10. Marsh. N. D., Gann. R. G. NIST Technical note 1763: Smoke Component yields from bench-scale fire tests: 4. Comparison with room fire results (2013), NIST Fire Research Division Engineering Laboratory, pp. 1-35.
  11. Blomqvist. P., Sandinge. A. Experimental evaluation of fire toxicity test methods (2018), Research Institute of Sweden, Safety and transport fire research, pp. 1-134.
  12. Blomqvist. P., Lonnermark. A., Mansson. M., Persson. J. TOXFIRE- Fire characteristics and smoke gas analysis in under-ventilated large-scale combustion experiments (1996), SP Swedish National Testing and Research institute, SP report 1996;45.
  13. Babrauskas. V., Parker. W. J., Mulholand. G., Twilley. W. H., The phi meter: A simple, fuel-dependant instrument for monitoring combustion equivalence ratio (1994), Review of Scientific Instruments (65), 7, pp. 2367-2375. [CrossRef]
  14. Hull. T. R., Purser. D. A., Stec. A. A. Fire toxicity assessment: Comparison of asphyxiant yields from laboratory and large-scale flaming fires (2014), Fire Safety Science (11). [CrossRef]
  15. Blomqvist, P., Hertzberg, T. and Tuovinen, H. A small-scale controlled equivalence ratio tube furnace method – Experience of the method and link to large-scale fires (2007), Proceedings of the 11th International Interflam Conference, Interscience Communications Ltd., London, pp. 391-402.
  16. Stec, A. A., Hull, T. R., Lebek, K., Purser, J. A., and Purser, D. A. The effect of temperature and ventilation condition on the toxic product yields from burning polymers (2008), Fire and Materials (32), pp. 49-60. [CrossRef]
  17. Blomqvist. P., Sandinge. A. Experimental evaluation of fire toxicity test methods (2018), Research Institute of Sweden, Safety and transport fire research, pp. 1-134.
  18. Purser. D. A. Toxic combustion product yields as a function of equivalence ratio and flame retardants in under-ventilated fires: Bench-Larg-Scale comparisons (2016), Polymers (Basel) 8 (9), pp. 330. [CrossRef]
  19. Purser J.A., Purser D.A., Stec A.A., Moffat C., Hull T.R., Su J.Z., Bijloos M., Blomqvist P. Repeatability and reproducibility of the ISO/TS 19700 steady state tube furnace. Fire Saf. J. 2013;55:22–34. [CrossRef]
  20. Stec A.A., Hull T.R., Lebeck K., Purser J.A., Purser D.A. The effect of temperature and ventilation condition on the toxic product yields from burning polymers. Fire Mater. 2008;32:49–60. [CrossRef]
  21. Purser D.A., Purser J.A. HCN yields and fate of fuel nitrogen for materials under different combustion conditions in the ISO 19700 tube furnace. In: Karlsson B., editor. Fire Safety Science, Proceedings of the Ninth International Symposium; Karlsruhe, Germany. 21–26 September 2008; Greenwich, UK: International Association for Fire Safety Science; 2008. pp. 1117–1128.
  22. Purser D.A., Purser J.A. The Potential for Including Fire Chemistry and Toxicity in Fire Safety Engineering. Building Research Establishment Ltd.; Watford, UK: Mar 23, 2003. Project Report 202804.
  23. Murthy. D.P., Xie. M. and Jiang. R. Weibull models (2004), John Wiley & Sons.
  24. Luko. S.N. A review of the Weibull distribution and selected engineering applications (1999), SAE transactions, pp.398-412. [CrossRef]
  25. Gorgoso-Varela. J.J. and Rojo-Alboreca. A. Use of Gumbel and Weibull functions to model extreme values of diameter distributions in forest stands (2014), Annals of forest science, 71(7), pp.741-750. [CrossRef]
  26. Purser. J. A., Purser. D. A., et al. Repeatability and reproducibility of the ISO/TS 19700 steady state tube furnace (2013), Fire Safety Journal (55), pp. 22-34. [CrossRef]
Figure 1. Comparisons of CO yield as a function of equivalence ratio from bench-scale tests and large-scale tests [14].
Preprints 91591 g001
Figure 2. Comparison of HCN yields as a function of equivalence ratio produced by: SSTF and CACC with ISO room data.
Preprints 91591 g002
Figure 3. Comparison of NOx and HCN yields produced by the SSTF and ISO room test as a function of equivalence ratio.
Preprints 91591 g003
Figure 4. A comparison of SSTF data and large-scale test data obtained from literature, where graph (a) shows a comparison of PP, PA6.6 and PA6 (indicted by ‘x’), and graph (b) shows a comparison of pool fires using LDPE and PP [18].
Preprints 91591 g004
Table 1. Summary of results reported from SDC tests used for comparison in NIST technical note 1763.
Material Condition CO2 yield g/g CO yield g/g HCL yield g/g HCN yield g/g
Bookcase 50 kWm- [2] unpiloted ignition 0.2 7.3 x10- [2] <5x10- [4] <6x10- [4]
50 kWm- [2] piloted ignition 1.06 <4 x10- [4] <5x10- [4] <6x10- [4]
25 kWm- [2] piloted ignition No data reported
Sofa 50 kWm- [2] unpiloted ignition 1.65 1.9 x10- [2] < 3 x10- [3] < 4 x10- [3]
50 kWm- [2] piloted ignition 1.33 6.6 x10- [3] < 3 x10- [3] < 4 x10- [3]
25 kWm- [2] piloted ignition 1.76 4.3 x10- [3]- < 4 x10- [3] < 6 x10- [3]
Cables 50 kWm- [2] unpiloted ignition 1.12 3.0 x10- [2] 0.18 < 2 x10- [3]
50 kWm- [2] piloted ignition 1.18 2.8 x10- [2]- 0.05 < 2 x10- [3]
25 kWm- [2] piloted ignition 0.77 1.2 x10- [2] 0.10 < 3 x10- [3]
Disclaimer/Publisher’s Note: The statements, opinions and data contained in all publications are solely those of the individual author(s) and contributor(s) and not of MDPI and/or the editor(s). MDPI and/or the editor(s) disclaim responsibility for any injury to people or property resulting from any ideas, methods, instructions or products referred to in the content.
Copyright: This open access article is published under a Creative Commons CC BY 4.0 license, which permit the free download, distribution, and reuse, provided that the author and preprint are cited in any reuse.
Prerpints.org logo

Preprints.org is a free preprint server supported by MDPI in Basel, Switzerland.

Subscribe

© 2024 MDPI (Basel, Switzerland) unless otherwise stated