
Submitted:
28 November 2023
Posted:
30 November 2023
You are already at the latest version
Abstract
Land-use planning plays an important role in agricultural development, however it lacks tools to support planner in proposing land-use planning solutions especially, under saltwater intrusion condition in the coastal regions. This study aims to apply optimization in analyzing land-use solutions for agricultural land-use planning. In which a multi-objective optimization model is developed to optimize land-use area including land-use allocation taking into account socio-economic and environmental factors. The model has been applied in three districts of Soc Trang province, Vietnam (Long Phu, My Xuyen and Tran De) representing three ecological regions including salt water, brackish water and freshwater in the Mekong Delta of Vietnam. The results showed that two multi-objective optimization scenarios (in terms of profit, labor, environment benefits and risk reduction) have been implemented: (i) Multi-objective optimization of agricultural land-use until 2030 under normal conditions; (ii) Optimizing agricultural land-use until 2030 under climate change conditions similar to the 2016 drought and saltwater intrusion phenomenon in the Mekong Delta. The results showed that the second scenario is the option considered for implementing land-use plan thanks to the balance between good profits and minimizing economic and environmental risk. The land allocation was carried out taking into account household economic, the influence of adjacent production types, local traffic and canal systems factors to allocate optimal land-use areas. The combination of land-use optimization and spatial allocation process can help planners improve the quality of agricultural land-use planning.
Keywords:
multi-objective optimization
; land-use
; land-use allocation
; saltwater intrusion
; Mekong Delta
; Soc Trang
1. Introduction
The Mekong Delta is the largest food production region of Vietnam, accounting for 55.7% of Vietnam's rice output [1]. However, climate change and sea level rise are reported to have a significant influence on agricultural land usage [2,3]. People are still poor and vulnerable to climate change and sea level rise [2,4]. Many authors evaluate the types of land-use that can help reducing risks under extreme weather or climate change, such as the rice-shrimp cultivation in brackish coastal water areas [5], rice-vegetables for freshwater ecological zones for its ability to adapt to climate change in the context of freshwater scarcity due to saline intrusion [6,7]. However, the rice-shrimp area is decreasing because farmers pursue profits in converting to shrimp without paying attention to the environment [8], and at the same time, rice-vegetables faces difficulties in determining growing areas and financial capacity [9]. This presents managers with the challenge of developing profitable agricultural land-use options while minimizing costs, hazards, and environmental impacts.
For agricultural land-use planning, plans are developed based on FAO's guiding process [10]. In which, land suitability evaluation methods is used to the selection of suitable agricultural land-use types to determine suitable regions for land units [11]. Then, it is needed to do alternative assessment on socio-economic to optimize land-use options [12] but there is still lack of tools to support planners in developing countries [13].
Furthermore, the linear programming method has been used with GIS to optimize land use to maximize profit with constraint of capital, labors, productions and ecological restrictions [14,15]. Multi-objective optimization studies such as cost minimization combined with maximum area of usage [16] are used in a multi-objective environment. Or a combination of LULC prediction and allocation to minimize surface runoff for flood mitigation under dry, normal, and wet years to increase environmental benefits [17]. To compute the optimal area of dominating uses across the entire research region, some studies employed linear maximization or neuron networks [18].
For related studies in the Mekong Delta, recent optimality studies have used the optimization approaches for land-unit based [11]. In particular, appropriate optimal objectives such as maximizing profits, labor, costs, capital use efficiency and land suitability have been established on each land-unit [19,20]. The advantage of these studies is to propose optimal areas for agricultural land-use types (LUT) based on socio-economic and environmental constraints on the characteristics of each land unit instead of the whole area. But these studies lack land-use allocation tools to help users arrange land use types on the map. Besides, establishing mathematical models is a big challenge for managers who have no background in informatics.
Regarding land-use allocation, many land allocation methods have been used including full land-unit allocation [19,20], pixel based allocated using models (CLUE-S [21], CLUMondo), using Cellular Automata (CA) analysis [22]. Many studies use the CLUE-S model to distribute land layout, in which the optimized area of land use types is the input requirement of CLUE-S [23,17,18] or CLUMondo [24]. Some studies have used separate models to solve the problem of spatial arrangement of urban land use while taking infrastructure into account.
These previous optimization studies have helped planners make land use decisions. However, studies have not quantified and included impact factors such as risks in implementing land use types, investment capabilities of land use types under different conditions. Other factors include road and water supply development, the poverty rate in the area and the influence of urban areas did not consider land allocation land in developing areas. Given the current situation, it is necessary to conduct a study to propose the optimal use of land for agricultural production in order to meet the desires of local farmers to increase their income and to support the work of agricultural land planning by local government, as well as to construct a system of land-use arrangement for agricultural production that takes into account the socio-economic factors in the local area that affect the spatial arrangement of agricultural land-use types. The objective of this study is to create a model that provides tools to assist planners in maximizing agricultural land-use solutions and spatial distribution of these plans. The new model takes not only socio-economic and environmental factors but also reducing risk of implementation and effect of environment.
2. Materials and Methods
2.1. Study area
Soc Trang province is located in the Mekong Delta at the southern mouth of the Hau River, about 60 kilometers from Can Tho. It shares borders with Hau Giang, Tra Vinh, Bac Lieu, and the East Sea. Soc Trang province has 11 administrative units in 2023, including Soc Trang city, Vinh Chau town, Nga Nam town, and 8 districts (Ke Sach, My Tu, Cu Lao Dung, Long Phu, My Xuyen, Thanh Tri, Chau Thanh and Tran De). The study area was chosen based on contiguous districts with ecological characteristics of fresh, brackish, and saline water. This helps with the mapping of specific land-uses for these ecoregions.
The study area consists of three districts in Soc Trang province, based on the criteria chosen: My Xuyen, Long Phu, and Tran De (Figure 1). Long Phu, in particular, is in a freshwater area but is vulnerable to saline intrusion during extreme weather events (such as the 2016 drought and saline intrusion); My Xuyen is in a brackish water region; and Tran De is divided into two areas: the saline area outside the dike systems at the river's mouth and the freshwater area inside the dike systems.
The statistics from 2010 to 2018 of all three districts are shown below to analyze changes in the area of rice cultivation over time as a basis for predicting the area for specialized cultivation, fruit trees, and aquaculture as illustrated in Figure 2. Specifically, the districts' cultivated area only focuses on producing two rice crops, the summer-autumn crop spanning a large area of cultivation. The data shows the total area of rice cultivated in the year.
Figure 2 also depicts the cultivated area of vegetables, fruit trees, and aquaculture in the districts of Long Phu, Tran De, and My Xuyen from 2010 to 2021. In general, the area of vegetables and crops has fluctuated, but there has been a consistent increase in recent years. In contrast, the area of Fruit trees varies the least, ranging from 8,546 ha to 8,938 ha. From 2010 to 2021, the aquaculture sector in particular grew steadily.
2.2. Data collection
Based on research of Lambin and Geist [25], the previous studies and Vietnamese works, the factors influencing land-use type selection were chosen from similar studies in the Mekong Delta, Vietnam as in Table 1. Economic variables such as profit and market demand are the elements influencing the area of relevant land-use types. The component of investment capital and household capital indicate whether or not the household has the ability to arrange various types of land-use. Many studies have examined how social factors like labor, educational level, and infrastructure issues influence land use. To examine the possibilities of choosing land-use, natural conditions of soil, water, environmental benefit and risk of land-use were surveyed.
The field survey was conducted in four communes of three districts with 150 typical farmers. Individual interviews were conducted with advanced local farmers who had at least ten years of farming experience in the study area. The questionnaire was designed to collect data on household characteristics related to profitability, total cost, profits, labor demand, environmental benefits, and risk of LUTs for each land-use type (LUT). People evaluated that their LUT had a positive impact on improving the quality of the environment, and the risks of LUT were divided into four levels (high, medium, low, and no risk), corresponding to the percentage of farmers self-assessing the level of risk in agriculture production. The following data was encoded and descriptively statistically analyzed using Microsoft Excel software as the input data source of the model.
Besides, the maps of soil types, depth of alum formation, water salinity and duration of water salinity in 2015 were obtained from the Department of Agriculture and Rural Development of Soc Trang province for performing the land evaluation. The study area's land use map in 2015, as well as the saline intrusion maps in 2010 and 2015, were analyzed using data from the Department of Natural Resources and Environment.
2.3. Land-use optimization and allocation
The mathematical model was built up of three blocks as shown in Figure 3. In which, the first section specifies the input data source, which includes economic, social, and environmental data; the second block contains the module for optimizing agricultural land area (Land Optimization Module); and the third block contains the module for spatial allocation for land use types (Land Allocation Module).
The model's input data sources include socioeconomic and spatial data, in which socio-economic data contains information gathered during the economic research of land use types, such as costs, profits, working days, and people's perceptions of the environmental advantages and risks of land use. Base map layers (such as soil, acid sulfate, salinity, and fresh water supply layers) were included in spatial data. To build a land unit map, these maps were overplayed using the Union method according to FAO [11]. Other types of spatial data include infrastructure map layers for analyzing appropriate locations of use types (roads, canals).
The land-use area optimization stated in block 2 (Figure 3) employs the linear programing method to determine the area of use types in each land unit with the best objective function for profit maximization or multi-objective optimization. This module was created by using the Visual Basic.NET programming language and the LPSolve API function [34]. Section 2.3.1 defines the objective function and constraint equations in detail. This module produces a CSV file that describes the optimized area of each land-use type for each land unit.
The land allocation step is presented in block 3 of Figure 3, this step is built according to the grid layout method on GAMA platform software [35]. In which, the output area of the optimized step is used as the land-use requirement condition of this module. The procedure for allocating the required area for each land unit is summarized as follows: First, a temporary land use type is assigned to the cells within the same land unit. For a land unit allocated for only one land use type, the land arrangement is completed. For land units allocated for multiple uses, the temporarily allocated step assign all of its cells with a non-priority land use type as a based map (it means the allocated area greater than the requirement). These cells are noted by unallocated label. Next, each unallocated cell is calculated the appropriate indices for the land use types including LUT density, distance to canal (IC), distance to traffic (ID) and the ability to arrange each LUT (Icap_LUT). Continually, the iterative process for each land-use type to sort cells which Icap_LUT in descending order and set the land-use types for these cells. The output of the integrated system is a map of land use options arranged according to the required area and with the appropriate spatial location according to the requirements of the type of use.
2.3.1. Optimization objectives functions
The function of maximum land suitability (Equation 1), profit maximization (Equation 2), and maximum linear objectives of number of local labor used, environmental benefit rate, minimizing risk (Equation 3) are set as the options to optimize the area of land use types for each land unit in this study.
where:
i ∈ [1, n], n: number of land mapping units; j ∈ [1, m], with m: number of LUTs
Xij: Area of LUTj in land unit i . Pij: Profit of LUTj in land mapping unit i (unit: million VND / ha).
Sij: Land suitability of LUT j in land unit i (values).
Lj: the number of working days of LUTj per hectare.
Ej: Environmental benefit coefficient of LUT j. Farmer’s assessments of environmental benefits of LUTs.
Rj: Risk coefficient of LUTj. This is the LUTj productivity risk indicator. The smaller the risk value gave greater contribution to the goal function.
Wi: The weight of the objectives. In this study, the assumption of equal-weighted goals is set by default to 1 with the meaning that the goals in the multi-objective function have the same priority. These weights can be adjusted (from 0 to 1) depending on the priority of the local goals for the local development orientation.
2.3.2. Constraint equations
The objective function is constrained by a set of equations that includes the area of land units, the total number of working days, the total production or the minimum and maximum area of LUTs.
For each land mapping unit (LMU), the total area of LUT within the LMU should less than the area of the LMU, i ∈ [1, n]:
The total labor demand of the LUTs cannot exceed the local agricultural labor resources.
The minimum of each agricultural product to supply (the set of equation 6)
Yj: Yield of LUTs that provide the product k,
The maximum of each agricultural product to supply
Total area of LUTj <= Total limited area of LUTj.
2.3.3. Land-use allocation
After determining the optimal area of each land-use type (LUT) per each land unit, we proposed a detailed land-use allocation within each land unit. In particular, land-use types are arranged into the cells inside a land unit map by the Cellular Automata method and multi-criteria assessment based on natural, socio-economic and environment factors.
The allocation capability index for a LUT of a pixel Icap_LUT(i) was determined by the formula (9). A LUT was assigned into a cell when it had the highest value of Icap_LUT. In case there are many LUTs with the same value of Icap_LUT, the LUT was randomly selected from these LUTs.
In which:
The distance index from a cell to the nearest road (IR) and canal (IC) is calculated by the shortest distance from the position of each cell to the nearest road (canal). Distance values were also normalized to the range [0, 1] (Equations 10 and 11).
Density of land-use type in neighborhood of a cell (ID) is determined by counting the number of neighborhood cells of each land-use types divided by 8.
he investment priority index (II) represents the pixel located in the municipalities with a high priority for investment: The commune group assigned values to this index. Communes are divided into three groups based on their level of achievement of New Rural Construction Standards (NRS) in Vietnam; the commune group is then standardized into three values [1; 0.5; 0].
WR, WC, WD, WI in the Equation 9 are the weights for IR, IC, ID, II. By default, these weights are set to 1. In the application scenario, the weights were modified by experimenting with different weight combinations in the layout and comparing the results to the historical map.
3. Results
3.1. Analysis of economic factors affecting agricultural land-use
3.1.1. Dominant agricultural land-use types
The agricultural land-use types (LUTs) chosen for research in this study include those employed for freshwater, brackish, and saline ecological zones where the LUTs were chosen based on land-use dominance in the Mekong Delta region. Prospective LUTs in three districts include: Three rice crops, two rice crops, rice – vegetables (2 rice and one vegetable crop), rice – shrimp, annual crops (2–3 vegetable crops), fruit trees and shrimp.
3.1.2. Socio-economic and environmental factors
Table 2 showed that there was a huge difference in profits, especially between LUT7 (VND 277.23 million) and LUT2 (only about VND 42.42 million). However, in order to be able to implement LUT7, it is necessary to have not only capital but also intensive farming techniques as well as natural suitability conditions.
The results of the survey for the number of laborers for each agricultural land-use type per year. Among them, vegetables needed the highest number of working days, followed by shrimp, which farmers have to take care of all year. Two rice crops – vegetable and fruit have the same number of working days, equivalent to 115 and 121 days per hectare per year, respectively.
Risk factors include more or less uncertainty about yields, prices, and weather risks. Table 2 shows that people rated the riskiest form of shrimp farming 4.24 out of 5.0 in production. In contrast, most people think of using 2 rice crops or 2 rice crops - low-risk or no-risk crops with 2.62 and 2.51 respectively. In the case of fruits and vegetables, the risk is assessed to be quite high (3.36 and 3.62) as farming is market-dependent and yield and weather generally do not affect these LUTs.
In terms of the environment, the analysis results show that 2 rice crops, Rice - vegetable, and rice-shrimp are environmentally beneficial LUTs, with evaluated scores of 4.22, 4.02, and 3.96 respectively. Shrimp, annual crops, and three rice crops, on the other hand, were rated as bad for the environment (with scores of 3.16, 3.18, and 3.27, respectively). Among the LUTs, upland crops and shrimp showed the highest rates of negative environmental impact where Fruit trees receive only 3.42 points. The outcomes of these assessments will be normalized to use the values of the LUTs' respective variables.
In Vietnam, the criteria for classifying new rural commune standard include many significant variables such as household income, commune poverty rate, which can be used to reflect commune investment level and household investment aptitude. The results of establishing new rural communes (NRC) were used to assign investment ability indicators as a qualitative element influencing agricultural land-use allocation. The communes' investment ability was classified into three groups based on their revenue and poverty rates: Group 1 consists of communes that meet NRC standards; Group 2 consists of communes that do not reach NRC standards but have a per capita income of 20-28 million VND and a poverty rate of less than 6%; and Group 3 consists of the other communes (Table 3).
According to the survey results, local agricultural production was experiencing issues such as: (i) water supply and drainage due to distance from canals, (ii) difficulty transporting materials and travel due to narrow or unpaved roads, and (iii) affecting farming practices due to saline leakage from shrimp ponds to rice fields. Apart from natural factors such as land and water, individuals still encountered difficulties in manufacturing owing to a lack of energy or poor equipment functioning, impacting production efficiency.
Figure 4.
Infrastructure requirements of LUTs.
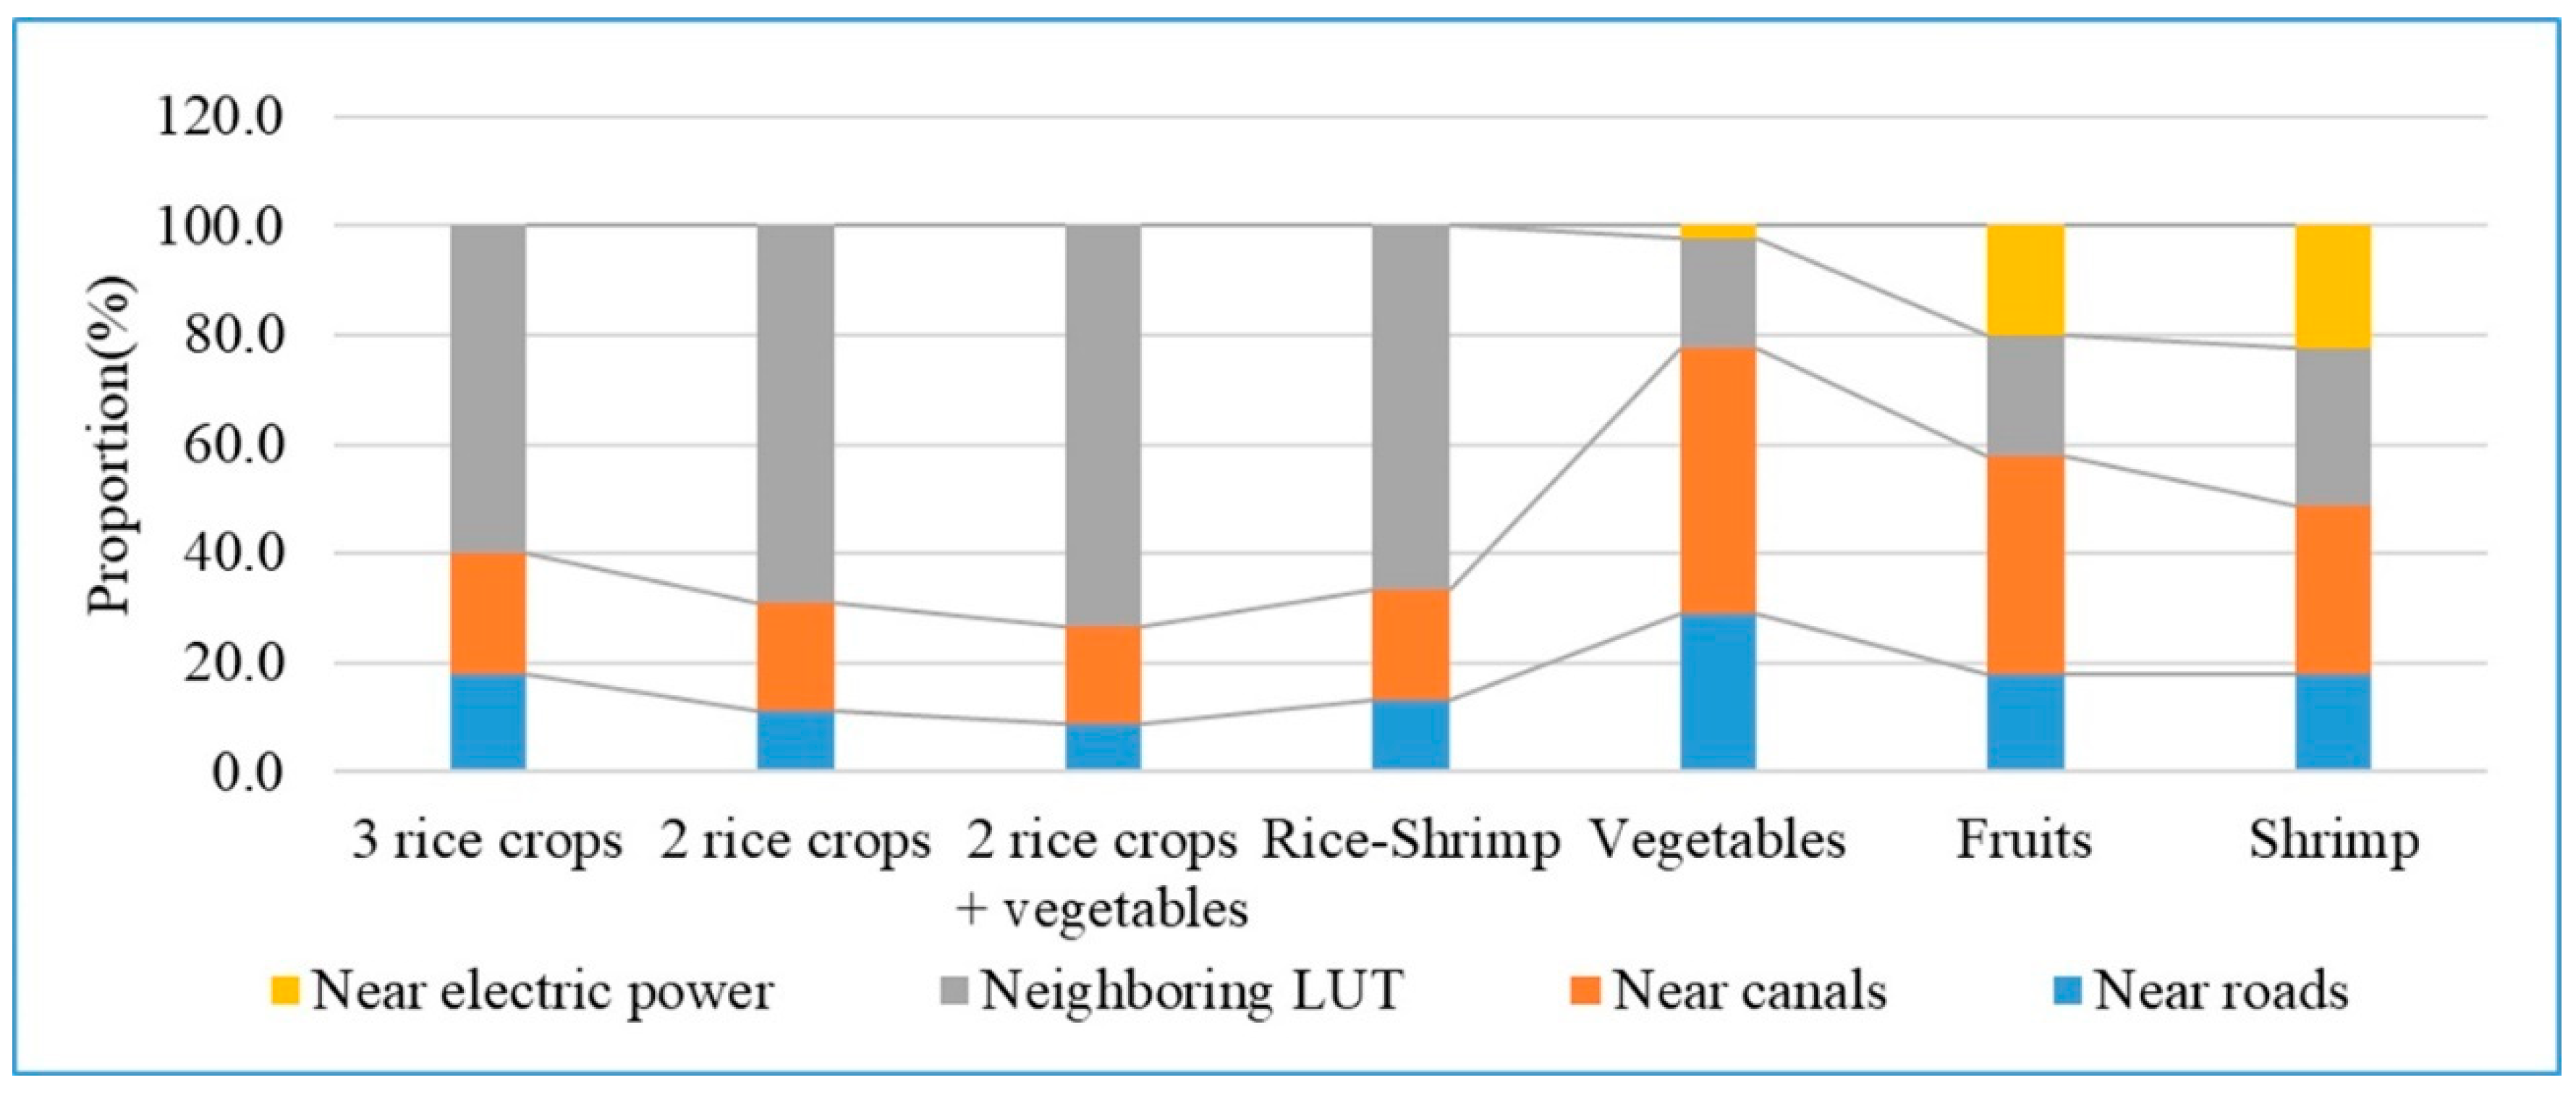
The three LUTs influenced by neighbor land-uses are two rice crops, three rice crops, and rice-shrimp. If nearby homes raise shrimp or keep salt water in the pond, neighboring rice-growing households will be unable to cultivate or will obtain low yields. The most important priority for shrimp and fruit farming was a strong electric power source to operate machinery, followed by the need to be positioned near a road and the effect of neighboring LUTs. In reality, if they wish to cultivate aquaculture items, the nearby homes must also cultivate in the same manner, resulting in great efficiency. Approximately 20% of respondents agreed that vegetables and fruits should be grown near rivers and canals. However, due to farmer agricultural practices, vegetables and fruit have to be positioned near the road.
Based on the specific socioeconomic characteristics in previous studies that had varying effects on land-use selection, the factors have graded as in Table 4 and separated into two groups: the group of factors influencing land-use type selection and the one influencing spatial layout. Each element was thought to serve a single function: optimizing land-use and allocating agricultural land-use.
Factors such as land suitability, profitability, number of labor-days, risk level, and environmental benefit were employed in the optimization module. These elements were classified as either single-target or aggregated socio-economic goals.
Factors influencing agricultural land-use allocation include investment capacity, transportation infrastructure, canals, and the needs of surrounding LUTs. The LUTs were ordered in order according on the survey results, which were assessed and taken into account in the land layout. When compared to other land-use types, the combined data reveal that LUT 7 (Shrimp) and LUT 6 (Fruit trees) are prioritized to be located near roads, canals, and rivers, where investment is viable. This functionality was thought about for two locations: Shrimp was prioritized for brackish areas to be arranged in priority places, near highways, canals, and rivers, and in areas with investment potential, then it gradually moved out, followed by rice-shrimp arrangements. Vegetables and fruit trees were prioritized for planting near watery bodies.
3.2. Application of integrated systems in Soc Trang province
3.2.1. Land evaluation
Land mapping unit (LMU) maps were created by utilizing the Union technique to analyze maps such as soil, depth to the acid sulfate soil (ASS) happened, water salinity, and water salinity duration maps of three districts in Soc Trang province (Long Phu, Tran De, and My Xuyen). The districts' LMU map was divided into 28 LMUs as in Figure 5.
Table 5 shows the detailed attributes of the units. In which, the unit 14 has the largest land area (18,586.90 ha) in My Xuyen district, with soil characteristics of Fluvisols soil type, depth acid sulfate soil layer showing less than 50cm, salinity 8 -12‰, and salinity period of 6 months each year. There are two large-scale land units in Tran De district: unit 3 and unit 6, which have areas of 16,996.50ha and 10,047.49ha, respectively. These are low salinity land units since they are located inside of the dyke and are supplied with fresh water via the canal system, but irrigation capacity can only cover the needs of two crops.
In addition, the results of the adaptive classification for 7 land use types across 28 land units are also shown in Table 5. FAO (1976) adaptation levels are classified according to the levels of S1, S2, S3 and N which correspond to highly suitable, moderately suitable, marginally suitable, and non- suitable. These values are normalized to 1, 0.67, 0.33 and 0 for the optimization model.
3.2.2. Configuring optimization scenarios
The optimization scenarios were set to optimize the agricultural land area of the three districts until 2030 with socio-economic and environmental changes.
Scenario 1: Optimizing agricultural land until 2030 under normal conditions. This scenario was designed to determine the optimal land area and land allocation for agricultural production under actual natural conditions and socio-economic development until 2030.
Scenario 2: Optimizing agricultural land to 2030 under conditions of environmental and climate changes similar to the drought and salinity intrusion phenomenon in 2016 and 2020 in the Mekong Delta. It was recommended by authorities that farmers reduce three rice crop areas. Thus, this scenario is to explain when the three-rice-crop area is recommended not to be used as before, which LUT needs to be used to replace it.
For each scenario, there were 3 alternatives were analyzed: Optimizing land suitability level, optimizing profits, and optimizing multiple objectives (profits, labor, risks, and environmental benefit). Regarding the limited areas of the LUTs in the scenarios, the minimum and maximum thresholds of the LUT’s area were defined in Table 6. In the optimization model, the unlimited represented by a constant number (1,000,000 ha). It is a number greater than the study area.
3.2.3. Exploring weights of the multi-objective land optimization module
The weight of the objectives was set by default in the two scenarios to 1, which indicates that the weights are equal. The Land Optimization module provides functionality that allows users to automatically search for target weights based on historical land use, with each set of target weights showing the total area for each land use type to compare with the statistical area. From there, determine the appropriate set of weights for the local objectives.
The objective parameters of the optimization were explored by combining 3 target parameters (W1, W2, and W3). In which profit parameter (W1) that can receive from 0.1 to 0.8; W2 from 0.1 to 0.9; W1 and W3 are the compensation for the two first parameters. The explored result of 36 sets of parameters showed that the weights W1 = 0.4, W2 = 0.2, and W3 = 0.4 were selected to develop multi-objective agricultural land-use optimization for two scenarios.
3.2.4. Optimizing agricultural land-use area
Figure 6 depicts the results of the optimization of the area of LUTs under Scenario 1, in which the land use distribution maps of the three options were analyzed, including adaptation level optimization (Figure 6a), optimal Profit maximization (Figure 6b), and optimization of the combined socio-economic and environmental goals (Figure 6c). In such case, the map of option 1 (Figure 6a) differs significantly from the other two options (Figure 6b and Figure 6c), which are mostly represented by the amount of rice-crop land and shrimp farming land. The distribution of crop rice in Option 1 is concentrated in the northern part of Long Phu district while for the other 2 options, the area for crop rice is arranged further along the road in Tran De district. For shrimp farming land, the maps of options 2 and 3 both show the same arrangement in My Xuyen districts (western part of the maps).
A more extensive analysis of the area of scenario 1 (Figure 6d) reveals that three rice crops (LUT1) and fruit trees (LUT6) have comparable distribution areas due to area requirements in the three alternatives. However, the area of the two rice crops (LUT2) and rice-shrimp crops (LUT4) in the option 1 is more than that of the other two options, totaling more than 10,000 hectares for each kind due to the high land suitability but poor lucrative use patterns. In contrast, the amount of rice-crop land (LUT3) is less than 10,000 ha smaller than the other two alternatives due to limited adaptability but high profit. The remaining land use types of the two alternatives have similar areas, although the size of LUT2 and LUT5 of option 1 is 400ha and 550ha larger, respectively, than that of option 2. Option 1's LUT2 analysis is superior to that of Option 2. The results reveal that option 3 has several advantages in terms of the environment and risk limits of option 1, as well as the profit advantages of option 2.
For scenario 2, under the conditions of environmental change due to climate change, the results of analysis of 3 land-use options in 2030 are shown in Figure 7. Regarding the maps of the 3 alternatives, the map in Figure 7a gives similar results to Figure 6a and has a difference compared to the other 2 options (Figure 7b and Figure 7c). The remaining two optimization options show that the layout of shrimp land is similar to each other. However, the area and arrangement of rice-crop land (LUT3) are different. Option 2 focuses on arranging rice-vegetable crops in Tran De district while Option 3 focuses on arranging this type in Long Phu district. The reason for the different spatial arrangement of LUT 3 while having the same required area is because the land units arranged for 2-rice crop land of option 3 are higher while the area for growing vegetables is less than the one in Option 2.
Areas of land use types of the 3 alternatives of scenario 2 are shown in Figure 7d. In which, 3-crop rice is no longer arranged in all 3 options. The two-crop rice area of option 1 is significantly higher than that of the other two options because this difference is allocated to rice-vegetable cultivation. Similarly, the rice-shrimp area of 2 options 2 and 3 of scenario 2 is much lower than that of option 1 due to the conversion from rice-shrimp land to shrimp farming land.
3.2.5. Examining for the best options
With 6 examined possibilities of two situations, the total profit of the solutions is a significant component in determining which alternative option to select. However, environmental goals and risk minimization should be taken into account while selecting solutions. Figure 8 depicts the total return of the six alternative options. In both scenarios, the profit maximization plan provides the maximum profit, followed by the multi-objective optimal solution, while the adaptive maximization plan yields the lowest profit. In the absence of the effects of climate change.
When the overall profit of the two extremely profitable alternatives is considered, the difference is amounting 22.9 billion VND for option 2 and 72.9 billion VND for option 3. However, when considering the environmental component, option 3 in each scenarios produces the best results because it meets the overall goal which is offered to maximize the synthesis as a foundation for determining the planning possibilities.
The model also includes an overlay feature that allows users to define the areas to be converted for the proposed alternative based on the allotted map. Figure 9 shows the allocation map of the multi-objective alternative of Scenario 1 compared to the 2015 land use map (Figure 9b), and the conversion map. Figure 9c depicts the darkened regions that should be altered if the strategy is adopted.
4. Discussion
This study has established a predesigned tool for optimization and land allocation in the Mekong Delta using proven criteria from prior studies [26,27,29], as well as environmental and risk assessment criteria of usage patterns. Furthermore, the priority policy deploy ability component is incorporated into the land allocation model. The results also demonstrate that the integrated model makes it easier for planners to utilize due to the model's predefined impact variables. The optimization findings are then distributed spatially based on socioeconomic characteristics and local infrastructure.
Previous research found that the execution of planning options frequently encountered capital issues [36] since the land allocation model did not integrate this component in the geographic distribution. Although the commune's priority arrangement in terms of space is still limited due to the lack of a criterion for selecting the investment potential value for each pixel, the commune targeted for development in the district's policy will be prioritized for distribution. more places on the same land unit.
In this study, the value utilized helps to quantify the effect levels of the elements in the land allocated that other studies have demonstrated [9] for the risk factors of the land-uses and the environmental benefits of the uses.
The optimization strategies presented in this article were examined, with three alternatives for each scenario, including two scenarios corresponding to normal conditions and under situations of environmental change. In general, multi objective optimization is important for environmental protection because it has the lowest risk but also the lowest reward. Harmonization of the profitability, risk reduction, and negative environmental impact of intensive shrimp farming [9] by the utilization of rice-shrimp and rice - vegetables [5,6]. The area for rice shrimp has been guaranteed, and the area for rice crops has been enlarged, allowing people to lower the quantity of rice crops while still ensuring income. This promises to make the plan easy to deploy and propagate among farmers.
To take use of the advantages of each platform, the two modules of the integration model are often deployed on two different platforms: The optimized module is created using the Windows application program interface (Visual Studio). The land allocation module is built on the GAMA platform [35], which is ideal for creating spatial layout models using multi-criteria analysis. The optimization module includes various choices for creating constraints equations that may be added and removed freely, but the program has not been built to incorporate additional elements. In terms of spatial layout, the spatial layout model is used when land units are grouped into one to three land use kinds. When numerous land use types have the same priority, the system demands the creation of a priority list organized by the infrastructure element for the land use types.
Because users must operate two different modules, this two-module integrated solution remains challenging to use. This limitation can be overcome through extensive research and development of a comprehensive coupling model with the headless mode of the optimized module to make users more technically transparent to make it easier for non-technical managers.
In addition, forecasting of agricultural production is essential for land use planning, which has not been implemented in this study. Therefore, it is necessary to expand agricultural production forecasting research to serve as input for the constraints of optimizing land use area.
5. Conclusions
The model for implementing land use optimization has been built including two main components: (1) Optimizing agricultural land use; (2) spatial arrangement of agricultural land use areas. This method optimizes the area and layout of land use maps for the land use system with single-objective optimization functions (such as profit, land suitability) and multi-objective optimization functions. objectives (profit, labor, risk reduction and environmental benefits).
The implemented model allowed users to solve the problem of arranging different LUTs in a land unit thanks to the newly proposed land allocation module. In which, competitive LUTs are prioritized according to the criteria of proximity, proximity to roads, proximity to canals and the investment ability of the commune.
The results of the case study in three districts of Soc Trang province (Long Phu, My Xuyen, and Tran De) showed that the multi-objective optimal solution in the two scenarios is chosen thank to the balance between profitability and risk minimization, as well as negative environmental impacts.
Despite some restrictions, the model enables users to build solutions for agricultural land use planning, assisting in the development of scientifically sound plans under Mekong Delta conditions in Vietnam.
Supplementary Materials
Author Contributions
Q.C.T modeled, wrote the paper original draft; T.N conceptualized the study, wrote the paper original draft; collected data, built scenarios and the case of study and finalized the paper; V.T.P reviewed; T.H.N supervised and reviewed. All authors have read and agreed to the published version of the manuscript.
Funding
The study was partially funded by Can Tho University for the annual study, code project T2022-68.
Data Availability Statement
Data available on request due to restrictions privacy.
Acknowledgments
We would like to thank the staffs at the Department of Agriculture and Rural development of Soc Trang Province, for their support during data collection.
Conflicts of Interest
The authors declare no conflict of interest.
References
- GSO Mekong Delta - Promoting the number one rice bowl advantage in the country 2021.
- Espagne, E.; Ngo-Duc, T.; Nguyen, M.-H.; Pannier, E.; Woillez, M.-N.; Drogoul, A.; Huynh, T.P.L.; Le, T.T.; Nguyen, T.T.H.; Nguyen, T.T.; et al. Climate Change in Viet Nam, Impacts and Adaptation : A COP26 Assessment Report of the GEMMES Viet Nam Project; Agence Française de Développement, 2021.
- Anh, D.L.T.; Anh, N.T.; Chandio, A.A. Climate Change and Its Impacts on Vietnam Agriculture: A Macroeconomic Perspective. Ecol. Inform. 2023, 74, 101960. [CrossRef]
- Wassmann, R.; Hien, N.X.; Hoanh, C.T.; Tuong, T.P. Sea Level Rise Affecting the Vietnamese Mekong Delta: Water Elevation in the Flood Season and Implications for Rice Production. Clim. Change 2004, 66, 89–107. [CrossRef]
- Loc, H.H.; Thi Hong Diep, N.; Can, N.T.; Irvine, K.N.; Shimizu, Y. Integrated Evaluation of Ecosystem Services in Prawn-Rice Rotational Crops, Vietnam. Ecosyst. Serv. 2017, 26, 377–387. [CrossRef]
- Bong, B.B.; Bo, N.V.; Son, N.H.; Tung, L.T.; Tu, T.Q.; Toan, T.Q.; Yen, B.T.; Trung, N.D.; Labios, R.V.; Sebastian, L.S. Adaptation Options for Rice-Based Cropping Systems in Climate Risk-Prone Provinces in the Mekong River Delta: An Assessment Report; Wageningen, the Netherlands: CGIAR Research Program on Climate Change, Agriculture and Food Security (CCAFS), 2018.
- Truong, Q.C.; Drogoul, A.; Gaudou, B.; Taillandier, P.; Huynh, N.Q.; Nguyen, T.H.; Minderhoud, P.; Nguyen Thi Thu, H.; Espagne, E. An Agent-Based Model for Land-Use Change Adaptation Strategies in the Context of Climate Change and Land Subsidence in the Mekong Delta. Sustainability 2023, 15, 5355. [CrossRef]
- Truong, Q.C.; Gaudou, B.; Van Danh, M.; Quang Huynh, N.; Drogoul, A.; Taillandier, P. A Land-Use Change Model to Study Climate Change Adaptation Strategies in the Mekong Delta. In Proceedings of the 2021 RIVF International Conference on Computing and Communication Technologies (RIVF); August 2021; pp. 1–6.
- Trang, N.T.; Tu, V.H.; Kopp, S.W. Trade-Offs between Economic and Environmental Efficiencies in Shrimp Farming: Implications for Sustainable Agricultural Restructuring in the Vietnamese Mekong Delta. Environ. Dev. Sustain. 2023. [CrossRef]
- FAO Guidelines for Land-Use Planning; FAO Development Series; 1993; ISBN 92-5-103282-3.
- FAO A Framework for Land Evaluation; Soil Resources, Management and Conservation Service, Ed.; FAO soils bulletin; 2. print.; FAO: Rome, 1981; ISBN 92-5-100111-1.
- Yamamura, K.; Tamura, N. Finding All Solutions of Separable Systems of Piecewise-Linear Equations Using Integer Programming. J. Comput. Appl. Math. 2012, 236, 2844–2852.
- Delphin, S.; Snyder, K.A.; Tanner, S.; Musálem, K.; Marsh, S.E.; Soto, J.R. Obstacles to the Development of Integrated Land-Use Planning in Developing Countries: The Case of Paraguay. Land 2022, 11, 1339. [CrossRef]
- Chuvieco, E. Integration of Linear Programming and GIS for Land-Use Modelling. Int. J. Geogr. Inf. Syst. 1993, 7, 71–83. [CrossRef]
- Mellaku, M.; Reynolds, T.; Woldeamanuel, T. Linear Programming-Based Cropland Allocation to Enhance Performance of Smallholder Crop Production: A Pilot Study in Abaro Kebele, Ethiopia. Resources 2018, 7, 76. [CrossRef]
- Aerts, J.C.J.H.; Eisinger, E.; Heuvelink, G.B.M.; Stewart, T.J. Using Linear Integer Programming for Multi-Site Land-Use Allocation. Geogr. Anal. 2003, 35, 148–169. [CrossRef]
- Phinyoyang, A.; Ongsomwang, S. Optimizing Land Use and Land Cover Allocation for Flood Mitigation Using Land Use Change and Hydrological Models with Goal Programming, Chaiyaphum, Thailand. Land 2021, 10, 1317. [CrossRef]
- Liao, G.; He, P.; Gao, X.; Lin, Z.; Huang, C.; Zhou, W.; Deng, O.; Xu, C.; Deng, L. Land Use Optimization of Rural Production–Living–Ecological Space at Different Scales Based on the BP–ANN and CLUE–S Models. Ecol. Indic. 2022, 137, 108710. [CrossRef]
- Vũ P.T.; Khương N.T.A.; Trí L.Q.; Huy V.T. Application of mathematical optimization method in agricultural land use - case study in Vi Thuy district, Hau Giang province. Can Tho Univ. J. Sci. 2016, 38–47. [CrossRef]
- Vũ P.T.; Lộc T.T.; Trí L.Q.; Huy V.T.; Trung N.H. Enhancing land use efficiency for income optimization of farm households in Tra Hat hamlet of Chau Thoi commune, Vinh Loi district, Bac Lieu province. Can Tho Univ. J. Sci. 2017, 54–63. [CrossRef]
- Verburg, P.H.; Overmars, K.P. Dynamic Simulation of Land-Use Change Trajectories with the Clue-S Model. In Modelling Land-Use Change: Progress and Applications; Koomen, E., Stillwell, J., Bakema, A., Scholten, H.J., Eds.; The GeoJournal Library; Springer Netherlands: Dordrecht, 2007; pp. 321–337 ISBN 978-1-4020-5648-2.
- Ligtenberg, D.V.P.H.V.A.K.B.A. An Agent-Based Approach to Model Land-Use Change at a Regional Scale. Landsc. Ecol. 2010, 25. [CrossRef]
- Wu, C.; Chen, B.; Huang, X.; Dennis Wei, Y.H. Effect of Land-Use Change and Optimization on the Ecosystem Service Values of Jiangsu Province, China. Ecol. Indic. 2020, 117, 106507. [CrossRef]
- Quang, T.C.; Diem, P.K.; Minh, V.Q.; Vu, P.T.; Vu, P.H.; Chinh, P.T. An Analysis of Land Use Options Using CLUMondo Model to Promote Agricultural Restructuring in the Mekong Delta’s Coastal Area in Vietnam. Agric. Sci. Dig. - Res. J. 2023, 43, 482–489. [CrossRef]
- Lambin, E.; Geist, H.J. Causes of Land-Use and Land-Cover Change Available online: http://www.eoearth.org/view/article/150964/ (accessed on 23 March 2015).
- Santiphop, T.; Shrestha, R.P.; Hazarika, M.K. An Analysis of Factors Affecting Agricultural Land Use Patterns and Livelihood Strategies of Farm Households in Kanchanaburi Province, Thailand. J. Land Use Sci. 2012, 7, 331–348. [CrossRef]
- Liu, J.; Xia, M. Influencing Factors Analysis and Optimization of Land Use Allocation: Combining MAS with MOPSO Procedure. Sustainability 2023, 15, 1401. [CrossRef]
- Loi L.T.; Tien L.T.M.; Vu P.T. Analysis of the factors affecting efficiency of agricultural land use patterns in the Ba Tri district, Ben Tre province. Can Tho Univ. J. Sci. 2016, 80–92. [CrossRef]
- Vu P.T.; Tri L.Q.; Dat N.T.; Huy V.T.; Nuong L.T.; Trung N.H. Using multi-criteria decision analysis in agricultural land uses in Bac Lieu province. Can Tho Univ. J. Sci. 2014, 106–115.
- Sofi, N.A.; Ahmed, A.; Ahmad, M.; Bhat, B.A. Decision Making in Agriculture: A Linear Programming Approach. 2015, 10.
- Tuan Anh, B.; Bong Dinh, N.; Tam Thi, D. Some Factors Which Influence management of Agricultural Land Use in Sontay Town, Hanoi City. J Sci Devel 2013, 11, 654–662.
- Tri L.Q.; Chi V.V.; Vu P.T.; Kiet N.H.; Binh N.T.S.; Guong V.T. Evaluating the changes of soil properties and land use at three coastal districts in Soc Trang province. Can Tho Univ. J. Sci. 2008, 59–68.
- Nghi N.Q.; Hien L.T.D. Market risk in agriculture of households in the Mekong Delta. Can Tho Univ. J. Sci. 2014, 33, 38–44.
- lp_solve Introduction to Lp_solve 5.5.2.5. Available online: http://web.mit.edu/lpsolve/doc/ (accessed on 4 June 2019).
- Taillandier, P.; Gaudou, B.; Grignard, A.; Huynh, Q.-N.; Marilleau, N.; Caillou, P.; Philippon, D.; Drogoul, A. Building, Composing and Experimenting Complex Spatial Models with the GAMA Platform. GeoInformatica 2019, 23, 299–322. [CrossRef]
- Enoguanbhor, E.C.; Gollnow, F.; Walker, B.B.; Nielsen, J.O.; Lakes, T. Key Challenges for Land Use Planning and Its Environmental Assessments in the Abuja City-Region, Nigeria. Land 2021, 10, 443. [CrossRef]
Figure 1.
The study area in Soc Trang province, Vietnam.
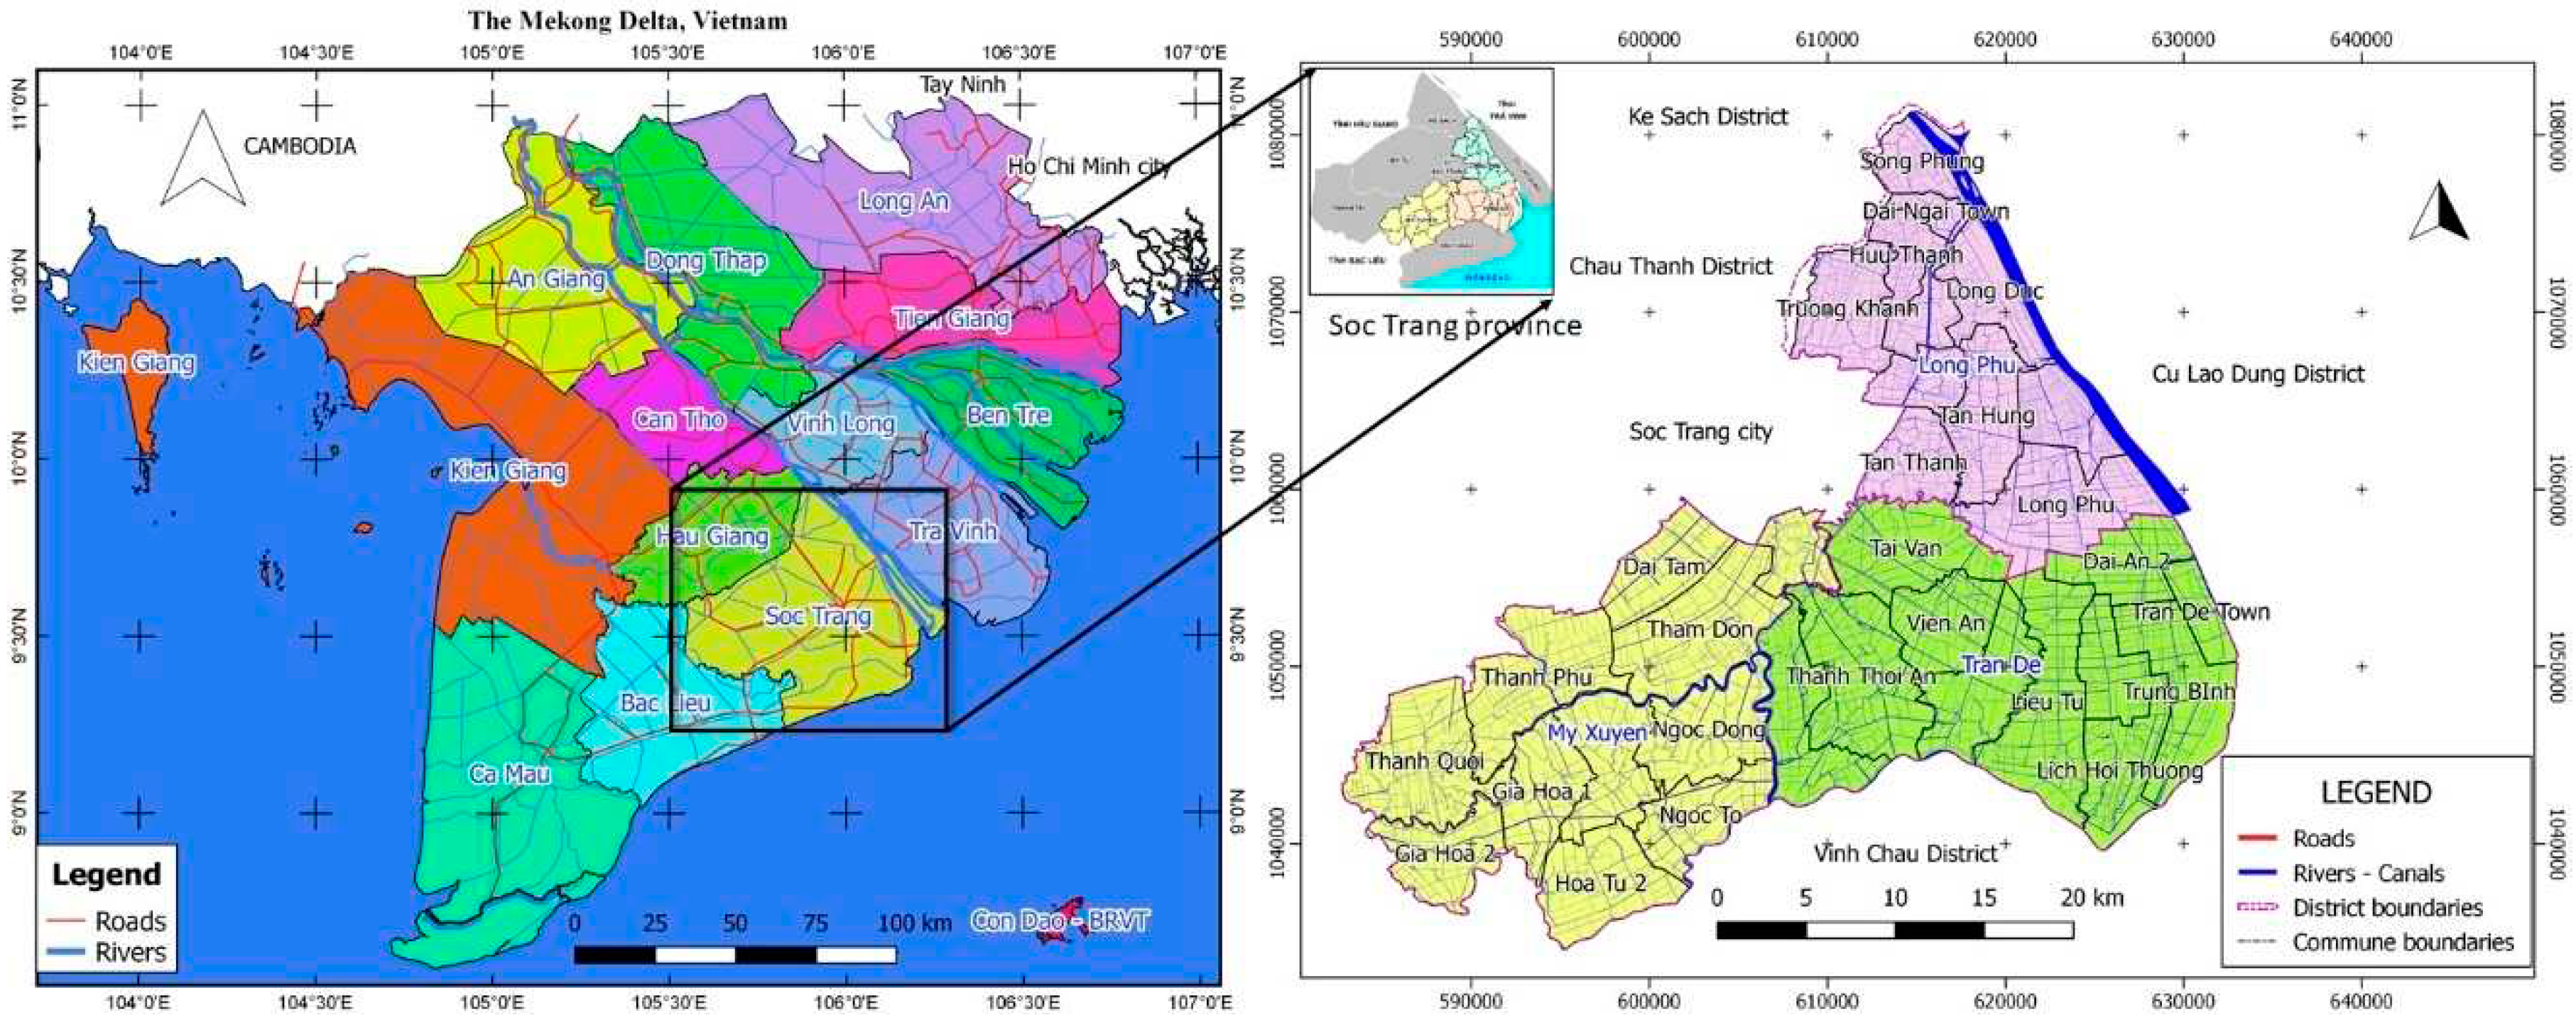
Figure 2.
Cultivated agricultural land-use area of three districts from 2010 to 2021.
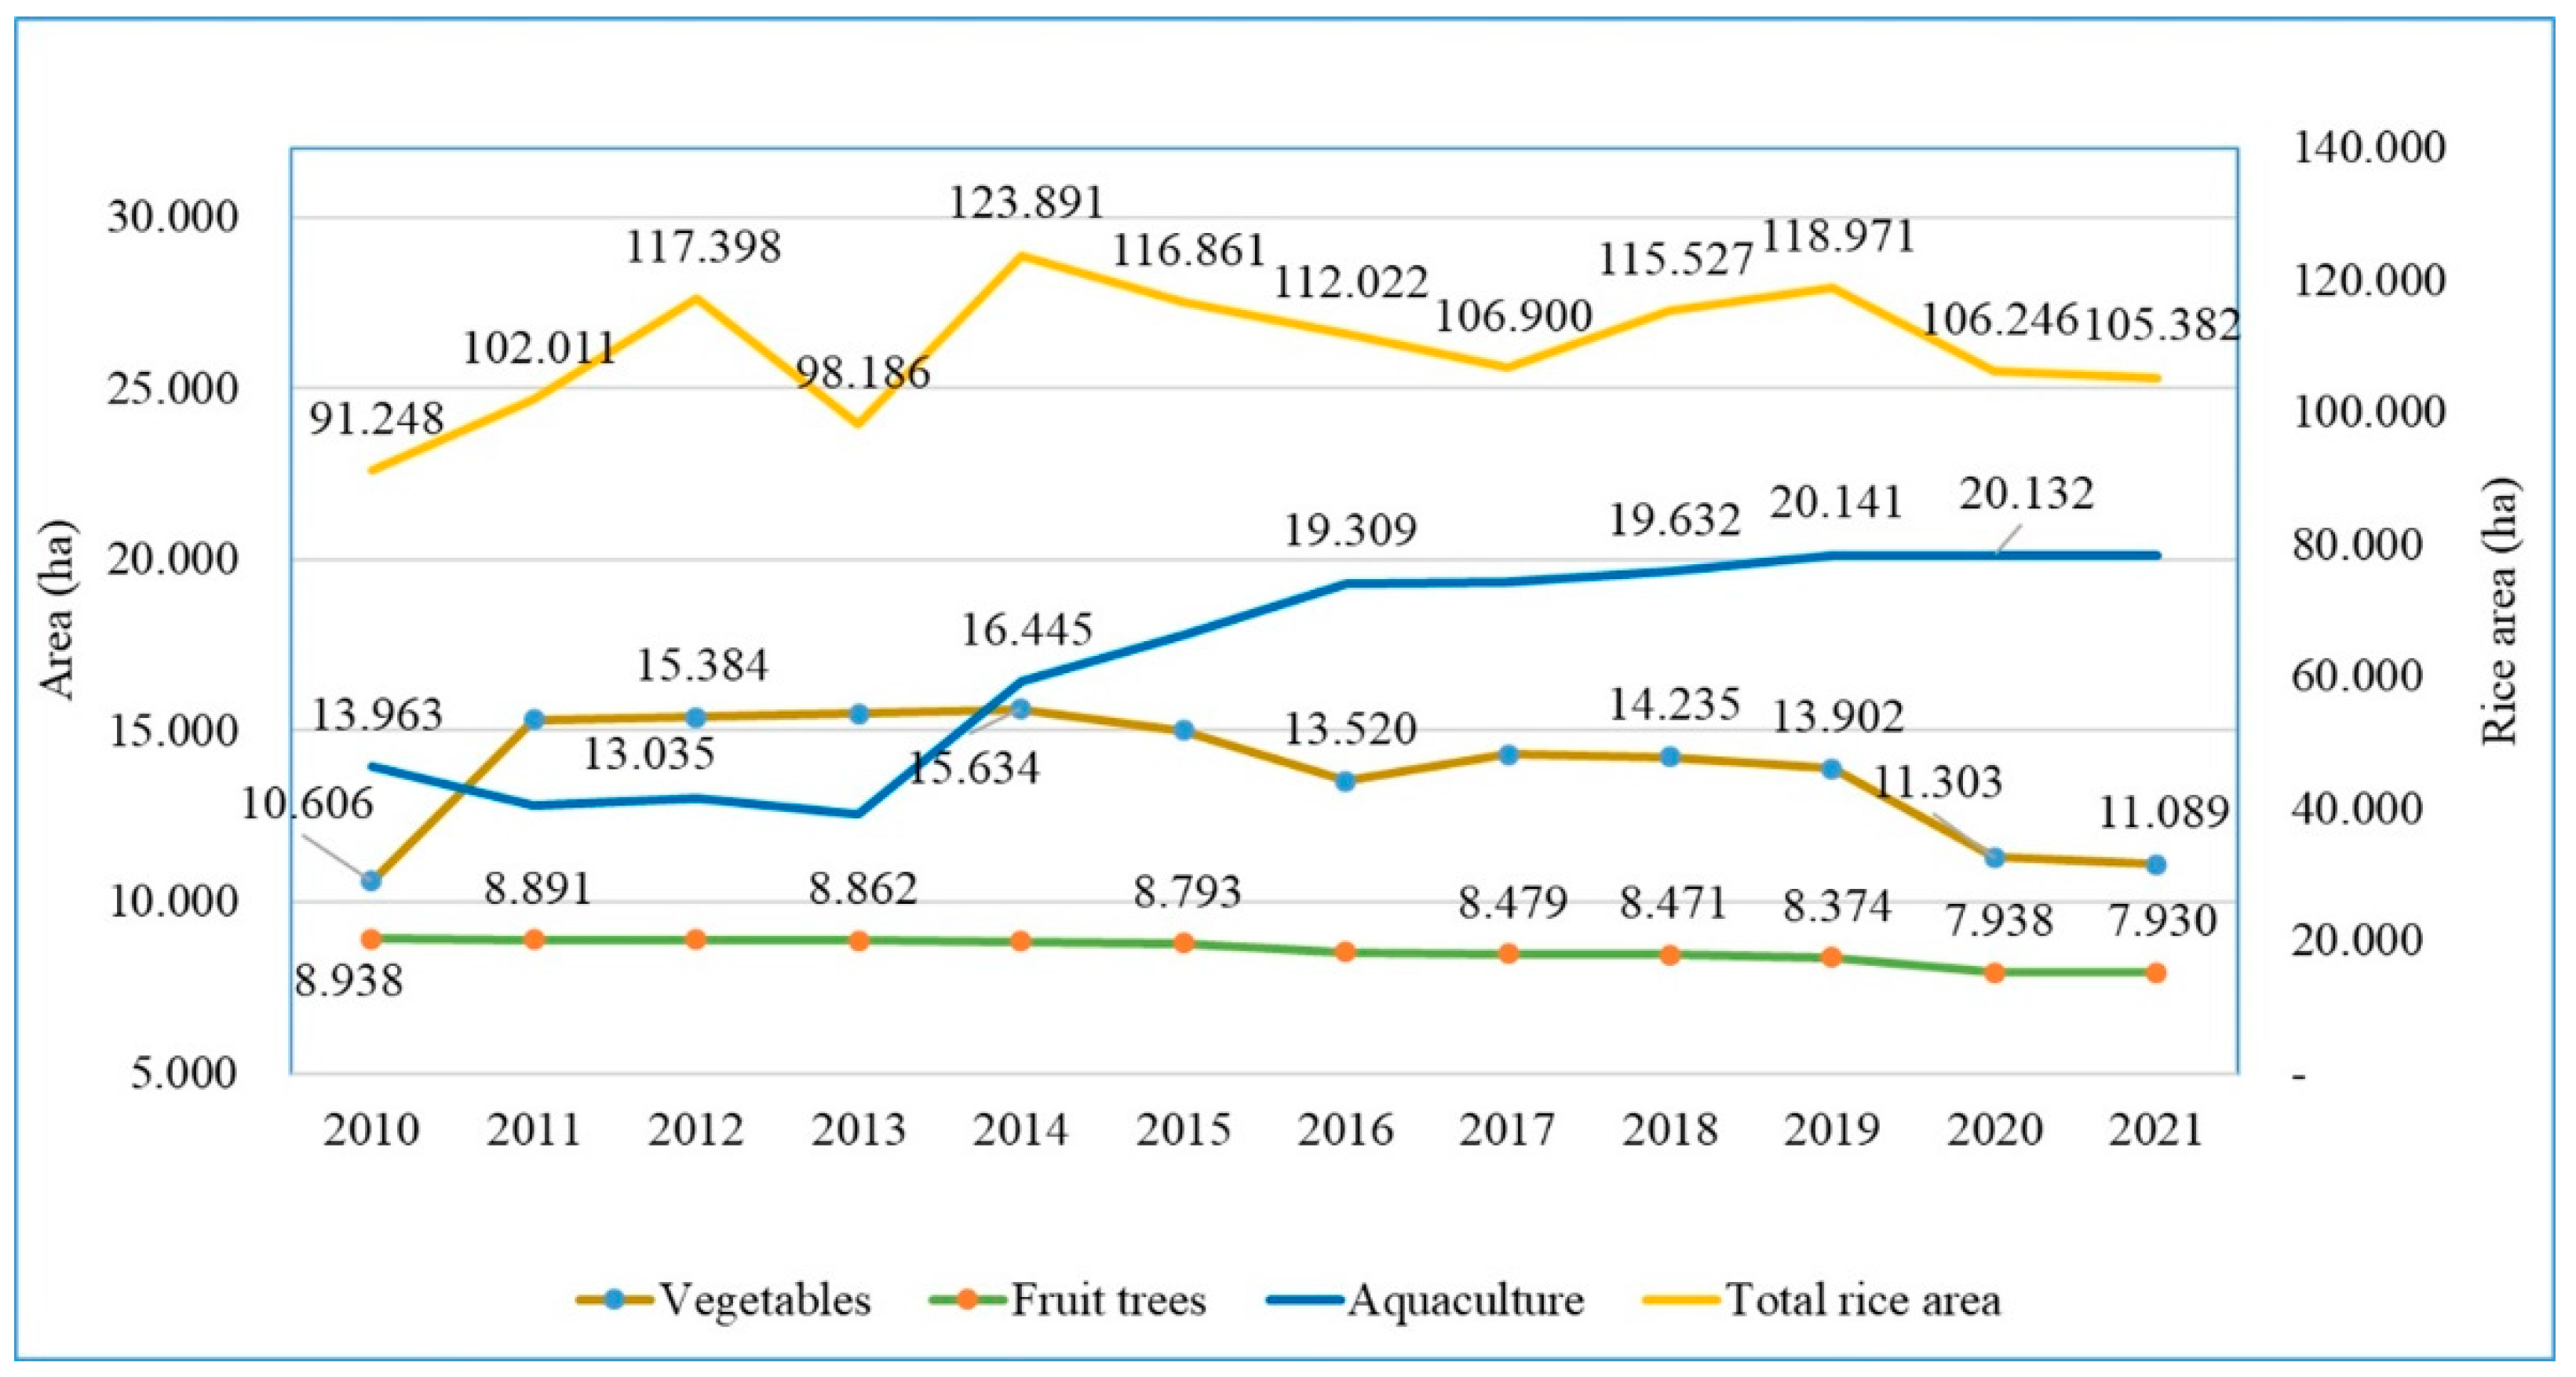
Figure 3.
Research method diagram.
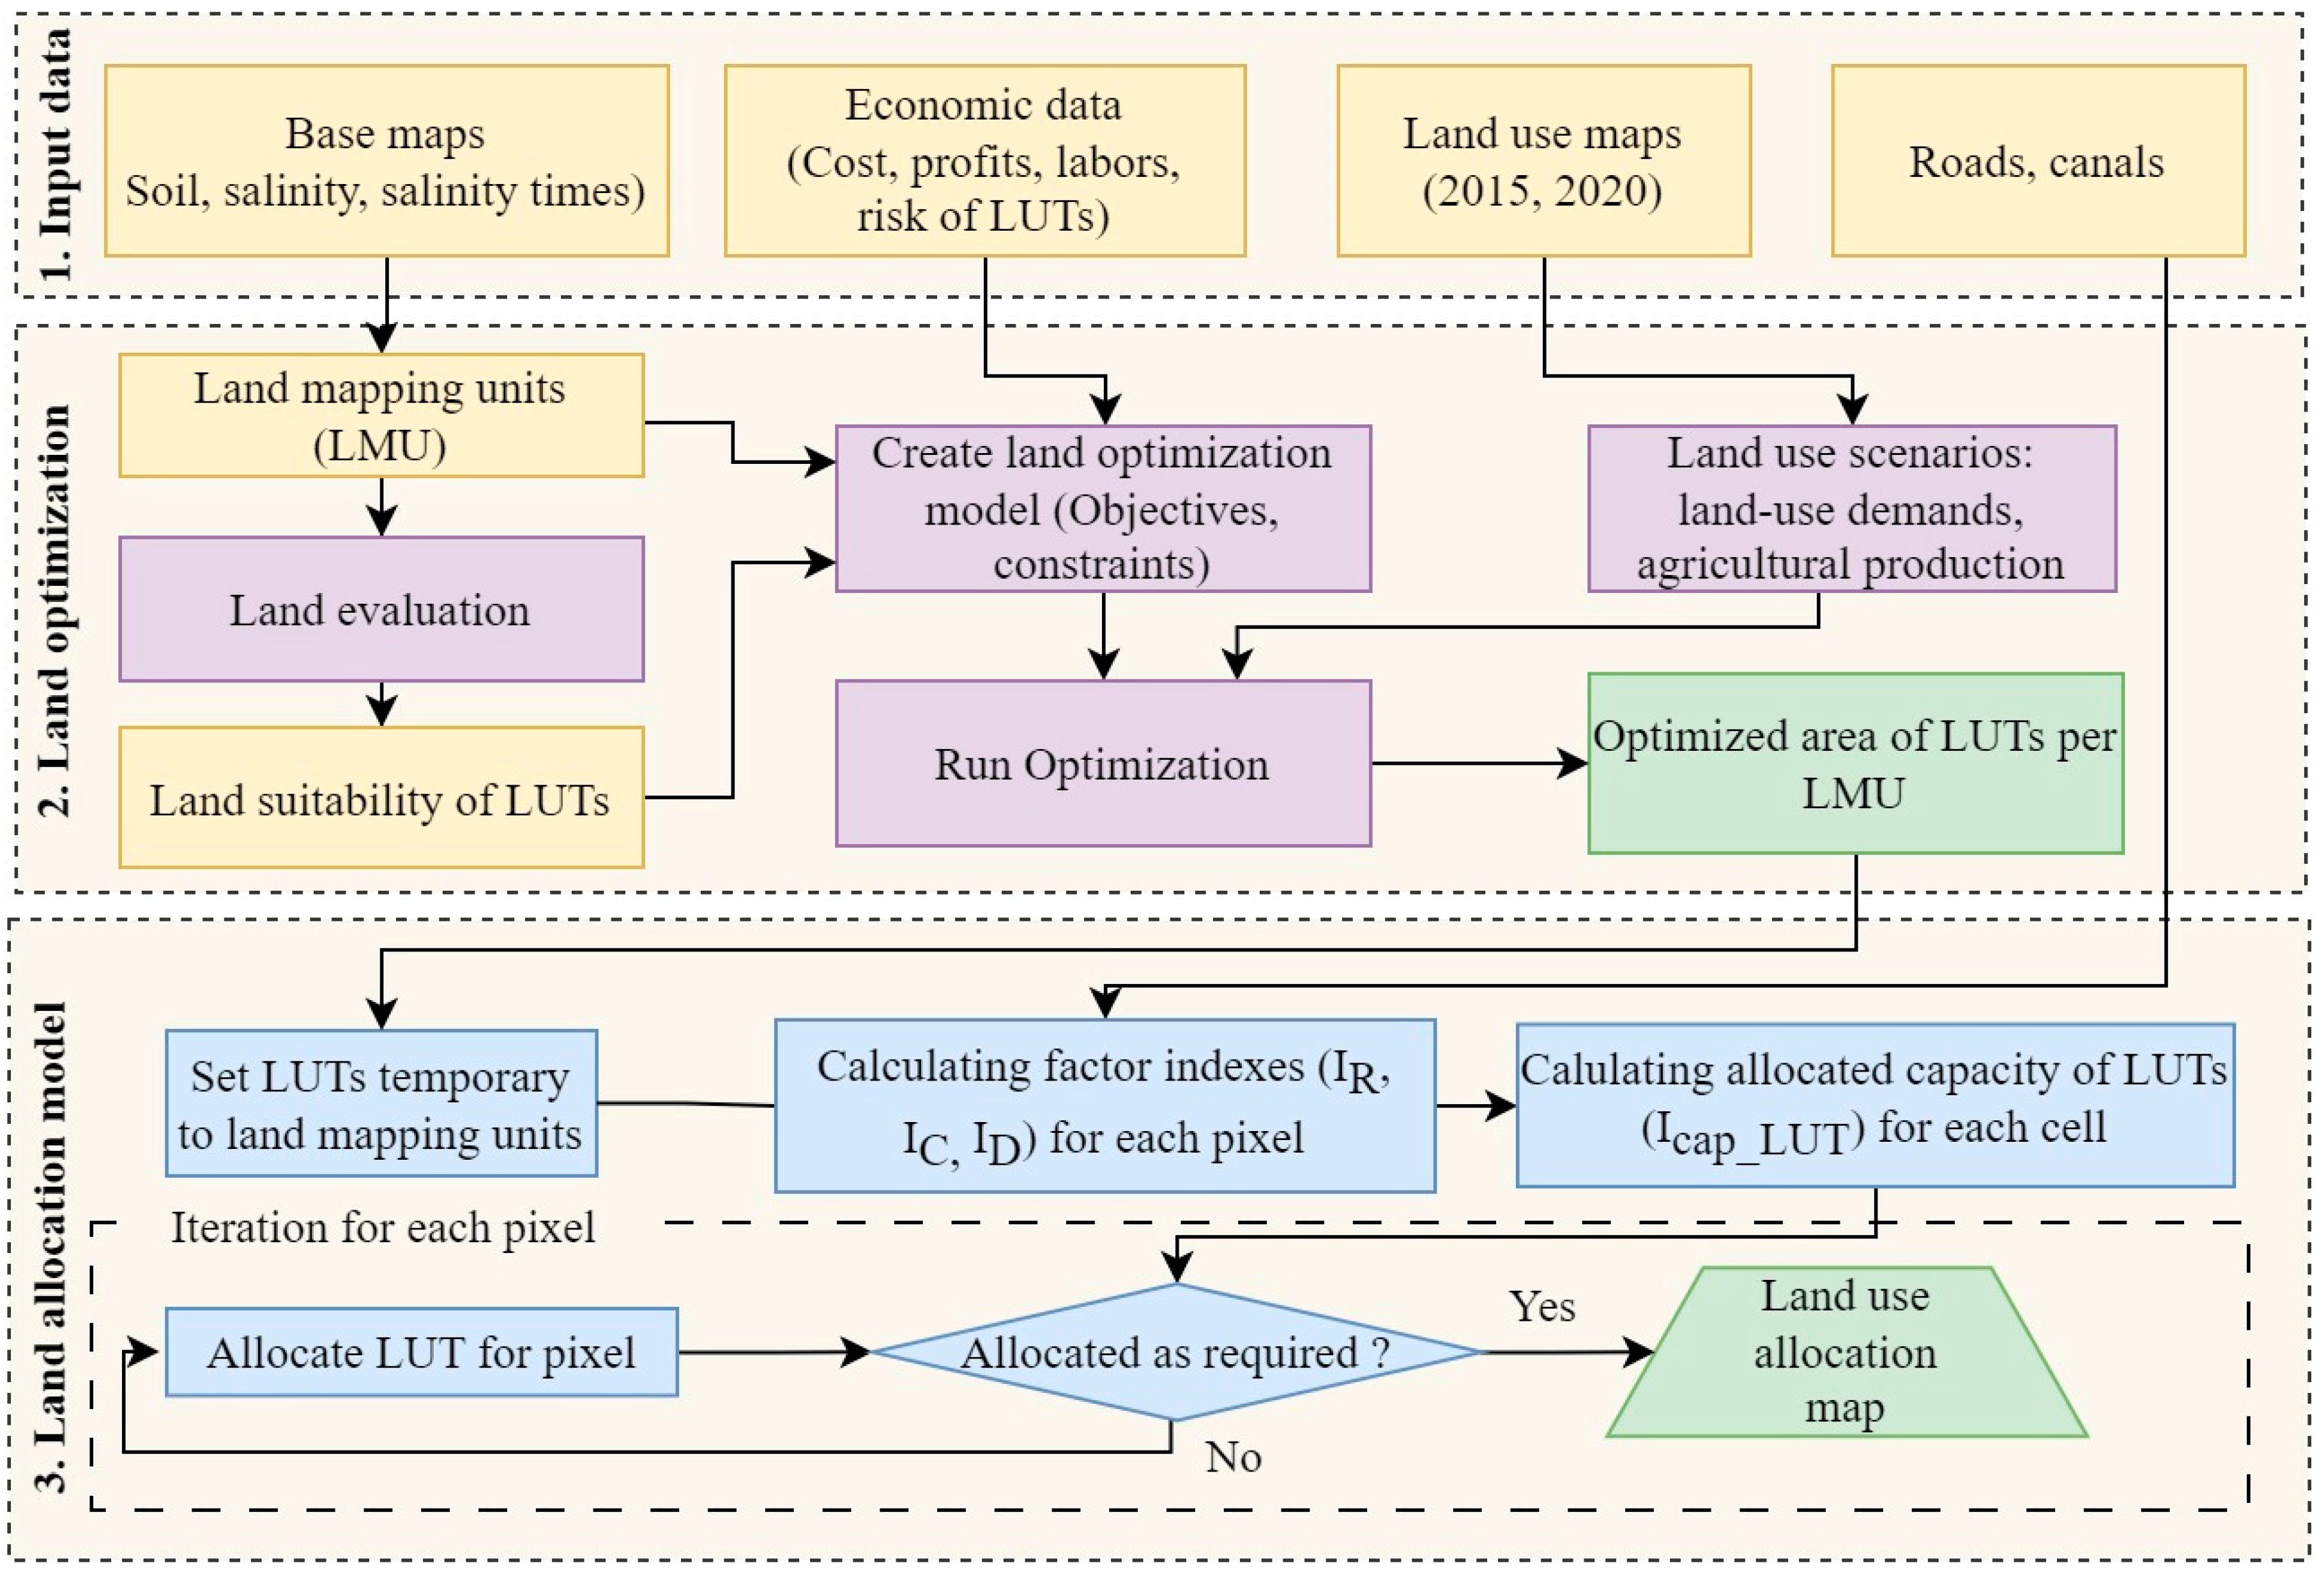
Figure 5.
Land mapping units of the study area.
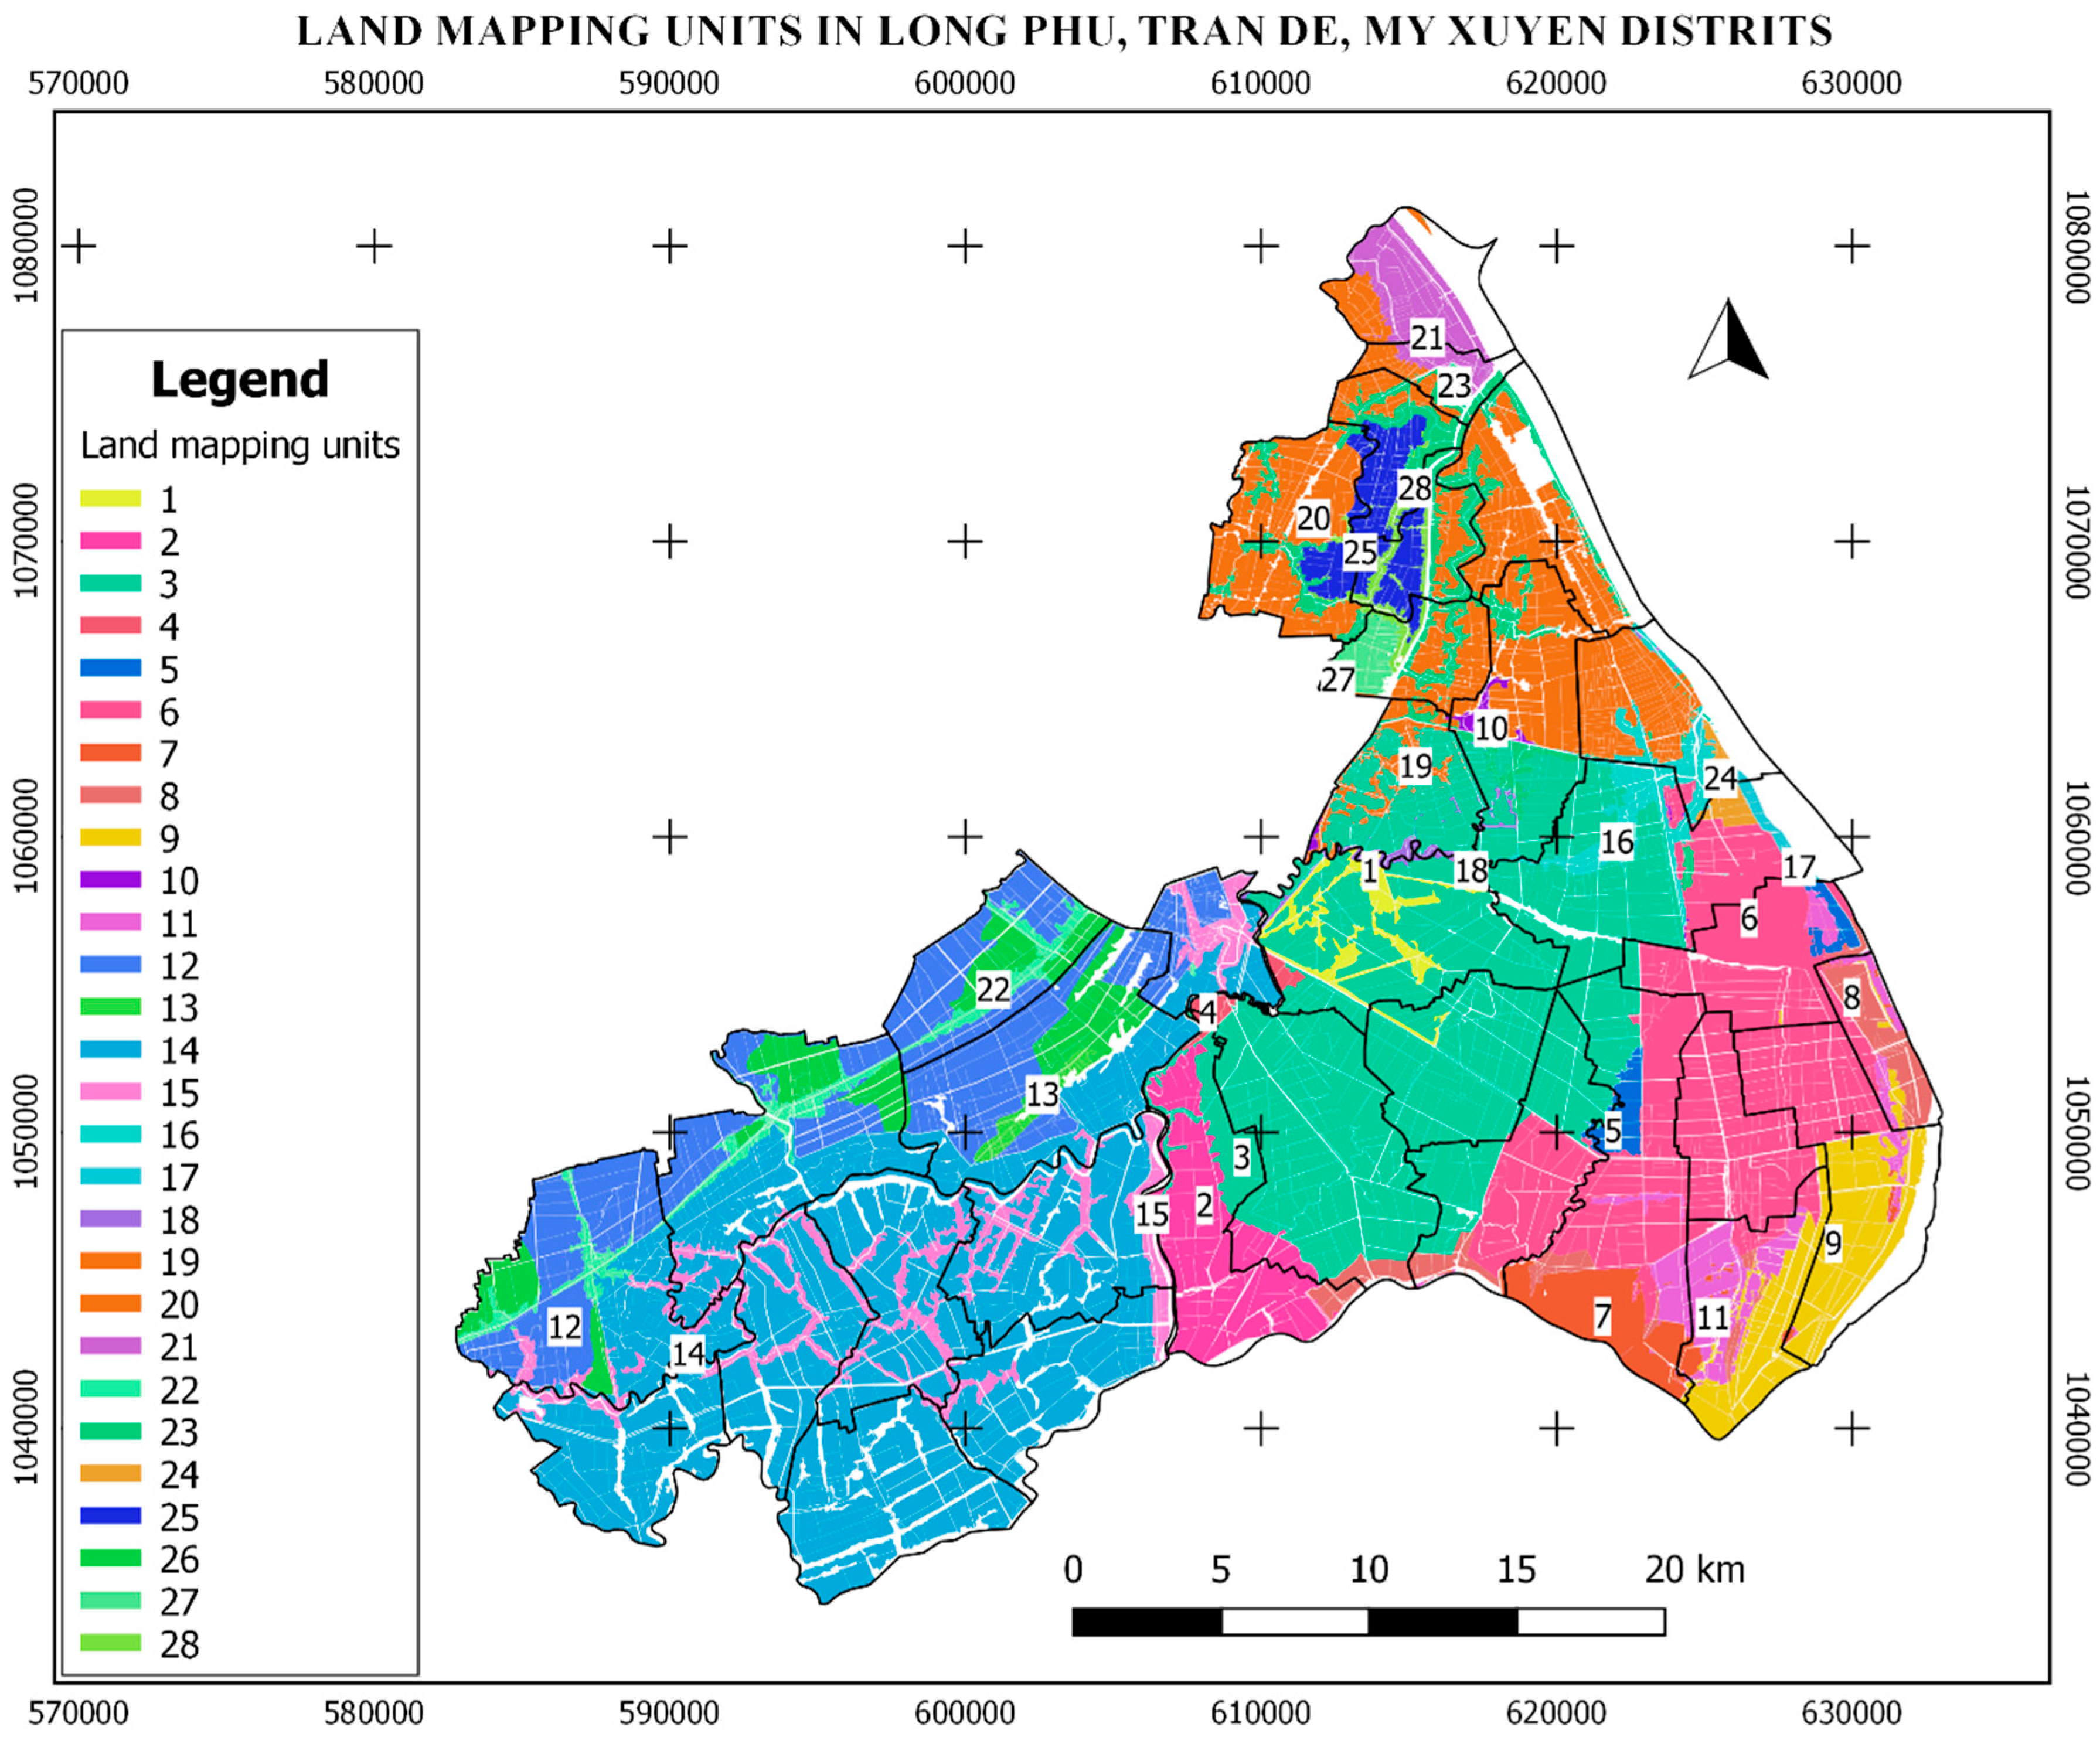
Figure 6.
Land-use maps of tree alternatives in Scenarios 1. a) Option 1: Maximization of land suitability; b) Option 2: Maximization of profits; c) Option 3: Maximization multiple objectives d) Land-use area of 3 alternative options.
Figure 6.
Land-use maps of tree alternatives in Scenarios 1. a) Option 1: Maximization of land suitability; b) Option 2: Maximization of profits; c) Option 3: Maximization multiple objectives d) Land-use area of 3 alternative options.
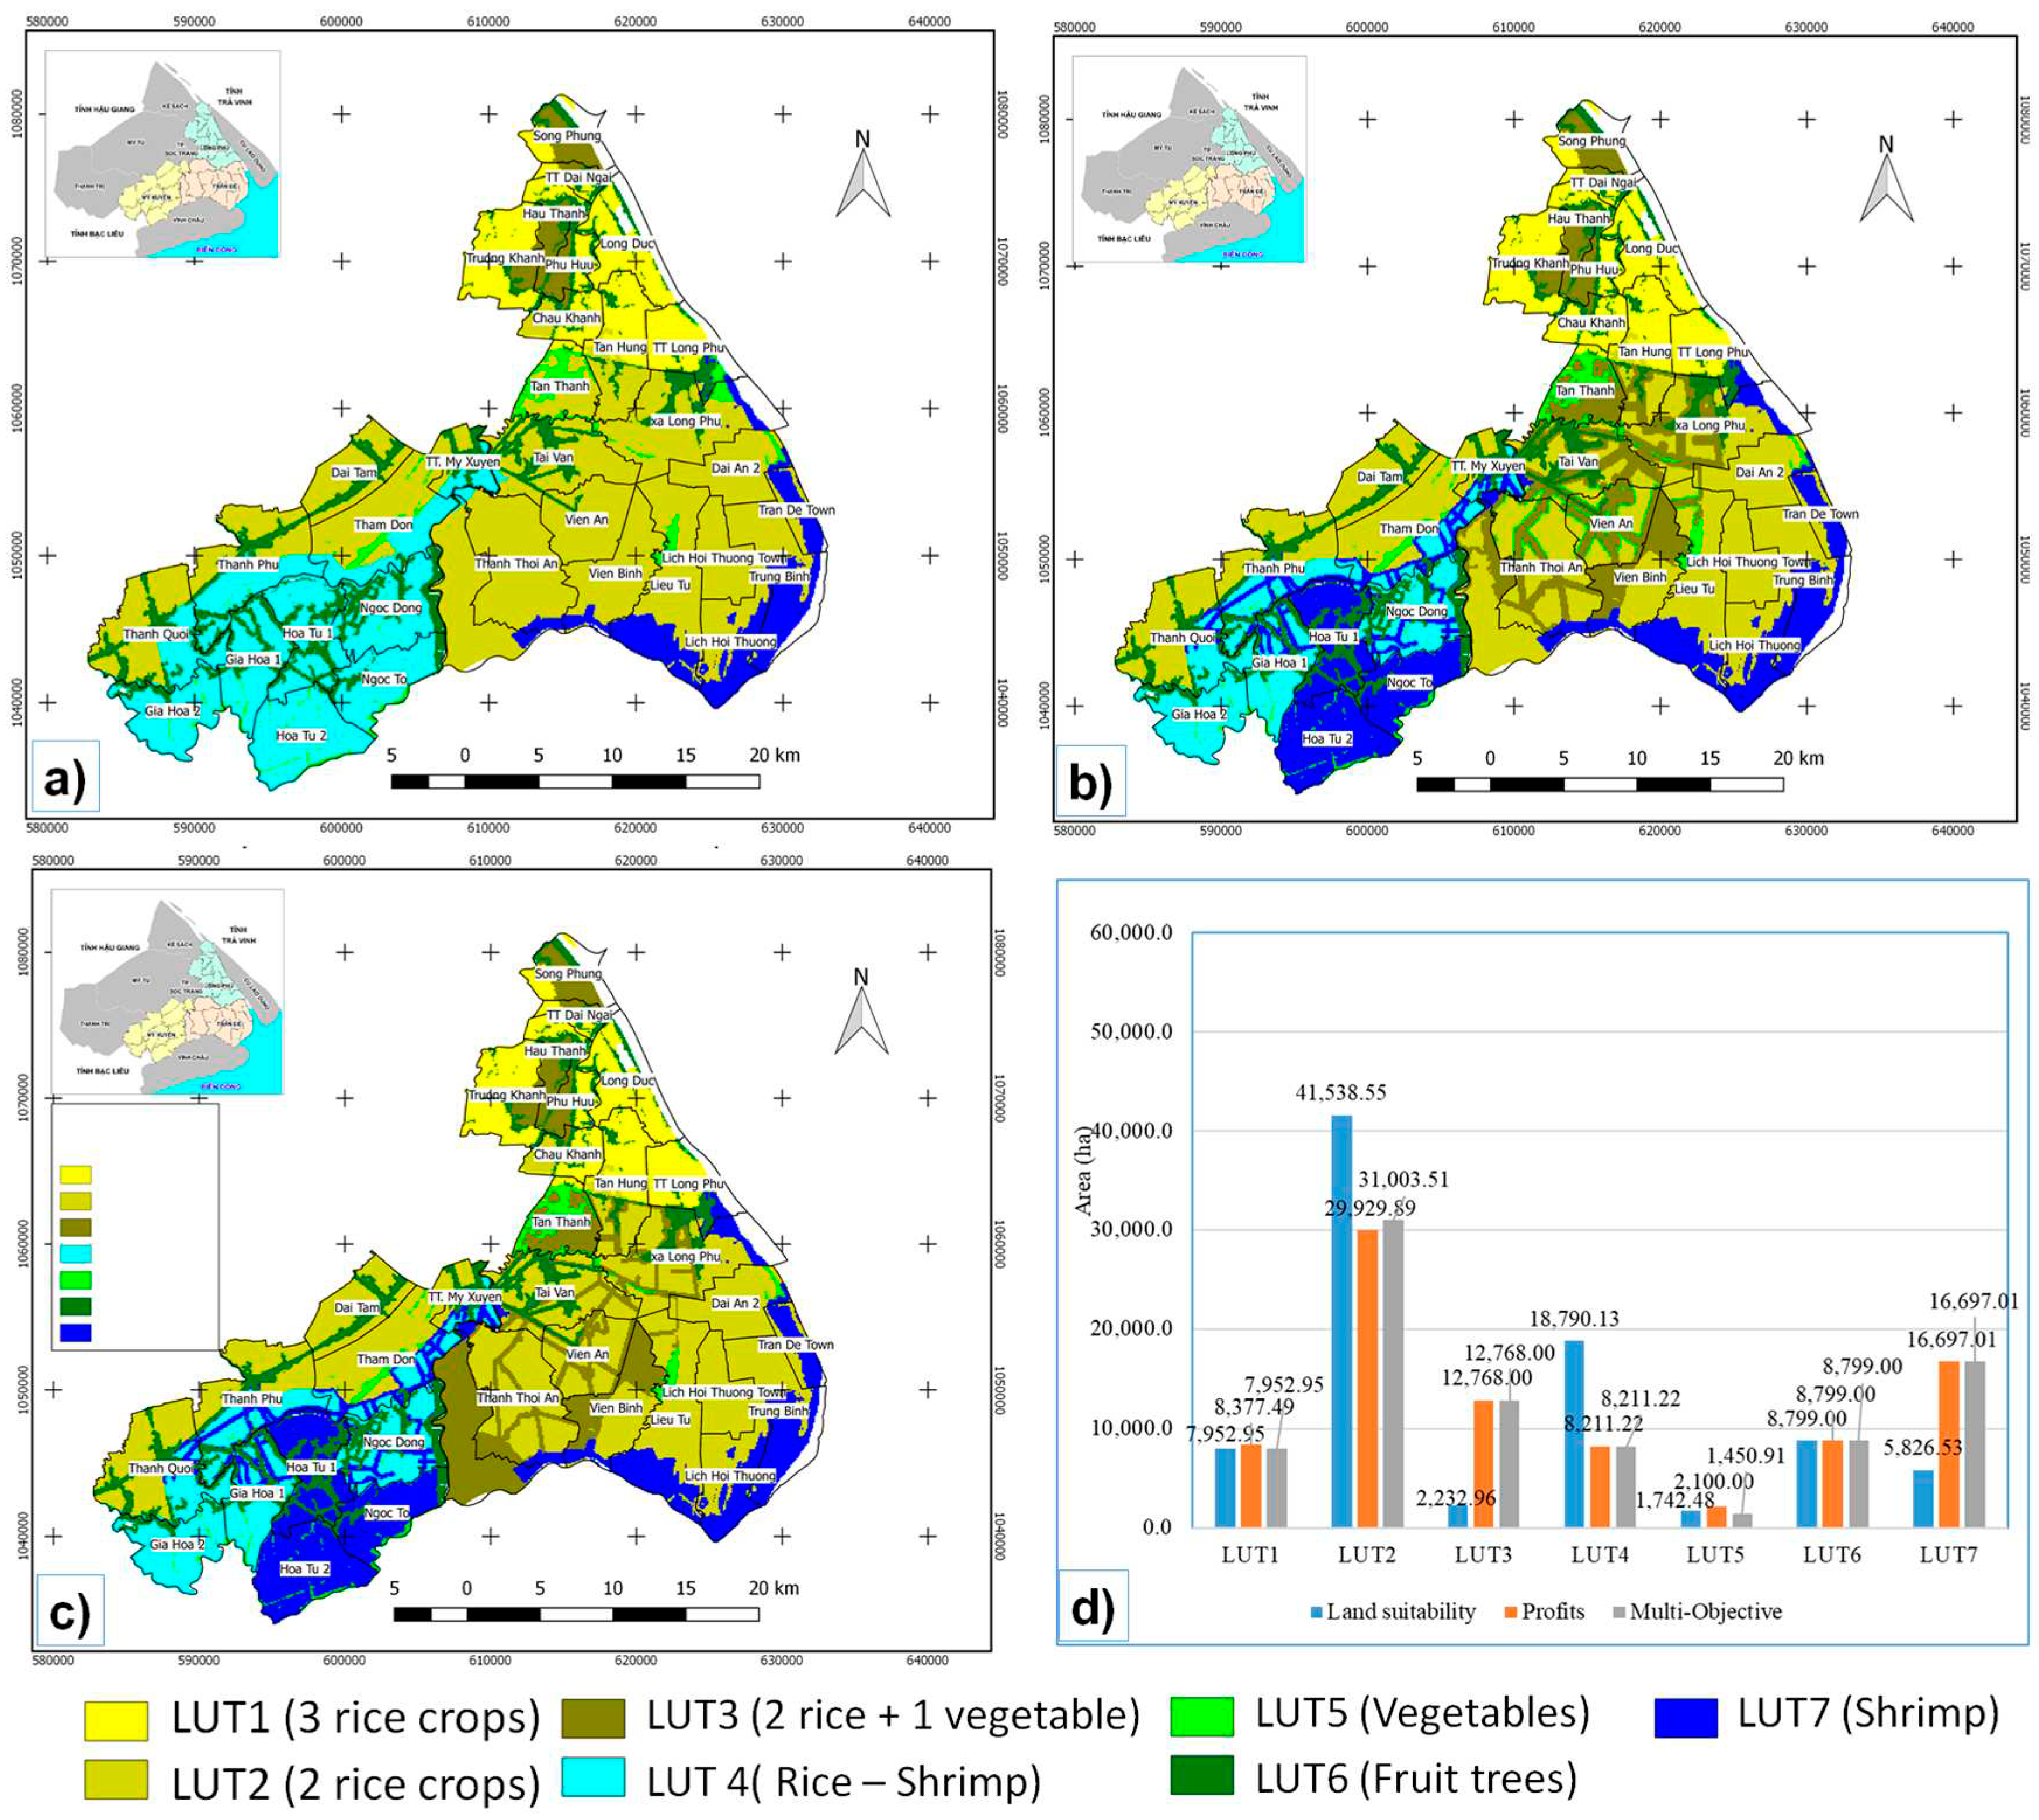
Figure 7.
Land-use maps of 3 alternatives in scenarios 2. a) Option 1: Maximization of land suitability; b) Option 2: Maximization of profits; c) Option 3: Maximization multiple objectives d) Land-use area of 3 alternative options.
Figure 7.
Land-use maps of 3 alternatives in scenarios 2. a) Option 1: Maximization of land suitability; b) Option 2: Maximization of profits; c) Option 3: Maximization multiple objectives d) Land-use area of 3 alternative options.
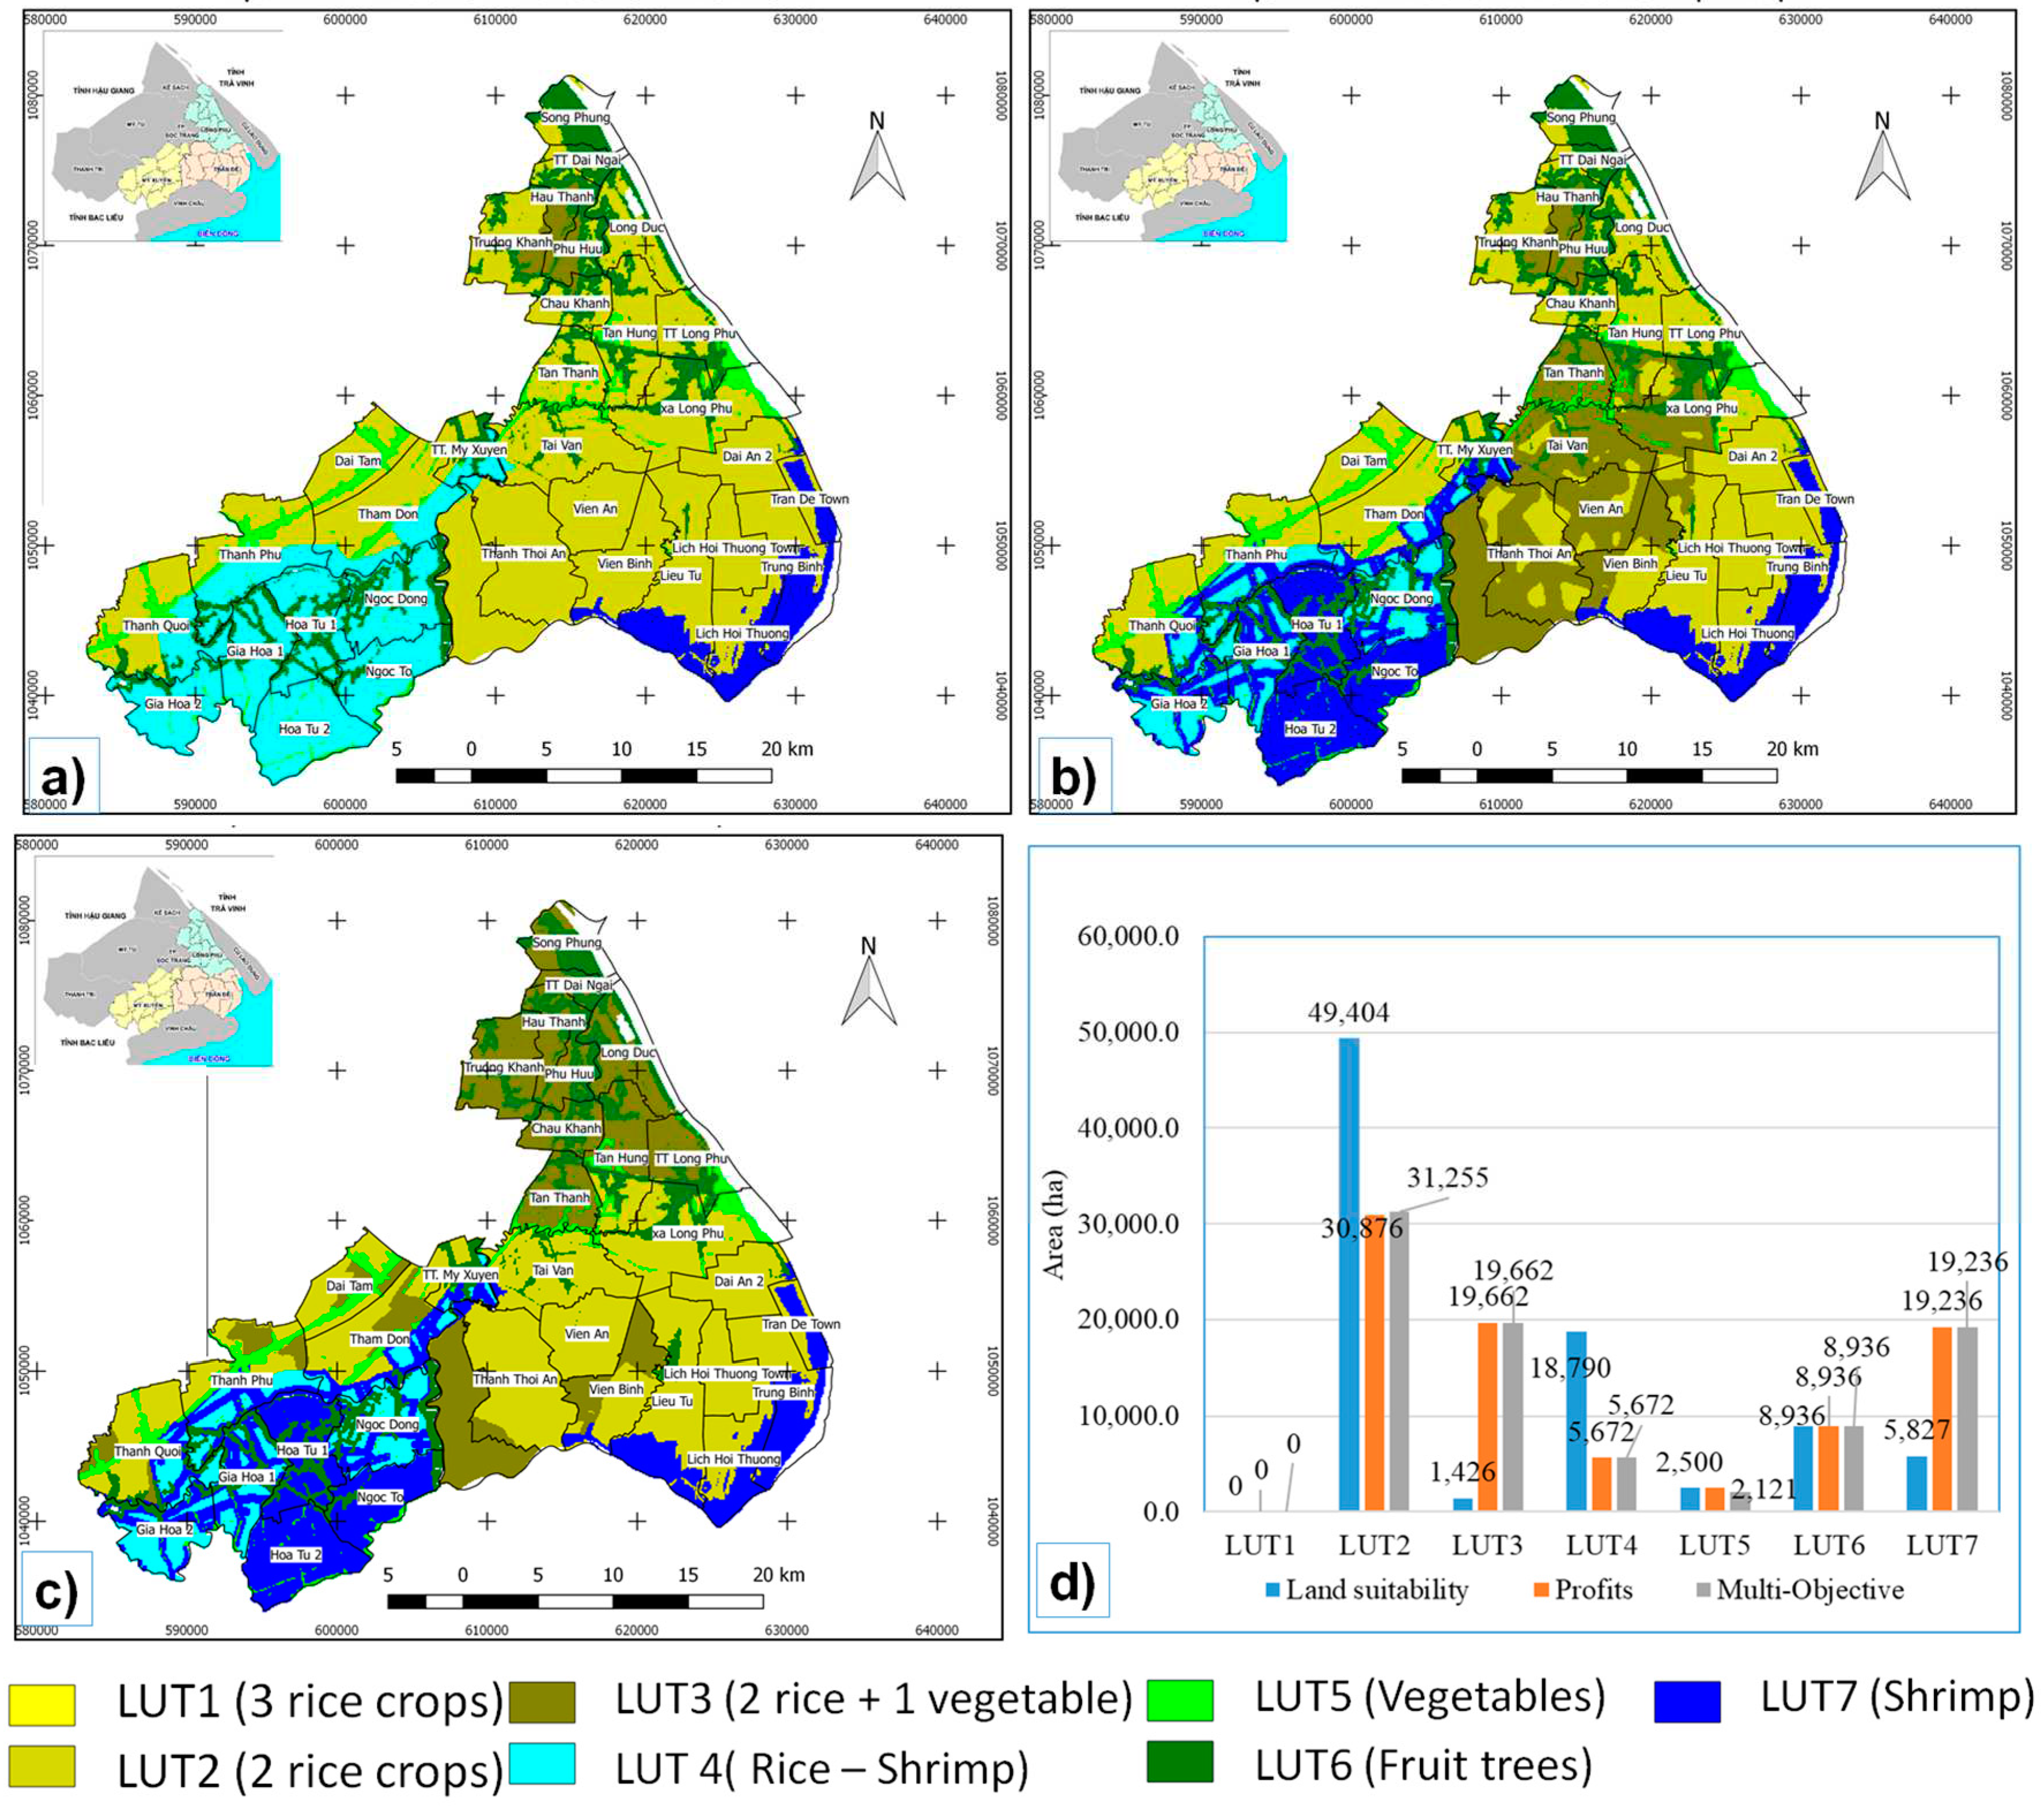
Figure 8.
Compare the total profit of the two scenarios in 2030.
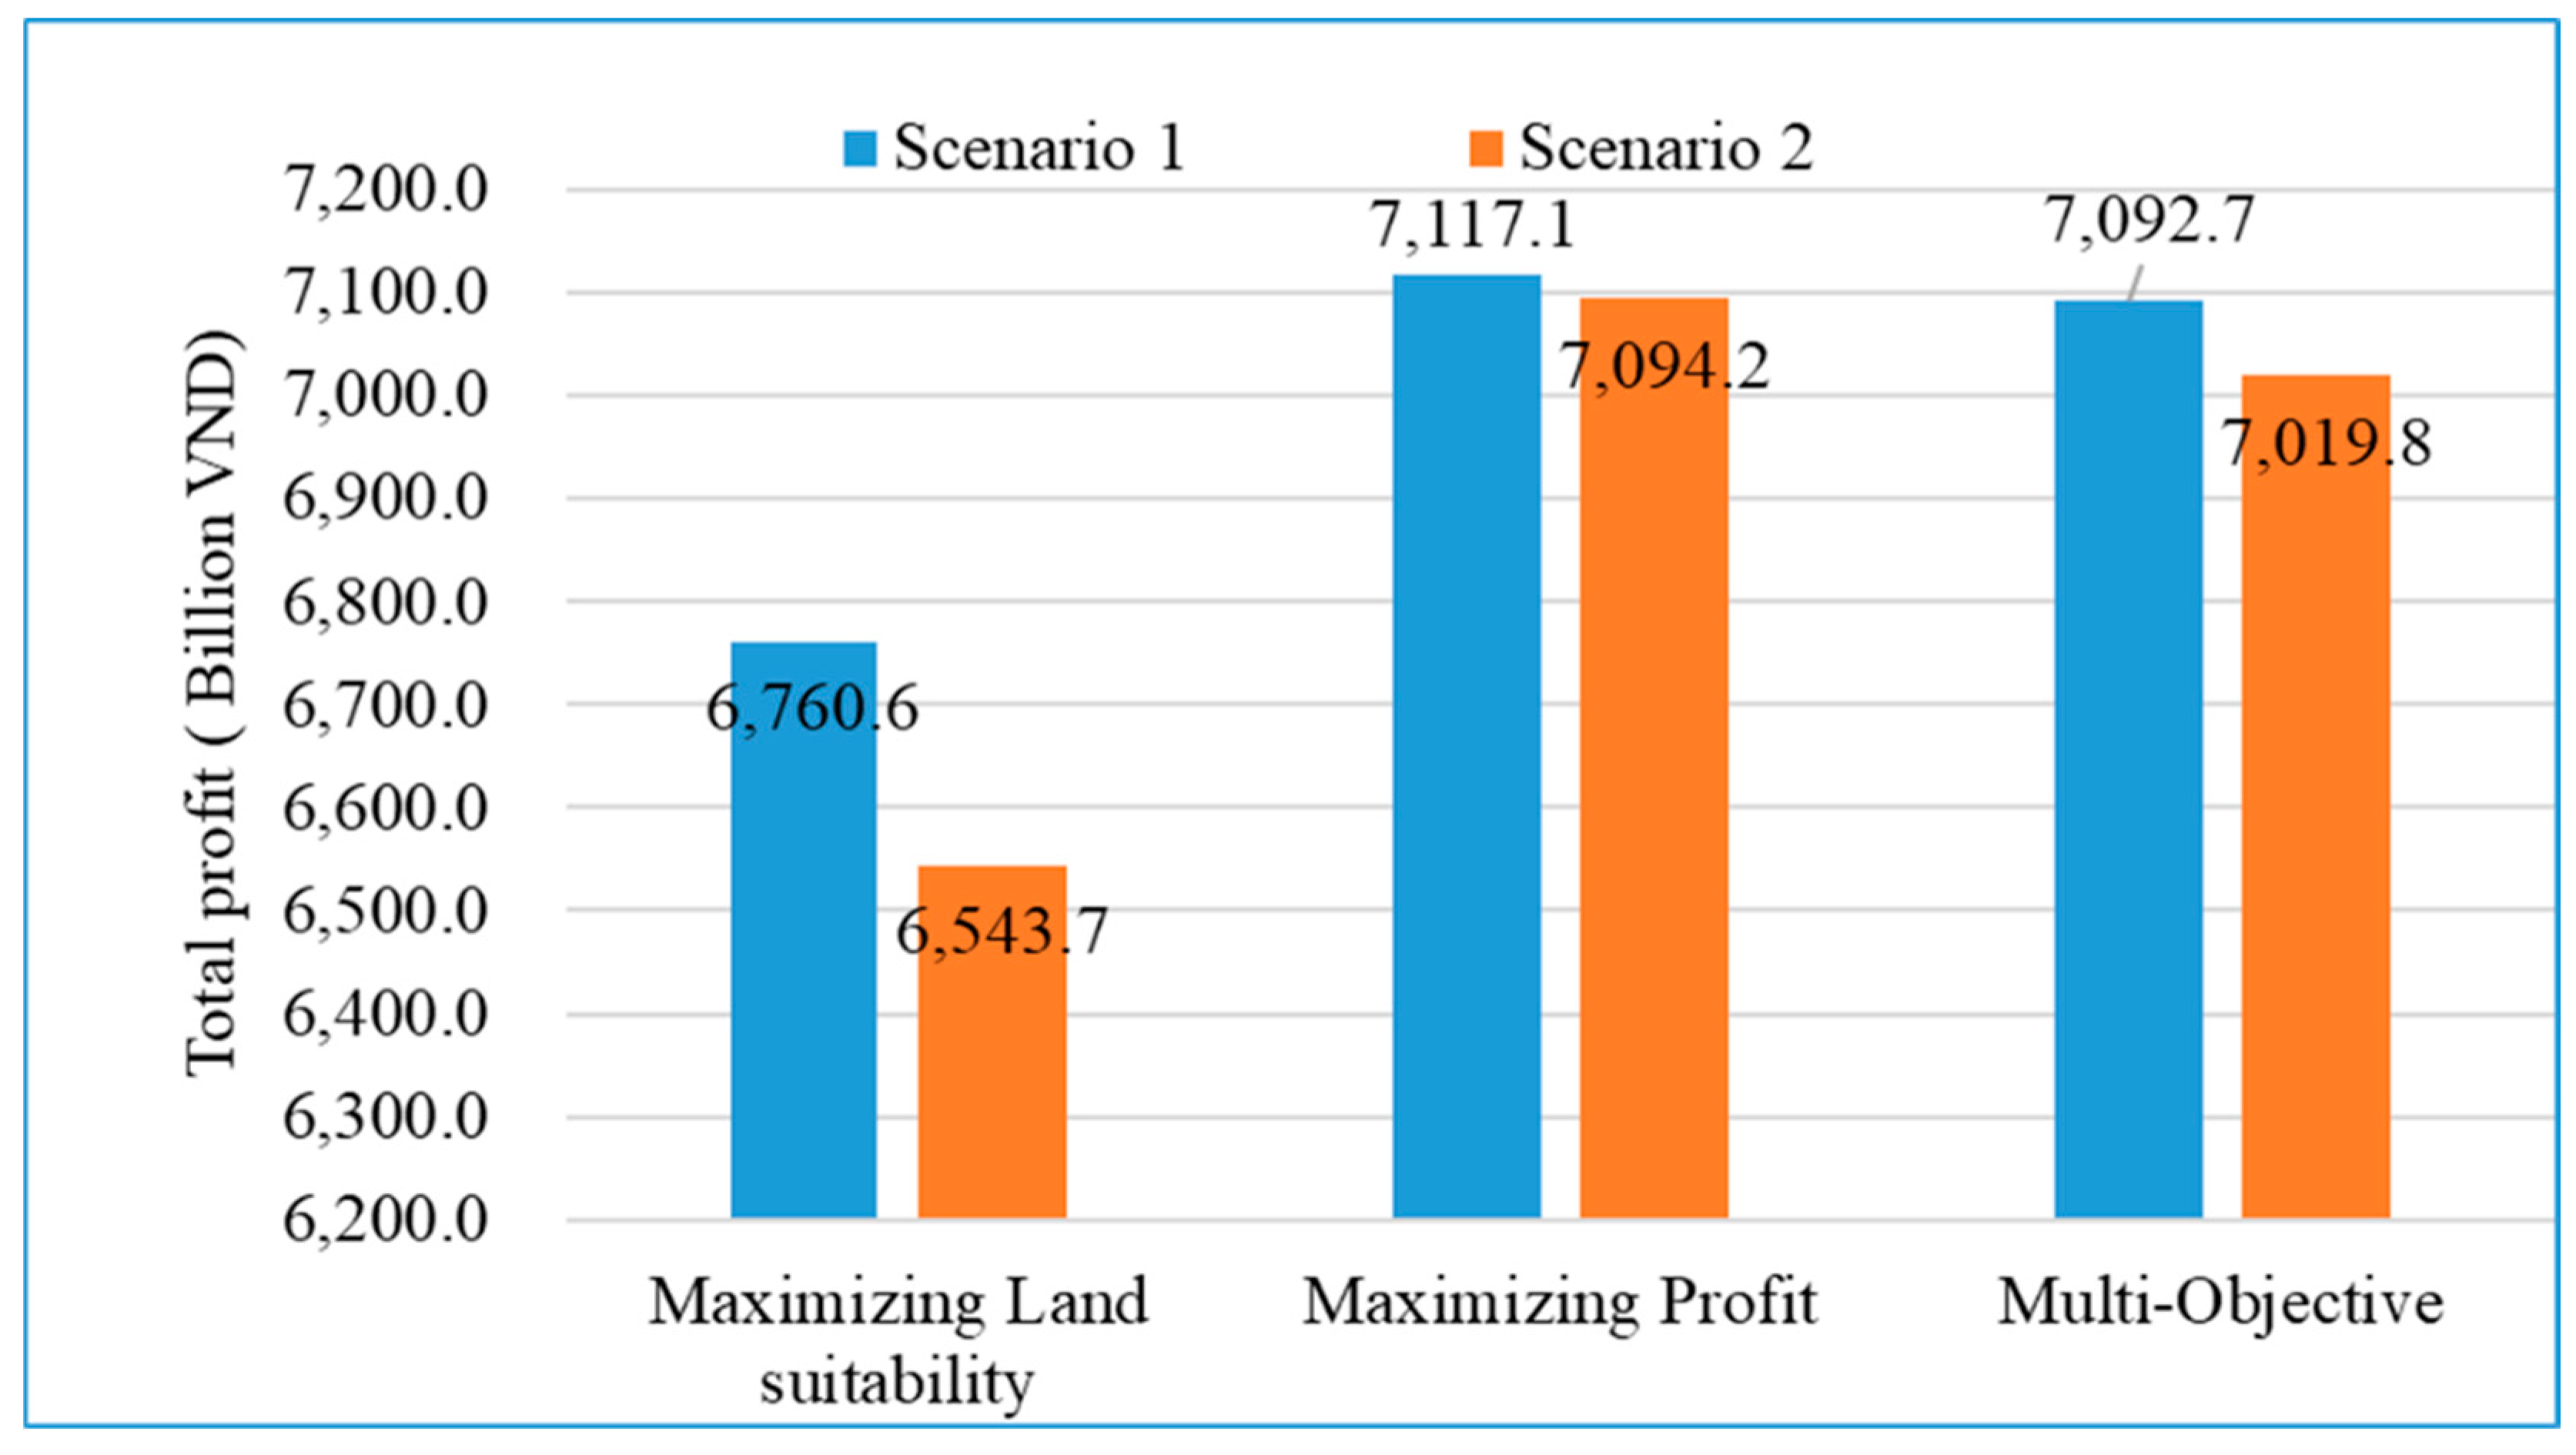
Figure 9.
Different maps in 2015 of scenario 1 between the multi-objective map and the land-use map. (a) Optimized map; (b) Land-use map in 2015; (c) Areas to be converted.
Figure 9.
Different maps in 2015 of scenario 1 between the multi-objective map and the land-use map. (a) Optimized map; (b) Land-use map in 2015; (c) Areas to be converted.
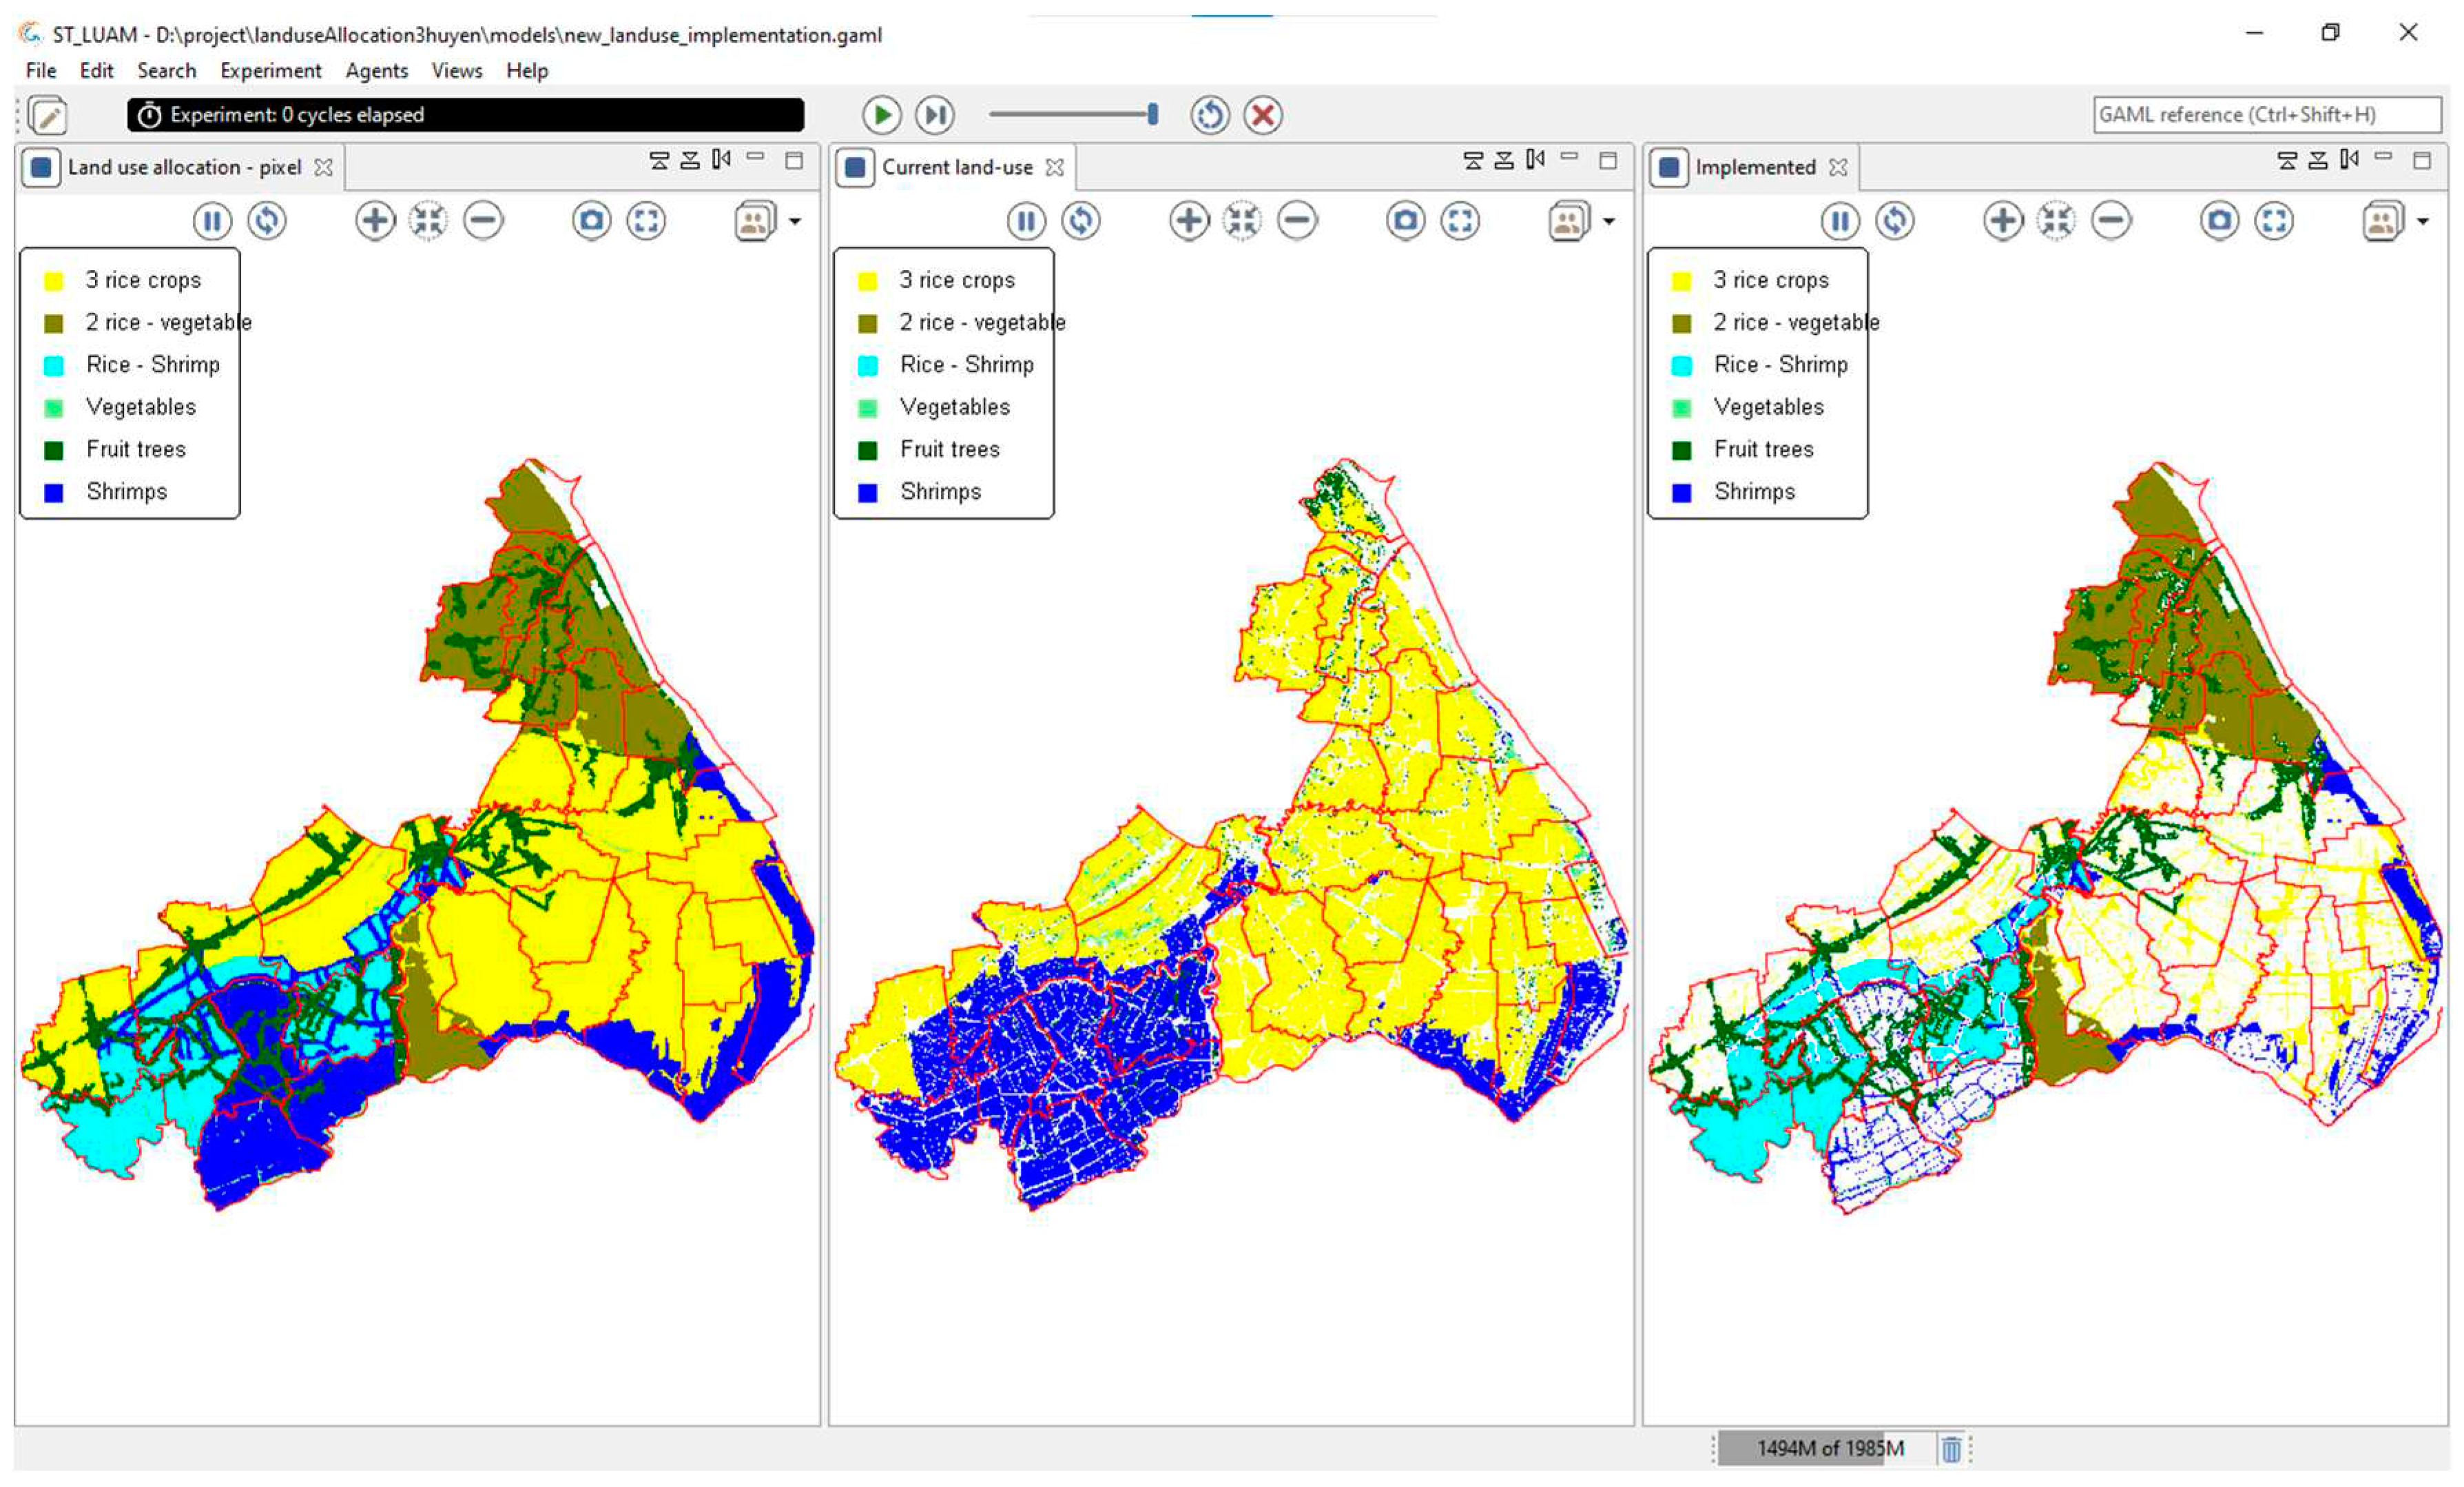

Table 1.
Socio-economic factors related to land-use.
| Factor group | Factors | Source |
|---|---|---|
| Economic | Profit | Santiphop et al. [26]; Liu and Xia [27]; Le et al. [28]; Pham et al. [29] |
| Capital, cost | Le et al. [28]; Sofi et al [30] | |
| Household capital | Bui et al. [31]; | |
| Market demands | Santiphop et al. [26]; Liu and Xia [27] | |
| Social | Labor | Pham et al. [29]; Sofi et al [30] |
| Educational level | Bui et al. [31]; | |
| Neigborhood effect | Le et al. [32]; | |
| Infrastructure (road, canels) | Le et al. [28]; Liu and Xia [27] | |
| Environment | Risk of land-use | Nghi and Hien [33]; Pham et al. [29] |
| Natural factors: soil, water | Most related research |
Table 2.
Socio-economic and environmental factors of LUTs.
| LUT | Labor demand | Profits | Environmental benefits | Risk in cultivation | |
| (Day/year/ha) | (million VND/ha) | ||||
| LUT1 | 3 rice crops | 92 | 58.48±4.78 | 3.27±1.18 | 3.20±1.19 |
| LUT2 | 2 rice crops | 78 | 42.42±4.13 | 3.96±1.26 | 2.62±0.68 |
| LUT3 | Rice – Vegetable | 121 | 80.27±4.96 | 4.02±1.00 | 2.51±0.81 |
| LUT4 | Rice – shrimp | 86 | 86.62±7.02 | 4.22±0.87 | 2.96±0.92 |
| LUT5 | Annual crops | 233 | 88.07±5.59 | 3.18±1.18 | 3.36±1.01 |
| LUT6 | Fruit trees | 115 | 184.00±34.83 | 3.42±1.06 | 3.62±0.85 |
| LUT7 | Shrimp | 217 | 277.23±30.16 | 3.16±1.01 | 4.24±1.08 |
Table 3.
Communes organized into groups based on economic potential.
| Dictrict | Communes | ||
|---|---|---|---|
| Group 1 | Group 2 | Group 3 | |
| Long Phu | Truong Khanh, Tan Thanh, | Long Phu, Song Phung, Hau Thanh | Long Duc, Chau Khanh, Tân Hung, Phu Huu |
| Tran De | Trung Binh, Lich Hoi Thuong, Thanh Thoi Thuan, Vien Binh | Vien An | Dai An 2, Lieu Tu, Tai Van, Thanh Thoi An |
| My Xuyen | Hoa Tu 1, Hoa Tu 2, Ngoc To, Đại Tâm, TT My Xuyen | Ngoc Dong, Gia Hoa 1, Gia Hoa 2 | Tham Don, Thanh Phu, Thanh Quoi |
| Household’s income per year | NRC qualified (greater than 30 Million VND) |
Not up to NRC standard (20-28 Million VND) | Not up to NRC standard(< 20 Million VND) |
| Poverty rate | NRC qualified ≤ 4% |
NRC qualified (≤ 6%) |
Not up to NRC standard NRC (≤ 23%) |
Table 4.
A summary of the factors influencing agricultural land-use.
| Factors | Detailed | Impact on LUTs and allocation orders | Applied |
|---|---|---|---|
| Economic | Profit | LUT7, LUT6, LUT5, LUT4, LUT3, LUT1, LUT2. | Optimization |
| Capacity of investment | LUT7, LUT6, LUT5, LUT4, LUT3, LUT1, LUT2 | Allocation | |
| Social | Labor days | LUT5, LUT7, LUT3, LUT6, LUT1, LUT4, LUT2 | Optimization |
| Road systems | LUT5, LUT6, LUT7, LUT1, LUT4, LUT3, LUT2 | Allocation | |
| Channel systems | LUT5, LUT6, LUT7, LUT4, LUT3, LUT1, LUT2 | Allocation | |
| Neighboring LUT | LUT7, LUT4, LUT1, LUT3, LUT2 | Allocation | |
| Environment | Land suitability | Based on Land suitability order | Optimization |
| Risk of LUT | LUT7, LUT6, LUT1, LUT5, LUT4, LUT3, LUT2 | Optimization | |
| Benefit of environment | LUT2, LUT4, LUT3, LUT1, LUT6, LUT5, LUT7 | Optimization |
Table 5.
Land suitability of land mapping units.
| LMU | Soil type |
Acid sulphate occurred |
Salinity (‰) | Persistence of Salinity (months) | Irrigation capability(months) | LUT1 | LUT2 | LUT3 | LUT4 | LUT5 | LUT6 | LUT7 |
| 1 | Anthrosols | No | 2-4 | 5 | 7 | 0.00 | 0.00 | 0.00 | 0.00 | 0.33 | 1.00 | 0.00 |
| 2 | Fluvisols | Active at <50cm | 2-4 | 6 | 6 | 0.00 | 0.67 | 0.67 | 0.00 | 0.33 | 0.00 | 0.00 |
| 3 | Fluvisols | Active at >50cm | 2-4 | 5 | 7 | 0.00 | 0.67 | 0.67 | 0.00 | 0.67 | 0.00 | 0.00 |
| 4 | Anthrosols | No | 4-6 | 5 | 7 | 0.00 | 0.00 | 0.00 | 0.67 | 0.00 | 0.00 | 0.33 |
| 5 | Arenosols | No | 4-6 | 6 | 6 | 0.00 | 0.33 | 0.33 | 0.00 | 0.67 | 0.67 | 0.00 |
| 6 | Fluvisols | Active at <50cm | 4-6 | 5 | 7 | 0.00 | 1.00 | 0.67 | 0.00 | 0.67 | 0.33 | 0.00 |
| 7 | Anthrosols | Active at >50cm | 12-20 | 12 | 0 | 0.00 | 0.00 | 0.00 | 0.33 | 0.00 | 0.00 | 0.67 |
| 8 | Fluvisols | No | 12-20 | 12 | 0 | 0.00 | 0.00 | 0.00 | 0.33 | 0.00 | 0.00 | 0.67 |
| 9 | Fluvisols | Active at <50cm | 12-20 | 12 | 0 | 0.00 | 0.00 | 0.00 | 0.67 | 0.00 | 0.00 | 1.00 |
| 10 | Fluvisols | Active at <50cm | 2-4 | 3 | 9 | 0.00 | 0.67 | 0.33 | 0.00 | 0.33 | 0.67 | 0.00 |
| 11 | Anthrosols | Active at >50cm | 4-6 | 5 | 7 | 0.00 | 0.67 | 0.33 | 0.00 | 0.67 | 0.00 | 0.00 |
| 12 | Fluvisols | No | 6-8 | 3 | 9 | 0.00 | 1.00 | 0.67 | 0.00 | 0.67 | 0.33 | 0.00 |
| 13 | Arenosols | No | 2-4 | 3 | 9 | 0.00 | 0.33 | 0.00 | 0.00 | 1.00 | 0.67 | 0.00 |
| 14 | Fluvisols | Potential at <50cm | 8-12 | 6 | 6 | 0.00 | 0.00 | 0.00 | 1.00 | 0.33 | 0.00 | 0.33 |
| 15 | Anthrosols | Potential at >50cm | 6-8 | 6 | 6 | 0.00 | 0.00 | 0.00 | 0.00 | 0.67 | 1.00 | 0.00 |
| 16 | Anthrosols | Potential at >50cm | 2-4 | 3 | 9 | 0.00 | 0.33 | 0.33 | 0.00 | 0.67 | 1.00 | 0.00 |
| 17 | Fluvisols | Active at <50cm | 8-10 | 6 | 6 | 0.00 | 0.00 | 0.00 | 0.00 | 0.67 | 0.33 | 0.67 |
| 18 | Anthrosols | Potential at >50cm | <2 | 5 | 7 | 0.00 | 0.00 | 0.00 | 0.00 | 1.00 | 0.33 | 0.00 |
| 19 | Anthrosols | Potential at >50cm | <2 | 3 | 9 | 0.00 | 0.00 | 0.00 | 0.00 | 1.00 | 0.33 | 0.00 |
| 20 | Fluvisols | No | 2-4 | 3 | 9 | 1.00 | 0.67 | 0.67 | 0.00 | 0.67 | 1.00 | 0.00 |
| 21 | Fluvisols | No | 2-4 | 6 | 6 | 0.33 | 0.67 | 0.67 | 0.00 | 0.67 | 1.00 | 0.00 |
| 22 | Anthrosols | Potential at >50cm | 2-4 | 5 | 7 | 0.00 | 0.00 | 0.00 | 0.00 | 0.67 | 1.00 | 0.00 |
| 23 | Anthrosols | No | 2-4 | 2 | 10 | 0.00 | 0.00 | 0.00 | 0.00 | 0.67 | 1.00 | 0.00 |
| 24 | Arenosols | No | 8-10 | 5 | 7 | 0.00 | 0.00 | 0.00 | 0.00 | 0.67 | 0.67 | 0.33 |
| 25 | Fluvisols | Active at >50cm | 2-4 | 6 | 6 | 0.67 | 0.67 | 1.00 | 0.00 | 0.67 | 0.00 | 0.00 |
| 26 | Fluvisols | Potential at <50cm | 6-8 | 6 | 6 | 0.00 | 0.67 | 0.67 | 0.00 | 0.33 | 0.33 | 0.00 |
| 27 | Fluvisols | No | 6-8 | 3 | 9 | 0.67 | 0.67 | 0.67 | 0.00 | 0.67 | 0.67 | 0.00 |
| 28 | Anthrosols | Active at >50cm | 2-4 | 3 | 9 | 0.00 | 0.00 | 0.00 | 0.00 | 0.67 | 1.00 | 0.00 |
Notes: 1.00: Highly suitable, 0.67: Moderately suitable, 0.33: Marginally suitable, 0.00: Non-suitable.
Table 6.
Restricted area for the LUTs in the two scenarios.
| LUT | Scenario 1 | Scenario 2 | ||
| Lower bound (ha) | Upper bound (ha) | Lower bound (ha) | Upper bound (ha) | |
| LUT1 | 0 | Unlimited | 0 | Unlimitted |
| LUT2 | 0 | Unlimited | 0 | Unlimitted |
| LUT3 | 0 | 12,768.00 | 0 | 15,436.00 |
| LUT4 | 0 | Unlimitted | 0 | Unlimitted |
| LUT5 | 0 | 2,100.01 | 0 | 2,500.01 |
| LUT6 | 0 | 8,799.00 | 0 | 8,936.00 |
| LUT7 | 0 | 16,697.01 | 0 | 19,236.01 |
Disclaimer/Publisher’s Note: The statements, opinions and data contained in all publications are solely those of the individual author(s) and contributor(s) and not of MDPI and/or the editor(s). MDPI and/or the editor(s) disclaim responsibility for any injury to people or property resulting from any ideas, methods, instructions or products referred to in the content. |
© 2023 by the authors. Licensee MDPI, Basel, Switzerland. This article is an open access article distributed under the terms and conditions of the Creative Commons Attribution (CC BY) license (http://creativecommons.org/licenses/by/4.0/).
Copyright: This open access article is published under a Creative Commons CC BY 4.0 license, which permit the free download, distribution, and reuse, provided that the author and preprint are cited in any reuse.


