Submitted:
28 November 2023
Posted:
30 November 2023
You are already at the latest version
Abstract
Keywords:
1. Introduction
2. Materials and Methods
2.1. Blends Characterization
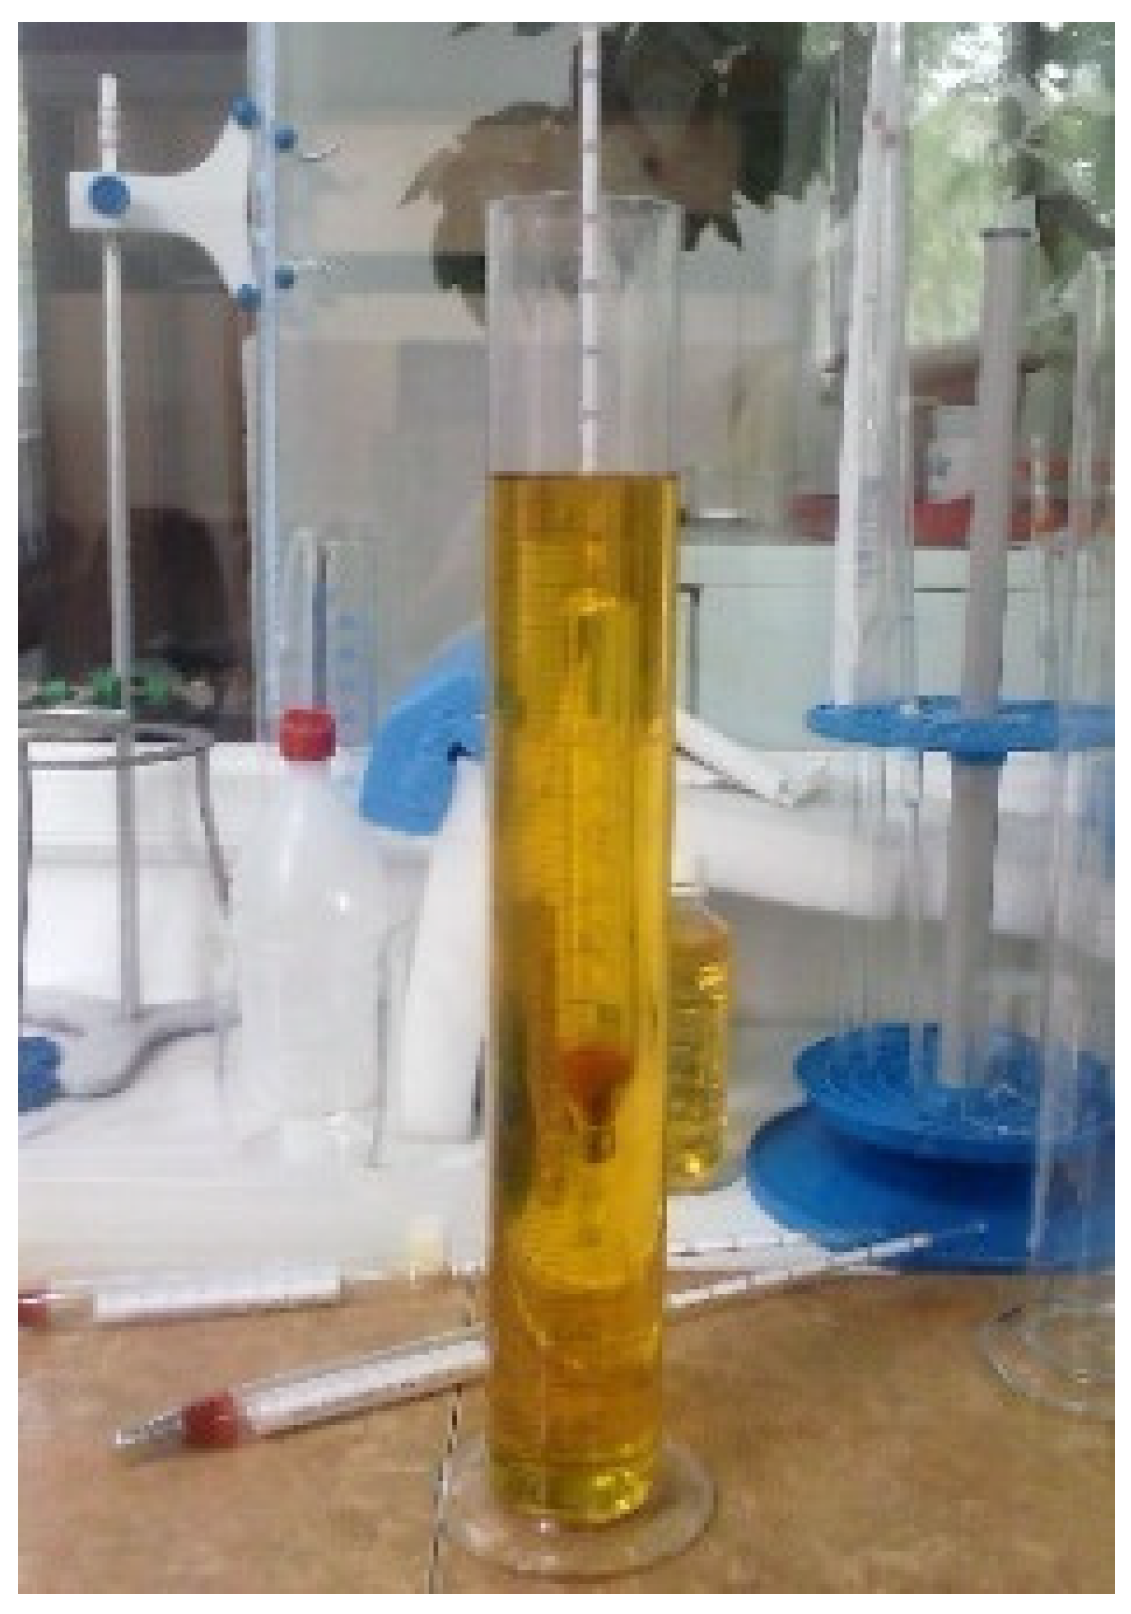
Density of the Fuel Blends Determination
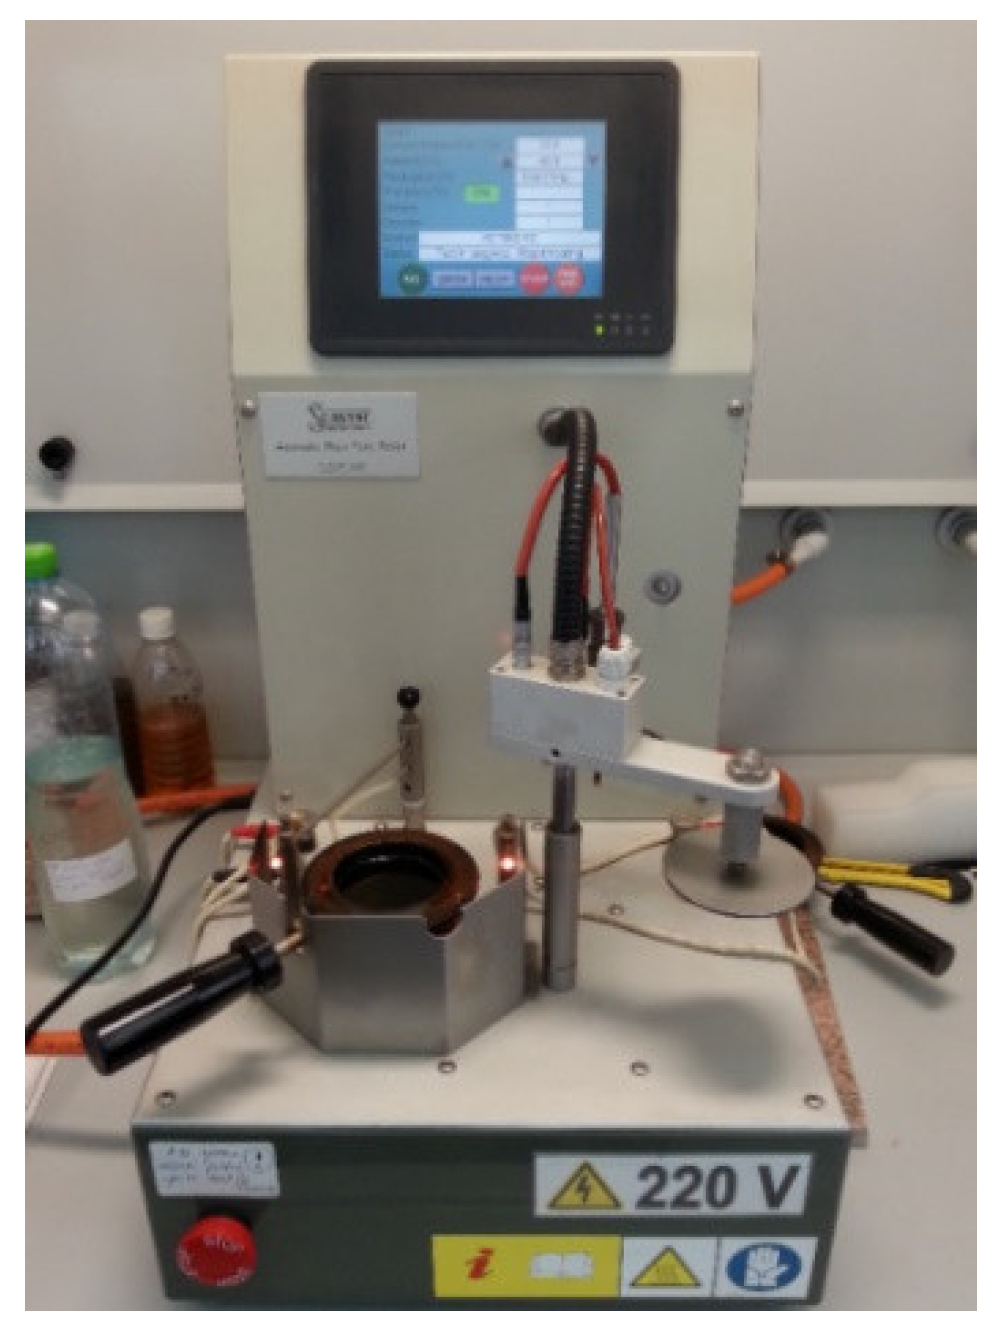
Flash Point Measurements
Kinematic Viscosity Measurements
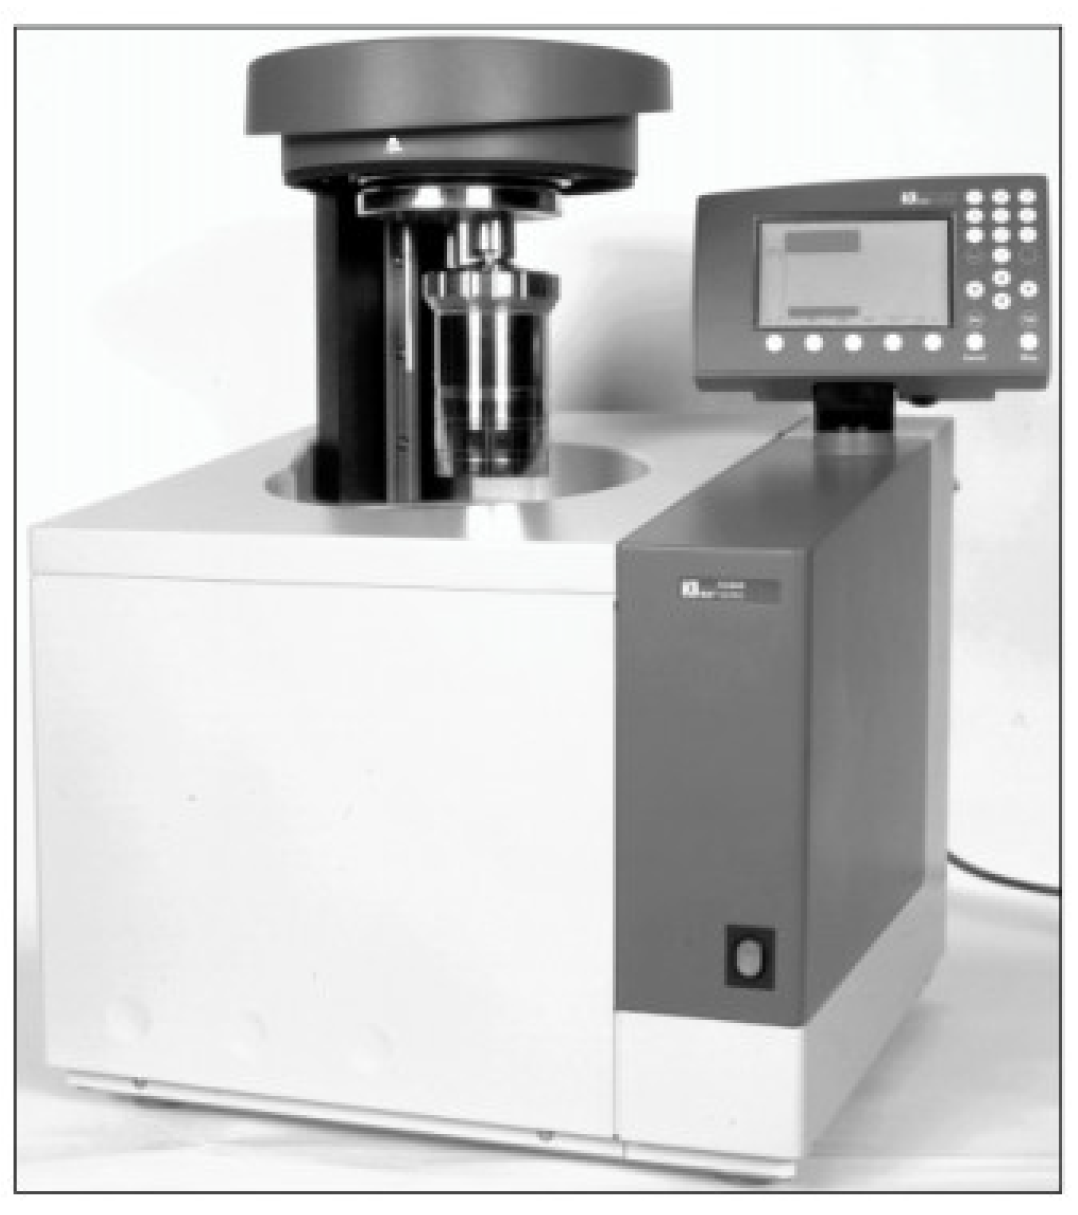
Low Calorific Power Determination
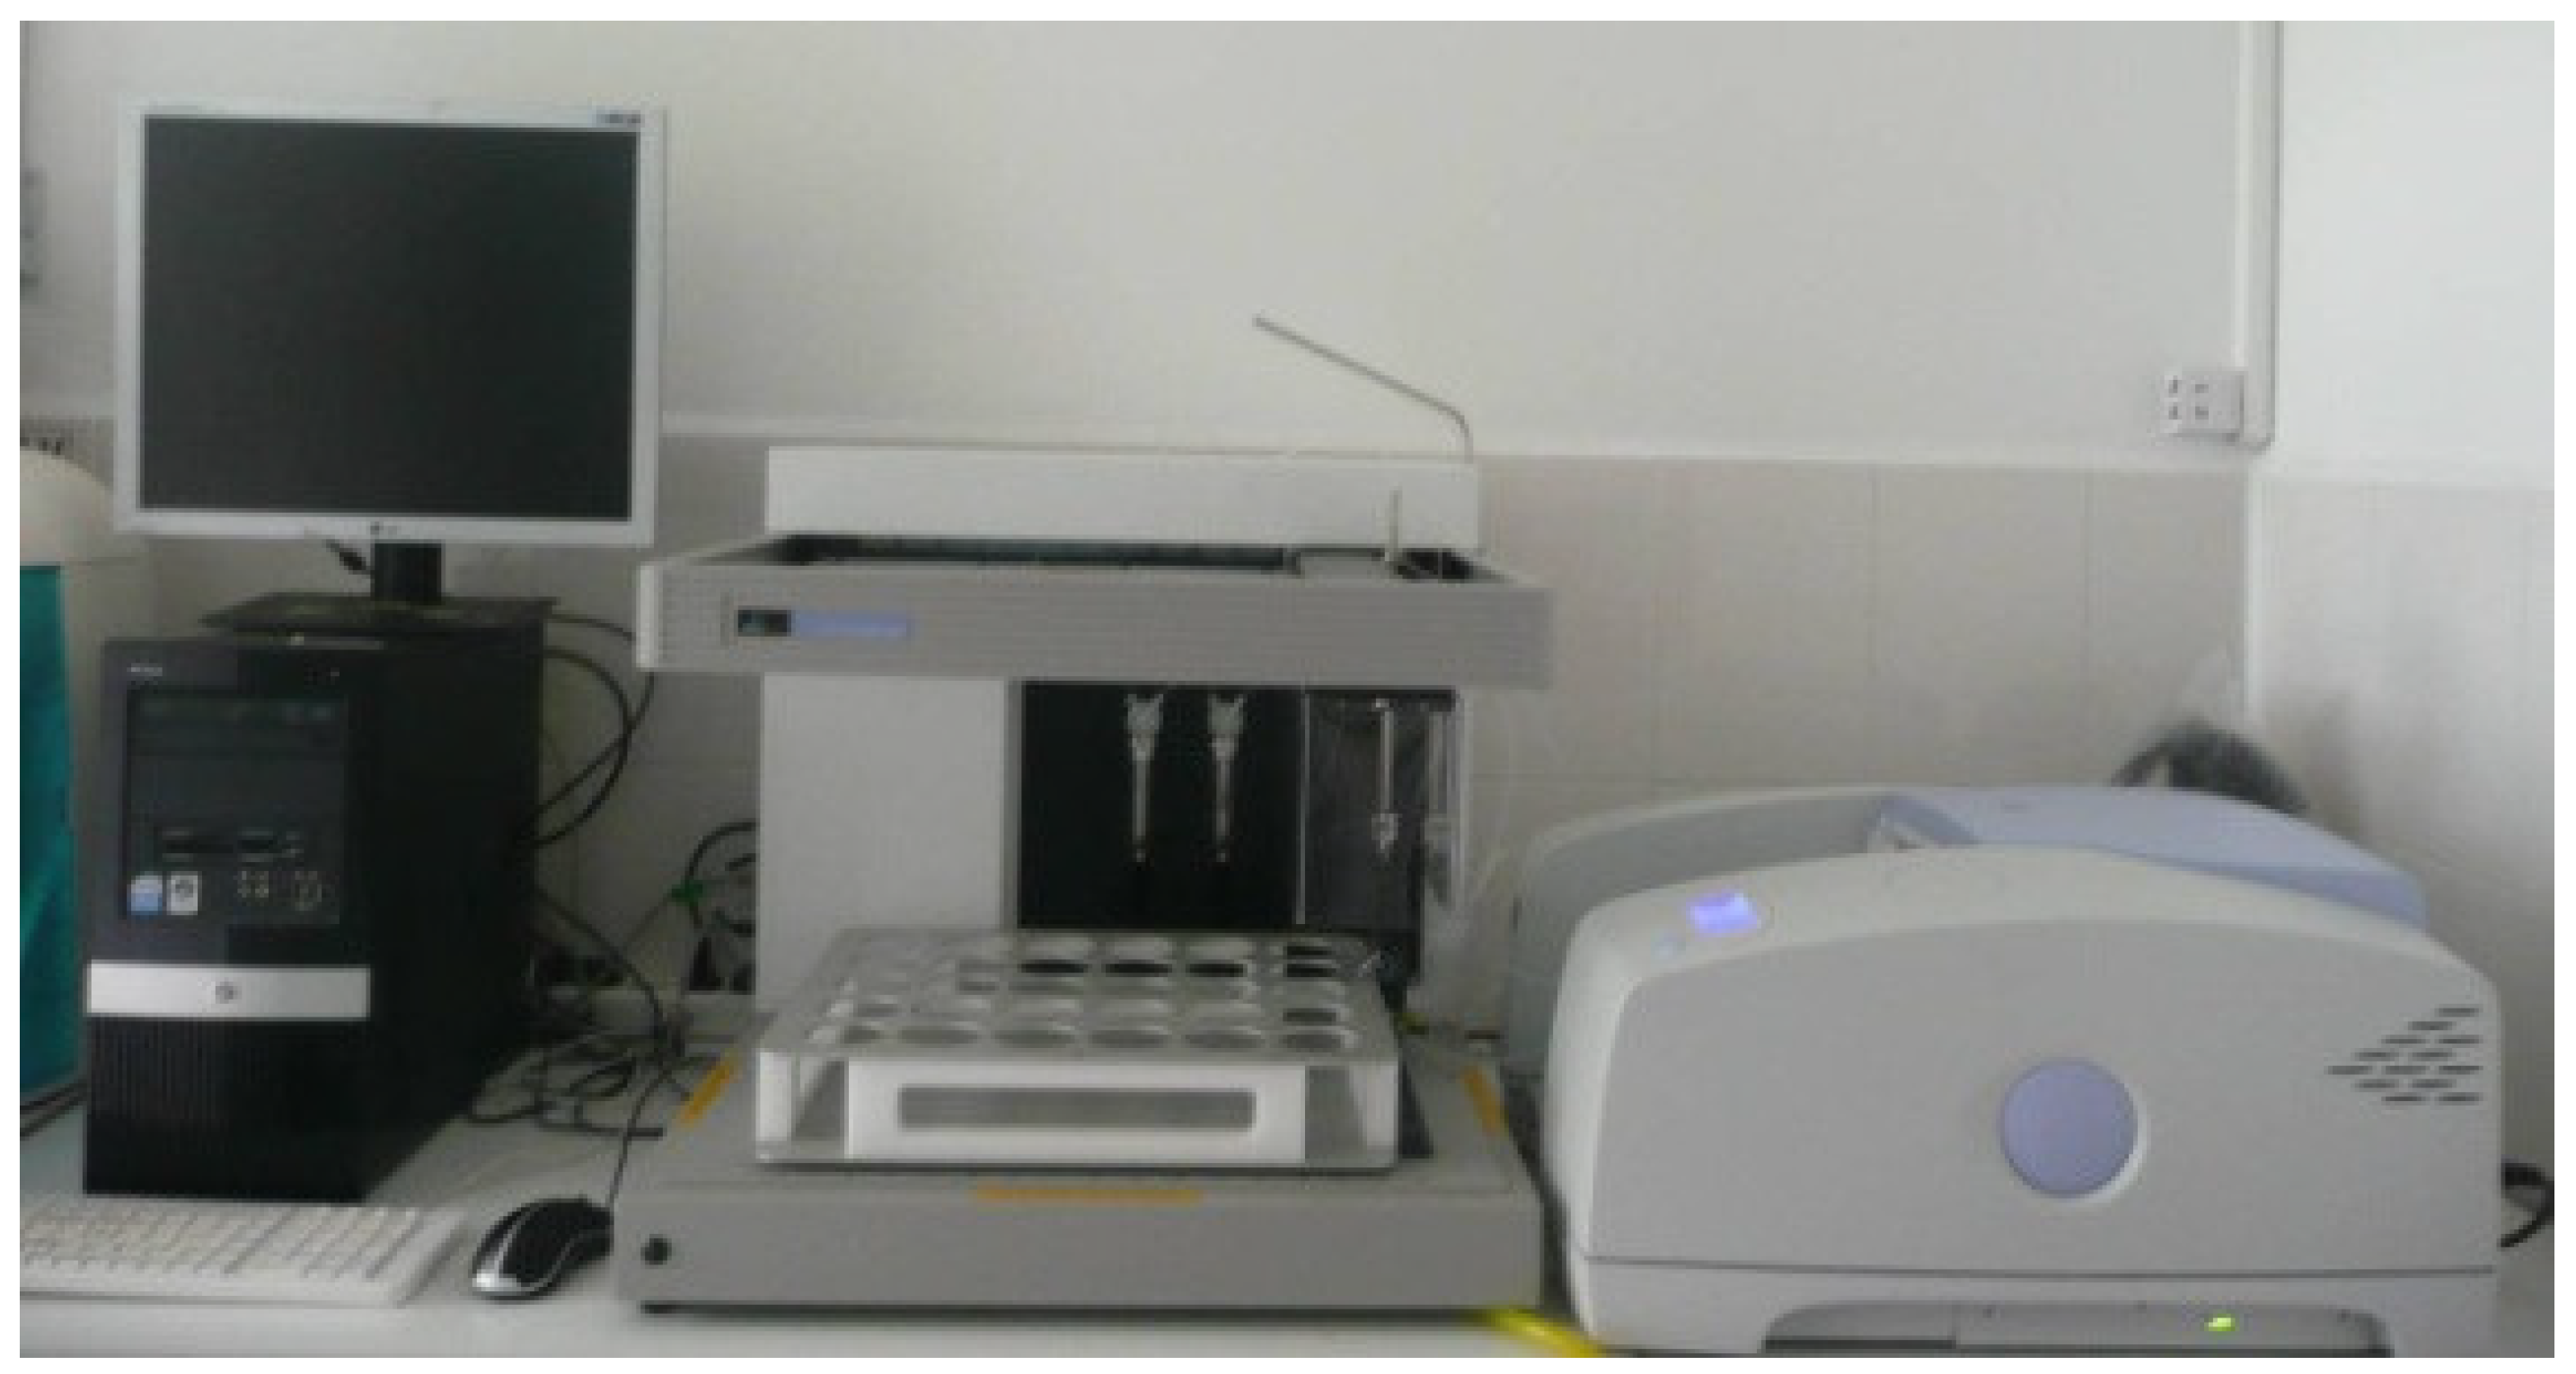
FTIR Analysis (Fourier Transform Infrared Spectroscopy)
Elemental Analysis
2.2. Theoretical Calculation of the Combustion Process
2.3. Engine Experimental Procedure
2.4. Gaseous Emissions Measurements
3. Results and Discussions
3.1. Physical-Chemical Properties for Fuel Blends Experimental Results
- Flash point, kinematic viscosity, and density exhibit an increasing trend with the rise in biodiesel concentration. This correlation suggests a notable impact of biodiesel content on these physical properties.
- A decrease in low calorific power is observed with an increasing biodiesel concentration, indicating an undesirable property. This observation prompts further investigation into the implications for combustion efficiency which may result in a much larger amount of fuel to be required than in the case of a Jet-A fuel.
- Elemental analysis reveals that as biodiesel concentration increases, carbon and hydrogen content decrease, while oxygen content increases. This suggests a potential decrease in resulting CO2 concentration during the combustion process, attributed to a reduced need for oxygen.
- Analysis across all studied fuel blends indicates consistent trends. The kinematic viscosity at 40°C, flash point, and low calorific power exhibit a proportional increase with the increase in biodiesel percentage. This uniformity emphasizes the predictable influence of biodiesel concentration on these properties.
- Elemental analysis further establishes that the rise in biodiesel percentage corresponds to an increase in oxygen content and a decrease in carbon content. These findings contribute to a comprehensive understanding of the elemental composition changes induced by varying alcohol concentrations in fuel blends.
3.2. Combustion Reaction Analysis
| Blend | MO [kg] | Mair [kg] | CO2 [kg] | H2O [kg] |
| Ke | 3.32 | 14.45 | 3.12 | 1.20 |
| Ke+10%BP | 3.29 | 14.29 | 3.09 | 1.19 |
| Ke+20%BP | 3.23 | 14.05 | 3.05 | 1.18 |
| Ke+30%BP | 3.21 | 13.97 | 3.04 | 1.17 |
| BP | 2.95 | 12.85 | 2.84 | 1.11 |
3.3. Micro-Turbojet Engine Experimental Results
3.3.1. Experimental Results
3.3.2. Jet Engine Cycle Analysis
4. Conclusions
Author Contributions
Data Availability Statement
Acknowledgments
Conflicts of Interest
References
- Bogdanov, D.; Gulagi, A.; Fasihi, M.; Breyer, C. Full energy sector transition towards 100% renewable energy supply: Integrating power, heat, transport and industry sectors including desalination. Appl. Energy 2021, 283, 116273. [Google Scholar] [CrossRef]
- Flightpath 2050 Europe’s Vision for Aviation Maintaining Global Leadership & Serving Society’s Needs Report of the High Level Group on Aviation Research. Available online: https://www.arcs.aero/sites/default/files/downloads/Bericht_Flightpath_2050.pdf.
- Shah, S.H.; Raja, I.A.; Rizwan, M.; Rashid, N.; Mahmood, Q.; Shah, F.A.; Pervez, A. Potential of microalgal biodiesel production and its sustainability perspectives in Pakistan. Renew. Sustain. Energy Rev. 2018, 81, 76–92. [Google Scholar] [CrossRef]
- Zhang, H.; Fang, Y.; Wang, M.; Appels, L.; Deng, Y. Prospects and perspectives foster enhanced research on bio-aviation fuels. J. Environ. Manag. 2020, 274, 111214. [Google Scholar] [CrossRef] [PubMed]
- Kandaramath Hari, T.; Yaakob, Z.; Binitha, N.N. Aviation Bio-fuel From Renewable Resources: Routes, Opportunities and Challenges. Renew. Sustain. Energy Rev. 2015, 42, 1234–1244. [Google Scholar] [CrossRef]
- Hemighaus, G., Boval, T., Bosley, C., Organ, R., Lind, J., Brouette, R., Thompson, T., Lynch, J., and Jones, J., Alternative Jet Fuels: A Supplement to Chevron’s Aviation Fuels Technical Review. Chevron Corporation, San Ramon, CA, USA, 2006.
- Kubickova, I.; Kubicka, D. Utilization of Triglycerides and Related Feedstocks for Production of Clean Hydrocarbon Fuels and Petrochemicals: A Review. Waste Biomass Valorization 2010, 1, 293–308. [Google Scholar] [CrossRef]
- Moser, B.R. Camelina (Camelina sativa L.) Oil as a Biofuels Feedstock: Golden Opportunity or False Hope. Lipid Technol. 2010, 22, 270–273. [Google Scholar] [CrossRef]
- Arkoudeas, P.; Kalligeros, S.; Zannikos, F.; Anastopoulos, G.; Karonis, D.; Korres, D.; Lois, E. Study of Using JP-8 Aviation Fuel and Biodiesel in CI Engines. Energy Convers. Manag. 2003, 44, 1013–1025. [Google Scholar] [CrossRef]
- Saxenaa, P.; Jawaleb, S.; Joshipurac, M.H. A Review on Prediction of Properties of Biodiesel and Blends of Biodiesel. Procedia Eng. 2013, 51, 395–402. [Google Scholar] [CrossRef]
- Roberts, W.L., Bio Jet Fuels. The Fifth International Biofuels Conference, Raleigh, NC, USA, 2008.
- Wardle, D.A. Global Sale of Green Air Travel Supported Using Biodiesel. Renew. Sustain. Energy Rev. 2003, 7, 1–64. [Google Scholar] [CrossRef]
- Saynor, B., Bauen, A., and Leach, M., The Potential for Renewable Energy Sources in Aviation. PRESAV Final Report. 2003.
- Corscadden, K.; Yang, J.; Xin, Z.; He, Q.S.; Niu, H. An overview on performance characteristics of bio-jet fuels. Fuel 2018, 237, 916–936. [Google Scholar] [CrossRef]
- Kim, D.; Violi, A. Hydrocarbons for the next generation of jet fuel surrogates. Fuel 2018, 228, 438–444. [Google Scholar] [CrossRef]
- AlNouss, A.; McKay, G.; Al-Ansari, T. A techno-economic-environmental study evaluating the potential of oxygen-steam biomass gasification for the generation of value-added products. Energy Convers Manag. 2019, 196, 664–676. [Google Scholar] [CrossRef]
- Siew, E.; Whya, K.; Hwai, C.O.; VoonLeeb, H.; Gana, Y.Y.; Chen, W.-H.; Chonge, C.T. Renewable aviation fuel by advanced hydro-processing of biomass: Challenges and perspective. Energy Convers. Manag. 2019, 199, 112015. [Google Scholar] [CrossRef]
- Junming Xu, Feng Long, Jianchun Jiang, Fanglin Li, QiaolongZhai, Fei Wang, Peng Liu, Jing Li. Integrated catalytic conversion of waste triglycerides to liquid hydrocarbons for aviation bio-fuels. Journal of Cleaner Production 2019, 222, 784–792. [Google Scholar] [CrossRef]
- Abd El-Fatah Abomohra, MahdyElsayed, Sivakumar Esakkimuthu, Mostafa El-Sheekh, Dieter Hanelt. Potential of fat, oil and grease (FOG) for biodiesel production: A critical review on the recent progress and future perspectives. Prog. Energy Combust. Sci. 2020, 81, 100868. [Google Scholar] [CrossRef]
- Narendra Krishania, Upendra Rajak, Prem Kumar Chaurasiya, Thokchom Subhaschandra Singh, Anil Kumar Birru, Tikendra Nath Verma. Investigations of spirulina, waste cooking and animal fats blended biodiesel fuel on auto-ignition diesel engine performance, emission characteristics. Fuel 2020, 276, 118123. [Google Scholar] [CrossRef]
- Mata, T.M.; Mendes, A.M.; Caetano, N.S.; Martins, A.A. Properties and sustainability of biodiesel from animal fats and fish oil. Chem Eng Trans 2014, 38, 175–180. [Google Scholar] [CrossRef]
- Alptekin, E.; Canakci, M.; Sanli, H. Biodiesel production from vegetable oil and waste animal fats in a pilot plant. Waste Manag. 2014, 34, 2146–2154. [Google Scholar] [CrossRef]
- Mata, T.M.; Cardoso, N.; Ornelas, M.; Neves, S.; Caetano, N.S. Evaluation of two purification methods of biodiesel from beef tallow, pork fat, and chicken fat. Energy Fuels 2011, 25, 4756–4762. [Google Scholar] [CrossRef]
- Sander, A.; Koscak, M.A.; Kosir, D.; Milosavljevic, N.; Vukovic, J.P.; Magic, L. The influence of animal fat type and purification conditions on biodiesel quality. Renew. Energy 2018, 118, 752–760. [Google Scholar] [CrossRef]
- Ndiaye, M.; Arhaliass, A.; Legrand, J.; Roelens, G.; Kerihuel, A. Reuse of waste animal fat in biodiesel: Biorefining heavily-degraded contaminant-rich waste animal fat and formulation as diesel fuel additive. Renew. Energy 2020, 145, 1073–1079. [Google Scholar] [CrossRef]
- Habib, M.S.; Asghar, O.; Hussain, A.; Imran, M.; Mughal, M.P.; Sarkar, B. A robust possibility programming approach toward animal fat-based biodiesel supply chain network design under uncertain environment. J. Clean. Prod. 2020, 122403. [Google Scholar] [CrossRef]
- Agrisoma Biosciences Inc. Biojet Blend Fuels Transatlantic Flight. Biomass Magazine. 2018. Available online: http://biomassmagazine.com/articles/15596/biojet-blend-fuels-transatlantic-flight (accessed on 9 August 2022).
- Rucinski, T. United Airlines Targets 50 Percent Cut in Greenhouse Gas Emissions. 2018. Available online: https://www.reuters.com/article/us-ual-emissions-idUSKCN1LT32A (accessed on 9 August 2022).
- Chakraborty, D.; Kotoky, A. Oil from Seeds Helps Propel SpiceJet’s First. 2018, Bloomberg. Available online: https://www.bloomberg.com/news/articles/2018-08-27/india-s-spicejet-makes-maiden-flight-usingblended-bio-fuel (accessed on 9 August 2022).
- Willige, A. An Airbus Powered by Cooking Oil: Is Sustainable Aviation Fuel the Future of Aviation? 2022. Available online: https://climatechampions.unfccc.int/an-airbus-powered-by-cooking-oil-is-sustainable-aviation-fuel-the-future-of-aviation/?gclid=CjwKCAiAqt-dBhBcEiwATw-ggLj4hxSBtkp9Ys0LBXCBifrE-Iqyr4Rrq7SqUYKgCWshS-8sBKmBZhoCtnIQAvD_BwE (accessed on 21 December 2022).
- Sundararaj, R.H.; Kumar, R.D.; Raut, A.K.; Sekar, T.C.; Pandey, V.; Kushari, A.; Puri, S.K. Combustion and emission characteristics from biojet fuel blends in a gas turbine combustor. Energy 2019, 182, 689–705. [Google Scholar] [CrossRef]
- Suchocki, T.; Witanowski, Ł.; Lampart, P.; Kazimierski, P.; Januszewicz, K.; Gawron, B. Experimental investigation of performance and emission characteristics of a miniature gas turbine supplied by blends ofkerosene and waste tyre pyrolysis oil. Energy 2021, 215, 119125. [Google Scholar] [CrossRef]
- Cican, G.; Toma, A.; Pu¸sca¸su, C.; Catana, R. Jet CAT P80 thermal analyses and performance assessment using different fuels types. J. Therm. Sci. 2018, 27, 389–393. [Google Scholar] [CrossRef]
- Cican, G.; Plesu, V.; Deaconu, M.; Toma, A.; Cretu, M. Performances and Emissions Evaluation of a Microturbojet Engine Running on Biodiesel Blends. ASME J. Energy Resour. Technol. 2019, 141, 072003. [Google Scholar] [CrossRef]
- Przysowa, R.; Gawron, B.; Białecki, T.; Ł˛egowik, A.; Merkisz, J.; Jasi’nski, R. Performance and Emissions of a Microturbine and Turbofan Powered by Alternative Fuels. Aerospace 2021, 8, 25. [Google Scholar] [CrossRef]
- Cican, G.; Crunteanu, D.E.; Mirea, R.; Ceatra, L.C.; Leventiu, C. Biodiesel from Recycled Sunflower and Palm Oil—A Sustainable Fuel for Microturbo-Engines Used in Airside Applications. Sustainability 2023, 15, 2079. [Google Scholar] [CrossRef]
- Ratkovská, K.; Hocko, M.; Cˇ ernˇan, J.; Cúttová, M. The Influence of Biofuel on the Operational Characteristics of Small Experimental Jet Engine 1. Mechanics. Mater. Sci. Eng. 2017. [Google Scholar] [CrossRef]
- Balogun, S.A.; Ghazali, I.; Mohammed, A.T.; Hermansyah, D.; Amanah, A.; Kurnia, M.T. Renewable Aviation Fuel: Review of Bio-jet Fuel for Aviation Industry. Eng. Sci. Lett. 2022, 01, 7–11. [Google Scholar] [CrossRef]
- Cican, G.; Deaconu, M.; Mirea, R.; Ceatra, L.; Cretu, M.; Dobre, T. Investigating the Use of Recycled Pork Fat-Based Biodiesel in Aviation Turbo-engines. Processes 2020, 8, 1196. [Google Scholar] [CrossRef]
- JetCat USA, 2008, “Jet Cat Instruction Manual. U.S. Patent No. 6216440.
- Oyerinde, A.Y.; Bello, E.I. Use of Fourier Transformation Infrared (FTIR) Spectroscopy for Analysis of Functional Groups in Peanut Oil Biodiesel and Its Blends. Br. J. Appl. Sci. Technol. 2016, 13, 22178. [Google Scholar] [CrossRef]
- Speight, J.G. Handbook of Industrial Hydrocarbon Processes; Gulf Professional Publishing: Houston, TX, USA, 2020. [Google Scholar]
- 12-809923-0. Available online: https://www.sciencedirect.com/book/9780750686327/handbook-of-industrial-hydrocarbonprocesses (accessed on 9 August 2022).
- Mattingly, J. Elements of Propulsion: Gas Turbines and Rockets, 2nd ed.; American Institute of Aeronautics and Astronautics: Reston, VA, USA, 2006. [Google Scholar]

| Sample | Flash Point [°C] |
Viscosity at 40°C, [cSt] | Density at 22°C, [g/cm3] | Low Calorific Value, [kJ/kg] | Elemental analysis, [%] |
| Ke | 42.3 | 1.39 | 0.817 | 45.292 | C% = 85.17 H% = 13.31 N% = 0.07 O% = 1.45 |
| Ke+10%BP | 44.2 | 1.51 | 0.823 | 44.403 | C% = 84.40 H% = 13.22 N% = 0.07 O% =2.32 |
| Ke+20%BP | 50.2 | 1.82 | 0.830 | 43.67 | C% = 83.21 H% = 13.1 N% = 0.07 O% =3.62 |
| Ke +30%BP | 54.7 | 2.06 | 0.836 | 41.99 | C% = 82.85 H% = 13.03 N% = 0.07 O% =4.05 |
| 100% BP | 161 | 5.08 | 0.875 | 39.323 | C% = 77,43 H% = 12,38 N% = 0,06 O% = 10,13 |
Disclaimer/Publisher’s Note: The statements, opinions and data contained in all publications are solely those of the individual author(s) and contributor(s) and not of MDPI and/or the editor(s). MDPI and/or the editor(s) disclaim responsibility for any injury to people or property resulting from any ideas, methods, instructions or products referred to in the content. |
© 2023 by the authors. Licensee MDPI, Basel, Switzerland. This article is an open access article distributed under the terms and conditions of the Creative Commons Attribution (CC BY) license (http://creativecommons.org/licenses/by/4.0/).


