Preprint
Communication

Photobleaching and Polarization Anisotropy of Olive Flounder Canine by Nonlinear Optical Microscopy

Altmetrics

Downloads

91

Views

46

Comments

0

Submitted:

28 November 2023

Posted:

30 November 2023

You are already at the latest version

Alerts
Abstract
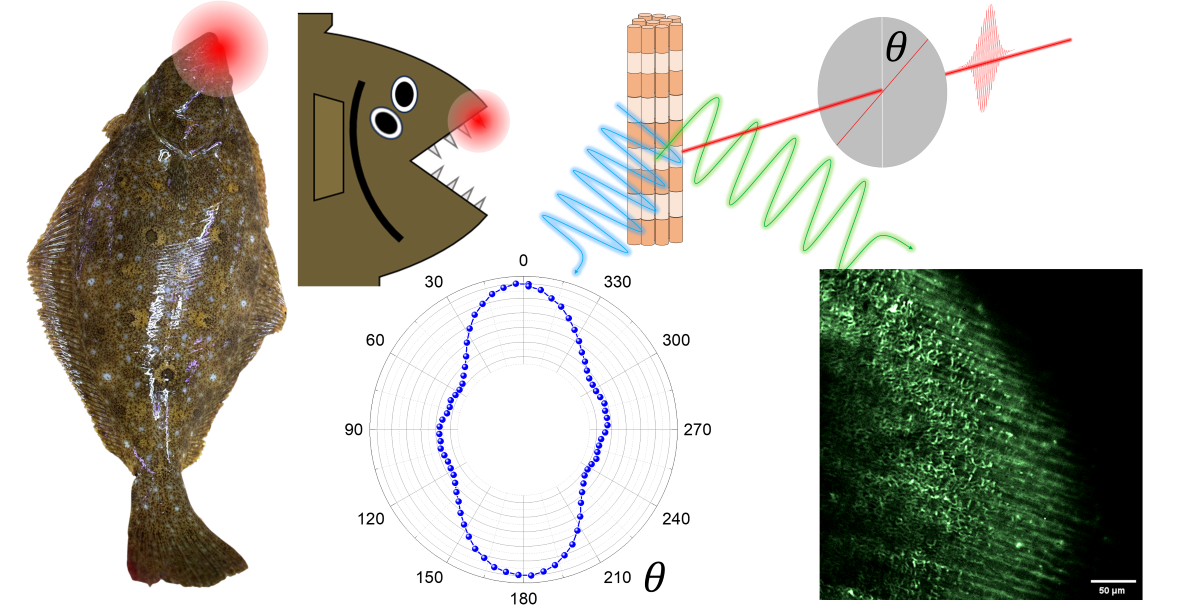
We have investigated the canine of olive flounder in terms of the nonlinear optical signals of two-photon excitation autofluorescence (2PEF) and second harmonic generation (SHG), whereby two kinds of nonlinear microscope images of the canine were obtained using ~140 femtosecond pulses. For increasing excitation power of laser pulses, a photobleaching effect was found to be significant in the red and green ranges of autofluorescence, where a double-exponential decay of the intensity occurs within hundreds of second due to collagen fluorophores in the canine. In the blue range of autofluorescence, the photobleaching is suppressed due to an energy conversion of the incident laser pulse to SHG signal. As a result, the signal in blue range remains constant for long term exposure to laser. We have also found that the SHG intensity depends on the orienta-tion of linearly polarized excitation, and the optical anisotropy of SHG can be attributed to the collagen alignment of canines.
Keywords: 
Subject: Physical Sciences  -   Optics and Photonics

1. Introduction

Currently, fluorescence microscopy is widely used because of its optical convenience and less invasive method, where an image of fluorescence microscopy is obtained by reconstructing the fluorescence signals of various focused laser spots. However, when chemical staining process is given to biological specimen, the additional chemical treatment inevitably harms the homogeneity of specimens, and the high absorption coefficient of synthetic dyes also limits the imaging depth. To overcome this issue, nonlinear optical signals can be used, and two-photon excitation fluorescence (2PEF) and second harmonic generation (SHG) are often utilized to obtain a microscope image of archaeological and osteological specimens [1,2,3,4,5,6].
In the case of 2PEF microscopy, transparent laser color, i.e., the energy of the laser photon less than the bandgap of the specimen, gives rise to fluorescence through the two-photon absorption (2PA) process. As the third-order nonlinear optical process requires strong light intensity, 2PEF occurs only in the intense area of a laser spot. Therefore, 2PEF microscopy provides an improved spatial resolution compared to the confocal fluorescence microscope image obtained by direct one-photon transition, and collateral damages to the unwanted area can be inhibited. On the other hand, SHG occurs in non-centrosymmetric structures [7,8,9,10,11], where the frequency of incident light becomes doubled as a consequence of the second-order nonlinear process, and the energy conversion from the incident light to SHG occurs in a coherent and instantaneous way. Therefore, the SHG signal can be obtained without an extra staining process, and the structural asymmetry can be studied in terms of polarization dependence.
Animal bone and tooth are important in archaeological and forensic science. The physical properties of bones in archaeological reconstruction such as degeneration and preservation provide important clues of living style and cultural activities. For example, the bone structures are investigated by isotopic analysis [12], X-ray diffraction [13], and scanning electron microscope (SEM) [14], but most of the studies focused on mammalian bones. Fish bones are known to have different carbon-nitrogen ratio (C:N) compared to that of mammalian bones, and a distinctive collagen composition is expected [15]. However, the optical properties of fish bone collagen are rarely known. In this work, we utilized two different nonlinear optics techniques to investigate the tooth of olive flounder, which is the most common fish for food in Korea, Japan, and China. Although the specimen is not stained with fluorescence dye, we observed autofluorescence from the tooth collagen by 2PA process of femtosecond pulses, and a fluorescence image was also obtained by lateral laser scanning. For increasing excitation power, we found a photobleaching effect becomes significant in the tooth collagen. In addition, a SHG image was also obtained due to the non-centrosymmetric structure of the tooth collagen, and we found the SHG signal shows a strong polarization anisotropy. This result suggests that the tooth collagen has an aligned bundle structure.

2. Material and Method

2.1. Sample Preparation

As shown in Figure 1(a), a canine tooth was obtained from an olive flounder fish, slaughtered an hour before sample extraction. Before sample preparation, a single canine tooth image was obtained by bright-field microscopy in Figure 1(b). After cleaning with distilled water and ethanol, the specimen was dried at 25 °C for 24 hours, and stored at 4 °C. To be a suitable sample for nonlinear microscopy, the canine tooth was polished, and acrylic resin was used as a fixation medium, which is transparent under visible light. After 24 hours at room temperature with the acrylic resin, a clear resin layer was formed on the sample. Article 2 (Scope of Animals)
Concerned with the ethics regulations for animal and human specimens in South Korea, the article 2 (1) of the animal protection act says that animals prescribed by presidential decree means reptiles, amphibians, and fish. However, this excludes animals intended for human consumption, which was revised on 11 February 2014. As olive flounder fish is used for food, the IRB process is exempt.

2.3. Nonlinear Optical Microscopy

In Figure 1(c), the optical alignment of our nonlinear microscope was shown schematically, where two different optical images of 2PEF and SHG microscope were provided at three different spectrum ranges of blue (410~510 nm), green (470~570 nm), and red (510~670 nm), respectively. For the signal detection, three separate photo-multiplier tube (PMTs) were used, and samples were excited by 900 nm of 140 fs pulses, which are operating at 80 MHz repetition rate. The excitation intensity was controlled by a pair of a half-waveplate and linear polarizer, whereby the power changes from 20mW up to 250 mW. The scan area was controlled by a Galvano scanning mirror, and different objective lenses were used for autofluorescence (Olympus MPLFLN 10x (NA=0.3)) and second harmonic generation (Olympus MPLFLN 50x BDP (NA=0.75)). For precise scanning of the sample area, a motorized stage was utilized. In order to measure excitation angle dependence, we rotated a linear polarizer with a fixed half-waveplate. To maintain the same excitation power (60 mW), an additional linear polarizer was used. The additional polarizer is also useful to change the incident angle of the excitation laser beam, whereby we found the optimum angle.
As shown in Figure 1(d), 2PEF is advantageous in spatial resolution. In the case of the direction one-photon absorption, fluorescence occurs over the whole area of laser, but 2PEF occurs in the selected area, which is less than the laser spot size. Due to the localized excitation, a 3-dimensional image can also be reconstructed, and the spatial resolution is enhanced significantly. As we used near infra-red wavelength (~900 nm) for excitation, the unparticipating lights, the intensity of which is lower than the 2PEF threshold, likely penetrate specimen.

3. Results and Discussion

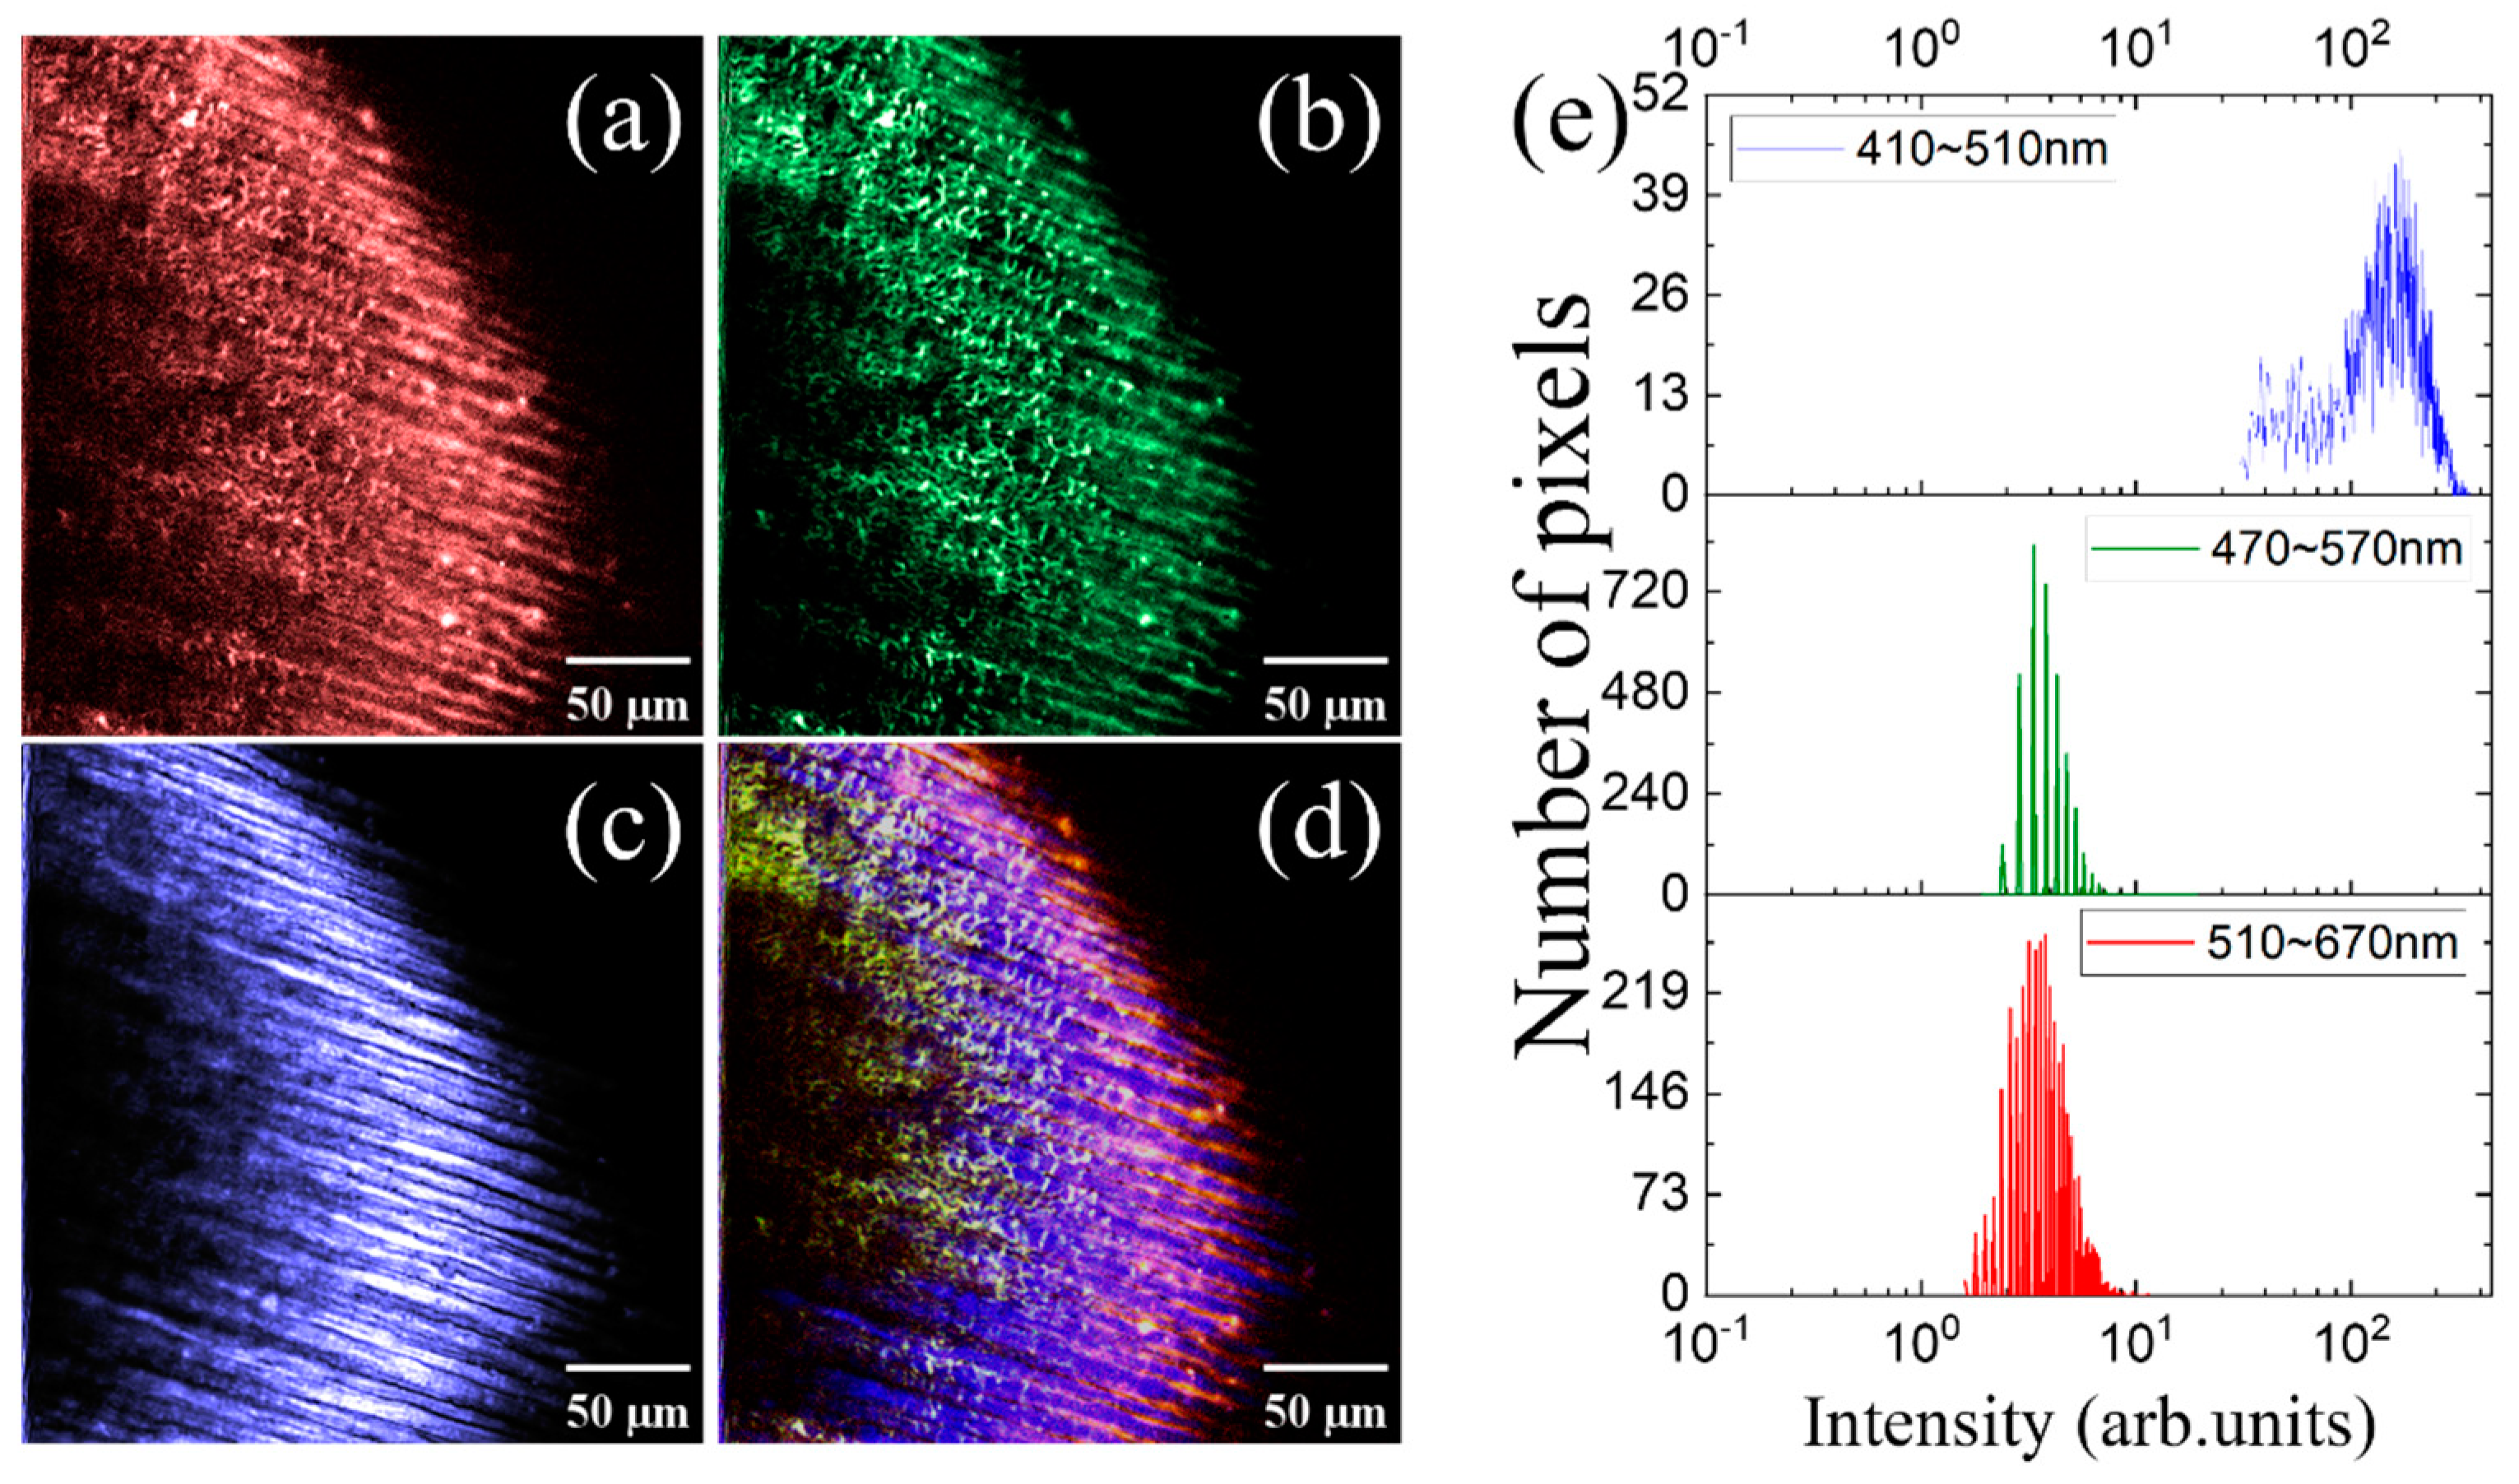
Nonlinear optical images of the olive flounder fish canine were obtained in three different color channels of red (Figure 2(a)), green (Figure 2(b)), and blue (Figure 2(c)), respectively. In red and green channels, the two images show curly and stripe-like structures, which are associated with the collagen alignment. On the other hand, the image in blue channel shows only a stripe-like structure. When the three color images are merged together in Figure 2(d), the stripe-like structure becomes significant among the three different color channels.
In Figure 1(e), the intensity distribution over a selected color image was shown. For example, given the image (Figure 1(c)) in blue (410~510 nm) channel, the number of pixels was counted for intensity. While the similar intensity distributions were obtained from the two images in red and green channels, the image intensity in the blue channel is nearly twenty times larger. These results suggest that the autofluorescence of the canine appears over a broad spectrum range via the 2PA process, which covers red, green, and blue channels. However, an additional signal of SHG is also generated in the blue channel. While the both curly and stripe-like structures cause autofluorescence, the SHG is originated from the stripe-like structure. Indeed, animal canines were known to cause SHG due to the aligned collagens.
It is known that the autofluorescence of collagens is likely suppressed under strong excitation [16,17,18,19]. As 2PEF occurs over a threshold excitation power, the photobleaching effect in 2PEF microscopy can be less significant compared to that in direct one-photon excitation fluorescence, but not avoidable [20]. On the other hand, SHG is free from the photobleaching unless excitation is less than the optical damage threshold power of SHG, which is usually orders of magnitude large compared to that of fluorescence photobleaching [10]. As the SHG is an inherent consequence of the outmost bound electrons, an external labelling of fluorophore is also not necessary.
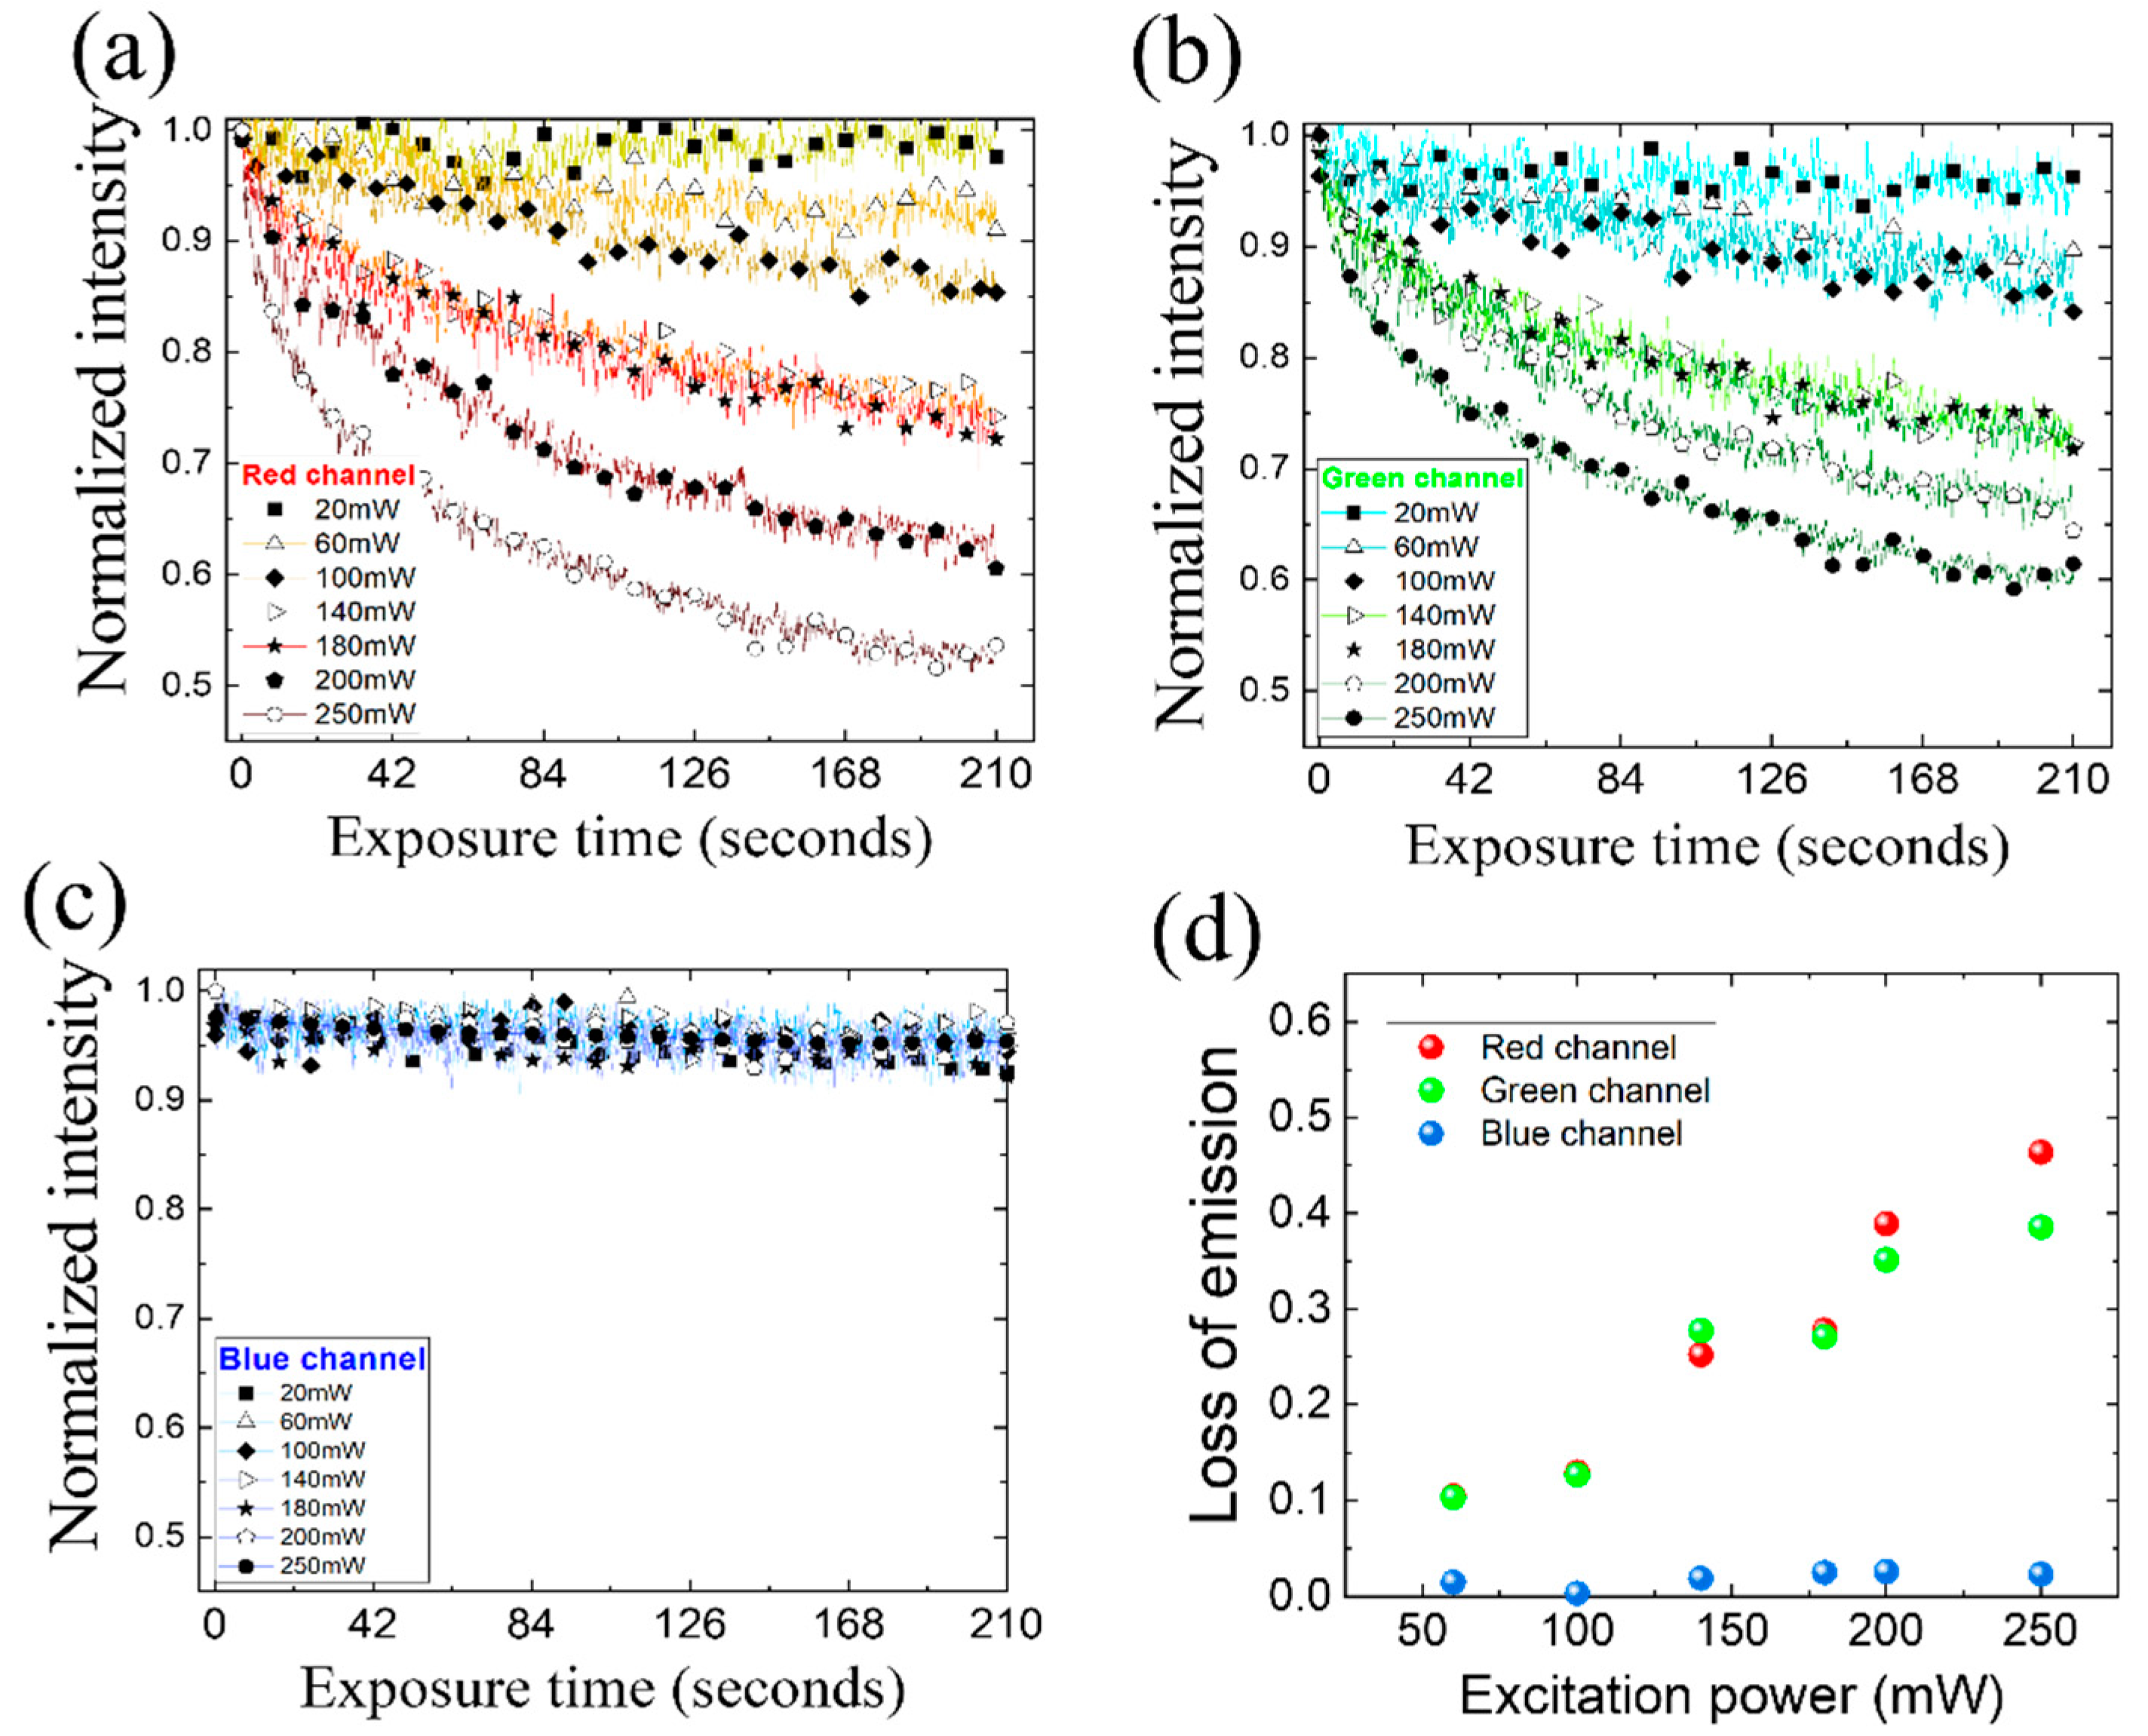
To investigate the photobleaching effect of 2PEF, the temporal degradation of autofluorescence was measured at various excitation power. In Figure 3(a) and 3(b), the time-resolved normalized autofluorescence intensity at red and green channels were shown for increasing excitation power, respectively. In both cases, the decrease of autofluorescence intensity is not significant with excitation power of 20 mW. When excitation power becomes over 60 mW, a gradual photobleaching was observed to appear in ~102 seconds. We found that the time-resolved autofluorescence intensity with various excitation powers can be fitted by double exponential decay functions ( I t = A e t / τ 1 + B e t / τ 1 + I o ) , where five empirical parameters ( A ,   B ,   τ 1 , τ 2 ,   I 0 ) are used. Suppose the autofluorescence intensity converges to the offset ( I = I o ), a normalized loss of emission ( I 0 I ) / I 0 ) can be obtained as an evaluation quantify photobleaching.
To investigate the photobleaching effect of 2PEF, the temporal degradation of autofluorescence was measured at various excitation power. In Figure 3a and 3b, the time-resolved normalized autofluorescence intensity at red and green channels were shown for increasing excitation power, respectively. In both cases, the decrease of autofluorescence intensity is not significant with excitation power of 20 mW. When excitation power becomes over 600 mW, a gradual photobleaching was observed to appear in ~102 seconds. We found that the time-resolved autofluorescence intensity with various excitation powers can be fitted by double exponential decay functions ( I t = A e t / τ 1 + B e t / τ 1 + I o ) , where five empirical parameters ( A ,   B ,   τ 1 , τ 2 ,   I 0 ) are used. Suppose the autofluorescence intensity converges to the offset ( I = I o ), a normalized loss of emission ( I 0 I ) / I 0 ) can be obtained as an evaluation quantity of photobleaching.
On the other hand, the autofluorescence intensity in blue channel remains constant (Figure 3(c)) with the small loss of emission ~10-2 (Figure3(d)) as excitation power increases up to 250 mW. It is noticeable that the frequency-doubled state of SHG is not associated with light absorption. However, 2PA results in an intra-relaxation of excite carriers before fluorescence occurs, where phonons or molecular vibrations are induced. Therefore, the blue signal (410~510 nm) is dominated by SHG, and the most of incident light is converted to SHG. Likewise, strong photobleaching occurs in red and green channels because the energy conversion to SHG is absent. As shown in Figure 3(d), the autofluorescence loss in red and green channels show a linear increase for increasing excitation power up to 250 mW, while the second- and third-order nonlinearity of SHG and 2PA show quadratic and cubic excitation power dependence respectively [13]. Up to 250 mW excitation, we also found the photobleaching is a temporary effect. If the photobleached canine remains blocked from laser excitation for a few minutes, the autofluorescence is recovered, and the same photobleaching feature can be obtained.
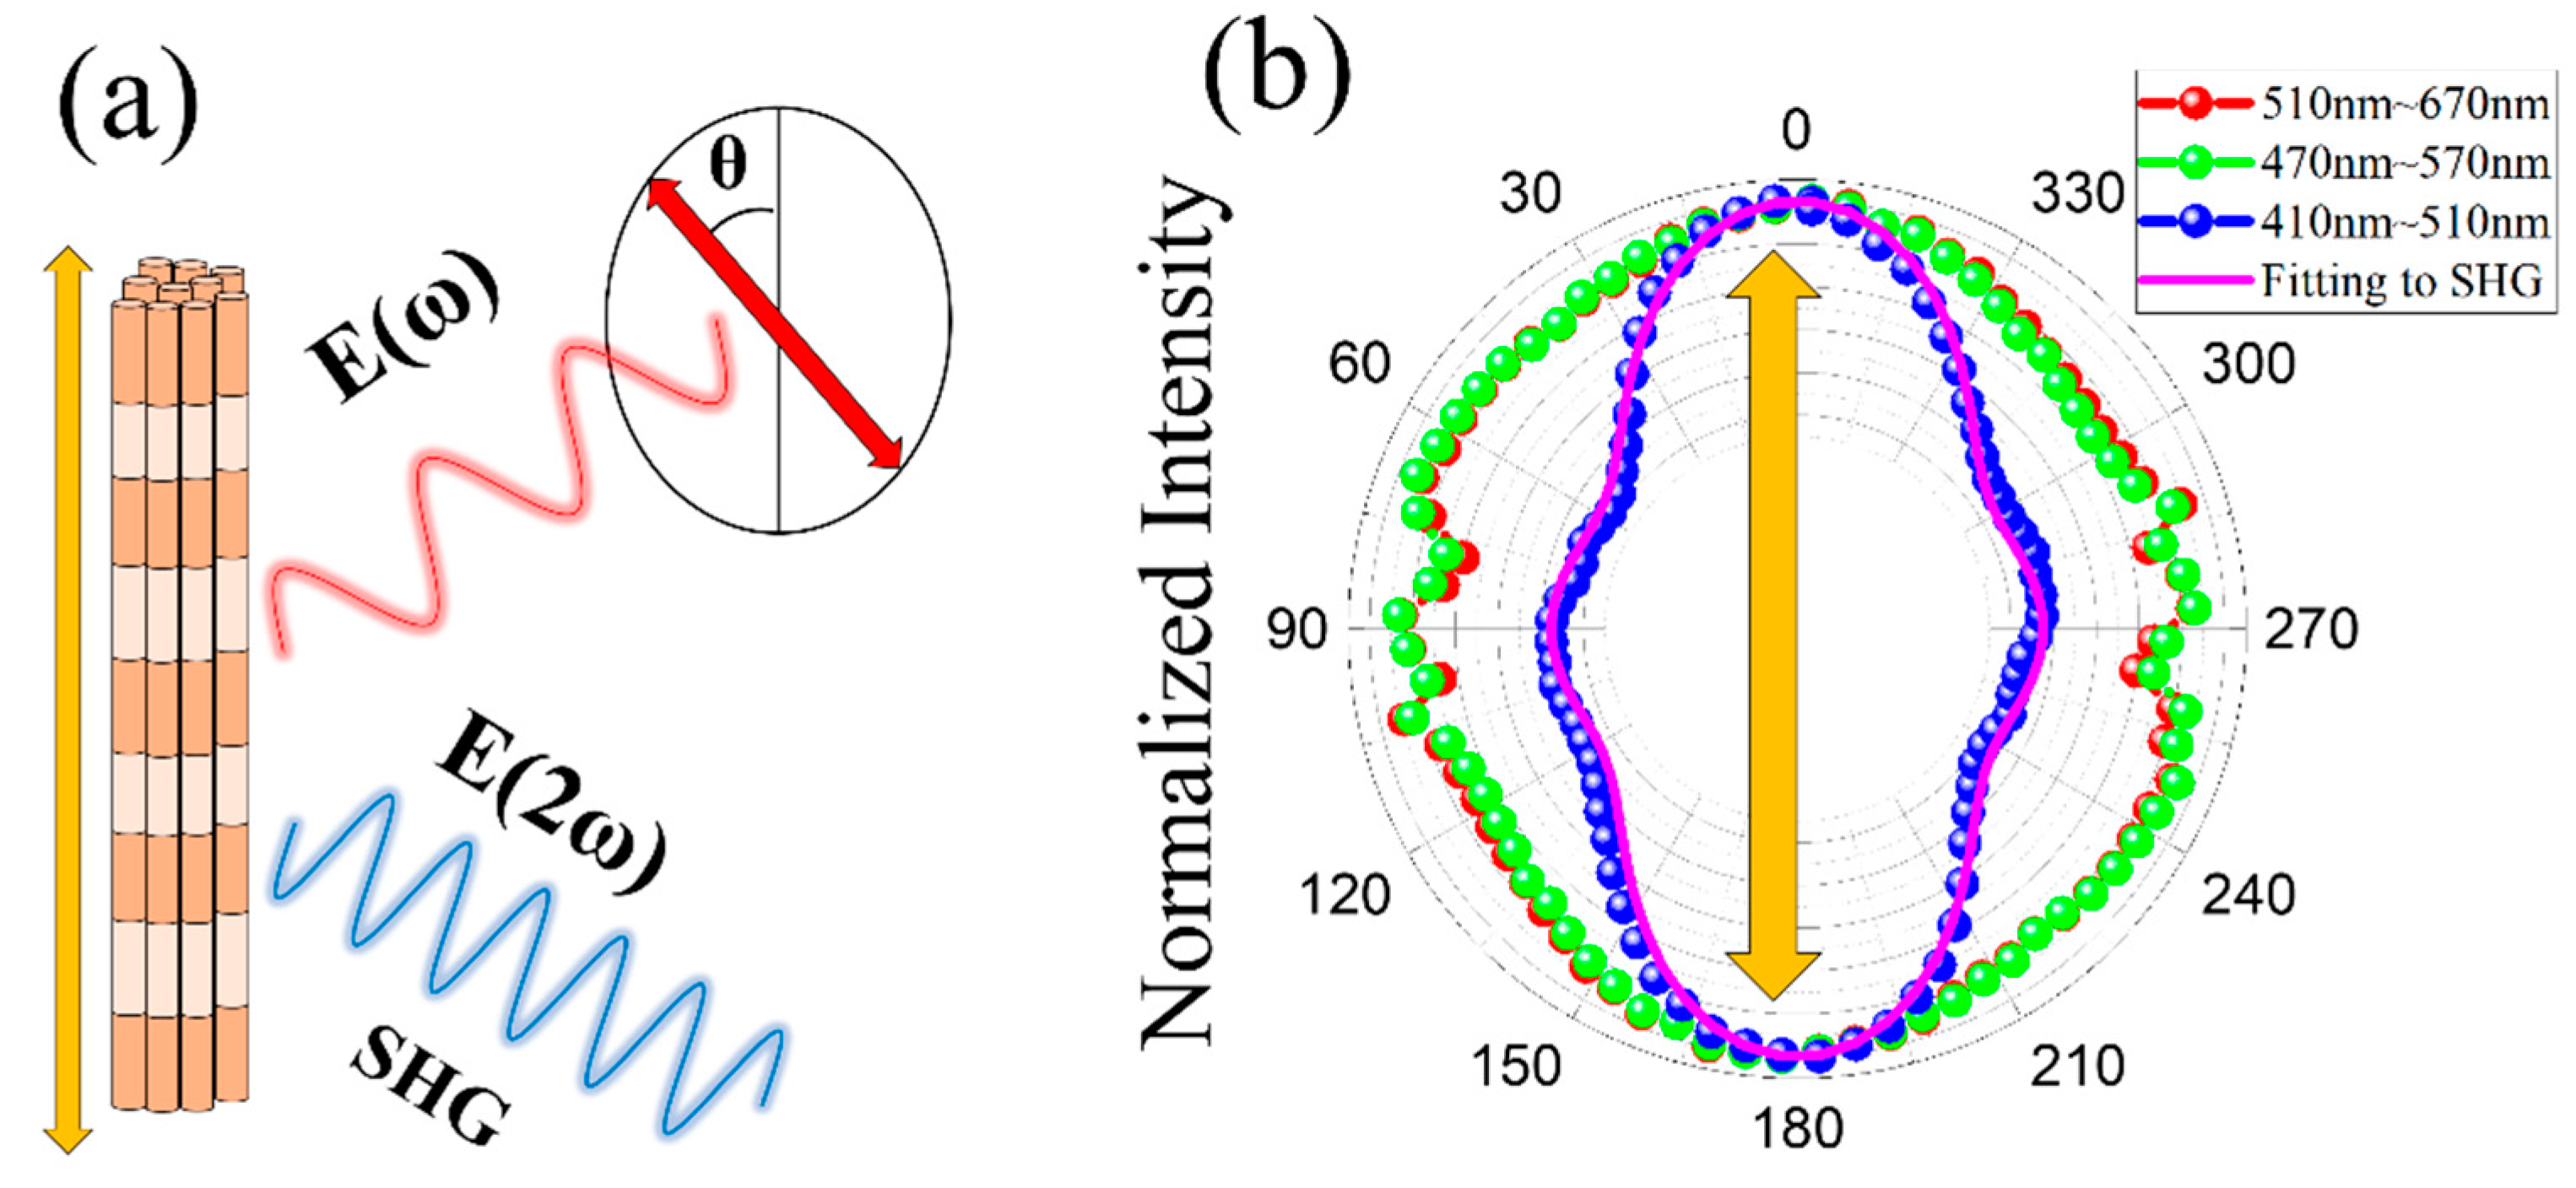
Regarding that the SHG image is dominated by stripe-like structures, polarization dependence of the SHG intensity was studied. Suppose the canine collagen bundle is aligned as shown schematically in Figure 4(a), the frequency-doubled SHG electric field E ( 2 ω ) depends on the angle ( θ ) between linearly polarized excitation light E ( ω ) the collagen alignment. Given an incident electric field vector E i ω , the SHG polarization vector P i 2 ω is described as
P i 2 ω = i , j , k = 1 3 χ i j k ( 2 ) E j 2 ω E k 2 ω ,
where the subscripts i , j , k refer to the cartesian axis of x , y , z . Therefore, the second-order electric susceptibility χ ( 2 ) is a tensor. Recently, the SHG of collagens was described in terms of the cylindrical symmetry ( C 6 ), whereby χ i j k 2 tensor becomes reduced with the nonvanishing components along the main axis [9,21,22,23,24]. Suppose light propagates along k -axis E k ω = 0 , the three components of P i , j , k 2 ω are given as
P i 2 ω = χ i j j 2 E j ω 2 + χ i i i 2 E i ω 2
P j 2 ω = 2 χ j i j 2 E j ω E i ω ,
P k 2 ω = 0 .
To describe the two transverse components of electric fields in the polarization plane, E i ω and E j ω can be normalized to be E i ω 2 + E j ω 2 = E ω 2 = 1 , and the polarization angle of electric field ( θ ) can be determined by E i ω / E ω = cos θ   and E j ω / E ω = sin θ . Regarding the birefringence of C 6 symmetry in collagens, the difference between extra-ordinary and ordinary refractive indices ( n = n e n o ) was known to near 3 ~ 5 × 10 3 [24,25,26], and the lateral polarization components P i , j 2 ω can be determined by
P i 2 ω = χ i j j 2 sin 2 θ + χ i i i 2 cos 2 θ e i 4 π n e n o z λ ,
P j 2 ω = 2 χ j i j 2 cos θ sin θ e i 2 π n e + n o z λ ,
where λ is wavelength of incident light and z is propagation length along the k direction. Finally, the SHG intensity I 2 ω ~ P i 2 ω 2 + P j 2 ω 2 can be described by
I 2 ω ~ A sin 2 θ + γ cos 2 θ 2 + γ 2 sin 2 2 θ cos 4 π n e n o z λ 1 + sin 2 2 θ 2   + Ω f l
where A , γ , and Ω f l are a fitting parameter for normalization, ratio of χ i i i 2 to χ i j j 2 , and non-polarized autofluorescence, respectively.
In Figure 4(b), the nonlinear signal intensity measured at red, green, and blue channels were plotted for changing the polarization angle ( θ ). Compared to the autofluorescence in red and green, the SHG in blue channel shows a significant polarization anisotropy, where the SHG intensity becomes maximized when excitation polarization is parallel to the collagen alignment ( θ = 0 ° , 180 ° ). We also found the measured polarization anisotropy was fitted well with Equation (7), where the obtained ratio γ ~ 1.4 is also comparable to previous results [23], and Ω f l was almost constant (~0.3).

4. Conclusions

We have studied the canine of the olive flounder fish using two non-linear microscopy techniques. While the autofluorescence images of the canine obtained by two-photon absorption show curly and stripe-like structures in red and green detection channels, the SHG image shows only stripe-like structures. As excitation power is increased up to 250 mW, a temporal photobleaching appears to be significant in the autofluorescence. We have also found the SHG has a strong polarization anisotropy, where the intensity becomes maximized when excitation polarization is parallel to the collagen alignment. Those two nonlinear microscopies can be a useful method to investigate the canine of various fishes.

Author Contributions

Conceptualization, S.L. and K.K.; methodology, S.L., J.K. and M.K; software, S.L, J.K., M.K.; validation, S.L. and K.K.; formal analysis, S.L. and J.K.; investigation, S.L. and J.K.; resources, K.K.; data curation, S.L., J.K.; writing—original draft preparation, S.L., J.K., M.K., H.K. and K.K.; writing—review and editing, M.K., H.K., K.K and R.A.T.; visualization, S.L., M.K. and K.K.; supervision, K.K.; project administration, K.K.; funding acquisition, K.K. All authors have read and agreed to the published version of the manuscript.

Funding

This research was supported by the National Research Foundation of Korea funded by the Ministry of Science and ICT (BrainLink RS-2023-00236798, RLRC 2022R1A5A8023404) and a grant of the Korea Health Technology R&D Project through the Korea Health Industry Development Institute (KHIDI), funded by the Ministry of Health & Welfare, Republic of Korea (HI19C1085).

Data Availability Statement

All data generated or analyzed during this study are included in this published article.

Conflicts of Interest

The authors declare no conflicts of interest.

Ethics Approval

This article does not require IRB/IACUC approval because olive flounder fish is used for food.

References

  1. Pulin, M.; Stockhausen, K.E.; Masseck, O.A.; Kubitschke, M.; Busse, B.; Wiegert, J.S.; Oertner, T.G. Orthogonally-Polarized Excitation for Improved Two-Photon and Second-Harmonic-Generation Microscopy, Applied to Neurotransmitter Imaging with GPCR-Based Sensors. Biomed Opt Express 2022, 13, 777. [Google Scholar] [CrossRef]
  2. Chen, W.-L. Multiphoton Autofluorescence and Second-Harmonic Generation Imaging of the Tooth. J Biomed Opt 2007, 12, 064018. [Google Scholar] [CrossRef] [PubMed]
  3. Wu, Y.; Qu, J.Y. Two-Photon Autofluorescence Spectroscopy and Second-Harmonic Generation of Epithelial Tissue. Opt Lett 2005, 30, 3045. [Google Scholar] [CrossRef]
  4. Rubart, M. Two-Photon Microscopy of Cells and Tissue. Circ Res 2004, 95, 1154–1166. [Google Scholar] [CrossRef]
  5. Cisek, R.; Joseph, A.; Harvey, M.; Tokarz, D. Polarization-Sensitive Second Harmonic Generation Microscopy for Investigations of Diseased Collagenous Tissues. Front Phys 2021, 9. [Google Scholar] [CrossRef]
  6. Chu, S.-W.; Chen, S.-Y.; Chern, G.-W.; Tsai, T.-H.; Chen, Y.-C.; Lin, B.-L.; Sun, C.-K. Studies of χ(2)/χ(3) Tensors in Submicron-Scaled Bio-Tissues by Polarization Harmonics Optical Microscopy. Biophys J 2004, 86, 3914–3922. [Google Scholar] [CrossRef]
  7. Roth, S.; Freund, I. Second Harmonic Generation in Collagen. J Chem Phys 1979, 70, 1637–1643. [Google Scholar] [CrossRef]
  8. Thomas, B.; McIntosh, D.; Fildes, T.; Smith, L.; Hargrave, F.; Islam, M.; Thompson, T.; Layfield, R.; Scott, D.; Shaw, B.; et al. Second-Harmonic Generation Imaging of Collagen in Ancient Bone. Bone Rep 2017, 7, 137–144. [Google Scholar] [CrossRef] [PubMed]
  9. Stoller, P.; Reiser, K.M.; Celliers, P.M.; Rubenchik, A.M. Polarization-Modulated Second Harmonic Generation in Collagen. Biophys J 2002, 82, 3330–3342. [Google Scholar] [CrossRef]
  10. Campagnola, P.J.; Millard, A.C.; Terasaki, M.; Hoppe, P.E.; Malone, C.J.; Mohler, W.A. Three-Dimensional High-Resolution Second-Harmonic Generation Imaging of Endogenous Structural Proteins in Biological Tissues. Biophys J 2002, 82, 493–508. [Google Scholar] [CrossRef]
  11. Ugryumova, N.; Jacobs, J.; Bonesi, M.; Matcher, S.J. Novel Optical Imaging Technique to Determine the 3-D Orientation of Collagen Fibers in Cartilage: Variable-Incidence Angle Polarization-Sensitive Optical Coherence Tomography. Osteoarthritis Cartilage 2009, 17, 33–42. [Google Scholar] [CrossRef] [PubMed]
  12. Harbeck, M.; Grupe, G. Experimental Chemical Degradation Compared to Natural Diagenetic Alteration of Collagen: Implications for Collagen Quality Indicators for Stable Isotope Analysis. Archaeol Anthropol Sci 2009, 1, 43–57. [Google Scholar] [CrossRef]
  13. Schoeninger, M.J.; Moore, K.M.; Murray, M.L.; Kingston, J.D. Detection of Bone Preservation in Archaeological and Fossil Samples. Applied Geochemistry 1989, 4, 281–292. [Google Scholar] [CrossRef]
  14. Rubin, M.A.; Rubin, J.; Jasiuk, I. SEM and TEM Study of the Hierarchical Structure of C57BL/6J and C3H/HeJ Mice Trabecular Bone. Bone 2004, 35, 11–20. [Google Scholar] [CrossRef] [PubMed]
  15. Szpak, P. Fish Bone Chemistry and Ultrastructure: Implications for Taphonomy and Stable Isotope Analysis. J Archaeol Sci 2011, 38, 3358–3372. [Google Scholar] [CrossRef]
  16. Marcu, L.; Grundfest, W.S.; Maarek, J.I. Photobleaching of Arterial Fluorescent Compounds: Characterization of Elastin, Collagen and Cholesterol Time-resolved Spectra during Prolonged Ultraviolet Irradiation. Photochem Photobiol 1999, 69, 713–721. [Google Scholar] [CrossRef] [PubMed]
  17. Maggiano, C.; Dupras, T.; Schultz, M.; Biggerstaff, J. Spectral and Photobleaching Analysis Using Confocal Laser Scanning Microscopy: A Comparison of Modern and Archaeological Bone Fluorescence. Mol Cell Probes 2006, 20, 154–162. [Google Scholar] [CrossRef] [PubMed]
  18. Yova, D.; Hovhannisyan, V.; Theodossiou, T. Photochemical Effects and Hypericin Photosensitized Processes in Collagen. J Biomed Opt 2001, 6, 52. [Google Scholar] [CrossRef] [PubMed]
  19. Lee, S.G.; Kim, M.; Jeong, S.; Hwang, J.; Kim, J.; Gourrier, A.; Vial, J.C.; Kyhm, K. Autofluorescence Loss in Photobleaching for Human Dentin Ex Vivo. Current Optics and Photonics 2022, 6, 86–91. [Google Scholar] [CrossRef]
  20. Patterson, G.H.; Piston, D.W. Photobleaching in Two-Photon Excitation Microscopy. Biophys J 2000, 78, 2159–2162. [Google Scholar] [CrossRef]
  21. Stoller, P.; Kim, B.-M.; Rubenchik, A.M.; Reiser, K.M.; Da Silva, L.B. Polarization-Dependent Optical Second-Harmonic Imaging of a Rat-Tail Tendon. J Biomed Opt 2002, 7, 205. [Google Scholar] [CrossRef] [PubMed]
  22. Spiesz, E.M.; Kaminsky, W.; Zysset, P.K. A Quantitative Collagen Fibers Orientation Assessment Using Birefringence Measurements: Calibration and Application to Human Osteons. J Struct Biol 2011, 176, 302–306. [Google Scholar] [CrossRef] [PubMed]
  23. Tiaho, F.; Recher, G.; Rouède, D. Estimation of Helical Angles of Myosin and Collagen by Second Harmonic Generation Imaging Microscopy. Opt Express 2007, 15, 12286. [Google Scholar] [CrossRef] [PubMed]
  24. Gusachenko, I.; Latour, G.; Schanne-Klein, M.-C. Polarization-Resolved Second Harmonic Microscopy in Anisotropic Thick Tissues. Opt Express 2010, 18, 19339. [Google Scholar] [CrossRef] [PubMed]
  25. Park, J.; Kemp, N.J.; Rylander, H.G.; Milner, T.E. Complex Polarization Ratio to Determine Polarization Properties of Anisotropic Tissue Using Polarization-Sensitive Optical Coherence Tomography. Opt Express 2009, 17, 13402. [Google Scholar] [CrossRef]
  26. Kemp, N.J.; Zaatari, H.N.; Park, J.; Rylander III, H.G.; Milner, T.E. Form-Biattenuance in Fibrous Tissues Measured with Polarization-Sensitive Optical Coherence Tomography (PS-OCT). Opt Express 2005, 13, 4611. [Google Scholar] [CrossRef]
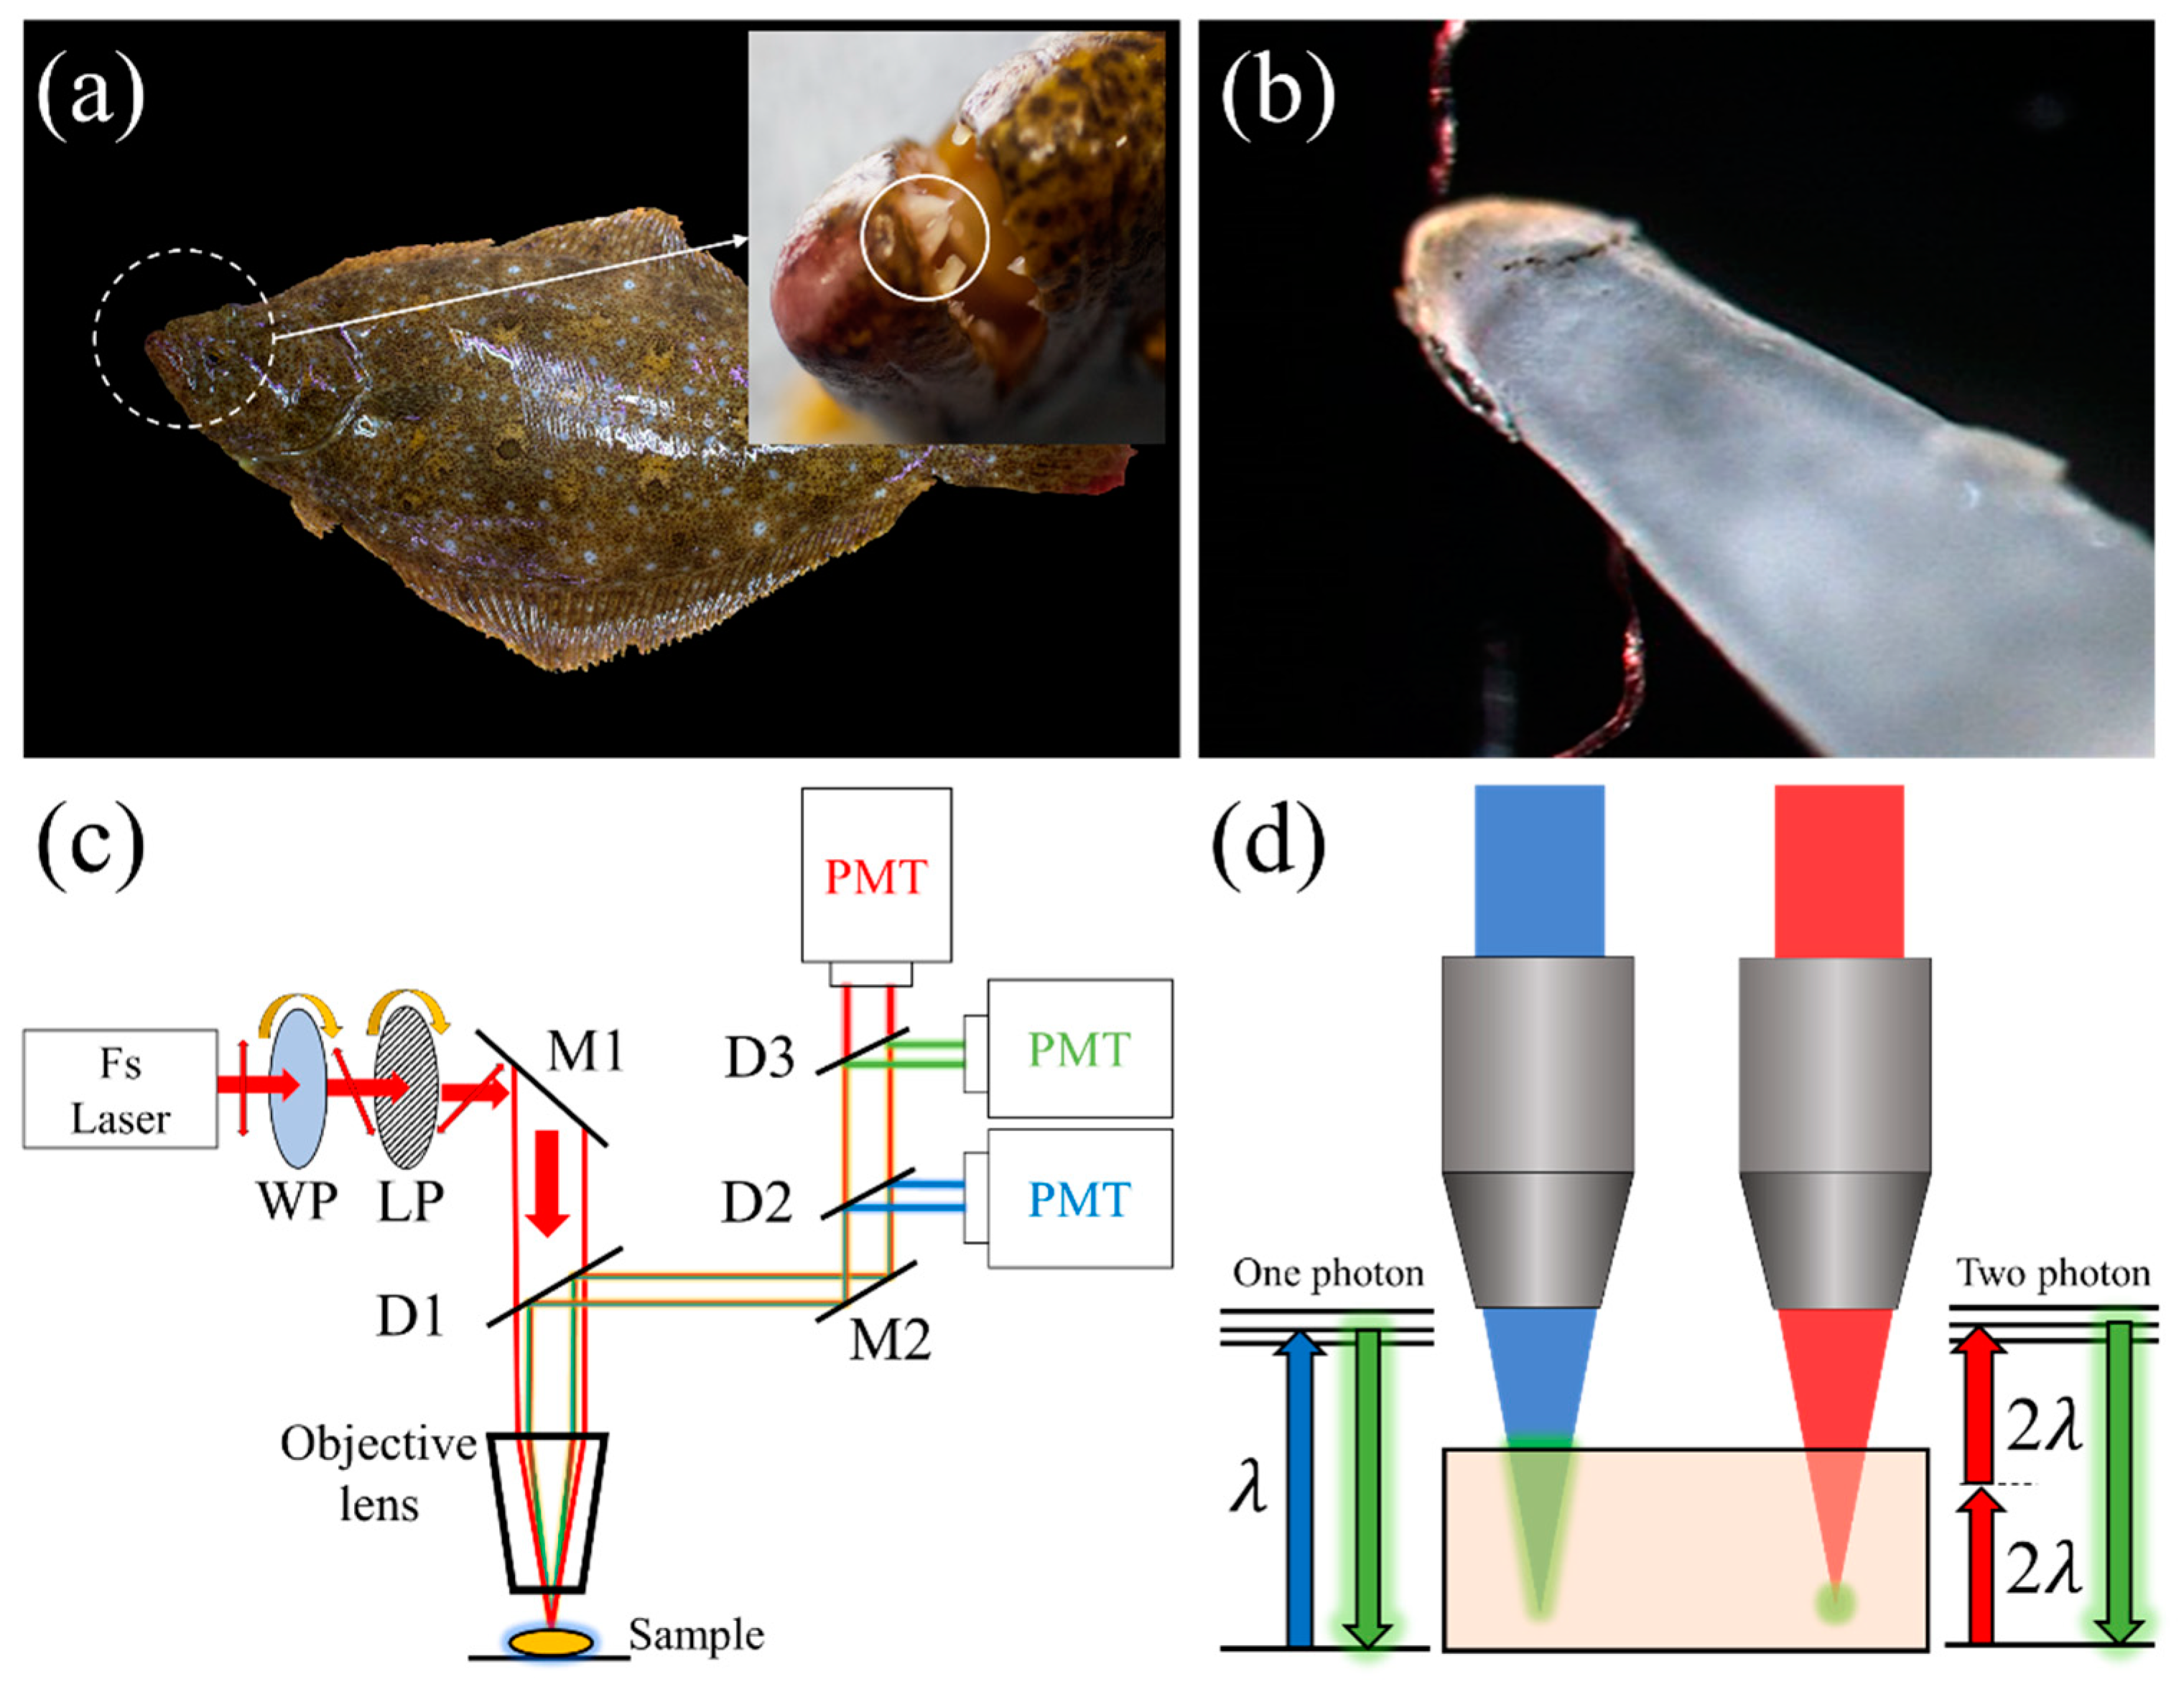
Figure 1. (a) A canine of olive flounder. (b) Bright field image of an extracted canine. (c) Nonlinear optical microscope setup. Sample is excited by femtosecond pulses with an objective lens (NA=0.75), and the nonlinear optical signals of two-photon excitation autofluorescence (2PEF) and second harmonic generation (SHG) are selected by dichroic mirror (D1). Using additional dichroic mirrors (D2, D3) and three PMTs, the signals are separated by three different spectrum ranges of blue (410~510 nm), green (470~570 nm), and red (510~670 nm), respectively. (d) Although the same green fluorescence is observed from the canines via one-photon (left) and two-photon (right) absorption, the two-photon fluorescence occurs only in the reduced area of high intensity. As a result, a significantly enhanced spatial resolution can be achieved.
Preprints 91678 g001
Figure 2. Nonlinear optical images in red (a) and green (b) detection channels show curly and stripe-like structures, while the image in blue channel (c) shows only stripe-like structure. (d) The three-color images are integrated. (e) To evaluate intensity distribution, the number of pixels for detected intensity is plotted for three detection channels (red, green, and blue), respectively. The signal intensity in blue (410 ~ 510 nm) channel is nearly 20 times brighter than those in red (510 ~ 670 nm) and green (510 ~ 570 nm) channels.
Preprints 91678 g002
Figure 3. Time dependence of normalized autofluorescence intensity with different excitation power measured in red (a), green (b), and blue (c) detection channels. For increasing excitation power, the photobleaching effect becomes significant in the red and green channels, but the autofluorescence intensity in blue channel barely changes. (d) Excitation power dependence of loss of autofluorescence emission in red, green and blue channels are compared.
Preprints 91678 g003
Figure 4. (a) SHG intensity obtained from the collagen bundles of an olive flounder canine depends on the angle ( θ ) between linearly polarized excitation light and the aligned collagen bundle. (b) Polarization angle ( θ ) dependence of SHG intensity for red (510~670 nm), green (470~570 nm), and blue (410~510 nm) ranges.
Preprints 91678 g004
Disclaimer/Publisher’s Note: The statements, opinions and data contained in all publications are solely those of the individual author(s) and contributor(s) and not of MDPI and/or the editor(s). MDPI and/or the editor(s) disclaim responsibility for any injury to people or property resulting from any ideas, methods, instructions or products referred to in the content.
Copyright: This open access article is published under a Creative Commons CC BY 4.0 license, which permit the free download, distribution, and reuse, provided that the author and preprint are cited in any reuse.
Prerpints.org logo

Preprints.org is a free preprint server supported by MDPI in Basel, Switzerland.

Subscribe

© 2024 MDPI (Basel, Switzerland) unless otherwise stated