Submitted:
25 November 2023
Posted:
30 November 2023
You are already at the latest version
Abstract
Keywords:
1. Introduction
2. Materials and Methods
2.1. Site Description and Data Collection
2.2. Method Description
2.2.1. Geostatistical Methods
2.2.2. Multifractal Detrended Fluctuation Analysis (MF-DFA)
3. Results and Discussion
3.1. Groundwater Level Spatiotemporal Characteristics
3.2. Groundwater Level Multifractal Characteristics
3.3. Hurst Exponent Spatial and Temporal Distribution and Groundwater Level Prediction
4. Conclusions
Author Contributions
Funding
Data Availability Statement
Acknowledgments
Conflicts of Interest
References
- Cherkez, E.A.; Kozlova, T.V.; Shmouratko, V.I. Engineering geodynamics of landslide slopes of the Odessa seacoast after antilandslide measures. Visnyk Odeskoho Natsionalnoho Universytetu. Geographichni i geologichni nauky 2023, 18(1), 15–25. (In Russian) [Google Scholar]
- Zelinskiy, I.P.; Korzhenevskiy, B.A.; Cherkez, E.A.; Shatohina, L.N.; Ibragimzade, D.D.; Socalo, N.S. Landslides of the Black Sea North-Western Coast, their studying and forecasting; Naukova Dumka: Kyiv, Ukraine, 1993; pp. 36–40. (In Russian) [Google Scholar]
- Feder, J. Fractals; Plenum Press: New York and London, 1988. [Google Scholar]
- Mandelbrot, B.B. The Fractal Geometry of Nature; W. H. Freeman: Sun-Francisco, USA, 1982. [Google Scholar]
- Schroeder, M. Fractals, Chaos, Power-laws; W. H. Freeman: New York, USA, 1991. [Google Scholar]
- Fractals in the Natural and Applied Sciences; Novak, M.M., Ed.; Elsevier Science B.V.: Amsterdam, 1994; Volume IFIP (A-41). [Google Scholar]
- Paladin, G.; Vulpiani, A. Anomalous scaling laws in multifractal objects. Phys. Rep. 1987, 156(4), 147–225. [Google Scholar]
- Smith, J.M. Fundamental of Fractals for Engineers and Scientists; John Wiley: New York, USA, 1991. [Google Scholar]
- Abarbanel, H.D.I. Analysis of Observed Chaotic Data; Springer: New York, USA, 1996; pp. 69–93. [Google Scholar]
- Bunde, A.; Bogachev, M.I.; Lennartz, S. Precipitation and river flow: Long-term memory and predictability of extreme events. Geophys. Monogr. Ser. 2012, 196, 139–152. [Google Scholar]
- Dæhlen, M.; Lyche, T.; Mørken, K.; Schneider, R.; Seidel, H.-P. Multiresolution analysis over triangles based on quadratic Hermite interpolation. Journal of Computational and Applied Mathematics 2000, 119, 97–114. [Google Scholar]
- Li, Z.; Zhang, Y.K. Quantifying fractal dynamics of groundwater systems with detrended fluctuation analysis. J. Hydrol. 2007, 336, 139–146. [Google Scholar]
- Tu, T.; Ercan, A.; Kavvas, M.L. Fractal scaling analysis of groundwater dynamics in confined aquifers. Earth Syst. Dynam. 2017, 8(4), 931–949. [Google Scholar]
- Zhu, J.; Young, M.H.; Osterberg, J. Impacts of riparian zone plant water use on temporal scaling of groundwater systems. Hydrol. Process, 2012; 26, 1352–1360. [Google Scholar]
- Peng, C.-K.; Buldyrev, S.V.; Havlin, S.; Simons, M.; Stanley, H.E.; Goldberger, A.L. Mosaic organization of DNA nucleotides. Phys. Rev. E. 1994, 49(2), 1685–1689. [Google Scholar]
- Hardstone, R.; Poil, S.; Schiavone, G.; Jansen, R.; Nikulin, W.; Mansvelder, H.D.; Linkenkaer-Hansen, K. Detrended fluctuation analysis: a scale-free view on neuronal oscillations. Front. Physiol. 2012, 3, 450. [Google Scholar]
- Liang, X.; Zhang, Y.K. Temporal and spatial variation and scaling of groundwater levels in a bounded unconfined aquifer. J. Hydrol. 2013, 479, 139–145. [Google Scholar]
- Yu, X.; Ghasemizadeh, R.; Padilla, I.Y.; Kaeli, D.; Alshawabkeh, A. Patterns of temporal scaling of groundwater level fluctuation, J. Hydrol. 2016, 536, 485–495. [Google Scholar]
- Yu, H.; Wen, X.; Feng, Q.; Deo, R.C.; Si, J.; Wu, M. Comparative study of hybrid-wavelet artificial intelligence models for monthly groundwater depth forecasting in extreme arid regions, northwest China. Water Resour. Manag. 2018, 32, 301–323. [Google Scholar]
- Cai, H.J.; Shi, H.Y.; Liu, S.N.; Babovic, V. Impacts of regional characteristics on improving accuracy of groundwater level prediction using machine learning: the case of central eastern continental United States. J. Hydrol.: Reg. Stud 2021, 37, 100930. [Google Scholar]
- Schilling, K.E.; Zhang, Y.K. Temporal scaling of groundwater level fluctuations near a stream. Ground Water 2012, 50(1), 59–67. [Google Scholar]
- Sun, H.G.; Gu, X.; Zhu, J.; Yu, Z.; Zhang, Y. Fractal nature of groundwater level fluctuations affected by riparian zone vegetation water use and river stage variations. Scientific Reports 2019, 9, 15383. [Google Scholar]
- Kantelhardt, J.W.; Zschiegner, S.A.; Koscielny-Bunde, E.; Havlin, S.; Bunde, A.; Stanley, H.E. Multifractal detrended fluctuation analysis of nonstationary time series. Physica A: Statistical Mechanics and its Applications 2002, 316, 87–114. [Google Scholar]
- Hurst, H.E. Long-Term Storage Capacity of Reservoirs. Trans. Am. Soc. Civ. Eng. 1951, 116, 770–799. [Google Scholar]
- Cherkez, E.A.; Melkonyan, D.V. The assessment of factors affecting the evolution of landslides in the Odessa coast. Herald of the Odessa National University, Series: Geographical and geological sciences 2009, 14(16), 268–279. (In Russian) [Google Scholar]
- Shmouratko V., I. The ground water regime and geoecological mapping of urban territories. Engineering geology and the environment. In Proceedings of the 8th international congress of the IAEG, Vancouver, Canada, 21–25 September 1998; Rotterdam: Balkema, 2000; pp. 4367–4373. [Google Scholar]
- Cherkez, E.A.; Shmouratko, V.I. Rotational dynamics and the level of the Quaternary aquifer in Odessa. Herald of the Odessa National University, Series: Geographical and geological sciences 2012, 17(2), 122–140. (In Russian) [Google Scholar]
- Ahmadi, S.H.; Sedghamiz, A. Geostatistical analysis of spatial and temporal variations of groundwater level. Environ. Monit. Assess, 2007; 129(1-3), 277–294. [Google Scholar]
- Delhomme, J.P. Spatial variability and uncertainty in groundwater flow parameters: a geostatistical approach. Water Resour. Res. 1979, 15(2), 269–280. [Google Scholar]
- Lu, C.; Song, Z.; Wang, W.; Zhang, Y.; Si, H.; Liu, B.; Shu, L. Spatiotemporal variation and long-range correlation of groundwater depth in the Northeast China Plain and North China Plain from 2000~2019. J. Hydrol.: Reg. Stud. 2021; 37, 100888. [Google Scholar]
- Gundogdu, K.S.; Guney, I. Spatial Analyses of Groundwater Levels Using Universal Kriging. J. Earth Syst. Sci. 2007, 116(1), 49–55. [Google Scholar]
- Journel, A.G.; Huijbregts, C.J. Mining geostatistics; Academic Press: London, 1978. [Google Scholar]
- Kitanidis, P.K. Introduction to Geostatistics: Applications in Hydrogeology; Cambridge university press: Cambridge, 1997. [Google Scholar]
- Isaaks, E.H.; Srivastava, R.M. An introduction to applied geostatistics; Oxford University Press: New York, 1989. [Google Scholar]
- Wallace, C.S.; Watts, J.M.; Yool, S.R. Characterizing the spatial structure of vegetation communities in the Mojave Desert using geostatistical techniques. Comput. Geosci. 2000, 26(4), 397–410. [Google Scholar]
- Delbari, M.; Amiri, M.; Motlagh, M.B. Assessing groundwater quality for irrigation using indicator kriging method. Appl. Water Sci. 2016, 6(4), 371–381. [Google Scholar]
- Barnes, R. Variogram tutorial. Golden, CO: Golden Software. 2003. Available online: http://www.goldensoftware.com/variogramTutorial.pdf.
- Philippopoulos, K.; Kalamaras, N.; Tzanis, C.G.; Deligiorgi, D.; Koutsogiannis, I. Multifractal Detrended fluctuation analysis of temperature reanalysis data over Greece. Atmosphere. 2019, 10, 336. [Google Scholar]
- Malamud, B.D.; Turcotte, D.L. Self-affine time series: I. Generation and analyses. Adv. Geophys. 1999, 40, 1–90. [Google Scholar]
- Kantelhardt, J.W. Fractal and multifractal time series. In Mathematics of Complexity and Dynamical Systems; Meyers, R.A., Ed.; Springer: New York, 2011; pp. 463–487. [Google Scholar]
- Livina, V.N.; Ashkenazy, Y.; Bunde, A.; Havlin, S. Seasonality effects on nonlinear properties of hydrometeorological records. In Extremis; Springer: Berlin, Germany, 2011; pp. 266–284. [Google Scholar]
- Li, E.; Mu, X.; Zhao, G.; Gao, P. Multifractal detrended fluctuation analysis of streamflow in Yellow river basin, China. Water 2015, 7, 1670–1686. [Google Scholar] [CrossRef]
- Gorjão, L.R.; Hassan, G.; Kurths, J.; Witthaut, D. MFDFA: Efficient multifractal detrended fluctuation analysis in python. Comput. Phys. Commun. 2022, 273, 108254. [Google Scholar]
- Kumar, V. Optimal contour mapping of groundwater levels using universal kriging - a case study. Hydrological Sciences J. 2007, 52(5), 1038–1050. [Google Scholar]
- Rakhshandehroo, G.R.; Amiri, S.M. Evaluating fractal behavior in groundwater level fluctuations time series. J. Hydrol. 2012, 464, 550–556. [Google Scholar]
- Habib, A. Exploring the physical interpretation of long-term memory in hydrology. Stoch. Environ. Res. Risk Assess. 2020, 34(12), 2083–2091. [Google Scholar]
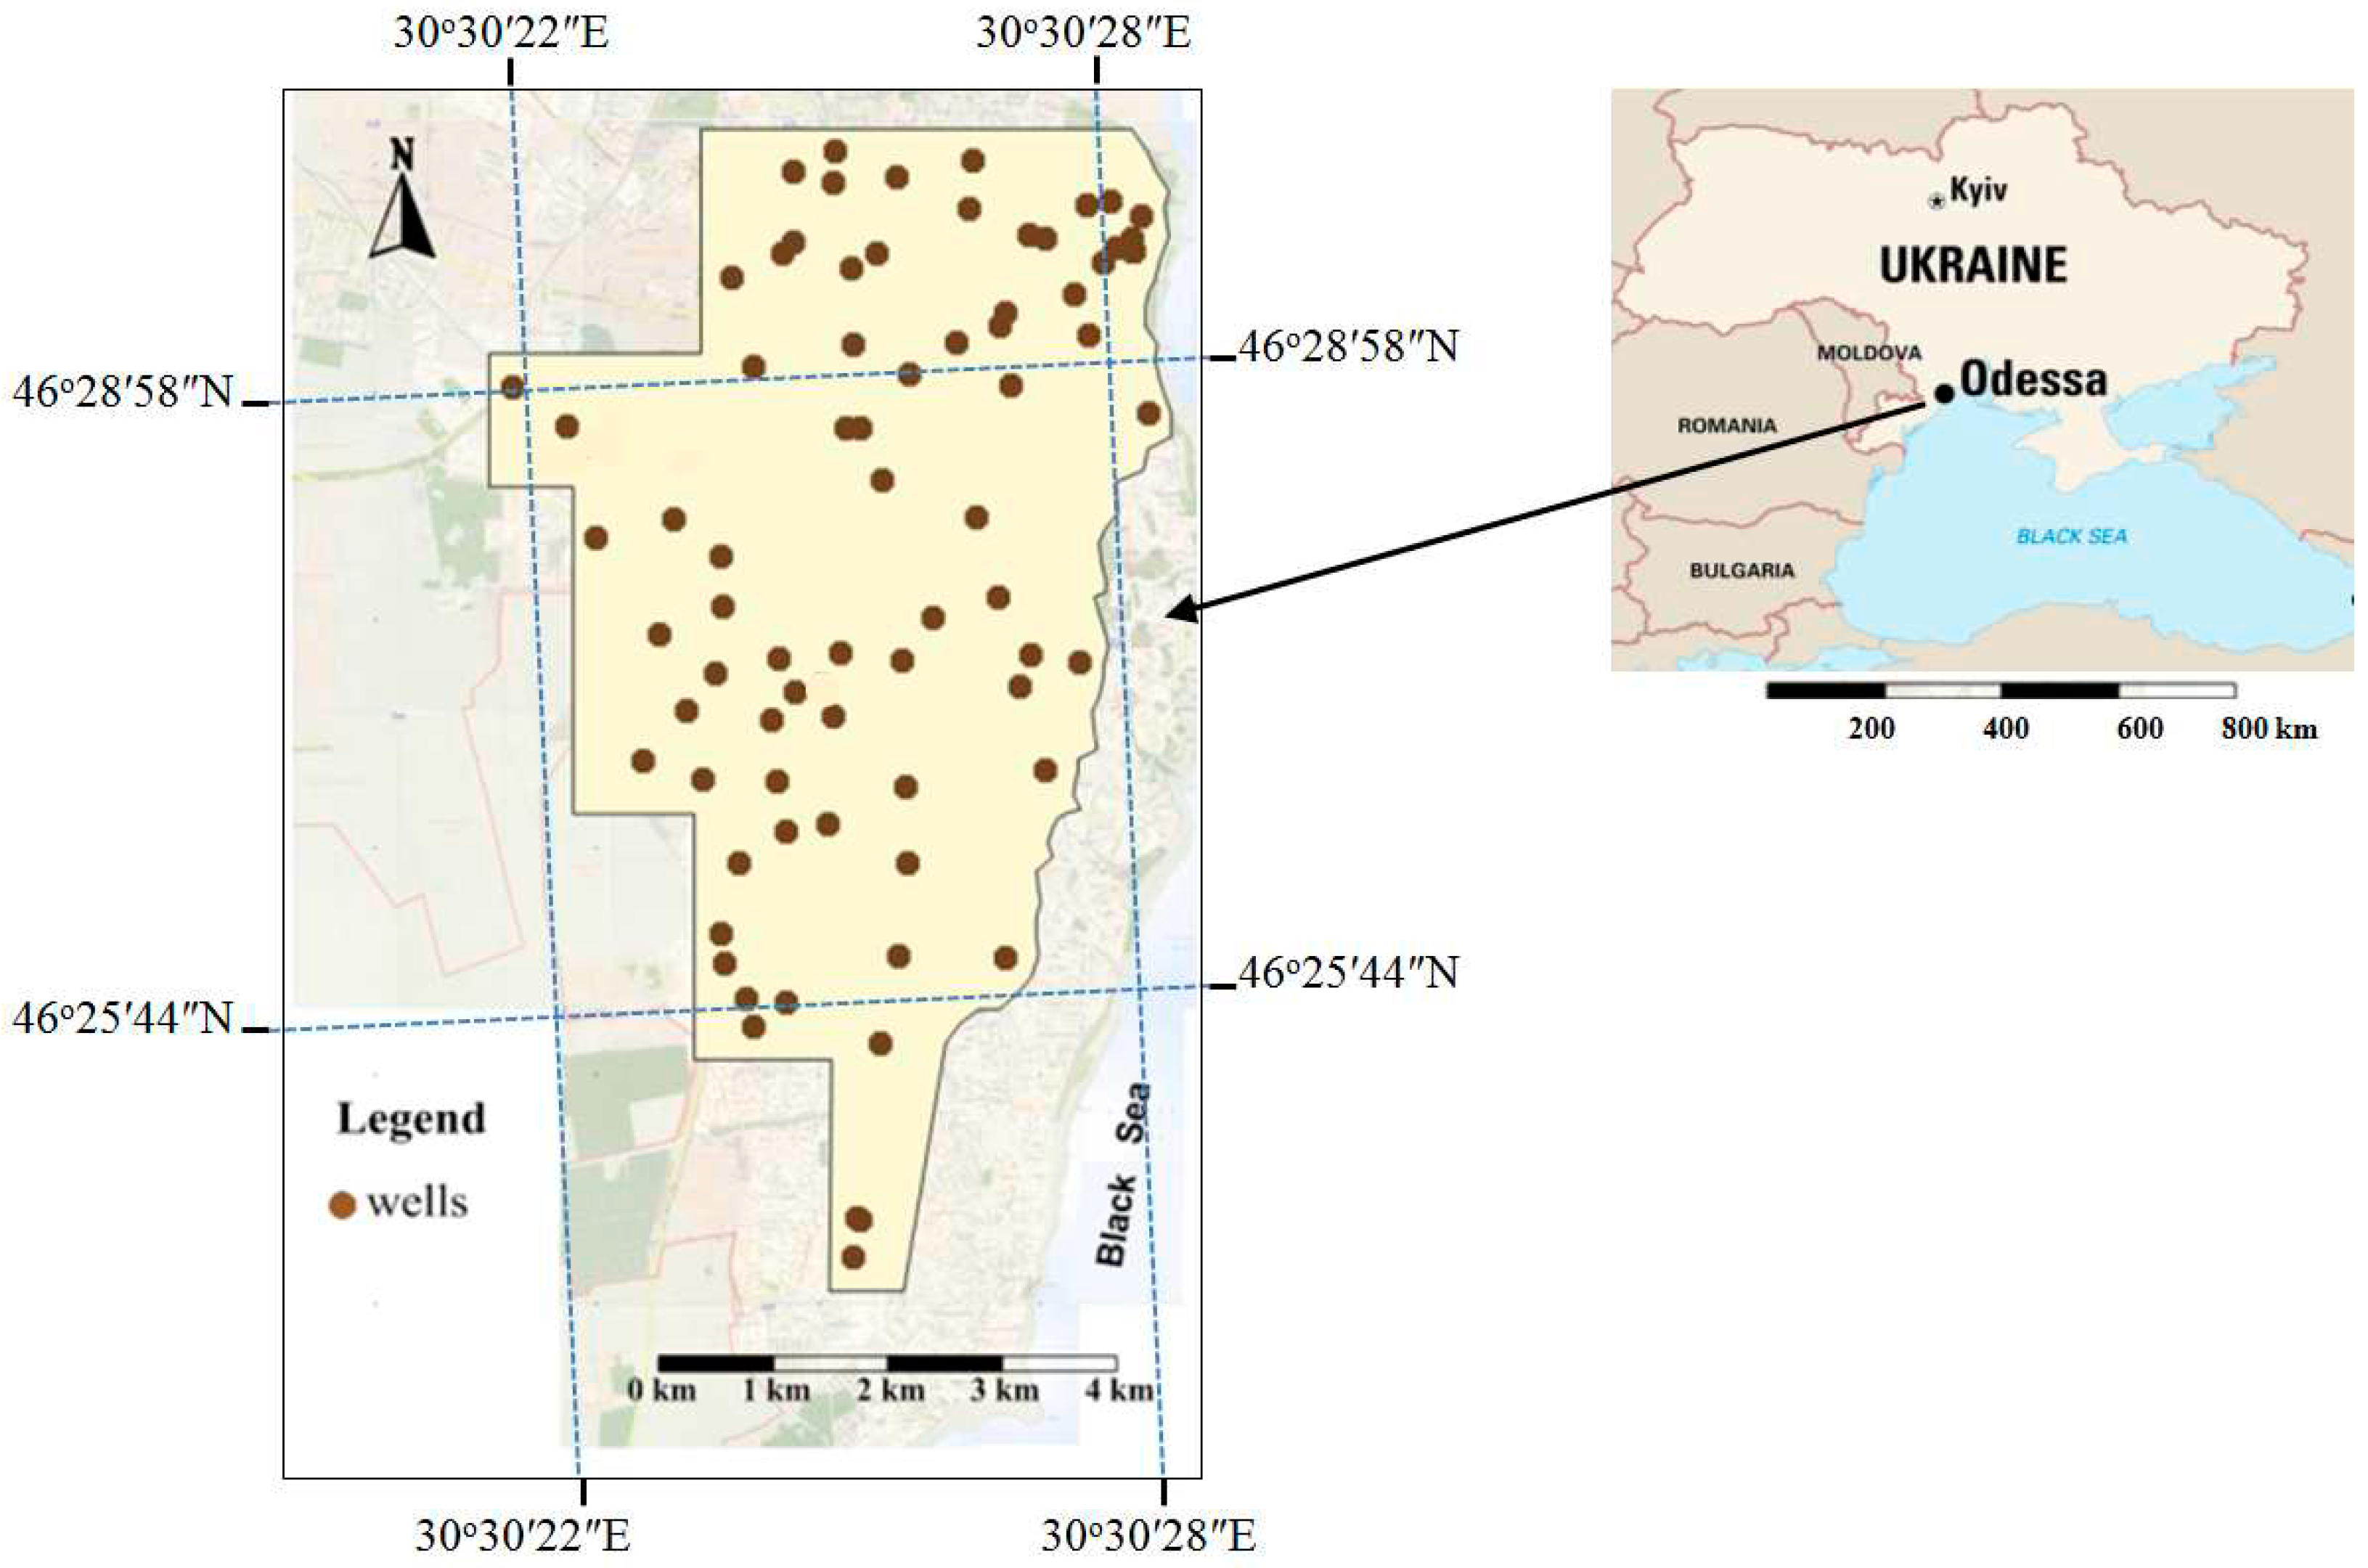
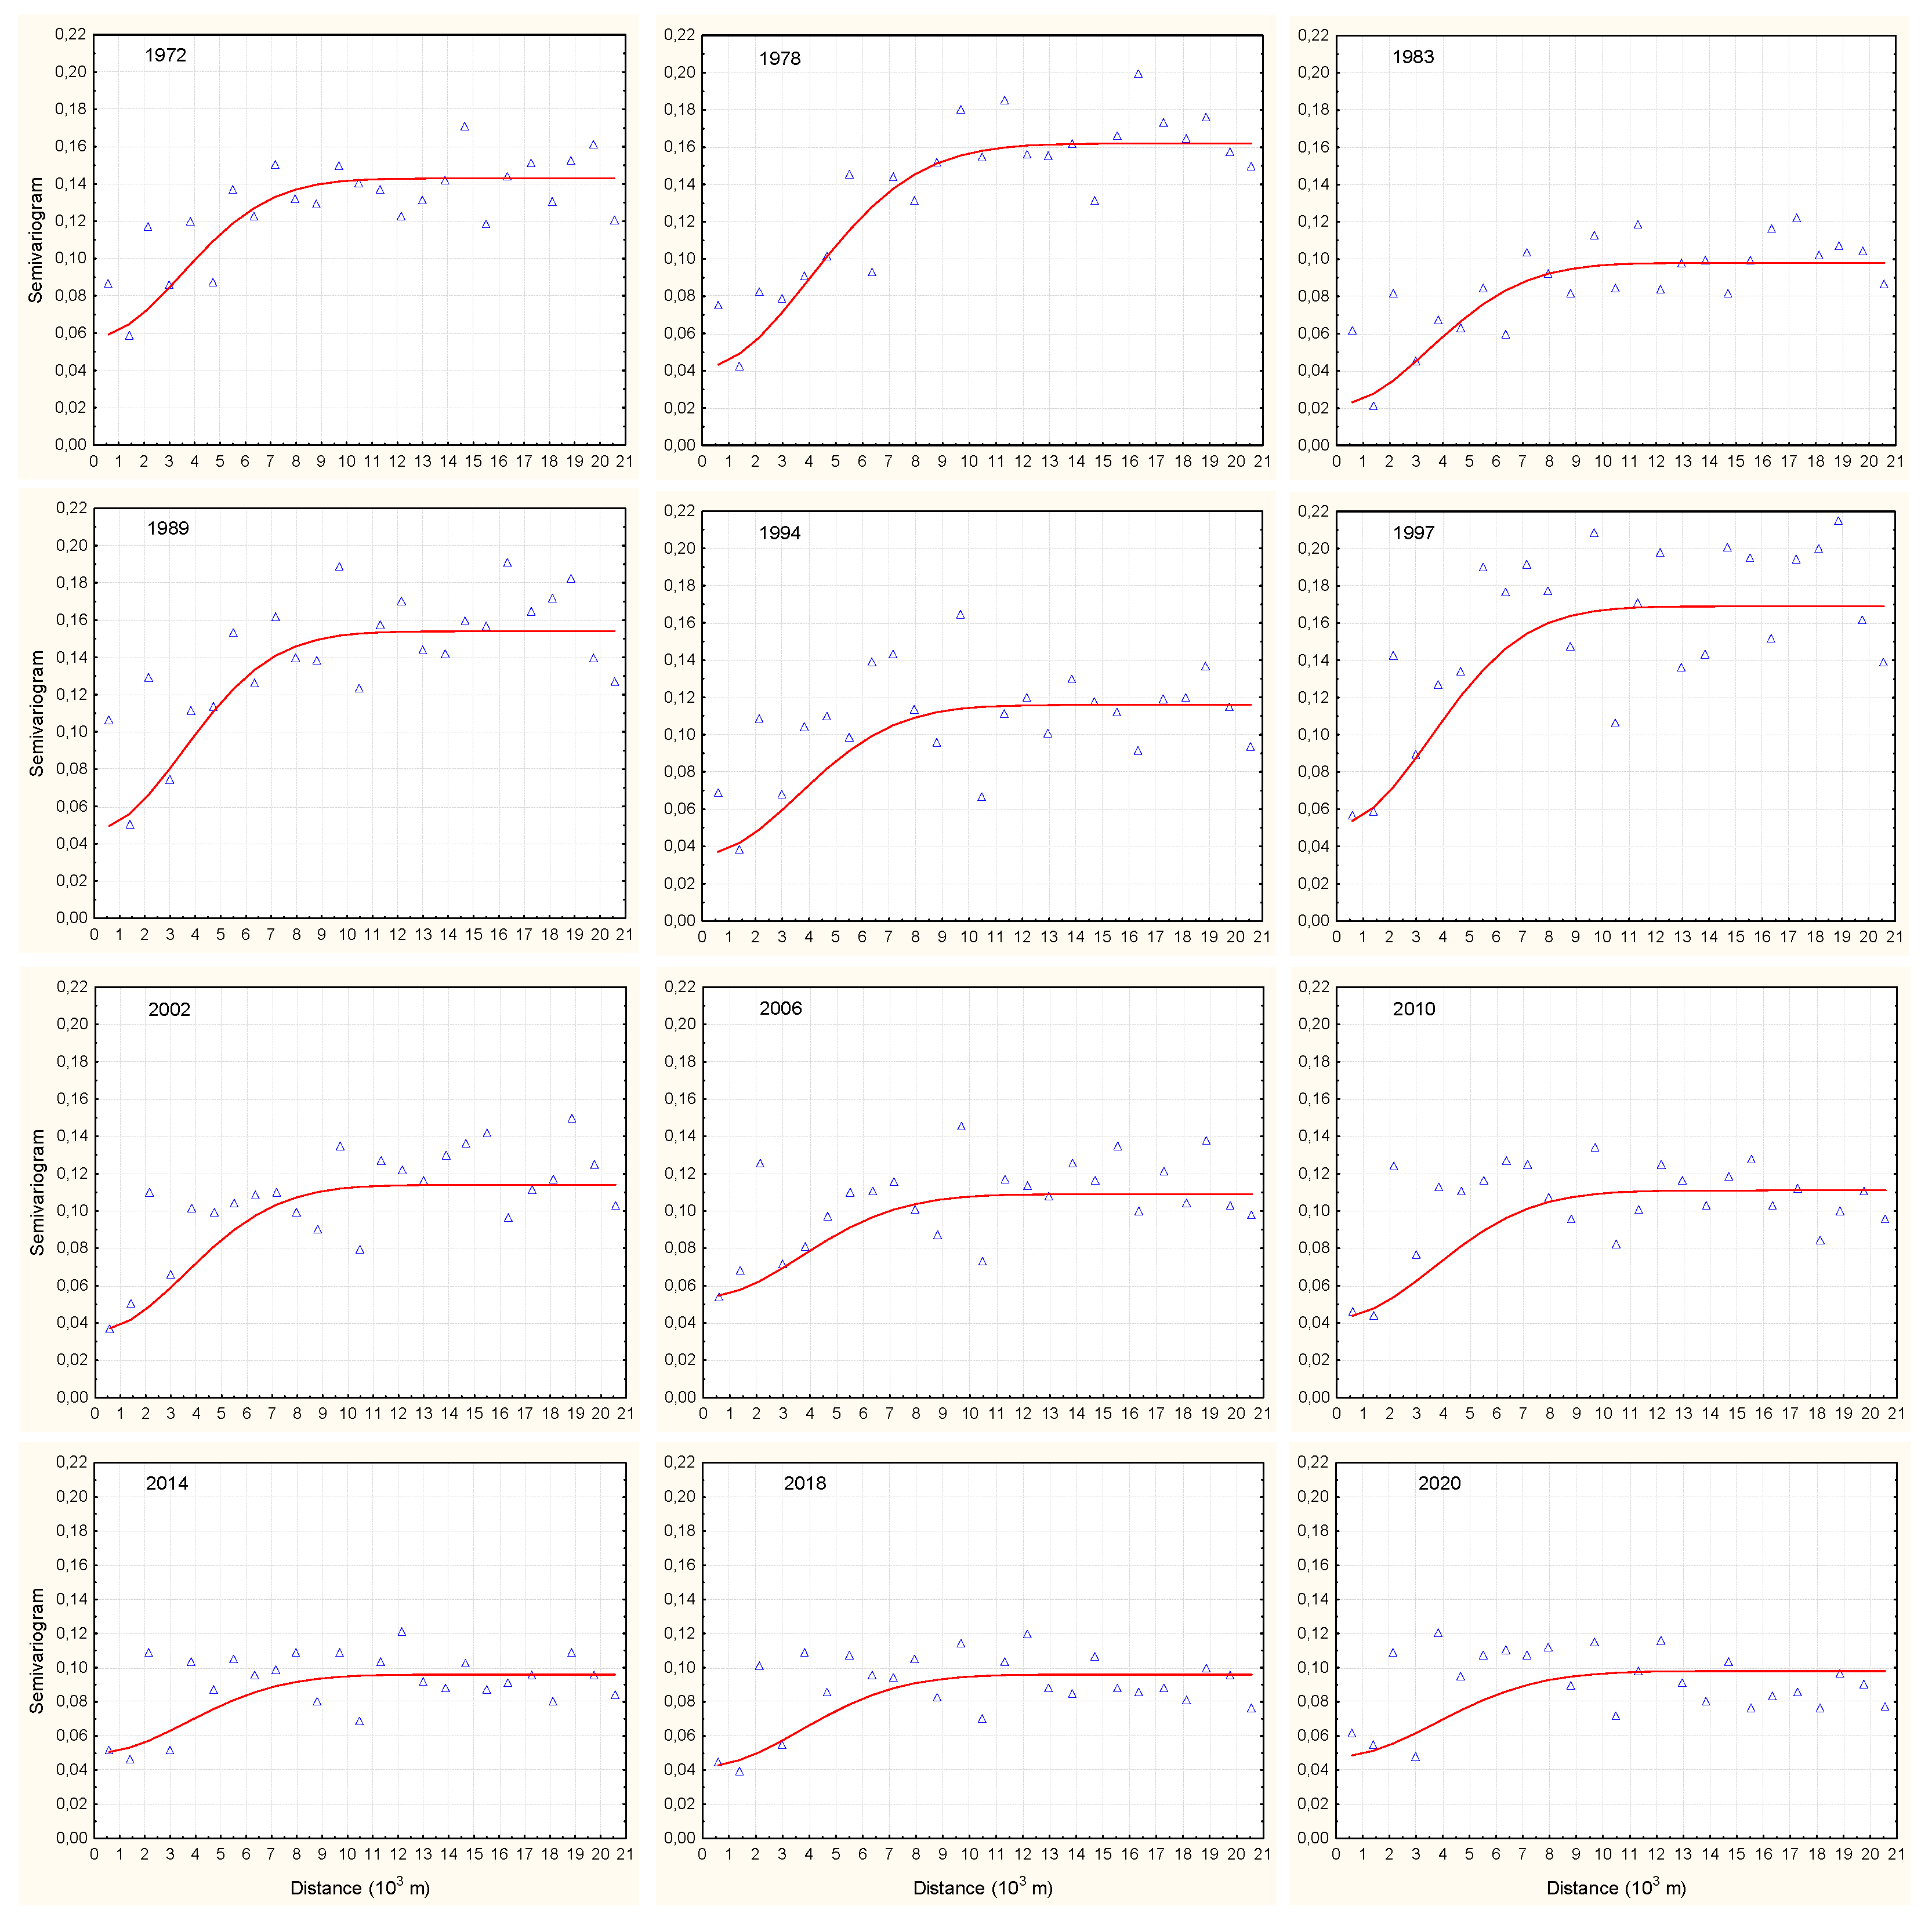
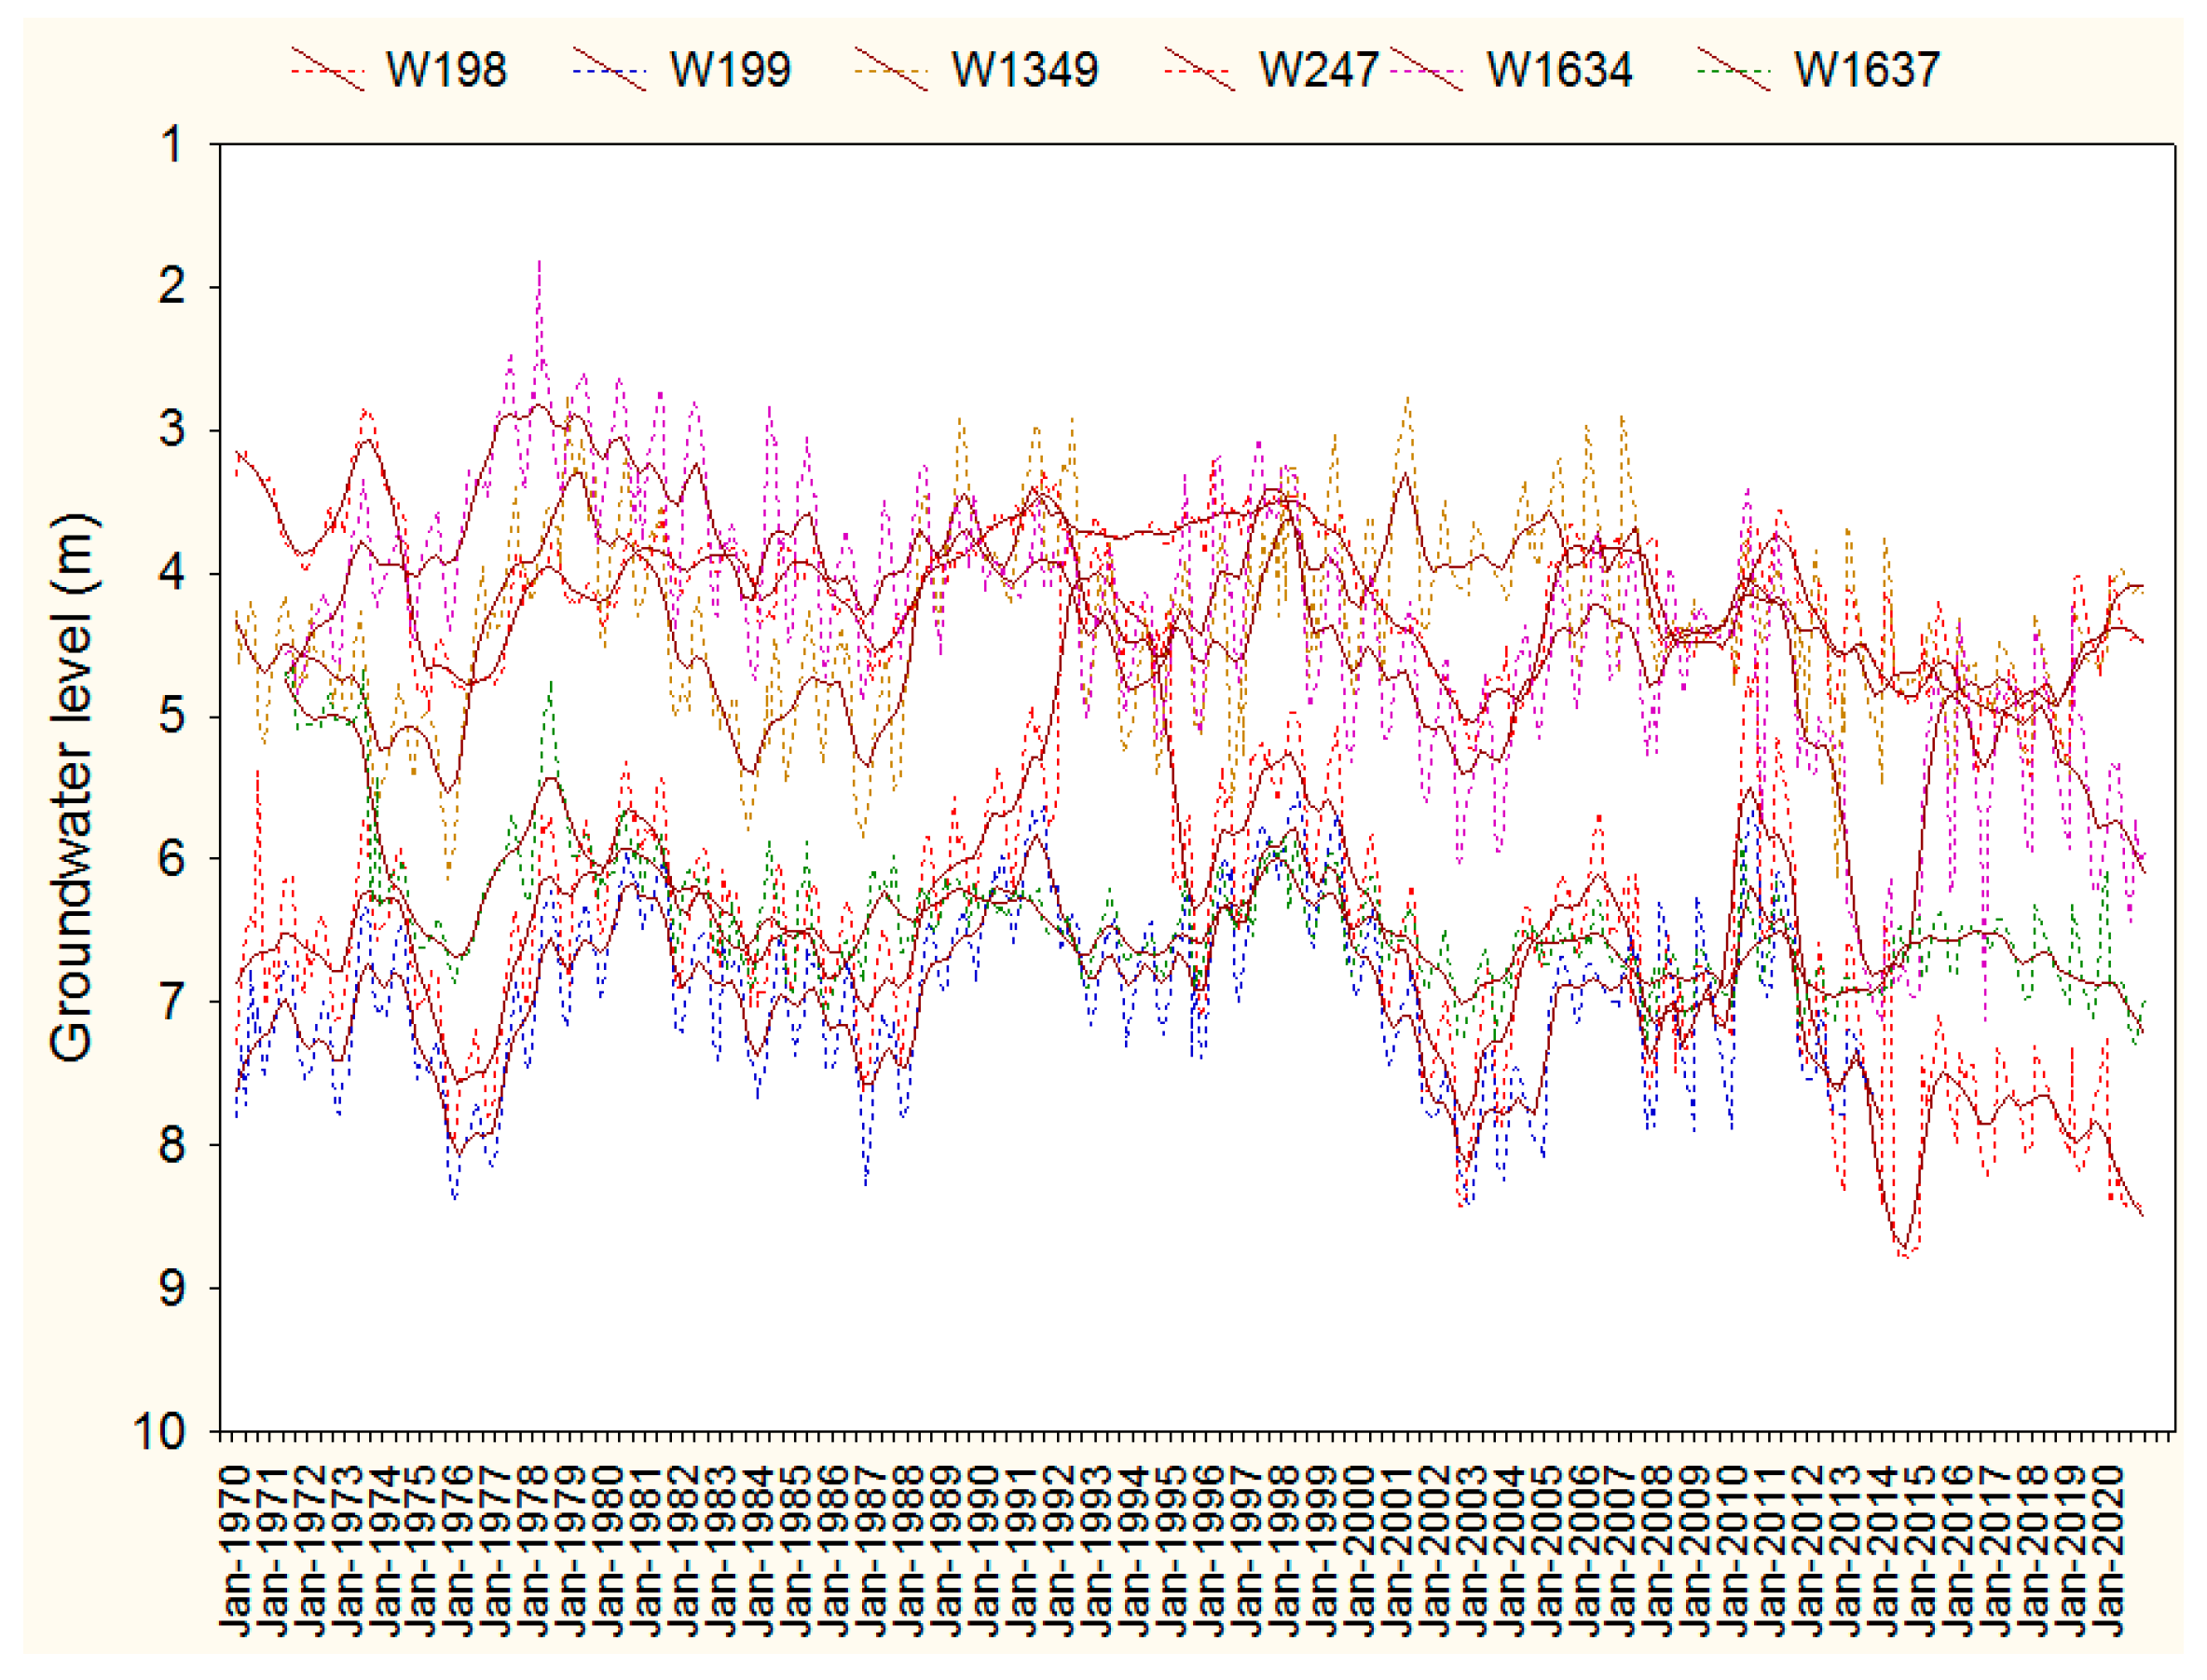
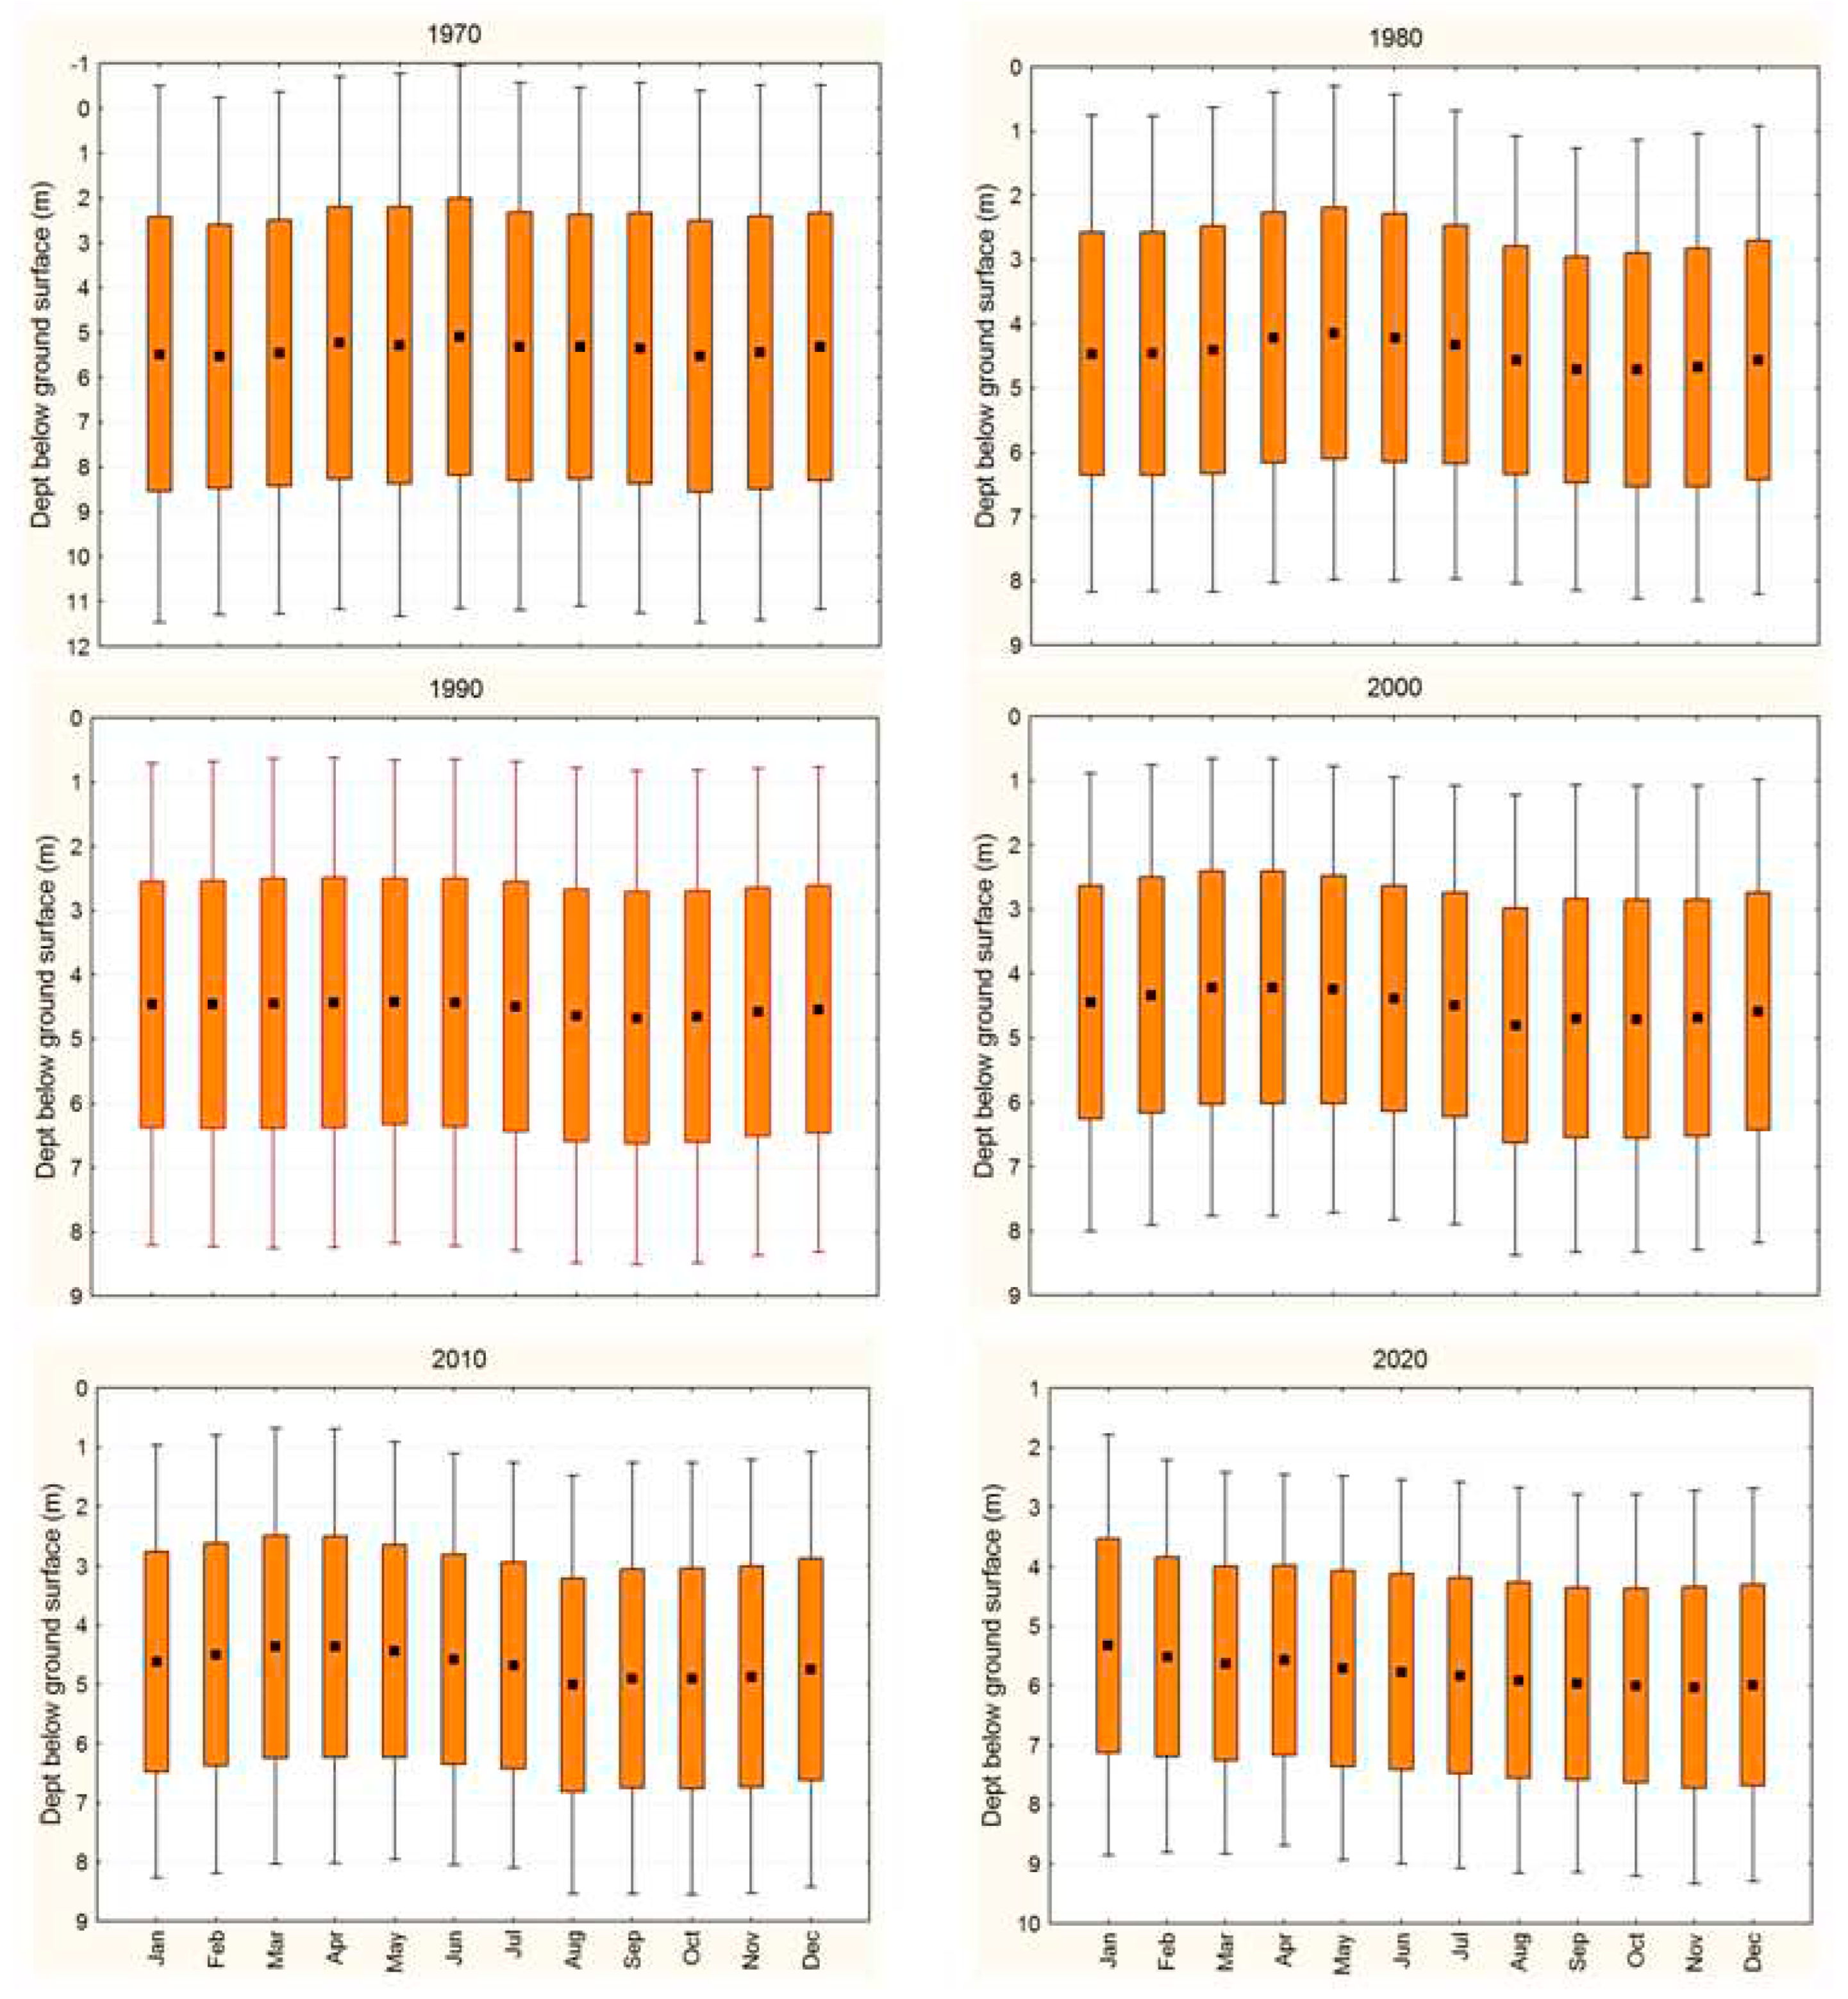
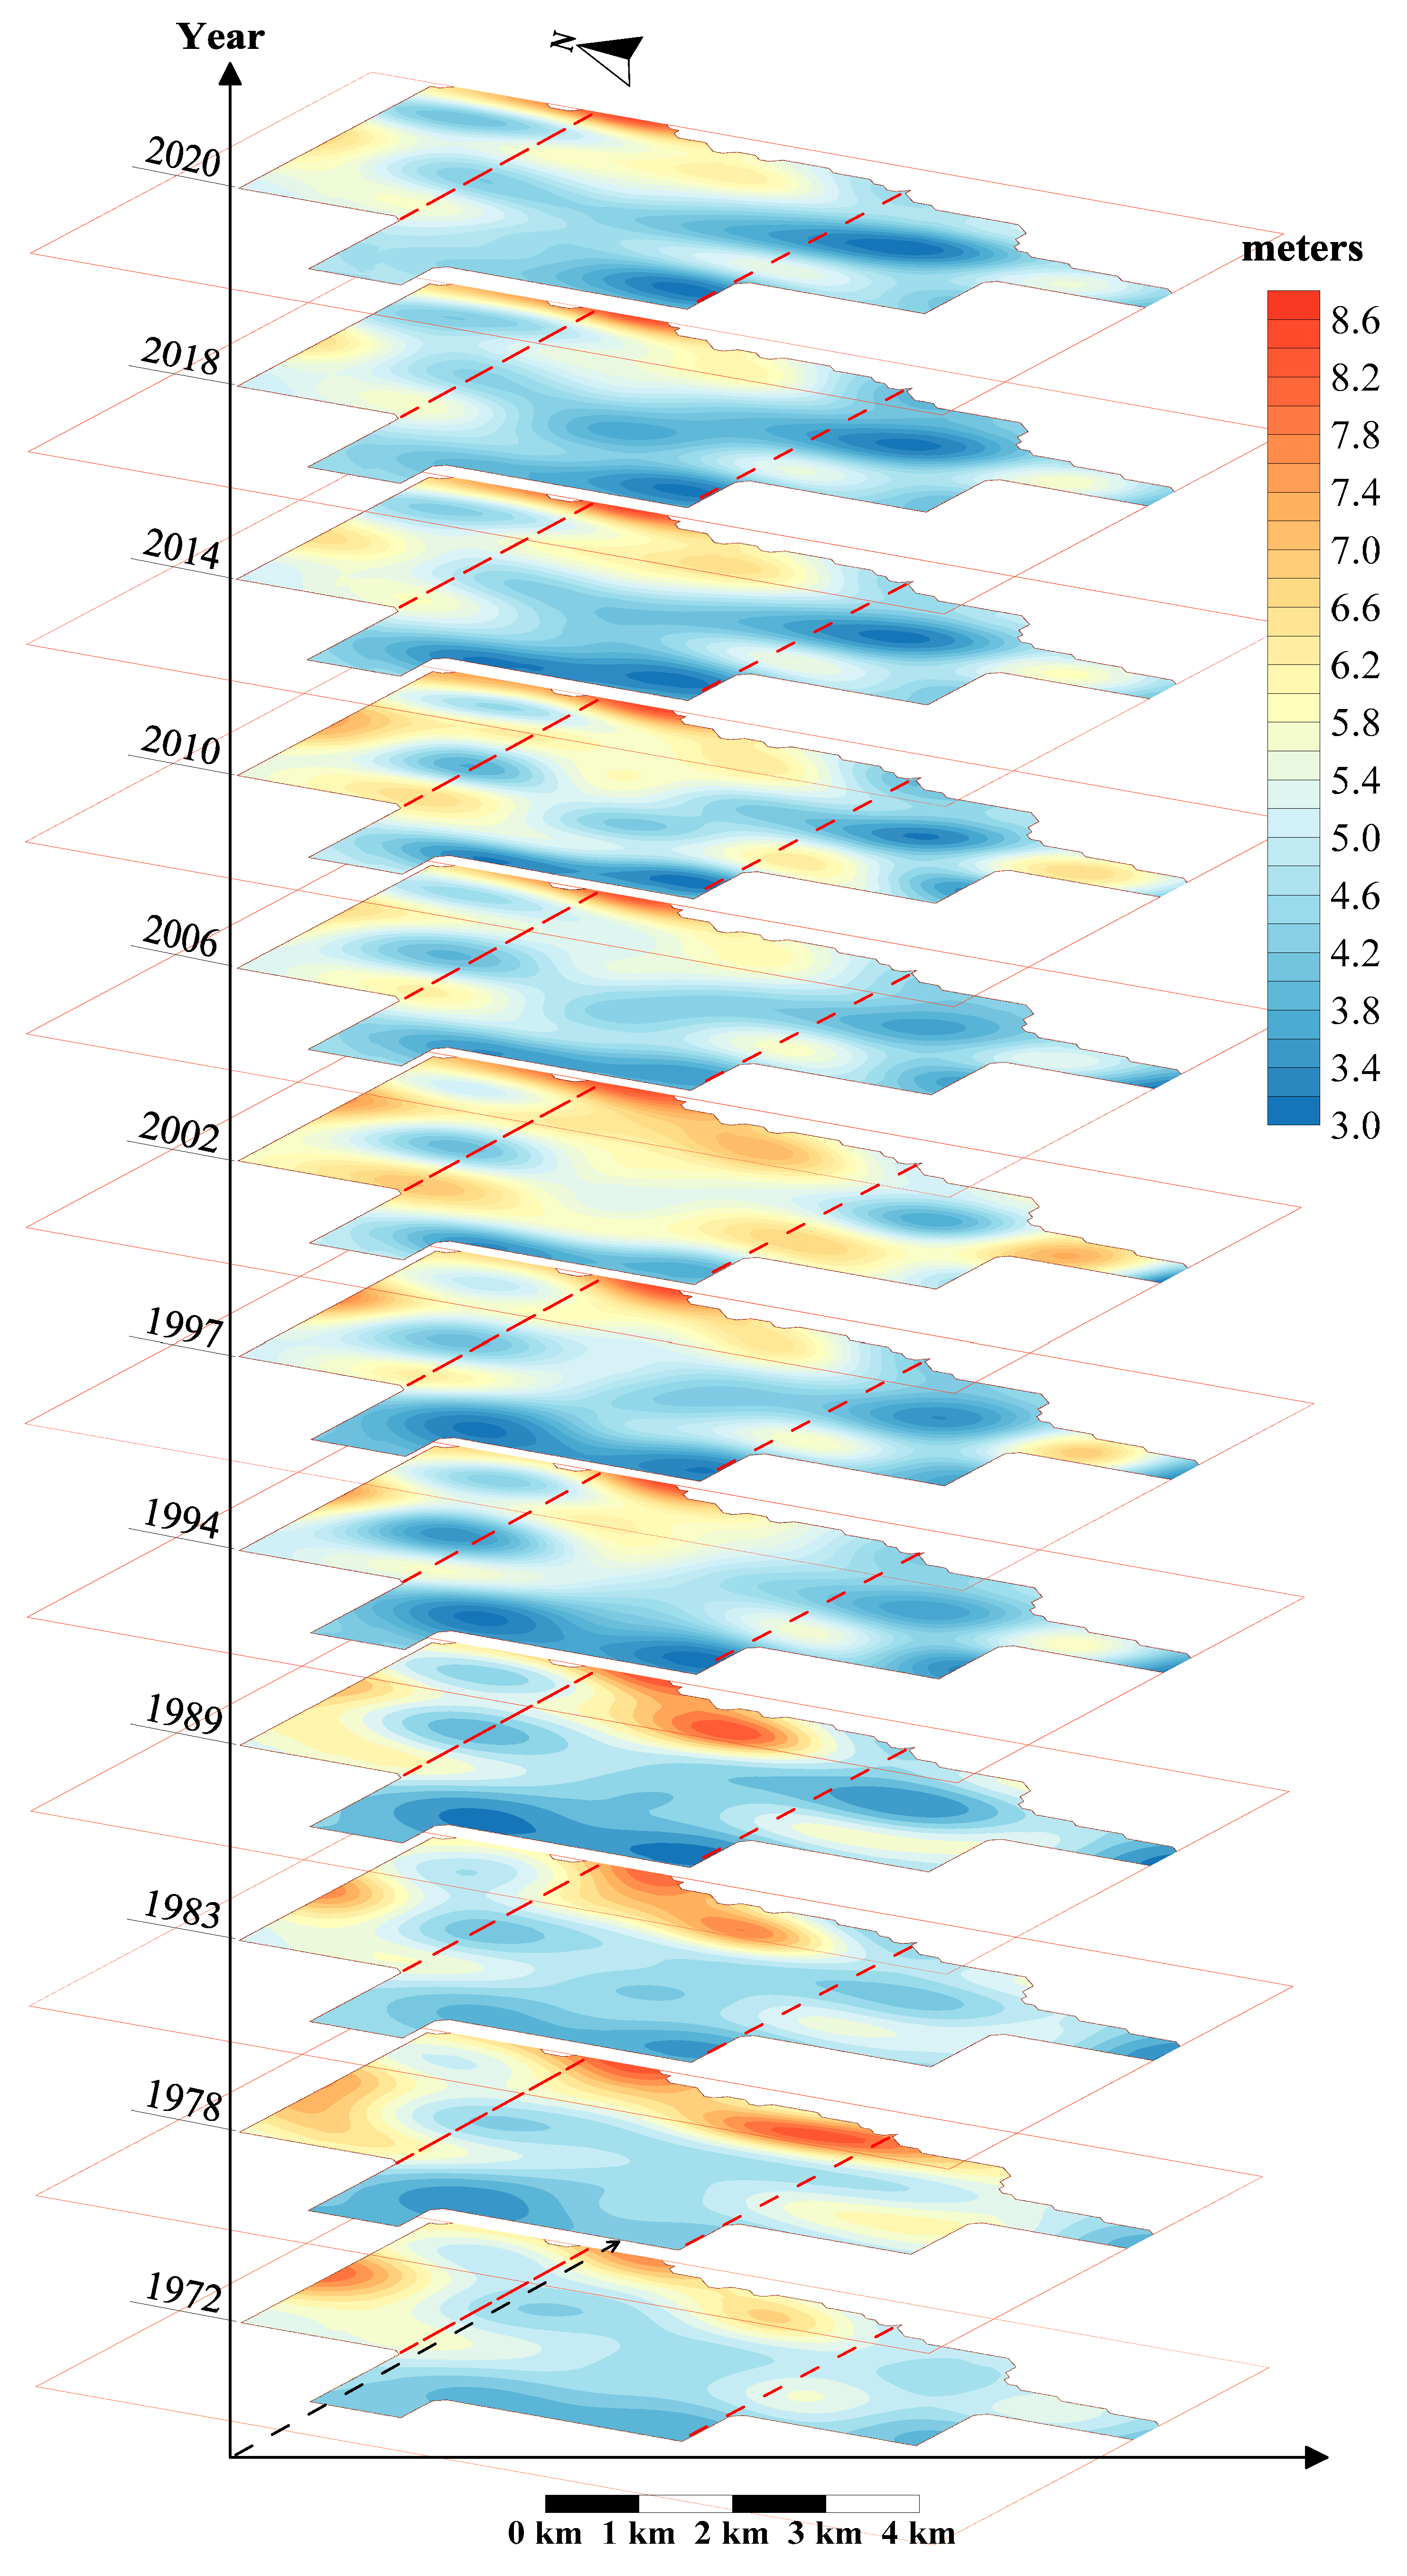
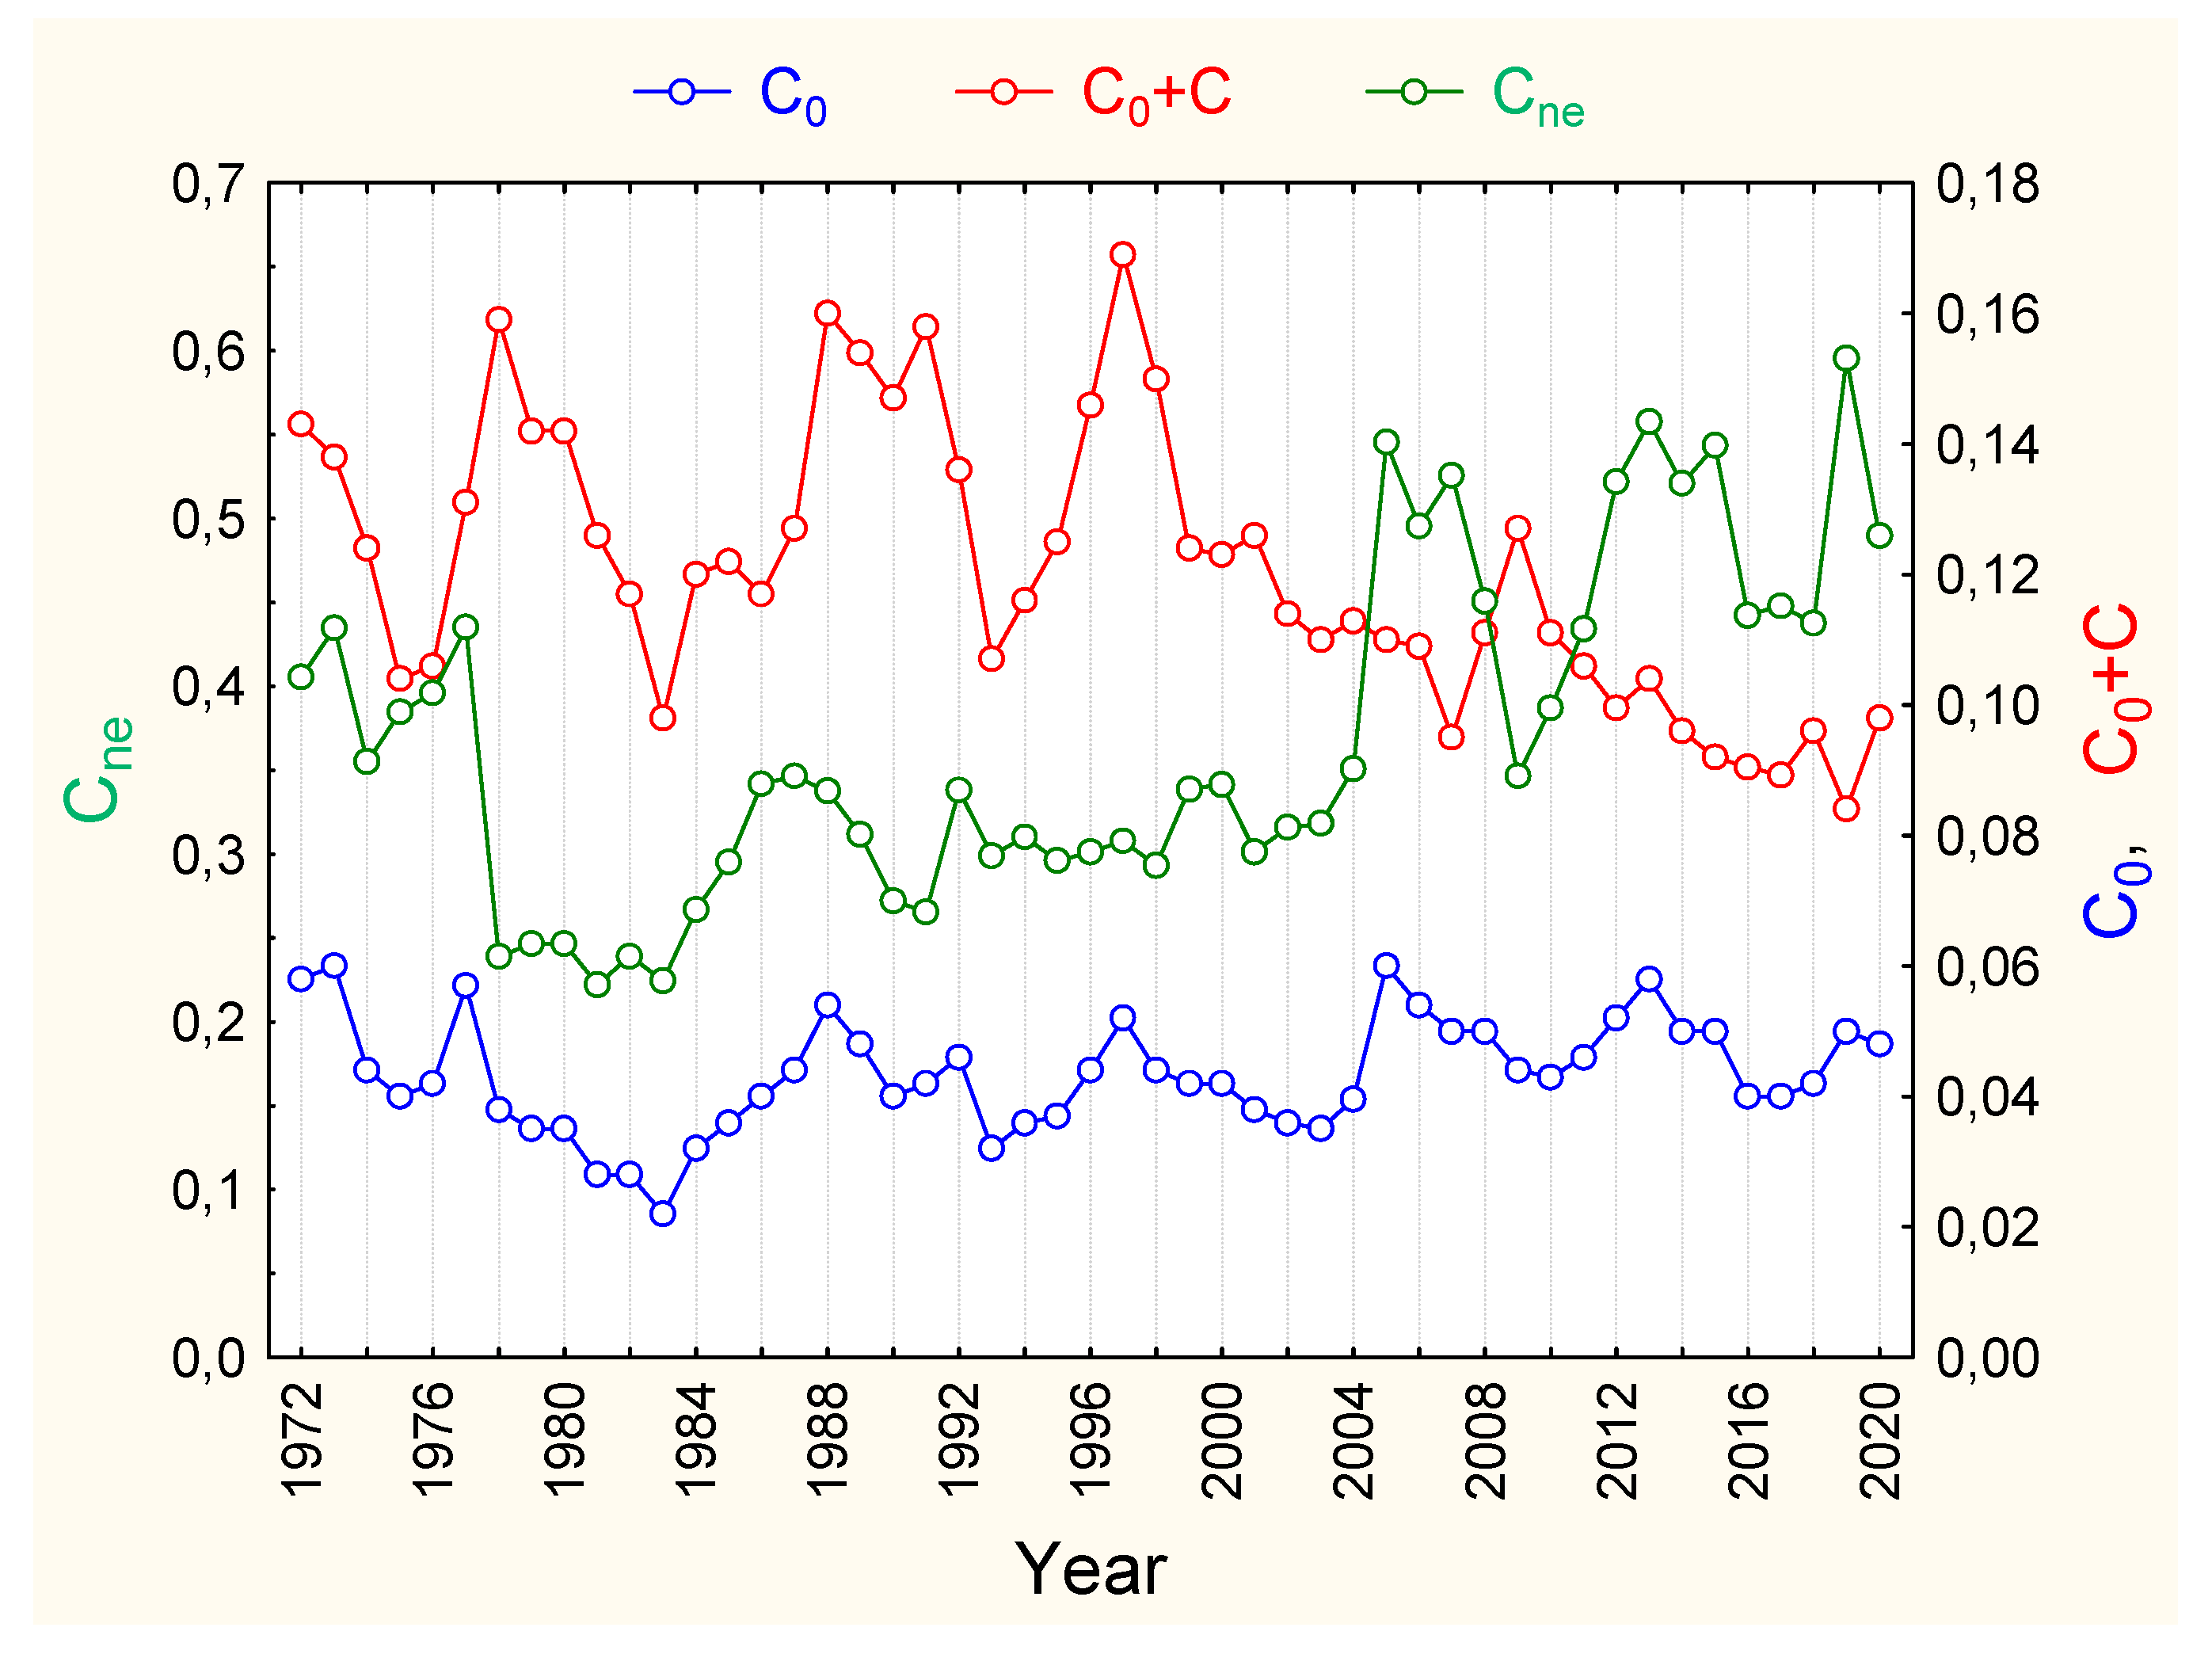
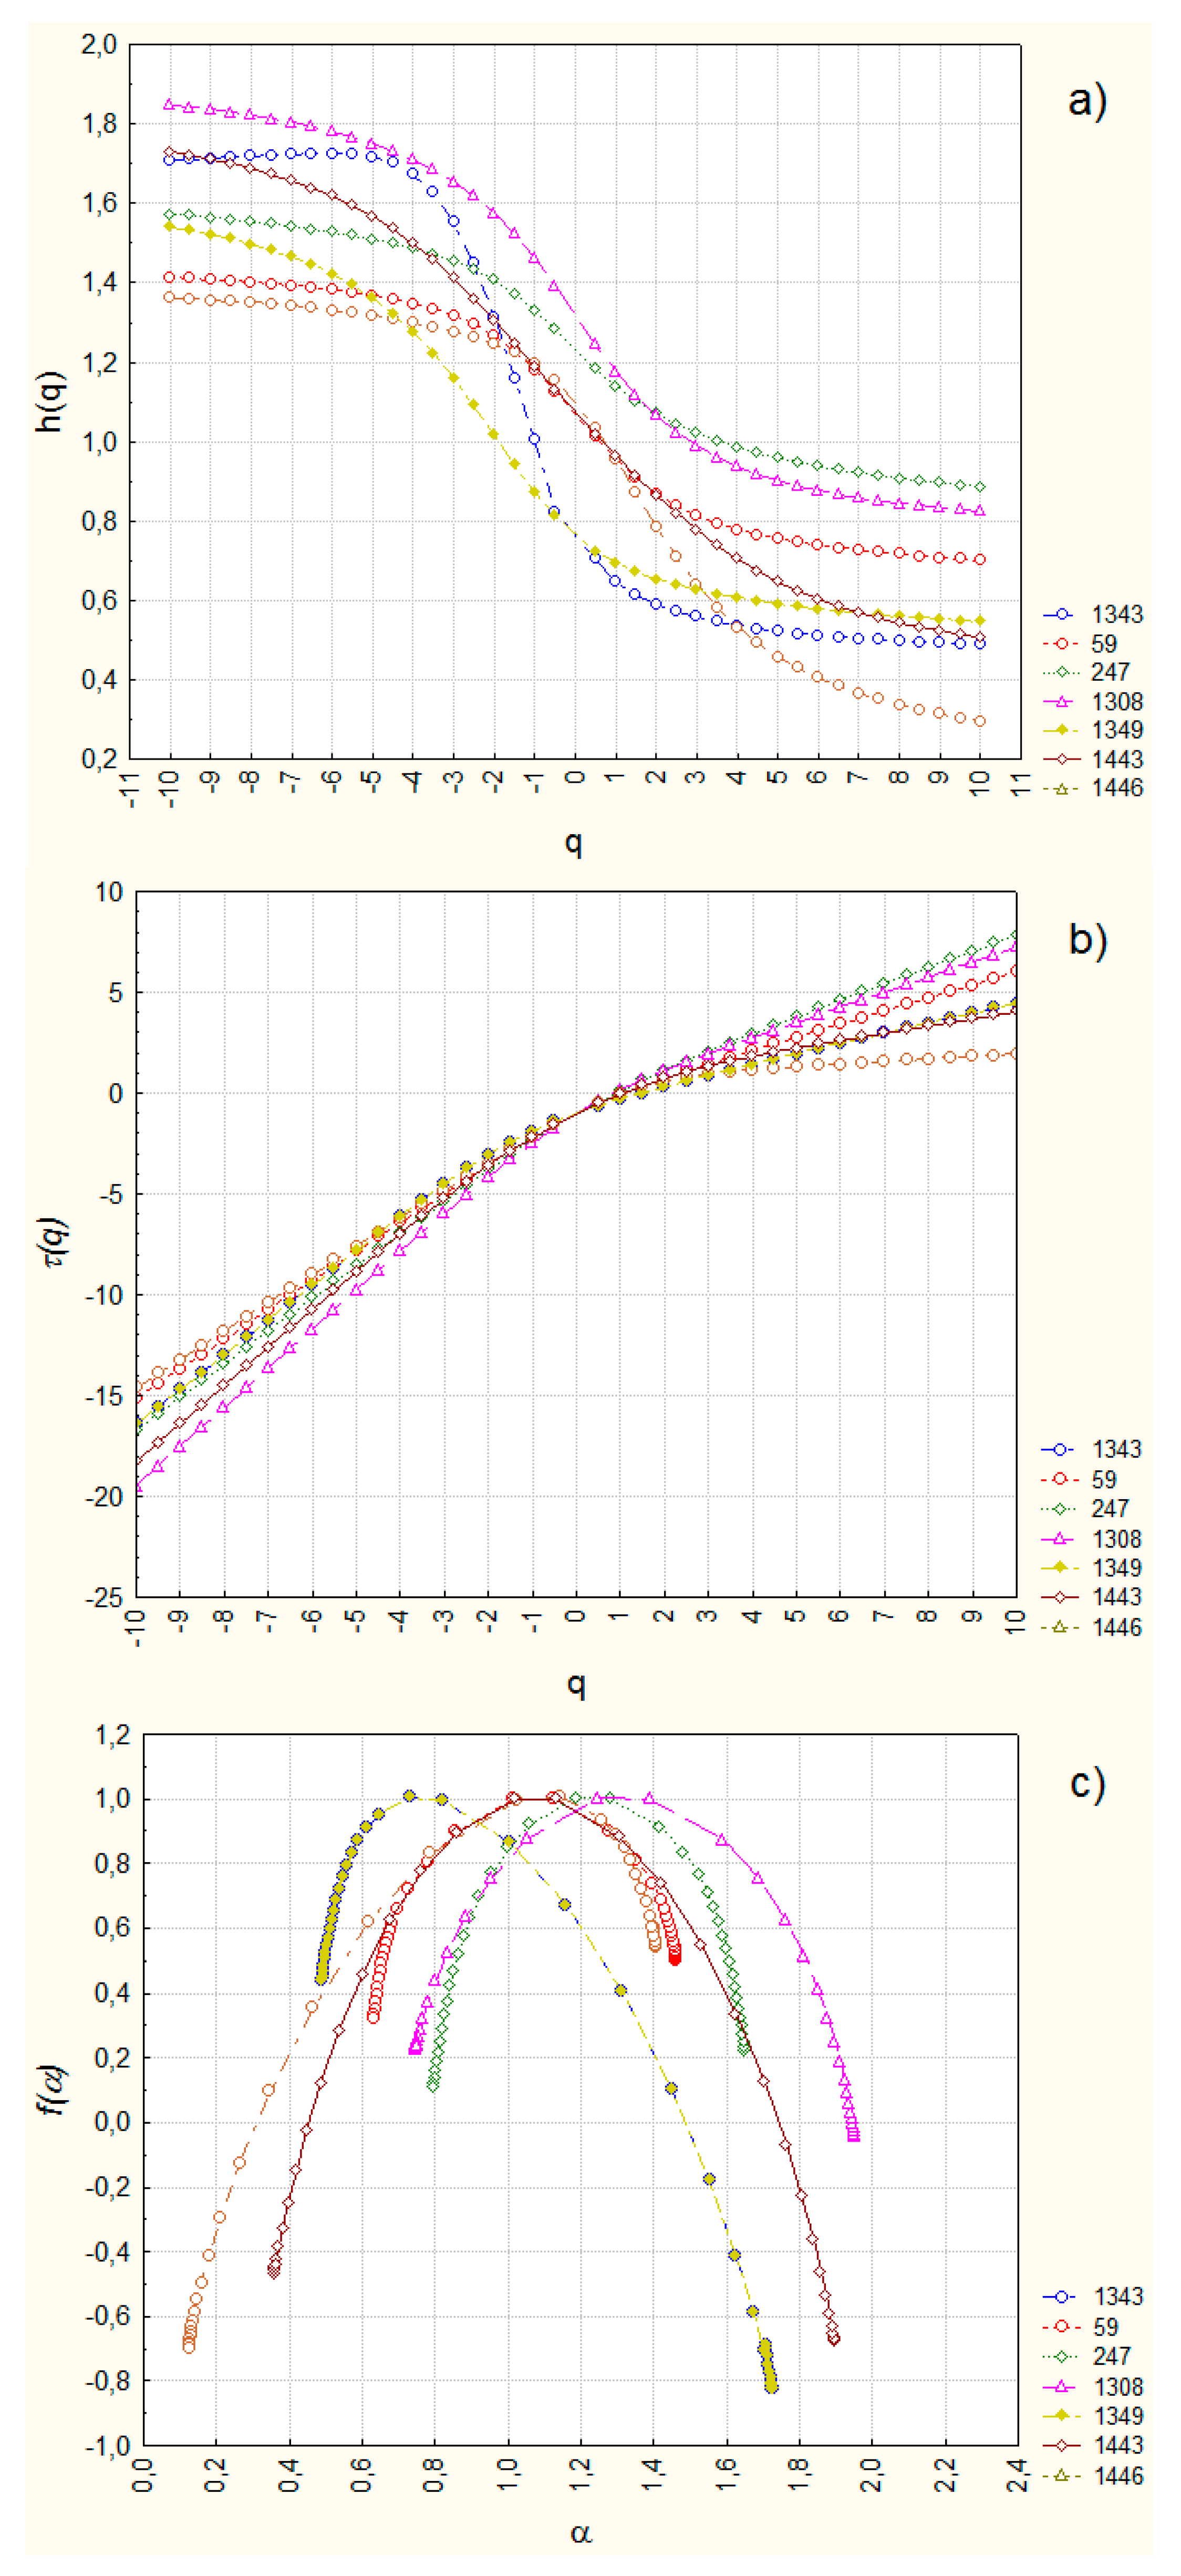
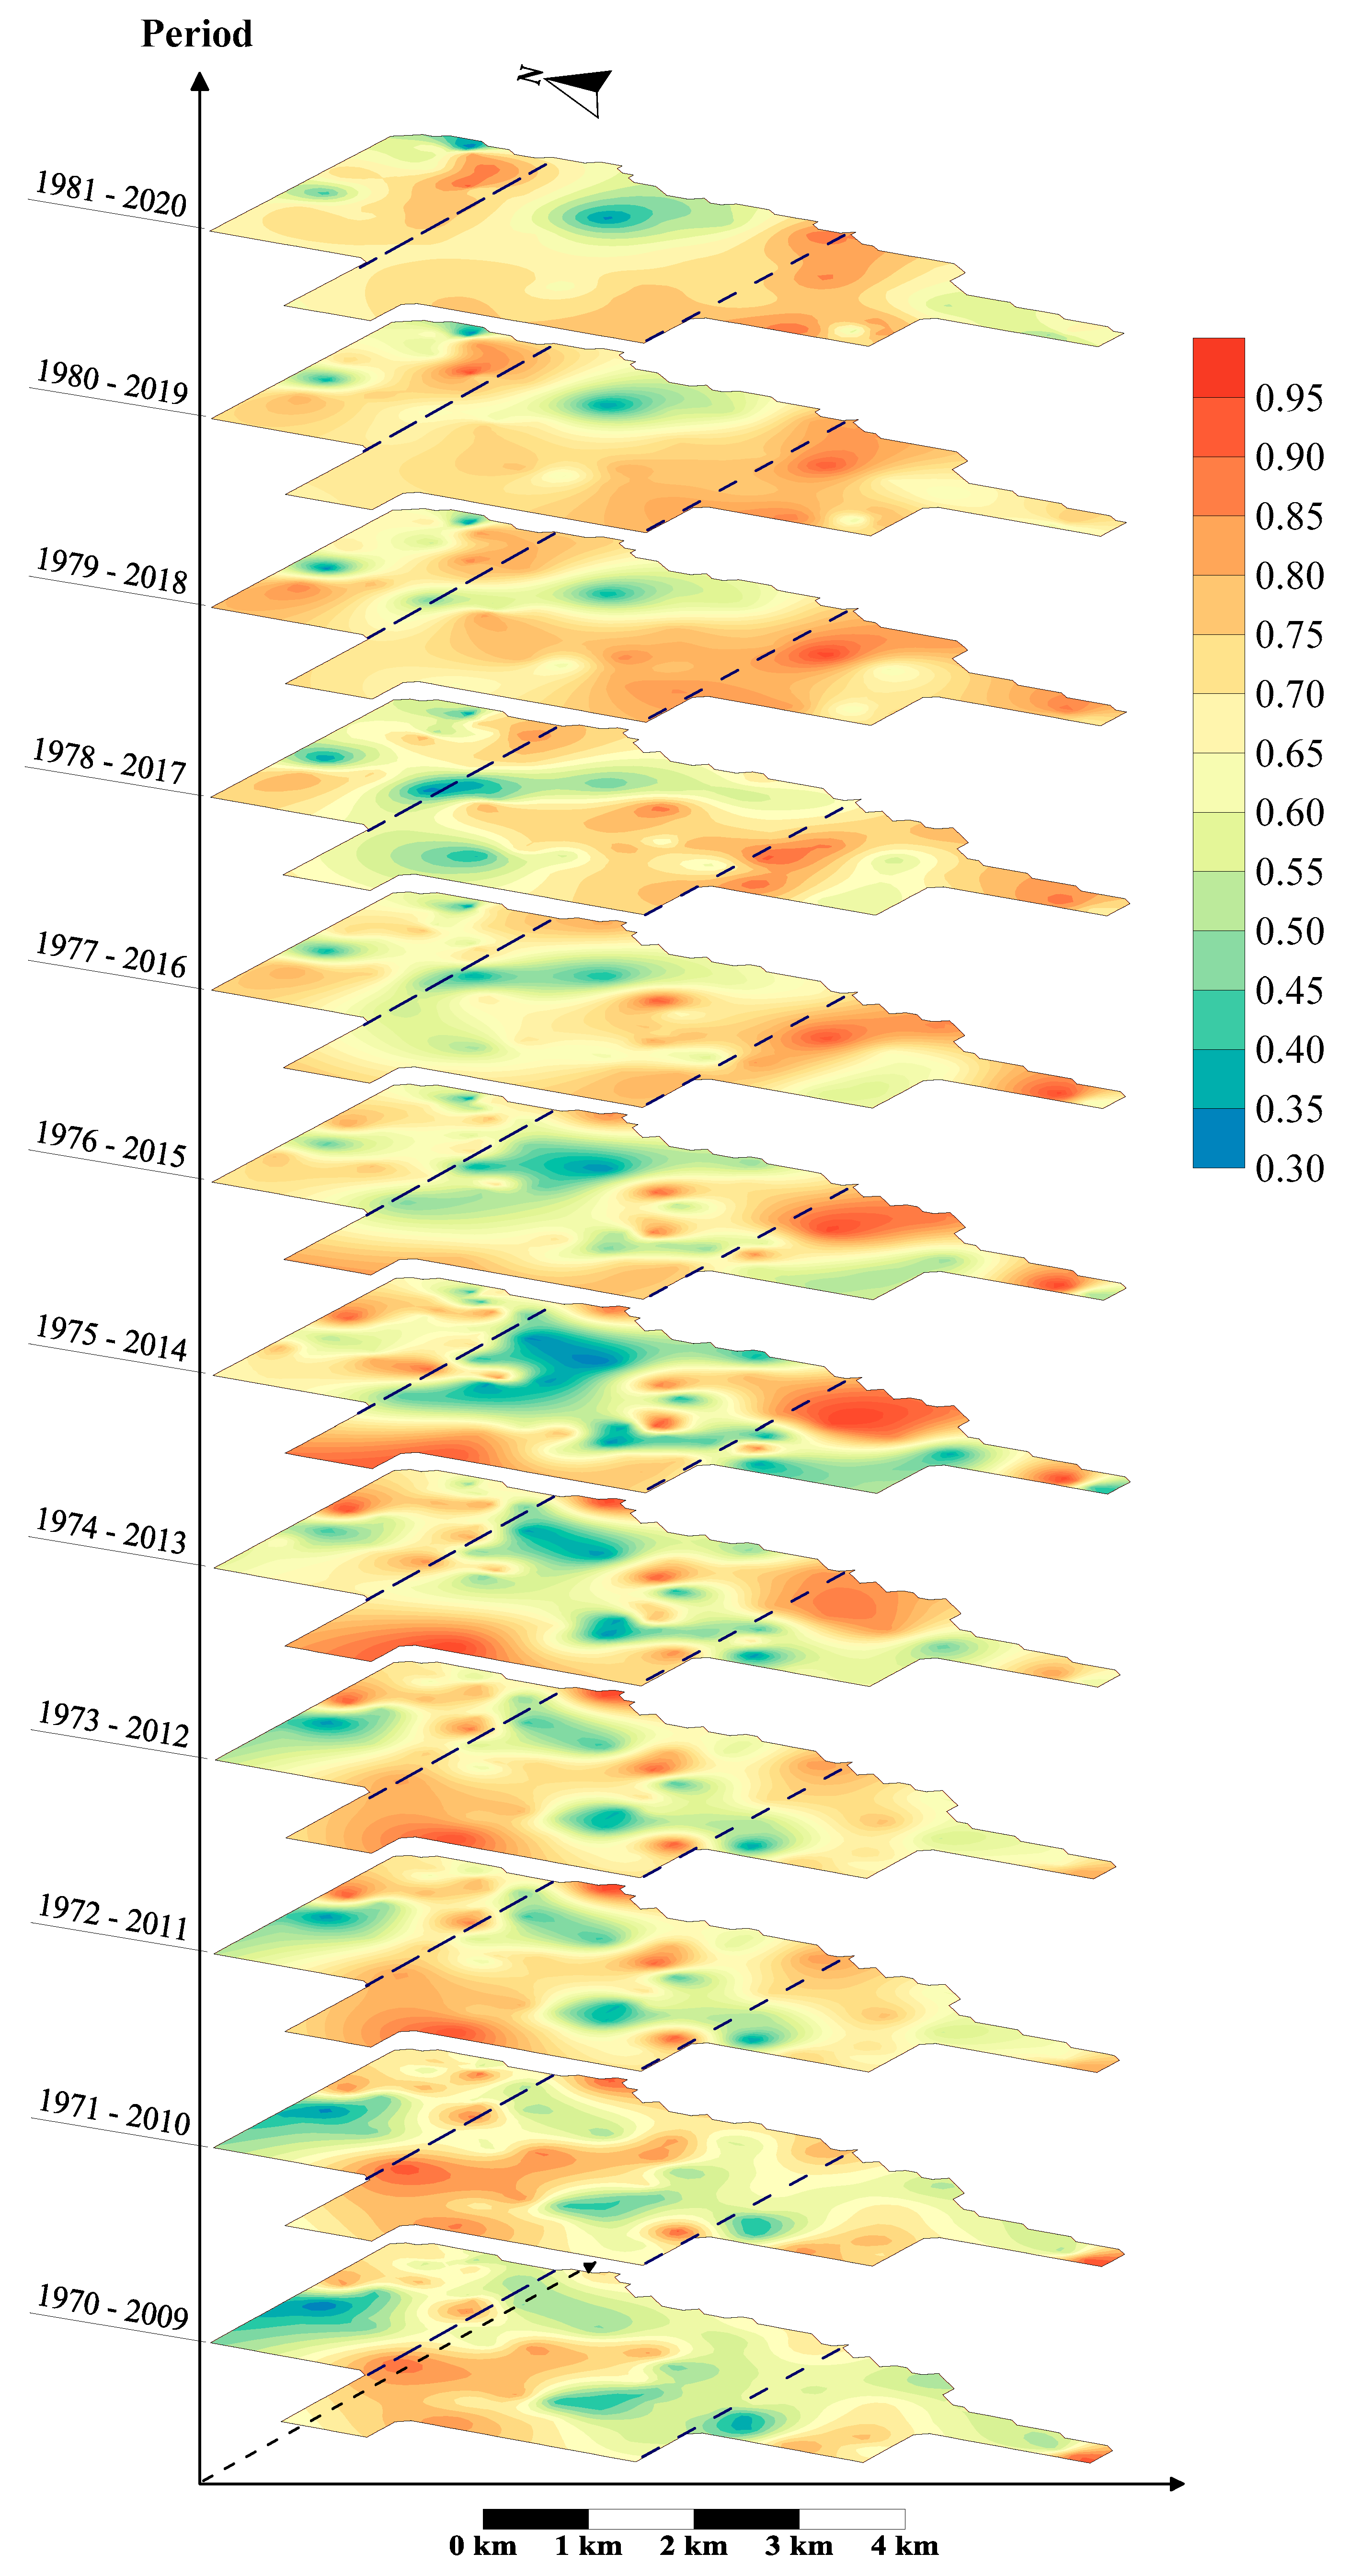
| Depth interval, meters | Average area, million m2 | Average area, % | |
|---|---|---|---|
| 0 – 1 | 0.06 | 0.24 | 13.28 |
| 1 – 2 | 0.52 | 2.04 | |
| 2 – 3 | 2.80 | 11.00 | |
| 3 – 4 | 6.14 | 24.12 | 68.07 |
| 4 – 5 | 5.80 | 22.78 | |
| 5 – 6 | 5.39 | 21.17 | |
| 6 – 7 | 2.28 | 8.96 | 18.65 |
| 7 – 8 | 1.15 | 4.52 | |
| 8 – 9 | 0.94 | 3.69 | |
| 9 – 10 | 0.38 | 1.48 | |
| Year | Mean | Median | Variation | Kurtosis | Skewness |
|---|---|---|---|---|---|
| 1972 | 5,09 | 4,54 | 2,50 | 0,49 | 1,06 |
| 1978 | 4,25 | 3,77 | 1,94 | 0,46 | 2,10 |
| 1983 | 4,75 | 4,36 | 1,91 | 0,40 | 2,19 |
| 1989 | 4,49 | 3,91 | 2,04 | 0,46 | 3,03 |
| 1994 | 4,68 | 4,44 | 1,86 | 0,40 | 3,01 |
| 1997 | 4,04 | 3,73 | 1,89 | 0,47 | 2,35 |
| 2002 | 4,93 | 4,87 | 1,81 | 0,37 | 2,63 |
| 2006 | 4,51 | 4,15 | 1,77 | 0,39 | 2,94 |
| 2010 | 5,03 | 4,54 | 2,03 | 0,40 | 2,59 |
| 2014 | 5,80 | 5,49 | 2,02 | 0,35 | 3,91 |
| 2018 | 5,22 | 5,10 | 1,61 | 0,31 | 0,46 |
| 2020 | 5,77 | 5,74 | 1,63 | 0,28 | 0,78 |
Disclaimer/Publisher’s Note: The statements, opinions and data contained in all publications are solely those of the individual author(s) and contributor(s) and not of MDPI and/or the editor(s). MDPI and/or the editor(s) disclaim responsibility for any injury to people or property resulting from any ideas, methods, instructions or products referred to in the content. |
© 2023 by the authors. Licensee MDPI, Basel, Switzerland. This article is an open access article distributed under the terms and conditions of the Creative Commons Attribution (CC BY) license (http://creativecommons.org/licenses/by/4.0/).


