1. Introduction
As an excellent raw material for the production of fine textiles, wool has high quality requirements in the textile industry [
1]. Both SM and STH have a high wool value, but SM have a higher wool quality, finer diameter, higher roll curvature, longer staple fiber length, and greater wool yield. The yield and quality of wool are determined by the hair follicles (HFs), an important accessory structure of the skin [
2]; hair follicles are important organs controlling the growth and development of mammalian hair and can be divided into primary hair follicles and secondary hair follicles according to their structural characteristics and developmental stages [
3]. The morphological development of hair follicles is a complex process involving an interaction between epithelial cells and dermal fibroblasts [
4]. First, mesenchymal cells send the “first signal” to induce the epidermis to form hair embryos, and the hair embryos release certain factors that induce the formation of dermal fibroblasts and dermal papillae. Then, the dermal papillae release the “second signal” to promote the proliferation and differentiation of epithelial cells; this forms a well-structured hair follicle [
5].
LncRNA is defined as a class of RNA molecules with a length greater than 200 nucleotides and no ability to encode proteins [
6]; it may be more specific than protein-coding genes in some applications [
7] and has been confirmed to participate in biological processes such as cell proliferation, cell differentiation, and apoptosis [
8]. Studies have shown that LncRNA plays an important role in the regulation of gene expression in organisms, but it is rarely annotated in the sheep genome [
9], and many functional genes and non-coding RNAs are involved in the regulation of the fiber yield and quality of cashmere [
10,
11]. Therefore, it is possible to improve wool traits by regulating the expression of non-coding RNA [
12].
In recent years, with the rise of molecular breeding technology and the discovery of lncRNA functions, more and more researchers have begun to pay attention to the molecular mechanism of wool fiber traits in economic animals for wool use. One study showed that several key genes such as KRT26, KRT28, and KRT39 and lncRNAs such as MSTRG.16794.17 and MSTRG.17532.2 have potentially important roles in the regulation of cashmere diameter [
13]. Jin et al. found that lncRNA MTC promoted the proliferation of Liaoning wool goat skin fibroblasts by regulating ITGB5, TlN2, CTSS, POLG, RAP1B, CHAF1A, CDCA8, and other proteins involved in cell proliferation [
14]. Sun et al. found that lncRNAs such as MSTRG.12818.1 and MSTRG.13824.1 play an important regulatory role in the growth phase, while lncRNAs such as MSTRG.15931.1 and MSTRG.22447.1 play an important regulatory role in the termination phase [
15]. Yin et al. found that lncRNA-599554 contributes to the induction of DPCs in cashmere goats, which may be achieved by promoting the expression of Wnt3a via the sponging of chi miR-15b-5p [
16]. However, most of the identified lncRNAs in the current lncRNA database are from humans and mice [
17].
In this study, the skin tissues of growing Super Merino sheep and Small-Tailed Han sheep were observed via histomorphology and high-throughput sequencing. Differentially expressed lncRNA and mRNA were identified while observing the histomorphology, and an enrichment analysis and sequencing data verification were conducted. These results may provide a theoretical basis for the role of lncRNA and mRNA in the growth and development of SM and STH hair follicles and the regulation of the wool fiber diameter.
2. Materials and Methods
2.1. Sample Collection and Ethical Statement
The skin samples of Super Merino and Small-Tailed Han sheep used in the experiment were collected from the Animal Husbandry Branch of the Jilin Academy of Agricultural Sciences. During the hair growth period in June, 6 healthy 1-year-old Small-Tailed Han sheep and 6 Small-Tailed Han sheep were selected, and two pieces of skin tissue of approximately 1cm2 from the upper shoulder were collected via surgical operation; one of these pieces was placed in paraformaldehyde for fixing, and the other piece was quickly frozen in liquid nitrogen and stored at -80 °C. The metal surgical instruments used were high-temperature sterilized and treated with 0.1% DEPC water. This research scheme was approved by the Experimental Animal Welfare Ethics Committee of Yanbian University (YD20220608002, 8 June 2022).
2.2. Histomorphological Study
The fixed skin tissue was dehydrated, embedded laterally and longitudinally, sliced after drying, stained with hematoxylin–eosin, and then observed and preserved under the Biological Microscope BX53 (OLYMPUS, Tokyo, Japan).
2.3. RNA Isolation, Library Preparation, and Sequencing
The frozen tissue was ground, Trizol reagent (Sangon Biotech, Shanghai, China) was used to extract the total RNA from the skin tissue, and the concentration of the extracted nucleic acid was detected with a Nanodrop2000 (Thermo Fisher Scientific, Waltham, MA, USA). The integrity was tested using an Agilent 2100 (Agilent Technologies, Santa Clara, CA, USA). The VAHTSTM Small RNA Library Prep Kit for Illumina (Illumina, San Diego, CA USA) was used to construct the library, and the Qsep-400 method was used for the quality inspection of the library. Sequencing By Synthesis (SBS) technology, the Illumina HiSeq high-throughput sequencing platform for sequencing the cDNA library, the sequence alignment of clean data with the specified reference genome (Ovis_aries.GCF_016772045.1_ARS_UI_Ramb_v2.0.genome.fa) was used to obtain mapped data.
2.4. LncRNA Identification and Target Gene Prediction
The prediction of new lncRNA consists of two parts: basic screening and potential coding ability screening. The basic screening consists of selecting transcripts whose class_code is “i”, “x”, “u”, “o” or “e” [
18]. Transcripts with length ≥200 bp and number of exons ≥ 2 were selected. Three parts of the transcript with FPKM ≥ 0.1 [
19] were selected. Since lncRNA does not encode proteins, whether the transcript is lncRNA can be determined by screening its coding potential to determine whether it has coding potential. The prediction of target genes is based on the mode of action of lncRNA and its target genes, and two prediction methods are used. The first prediction method is based on the fact that lncRNA regulates the expression of its neighboring genes and on the position relationship between the lncRNA and gene; the neighboring genes within 100 kb of lncRNA are its cis target genes. The second method involves predicting the lncRNA trans target genes by analyzing the correlation between the lncRNA and mRNA expression levels of the samples.
2.5. Expression Analysis
edgeR [
20] is suitable for differential expression analysis between samples (groups) and can be used for differential analysis with or without biological duplication. StringTie (1.3.1) [
21] was used to calculate the FPKMs of both lncRNAs and coding genes in each sample . Gene FPKMs were computed by summing the FPKMs of transcripts in each gene group. FPKM is defined as fragments per kilo-base of exon per million fragments mapped, calculated based on the length of the fragments and read counts mapped to this fragment. In the detection process of differentially expressed lncRNA and mRNA, a fold change ≥ 2 and FDR < 0.01 were used as screening criteria. The fold change refers to the ratio of expression between two samples (groups). In this study, genes with a high expression in SM were up-regulated genes, while genes with a high expression in STH were down-regulated genes.
2.6. Gene Ontology (GO) and Kyoto Encyclopedia of Genes and Genomes (KEGG) Enrichment Analyses
ClusterProfiler [
22] was used to conduct an enrichment analysis of the biological processes, molecular functions, and cell components of the cis–trans target genes and mRNA that were differentially expressed among samples.
The KEGG [
23] (Kyoto Encyclopedia of Genes and Genomes) database helps researchers to input genes and express information in a whole network. As the main public database on pathways (Kanehisa, 2008), it not only provides all possible metabolic pathways, but also provides a comprehensive annotation of the enzymes that catalyze each step of the reaction. It is therefore a powerful tool for metabolic analysis and metabolic network research in organisms.
2.7. Network Construction of LncRNA–mRNA
Based on the differential expression analysis of lncRNA and mRNA, Cytoscape [
24] was used to construct the regulatory relationship network diagram of the lncRNA–mRNA for differentially expressed lncRNA and differentially expressed cis–trans target genes.
2.8. qRT-PCR Verification
Nine DE lncRNAs and five DE mRNAs were selected, and GAPDH was selected as the steward gene [
25]. The Total RNA Extractor (Trizol, Shanghai, China) was used to extract the total RNA from samples. The LnRcute LncRNA First-Strand cDNA Kit (Beijing, China) was used to reverse-transcribe the total RNA into cDNA for real-time quantitative Polymerase Chain Reaction (qRT-PCR). Then, the LnRcute LncRNA qPCR Kit was used for RT-qPCR., A 20 µL system was selected, which included 12 µL of mix, and the positive and negative primers were 0.5 µL each. Then, 4 µL of cDNA and 3 µL of RNase-free ddH2O were used, and the reaction procedures were set at 95 °C for a one-time 3 min cycle, 95 °C for 5 s, 60 °C for 10 s, and 72 °C for a 15 s cycle 40 times. Melt curve analysis was performed at the end of the PCR cycle to determine the specificity of the intended primers. The primer sequences are shown in (
Table 1).
3. Results
3.1. Characterization of Sheep Wool and Follicle Traits
The results (
Table 2) showed that the skin thickness and the primary hair follicle and secondary hair follicle papilla diameter of Small-Tailed Han sheep were significantly higher than those of Super Merino sheep (
p < 0.01), while the hair follicle density and S/P value of Super Merino sheep were significantly higher than those of Small-Tailed Han sheep (
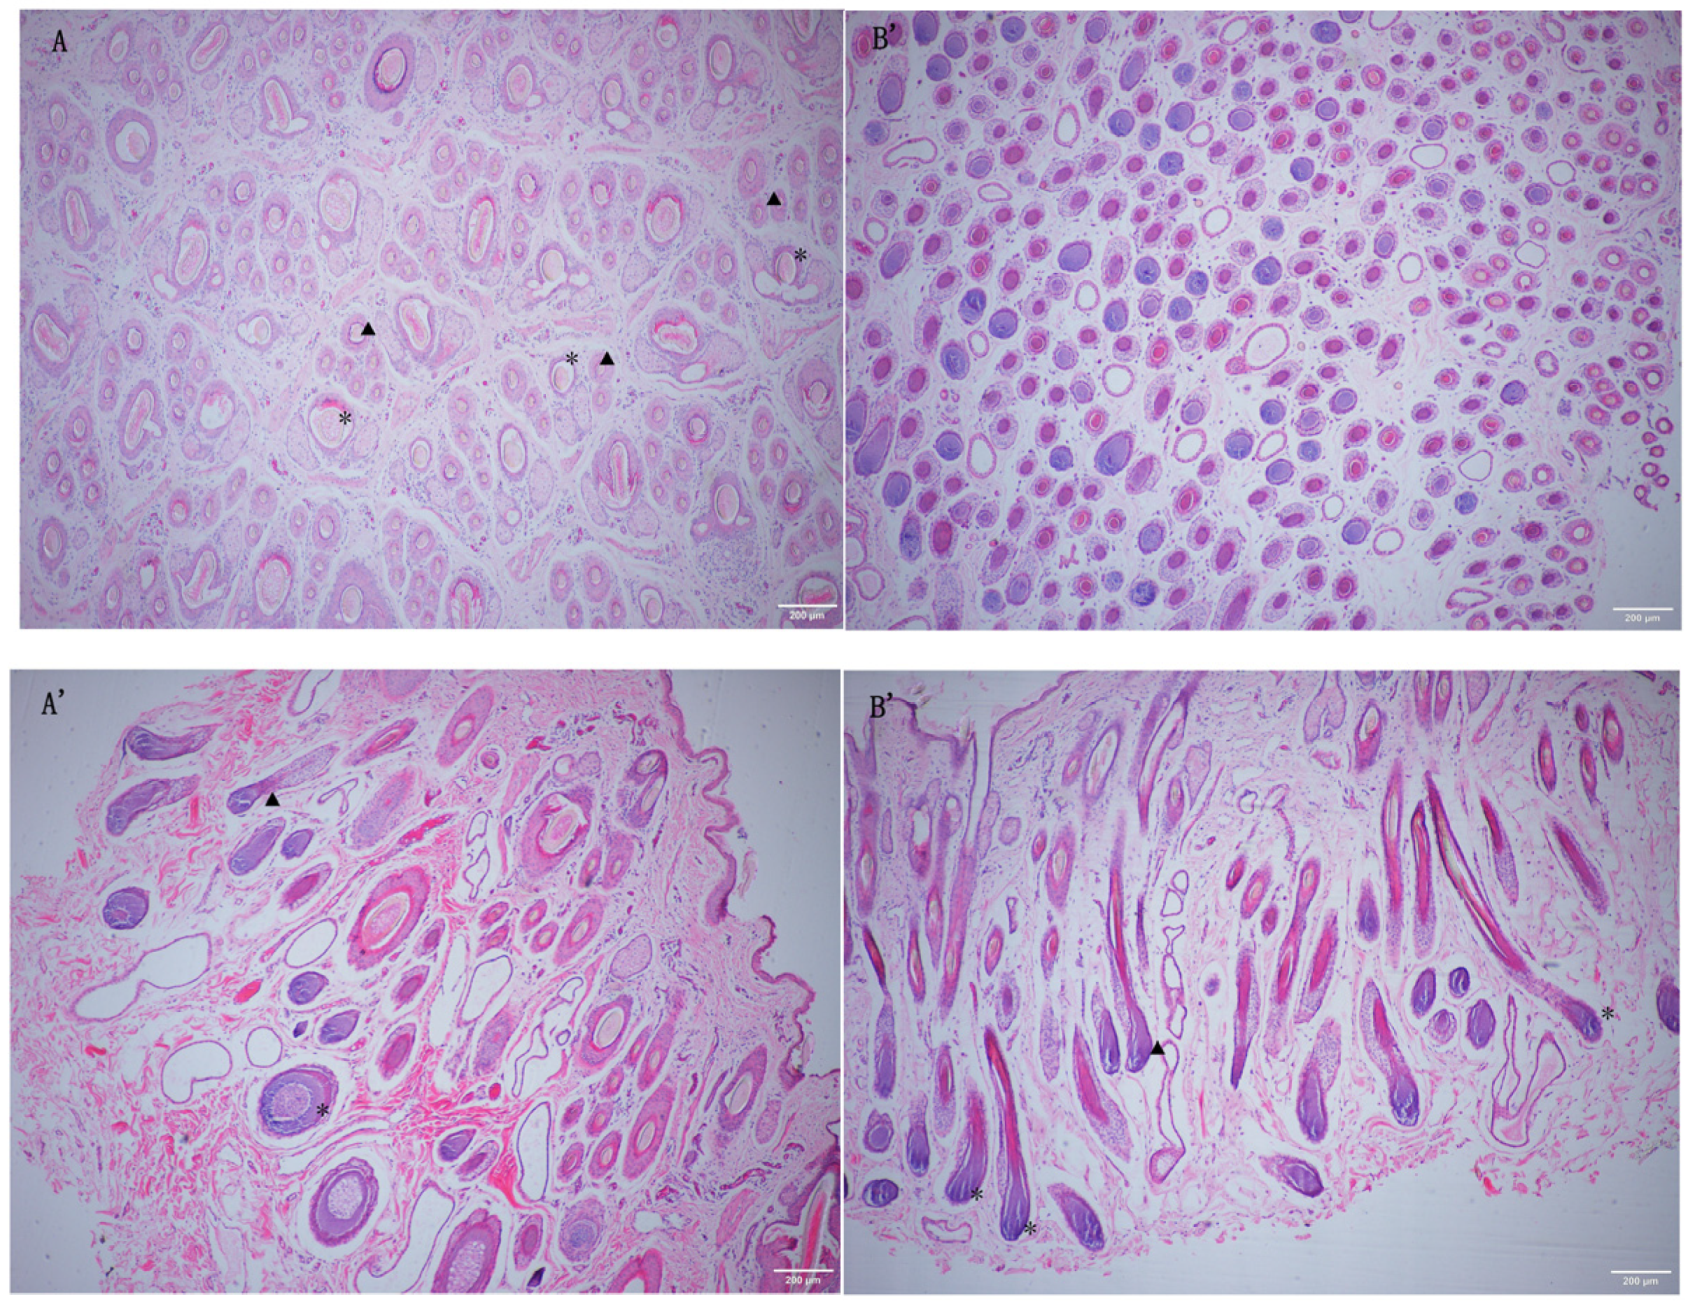
p < 0.01). The above statistical results were verified macroscopically using skin tissue sections (
Figure 1).
3.2. Sequencing Data Quality Control
The sequencing of the 12 samples was completed, and 221 Gb of clean long non-coding RNA data were analyzed. The clean data per sample reached 17.07 Gb, and the percentage of Q30 base was 93.62% or higher. Sequence alignment between the clean reads of each sample and the specified reference genome was performed, with efficiency ranging from 94.05% to 96.58% (
Table 3). The results indicated that the sequencing data were of high quality and could be used in the subsequent analysis.
3.3. Identification and Expression Analysis of lncRNA and mRNA
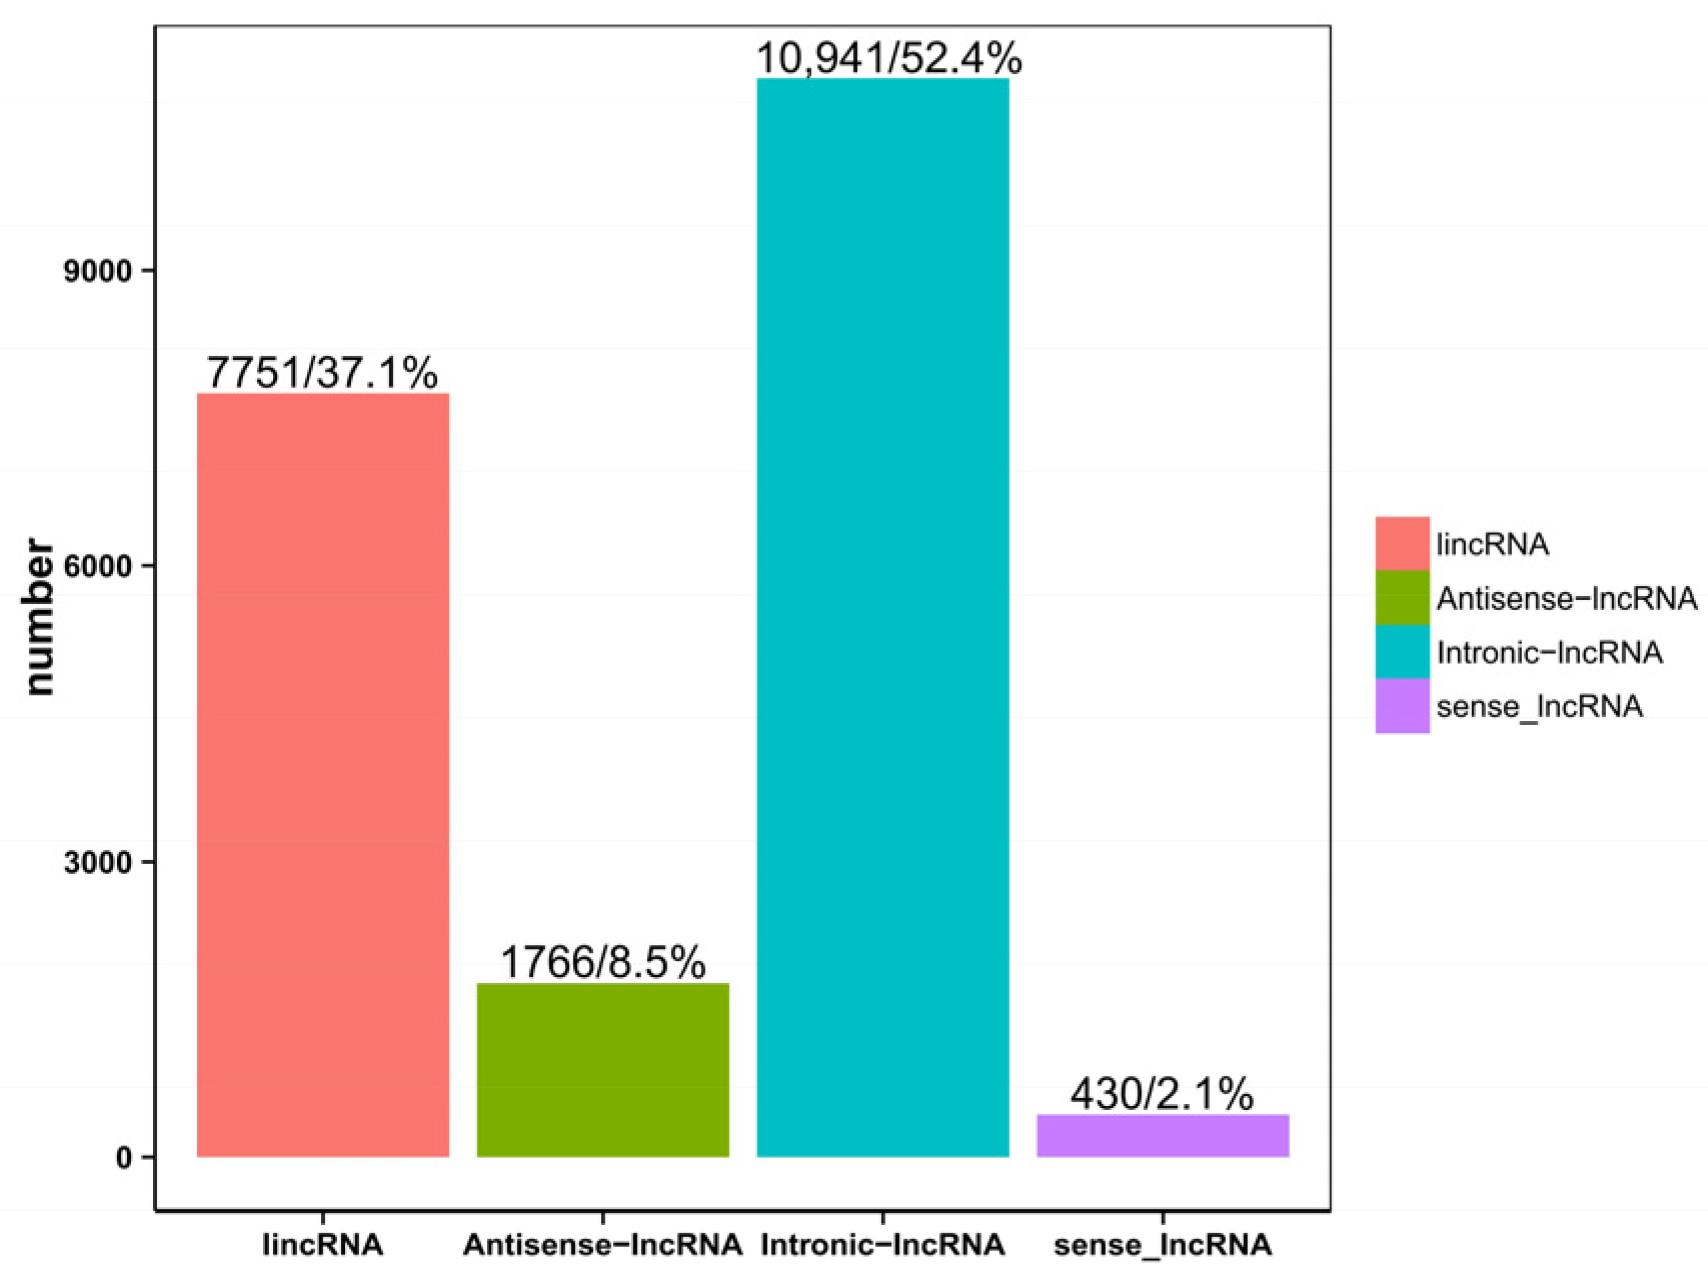
The classification results of the four lncRNAs predicted via CPC, CNCI, CPAT, and Pfam are shown in (
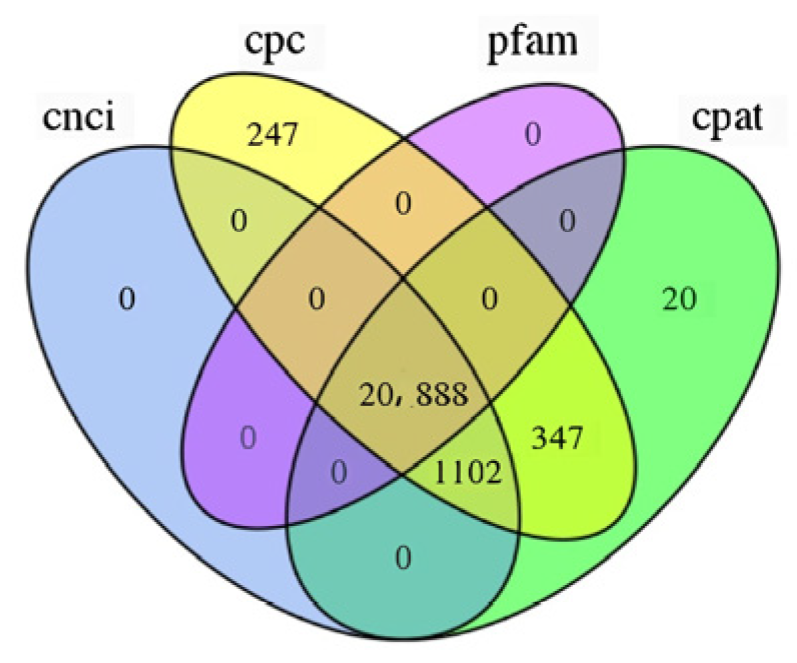
Figure 2). In order to display the analysis results intuitively, the non-coding transcripts authenticated using the above four analysis software packages were statistically analyzed, and a Venn diagram was drawn (
Figure 3). At the same time, through the intersection of the above four analysis results, a total of 20,888 lncRNAs were identified for subsequent lncRNA analysis. In addition, 31,579 mRNAs were identified, of which 10,323 were novel genes. Among the 20,888 lncRNAs, 56 lncRNAs were differentially expressed, of which 15 were up-regulated and 41 were down-regulated. Among the 31,578 mRNAs, 616 were differentially expressed, 210 were up-regulated, and 406 were down-regulated.
3.4. Comparative Analysis of lncRNA and mRNA Characteristics
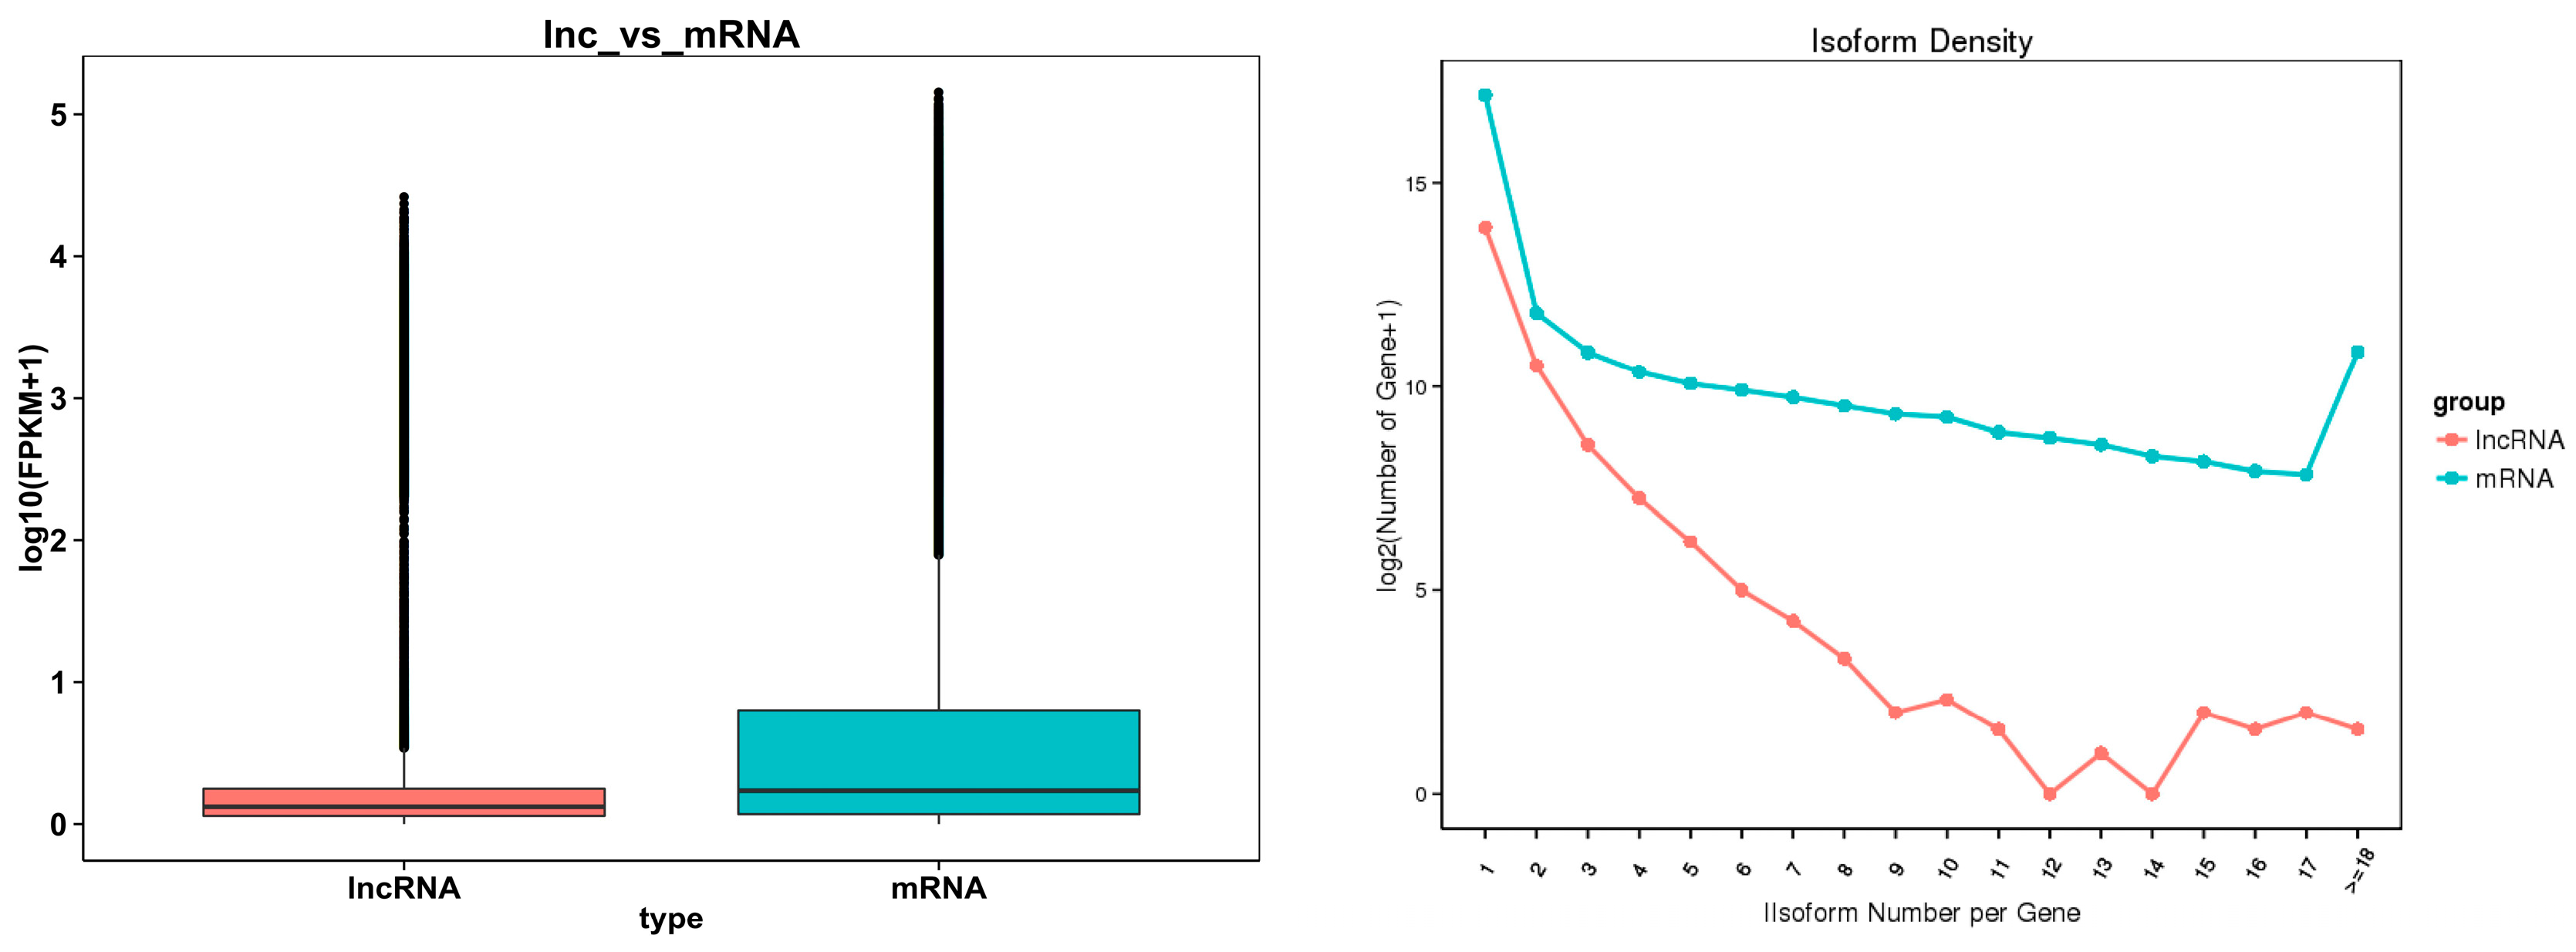
The box diagram comparing the expression levels of the lncRNA and mRNA (
Figure 4, left) revealed that the mRNA expression level was higher than the lncRNA expression level, and the comparison results regarding the number of variable shear isomers showed that the number of mRNAs with the same number of variable cut isomers was higher than the number of lncRNAs (
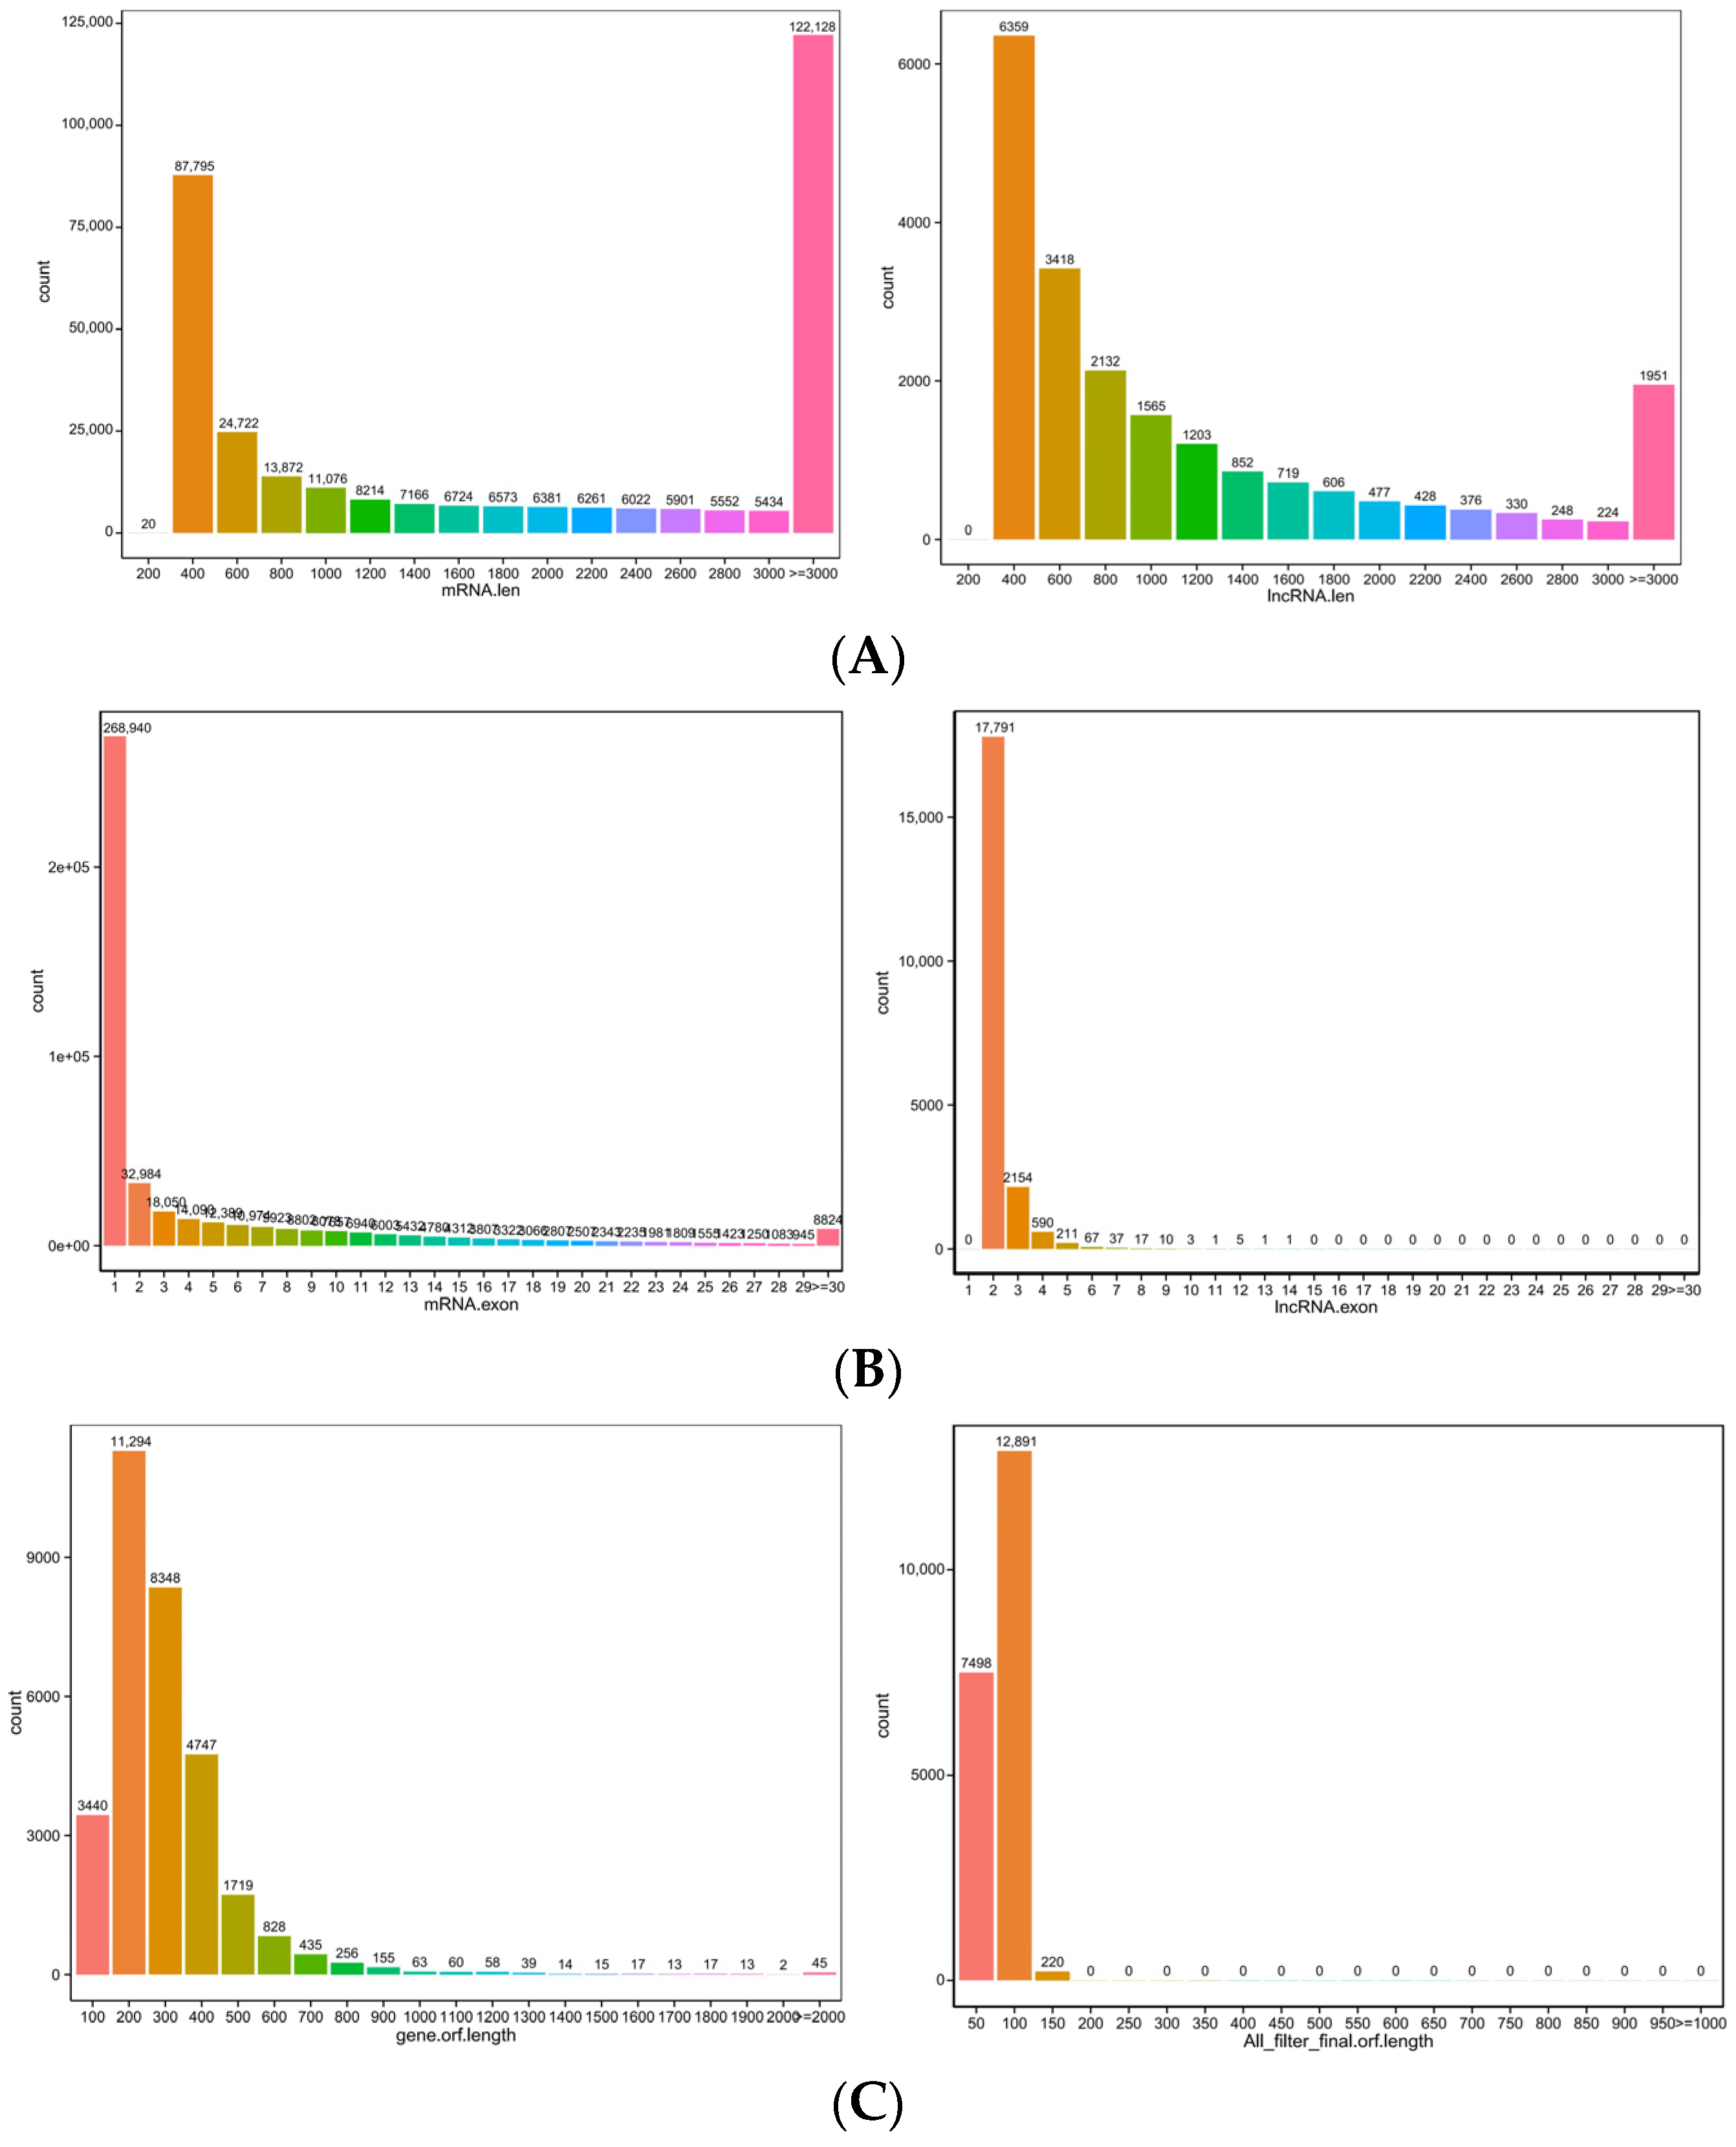
Figure 4, right). The comparison of the length, exon number, and ORF length of the lncRNA and mRNA (
Figure 5A–C) showed that the lncRNA had a shorter sequence length, fewer exons, and a shorter ORF length compared with the mRNA.
3.5. GO Analyses of DE mRNAs and Target Genes of DE lncRNAs
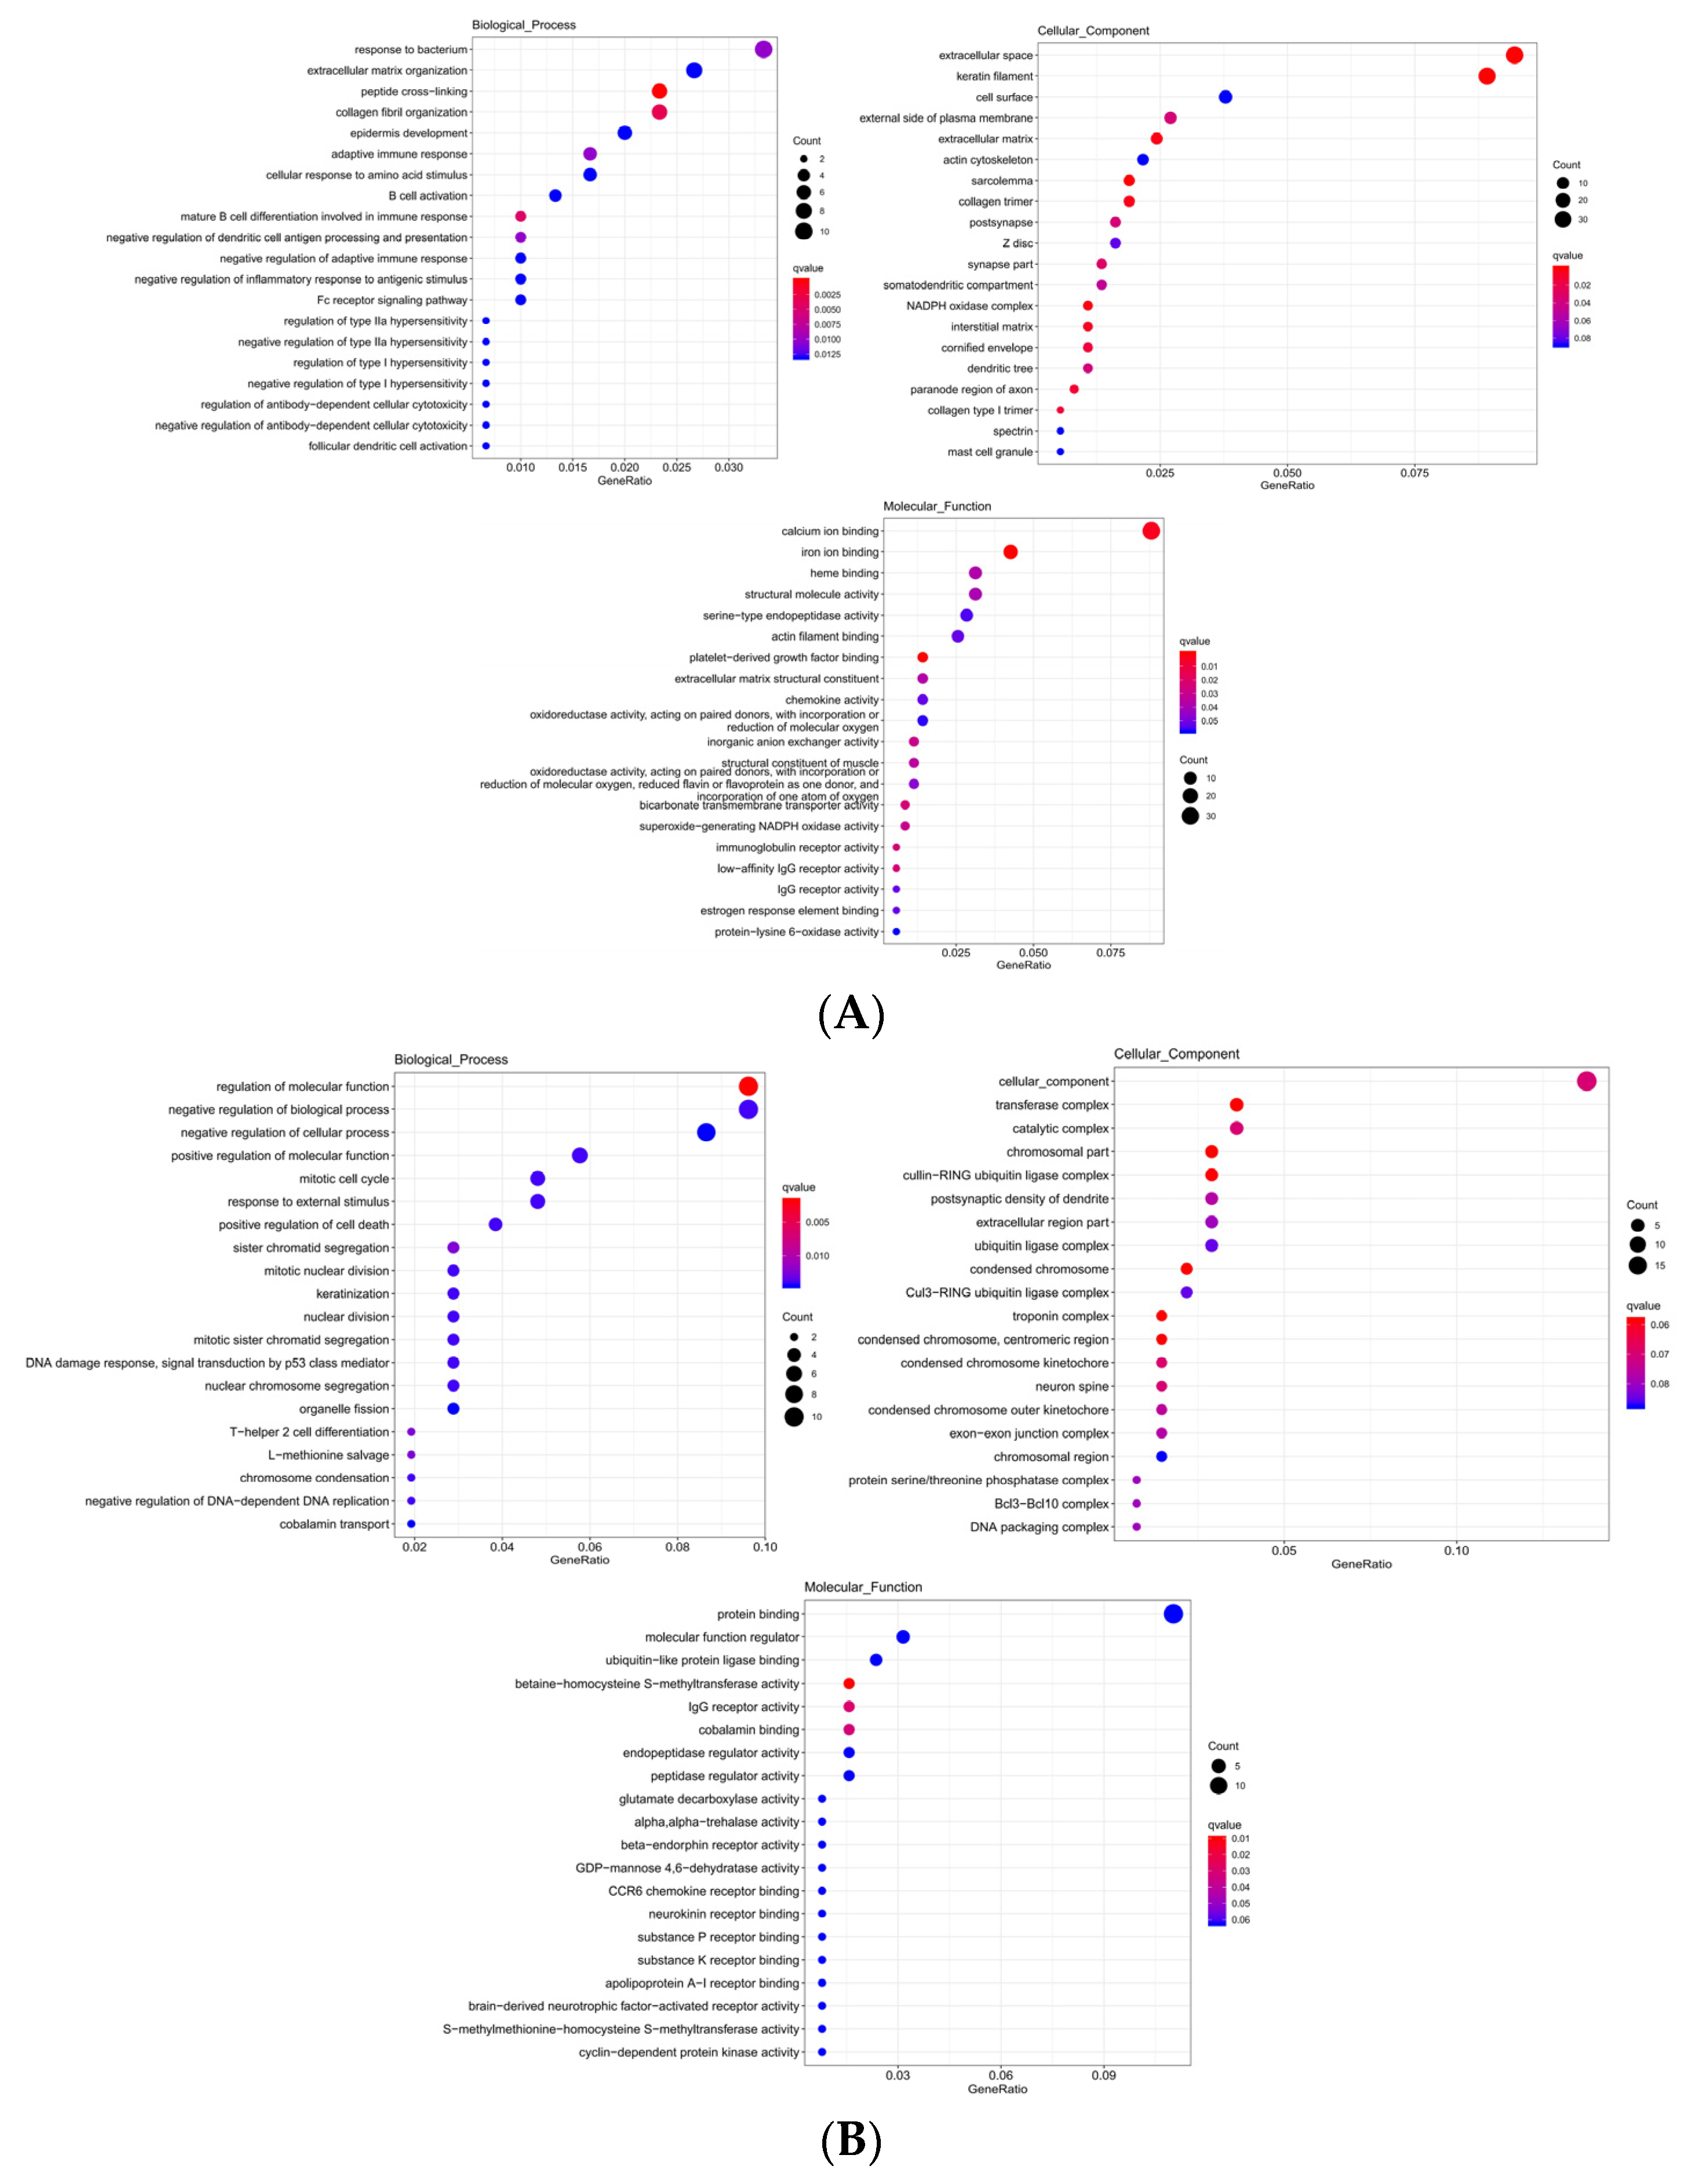
The significantly enriched GO term of DE mRNA was found to be correlated with epidermis development, skin development, and keratin filament, etc. (
Table 4). The top 20 significantly enriched terms were as seen in (
Figure 6A). The significant enrichment of cis target genes with DE lncRNA in the GO term was correlated with keratinization, epidermal cell differentiation, skin development, etc. (
Table 5). The top 20 significantly enriched terms were as seen in (
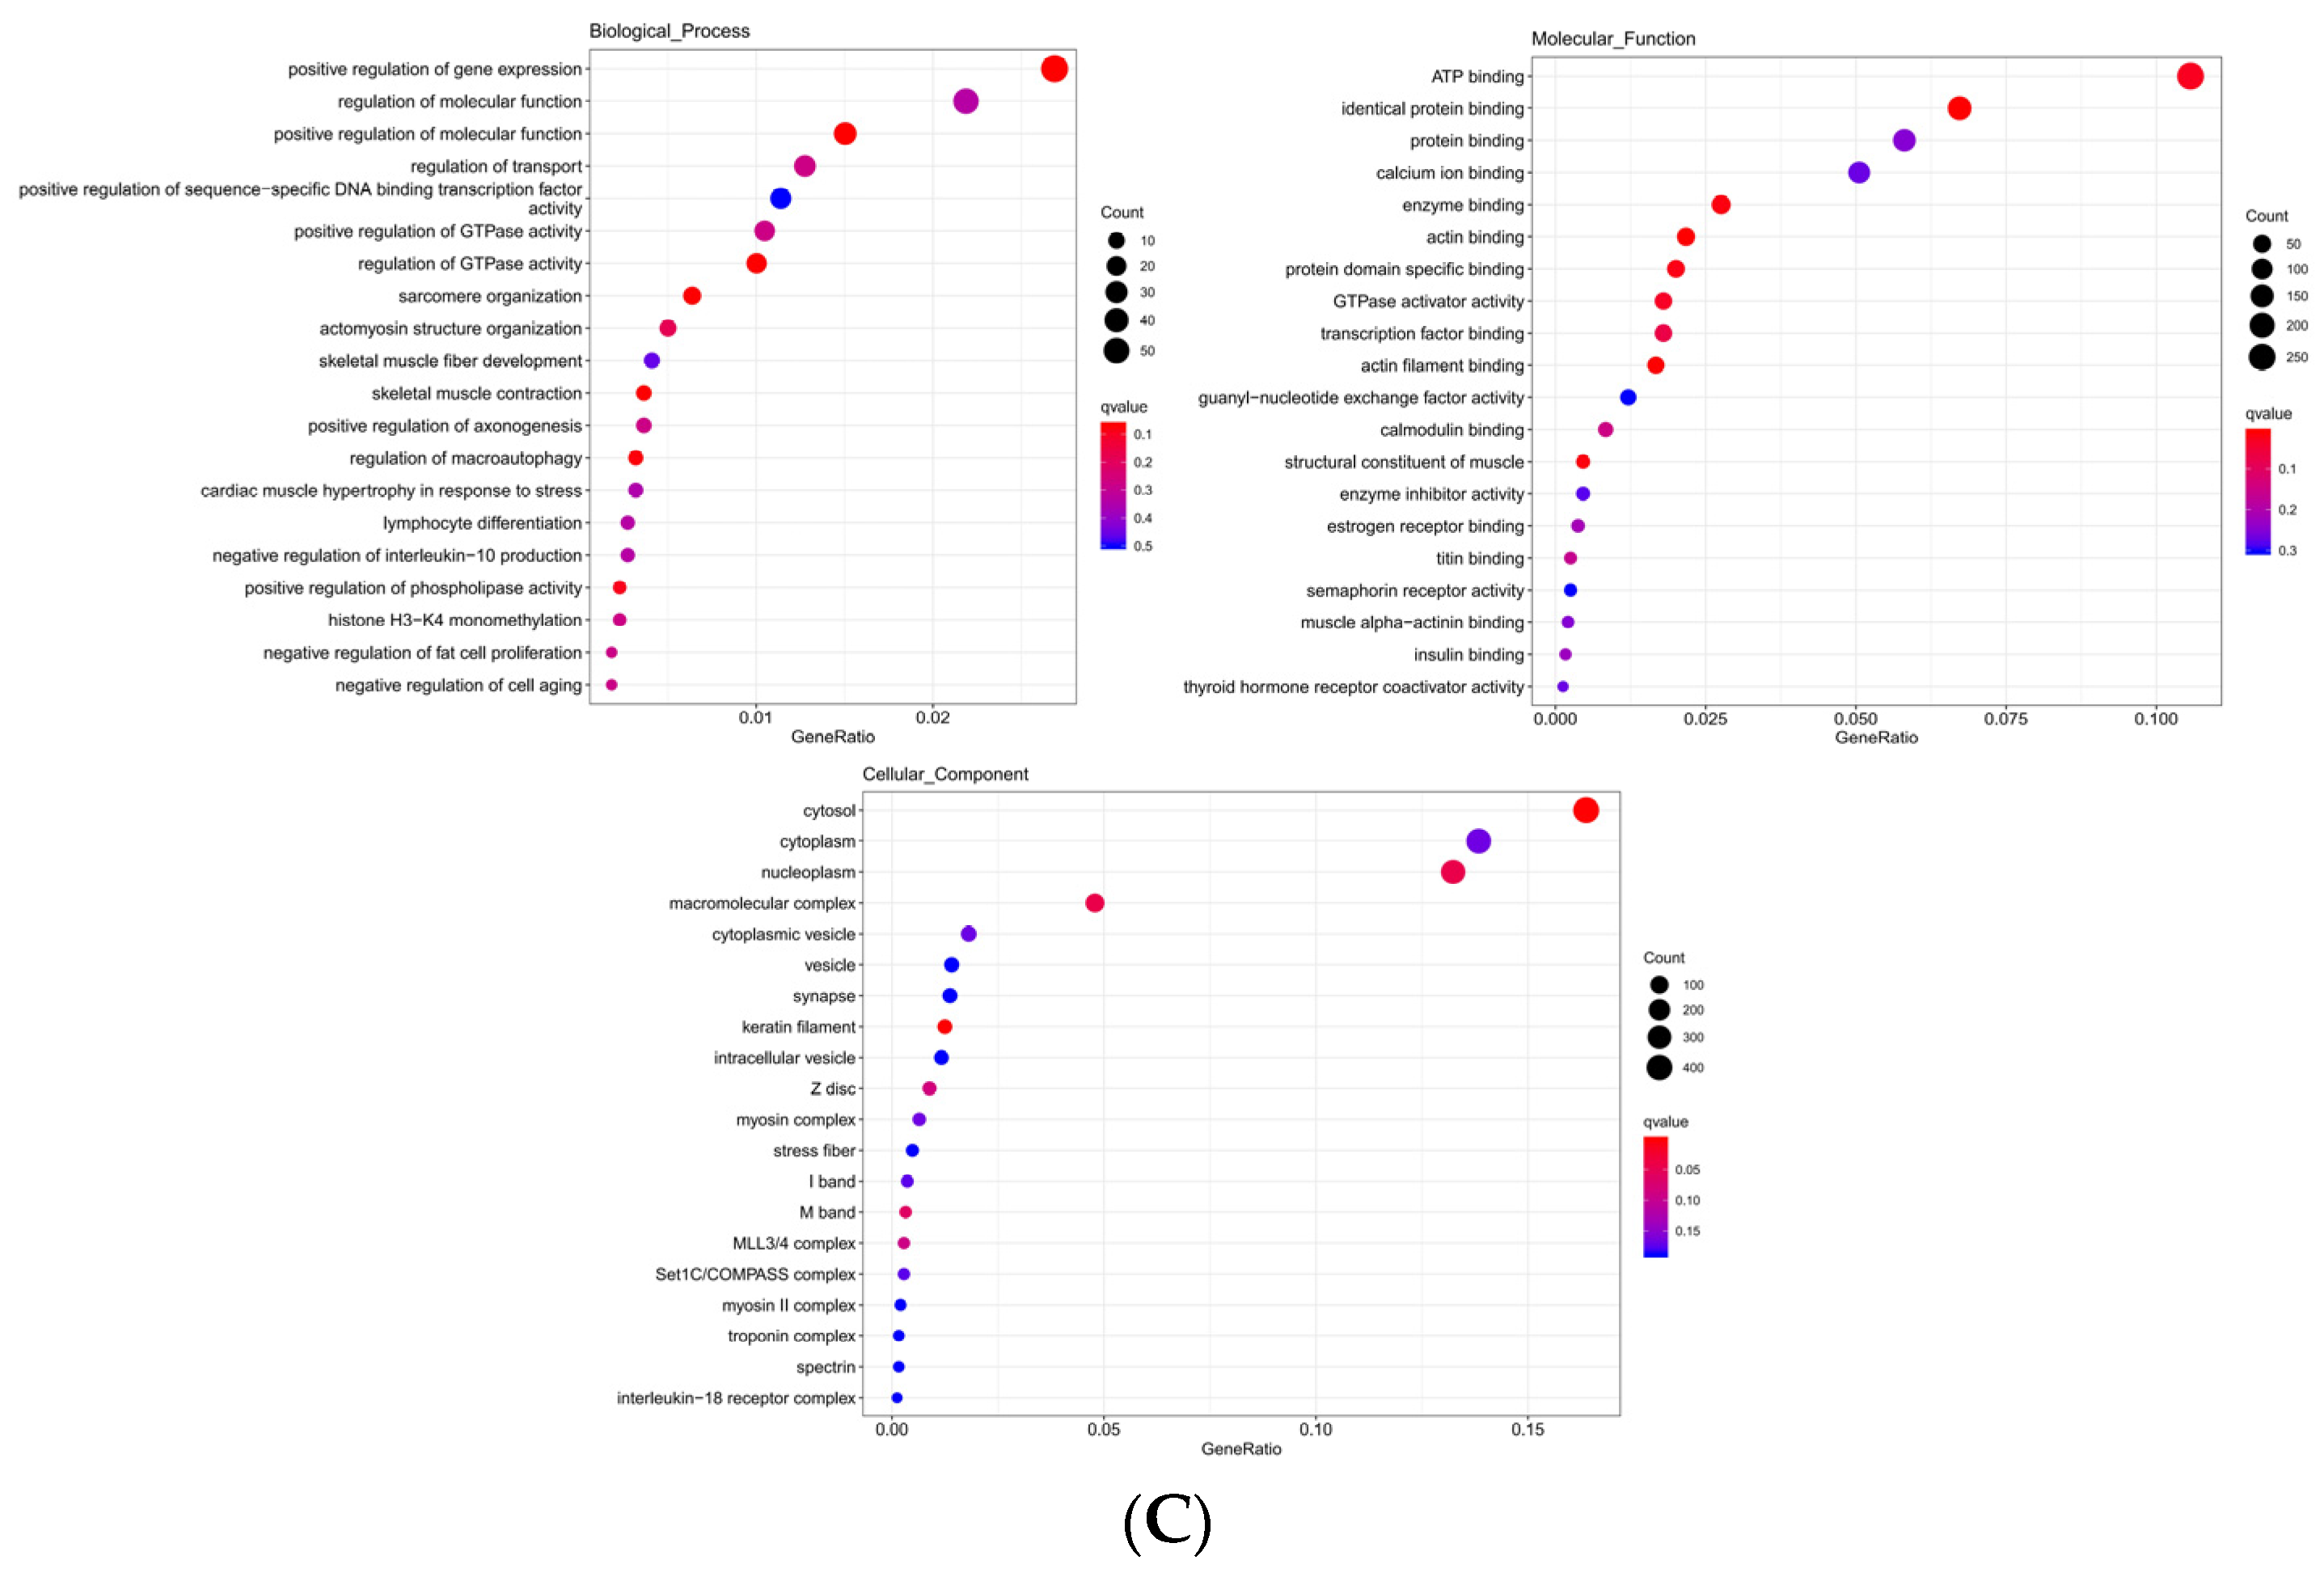
Figure 6B). The significant enrichment of trans target genes in the GO term was correlated with keratinocyte differentiation, epidermis development, skin epidermis development, etc. (
Table 6). The top 20 significantly enriched terms were as seen in (
Figure 6C). The target genes of DE lncRNA and DE mRNA overlapped in the analysis of the GO term; these included epidermis development, skin development, keratinocyte differentiation, keratinization, and keratin filament.
3.6. KEGG Analyses of DE mRNAs and Target Genes of DE lncRNAs
Differentially expressed mRNA was significantly enriched in the ECM–receptor interaction and PI3K-Akt signaling pathways (
p-value < 0.05) (
Table 7). Cis target genes with differentially expressed lncRNA were also significantly enriched in the ECM–receptor interaction and PI3K-Akt signaling pathways, as well as those with differentially expressed mRNA (
p-value < 0.05) (
Table 8). Trans target genes were significantly enriched in the Notch signaling pathway, MAPK signaling pathway, and Ras signaling pathway (
p-value < 0.05) (
Table 9). The top 20 signaling pathways of differentially expressed mRNA that were significantly enriched were as seen in
Figure 7A, and cis–trans target genes of lncRNA were significantly enriched as seen in
Figure 7B,C. It was found that the target genes of DE lncRNA and DE mRNA overlapped in the KEGG pathway analysis. This included, for example, the ECM-receptor and PI3K-Akt signaling pathways.
3.7. Regulatory Network
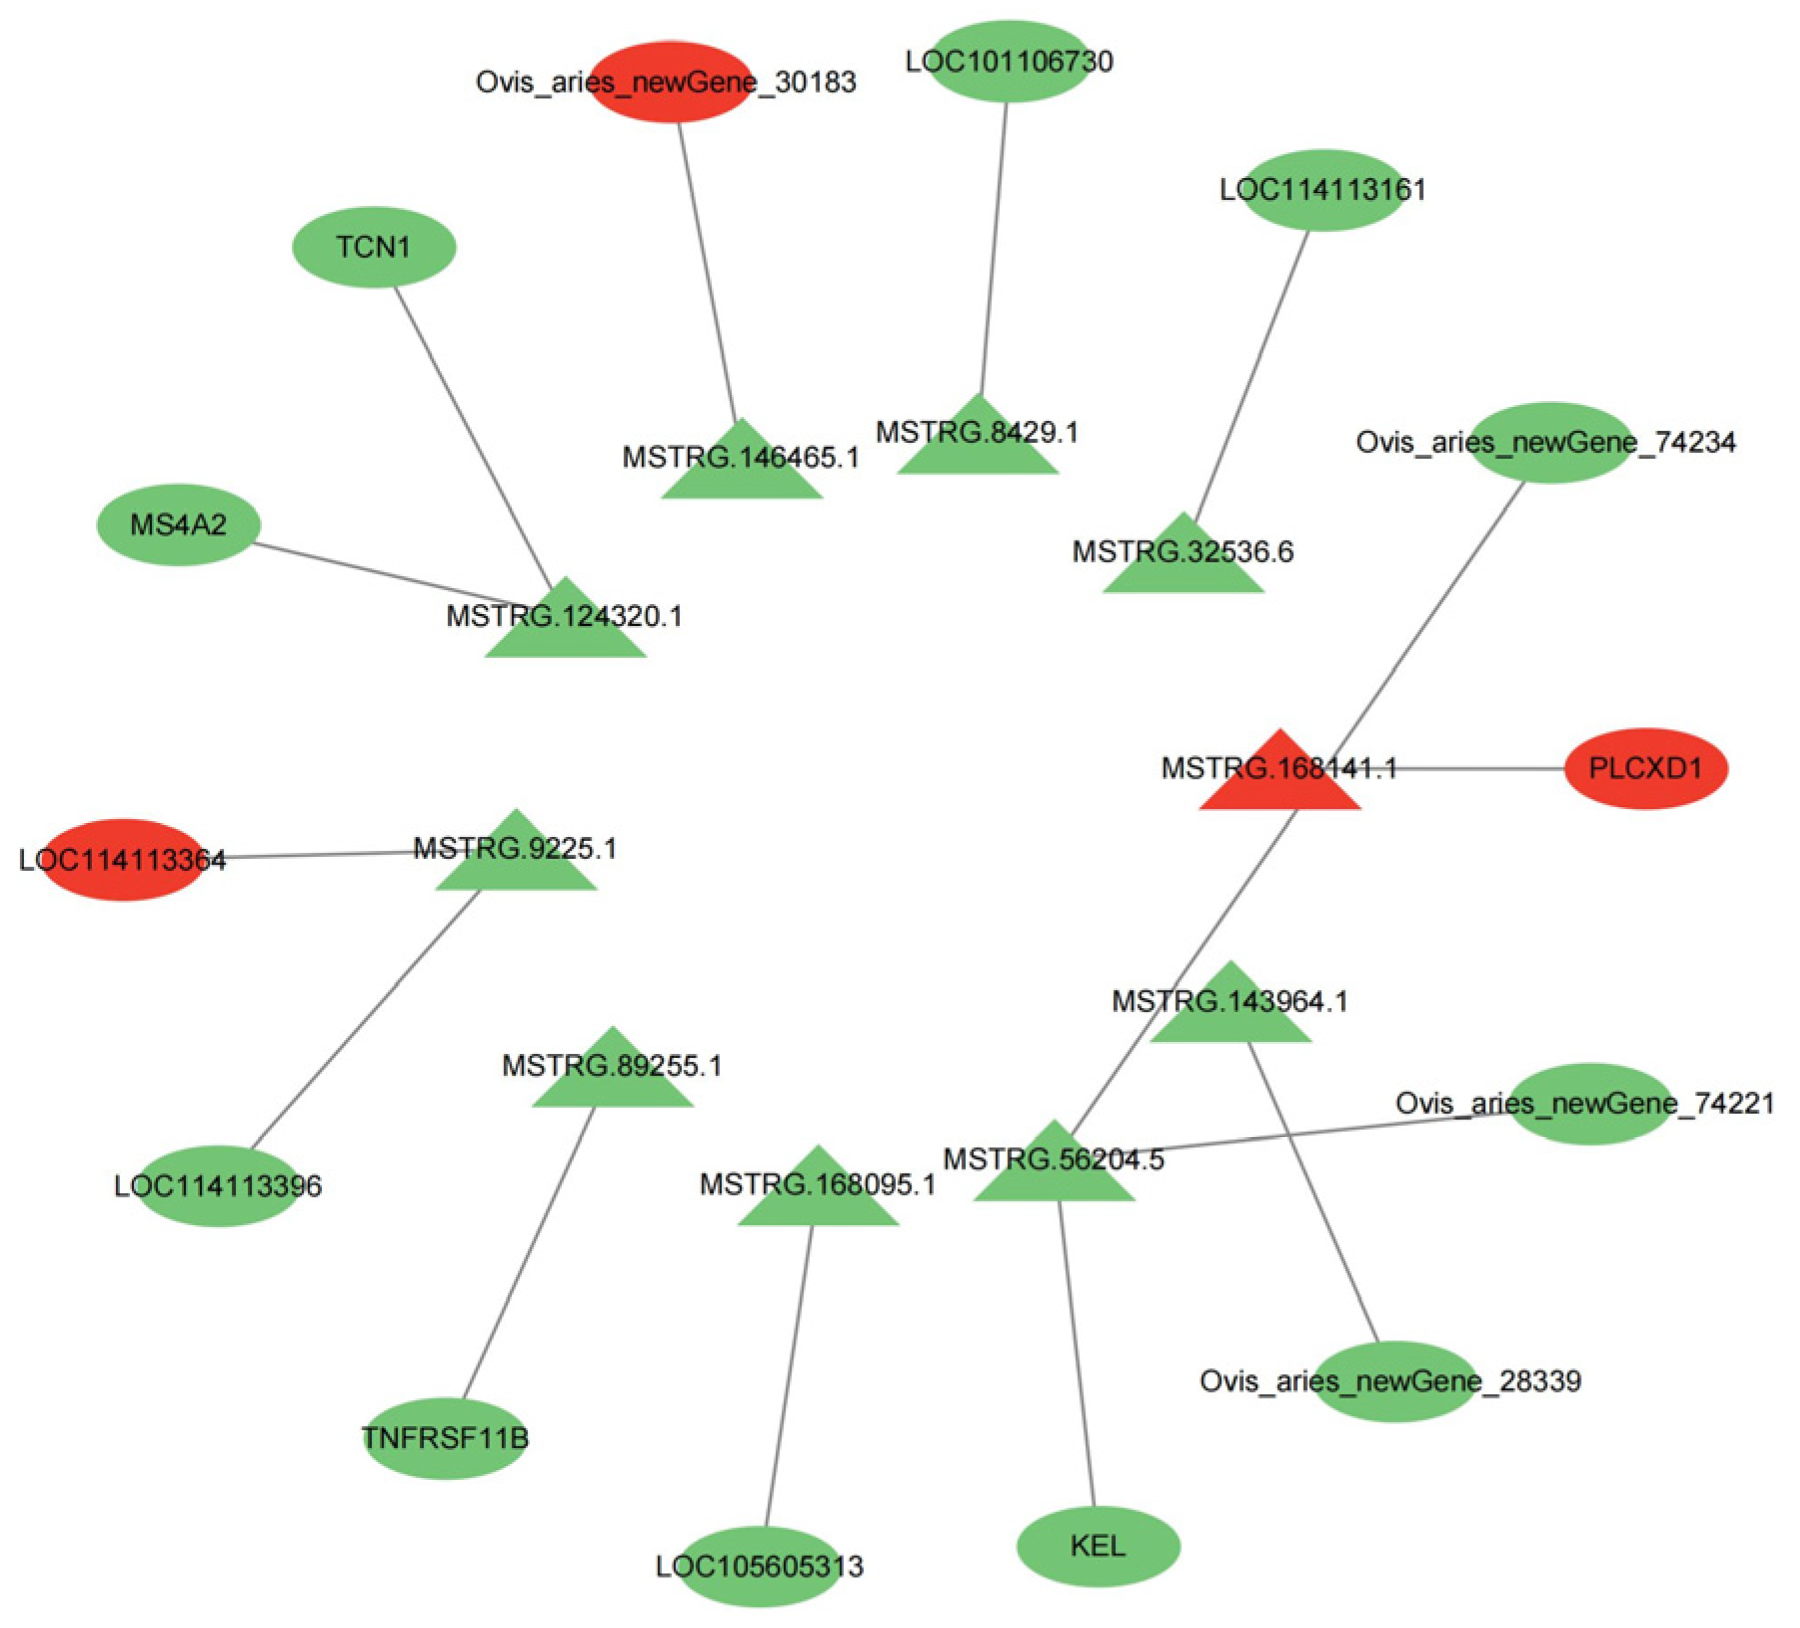
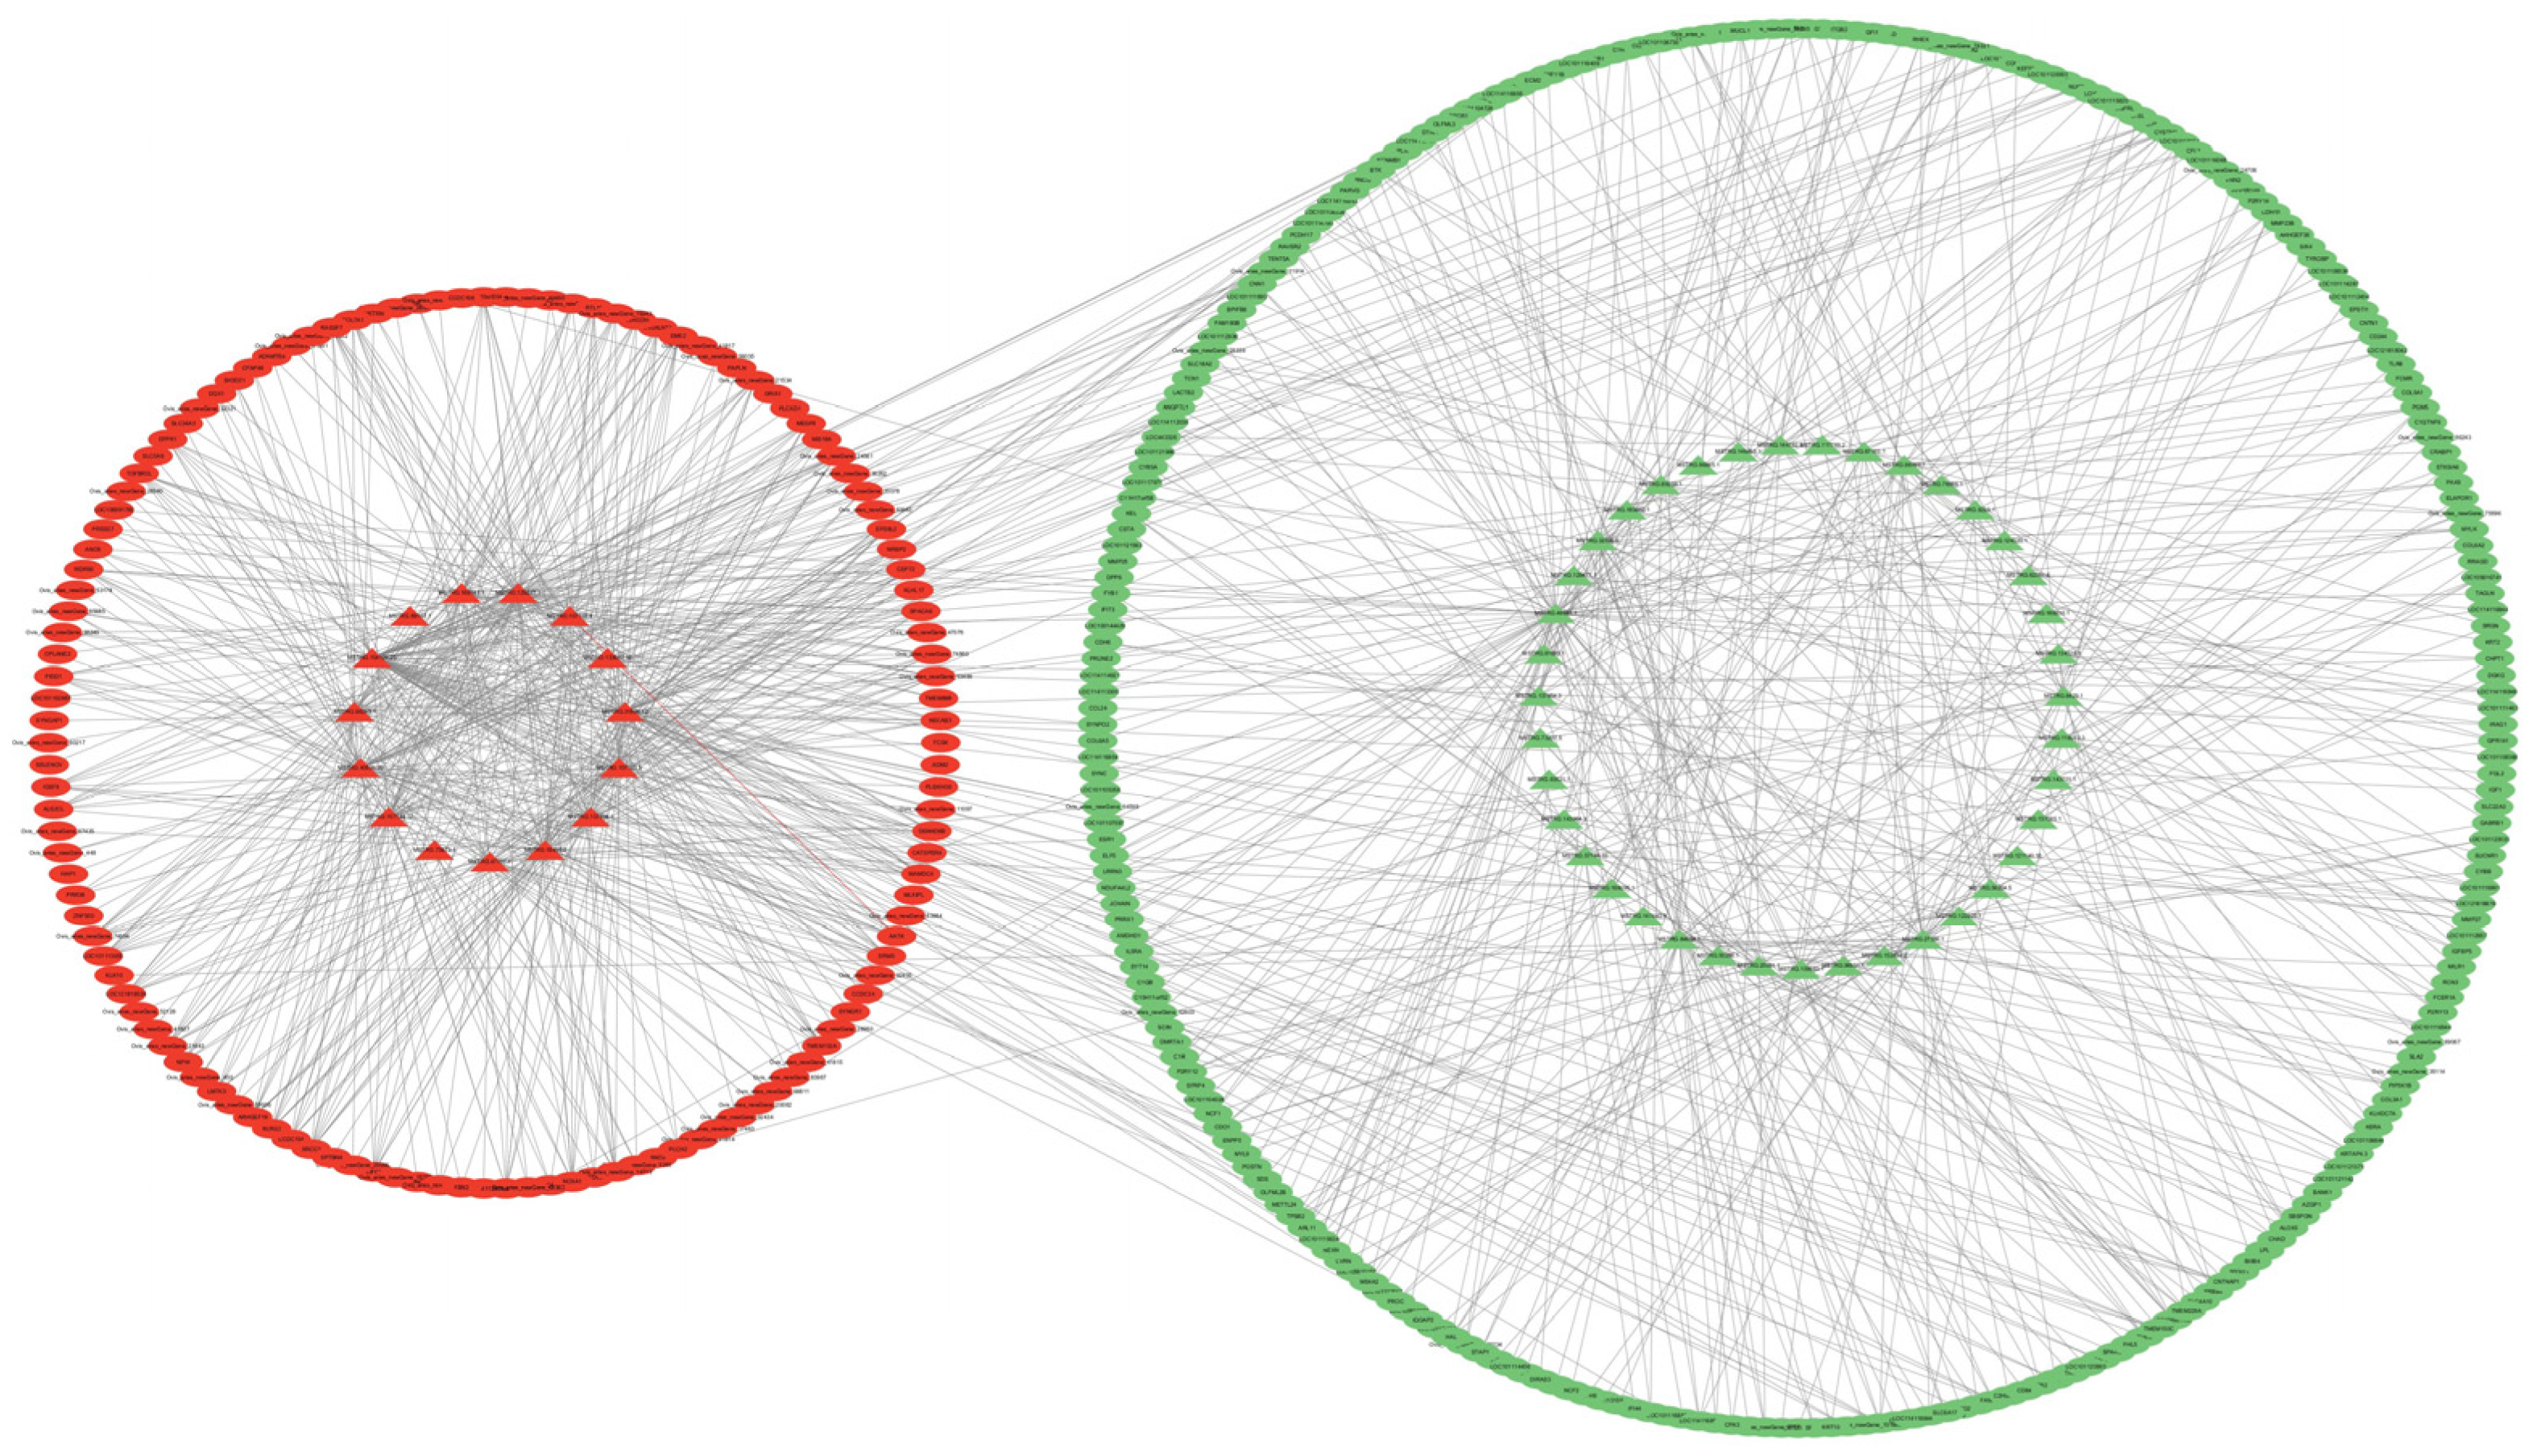
Among the 56 differentially expressed lncRNAs, 10 DE lncRNAs regulated 14 DE cis target genes, constituting a total of 14 lncRNA–mRNA pairs (
Figure 8). In total, 54 DE lncRNAs regulated 1027 DE trans target genes, which constituted 1027 lncRNA–mRNA pairs (
Figure 9).
3.8. Validation of RNA-Seq Data
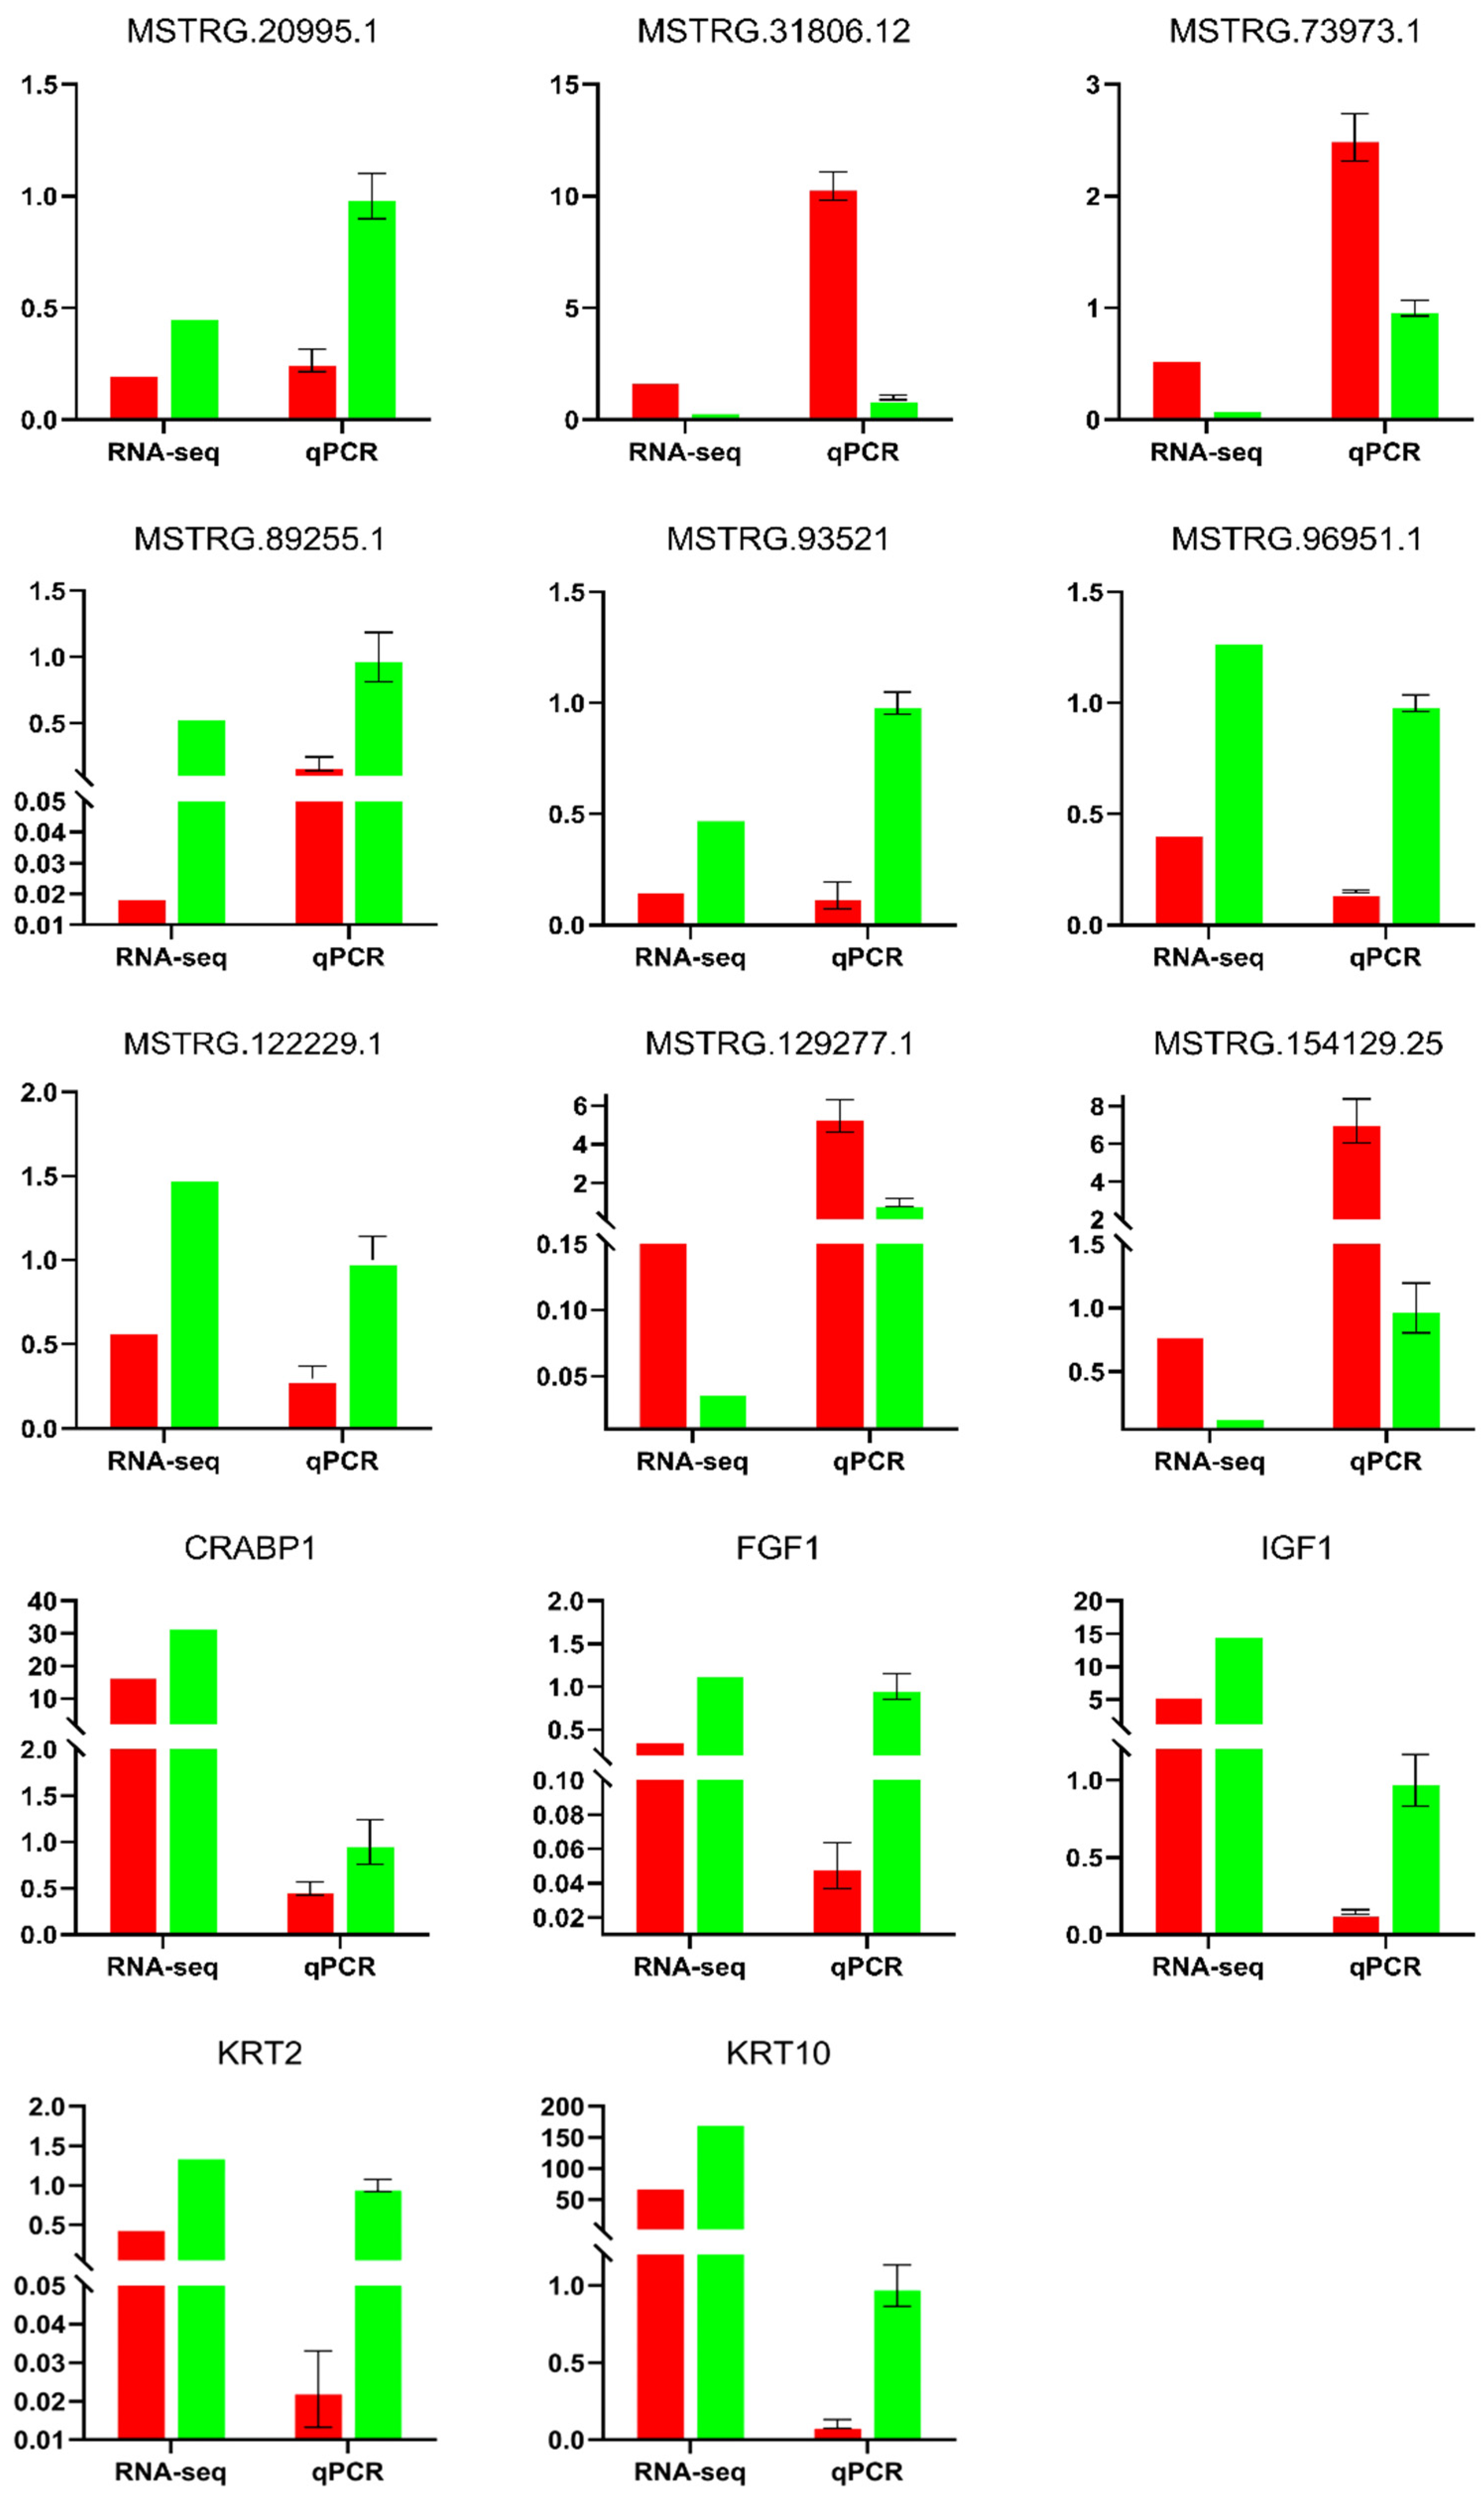
In order to verify the reliability of the RNA-seq results, nine DE lncRNAs and five DE mRNAs were selected, and their expression levels were verified via qRT-PCR (
Figure 10). The results showed that the trends observed in the expression of DE lncRNA and DE mRNA were consistent with the results of the RNA-seq, which showed the reliability of the RNA-seq data.
4. Discussion
In this study, the skin tissues of SM and STH were observed via histomorphology and high-throughput sequencing. There were significant differences between Super Merino sheep, which have a better hair quality and yield, and Small-Tailed Han sheep regarding their hair follicle traits; this suggests that there may be an inevitable relationship between hair follicle performance and wool traits. High-throughput sequencing further identified differentially expressed lncRNAs and mRNAs, and the results were combined with multiple structural characteristics to understand the lncRNA and mRNA data. The results showed that, consistent with previous studies, the expression level of lncRNA was lower than that of mRNA and was less evolutionarily conserved. LncRNA often contained fewer exons than protein-coding transcripts, and because there were fewer exons, the length was shorter than that of mRNA; in addition, the ORF of lncrNA was shorter than that of mRNA [
7,
26]. The expression trend of differentially expressed genes verified via qRT-PCR was consistent with that of RNA-seq.
Collins C. A et al. found that CRABP1 is expressed in embryonic dermis and in the stroma of skin tumors but confined to the hair follicle dermal papilla in normal postnatal skin [
27]. They also found that CRABP1 is dynamically expressed during skin development. This indicates that CRABP1 may be involved in the regulation of hair follicle growth and development or in the hair growth cycle. In this study, the expression levels of trans-targeting lncRNA MSTRG.98769.1 and CRABP1 in STH skin tissues were significantly higher than those in SM skin tissues. Therefore, it is speculated that the interaction between lncRNA MSTRG.98769.1 and CRABP1 may affect hair follicle growth, development, and fiber traits.
Studies have shown that hair follicle fibers are mainly composed of keratin (KRT) and keratin-associated protein (KRTAP) [
26,
28,
29]. Moreover, most differentially expressed KRT and KRTAP genes (KRT38, KRT4, KRTAP15-1, KRTAP13.1, and KRTAP3-1) are involved in the regulation of hair fibers, and their expressions are higher in the growth stage than in the middle development stage [
8]. In this study, LncRNA MSTRG.9225.1, MSTRG.124320.1, MSTRG.96951.1, MSTRG.91685.1, MSTRG.122229.1, MSTRG.89255.1, and their respective target genes were identified. LOC114113396 (KRTAP15-1), KRT10, KRTAP1-3, KRTAP4.3, and KRT2 were also found to be significantly higher in STH than in SM. Meanwhile, the cis target gene LOC114113396 (KRTAP15-1) of LncRNA MSTRG.9225.1 was significantly enriched during keratinization and epidermal cell differentiation, epithelium development, and skin development. The trans target gene KRT10 was significantly enriched in the GO keratin differentiation term. The trans target gene KRT2 of MSTRG.89255.1, the trans target gene KRTAP1-3 of LncRNA MSTRG.124320.1, and the trans target gene KRTAP4.3 of LncRNA MSTRG.96951.1, MSTRG.91685.1, and MSTRG.122229.1 were obviously enriched in the GO keratin filament term, which is closely related to HF growth and development and fiber traits [
3,
30]. Therefore, it is speculated that these lncRNAs interact with their respective target genes to participate in the regulation of hair follicle growth and development and fiber traits.
The FGF gene family is widely expressed in HF skin tissues and plays an important role in the proliferation, differentiation, and periodic growth of HF cells [
31]. Moreover, FGF1, FGF2, FGF5, FGF7, FGF10, FGF13, and FGF22 in hair follicle cells have been shown to regulate hair growth and development through hair follicles [
32,
33]. In their study, Kwack et al. indicated that many growth factors and intercellular signaling molecules in HFs, such as IGF-1, KGF, HGF, etc., are expressed and secreted by DPCs and are used in neighboring cells to control cell proliferation and differentiation, as well as hair shaft elongation [
34]. Some studies have also shown that IGF exists in the inner root sheath and medulla. It affects hair follicle cell proliferation and the hair growth cycle [
35]. Shi R et al. showed that KIT may affect the growth and density of wool [
36]. In this study, the expression levels of LncRNA MSTRG.98769.1 andMSTRG.84658.1 and the target genes FGF1, IGF1, and KIT in STH skin tissues were also significantly higher than those of SM. In the enrichment analysis of trans target genes, FGF1, IGF-1, and KIT were significantly enriched in the Ras signaling pathway and the MAPK signaling pathway, which are known to be related to hair follicle growth and development [
37,
38]. The MAPK signaling pathway regulates skin and hair follicle development, epidermal and keratinocyte differentiation, wool cycle growth, and wool fiber quality [
36,
39]. Meanwhile, in the enrichment analysis of differential mRNA, FGF1, IGF-1, and KIT were significantly enriched in the PI3K–Akt signaling pathway. The PI3K–Akt signaling pathway is crucial for maintaining and restoring hair induction in dermal papilla cells and for promoting the proliferation and inhibiting the apoptosis of dermal papilla cells [
5,
40]. Therefore, it is speculated that the interaction between lncRNAs and their respective target genes is involved in the regulation of hair follicle growth and development and fiber traits.
Zhao M et al. found that the variation in the KRTAP27-1 gene is related to the diameter of cashmere fiber [
41], and Zhao J et al. found that the variation in the KRTAP6-1 gene in goats affects the phenotype of fiber diameter and length [
42]. In this study, it was found that the expression of the LOC114113364 (KRTAP19-3L) gene in the skin tissue of SM was significantly higher than that in STH. Although it did not appear in the enrichment analysis, it belongs to the KRTAP family, and most of the differentially expressed KRT and KRTAP genes are involved in the regulation of hair fibers. It is speculated that LncRNAs MSTRG.9225.1 and LOC114113364 (KRTAP19-3L) may interact with each other and participate in the regulation of hair follicle growth and development and fiber traits. In addition, LOC101116570 (SPINK6) intersected in the functional enrichment analysis of cis–trans target genes. For example, for keratinocyte differentiation, epidermis development, and skin development, LOC114113396 (KRTAP15-1) and KRT10 appear in the same GO term. In addition, The National Center for Biotechnology Information (NCBI) found that its expression level in the skin was second only to that found in the testis. Therefore, it is speculated that LOC101116570 (SPINK6) may be involved in hair follicle growth and development as well as in the regulation of wool fiber fineness.
5. Conclusions
In conclusion, there were significant differences in the expression levels of LOC114113396 (KRTAP15-1), CRABP1, KRT10, KRTAP1-3, KRTAP4.3, KRT2, FGF1, IGF-1, and KIT in the two sheep skin tissues. These proteins are mainly concentrated in the biological processes and pathways related to hair follicle growth and development and hair fiber traits, suggesting that these proteins may play an important role in hair follicle growth and development. It was found that LncRNA MSTRG.9225.1, MSTRG.124320.1, MSTRG.96951.1, MSTRG.91685.1, MSTRG.122229.1, MSTRG.89255.1, MSTRG.98769.1, and MSTRG.84658.1 may cis- or trans-regulate the expression of their respective target genes LOC114113396 (KRTAP15-1), CRABP1, KRT10, KRTAP1-3, KRTAP4.3, KRT2, FGF1, IGF-1, and KIT and may indirectly participate in the growth and development of hair follicles and the regulation of hair fiber fineness. This study may provide a theoretical basis for the growth and development of sheep hair follicles and the molecular mechanism of wool fiber traits.
Author Contributions
F.S. and L.Z. developed the methodology; W.L and C.Z. collected the samples; Z.Z. and D.Z. carried out project administration; J.F. and X.Z. curated the data; D.W. and X.Z. provided the software; L.Z. and F.S supervised the project; J.F. and A.H. carried out visual processing; J.F. and D.W. validated the data; J.F. and A.H. wrote the original draft; and F.S. reviewed and edited the article. All authors have read and agreed to the published version of the manuscript.
Funding
This research was supported by the Science and Technology Research Project of the Education Department of Jilin Province (JJKH20220543KJ) and the National Natural Science Foundation of China (32060781).
Institutional Review Board Statement
All tests involving animals in this study were carried out in accordance with the Yanbian University Experimental Animal Welfare Ethics Committee Guidelines (YD20220608002), Jilin, China.
Informed Consent Statement
Not applicable.
Data Availability Statement
The data presented in this study are available upon request from the corresponding author.
Acknowledgments
We would like to thank the Jilin Academy of Agricultural Sciences and Yanbian University for their support of this study.
Conflicts of Interest
The authors declare no conflicts of interest.
References
- Ma S, Long L, Huang X, Tian K, Tian Y, Wu C, Zhao Z. Transcriptome analysis reveals genes associated with wool fineness in merinos. PeerJ. 2023 May 23;11:e15327. [CrossRef]
- Schneider MR, Schmidt-Ullrich R, Paus R. The hair follicle as a dynamic miniorgan. Curr Biol. 2009 Feb 10;19(3):R132-42. [CrossRef]
- Zhao R, Li J, Liu N, Li H, Liu L, Yang F, Li L, Wang Y, He J. Transcriptomic Analysis Reveals the Involvement of lncRNA-miRNA-mRNA Networks in Hair Follicle Induction in Aohan Fine Wool Sheep Skin. Front Genet. 2020 Jun 9;11:590. [CrossRef]
- Hardy, MH. The secret life of the hair follicle. Trends Genet. 1992 Feb;8(2):55-61. [CrossRef]
- Ma R, Shang F, Rong Y, Pan J, Wang M, Niu S, Qi Y, Li Y, Lv Q, Wang Z, Wang R, Su R, Liu Z, Zhao Y, Wang Z, Li J, Zhang Y. Expression profile of long non-coding RNA in inner Mongolian cashmere goat with putative roles in hair follicles development. Front Vet Sci. 2022 Sep 2;9:995604. [CrossRef]
- Statello L, Guo CJ, Chen LL, Huarte M. Gene regulation by long non-coding RNAs and its biological functions. Nat Rev Mol Cell Biol. 2021 Feb;22(2):96-118. Erratum in: Nat Rev Mol Cell Biol. 2021 Jan 8. [CrossRef]
- Wang S, Ge W, Luo Z, Guo Y, Jiao B, Qu L, Zhang Z, Wang X. Integrated analysis of coding genes and non-coding RNAs during hair follicle cycle of cashmere goat (Capra hircus). BMC Genomics. 2017 Oct 11;18(1):767. [CrossRef]
- Zhou G, Kang D, Ma S, Wang X, Gao Y, Yang Y, Wang X, Chen Y. Integrative analysis reveals ncRNA-mediated molecular regulatory network driving secondary hair follicle regression in cashmere goats. BMC Genomics. 2018 Mar 27;19(1):222. [CrossRef]
- Yue Y, Guo T, Yuan C, Liu J, Guo J, Feng R, Niu C, Sun X, Yang B. Integrated Analysis of the Roles of Long Noncoding RNA and Coding RNA Expression in Sheep (Ovis aries) Skin during Initiation of Secondary Hair Follicle. PLoS One. 2016 Jun 8;11(6):e0156890. [CrossRef]
- Shang F, Ma R, Rong Y, Pan J, Wang M, Niu S, Qi Y, Li Y, Wang Z, Lv Q, Wang R, Su R, Liu Z, Zhao Y, Wang Z, Li J, Zhang Y. Construction and functional analysis of ceRNA regulatory network related to the development of secondary hair follicles in Inner Mongolia cashmere goats. Front Vet Sci. 2022 Aug 25;9:959952. [CrossRef]
- Wu C, Xu Q, Li J, Qin C, Tulafu H, Liu W, Lu Q, Zheng W, Fu X. Regulation of cashmere fineness traits by noncoding RNA in Jiangnan cashmere goats. BMC Genomics. 2023 Oct 11;24(1):604. [CrossRef]
- Wu X, Gu Y, Li S, Guo S, Wang J, Luo Y, Hu J, Liu X, Li S, Hao Z, Li M, Shi B. RNA-Seq Reveals the Roles of Long Non-Coding RNAs (lncRNAs) in Cashmere Fiber Production Performance of Cashmere Goats in China. Genes (Basel). 2023 Feb 1;14(2):384. [CrossRef]
- Fu X, Zhao B, Tian K, Wu Y, Suo L, Ba G, Ciren D, De J, Awang C, Gun S, Yang B. Integrated analysis of lncRNA and mRNA reveals novel insights into cashmere fineness in Tibetan cashmere goats. PeerJ. 2020 Nov 9;8:e10217. [CrossRef]
- Jin M, Fan W, Piao J, Zhao F, Piao J. Effects of lncRNA MTC on protein expression in skin fibroblasts of Liaoning Cashmere goat based on iTRAQ technique. Anim Biotechnol. 2022 Sep 10:1-10. [CrossRef]
- Sun H, Meng K, Wang Y, Wang Y, Yuan X, Li X. LncRNAs regulate the cyclic growth and development of hair follicles in Dorper sheep. Front Vet Sci. 2023 Jul 31;10:1186294. [CrossRef]
- Yin RH, Wang YR, Zhao SJ, et al. LncRNA-599554 sponges miR-15a-5p to contribute inductive ability of dermal papilla cells through positive regulation of the expression of Wnt3a in cashmere goat. Electron J Biotechnol 2020;45.
- Ren H, Wang G, Chen L, Jiang J, Liu L, Li N, Zhao J, Sun X, Zhou P. Genome-wide analysis of long non-coding RNAs at early stage of skin pigmentation in goats (Capra hircus). BMC Genomics. 2016 Jan 19;17:67. [CrossRef]
- Lv J, Cui W, Liu H, He H, Xiu Y, Guo J, Liu H, Liu Q, Zeng T, Chen Y, Zhang Y, Wu Q. Identification and characterization of long non-coding RNAs related to mouse embryonic brain development from available transcriptomic data. PLoS One. 2013 Aug 14;8(8):e71152. [CrossRef]
- Kelley D, Rinn J. Transposable elements reveal a stem cell-specific class of long noncoding RNAs. Genome Biol. 2012 Nov 26;13(11):R107. [CrossRef]
- Robinson M D, McCarthy D J, XJyth G K. edgeR: a Bioconductor package for differential expression analysis of digital gene expression data[J]. Bioinformatics, 2010, 26(1): 139-140.
- Kim D, Langmead B, Salzberg S L. HISAT: a fast spliced aligner with low memory requirements[J]. Nature methods, 2015, 12(4): 357-360.
- Yu G, Wang L G, Han Y, et al. clusterProfiler: an R package for comparing biological themes among gene clusters[J]. Omics: a jouRNAl of integrative biology, 2012, 16(5): 284-287.
- Kanehisa M, Araki M, Goto S, Hattori M, Hirakawa M, Itoh M, Katayama T, Kawashima S, Okuda S, Tokimatsu T, Yamanishi Y. KEGG for linking genomes to life and the environment. Nucleic Acids Res. 2008 Jan;36(Database issue):D480-4. [CrossRef]
- Shannon P, Markiel A, Ozier O, Baliga NS, Wang JT, Ramage D, Amin N, Schwikowski B, Ideker T. Cytoscape: a software environment for integrated models of biomolecular interaction networks. Genome Res. 2003 Nov;13(11):2498-504. [CrossRef]
- Jiao Q, Wang YR, Zhao JY, Wang ZY, Guo D, Bai WL. Identification and molecular analysis of cashmere goat lncRNAs reveal their integrated regulatory network and potential roles in secondary hair follicle. Anim Biotechnol. 2021 Dec;32(6):719-732. [CrossRef]
- Zheng YY, Sheng SD, Hui TY, Yue C, Sun JM, Guo D, Guo SL, Li BJ, Xue HL, Wang ZY, Bai WL. An Integrated Analysis of Cashmere Fineness lncRNAs in Cashmere Goats. Genes (Basel). 2019 Apr 2;10(4):266. [CrossRef]
- Collins CA, Watt FM. Dynamic regulation of retinoic acid-binding proteins in developing, adult and neoplastic skin reveals roles for beta-catenin and Notch signalling. Dev Biol. 2008 Dec 1;324(1):55-67. [CrossRef]
- Magin TM, Vijayaraj P, Leube RE. Structural and regulatory functions of keratins. Exp Cell Res. 2007 Jun 10;313(10):2021-32. [CrossRef]
- Gong H, Zhou H, Forrest RH, Li S, Wang J, Dyer JM, Luo Y, Hickford JG. Wool Keratin-Associated Protein Genes in Sheep-A Review. Genes (Basel). 2016 May 28;7(6):24. [CrossRef]
- Wu C, Qin C, Fu X, Huang X, Tian K. Integrated analysis of lncRNAs and mRNAs by RNA-Seq in secondary hair follicle development and cycling (anagen, catagen and telogen) of Jiangnan cashmere goat (Capra hircus). BMC Vet Res. 2022 May 6;18(1):167. [CrossRef]
- Jia Q, Zhang S, Wang D, Liu J, Luo X, Liu Y, Li X, Sun F, Xia G, Zhang L. Regulatory Effects of FGF9 on Dermal Papilla Cell Proliferation in XJall-Tailed Han Sheep. Genes (Basel). 2023 May 18;14(5):1106. [CrossRef]
- Zhu YB, Wang ZY, Yin RH, Jiao Q, Zhao SJ, Cong YY, Xue HL, Guo D, Wang SQ, Zhu YX, Bai WL. A lncRNA-H19 transcript from secondary hair follicle of Liaoning cashmere goat: Identification, regulatory network and expression regulated potentially by its promoter methylation. Gene. 2018 Jan 30;641:78-85. [CrossRef]
- Kawano M, Komi-Kuramochi A, Asada M, Suzuki M, Oki J, Jiang J, Imamura T. Comprehensive analysis of FGF and FGFR expression in skin: FGF18 is highly expressed in hair follicles and capable of inducing anagen from telogen stage hair follicles. J Invest Dermatol. 2005 May;124(5):877-85. [CrossRef]
- Kwack MH, Seo CH, Gangadaran P, Ahn BC, Kim MK, Kim JC, Sung YK. Exosomes derived from human dermal papilla cells promote hair growth in cultured human hair follicles and augment the hair-inductive capacity of cultured dermal papilla spheres. Exp Dermatol. 2019 Jul;28(7):854-857. [CrossRef]
- Sohn KM, Jeong KH, Kim JE, Park YM, Kang H. Hair growth-promotion effects of different alteRNAting current parameter settings are mediated by the activation of Wnt/β-catenin and MAPK pathway. Exp Dermatol. 2015 Dec;24(12):958-63. [CrossRef]
- Shi R, Li S, Liu P, Zhang S, Wu Z, Wu T, Gong S, Wan Y. Identification of key genes and signaling pathways related to Hetian sheep wool density by RNA-seq technology. PLoS One. 2022 May 25;17(5):e0265989. [CrossRef]
- Lv X, Chen W, Sun W, Hussain Z, Wang S, Wang J. Analysis of lncRNAs Expression Profiles in Hair Follicle of Hu Sheep Lambskin. Animals (Basel). 2020 Jun 15;10(6):1035. [CrossRef]
- Lv X, Chen W, Wang S, Cao X, Yuan Z, Getachew T, Mwacharo JM, Haile A, Sun W. Integrated Hair Follicle Profiles of microRNAs and mRNAs to Reveal the Pattern Formation of Hu Sheep Lambskin. Genes (Basel). 2022 Feb 14;13(2):342. [CrossRef]
- Xiao S, Wang J, Chen Q, Miao Y, Hu Z. The mechaniXJ of activated platelet-rich plaXJa supeRNAtant promotion of hair growth by cultured dermal papilla cells. J CoXJet Dermatol. 2019 Dec;18(6):1711-1716. [CrossRef]
- Yamane M, Seo J, Zhou Y, Asaba T, Tu S, Nanmo A, Kageyama T, Fukuda J. Effects of the PI3K/Akt signaling pathway on the hair inductivity of human dermal papilla cells in hair beads. J Biosci Bioeng. 2022 Jul;134(1):55-61. [CrossRef]
- Zhao M, Zhou H, Luo Y, Wang J, Hu J, Liu X, Li S, Hao Z, Jin X, Song Y, Wu X, Hu L, Hickford JGH. Variation in the Caprine Keratin-Associated Protein 27-1 Gene is Associated with Cashmere Fiber Diameter. Genes (Basel). 2020 Aug 13;11(8):934. [CrossRef]
- Zhao J, Ding Q, Li L, Kalds P, Zhou S, Sun J, Huang S, Wang X, Chen Y. Deletions in the KAP6-1 gene are associated with fiber traits in cashmere-producing goats. Anim Biotechnol. 2022 Nov;33(6):1198-1204. [CrossRef]
Figure 1.
The 40x magnification histological analysis of skin tissue of Small-Tailed Han sheep and Super Merino sheep. A: Cross-section of STH tissues. A’: Transverse section of STH tissues. B: Cross-section of SM tissues. B’: Transverse section of SM tissues. “★”Primary hair follicle. “▲”Secondary hair follicle.
Figure 2.
Statistical map for predicting long non-coding RNAs.
Figure 2.
Statistical map for predicting long non-coding RNAs.
Figure 3.
Prediction method: Venn diagram.
Figure 3.
Prediction method: Venn diagram.
Figure 4.
On the left is a comparison of the lncRNA and mRNA expression levels. On the right is a comparison of the lncRNA and mRNA variable shear isomers.
Figure 4.
On the left is a comparison of the lncRNA and mRNA expression levels. On the right is a comparison of the lncRNA and mRNA variable shear isomers.
Figure 5.
(A) Length distribution of mRNA and lncRNAs; the length unit is bp. (B) Exon number distribution of mRNA and lncRNA. (C) Open reading frame (ORF) length distribution of mRNA and lncRNA.
Figure 5.
(A) Length distribution of mRNA and lncRNAs; the length unit is bp. (B) Exon number distribution of mRNA and lncRNA. (C) Open reading frame (ORF) length distribution of mRNA and lncRNA.
Figure 6.
(A) Differentially expressed gene enrichment bubble map. (B) Differentially expressed lncRNA cis target gene enrichment bubble map. (C) Differentially expressed lncRNA trans target gene enrichment bubble map.
Figure 6.
(A) Differentially expressed gene enrichment bubble map. (B) Differentially expressed lncRNA cis target gene enrichment bubble map. (C) Differentially expressed lncRNA trans target gene enrichment bubble map.
Figure 7.
(A) The rich distribution diagram showing the differential expression of the mRNA KEGG channel. (B) Rich distribution diagram of the KEGG pathway of the lncRNA cis target gene. (C) The rich distribution diagram showing the lncRNA trans target gene KEGG pathway.
Figure 7.
(A) The rich distribution diagram showing the differential expression of the mRNA KEGG channel. (B) Rich distribution diagram of the KEGG pathway of the lncRNA cis target gene. (C) The rich distribution diagram showing the lncRNA trans target gene KEGG pathway.
Figure 8.
Interaction network diagram of differentially expressed lncRNA and differentially expressed cis target genes. Triangles are DE lncRNAs. Ovals are DE mRNAs. Red is used for genes that are highly expressed in SM, Green is used for genes that are highly expressed in STH.
Figure 8.
Interaction network diagram of differentially expressed lncRNA and differentially expressed cis target genes. Triangles are DE lncRNAs. Ovals are DE mRNAs. Red is used for genes that are highly expressed in SM, Green is used for genes that are highly expressed in STH.
Figure 9.
Interaction network diagram of differentially expressed lncRNA and differentially expressed trans target genes. Triangles are differentially expressed lncRNAs. Ovals are differentially expressed mRNAs. Red is used for genes that are highly expressed in SM, Green is used for genes that are highly expressed in STH.
Figure 10.
The lncRNA and mRNA were verified via qRT-PCR. The vertical axis is the relative expression, the left side of the X-axis is RNA sequencing (RNAseq), and the right side is qRT-PCR. Red: SM, Green: STH.
Figure 10.
The lncRNA and mRNA were verified via qRT-PCR. The vertical axis is the relative expression, the left side of the X-axis is RNA sequencing (RNAseq), and the right side is qRT-PCR. Red: SM, Green: STH.
Table 1.
Sequences of primers used in qRT-PCR.
Table 1.
Sequences of primers used in qRT-PCR.
| Gene |
Primer Sequence 5’→3’ |
Product Length (bp) |
| MSTRG.93521.1 (down) |
CAGGCTCGGCTGAGGTTTGG
AGTCTGTGGTTGTGTCCAGTGATG |
114 |
| MSTRG.20995.1 (down) |
GTGGGGAGCCAAAGAGGAAT
AGGTCAACGGCGTGGTTAAA |
165 |
| MSTRG.154129.25 (up) |
TGGTTAGCTCAAGGTTCGAGA
GCAGCAGGAGGAAACAACCTA |
141 |
| MSTRG.122229.1 (down) |
AGCCAAAGGGAAGCGAGTAG
TCCCTCTGGTCCCTAAGGAAG |
92 |
| MSTRG.89255.1 (down) |
CTGGTGAGGAAAGAGGTGGATGTG
ACGAGGTTGGTTTGCTGGGAAAG |
135 |
| MSTRG.96951.1 (down) |
ACTCGCCTTGTTCCAACCTC
AGTGTGTCCGAATCTGCCTC |
131 |
| MSTRG.31806.12 (up) |
AGCAAGAGCCAGTGGTACAATA
ATAGCCTCCAGCAGACGAGG |
92 |
| MSTRG.73973.1 (up) |
AAGGGCAAGTGGGCTCCGTAG
CAACTGCTTGGGACTTCTCTGGT |
149 |
| MSTRG.129277.1 (up) |
GCCACCAGTCGTCATGAAAG
TCTAGCCATTCCGTCAGCAC |
92 |
| FGF1 (down)
|
GGAGCGACCAGCACATTCAG
CGTACAAAAGCCCGTTGGTG |
114 |
| IGF1 (down) |
TGCTTTTGTGATTTCTTGAAGGTGA
AGAGCATCCACCAACTCAGC |
143 |
| KRT2 (down) |
ACCTTCATCGACAAGGTGCG
AGTTGGCTGATGTACCGCTG |
137 |
| CRABP1 (down) |
ACGGGGACCAGTTCTACATCA
TCCCAAGTGGGTAAGCTCCTG |
127 |
| KRT10 (down) |
AGCAGAAACTAGCTGGGATACT
AGGACTCTACCATCAGGTGC |
81 |
| GAPDH |
GTGGACCTGACCTGCCGTCTAG
GAGTGGGTGTCGCTGTTGAAGTC |
149 |
Table 2.
Comparison of skin structure and hair follicle traits.
Table 2.
Comparison of skin structure and hair follicle traits.
| Traits |
Super Merino
(n = 6) |
Small-Tailed Han Sheep
(n = 6) |
| Skin thickness (µm) |
1355.37 ± 50.48 |
1616.57 ± 44.53 ** |
| Hair follicle density (mm2) |
19.74 ± 2.04 ** |
11.59 ± 1.13 |
Diameter of primary dermal
papilla (µm) |
122.35 ± 2.99 |
143.68 ± 5.46 ** |
Diameter of secondary dermal
Papilla (µm) |
49.26 ± 1.99 |
63.81 ± 3.24 ** |
| S/P |
19.65 ± 2.90 ** |
5.46 ± 2.43 |
Table 3.
Quality statistics of the sequencing data.
Table 3.
Quality statistics of the sequencing data.
| BMK-ID |
Total Reads |
Mapped Reads |
Uniquely Mapped Reads |
Multiple Mapped Reads |
Q20 (%) |
Q30 (%) |
| SM1 |
119,612,582 |
113,676,411 (95.04%) |
111,058,913 (92.85%) |
2,617,498 (2.19%) |
97.67 |
93.62 |
| SM2 |
115,429,242 |
109,531,249 (94.89%) |
107,228,260 (92.90%) |
2,302,989 (2.00%) |
97.76 |
93.79 |
| SM3 |
124,719,310 |
117,304,477 (94.05%) |
115,270,935 (92.42%) |
2,033,542 (1.63%) |
97.86 |
93.87 |
| SM4 |
118,615,420 |
113,129,111 (95.37%) |
109,835,326 (92.60%) |
3,293,785 (2.78%) |
97.67 |
93.62 |
| SM5 |
132,926,276 |
127,869,012 (96.20%) |
125,542,321 (94.45%) |
2,326,691 (1.75%) |
97.85 |
93.87 |
| SM6 |
122,335,752 |
117,949,087 (96.41%) |
115,542,600 (94.45%) |
2,406,487 (1.97%) |
98.16 |
94.68 |
| STH1 |
127,399,620 |
123,042,683 (96.58%) |
120,295,753 (94.42%) |
2,746,930 (2.16%) |
98.08 |
94.52 |
| STH2 |
127,087,066 |
122,677,440 (96.53%) |
119,419,027 (93.97%) |
3,258,413 (2.56%) |
98.18 |
94.80 |
| STH3 |
128,176,154 |
123,199,306 (96.12%) |
119,827,700 (93.49%) |
3,371,606 (2.63%) |
98.07 |
94.45 |
| STH4 |
132,012,936 |
126,513,200 (95.83%) |
123,006,721 (93.18%) |
3,506,479 (2.66%) |
97.84 |
93.88 |
| STH5 |
117,224,636 |
112,912,295 (96.32%) |
110,197,340 (94.01%) |
2,714,955 (2.32%) |
97.89 |
93.96 |
| STH6 |
114,176,126 |
109,862,331 (96.22%) |
107,334,555 (94.01%) |
2,527,776 (2.21%) |
98.02 |
94.38 |
Table 4.
Important GO terms for the significant enrichment of DE mRNA.
Table 4.
Important GO terms for the significant enrichment of DE mRNA.
| GO Accession |
Description |
Term Type |
p-Value |
Gene Count |
| GO:0008544 |
Epidermis development |
BP |
0.0001788 |
6 |
| GO:0043588 |
Skin development |
BP |
0.0013060 |
5 |
| GO:0030216 |
Keratinocyte differentiation |
BP |
0.0108638 |
4 |
| GO:0043589 |
Skin morphogenesis |
BP |
0.0161471 |
2 |
| GO:0032980 |
Keratinocyte activation |
BP |
0.0223430 |
1 |
| GO:0031424 |
Keratinization |
BP |
0.0431341 |
2 |
| GO:0045684 |
Positive regulation of epidermis development |
BP |
0.0441884 |
1 |
| GO:0045095 |
Keratin filament |
CC |
5.5×10⁻³³
|
33 |
| GO:0030280 |
Structural constituent of epidermis |
MF |
0.0046092 |
2 |
Table 5.
Important GO terms with significant enrichment of cis target genes of DE lncRNA.
Table 5.
Important GO terms with significant enrichment of cis target genes of DE lncRNA.
| GO Accession |
Description |
Term Type |
p-Value |
Gene Count |
| GO:0031424 |
Keratinization |
BP |
0.000191957 |
3 |
| GO:0009913 |
Epidermal cell differentiation |
BP |
0.007490985 |
2 |
| GO:0060429 |
Epithelium development |
BP |
0.007577933 |
3 |
| GO:0043588 |
Skin development |
BP |
0.033189955 |
2 |
| GO:0008544 |
Epidermis development |
BP |
0.034860079 |
2 |
| GO:0030216 |
Keratinocyte differentiation |
BP |
0.036562275 |
2 |
Table 6.
Important GO terms with significant enrichment of trans target genes of DE lncRNA.
Table 6.
Important GO terms with significant enrichment of trans target genes of DE lncRNA.
| GO Accession. |
Description |
Term Type |
p-Value |
Gene Count |
| GO:0030216 |
Keratinocyte differentiation |
BP |
0.007050079 |
13 |
| GO:0008544 |
Epidermis development |
BP |
0.014961718 |
12 |
| GO:0098773 |
Skin epidermis development |
BP |
0.026714406 |
2 |
| GO:0043588 |
Skin development |
BP |
0.030278222 |
11 |
| GO:0045095 |
Keratin filament |
CC |
5.65×10⁻⁷
|
31 |
Table 7.
Important pathways for the significant enrichment of DE mRNA.
Table 7.
Important pathways for the significant enrichment of DE mRNA.
| ID |
Description |
p-Value |
Gene Count |
| ko04512 |
ECM–receptor interaction |
0.000463248 |
10 |
| ko04151 |
PI3K-Akt signaling pathway |
0.00543434 |
18 |
Table 8.
The differential expression of lncRNA cis target genes is an important pathway for significant enrichment.
Table 8.
The differential expression of lncRNA cis target genes is an important pathway for significant enrichment.
| ID |
Description |
p-Value |
Gene Count |
| ko04151 |
PI3K-Akt signaling pathway |
0.006991938 |
9 |
| ko04512 |
ECM–receptor interaction |
0.019300678 |
4 |
Table 9.
The differential expression of lncRNA trans target genes is an important pathway for significant enrichment.
Table 9.
The differential expression of lncRNA trans target genes is an important pathway for significant enrichment.
| ID |
Description |
p-Value |
Gene Count |
| ko04330 |
Notch signaling pathway |
0.001020893 |
20 |
| ko04010 |
MAPK signaling pathway |
0.003390449 |
65 |
| ko04014 |
Ras signaling pathway |
0.046038056 |
55 |
|
Disclaimer/Publisher’s Note: The statements, opinions and data contained in all publications are solely those of the individual author(s) and contributor(s) and not of MDPI and/or the editor(s). MDPI and/or the editor(s) disclaim responsibility for any injury to people or property resulting from any ideas, methods, instructions or products referred to in the content. |
© 2023 by the authors. Licensee MDPI, Basel, Switzerland. This article is an open access article distributed under the terms and conditions of the Creative Commons Attribution (CC BY) license (http://creativecommons.org/licenses/by/4.0/).
