Preprint
Article

Proguanil Suppresses Breast Tumor Growth In Vitro and In Vivo through Mitochondrial Dysfunction

Altmetrics

Downloads

116

Views

45

Comments

0

A peer-reviewed article of this preprint also exists.

Submitted:

30 November 2023

Posted:

30 November 2023

You are already at the latest version

Alerts
Abstract
Breast cancer is a serious disease and the second leading cause of cancer-related death among women in the U.S. New treatments for this aggressive disease are urgently needed. Repurposing FDA-approved drugs for cancer treatment is an alternative that saves time and lowers the costs needed for drug development. In this study, we investigated the effects of proguanil, an anti-malarial drug, in breast cancer cells. Proguanil exhibited a significant cytotoxic effect on breast cancer cell lines including patient derived cell lines. Proguanil caused apoptosis through increased production of ROS and consequent decrease of mitochondrial membrane potential, mitochondrial respiration, and ATP production rates. ROS generation by proguanil was up to 3-fold higher when compared to the control. Proguanil treatment increased the expression of Bax, p-H2AX, cleaved-caspase 9, cleaved PARP, and down-regulated bcl-2 and survivin in breast cancer cell lines. The enlargement of 4T1 breast tumors in female Balb/c mice was suppressed by 55% through daily oral administration of 20mg/kg of proguanil. Western blot analyses of proguanil- treated tumors showed increased levels of p-H2AX, Bax, c-PARP, and c-caspase3 compared to control. Proguanil proved to be an efficient in vitro and in-vivo inhibitor of breast cancer cells, hence should be considered further for clinical investigation against breast cancer.
Keywords: 
Subject: Medicine and Pharmacology  -   Oncology and Oncogenics

1. Introduction

Breast cancer is one of the most frequent malignancies among women and the second leading cause of cancer-related death [1,2]. It is a serious disease associated with substantial economic and medical burdens. A study from 2016 showed that the average costs per patient permitted by the insurance company in the first year after diagnosis were $60,637, $82,121, $129,387, and $134,682 for disease stages 0, I/II, III, and IV, respectively [2]. Although, the 5-year survival rate after a breast cancer diagnosis has improved over time, there is still a need to develop new strategies to control breast cancer and reduce the cost of treatment. Repurposing well-known and well-characterized non-cancer drugs for new uses in oncology is vital as it can save time and costs needed for drug development, and hence reach to patients quicker [3].
Reactive oxygen species (ROS) is a collective term for reactive, unstable, partially reduced oxygen derivatives. They include hydrogen peroxide (H2O2), superoxide anion (O2−), singlet oxygen (1O2), hydroxyl radical (·OH), and hypochlorous acid (HOCl) [4]. Cellular ROS can be created endogenously, as in the process of oxidative phosphorylation. They may also originate from contact with external sources, such as xenobiotic compounds [5,6].
Oxidative stress, which is a disbalance caused by excess of ROS, is implicated in various disease states such as diabetes, atherosclerosis, cancer, neurodegeneration, and aging [7,8,9]. The association of ROS with cancer has been always controversial. Paradoxically, numerous studies reported that ROS plays an important role in the initiation and progression of cancer [10,11,12]. On the other hand, many chemotherapeutic and radiotherapeutic agents eliminate cancer cells by augmenting ROS stress [13,14,15]. This implies that cancer cells can be killed by the same mechanism which promotes their survival.
The role of ROS on breast cancer etiology and progression is described by various studies [16,17]. Accumulating evidence suggests that the induction of ROS and oxidative stress are involved in the progression of breast cancer through several mechanisms [18]. Few such mechanisms are increased mutation rate, activation of growth-promoting signaling pathways, and increased resistance to therapy in response to oxidative stress [19,20,21]. It has been also reported that ROS generation by estrogens leads to the activation of several proliferative and anti-apoptotic signaling pathways, such as AKT, Cyclin D1, and Bcl-2 resulting in breast cancer development [22].
Proguanil, previously known as Paludrine, is an antimalarial agent which was developed in England during the World War II. Curd, Davey, and Rose, extensively investigated the antimalarial activity of pyrimidine derivatives. During the investigation they synthesized the drug, N1-p-chlorophenyl-N5-isopropylbiguanide and demonstrated that it exhibits a high degree of activity in avian malaria [23]. Proguanil is used as a preventive and therapeutic agent for malaria in both adults and children. It is a prodrug and its active metabolite is cycloguanil. Although both proguanil and cycloguanil inhibit malaria parasites they have different targets [24]. Cycloguanil is an inhibitor of dihydrofolate reductase (DHFR), which is essential for DNA and amino acid synthesis for malaria parasites. Thus, inhibition of DHFR results in parasitic death [25]. Inhibition of DHFR by cycloguanil seems to be specific for the parasitic DHFR, as parasites transformed with human DHFR showed high resistance to this drug [26]. At the same time, the sensitivity of transformed and non-transformed parasites to proguanil was unchanged, indicating that proguanil has a different target than its metabolite [26]. Literature evidence suggests that proguanil has limited intrinsic activity and the activity is associated with mitochondrial function [27], however its mechanism of action is not fully understood.
The combination of proguanil with atovaquone, known under the brand name ‘Malarone’ [28], has shown to be successful for chloroquine-resistant cases of malaria [29,30]. A study indicated that the addition of proguanil increases the ability of atovaquone to reduce membrane potential without having any effect on electron transport inhibition in parasites [31]. Proguanil by itself had minimal effects on the electron transport and membrane potential (ΔΨm) of the parasite. On the other hand, as indicated in another study, proguanil’s synergy with atovaquone, whose specific target is the bc1 complex, indicates mitochondria as the location of proguanil’s activity [32].
Previously we have established the anti-cancer efficacy of atovaquone in primary, paclitaxel-resistant and metastatic breast cancer [33]. Since the two compounds work in synergism, we further wanted to test the effects of proguanil in breast cancer model.
Proguanil seems unable to enter the mitochondrial matrix of mammalian cells unlike its related biguanide phenformin [32,34,35]. However, it demonstrated a better antiproliferative effect in cancer cells compared to other biguanides [36]. Several other studies confirmed the cytotoxic effects of proguanil in ovarian, bladder, and glioblastoma cancer cells, but its exact mechanism of action was not clear [37,38,39]. In the present study, we demonstrate that proguanil significantly inhibits the proliferation of human breast cancer cell lines (HCC1806, MCF-7and MDA-MB-231) along with several patient-derived breast cancer cell lines. We show that the apoptosis-inducing effect of proguanil in these cells is related to the generation of ROS in the mitochondria, mitochondrial depolarization, and inhibition of mitochondrial respiration resulting in the activation of the caspase-3 cascade. In vitro findings were further corroborated by demonstrating tumor size reduction in 4T1 in vivo orthotopic breast tumor model.

2. Materials and Methods

Chemicals

The Proguanil used in the study was 98.2% pure and obtained from Sigma Aldrich. It was dissolved in DMSO where it was stable for extended period of time. The bioavailability of Proguanil when taken orally is typically 100% according to the literature [40], however some studies have reported lower values [41].

Cell culture

Human breast carcinoma cell lines MDA-MB-231, MCF-7, HCC1806, and murine breast cancer cell line 4T1 were obtained from ATCC. These cell lines were maintained in DMEM supplemented with 10% FBS and 1%PSN. Patient-derived cells (TX-BR-109, TX-BR-237, TX-BR-247, TX-BR-313, and TX-BR-290) were obtained from the Children’s Oncology Group (Texas Tech University Science Center, Lubbock, TX). These cells were maintained in DMEM supplemented with 20% FBS, 1% PSN and 1x ITS (5µg/ml insulin, 5µg/ml transferrin, 5µg/ml selenous acid). All the above-mentioned cell lines were regularly authenticated by short tandem repeats (STR) analysis.

Sulphorhodamine B Assay (SRB)

Cytotoxicity assay was performed using SRB dye as described by us previously (26). Briefly, 4000-5000 cells/well were plated in 96 well plates. The following day, a wide range of proguanil (0-100 μM) was added to the cells. After 24, 48, and 72 hours, cells were fixed with 10% trichloroacetic acid, stained with SRB dye, and the optical density was measured in a 10mM Tris base solution.

AnnexinV-FITC apoptosis assay

Apoptosis assay was performed using annexin-V/FITC and propidium iodide as described by us previously [42]. Briefly, about 0.2×10⁶ cells were plated in each well of a six-well plate and treated with varying concentrations of proguanil for 72 hours. Apoptosis assay was performed using Annexin/PI kit and analyzed by BD flow cytometer.

Generation of reactive oxygen species

Intracellular ROS generation was determined by measuring the levels of superoxide and hydrogen peroxide ions produced in the cells using the dyes, dihydroethidium (DHE) and 6-carboxy-2, 7-dichlorodihydrofluorescein diacetate (DCFDA) by flow cytometry. In brief, 0.2×10⁶ cells were plated and allowed to attach overnight in each well of six-well plates. The cells were then exposed to either DMSO or 40 and 60 μM proguanil for varying time periods. Cells were further incubated with10 μM DCFDA and 5 μM hydroethidine at 37 °C for 25 min. Finally, cells were removed, washed, and resuspended in PBS and analyzed for ROS generation using a BD flow cytometer. Approximately 10,000 cells were evaluated for each sample. In all calculations, cell debris and clumps were excluded from the analysis.

Fluorescence microscopy

Around 0.2x10⁶ cells were plated in each well of 6-well plates, containing poly-L-Lysine coated coverslips. Cells were allowed to attach overnight. The next day, the coverslips were rinsed twice with PBS and co-stained with MitoTracker Green (100nM in HBSS) and MitoSOX Red (5µM in HBSS) as specified by the manufacturer (ThermoFisher #M36008 and #M7514). Following the staining, cells were treated with media containing DMSO or Proguanil for 15 min, rinsed with PBS, and fixed using 4% paraformaldehyde (PFA). Fluorescence images from a total of 100 cells per coverslip were obtained using Nikon Eclipse TE2000-E confocal microscope and analyzed using NIS-elements AR analysis 4.60.00 64-bit and GraphPad Prism 9 software.

Mitochondrial membrane potential

Alterations in the mitochondrial membrane potential were analyzed by flow cytometry using the membrane potential sensitive dye tetramethyl rhodamine (TMRM), which is taken up by active mitochondria with intact membrane potentials. Briefly, control and proguanil-treated cells after the desired duration of treatment were incubated with 10 μM TMRM at 37 °C for 15 min, harvested, washed, and resuspended in cold PBS. Cells were further analyzed using a flow cytometer.

Seahorse XFe-24 metabolic flux analysis

Real-time oxygen consumption rates (OCR) for HCC1806 and MDA-MB-231 cells were determined using the Seahorse Extracellular Flux (XFe-24) analyzer (Seahorse Bioscience, MA, USA) according to the protocol provided by Seahorse Bioscience. Around 30,000-40,000 cells were seeded into each well of XFe-24-well cell culture plates and incubated overnight to allow attachment. Cells were then treated with proguanil (20μM and 40 μM) for 48 hours. Vehicle alone (DMSO) control cells were processed in parallel. After the desired duration of treatment, cells were washed in XF assay media supplemented with 1mM Pyruvate, 10mM glucose, and 2mM L-glutamine and adjusted at 7.4 pH. Cells were then maintained for 1 hour in 500 μL/well of XF assay media at 37 °C, in a non-CO2 incubator, and then immediately analyzed by a Flux analyzer. The data set was analyzed by XFe-24 software.

Western Blot Analysis

Breast cancer cells were treated with different concentrations of proguanil for 72 hours. Whole-cell lysates were prepared using 4% (w/v) CHAPS buffer. RIPA lysis buffer was used for lysing tumor samples after homogenizing the tumors in 1X PBS. Protein estimation was done using a Bradford reagent. About 40-60 μg of protein were subjected to SDS-PAGE and the segregated protein was transferred to the PVDF membrane. The membranes were probed for primary antibodies against p-H2AX#7631, Bax #2774S, Bcl-2 #3498S, survivin #2808, C-caspase-9 #7237S, C-caspase-3 # 9661S, C-PARP #5625, and β-actin #SAB5600204.Except β-actin, which was purchased from Sigma Aldrich, (St Louis, MO), all other primary antibodies were obtained from Cell Signaling Technologies (Danvers, MA). The membrane was developed as described by us previously [43].

In vivo tumor model

Female Balb/c mice (4-6 weeks old) were purchased from Envigo. All animal experiments were conducted in agreement with ethical standards and protocol approved by Institutional Animal Care and Use Committee (IACUC). Briefly, 0.07 × 10⁶ 4T1 tumor cells in 0.1 ml PBS were injected orthotopically in the left and right 3rd mammary fat pad. Mice were divided randomly into two groups with 5 mice in each group once the tumor size was about 80-100 mm3. Since each mouse was bearing two tumors, every group consisted of 10 tumors. Treatment started with 20mg/kg proguanil daily on day 5 and continued for 27 days

Statistical Analysis

Data analysis and graphical representations were created in GraphPad Prism (Version 7.0). Results represent means ± SD or SEM of at least three independent experiments, unless otherwise specified. The student’s t-test or Mann-Whitney test were used for parametric and non-parametric data to test statistical significance of the difference between the control and treated groups. P-values less than 0.05 were considered statistically significant.

3. Results

3.1. Proguanil has anti-proliferative effects on breast cancer cells

To evaluate the anti-proliferative activity of proguanil, we first investigated the effects of proguanil on the growth of breast cancer cells. We used a panel of breast cancer cells including human, murine, and several patient-derived cell lines. Proguanil significantly reduced the proliferation of all the cell lines in a dose and time-dependent manner with IC50 in the range of 40-70 µM (Figure 1 A-D). It is worth noting that proguanil was more effective in suppressing the growth of patient-derived breast cancer cell lines (Figure 1). The IC50 of proguanil after 72h treatment ranged 30-60 µM in all five patient-derived cell lines (Figure 1E-I-I). These data suggest the potential cytotoxic effect of proguanil in breast tumor cells.

3.2. Proguanil triggers apoptosis in breast cancer cells

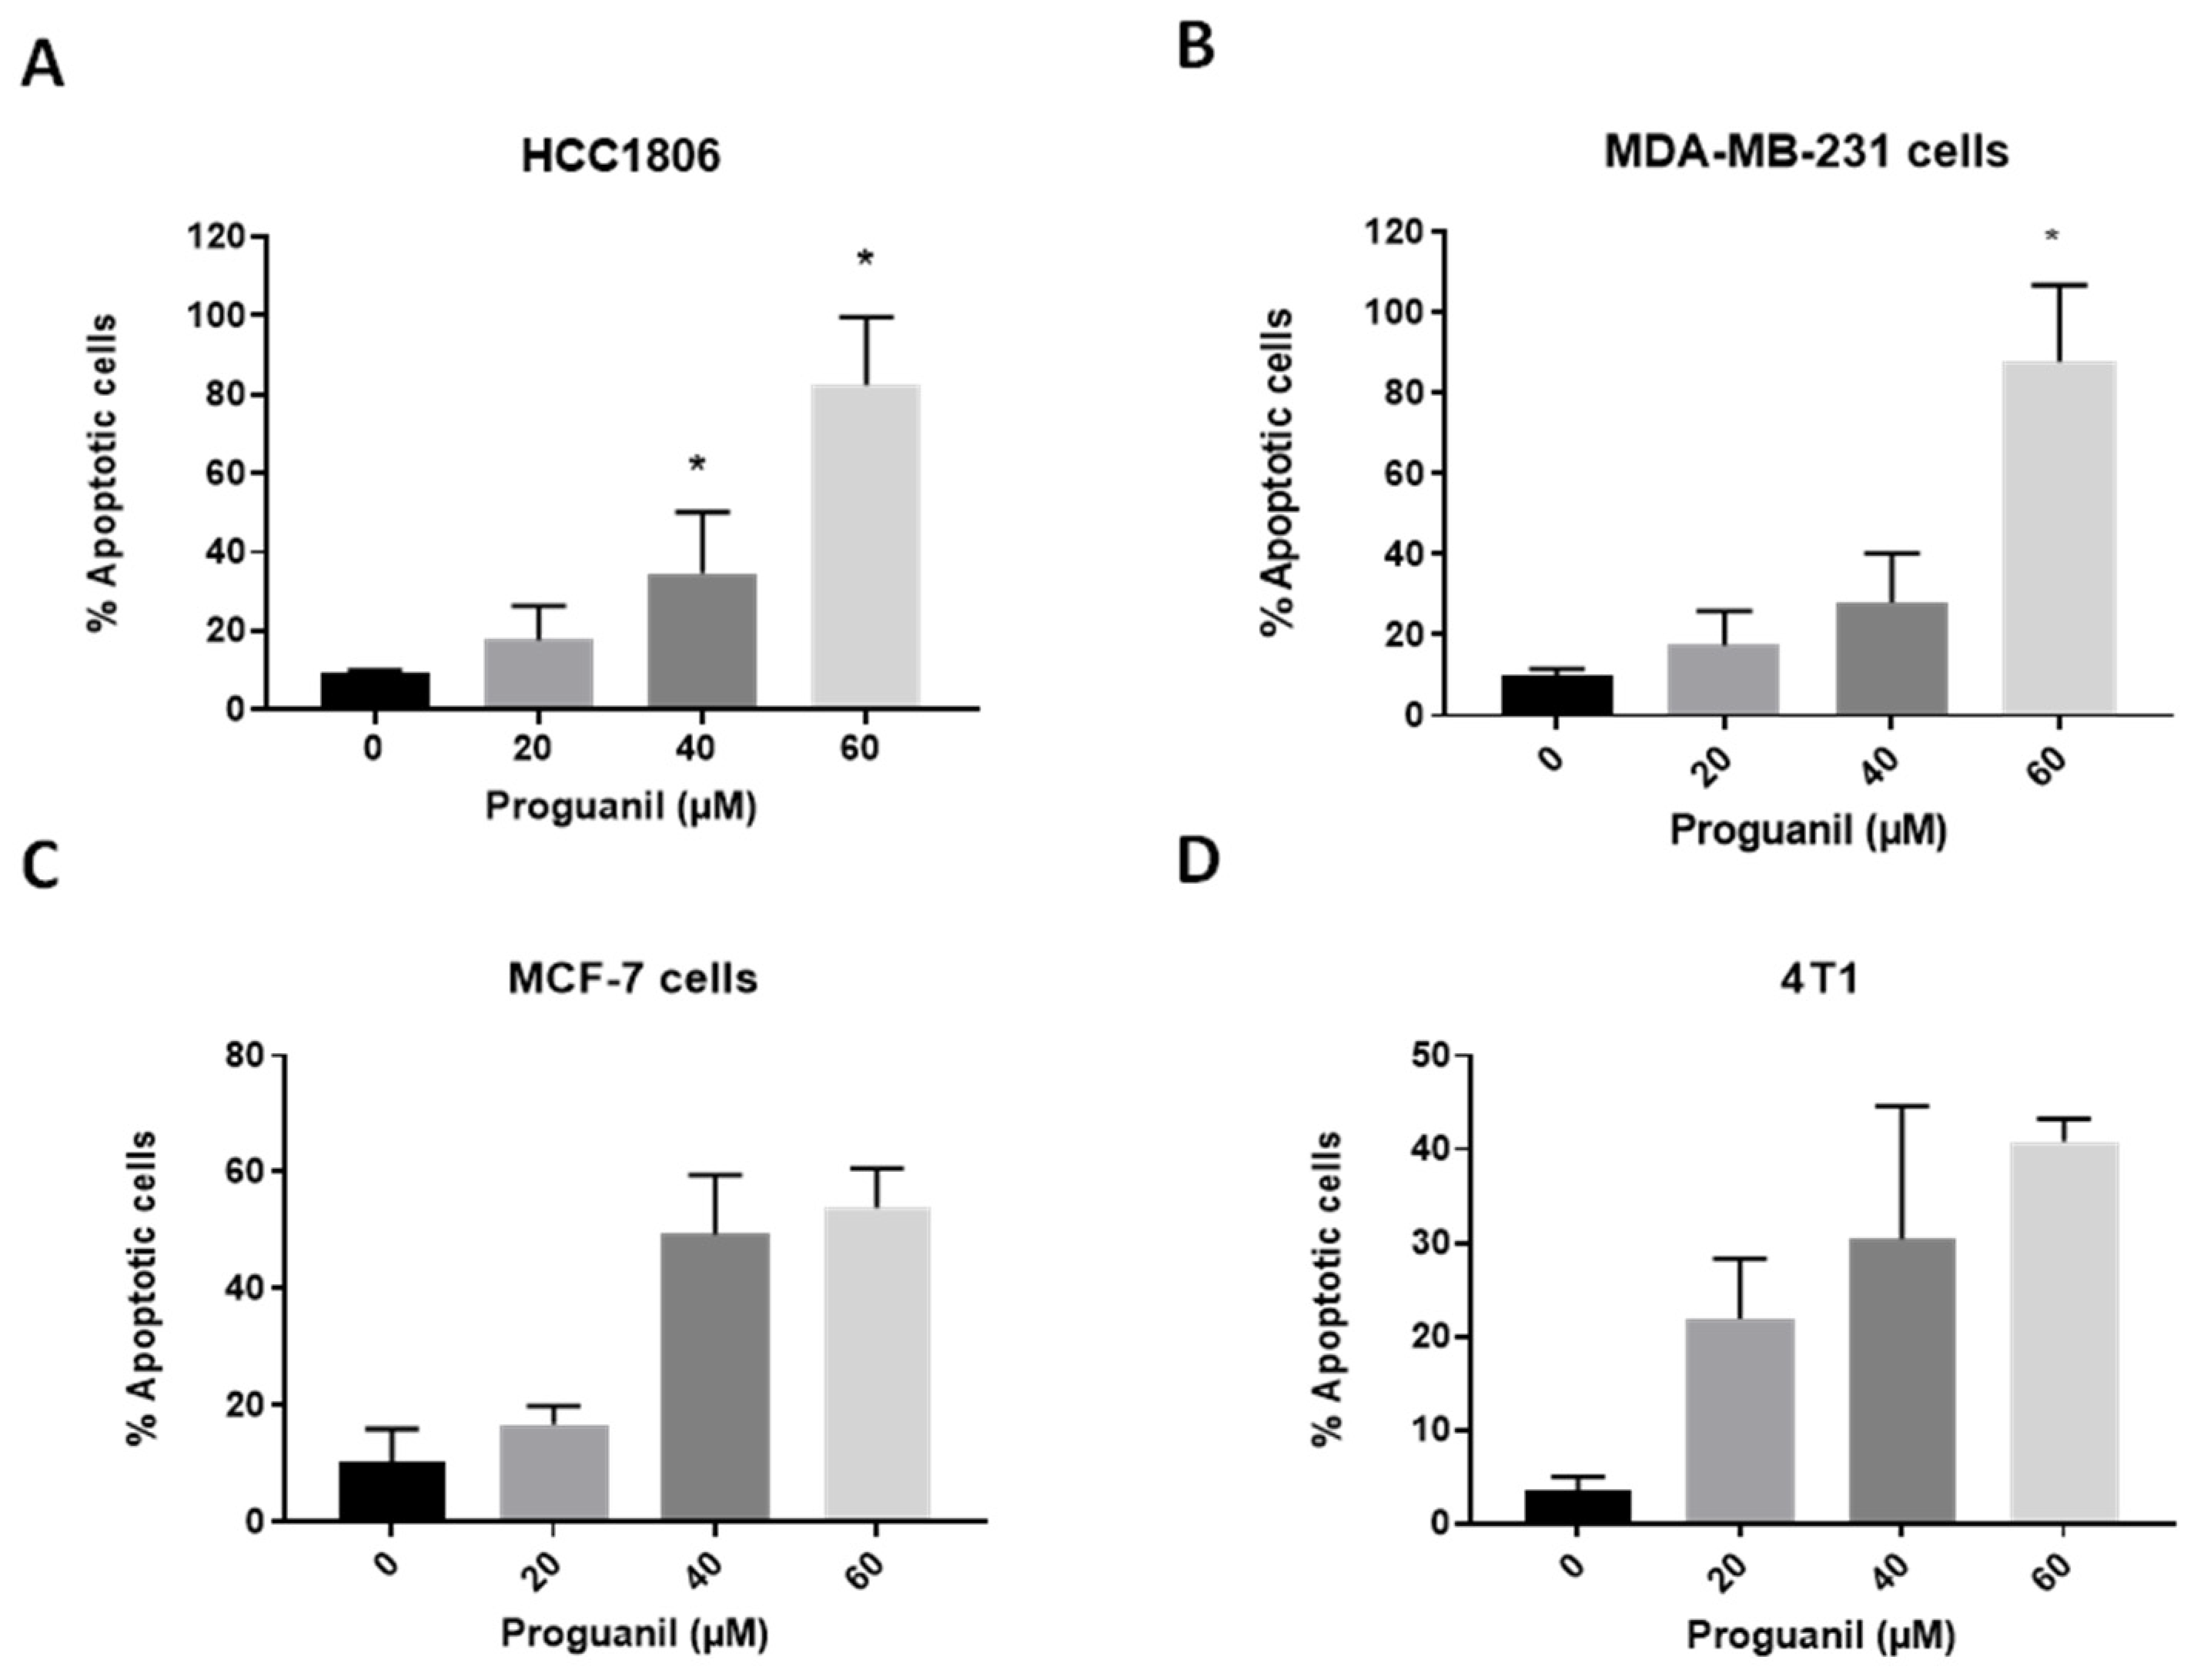
To understand better the mechanism of proguanil’s inhibitory effect on the cell growth we tested different breast cancer cell lines. HCC1806, MDA-MB-231, MCF-7, and 4T1 cells were treated with various concentrations of proguanil for 72h and analyzed for apoptosis using Annexin V/PI assay. We observed a time and concentration-dependent increase in the apoptotic cells after proguanil treatment in all cell lines (Figure 2 A-D). Treatment with 60 µM proguanil for 72h resulted in more than 80% apoptotic cell death of HCC1806 and MDA-MB-231 cells. On the other hand, MCF-7 and 4T1 were less sensitive to proguanil treatment. Potential reason could be the difference in the origin of the cells (human vs. murine) as well as the difference in the cell types (basal vs. luminal).

3.3. Proguanil causes the generation of mitochondrial ROS in breast cancer cells

To further dissect the mechanism of proguanil induced apoptosis, we determined if proguanil has any effect on ROS generation in breast cancer cell lines. Intracellular ROS generation by proguanil was evaluated by flow cytometry using 2',7'-dichlorofluorescin diacetate (DCFDA) and hydroethidine (DHE). DHE is a fluorogenic dye which can freely permeate cell membrane and be oxidized by cellular O2•−. Following oxidation, it produces two red fluorescent products (a) ethidium (E+), and (b) 2-hydroxyethidium (2-OH-E+). Among these two, 2-hydroxyethidium is a specific adduct of cellular O2. DCFDA, another fluorogenic dye, measures peroxyl, hydroxyl and other ROS activity within the cell. DCFDA diffuses into the cell and is subsequently deacetylated by cellular esterases to a non-fluorescent compound. The non-fluorescent compound is then oxidized by ROS into 2’, 7’ –dichlorofluorescein (DCF). DCF being highly fluorescent can be detected by fluorescence spectroscopy.
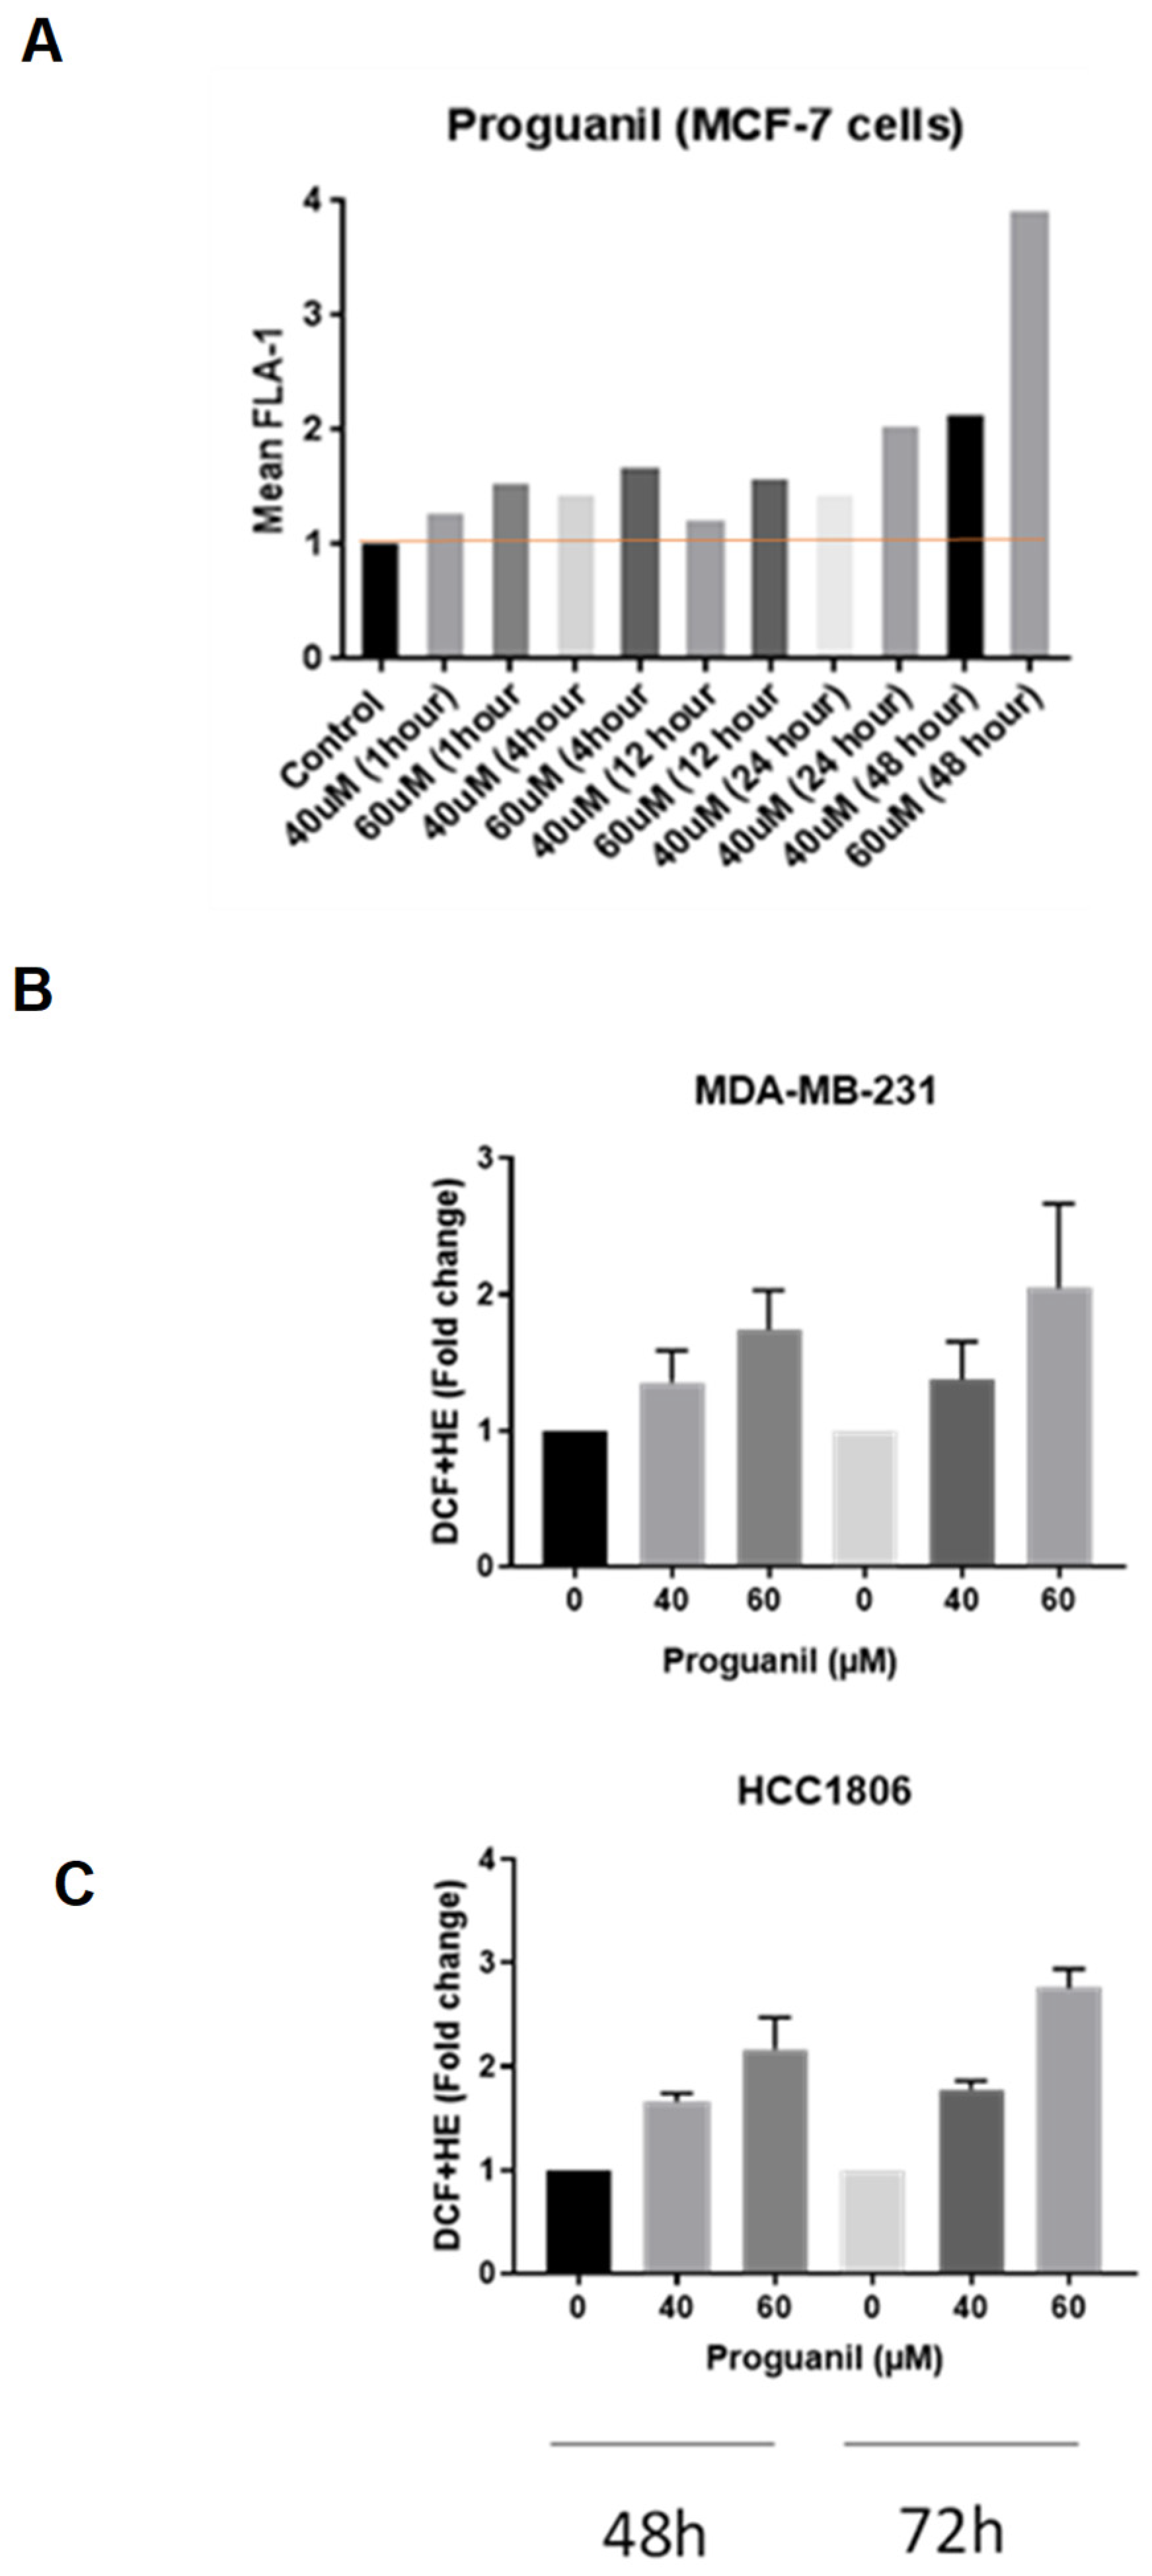
A time-dependent study of ROS generation was conducted in MCF-7 cells, with maximum ROS observed at 48 hours Figure 3A. Therefore, 48 and 72 hour time points were used for further studies. N-acetylcysteine (NAC) was used as a ROS scavenger in HCC1806 and MDA-MB-231 cells, where cells were pre-treated with NAC and then exposed to 60µM Proguanil. A slight decrease in ROS generation was observed with NAC pretreatment.
As shown in Figure 3B-C, proguanil treatment for 48h and 72h resulted in a dose-dependent increase in DCF and HE fluorescence (total ROS generation).Compared to DMSO-treated control, ROS generation in response to proguanil treatment was enhanced by 1.9 and 2.1-fold, at 72 h in MDA-MB-231 and HCC1806 cells respectively. This indicates that proguanil induces generation of ROS in breast cancer cells.
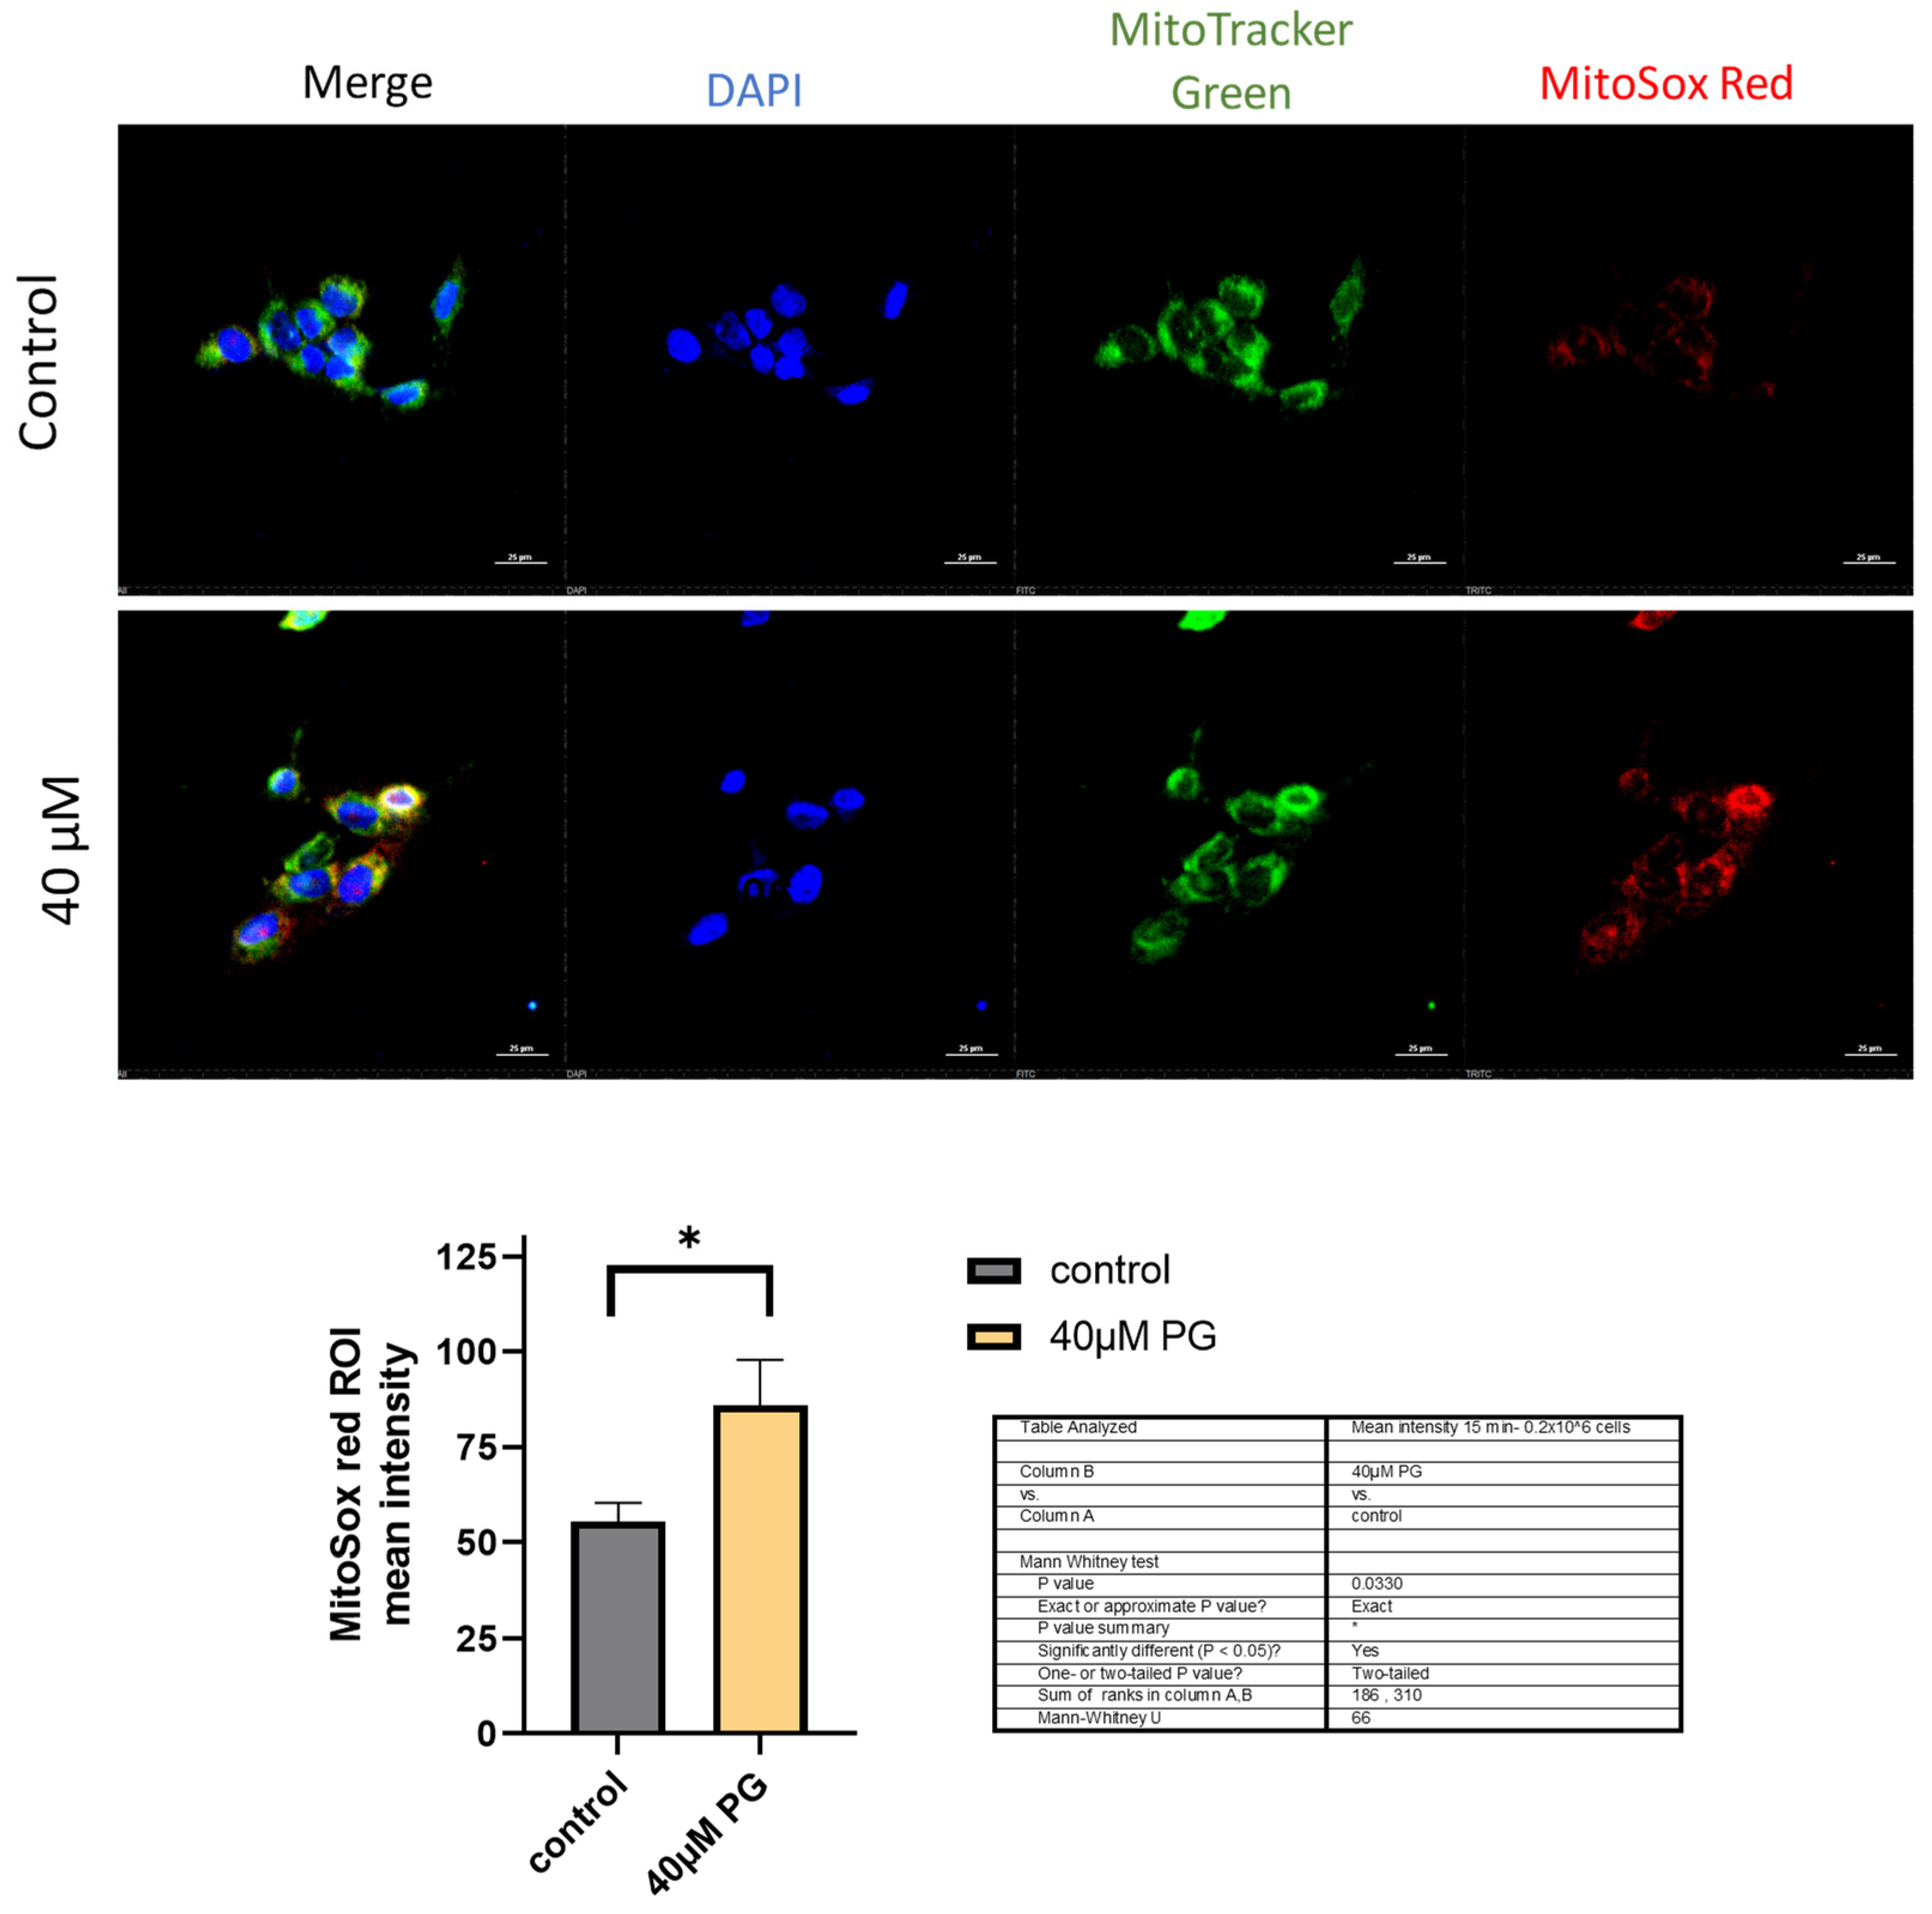
The biggest source of ROS generation in cells are mitochondria. To determine with certainty if ROS production was originating in the mitochondria, we analyzed the fluorescence of proguanil-treated HCC1806 cells using a fluorescence microscope. The cells were co-stained with MitoSOX Red and MitoTracker Green fluorogenic dyes and fixed with 4% PFA. MitoTracker Green is a green-fluorescent mitochondrial stain that localizes in mitochondria of living cells irrespective of the mitochondrial membrane potential. Mito SOX™ Red reagent permeates live cells and then selectively targets mitochondria. Inside mitochondria, MitoSOX™ Red is rapidly oxidized by superoxide.
Our results showed a significant increase of MitoSOX Red fluorescence as early as 15 minutes post-treatment with proguanil (Figure 4). The overlap of the two dyes confirms that proguanil induces generation of superoxide radical specifically in mitochondria of breast cancer cells.

3.4. Proguanil disrupts mitochondrial membrane potential in MDA-MB-231 and HCC1806 cells

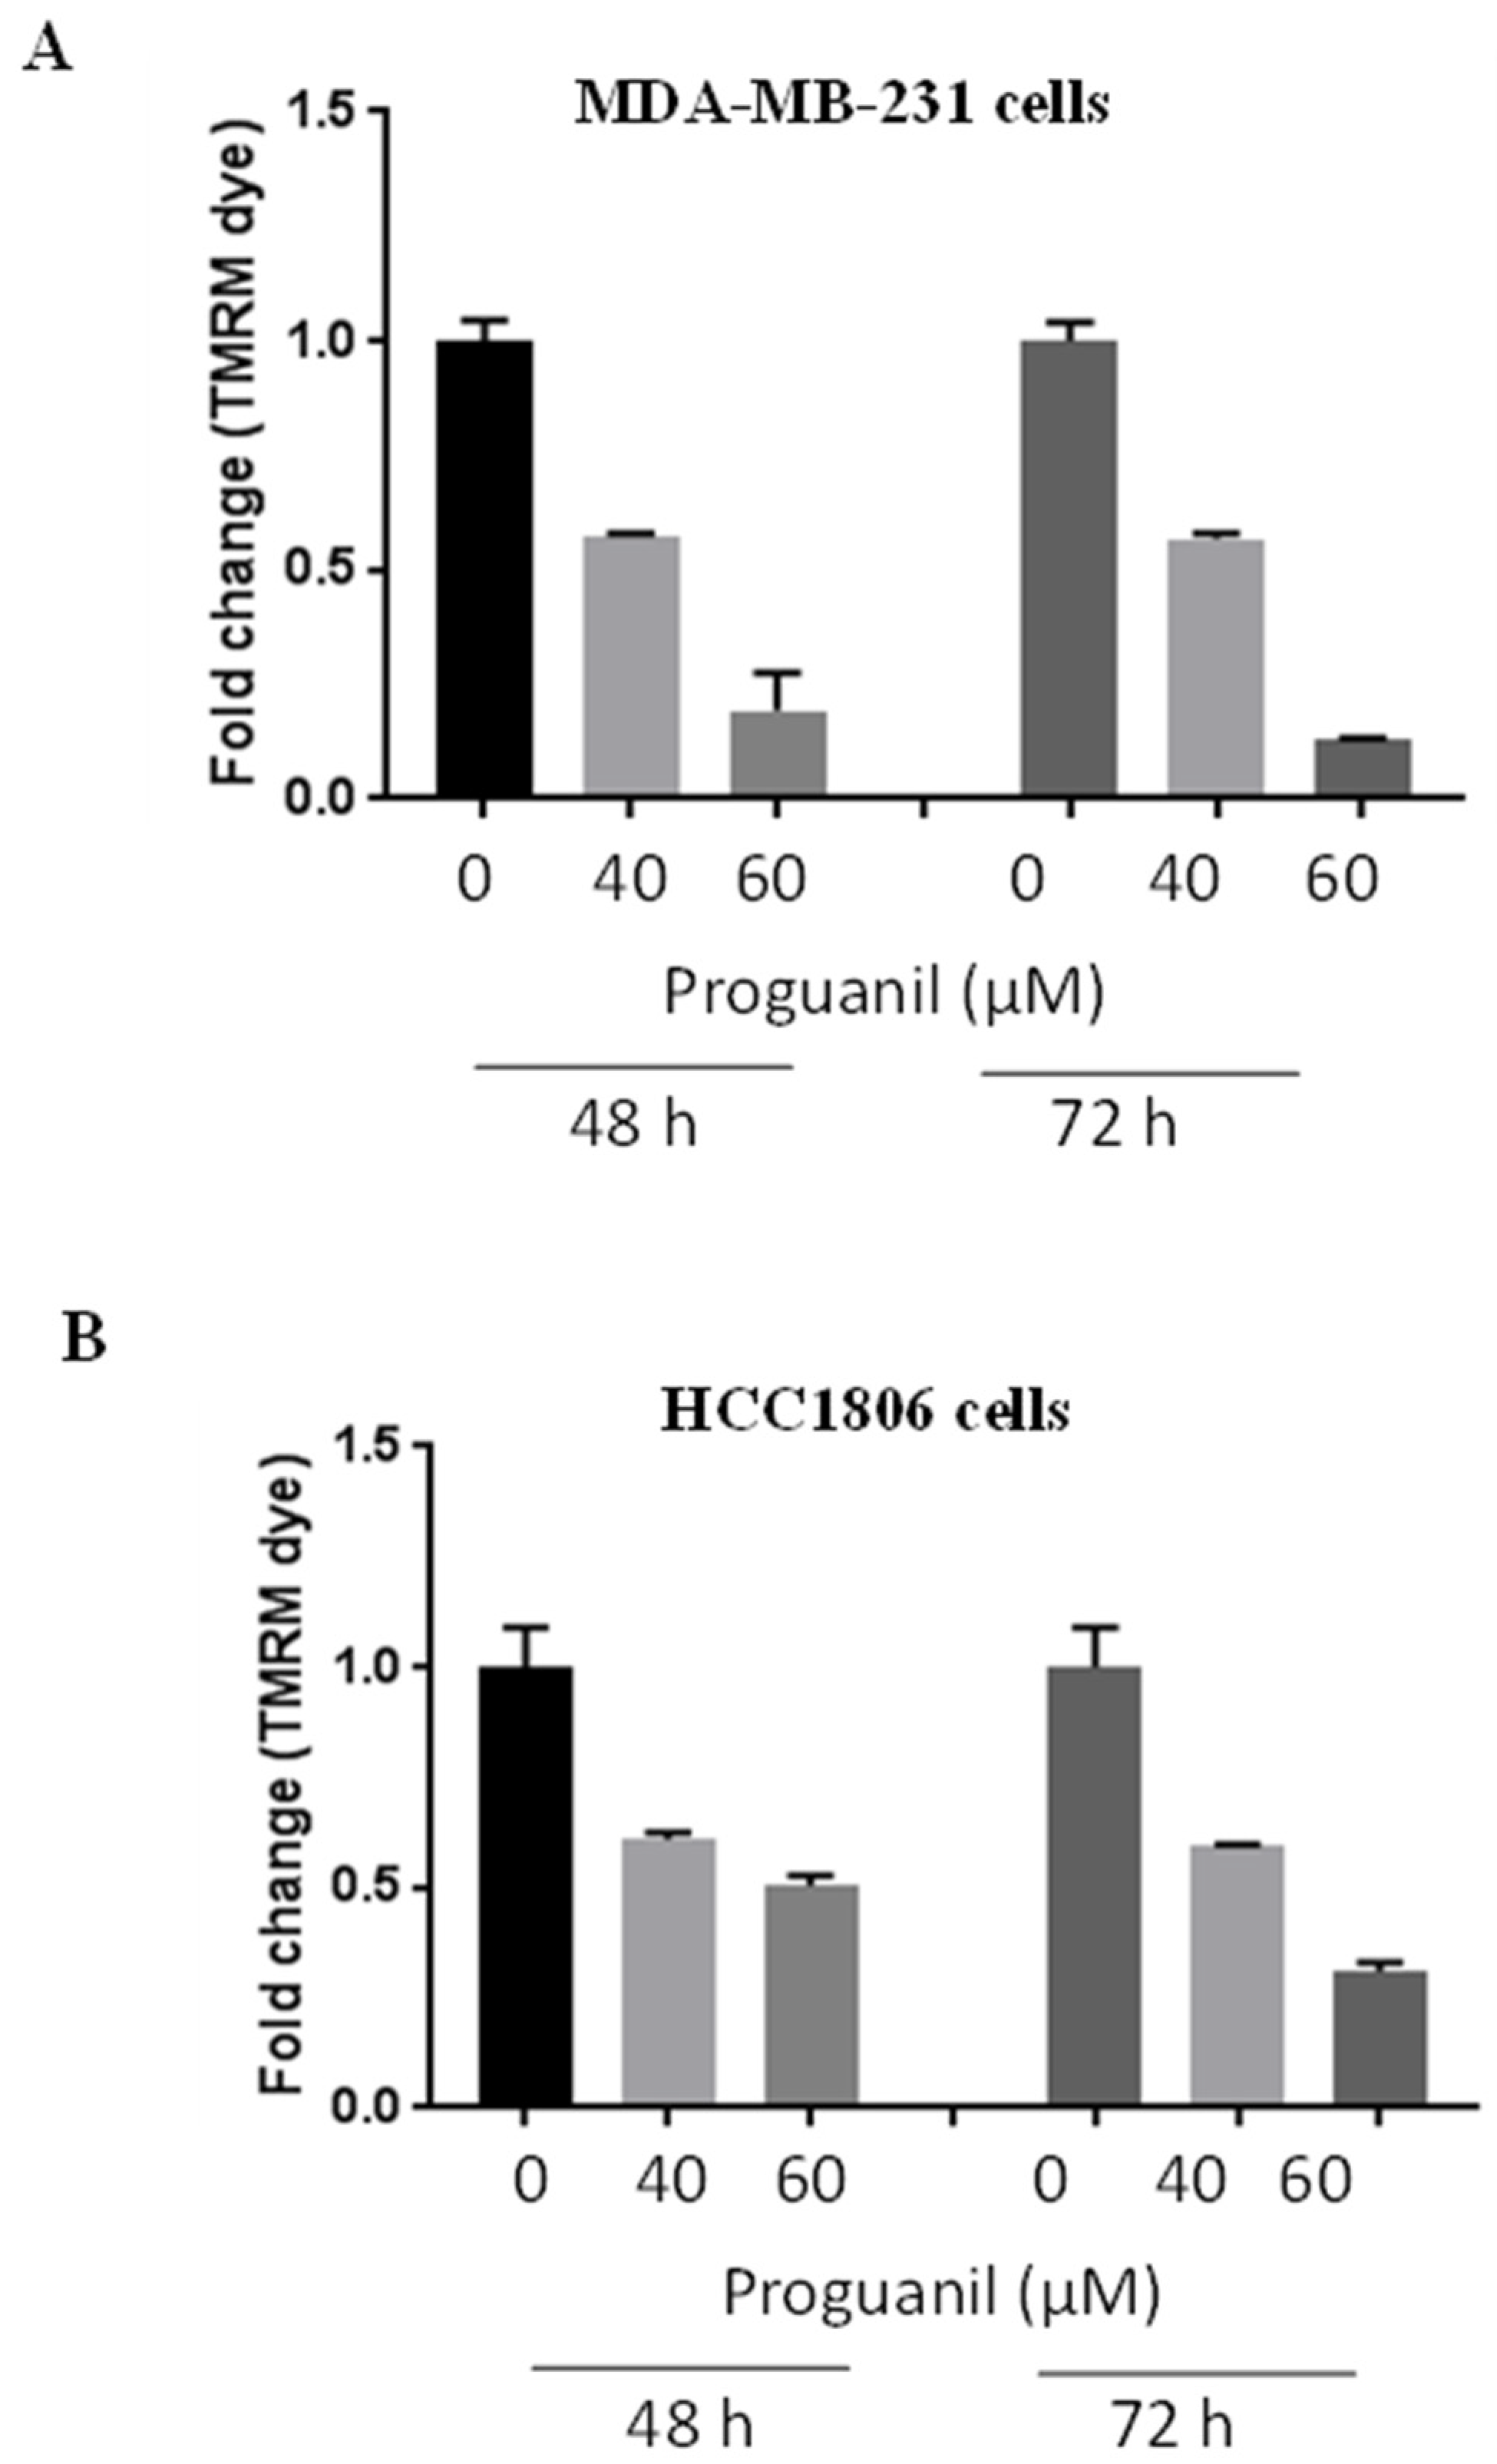
Increased intracellular ROS leads to apoptotic cell death by disrupting mitochondrial membrane potential. Tetramethyl rhodamine, methyl ester (TMRM) permeates the cell membrane and then accumulates in active mitochondria with intact membrane potentials. As the mitochondrial membrane potential is lost, TMRM accumulation decreases. The disruptions in ΔΨm by proguanil was measured by staining the cells with TMRM, a mitochondrial membrane-sensitive dye, and then analyzed by flow cytometry. As shown in Figure 5A-B, proguanil treatment significantly reduces the accumulation of TMRM dye in MDA-MB-231 and HCC1806 cells, in a concentration dependent manner, when compared with control. This indicates the reduction in mitochondrial membrane potential by proguanil in breast cancer cells.

3.5. Proguanil treatment activates the caspase-3 cascade in breast cancer cells

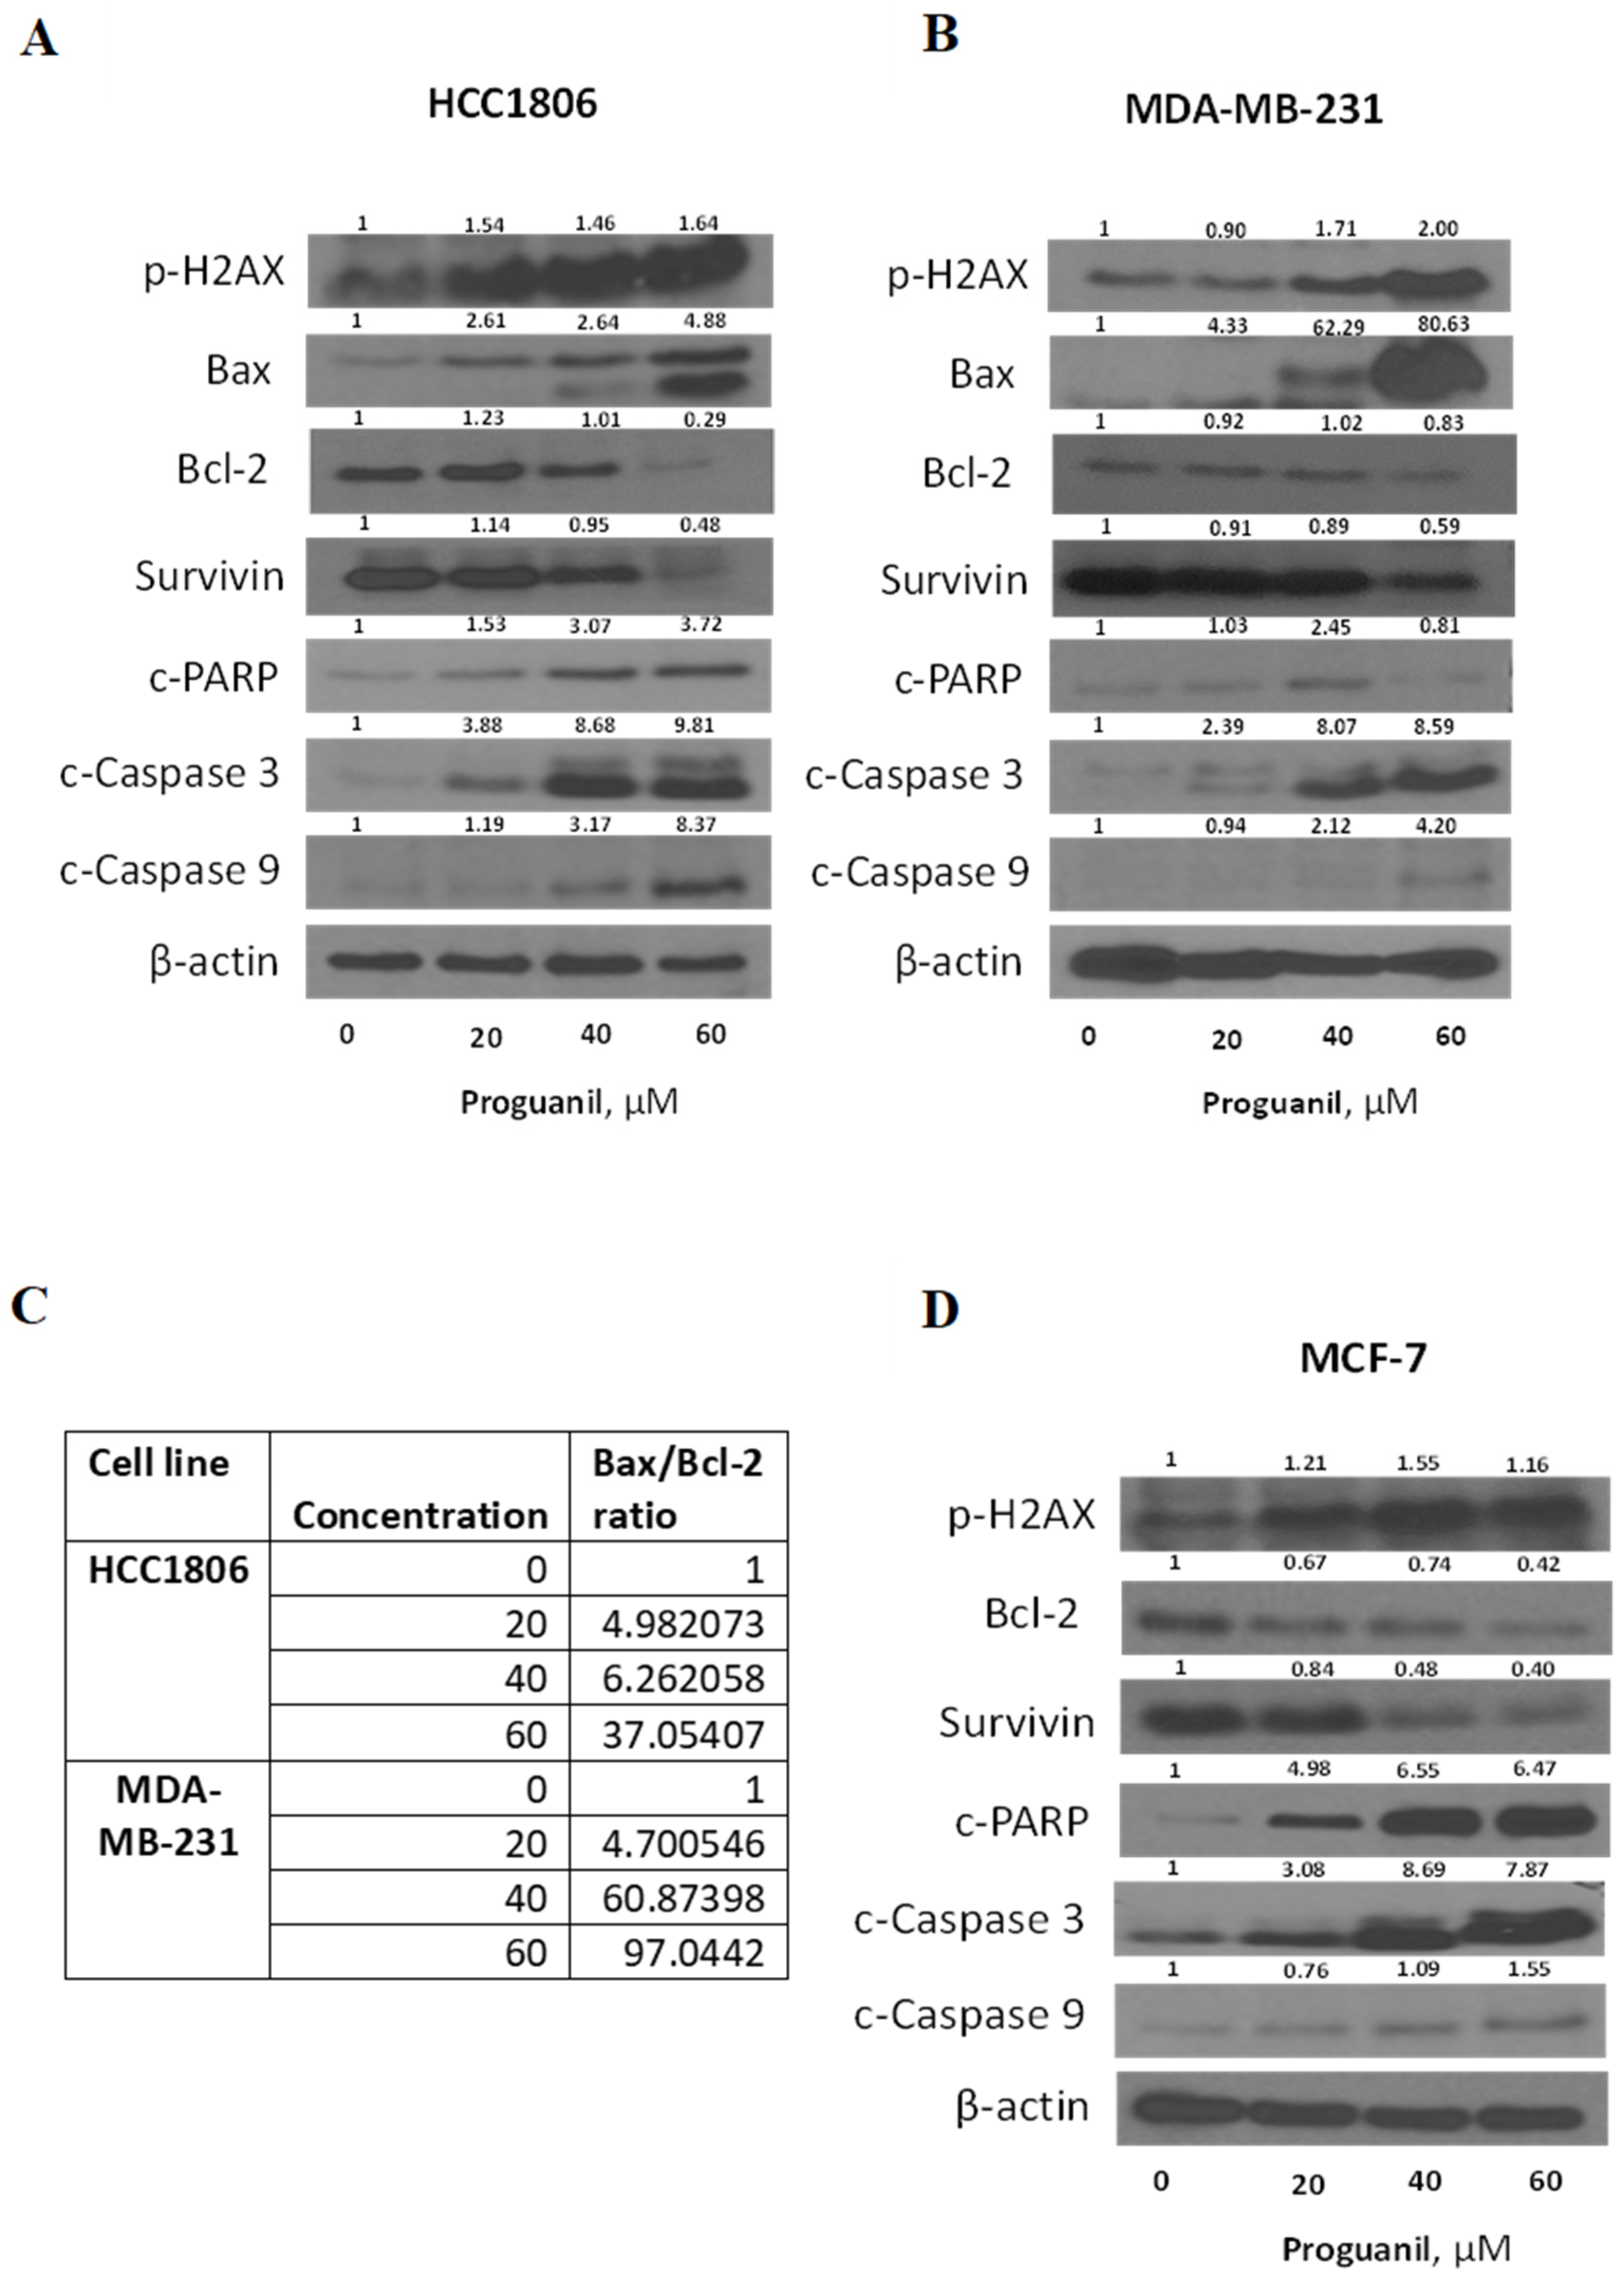
To evaluate the modulation of key signaling molecules of the mitochondrial death pathway after proguanil treatment, we performed western blot analyses from lysates treated with different concentrations of proguanil in HCC1806, MDA-MB-231, and MCF-7 cells. Our results revealed that proguanil treatment for 72 hours in HCC1806 cells resulted in increased expression of p-H2AX, which is a DNA damage marker (Figure 6A). In addition, we also observed increased expression of Bax, an apoptosis marker, and decreased expression of Bcl-2 and survivin, which are involved in apoptosis inhibition, in response to proguanil treatment (Figure 6A). Moreover, proguanil treatment caused significant activation of caspase-3, caspase-9, and PARP as evident by their cleavage (Figure 6A). Similar results were obtained in MCF-7 and MDA-MB-231 cells following exposure to proguanil for 72 hours (Figure 6B-C). As the concentration of proguanil increases, the ratio of Bax to Bcl-2 also increased, indicating an increase in apoptosis Figure 6D. Collectively these results suggest that proguanil activates the intrinsic mitochondrial death pathway in breast cancer cells.

3.6. Proguanil inhibits oxidative phosphorylation of breast cancer cells

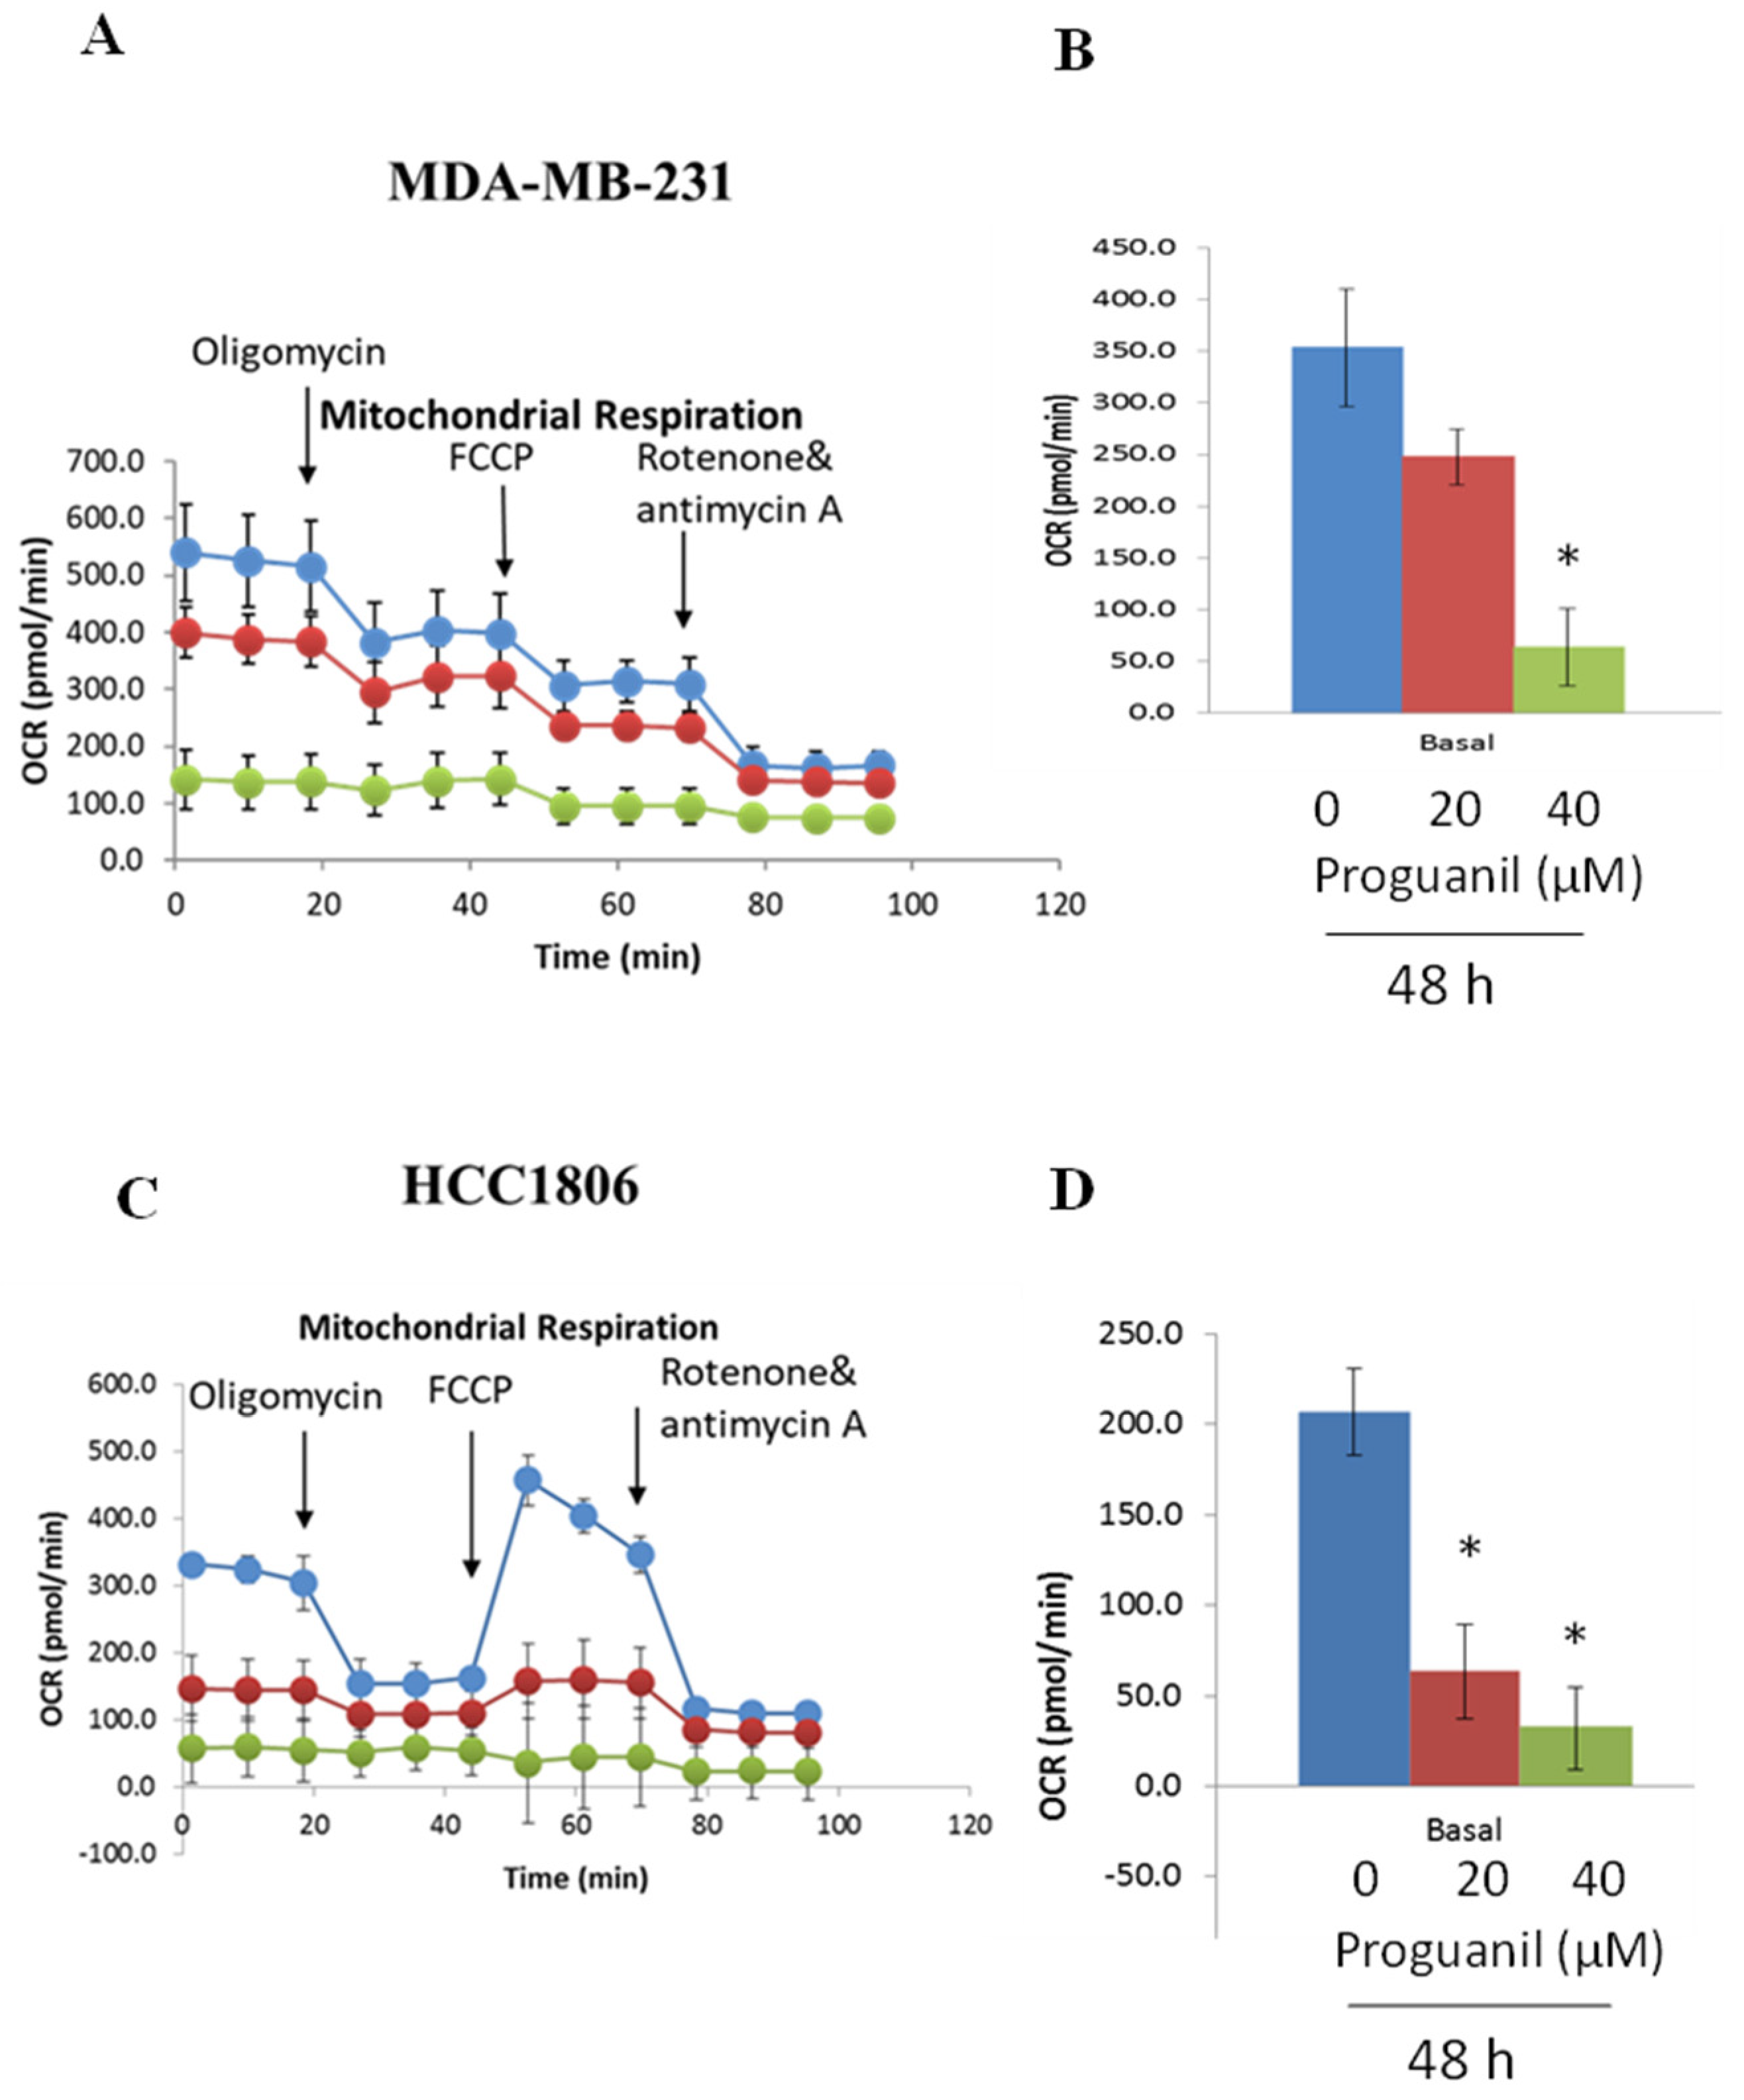
Since proguanil activates the mitochondrial death pathway after ROS generation and disruption of the mitochondrial membrane, we wanted to evaluate the effect of proguanil on the mitochondrial respiration of cancer cells. The metabolic profile of HCC1806 and MDA-MB-231 cells treated with increasing concentrations of proguanil was assessed using the Seahorse XF-e24 analyzer at 48 hours. Our results showed that proguanil treatment markedly inhibited the OCR of both MDA-MB-231 and HCC1806 cell lines in a concentration-dependent manner (Figure 7). These results suggest that proguanil inhibits oxidative phosphorylation of breast cancer cells.

3.7. Proguanil inhibits the growth of orthotopically implanted 4T1 breast tumors

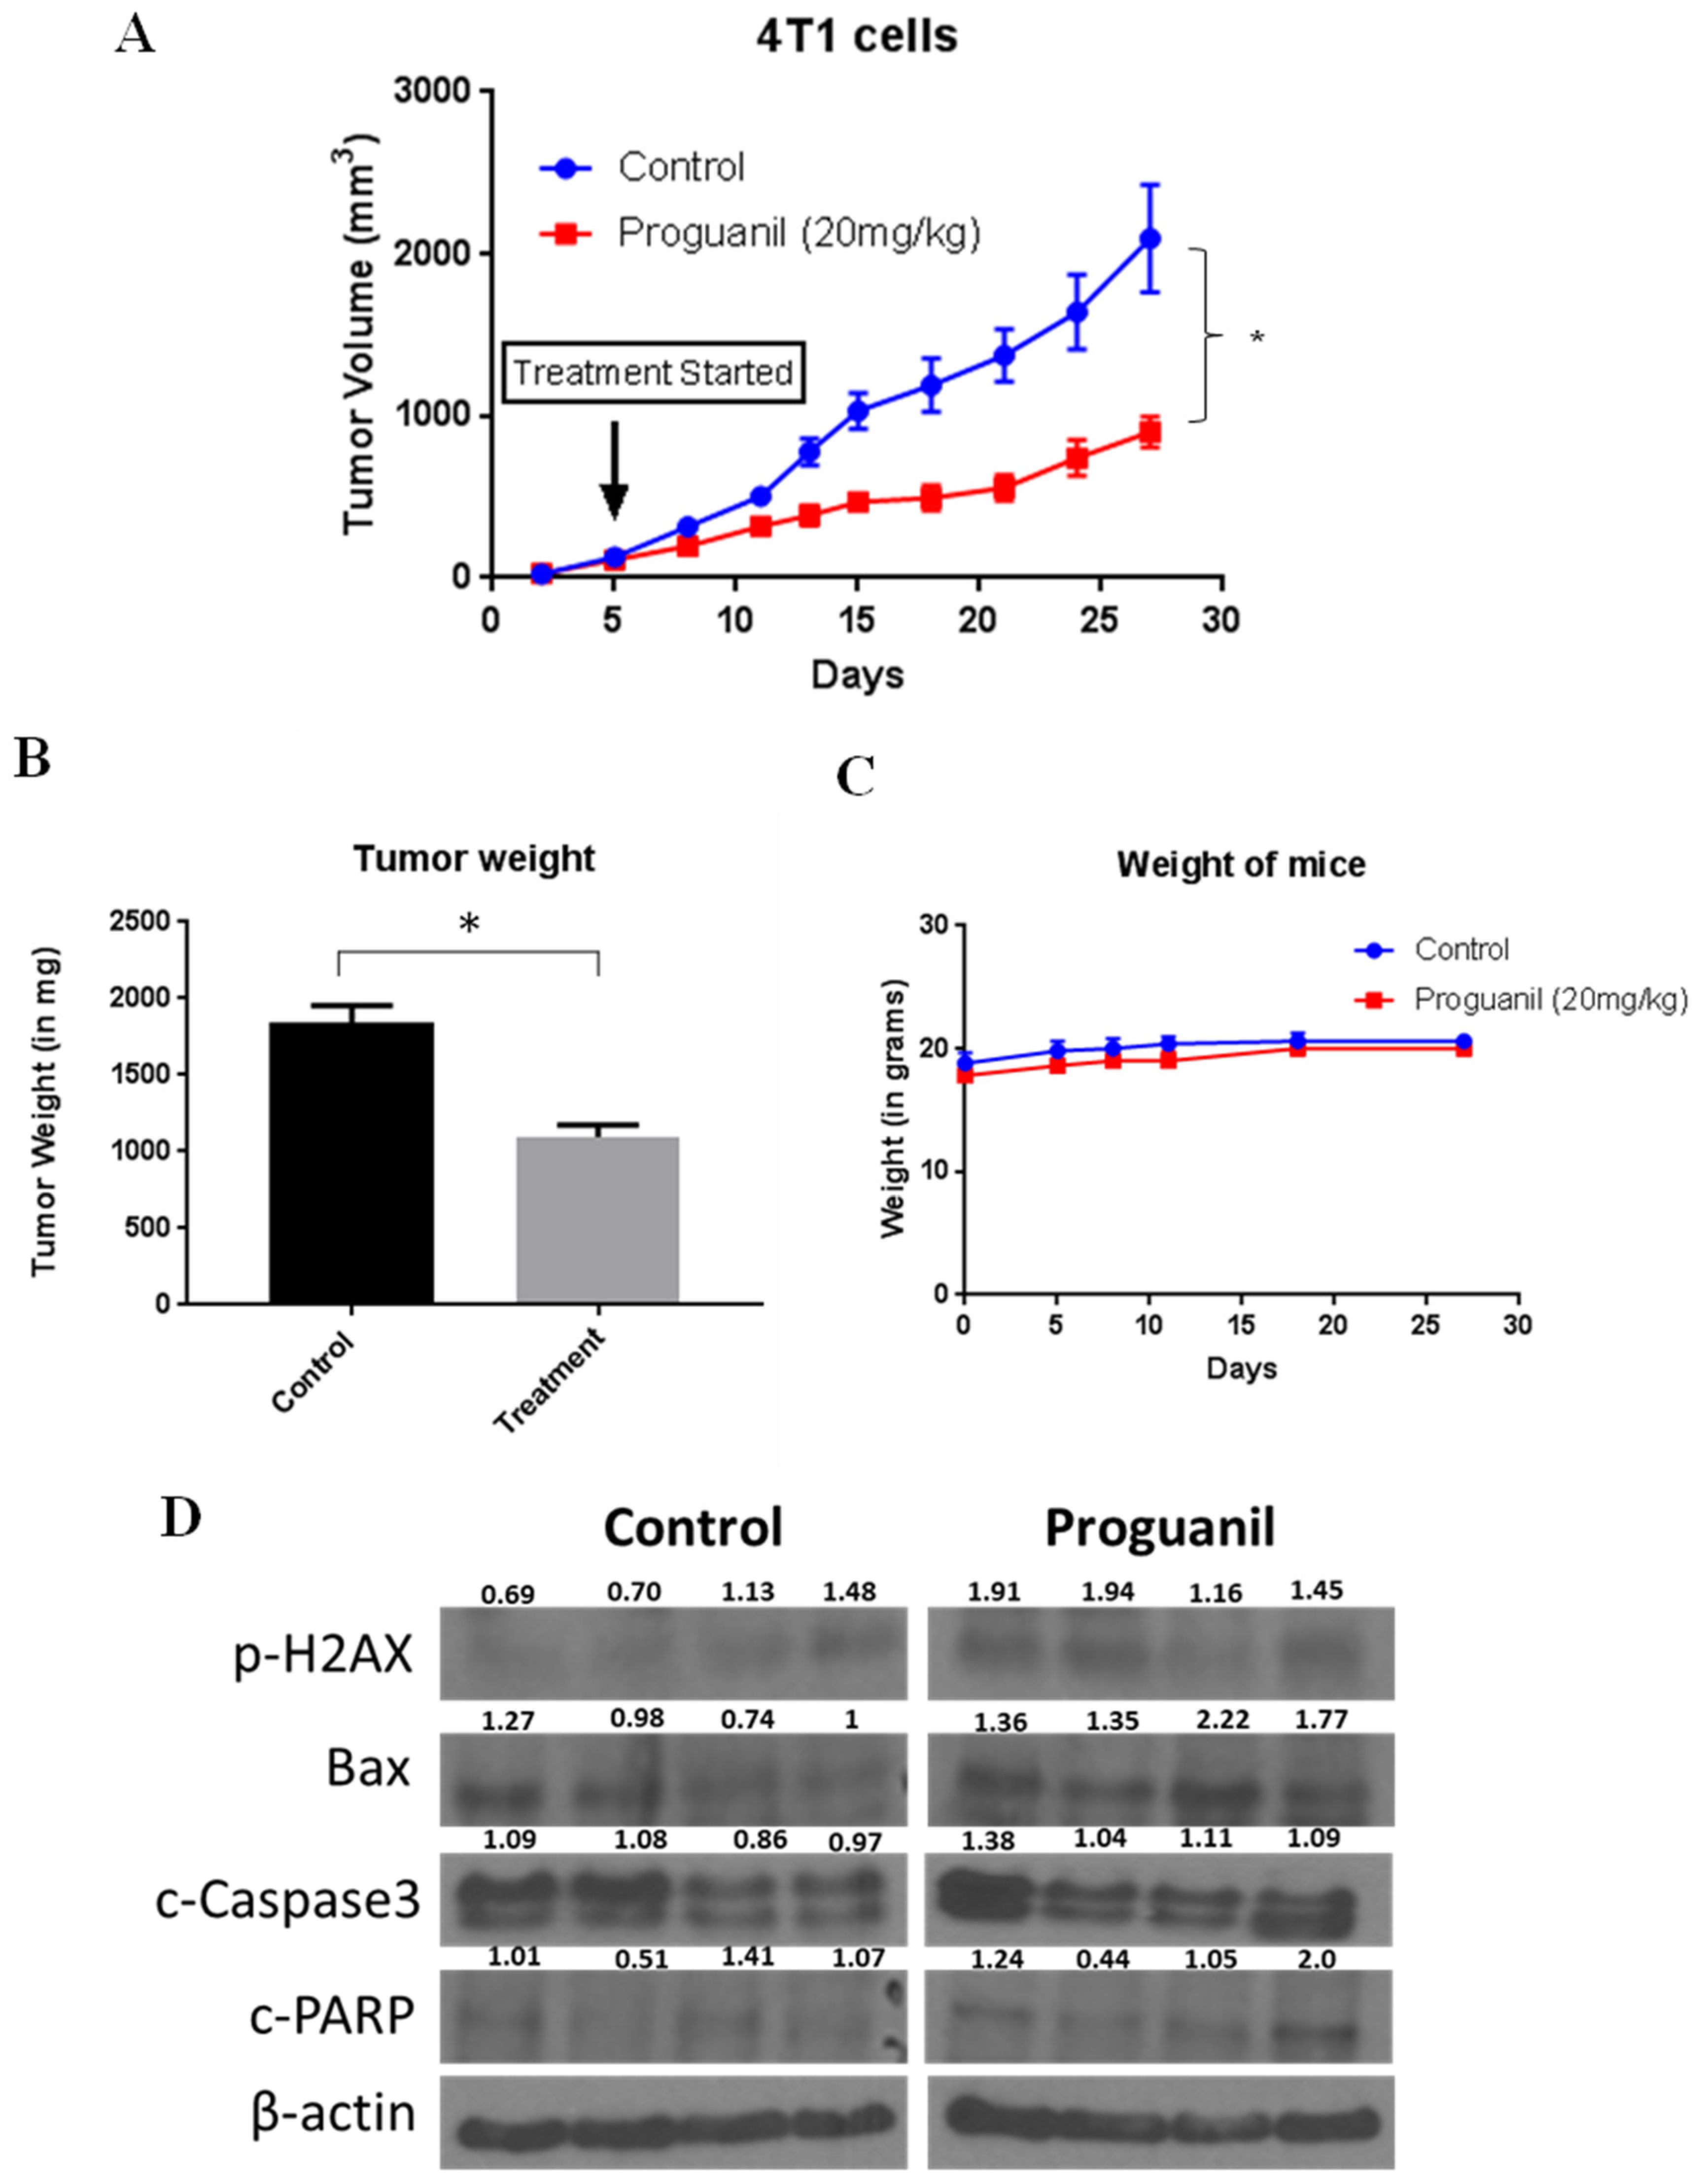
Thus far, we observed that proguanil was able to suppress the cell viability of various breast cancer cells by inducing apoptosis and ROS generation. However, the results achieved in cultured cells, should be verified in a preclinical model. Therefore, to evaluate the efficacy of proguanil in vivo, a highly aggressive 4T1 cell line was used. 4T1 cells were implanted in the 3rd mammary fat pad of female Balb/c mice and once the tumor was established, mice were administered with 20mg/kg proguanil daily by oral gavage. Our results showed that the growth rate of 4T1 tumors was significantly inhibited after proguanil treatment as compared to the vehicle treated mice (Figure 9A). At the day of termination, tumors from the control and proguanil-treated mice were excised and weighed. The average net weight of the tumors from proguanil-treated mice was significantly less when compared with the control group (Figure 8B). The average body weight of control and proguanil-treated mice did not change throughout the study, suggesting no obvious toxicity at this dose (Figure 8C). Western blot analyses from the control and treated tumors showed that proguanil-treated tumors increased levels of p-H2AX, Bax, c-PARP, and c-caspase3 (Figure 8D).

4. Discussion

Proguanil and other biguanide molecules are positively charged molecules which accumulate in the mitochondrial matrix at concentrations that are 1,000-fold higher than extracellular concentrations. The concentration depends on the presence of transporters and also the cell and mitochondrial membrane potential [32,34]. There is little information about the transport of proguanil into the mitochondria, but in yeast and malaria parasites proguanil most likely accesses the mitochondria. Its synergy with atovaquone, which specifically targets the bc1 complex, indicates mitochondria to be the location of the proguanil’s activity [32].
There is now considerable evidence supporting the antineoplastic role of anti-parasitic drugs [33,44,45,46,47,48] but only a few studies have recognized the cytotoxic effect of proguanil and tried to unveil its mechanism of action [36,37,38,39]. Some studies found that the drug seems unable to access the mitochondrial matrix of mammalian cells, although it’s an effective inhibitor of isolated Complex I [31,34,35]. In contrast, the other study suggests that proguanil may exert anticancer effects through reduction of tumor hypoxia, induction of oxidative stress and mitochondrial dysfunction, and causing DNA damage [48].
Our results showed that proguanil exerts strong cytotoxic effects not only in immortalized breast cancer cells but also in several patient derived cell lines. Our results further indicate that the antineoplastic effects of proguanil were associated with the increased production of ROS in the mitochondria, disruption of oxidative phosphorylation, and consequentially DNA damage and apoptosis.
Mitochondria have been recognized as the main intracellular source of ROS. Under normal physiological conditions, for mitochondria that are actively making ATP, the rate of ROS generation is lower. This is also due to the adequate levels of antioxidants that avert ROS accumulation and oxidative damage [49]. Numerous studies reported that ROS plays an important role in the initiation and progression of cancer [10,16,17,18,19,20,21], as well as its suppression [11,13,14,15,22,50,51,52].This implies that cancer cells evolved by fine-tuning levels of ROS and their redox environments. Thus, by disrupting this fine balance, cancer cells can be destroyed by the same mechanism which aids their survival.
The dual effect of ROS is also evident in breast cancer. The role of ROS on breast cancer etiology and progression is described by various studies [16,17]. At the same time, many chemotherapeutic and radiotherapeutic agents used for breast cancer treatment work by augmenting ROS stress in the cells. Therefore, targeting ROS homeostasis in breast cancer has been proven as an effective strategy.
Our results indicated that proguanil caused increased ROS generation that was about 2-3-fold higher compared to control in HCC1806 and MDA-MB-231 cells when measured by flow cytometry. In contrast to other studies which show proguanil does not inhibit mitochondrial respiration, our results showed a significant reduction in OCR and ATP production rate after proguanil treatment. In addition, the fluorescence microscopy confirmed the mitochondrial origin of ROS (overlap of MitoTracker Green and MitoSOX Red fluorescence) while quantification of MitoSOX Red fluorescence showed a significant increase of O2early after treatment. The divergence in findings between our and other studies could be due to the differences in the proguanil concentrations and the duration of the treatment [35].
Our study shows that proguanil exerts potent anticancer activity in vivo as well. Size reductions of animal breast tumors and increase in apoptotic markers were observed by oral administration of 20 mg proguanil/kg everyday. 4T1 tumors are highly aggressive, metastatic and represent stage IV of breast cancer [53]. We observed that proguanil suppressed 4T1 breast tumor growth by 55% in female Balb/c mice. Western blot analysis of the tumors taken from proguanil-treated mice showed increased apoptosis, which was related to the increased expression of Bax and p-H2AX.
Proguanil is given at a dose of 100-400 mg for the treatment of malaria. The dose of proguanil used in this study is 20mg/kg, which, when converted to a human equivalent dose, is 1.6 mg/kg. Thus, a human equivalent dose of proguanil would be approximately 96 mg for person with body weight of 60 kg. Therefore, the dose of proguanil used in our studies for its anti-cancer effects is much lower than its anti-malarial dose used in a clinical setting.

5. Conclusions

The current study provides evidence that proguanil induces apoptosis in breast cancer cells through a mechanism that activates the mitochondrial death pathway. While the specific mechanism by which proguanil achieves this effect remains to be fully understood, the results suggest that it may be related to the generation of reactive oxygen species (ROS). Nevertheless, oral administration of proguanil remarkably suppresses the growth of breast tumors by inducing apoptosis in the tumor cells.
In conclusion, the present study provides compelling evidence to testify that proguanil is an effective in vitro and in vivo inhibitor of breast cancer cell growth, hence should be further considered for clinical investigation against breast cancer.

Author Contributions

Conception and design: N. Gupta, S.K. Srivastava; Development of methodology: N. Gupta, S.K. Srivastava; Acquisition of data: N. Gupta, Marina Curcic; Analysis and interpretation of data: N. Gupta, Marina Curcic, S.K. Srivastava; Writing, review, and/or revision of the manuscript: N. Gupta, Marina Curcic, S.K. Srivastava; Administrative, technical, or material support: S.K. Srivastava; Study supervision: S.K. Srivastava. All authors have read and agreed to the published version of the manuscript.

Funding

Authors appreciate the funding from Dodge Jones Foundation, and James Buddy Davidson endowment.

Institutional Review Board Statement

Human subjects were not used in this study. All the preclinical investigations involving animals were carried out in line with the ethical standards and according to the approved protocol by Institutional Animal Care and Use Committee (IACUC).

Data Availability Statement

Not applicable.

Acknowledgments

Authors kindly thank Dr. Patrick Reynolds, for providing patient-derived breast cancer cells.

Conflicts of Interest

The authors declare no conflict of interest.

List of abbreviations

  • 4T1: murine breast cancer cell line
  • ATCC: American Type Culture Collection
  • Bax: Bcl-2-associated X protein
  • bcl-2: B-cell lymphoma 2 protein
  • Balb/c: Balb/c mice
  • DCFDA: 6-carboxy-2, 7-dichlorodihydrofluorescein diacetate
  • DHE: dihydroethidium
  • DMEM: Dulbecco's Modified Eagle Medium
  • FBS: Fetal Bovine Serum
  • HCC1806: human breast carcinoma cell line
  • ITS: Insulin-Transferrin-Selenous acid
  • MCF-7: human breast carcinoma cell line
  • MDA-MB-231: human breast carcinoma cell line
  • PSN: Penicillin-Streptomycin-Neomycin
  • SRB: Sulphorhodamine B assay
  • STR: Short Tandem Repeats
  • TMRM: tetramethyl rhodamine
  • TX-BR: Patient-derived cells
  • ROS: Reactive Oxygen Species”

References

  1. Sun, Y.S., et al., Risk Factors and Preventions of Breast Cancer. Int J Biol Sci, 2017. 13(11): p. 1387-1397. [CrossRef]
  2. Kabir, S. and M.A. Ahad. Parametric Study of Malignant Female Breast Tumor Size, Position and Orientation on EIM Parameters. in 2020 SoutheastCon. 2020. IEEE. [CrossRef]
  3. Pantziarka, P., et al., The Repurposing Drugs in Oncology (ReDO) Project. Ecancermedicalscience, 2014. 8: p. 442. [CrossRef]
  4. de Sá Junior, P.L., et al., The roles of ROS in cancer heterogeneity and therapy. Oxidative medicine and cellular longevity, 2017. 2017. [CrossRef]
  5. Gupta, S.C., et al., Upsides and downsides of reactive oxygen species for cancer: the roles of reactive oxygen species in tumorigenesis, prevention, and therapy. Antioxidants & redox signaling, 2012. 16(11): p. 1295-1322. [CrossRef]
  6. Yang, H., et al., The role of cellular reactive oxygen species in cancer chemotherapy. Journal of Experimental & Clinical Cancer Research, 2018. 37(1): p. 1-10. [CrossRef]
  7. Ray, P.D., B.-W. Huang, and Y. Tsuji, Reactive oxygen species (ROS) homeostasis and redox regulation in cellular signaling. Cellular signalling, 2012. 24(5): p. 981-990. [CrossRef]
  8. Mügge, A., The role of reactive oxygen species in atherosclerosis. Zeitschrift fur Kardiologie, 1998. 87(11): p. 851-864. [CrossRef]
  9. Chio, I.I.C. and D.A. Tuveson, ROS in cancer: the burning question. Trends in molecular medicine, 2017. 23(5): p. 411-429. [CrossRef]
  10. Ishikawa, K., et al., ROS-generating mitochondrial DNA mutations can regulate tumor cell metastasis. Science, 2008. 320(5876): p. 661-664. [CrossRef]
  11. Trachootham, D., J. Alexandre, and P. Huang, Targeting cancer cells by ROS-mediated mechanisms: a radical therapeutic approach? Nature reviews Drug discovery, 2009. 8(7): p. 579-591. [CrossRef]
  12. Wu, W.-S., The signaling mechanism of ROS in tumor progression. Cancer and Metastasis Reviews, 2006. 25(4): p. 695-705. [CrossRef]
  13. Wang, J. and J. Yi, Cancer cell killing via ROS: to increase or decrease, that is the question. Cancer biology & therapy, 2008. 7(12): p. 1875-1884. [CrossRef]
  14. Toler, S.M., D. Noe, and A. Sharma, Selective enhancement of cellular oxidative stress by chloroquine: implications for the treatment of glioblastoma multiforme. Neurosurgical focus, 2006. 21(6): p. 1-4. [CrossRef]
  15. Renschler, M.F., The emerging role of reactive oxygen species in cancer therapy. European Journal of Cancer, 2004. 40(13): p. 1934-1940. [CrossRef]
  16. Hecht, F., et al., The role of oxidative stress on breast cancer development and therapy. Tumor biology, 2016. 37(4): p. 4281-4291. [CrossRef]
  17. Gurer-Orhan, H., et al., The Role of Oxidative Stress Modulators in Breast Cancer. Curr Med Chem, 2018. 25(33): p. 4084-4101. [CrossRef]
  18. Brown, N.S. and R. Bicknell, Hypoxia and oxidative stress in breast cancer Oxidative stress-its effects on the growth, metastatic potential and response to therapy of breast cancer. Breast cancer research, 2001. 3(5): p. 1-5. [CrossRef]
  19. WANG, X., et al., The cellular response to oxidative stress: influences of mitogen-activated protein kinase signalling pathways on cell survival. Biochemical Journal, 1998. 333(2): p. 291-300. [CrossRef]
  20. Wiseman, H. and B. Halliwell, Damage to DNA by reactive oxygen and nitrogen species: role in inflammatory disease and progression to cancer. Biochemical Journal, 1996. 313(Pt 1): p. 17. [CrossRef]
  21. Yokomizo, A., et al., Cellular levels of thioredoxin associated with drug sensitivity to cisplatin, mitomycin C, doxorubicin, and etoposide. Cancer Research, 1995. 55(19): p. 4293-4296.
  22. Johar, R., et al., Role of reactive oxygen species in estrogen dependant breast cancer complication. Anti-Cancer Agents in Medicinal Chemistry (Formerly Current Medicinal Chemistry-Anti-Cancer Agents), 2016. 16(2): p. 190-199. [CrossRef]
  23. Jones, R., Jr., T.N. Pullman, and et al., The therapeutic effectiveness of large doses of paludrine in acute attacks of sporozoite-induced vivax malaria, Chesson strain. J Clin Invest, 1948. 27(3 Pt1): p. 51-5. [CrossRef]
  24. Kaneko, A., et al., Intrinsic efficacy of proguanil against falciparum and vivax malaria independent of the metabolite cycloguanil. J Infect Dis, 1999. 179(4): p. 974-9. [CrossRef]
  25. Crowther, A. and A. Levi, Proguanil—the isolation of a metabolite with high antimalarial activity. British Journal of Pharmacology and Chemotherapy, 1953. 8(1): p. 93. [CrossRef]
  26. Fidock, D.A., T. Nomura, and T.E. Wellems, Cycloguanil and its parent compound proguanil demonstrate distinct activities against Plasmodium falciparum malaria parasites transformed with human dihydrofolate reductase. Mol Pharmacol, 1998. 54(6): p. 1140-7. [CrossRef]
  27. Skinner-Adams, T.S., et al., Cyclization-blocked proguanil as a strategy to improve the antimalarial activity of atovaquone. Communications biology, 2019. 2(1): p. 1-14. [CrossRef]
  28. Looareesuwan, S., et al., Malarone (atovaquone and proguanil hydrochloride): a review of its clinical development for treatment of malaria. Malarone Clinical Trials Study Group. The American journal of tropical medicine and hygiene, 1999. 60(4): p. 533-541. [CrossRef]
  29. Marra, F., J.R. Salzman, and M.H. Ensom, Atovaquone–proguanil for prophylaxis and treatment of malaria. Annals of Pharmacotherapy, 2003. 37(9): p. 1266-1275. [CrossRef]
  30. Boggild, A.K., et al., Atovaquone-proguanil: report from the CDC expert meeting on malaria chemoprophylaxis (II). The American journal of tropical medicine and hygiene, 2007. 76(2): p. 208-223. [CrossRef]
  31. Srivastava, I.K. and A.B. Vaidya, A mechanism for the synergistic antimalarial action of atovaquone and proguanil. Antimicrobial agents and chemotherapy, 1999. 43(6): p. 1334-1339. [CrossRef]
  32. Mounkoro, P., T. Michel, and B. Meunier, Revisiting the mode of action of the antimalarial proguanil using the yeast model. Biochem Biophys Res Commun, 2021. 534: p. 94-98. [CrossRef]
  33. Gupta, N. and S.K. Srivastava, Atovaquone: An Antiprotozoal Drug Suppresses Primary and Resistant Breast Tumor Growth by Inhibiting HER2/beta-Catenin Signaling. Mol Cancer Ther, 2019. 18(10): p. 1708-1720. [CrossRef]
  34. Bridges, H.R., et al., Effects of metformin and other biguanides on oxidative phosphorylation in mitochondria. Biochem J, 2014. 462(3): p. 475-87. [CrossRef]
  35. Bridges, H.R., et al., Molecular features of biguanides required for targeting of mitochondrial respiratory complex I and activation of AMP-kinase. BMC biology, 2016. 14(1): p. 1-11. [CrossRef]
  36. Lea, M.A. and H. Kim, Effects of Biguanides on Growth and Glycolysis of Bladder and Colon Cancer Cells. Anticancer research, 2018. 38(9): p. 5003-5011. [CrossRef]
  37. Wu, Y., et al., Proguanil synergistically sensitizes ovarian cancer cells to olaparib by increasing DNA damage and inducing apoptosis. International journal of medical sciences, 2022. 19(2): p. 233. [CrossRef]
  38. Barbieri, F., et al., Inhibition of Chloride Intracellular Channel 1 (CLIC1) as Biguanide Class-Effect to Impair Human Glioblastoma Stem Cell Viability. Front Pharmacol, 2018. 9: p. 899. [CrossRef]
  39. Xiao, D., et al., Inhibitory role of proguanil on the growth of bladder cancer via enhancing EGFR degradation and inhibiting its downstream signaling pathway to induce autophagy. Cell Death & Disease, 2022. 13(5): p. 1-14. [CrossRef]
  40. Scholar, E., Proguanil, in xPharm: The Comprehensive Pharmacology Reference, D.B.B. S.J. Enna, Editor. 2007. p. 1-4.
  41. Baggish, A.L. and D.R. Hill, Antiparasitic agent atovaquone. Antimicrob Agents Chemother, 2002. 46(5): p. 1163-73. [CrossRef]
  42. Verma, K., et al., AKR1C3 Inhibitor KV-37 Exhibits Antineoplastic Effects and Potentiates Enzalutamide in Combination Therapy in Prostate Adenocarcinoma CellsAKR1C3 Inhibitor for CRPC Treatment. Molecular cancer therapeutics, 2018. 17(9): p. 1833-1845. [CrossRef]
  43. Pramanik, K.C., et al., CBP-Mediated FOXO-1 Acetylation Inhibits Pancreatic Tumor Growth by Targeting SirTAcetylation of FOXO-1 by Capsaicin Causes Apoptosis. Molecular cancer therapeutics, 2014. 13(3): p. 687-698. [CrossRef]
  44. Choi, A.R., et al., Anti-malarial Drugs Primaquine and Chloroquine Have Different Sensitization Effects with Anti-mitotic Drugs in Resistant Cancer Cells. Anticancer Res, 2016. 36(4): p. 1641-8.
  45. Efferth, T., et al., The anti-malarial artesunate is also active against cancer. Int J Oncol, 2001. 18(4): p. 767-73. [CrossRef]
  46. Kim, J.H., et al., Co-treatment with the anti-malarial drugs mefloquine and primaquine highly sensitizes drug-resistant cancer cells by increasing P-gp inhibition. Biochem Biophys Res Commun, 2013. 441(3): p. 655-60. [CrossRef]
  47. Xie, F., et al., Preclinical evidence of synergism between atovaquone and chemotherapy by AMPK-dependent mitochondrial dysfunction. Eur J Pharmacol, 2021. 907: p. 174256. [CrossRef]
  48. Mudassar, F., et al., Targeting tumor hypoxia and mitochondrial metabolism with anti-parasitic drugs to improve radiation response in high-grade gliomas. J Exp Clin Cancer Res, 2020. 39(1): p. 208. [CrossRef]
  49. Chen, Q., et al., Production of reactive oxygen species by mitochondria: central role of complex III. J Biol Chem, 2003. 278(38): p. 36027-31. [CrossRef]
  50. Pramanik, K.C., S.R. Boreddy, and S.K. Srivastava, Role of mitochondrial electron transport chain complexes in capsaicin mediated oxidative stress leading to apoptosis in pancreatic cancer cells. PloS one, 2011. 6(5): p. e20151. [CrossRef]
  51. Wen, J.-J. and N.J. Garg, Mitochondrial complex III defects contribute to inefficient respiration and ATP synthesis in the myocardium of Trypanosoma cruzi–infected mice. Antioxidants & redox signaling, 2010. 12(1): p. 27-37. [CrossRef]
  52. Murphy, M.P., How mitochondria produce reactive oxygen species. Biochemical journal, 2009. 417(1): p. 1-13. [CrossRef]
  53. Tao, K., et al., Imagable 4T1 model for the study of late stage breast cancer. BMC cancer, 2008. 8(1): p. 1-19. [CrossRef]
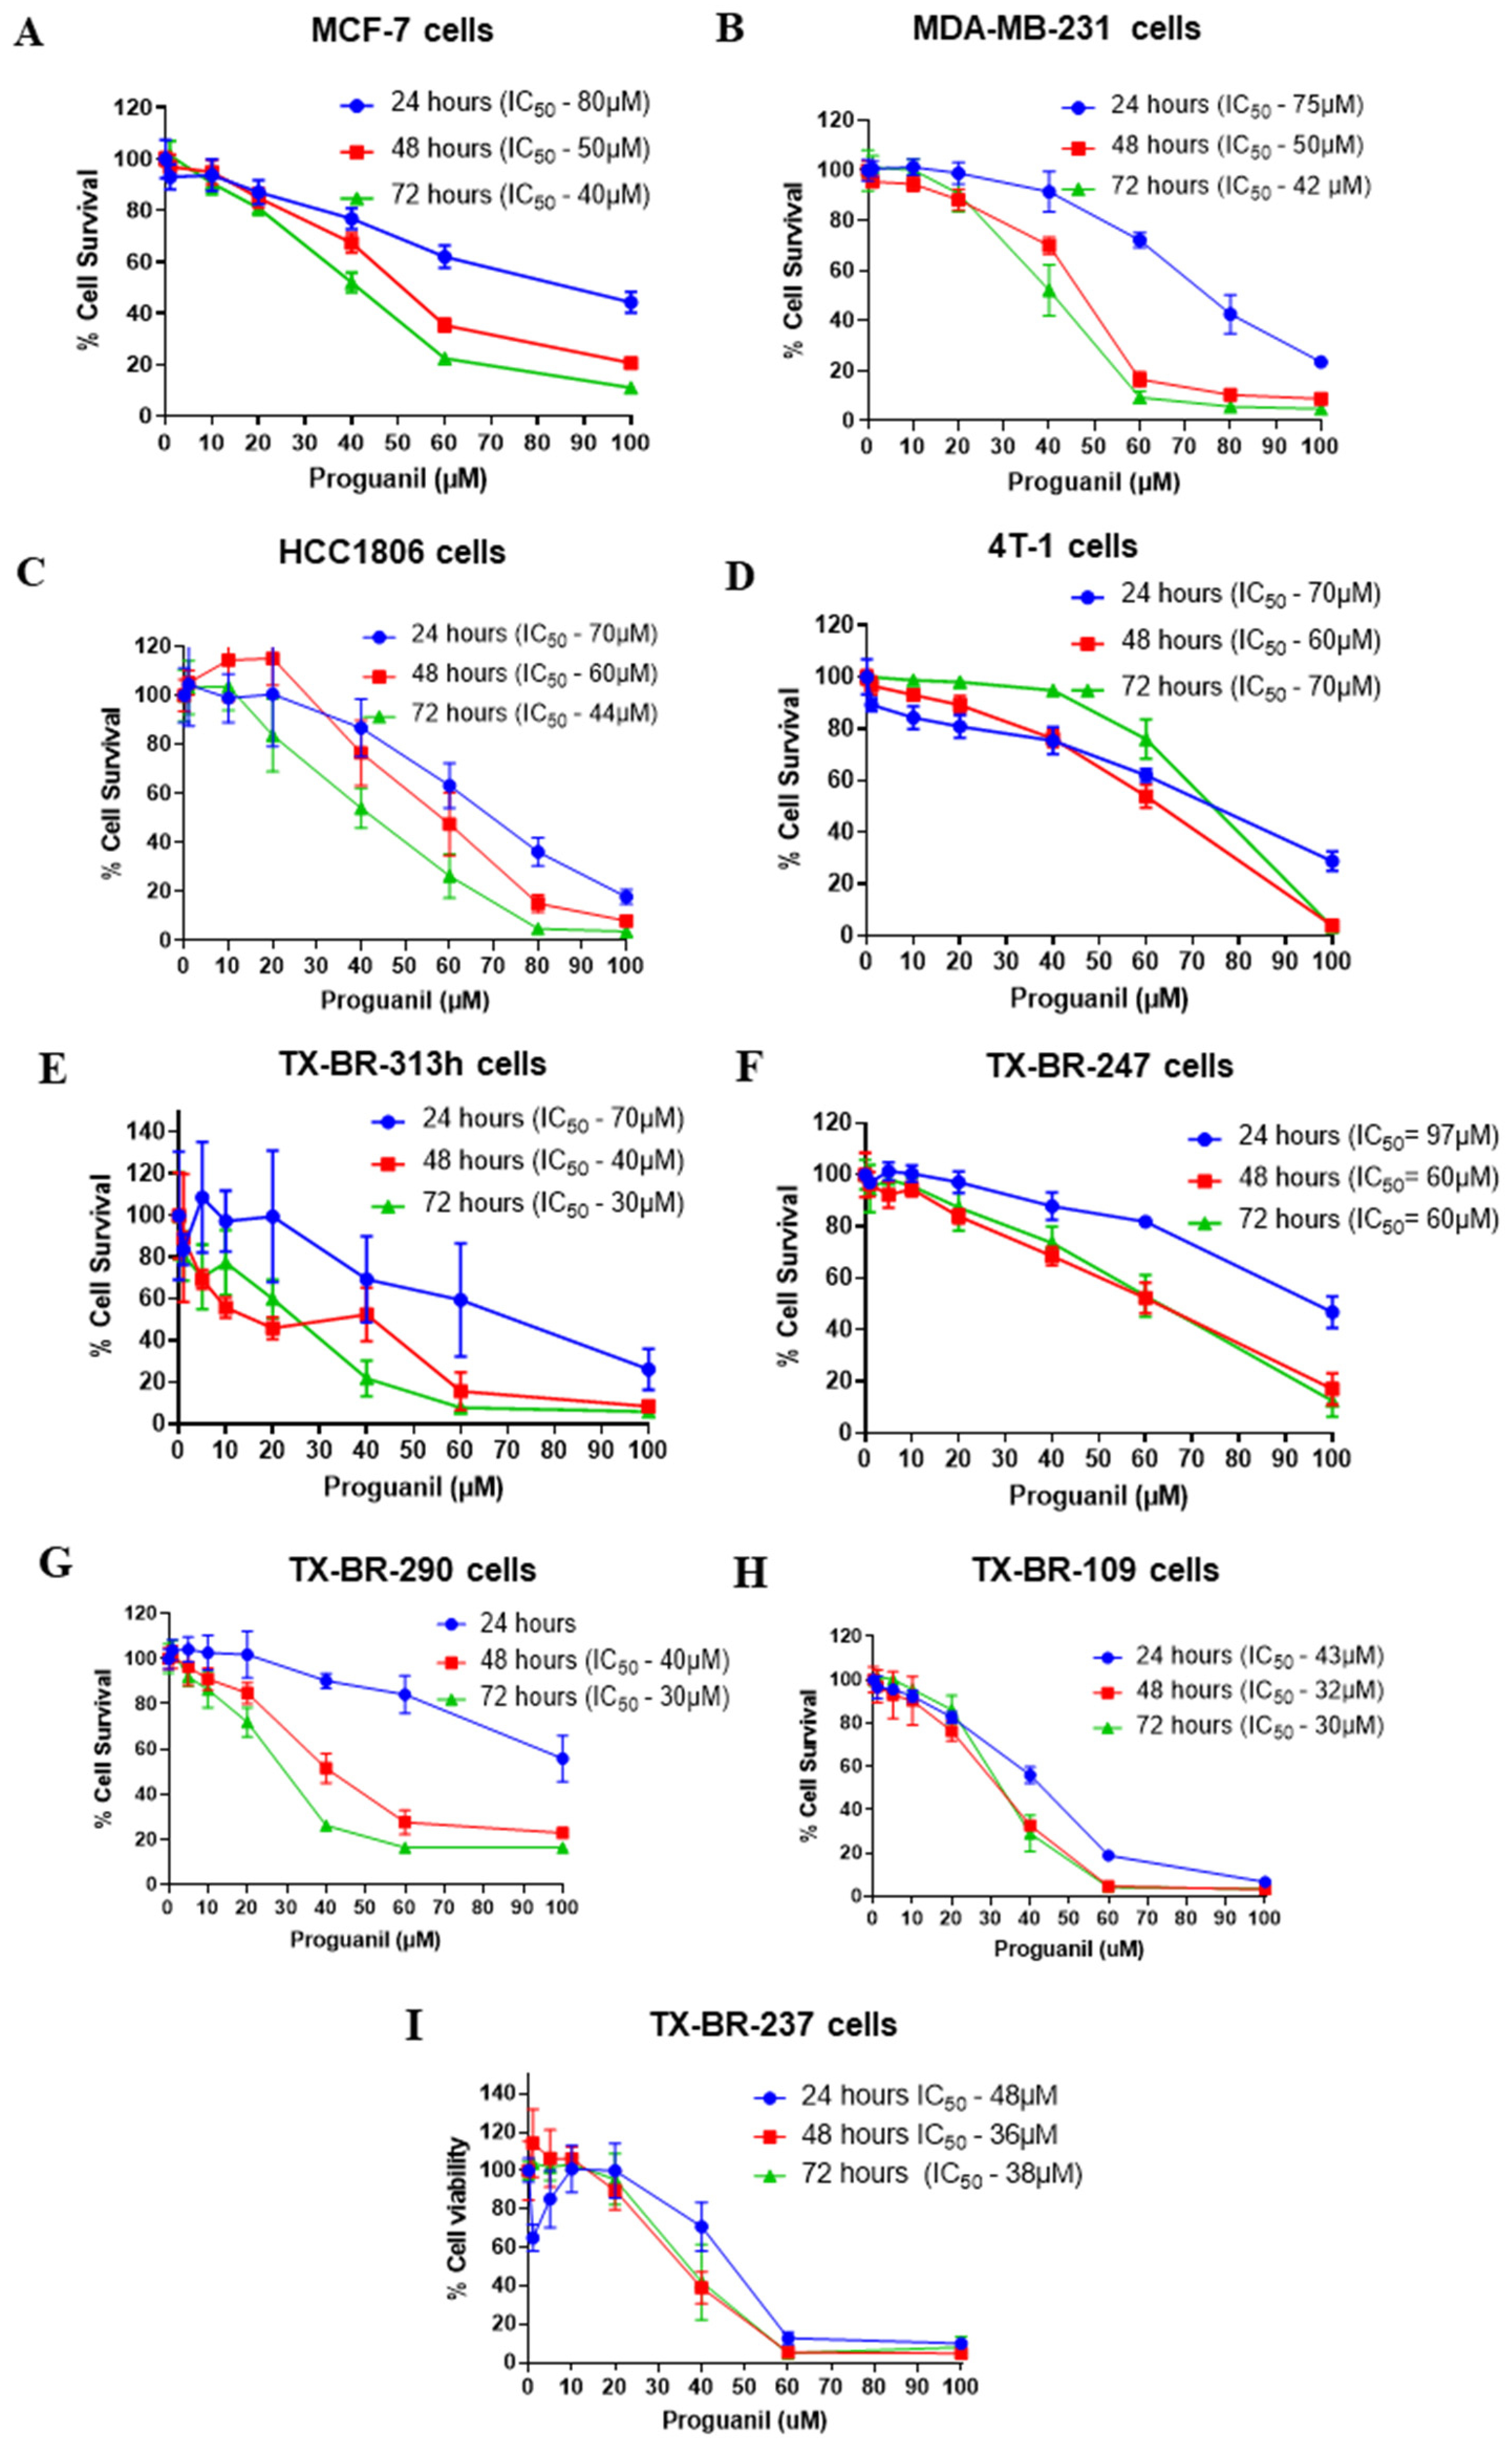
Figure 1. Anti-proliferative effects of proguanil in breast cancer cell lines and patient derived breast cancer cells. A) MCF-7, B) MDA-MB-231, C) HCC1806, D) 4T1, E) TX-BR-313h, F)TX-BR-247, G) TX-BR-290, H) TX-BR-109, and I) TX-BR-237. The cells were treated with increasing concentrations of proguanil for 24, 48 and 72h. Cell proliferation was measured by Sulphorhodamine B assay. The experiments were repeated at least three times with 8 replicates in each experiment.
Preprints 91857 g001
Figure 2. Apoptosis-inducing effects of proguanil in breast cancer cell lines. A) HCC1806, B) MDA-MB-231, C) MCF-7, D) 4T1 cells were treated with 20-60 μM proguanil for 72 h. Apoptotic cells were determined by Annexin V/PI assay using a flow cytometer. Each experiment was performed in triplicate (n=3).
Preprints 91857 g002
Figure 3. Effect of proguanil on the generation of reactive oxygen species (ROS). A) A time dependent study of ROS in MCF-7 cell line, B) Effects of proguanil on the generation of ROS in MDA-MB-231, and C)) HCC1806. The cells were treated with proguanil for 48 or 72 hours and analyzed for DCF and HE fluorescence (ROS generation) by flow cytometer upon staining the cells with DCFDA and DHE. Results are shown as the mean ± SD (n = 3).
Preprints 91857 g003
Figure 4. Proguanil induces increased superoxide production in mitochondria Fluorescence microscopy on HCC1806 cells performed using MitoTracker Green and MitoSOX Red stains. Fluorescence images from about 100 cells per coverslip were obtained using Nikon Eclipse TE2000-E confocal microscope and analyzed using NIS-elements AR analysis 4.60.00 64-bit and GraphPad Prism 9 software.
Preprints 91857 g004
Figure 5. Effect of proguanil on mitochondrial membrane potential. Fold change with TMRM fluorescence in A) MDA-MB-231 and B) HCC1806 cell cultures treated with 40 or 60 μM proguanil for the indicated time periods. Data are mean ± S.E. (n = 3).
Preprints 91857 g005
Figure 6. Proguanil activates the intrinsic cell death pathway. Western blot results for A) HCC1806, B) MDA-MB-231, C) Bax/Bcl-2 ratio for cell lines MDA-MB-231 and HCC1806, D) MCF-7. The cells were treated with 20-60 μM proguanil for 72 hours. Western blot analyses showing the immunoblots for p-H2AX, bax, bcl-2, survivin, cleaved fragments of caspase-9 and caspase-3, and PARP using appropriate antibodies. Blots were stripped and re-probed for actin to ensure equal protein loading. These experiments were performed 2–3 times independently, with similar results obtained in each experiment.
Preprints 91857 g006
Figure 7. Proguanil treatment inhibits the mitochondrial respiration of MDA-MB-231(A,B) and HCC1806 (C,D) breast cancer cells. The metabolic profile of breast cancer cells monolayers treated with proguanil (20μM and 40μM) was assessed using the Seahorse XF-e24 analyzer. The oxygen consumption rate of control and proguanil treated cells was significantly different as per student t-test (P<0.05).
Preprints 91857 g007
Figure 8. In vivo antitumor activity of proguanil in an orthotopic breast cancer model. A) Tumor growth curve of 4T1 tumors from control and proguanil treated mice. Values were plotted as mean ± SEM. B) Average tumor weight obtained from control and proguanil-treated mice. C) Weight of the mice during the study. D) 4T1 tumors were minced, lysed, and analyzed for p-H2AX, Bax, c-caspase-3 and c-PARP. Each band represents a tumor from an individual mouse. Statistically significantly different compared with control as analyzed by student’s t-test (p<0.05).
Preprints 91857 g008
Disclaimer/Publisher’s Note: The statements, opinions and data contained in all publications are solely those of the individual author(s) and contributor(s) and not of MDPI and/or the editor(s). MDPI and/or the editor(s) disclaim responsibility for any injury to people or property resulting from any ideas, methods, instructions or products referred to in the content.
Copyright: This open access article is published under a Creative Commons CC BY 4.0 license, which permit the free download, distribution, and reuse, provided that the author and preprint are cited in any reuse.
Prerpints.org logo

Preprints.org is a free preprint server supported by MDPI in Basel, Switzerland.

Subscribe

© 2024 MDPI (Basel, Switzerland) unless otherwise stated