Submitted:
30 November 2023
Posted:
01 December 2023
You are already at the latest version
Abstract
Keywords:
1. Introduction
2. Samples obtaining and characterization
- -
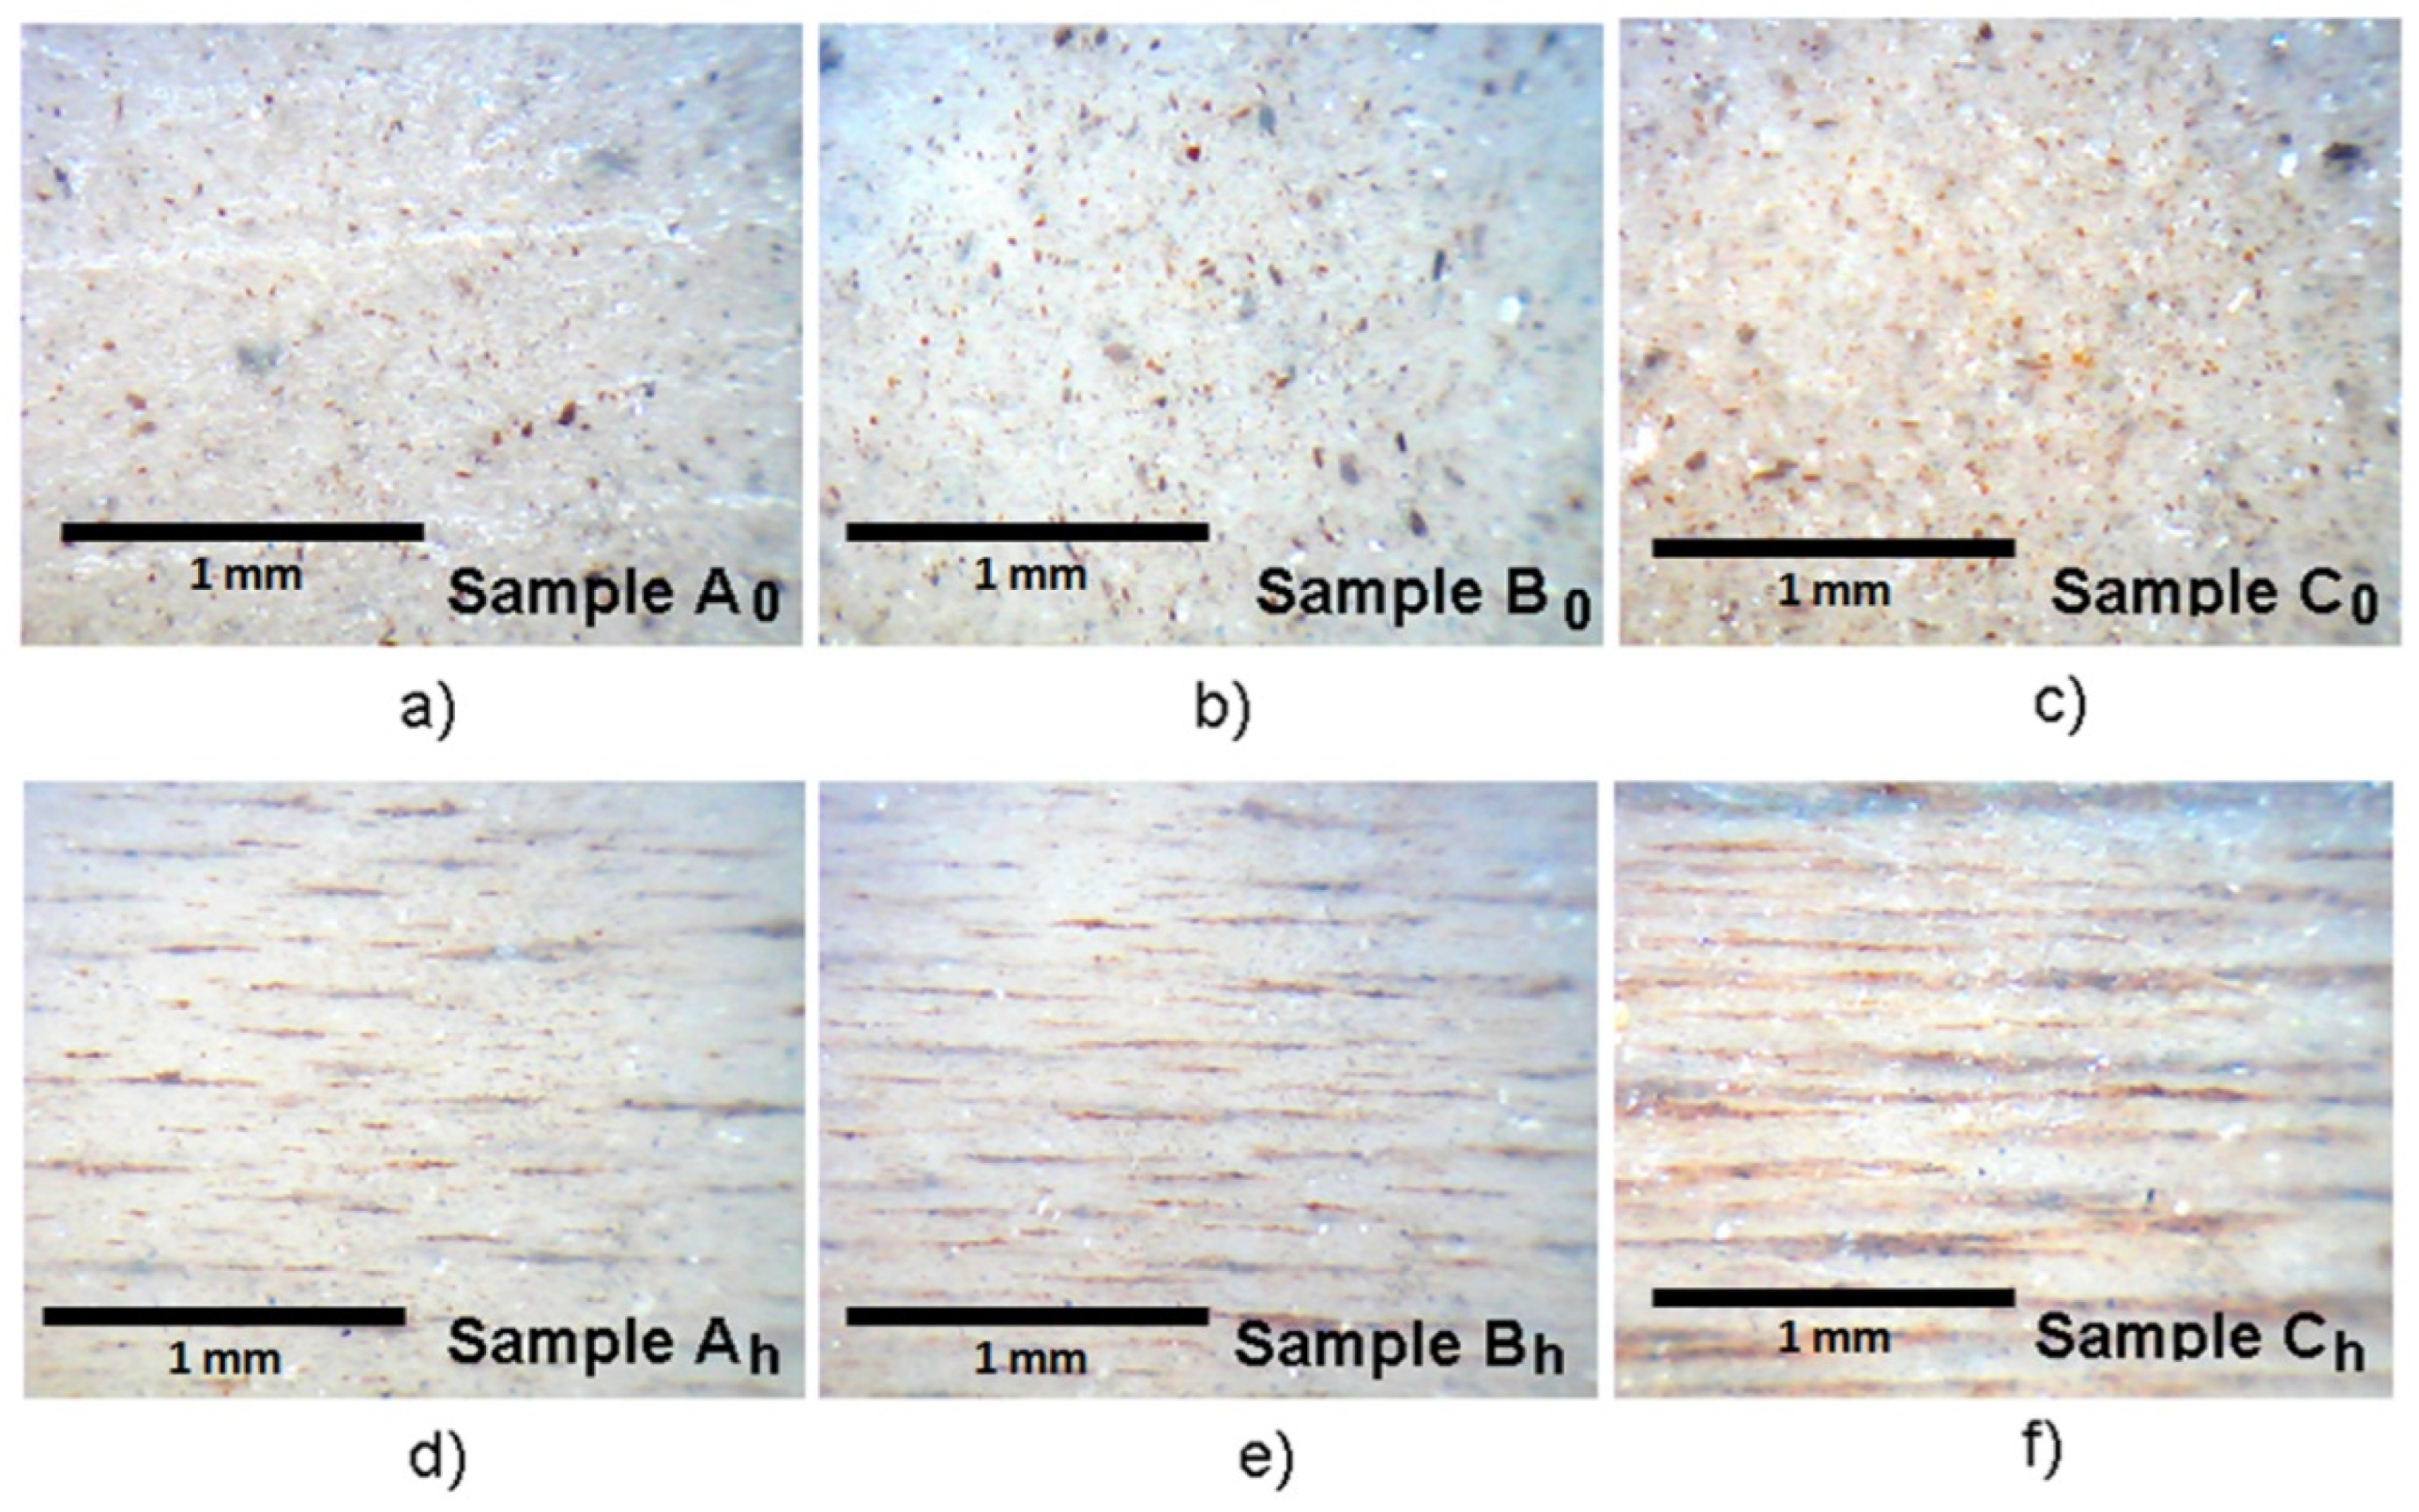
- for sample A0 and Ah: MFM = 0.05 g and MSR = 4 g (2 g of each component of the silicon rubber, A and B);
- -
- for sample B0 and Bh: MFM = 0.10 g and MSR = 4 g (2 g of each component of the silicon rubber, A and B);
- -
- for sample C0 and Ch: MFM = 0.15 g and MSR = 4 g (2 g of each component of the silicon rubber, A and B).
3. Results and discussion
3.1. Investigation of the complex magnetic permeability
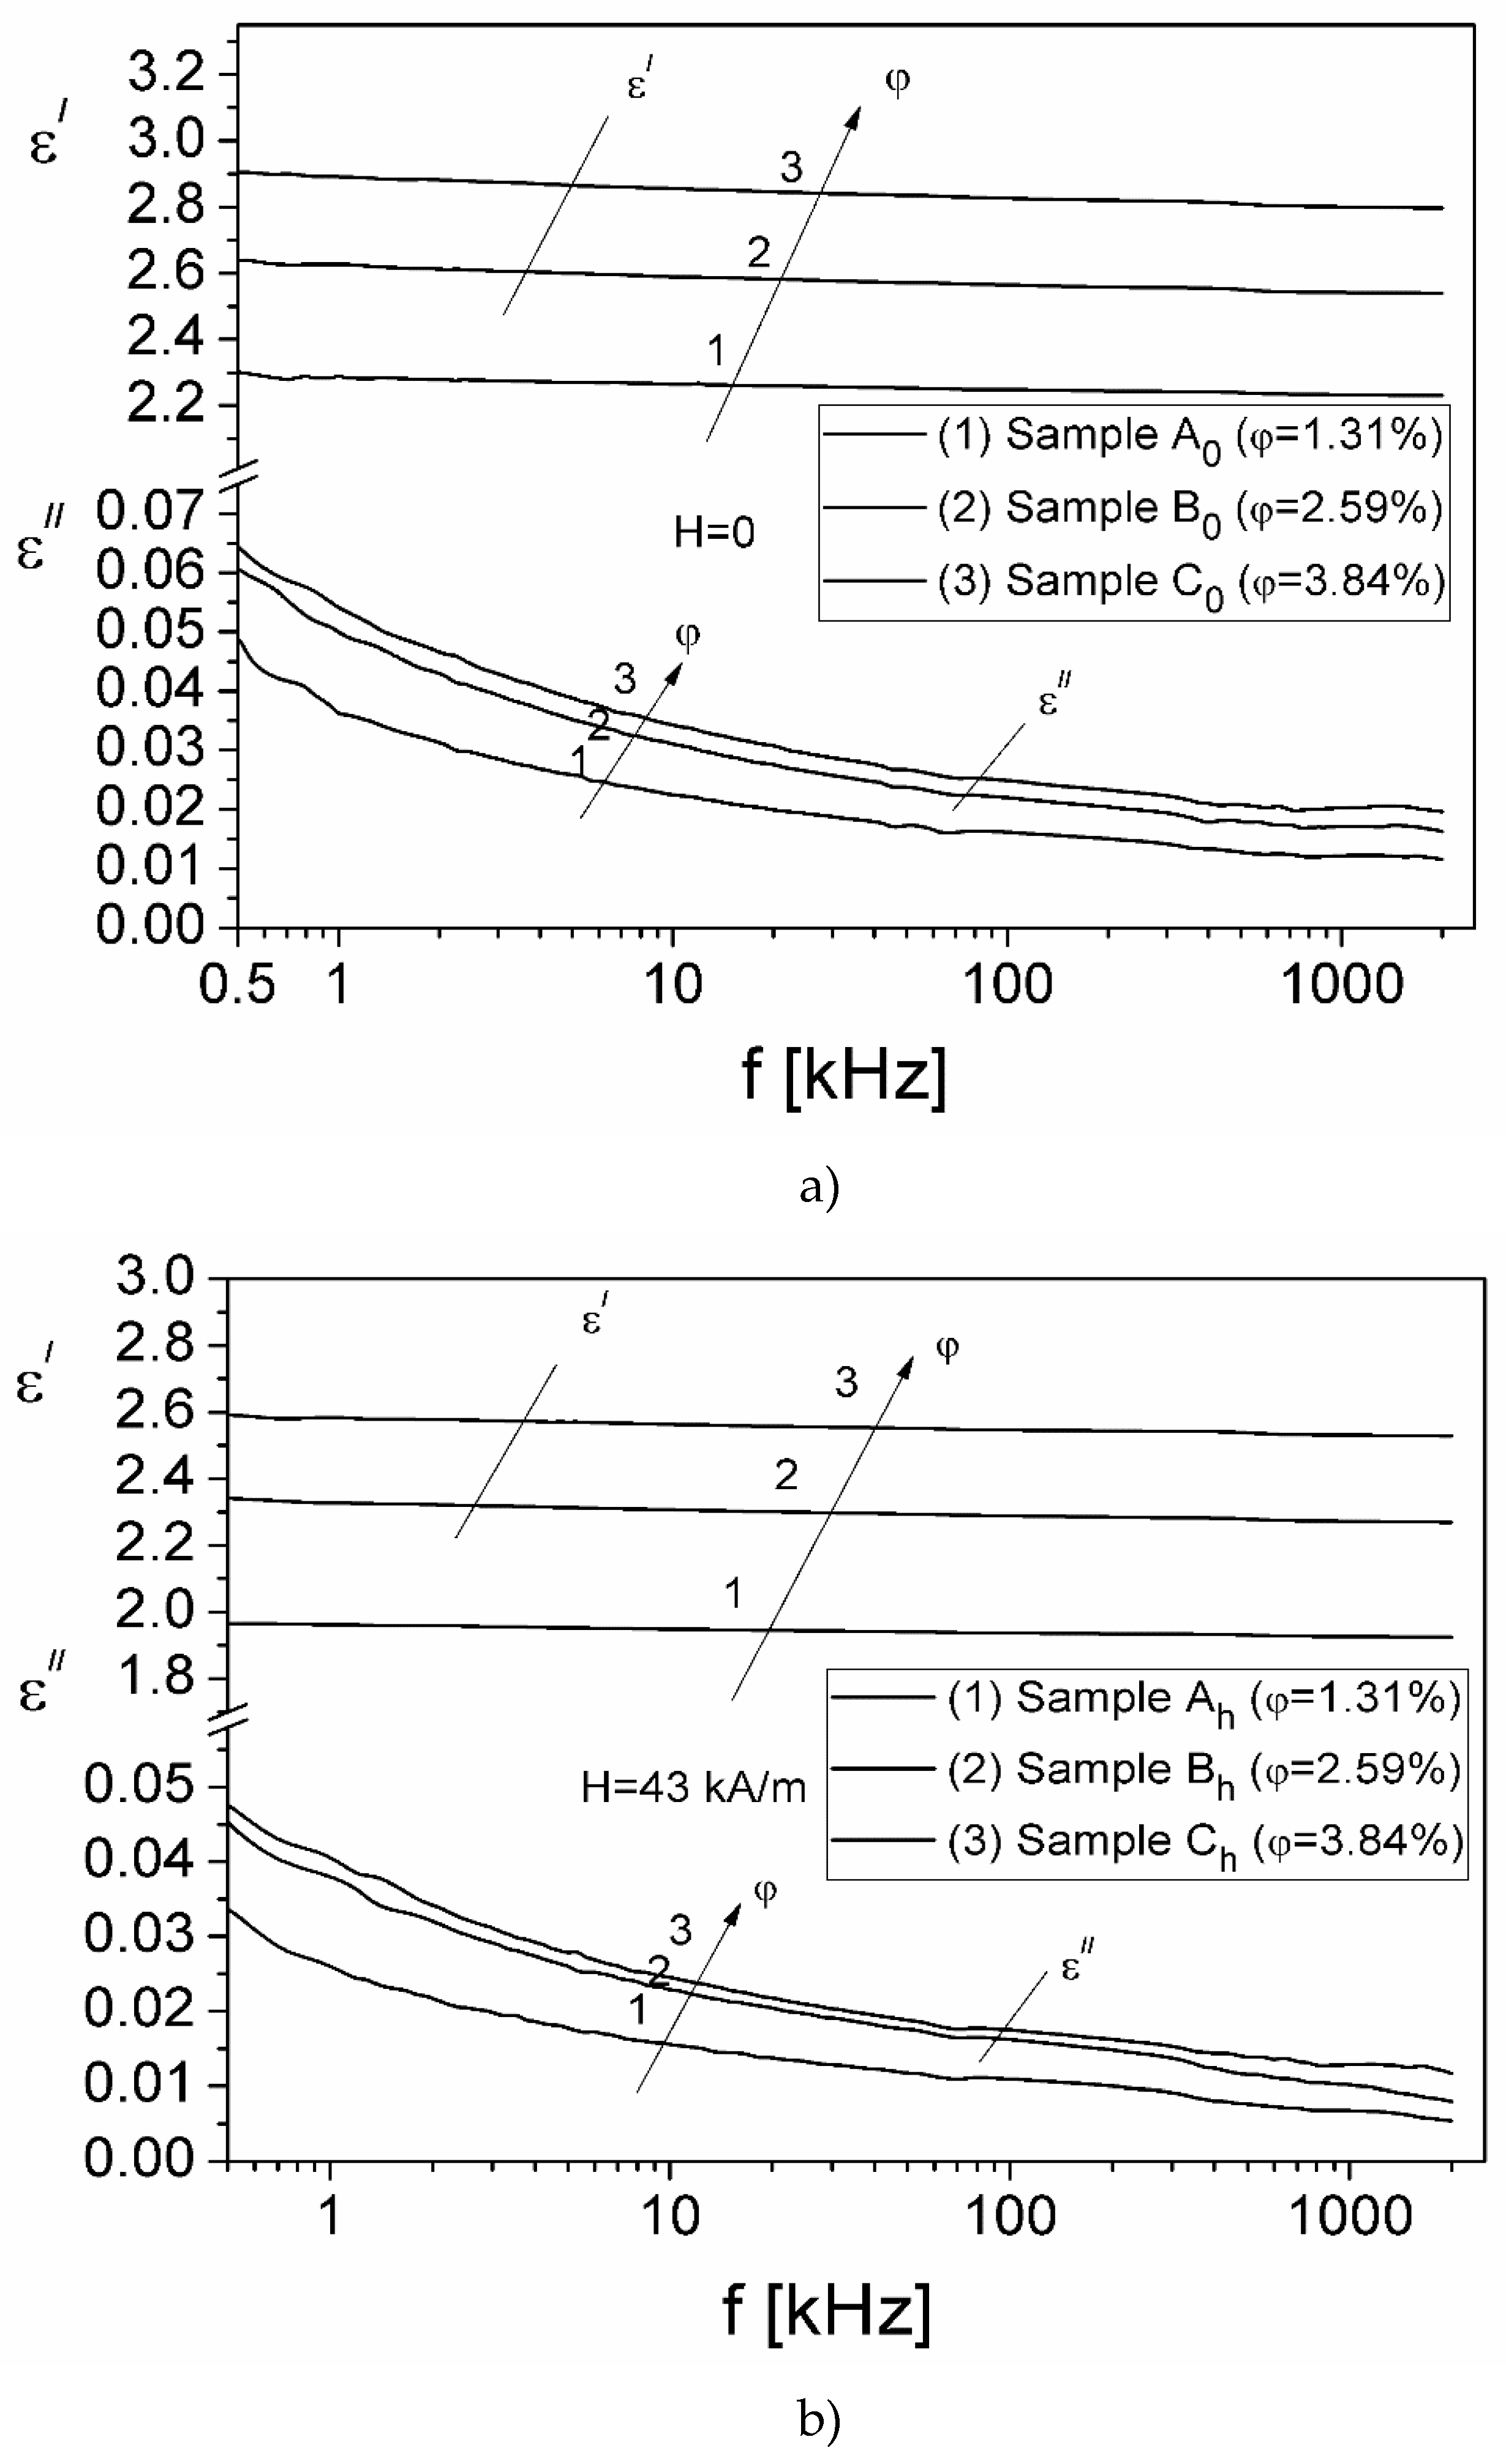
3.2. Investigation of the complex dielectric permittivity
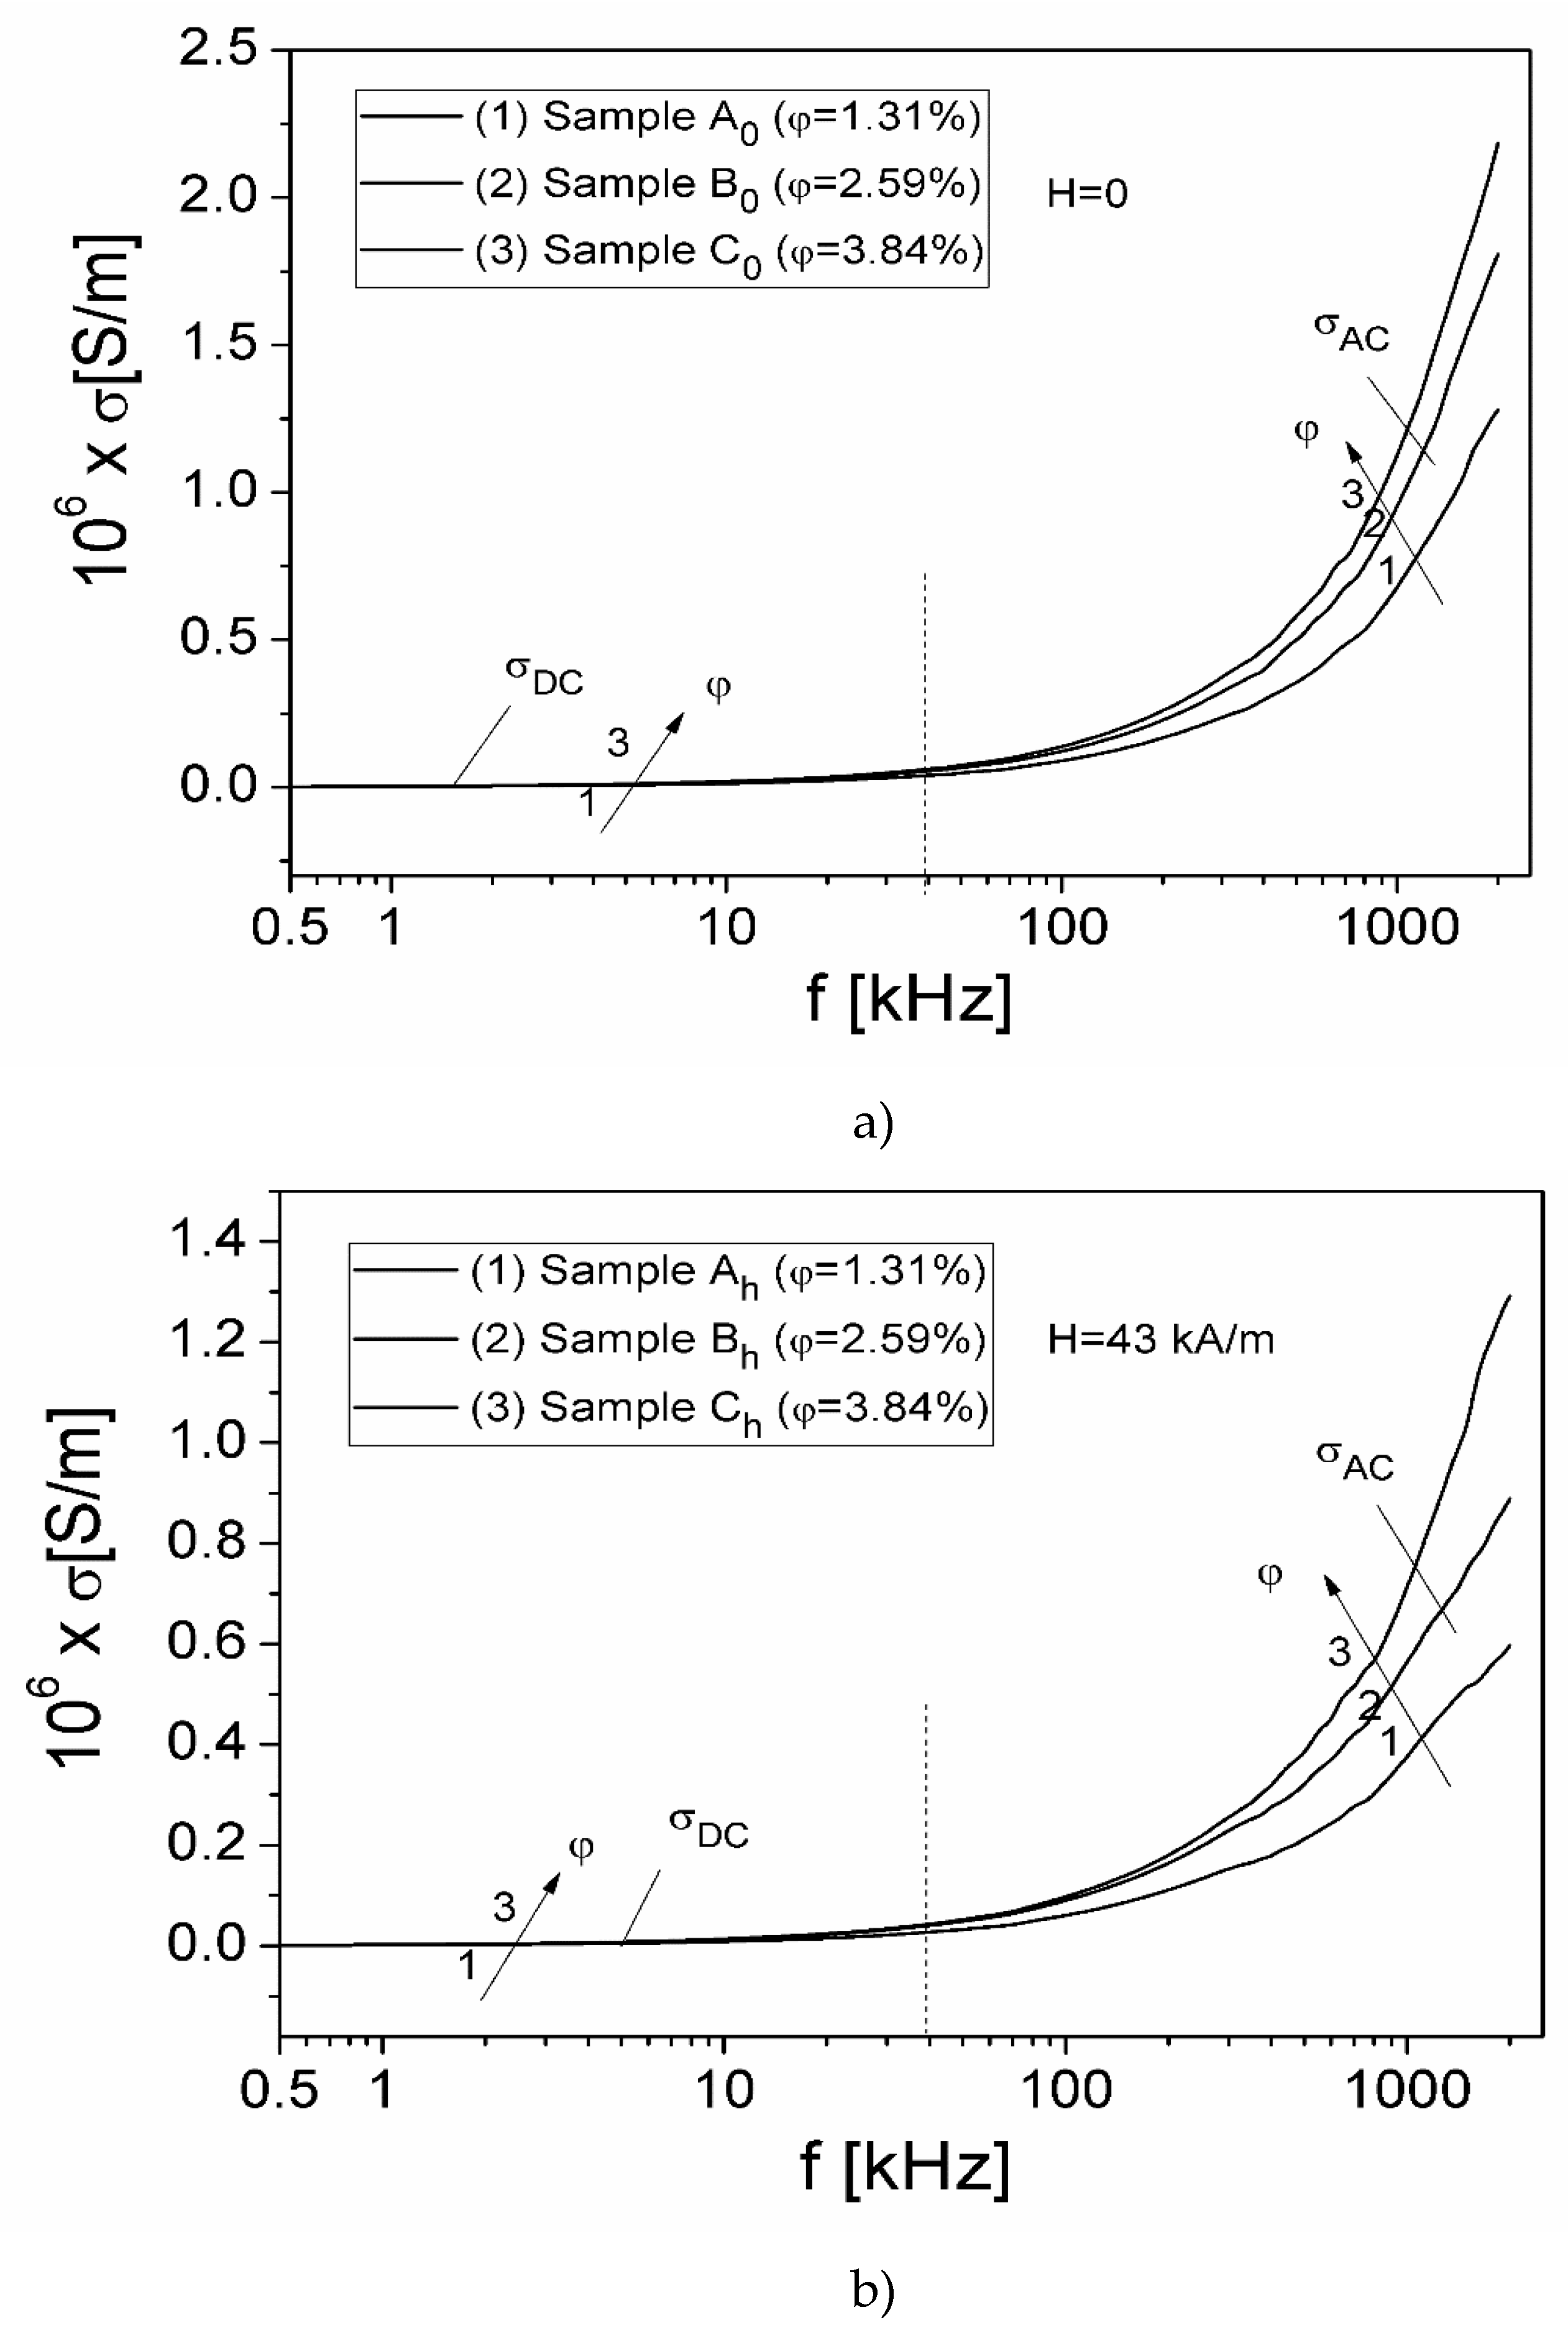
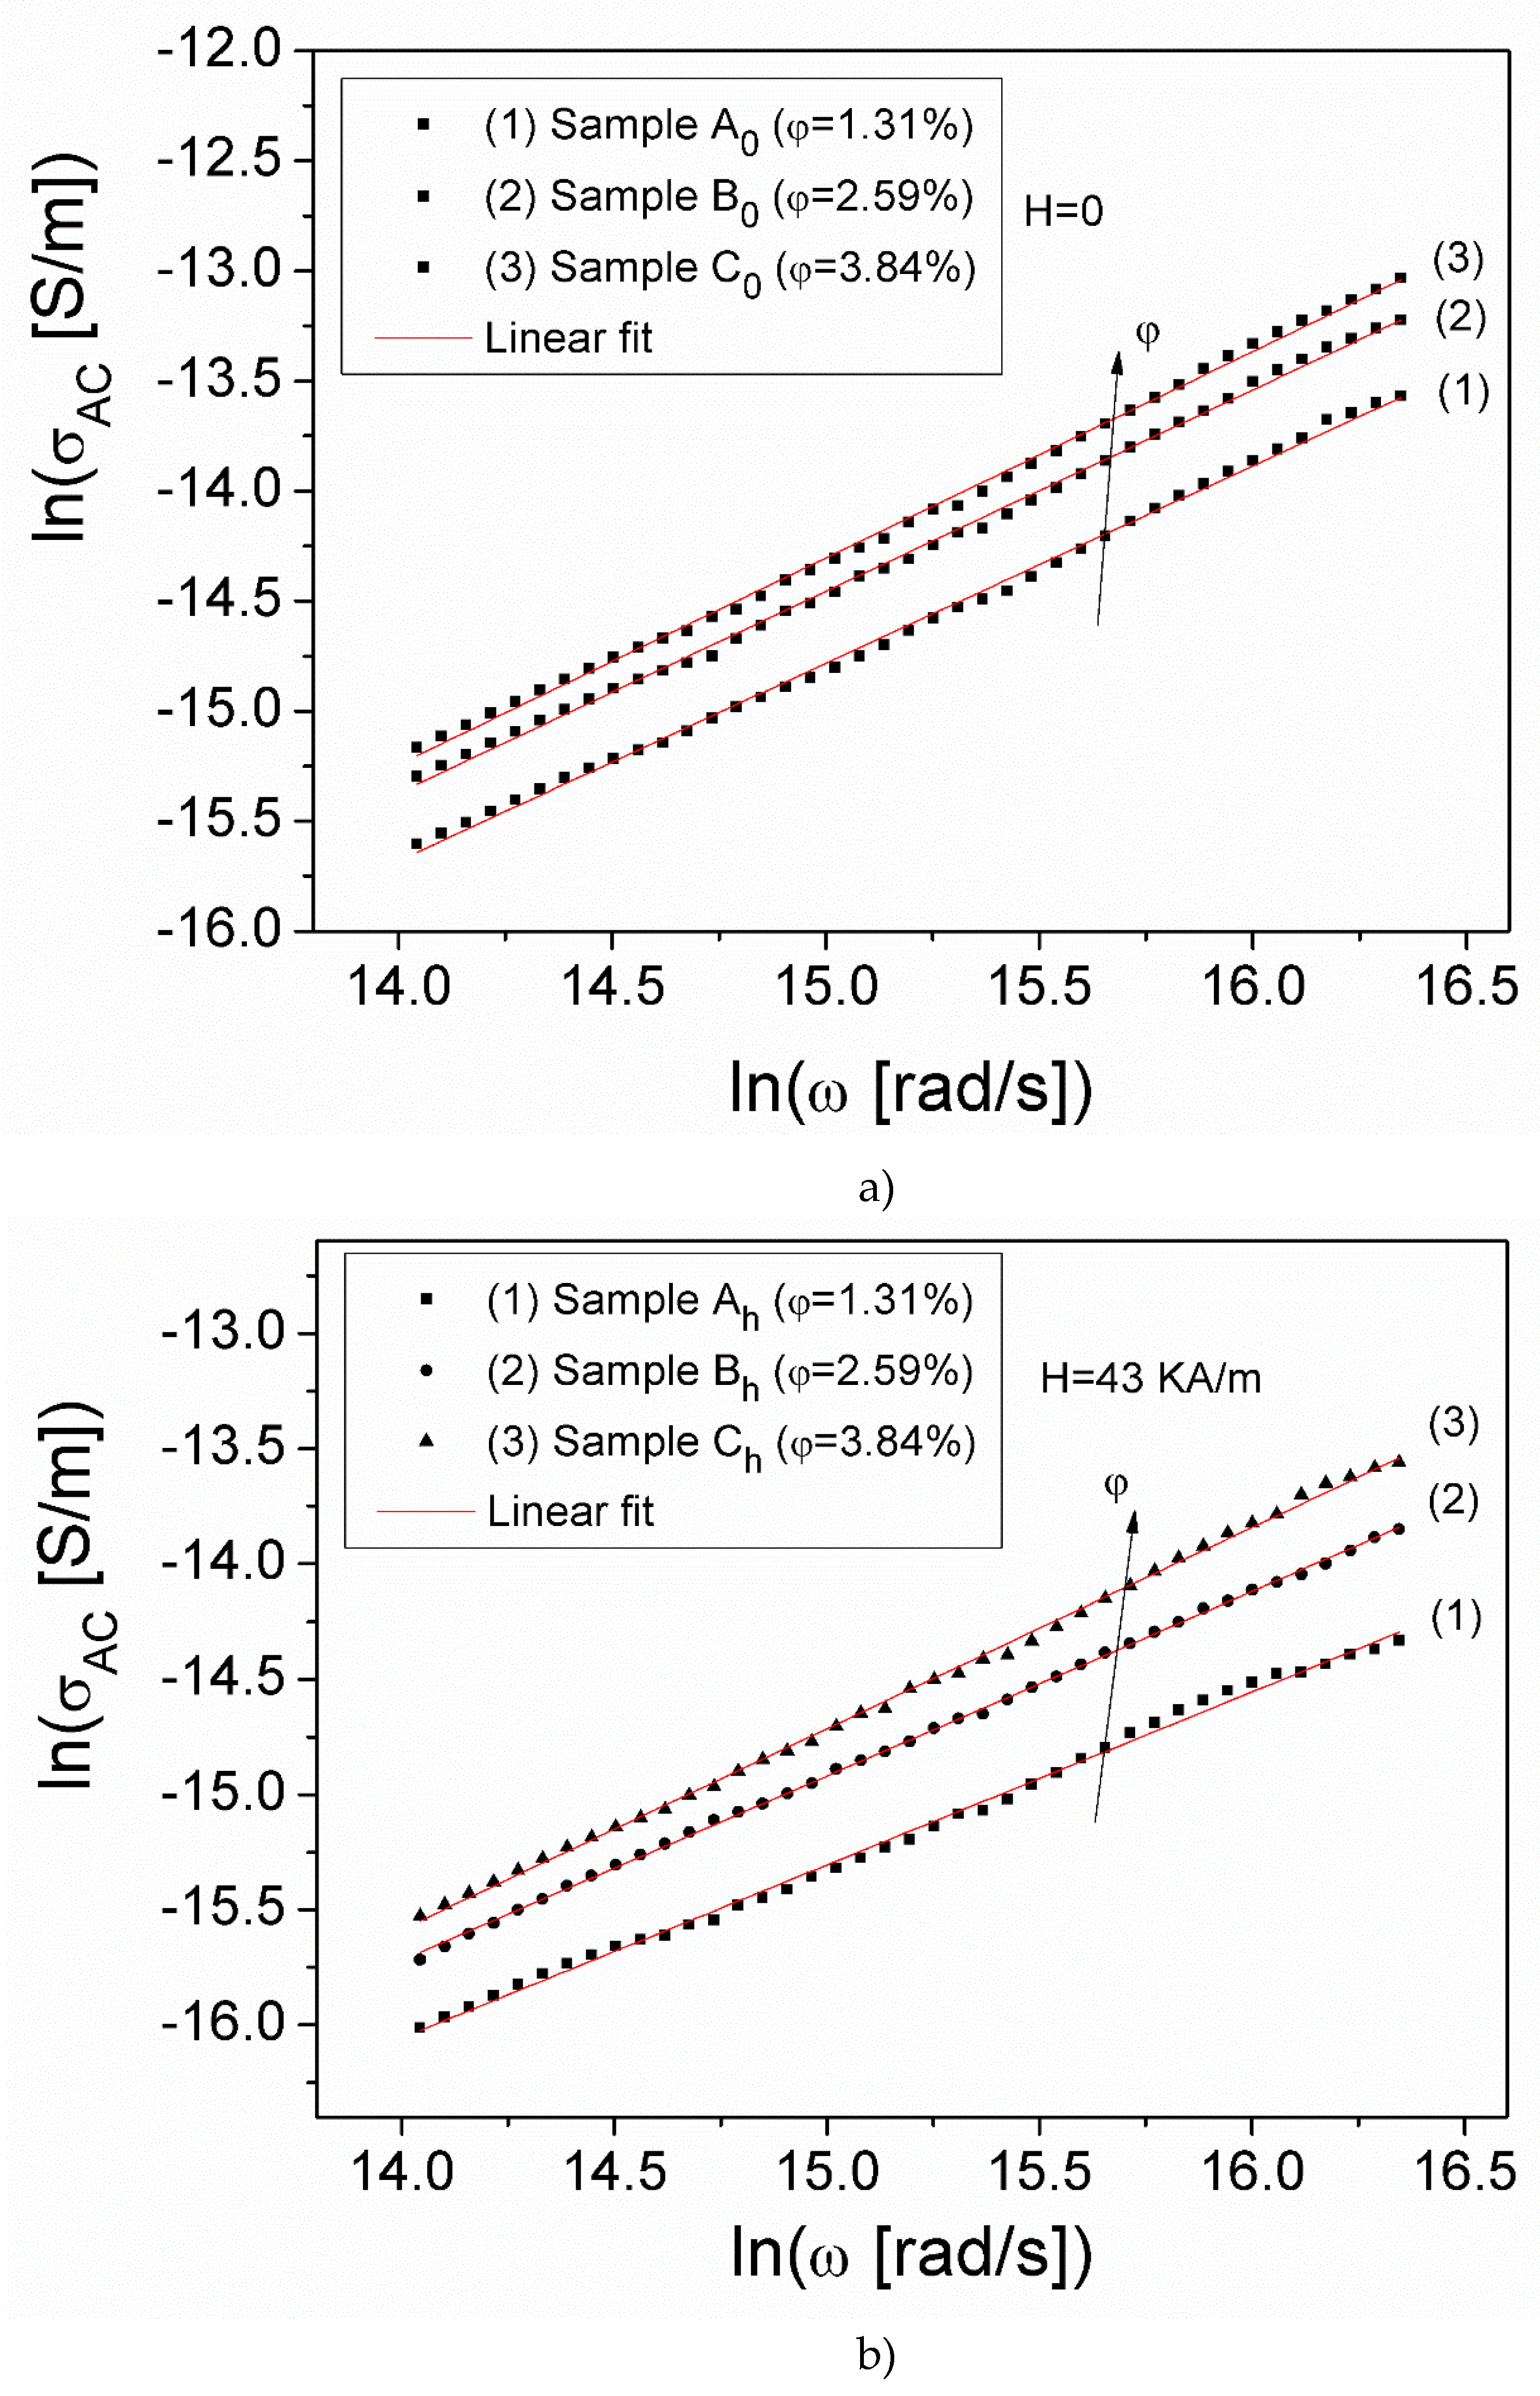
3.3. DC and AC conductivity
4. Conclusions
Author Contributions
Institutional Review Board Statement
Data Availability Statement
Conflicts of Interest
References
- Choi, S.; Han, S.I.; Kim, D.; Hyeon, T.; Kim, D.H. High-performance stretchable conductive nanocomposites: materials, processes, and device applications. Chem. Soc. Rev. 2019, 48, 1566–1595. [Google Scholar] [CrossRef] [PubMed]
- Wang, B.; Thukral, A.; Xie, Z.; et al. Flexible and stretchable metal oxide nanofiber networks for multimodal and monolithically integrated wearable electronics. Nat. Commun. 2020, 11(1), 2405–2420. [Google Scholar] [CrossRef] [PubMed]
- Cao, J.; Ling, Z.; Lin, X.; Wu, Y.; Fang, X.; Zhang, Z. Flexible composite phase change material with enhanced thermophysical, dielectric, and mechanical properties for battery thermal management. J. Energy Stor. 2022, 52, Part A, 104796. [Google Scholar] [CrossRef]
- Namkoong, M.; Guo, H.; Rahman, M.S.; et al. Moldable and transferable conductive nanocomposites for epidermal electronics. npj Flex Electron. 2022, 6(41), 1–9. [Google Scholar] [CrossRef] [PubMed]
- Zhang, C.; Liu, S.; Wei, F.; Dong, L.; Zhao, D.; Ou, Y. Magnetodielectric Properties of Ordered Microstructured Polydimethylsiloxane-Based Magnetorheological Elastomer with Fe3O4@rGO Nanoparticles. Polymers. 2023, 15, 941. [Google Scholar] [CrossRef] [PubMed]
- Kurahatti, R.V.; Surendranathan, A.O.; Kori, S.A.; Singh, N.; Ramesh Kumar, A.V.; Srivastava, S. Defence applications of polymer nanocomposites. Def. Sci. J. 2010, 60, 551e563. [Google Scholar] [CrossRef]
- Hammami, H.; Arous, M.; Lagache Mand Kallel, A. Study of the interfacial MWS relaxation by dielectric spectroscopy in unidirectional PZT fibres/epoxy resin composites. J. Alloys. Compd. 2007; 430, 1–8. [Google Scholar]
- Jamal, E.M.A.; Joy, P.A.; Kurian, P.; Anantharaman, M.R. Synthesis of nickel-rubber nanocomposites and evaluation of their dielectric properties. Mat. Sci. Eng. B. 2009, 156, 24–31. [Google Scholar] [CrossRef]
- Yakovenko, O.S.; Yu, L.; Matzui, L.; Vovchenko, L.; Lozitsky, O.V.; Prokopov, O.I.; Lazarenko, O.A.; Zhuravkov, A.V.; Oliynyk, V.V.; Launets, V.L.; Trukhanov, S.V.; Trukhanov, A.V. Electrophysical properties of epoxy-based composites with graphite nanoplatelets and magnetically aligned magnetite. Molec. Cryst. Liq. Cryst. 2018; 661, 68–80. [Google Scholar]
- Yakovenko, O.S.; Yu, L.; Matzui, L.; Vovchenko, L.; Oliynyk, V.V.; Trukhanov, A.V.; Trukhanov, S.V.; Borovoy, M.O.; Tesel'ko, P.O.; Launets, V.L.; Syvolozhskyi, O.A.; Astapovich, K.A. Effect of magnetic fillers and their orientation on the electrodynamic properties of BaFe12−xGaxO19 (x = 0.1–1.2)—Epoxy composites with carbon nanotubes within GHz range. Appl. Nanosci, 2020; 10, 4747–4752. [Google Scholar]
- Bica, I. The obtaining of magneto-rheological suspensions based on silicon oil and iron particles. Mat. Sci. Eng.: B. 2003; 98, 89–93. [Google Scholar]
- Bunoiu, M.; Bica, I. Magnetorheological elastomer based on silicone rubber, carbonyl iron and Rochelle salt: Effects of alternating electric and static magnetic fields intensities. J. Ind. Eng. Chem. 2016, 37, 312–318. [Google Scholar] [CrossRef]
- Bica, I.; Anitas, E.M.; Averis, L.M.E.; Bunoiu, M. Magnetodielectric effects in composite materials based on paraffin, carbonyl iron and graphene. J. Ind. Eng. Chem. 2015, 21, 1323–1327. [Google Scholar] [CrossRef]
- Vinnik, D.A.; Podgornov, F.V.; Zabeivorota, N.S.; Trofimov, E.A.; et al. Effect of treatment conditions on structure and magnetodielectric properties of barium. J. Magn. Magn. Mater. 2020, 498, 166190. [Google Scholar] [CrossRef]
- Kozlovskiy, A.L.; Kenzhina, I.E.; Zdorovets, M.V. FeCo–Fe2CoO4/Co3O4 nanocomposites: Phase transformations as a result of thermal annealing and practical application in catalysis. Ceram. Int. 2020, 46, Part. A, 10262–10269. [Google Scholar] [CrossRef]
- Rosensweig, R.E. Ferrohydrodynamics, Cambridge University Press, 1985.
- Fannin, P.C.; Marin, C.N.; Malaescu, I. The Influence of Particle Concentration and Polarizing Field on the Resonant Behaviour of Magnetic Fluids. J. Phys. Condensed Matter. 2003, 15(27), 4739–4750. [Google Scholar] [CrossRef]
- Fannin, P.C.; Malaescu, I.; Marin, C.N. Determination of the Landau–Lifshitz damping parameter of composite magnetic fluids. Phys. B. 2007, 388, 93–98. [Google Scholar] [CrossRef]
- **** http://www.prochima.com/ENG/product.asp?id=7.
- **** https://ferrofluid.ferrotec.com/products/ferrofluid-educational-fluid/efh/efh1/.
- Spunei, M.; Malaescu, I.; Mihai, M.; Marin, C.N. Absorbing materials with applications in radiotherapy and radioprotection. Rad. Prot. Dosim, 2014; 162, 167–170. [Google Scholar]
- Ercuta, A. Sensitive AC hysteresigraph of extended driving field capability. IEEE Trans. Instrum. Measur. 2020, 69(4), 1643–1651. [Google Scholar] [CrossRef]
- Chantrell, R.W.; Popplewell, J.; Charles, S.W. Measurements of particle size distribution parameters in ferrofluids. IEEE Trans. Magn. 1978, 14, 975. [Google Scholar] [CrossRef]
- Malaescu, I.; Fannin, P.C.; Marin, C.N.; Lazic, D. The concept of ferrofluid preheating in the treatment of cancer by magnetic hyperthermia of tissues. Med. Hypoth. 2018, 110, 76–79. [Google Scholar] [CrossRef]
- Debye, P. Polar Molecules, The Chemical Catalog Company, New York, 1929.
- Odenbach, S. Ferrofluids, 594, Springer, Berlin Heidelberg, 2002.
- Fannin, P.C.; Charles, S.W. The study of a ferrofluid exhibiting both Brownian and Neel relaxation. J. Phys. D, Appl. Phys, 1989; 22, 187–191. [Google Scholar]
- Bickford, L.R. Ferromagnetic Resonance Absorption in Magnetite Single Crystals. Phys. Rev. 1950, 78, 449. [Google Scholar] [CrossRef]
- Malaescu, I.; Marin, C.N. Study of magnetic fluids by means of magnetic spectroscopy. Phys. B: Cond. Matter, 2005; 365, 134–140. [Google Scholar]
- Lungu, A.; Malaescu, I.; Marin, C.N.; Vlazan, P.; Sfirloaga, P. The electrical properties of manganese ferrite powders prepared by two different methods. Phys. B. 2015, 462, 80–85. [Google Scholar] [CrossRef]
- ASTM D150-98 - Standard test methods for AC loss characteristics and permittivity (dielectric constant) of solid electrical insulation.
- Scaife, B.K.P. Principles of Dielectrics, Oxford Clarendon Press, 1998.
- Marin, C. N.; Fannin, P.C.; Malaescu, I.; Matu, G. Macroscopic and microscopic electrical properties of a ferrofluid in a low frequency field. Phys. Lett. A. 2020, 384, 126786. [Google Scholar] [CrossRef]
- Yakovenko, L.; Matzui, Y.; Vovchenko, L.L.; Lozitsky, O.V.; Prokopov, O.I.; Lazarenko, O.A.; Zhuravkov, A.V.; Oliynyk, V.V.; Launets, V.L.; Trukhanov, S.V.; Trukhanov, A.V. Electrophysical properties of epoxy-based composites with graphite nanoplatelets and magnetically aligned magnetite. Molec. Cryst. Liq. Cryst. 2018, 661, 68–80. [Google Scholar] [CrossRef]
- Trukhanov, A.V.; Algarou, N.A.; Slimani, Y.; Almessiere, M.A.; Baykal, A.; Tishkevich, D.I.; Vinnik, D.A.; Vakhitov, M.G.; Klygach, D.S.; Silibin, M.V.; Zubar, T.I.; Trukhanov, S.V. Peculiarities of the microwave properties of hard–soft functional composites SrTb0.01Tm0.01Fe11.98O19– AFe2O4 (A = Co, Ni, Zn, Cu, or Mn). RSC Adv, 2020; 10, 32638. [Google Scholar]
- Jonscher, A.K. Universal Relaxation Law, 1st edn.: Chelsea Dielectrics Press: London, 1996.
- Funke, K. Prog. Jump relaxation in solid electrolytes. Solid State Chem. 1993, 22, 111–195. [Google Scholar] [CrossRef]
- Okuda, T.; Jufuku, N.; Hidaka, S.; Terada, N. Magnetic, transport, and thermoelectric properties of the delafossite oxides CuCr1−xMgxO2 (0⩽x⩽0.04). Phys. Rev. B. 2005, 72, 144403. [Google Scholar] [CrossRef]
- Pike, G. E. AC conductivity of scandium oxide and a new hopping model for conductivity. Phys. Rev. B. 1972, 6, 1572–1580. [Google Scholar] [CrossRef]
- Elliott, S.R. ; A theory of ac conduction in chalcogenide glasses. Philos. Mag. B. 1977, 36(6), 1291–1304. [Google Scholar] [CrossRef]
| Samples __________ Parameters |
A0 | B0 | C0 | Ah | Bh | Ch |
|---|---|---|---|---|---|---|
| φ=1.31% | φ=2.59% | φ=3.84% | φ=1.31% | φ=2.59% | φ=3.84% | |
| H=0 | H=43 kA/m | |||||
| σDC [S/m] | 4.26∙10-9 | 9.40∙10-9 | 1.03∙10-8 | 4.93∙10-9 | 1.73∙10-8 | 1.86∙10-8 |
| n | 0.897 | 0.915 | 0.938 | 0.751 | 0.807 | 0.872 |
| A [S/m] | 5.42∙10-13 | 5.72∙10-13 | 4.73∙10-13 | 28.7∙10-13 | 20.4∙10-13 | 8.56∙10-13 |
| Wm [eV] | 1.51 | 1.83 | 2.51 | 0.62 | 0.81 | 1.22 |
Disclaimer/Publisher’s Note: The statements, opinions and data contained in all publications are solely those of the individual author(s) and contributor(s) and not of MDPI and/or the editor(s). MDPI and/or the editor(s) disclaim responsibility for any injury to people or property resulting from any ideas, methods, instructions or products referred to in the content. |
© 2023 by the authors. Licensee MDPI, Basel, Switzerland. This article is an open access article distributed under the terms and conditions of the Creative Commons Attribution (CC BY) license (http://creativecommons.org/licenses/by/4.0/).


