1. Introduction
Agriculture is one of the most important primary industries in the world today and a vital prerequisite for supporting the most basic livelihoods in all countries and regions. In almost all plants with large leaves (non-coniferous species), the leaves are one of most indispensable parts of the plants.
[1] We know that leaves contain chloroplasts, which absorb sunlight for photosynthesis and provide energy for the plant, and cuticles, which regulate the internal and external osmotic pressure and keep the water in the leaves at a healthy level.
According to current research, there is no direct link between plant cuticle wax and osmosis, and this paper is an attempt to establish the relationship between the two; abiotic stresses are also one of the critical issues for plants to survive long terms, such as Heat, Drought, Metals, Cold, Salt and Flooding.
[2] How plants survive such abiotic stresses is not yet clear.
[3] At the same time, improving crop yields is a global problem, and many scholars have conducted in-depth research on crop yield improvement through physical, chemical, biological, and geographical aspects. This project’s results will significantly help improve crop performance, for example, this project’s results will greatly help improve crop performance, for example, by optimizing plant cuticle waxes through genetic engineering or other means. In addition, the cuticle wax will act as a protective measure for the plant epidermis, blocking growth-aiding agrochemicals from being sprayed.
[4] The agrochemicals can be designed to work around this protective layer by studying this project. In addition, this is a process of chemically creating a distinct biomimetic plant surface that can be applied to, for example, biology or other disciplines.
In this study, 1-Octadecanol and n-Nonadecane were mixed in different proportions to simulate the composition of the waxy layer of the plant epidermis. Meanwhile, the “fusion-crystallization” images of the different components should be obtained by thermal analysis, and the crystallization behavior of the properties should be analyzed. The physical and thermochemical properties of plant cuticle wax layer simulated in this binary system are obtained.
Moreover, this binary mixture is not representative of the plant wax as they are lower chain lengths. However, it was necessary as we didn’t know a lot about alkane-alcohol phase behavior.
2. Materials and Methods
2.1. Experimental materials and equipment
Table 1.
The main experimental material.
Table 1.
The main experimental material.
| No. |
Name |
Purity |
Producer |
| 1 |
n-Nonadecane |
99% |
Sigma-Aldrich |
| 2 |
1-Octadecanol |
99% |
Sigma-Aldrich |
Table 2.
The main experimental equipment.
Table 2.
The main experimental equipment.
| No. |
Name |
Model |
Producer |
| 1 |
Differential Scanning Calorimetry |
DSC 1 |
METTLER TOLEDO |
| 2 |
Fourier-Transform Infrared Reflection |
NICOLET iS10 |
Thermo Scientific |
| 3 |
Aluminium-Crucibles |
1/3 ME-51119870 |
METTLER TOLEDO |
| 4 |
Aluminium-Piercing lids |
1/5 ME-51119873 |
METTLER TOLEDO |
2.2. Mass calculation
Twenty-one samples were made at the beginning of the experiment. The samples were differenced by 5% each. All the samples were thoroughly mixed to confirm they were in equilibrium. Then crush the sample into powder since all the analysis methods are using fine powder for the analysis.
The desired batch size of each glass is around 30-40 milligrams.
The total molar weight is:
The weight percentage of each chemical is:
The mass of each chemical for making the samples is:
The compositions of samples(mol%) we prepared are listed below:
Table 3.
The Chemicals information of each sample.
Table 3.
The Chemicals information of each sample.
| Sample No. |
Molar fraction
(C18OH/C19) |
n-Nonadecane mass (g) |
1-Octadecanol mass (g) |
Total mass (g) |
| 1 |
0 |
0 |
0.03 |
0.03 |
| 2 |
5 |
0.001923 |
0.037107 |
0.03903 |
| 3 |
10 |
0.003846 |
0.035154 |
0.039 |
| 4 |
15 |
0.005769 |
0.033201 |
0.03897 |
| 5 |
20 |
0.007692 |
0.031248 |
0.03894 |
| 6 |
25 |
0.009615 |
0.029295 |
0.03891 |
| 7 |
30 |
0.011538 |
0.027342 |
0.03888 |
| 8 |
35 |
0.013461 |
0.025389 |
0.03885 |
| 9 |
40 |
0.015384 |
0.023436 |
0.03882 |
| 10 |
45 |
0.017307 |
0.021483 |
0.03879 |
| 11 |
50 |
0.01923 |
0.01953 |
0.03876 |
| 12 |
55 |
0.021153 |
0.017577 |
0.03873 |
| 13 |
60 |
0.023076 |
0.015624 |
0.0387 |
| 14 |
65 |
0.024999 |
0.013571 |
0.03857 |
| 15 |
70 |
0.026922 |
0.011718 |
0.03864 |
| 16 |
75 |
0.028845 |
0.009765 |
0.03861 |
| 17 |
80 |
0.030768 |
0.007812 |
0.03858 |
| 18 |
85 |
0.032691 |
0.005859 |
0.03855 |
| 19 |
90 |
0.034614 |
0.003906 |
0.03852 |
| 20 |
95 |
0.036537 |
0.001953 |
0.03849 |
| 21 |
100 |
0.03 |
0 |
0.03 |
Table 4.
The crucible weight and sample weight for Reproducibility (in crucible).
Table 4.
The crucible weight and sample weight for Reproducibility (in crucible).
| Sample No. |
Molar fraction
(C18OH/C19) |
Crucible weight (empty)/mg |
Crucible weight (full)/mg |
Sample weight (mg) |
| Re-1 (1) |
0 |
48.38 |
58.07 |
9.69 |
| Re-1 (11) |
50 |
48.63 |
58.54 |
9.91 |
| Re-1 (21) |
100 |
48.43 |
56.57 |
8.14 |
| Re-2 (1) |
0 |
48.26 |
56.19 |
7.93 |
| Re-2 (11) |
50 |
48.59 |
55.06 |
6.47 |
| Re-2 (21) |
100 |
49.19 |
59.61 |
7.93 |
2.3. Data Collection and analysis
2.3.1. DSC
The “DSC 1” which produced by METTLER TOLEDO differential scanning calorimetry (DSC) instrument was used to investigate the long chain diesters’ thermal properties. These properties included the phase change enthalpy, melting and solidification temperature and total enthalpy. For the purposes of the measurements, the instrument was calibrated using internal standards crucible made of Aluminum. The DSC measurements were carried out in an inert N2 environment with a heating-cooling rate of 1°C min-1 throughout a temperature range of 20 to 70 degrees Celsius. Putting each crucible in the specific place on the pan holder, record the name of each sample, position on the holder, then set the method of this analysis (cooling and heating rate), input the empty weight of crucible which sample in and the weight of reference crucible, in this case, the weight of reference crucible was 49.000mg. Finally, sent the experiment to the instrument and run it for analysis.
The method of DSC used during this project was a heatwave-type, and the heating and cooling rate for major experiments was 1°C per minute and a 3-time repeat. This step was designed to analyze the fusion and crystallization process of the samples. And using different rate which was 0.75 and 0.5 °C per minute for further analysis.
Using STARe software to analyze the collected DSC diagrams, displaying the Onset Temperature, End set Temperature, and Peak Temperature, then integrating the peaks, getting the area of each peak, and shading the peak area.
2.3.2. FTIR
Utilizing Fourier transform infrared (FT-IR) spectroscopy, long-chain diesters were chemically characterized. Between 4000 and 400 cm-1, a NICOLET iS10 produced by Thermo-Scientific was utilized for the FT-IR analyses. There was a crystal on the surface of the FTIR instrument. An environment diagram was analyzed before the experiment. Then the sample powder covered the crystal completely during the experiment. Then the samples were analyzed by operating the computer, and the diagram of the sample was shown on the screen of the PC.
Using OriginLab® for plotting the Infrared spectra after getting the raw data from the FTIR instrument. Then Analysis the wavenumber of the peaks and get different vibration types of each sample.
3. Results
This section may be divided by subheadings. It should provide a concise and precise description of the experimental results, their interpretation, as well as the experimental conclusions that can be drawn.
3.1. DSC diagrams
3.1.1. Cooling rate at 1℃/min
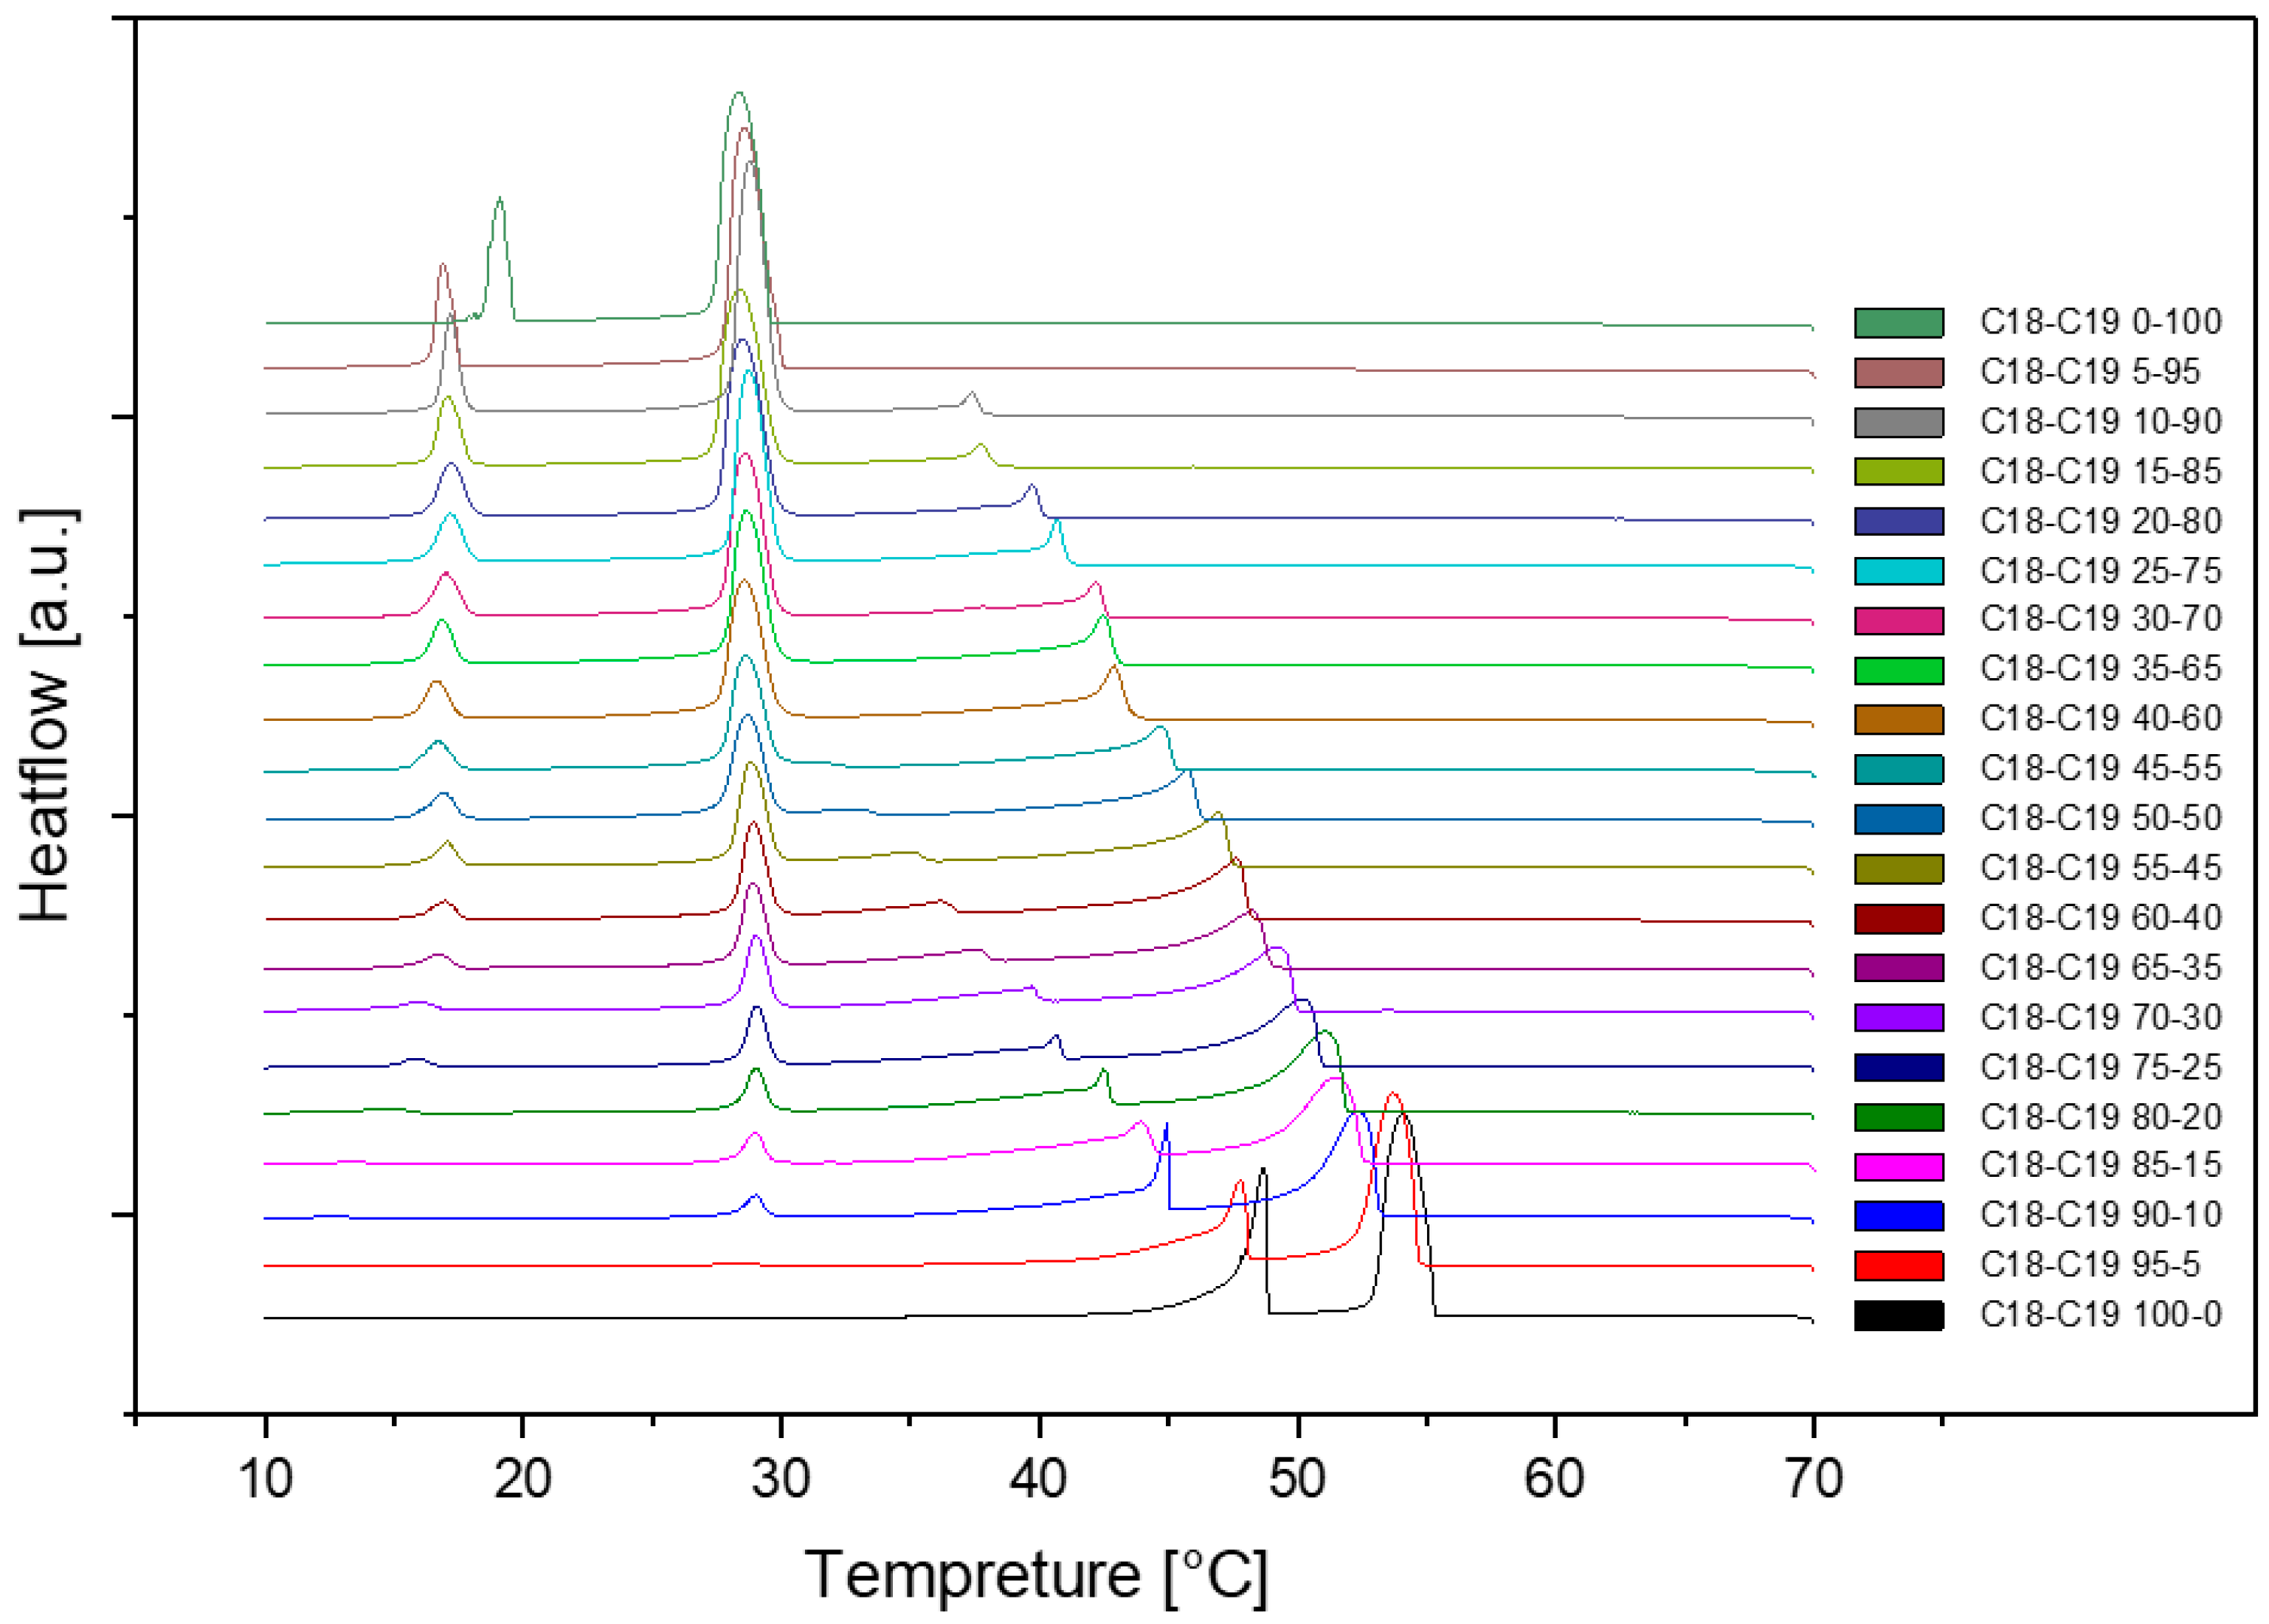
This is the cooling DSC diagram of heating and cooling cycle 1 at a rate of 1℃/min. As we can see, there are four peaks at most and two peaks at least. The peaks were moving when the composition was changing. The rightmost peak is 1-Octadecanol crystallizing from the liquid phase into a rotator phase. The next peak is the 1-Octadecanol transitioned into an ordered phase from the rotator phase. The two peaks on the left are about n-Nonadecane. The peak on the right is n-Nonadecane, crystallizing from the liquid phase into a rotator phase. The peak on the left is rotator-phase-n-Nonadecane transitioned into an ordered phase from the rotator phase.
[5]
Figure 1.
Cooling Phase diagram at 1℃/min (Cycle 1).
Figure 1.
Cooling Phase diagram at 1℃/min (Cycle 1).
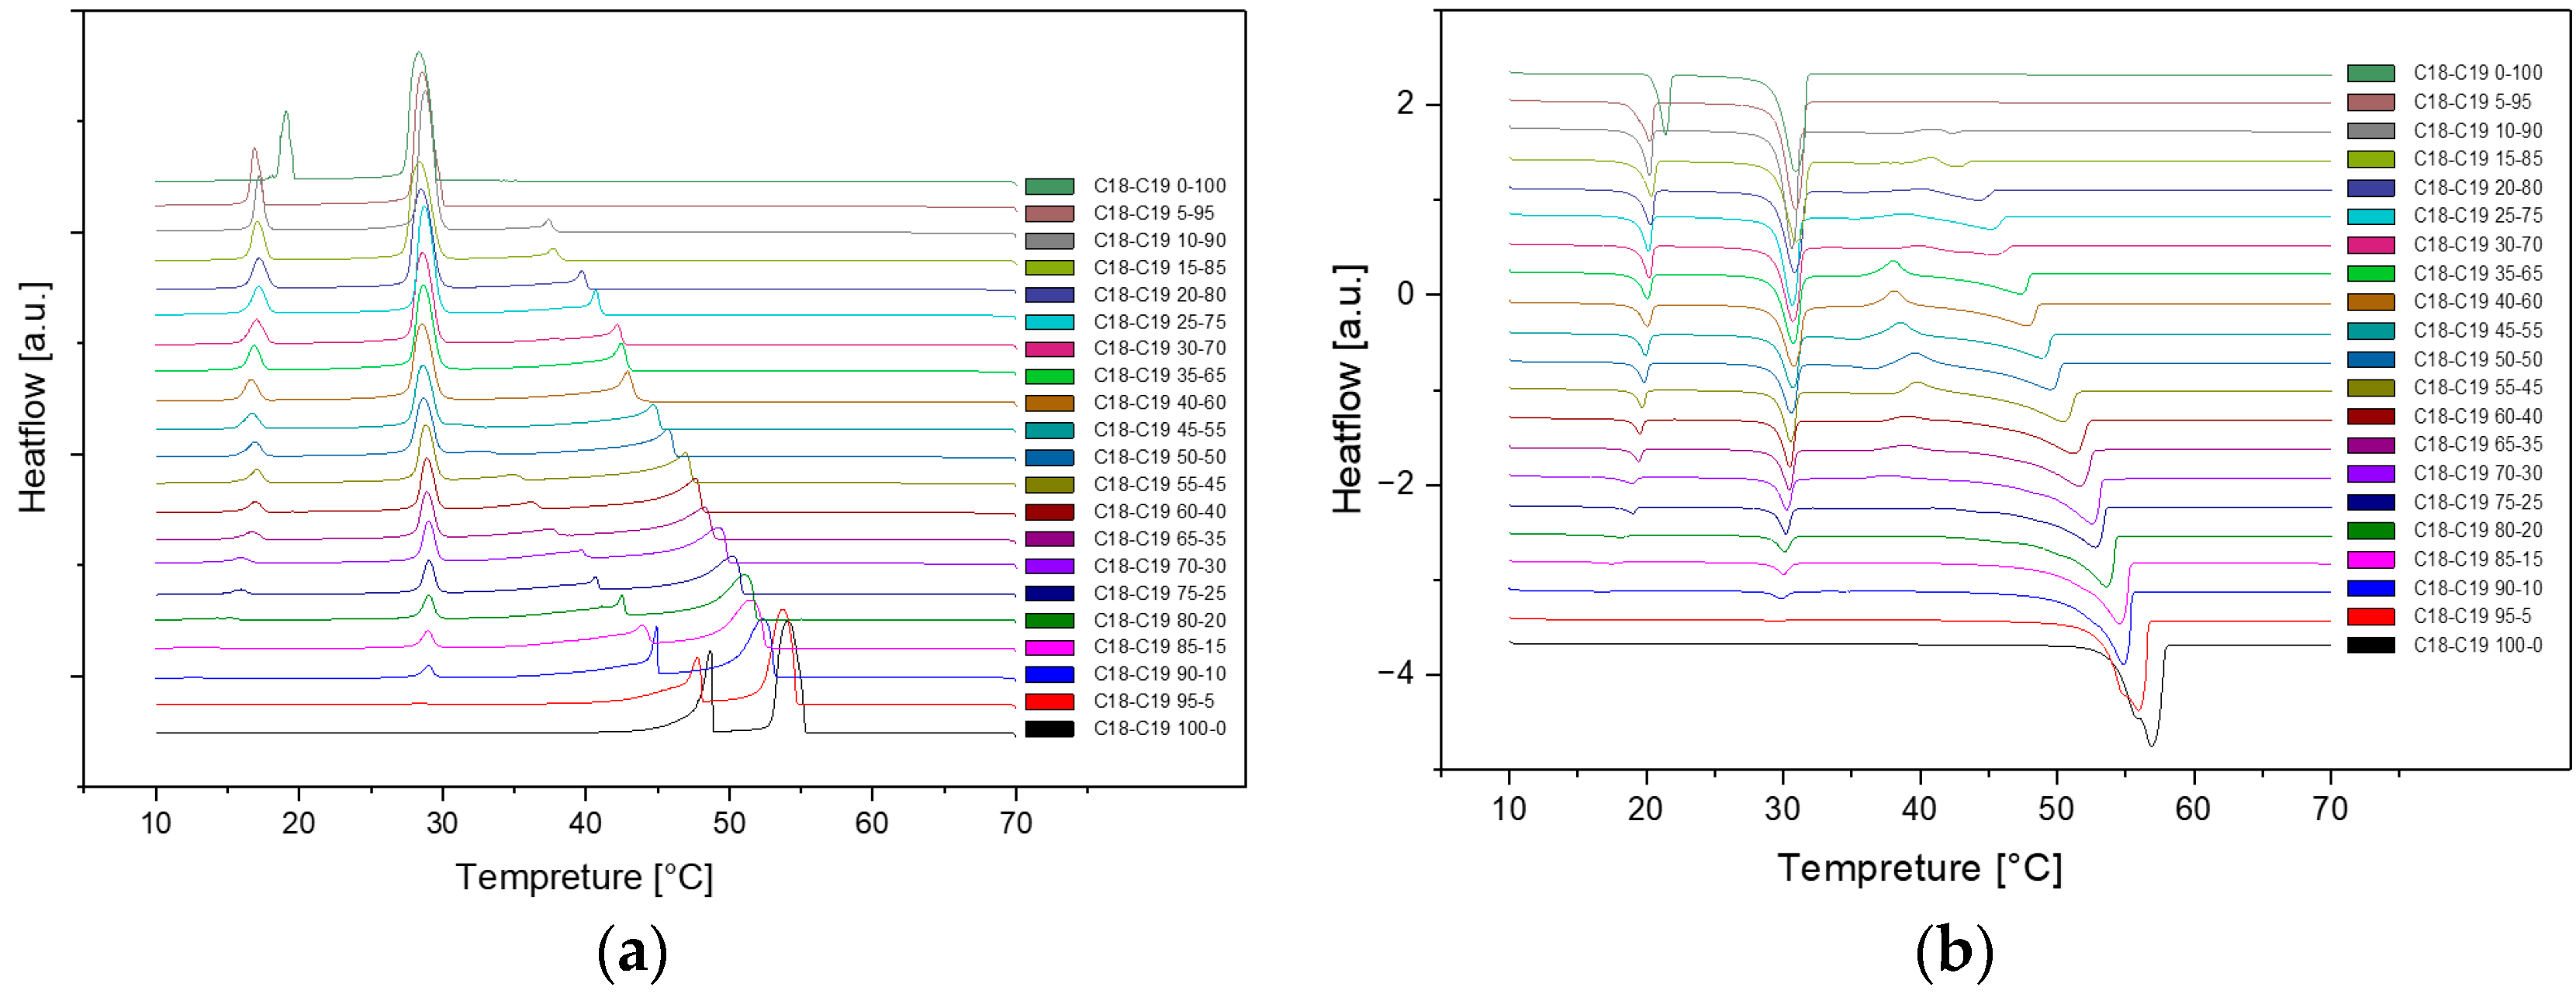
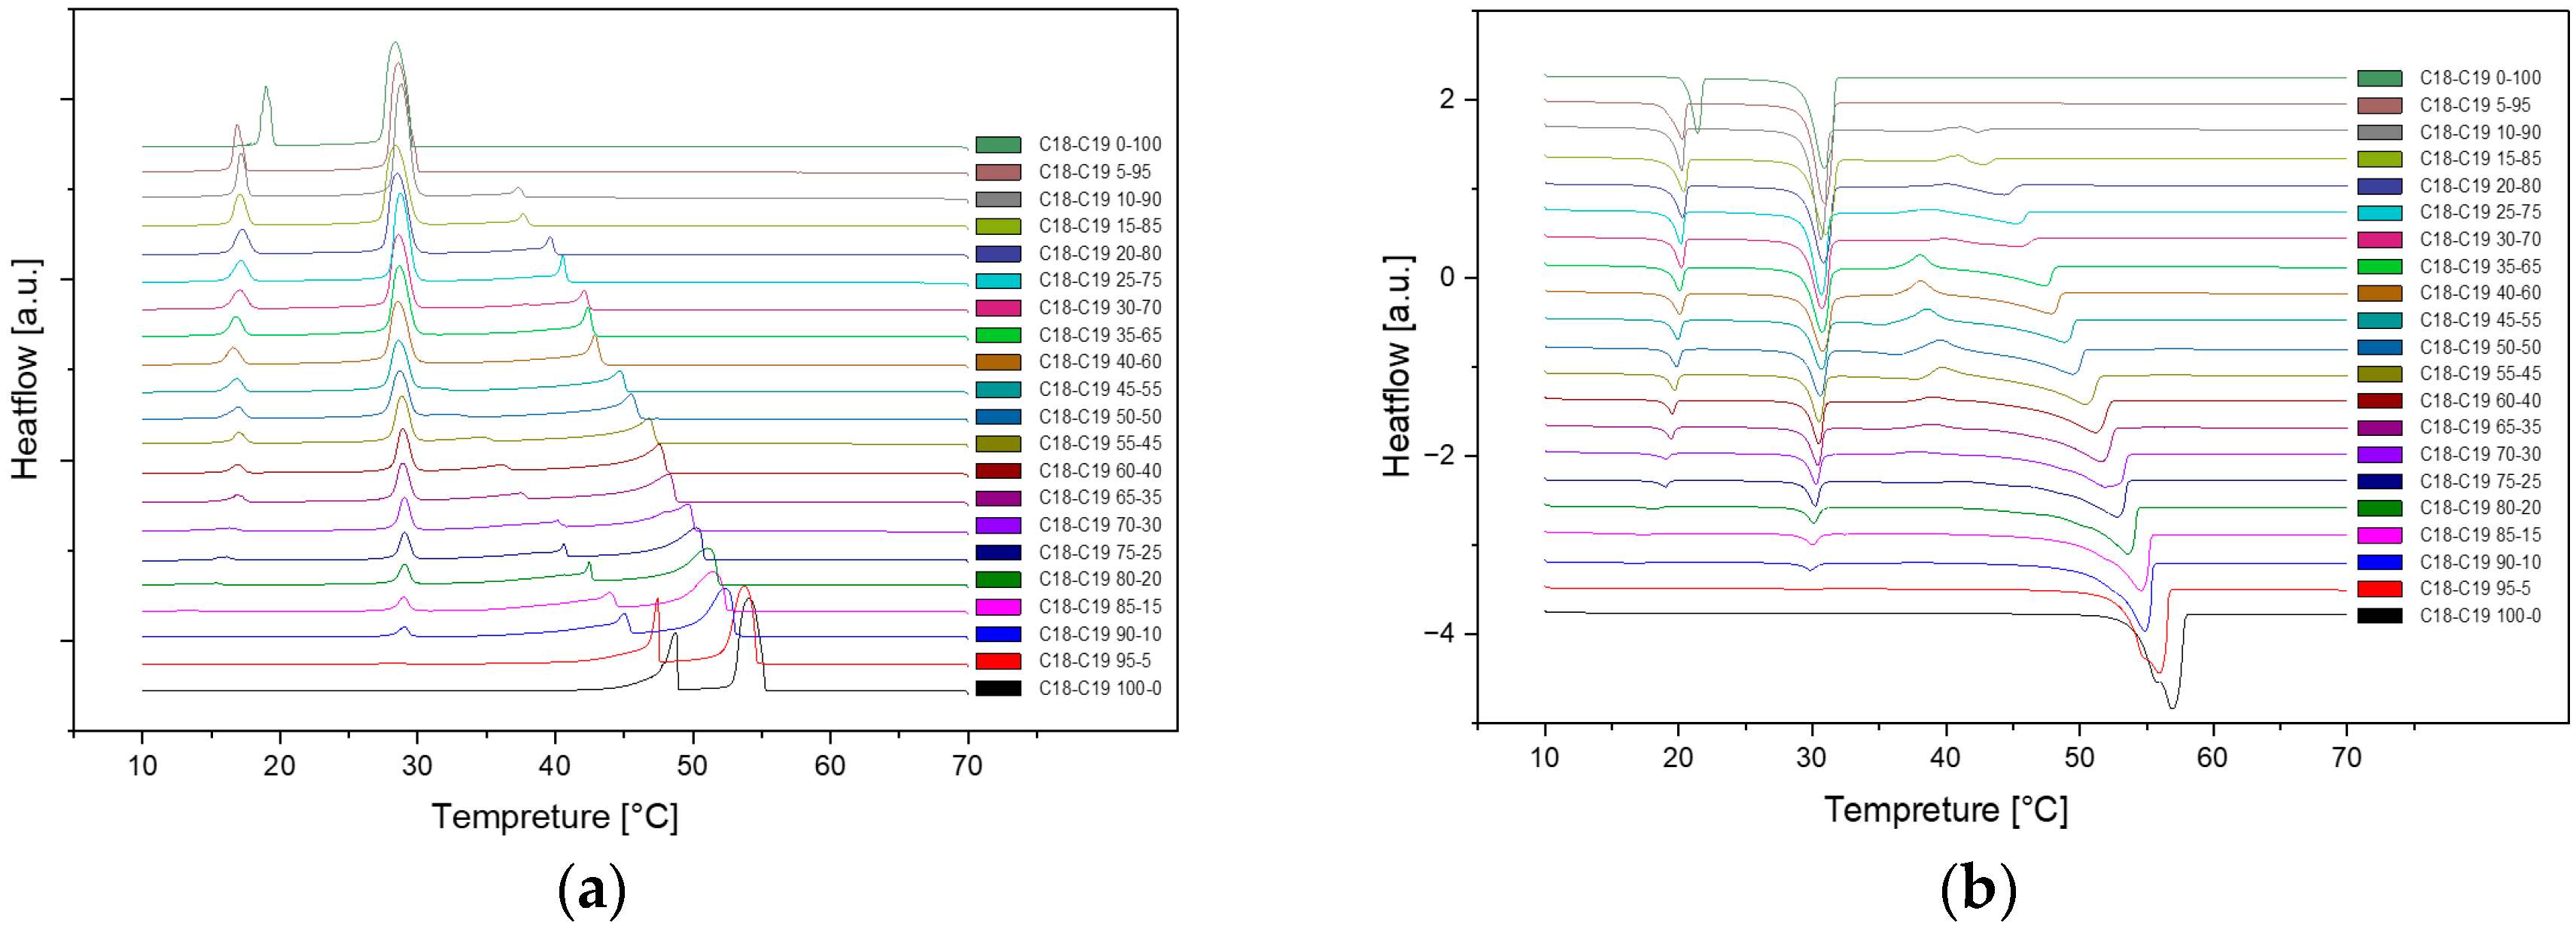
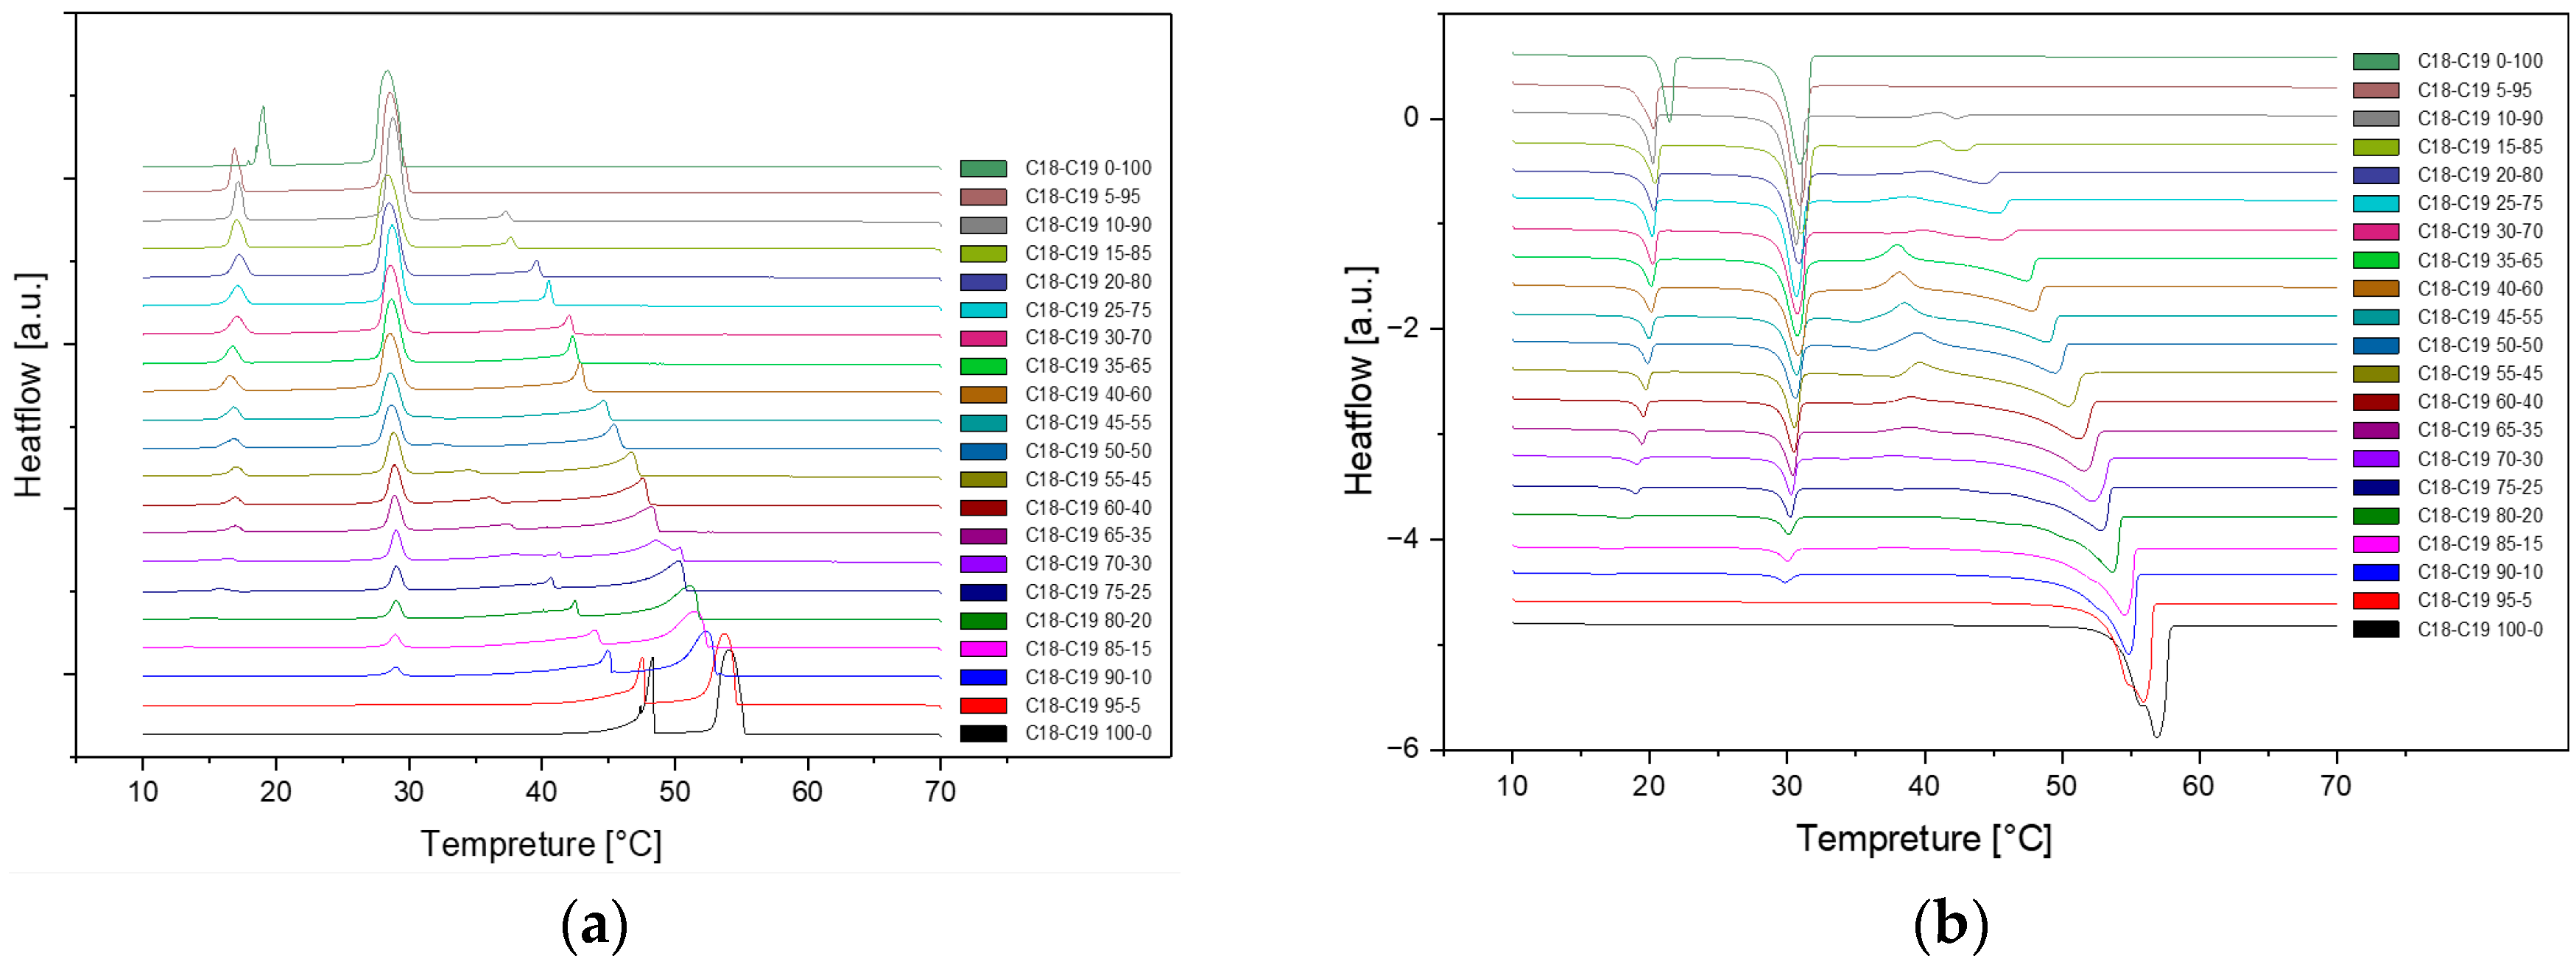
Here are the overall DSC diagrams at the rate of 1dCpm. The upper three are the cooling diagrams, and the rest are the heating diagrams.
Figure 2.
Cooling(a) and Heating(b) Phase diagram at 1℃/min (Cycle 1).
Figure 2.
Cooling(a) and Heating(b) Phase diagram at 1℃/min (Cycle 1).
Figure 3.
Cooling(a) and Heating(b) Phase diagram at 1℃/min (Cycle 2).
Figure 3.
Cooling(a) and Heating(b) Phase diagram at 1℃/min (Cycle 2).
Figure 4.
Cooling(a) and Heating(b) Phase diagram at 1℃/min (Cycle 3).
Figure 4.
Cooling(a) and Heating(b) Phase diagram at 1℃/min (Cycle 3).
As we can see, there are no distinct difference among these three cycles in cooling and heating rate at 1℃ per minute. So, the samples are extraordinarily stable during the three cycles at the same cooling and heating rate.
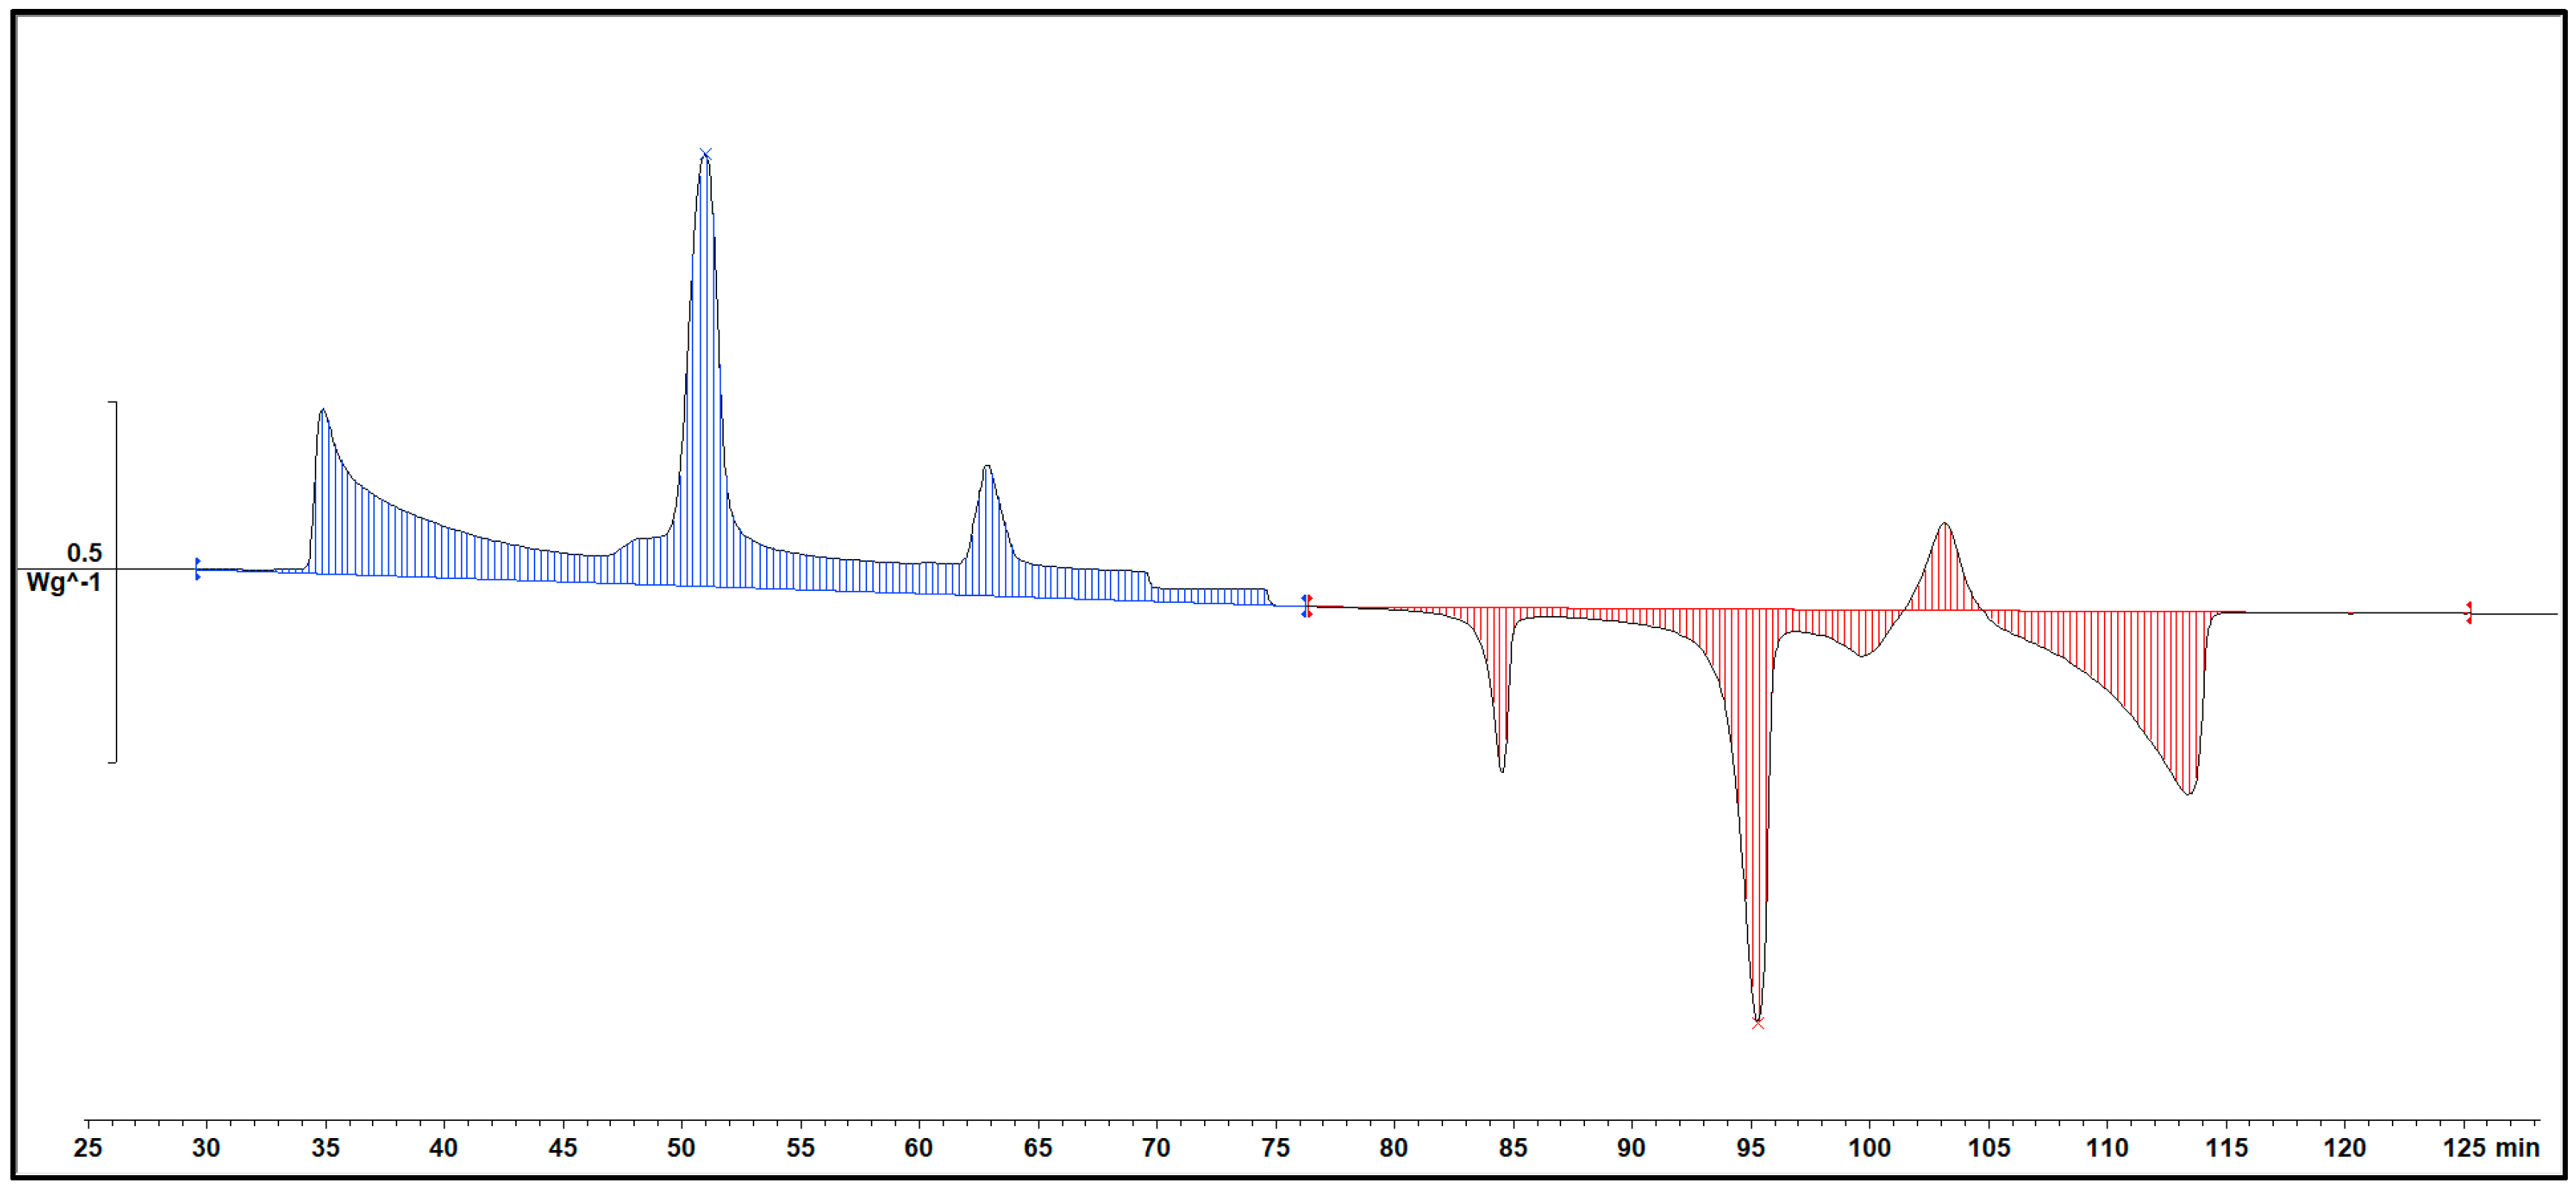
A Specific DSC diagram was shown below. These are the two parts for a whole DSC scanning. Blue part means the Cooling procedure of the sample, red part means the Heating part. Integral the peaks then we can get the area of each peak and that is the Enthalpy of each phase transition.
Figure 5.
An example of DSC diagram in STARe.
Figure 5.
An example of DSC diagram in STARe.
Two tables of Phase transition temperature and enthalpy value of each peak was obtained by concluding all DSC diagram.
Table 5.
Comparison of Transition Enthalpy between the Experimental Results and the Mean Values of the Literature.
Table 5.
Comparison of Transition Enthalpy between the Experimental Results and the Mean Values of the Literature.
| Cn
|
Molar Mass
(g/mol) |
Tm (K) |
ΔHm
(kJ/mol) |
TR-C (K) |
ΔHR-C
(kJ/mol) |
ΔHtotal
(kJ/mol) |
Reference |
| 18 |
270.49 |
330.3 |
- |
328.00 |
- |
- |
Miquel Àngel, 2021 [6]
|
| 328.2 |
44.742 |
321.78 |
15.756 |
60.498 |
This study |
| 19 |
268.52 |
304.9 |
45.580 |
295.5 |
13.750 |
59.330 |
Dirand et al., 2002 [5]
|
| 305.1 |
46.047 |
294.5 |
13.801 |
59.848 |
Cholakova et al., 2019 [7]
|
| 303.6 |
31.417 |
294.2 |
9.134 |
40.551 |
This study |
Table 6.
Comparison of Different Compositions between 1-Octadecanol and n-Nonadecane.
Table 6.
Comparison of Different Compositions between 1-Octadecanol and n-Nonadecane.
Composition
(C18OH %) |
Mw (g/mol) |
Tm (K) |
ΔHm
(kJ/mol) |
TR-γ (K) |
ΔHR-γ
(kJ/mol) |
TL-RI (K) |
ΔHL-RI
(kJ/mol) |
TR-Oi
(K) |
ΔHR-Oi
(kJ/mol) |
ΔHtotal
(kJ/mol) |
| 0 |
268.5200 |
303.60 |
9.134 |
- |
- |
301.79 |
31.417 |
- |
- |
40.551 |
| 5 |
268.6185 |
305.02 |
7.211 |
- |
- |
301.89 |
31.093 |
- |
- |
38.304 |
| 10 |
268.7170 |
308.33 |
3.727 |
- |
- |
302.03 |
28.532 |
290.27 |
6.909 |
39.168 |
| 15 |
268.8155 |
316.75 |
4.449 |
- |
- |
301.71 |
27.107 |
290.18 |
6.804 |
38.36 |
| 20 |
268.9140 |
318.38 |
6.868 |
- |
- |
301.81 |
26.061 |
290.30 |
6.4619 |
39.391 |
| 25 |
269.0125 |
319.15 |
8.248 |
- |
- |
301.97 |
24.074 |
290.21 |
5.617 |
37.939 |
| 30 |
269.1110 |
319.62 |
9.368 |
- |
- |
301.86 |
22.662 |
290.11 |
5.253 |
37.283 |
| 35 |
269.2095 |
321.05 |
11.853 |
- |
- |
301.91 |
21.542 |
289.87 |
4.937 |
38.332 |
| 40 |
269.3080 |
321.55 |
13.024 |
- |
- |
301.84 |
21.203 |
289.69 |
4.551 |
38.778 |
| 45 |
269.4065 |
322.61 |
13.899 |
- |
- |
301.80 |
18.306 |
1289.83 |
3.483 |
35.688 |
| 50 |
269.5050 |
323.3 |
15.669 |
305.48 |
2.647 |
301.87 |
15.402 |
289.98 |
3.339 |
37.057 |
| 55 |
269.6035 |
324.42 |
17.565 |
307.68 |
4.341 |
302.02 |
13.270 |
290.07 |
2.879 |
38.055 |
| 60 |
269.7020 |
325.25 |
18.127 |
309.11 |
5.453 |
302.09 |
11.373 |
289.97 |
2.368 |
37.321 |
| 65 |
269.8005 |
325.62 |
19.431 |
310.47 |
6.904 |
302.07 |
10.279 |
289.78 |
1.983 |
38.597 |
| 70 |
269.8990 |
326.41 |
20.569 |
312.95 |
9.471 |
302.15 |
8.461 |
289.16 |
1.636 |
40.137 |
| 75 |
269.9975 |
326.55 |
19.872 |
313.68 |
9.080 |
302.14 |
5.989 |
289.91 |
1.237 |
36.178 |
| 80 |
270.0960 |
327.27 |
21.454 |
315.56 |
11.590 |
302.11 |
4.303 |
- |
- |
37.347 |
| 85 |
270.1945 |
328.26 |
21.983 |
317.07 |
13.839 |
302.04 |
3.132 |
- |
- |
38.954 |
| 90 |
270.2930 |
328.42 |
22.891 |
318.07 |
13.836 |
- |
- |
- |
- |
36.727 |
| 95 |
270.3915 |
329.6 |
26.114 |
320.77 |
15.407 |
- |
- |
- |
- |
41.521 |
| 100 |
270.4900 |
329.86 |
44.742 |
321.85 |
15.756 |
- |
- |
- |
- |
60.498 |
3.1.2. Cooling rate at 0.75℃/min and 0.5℃/min
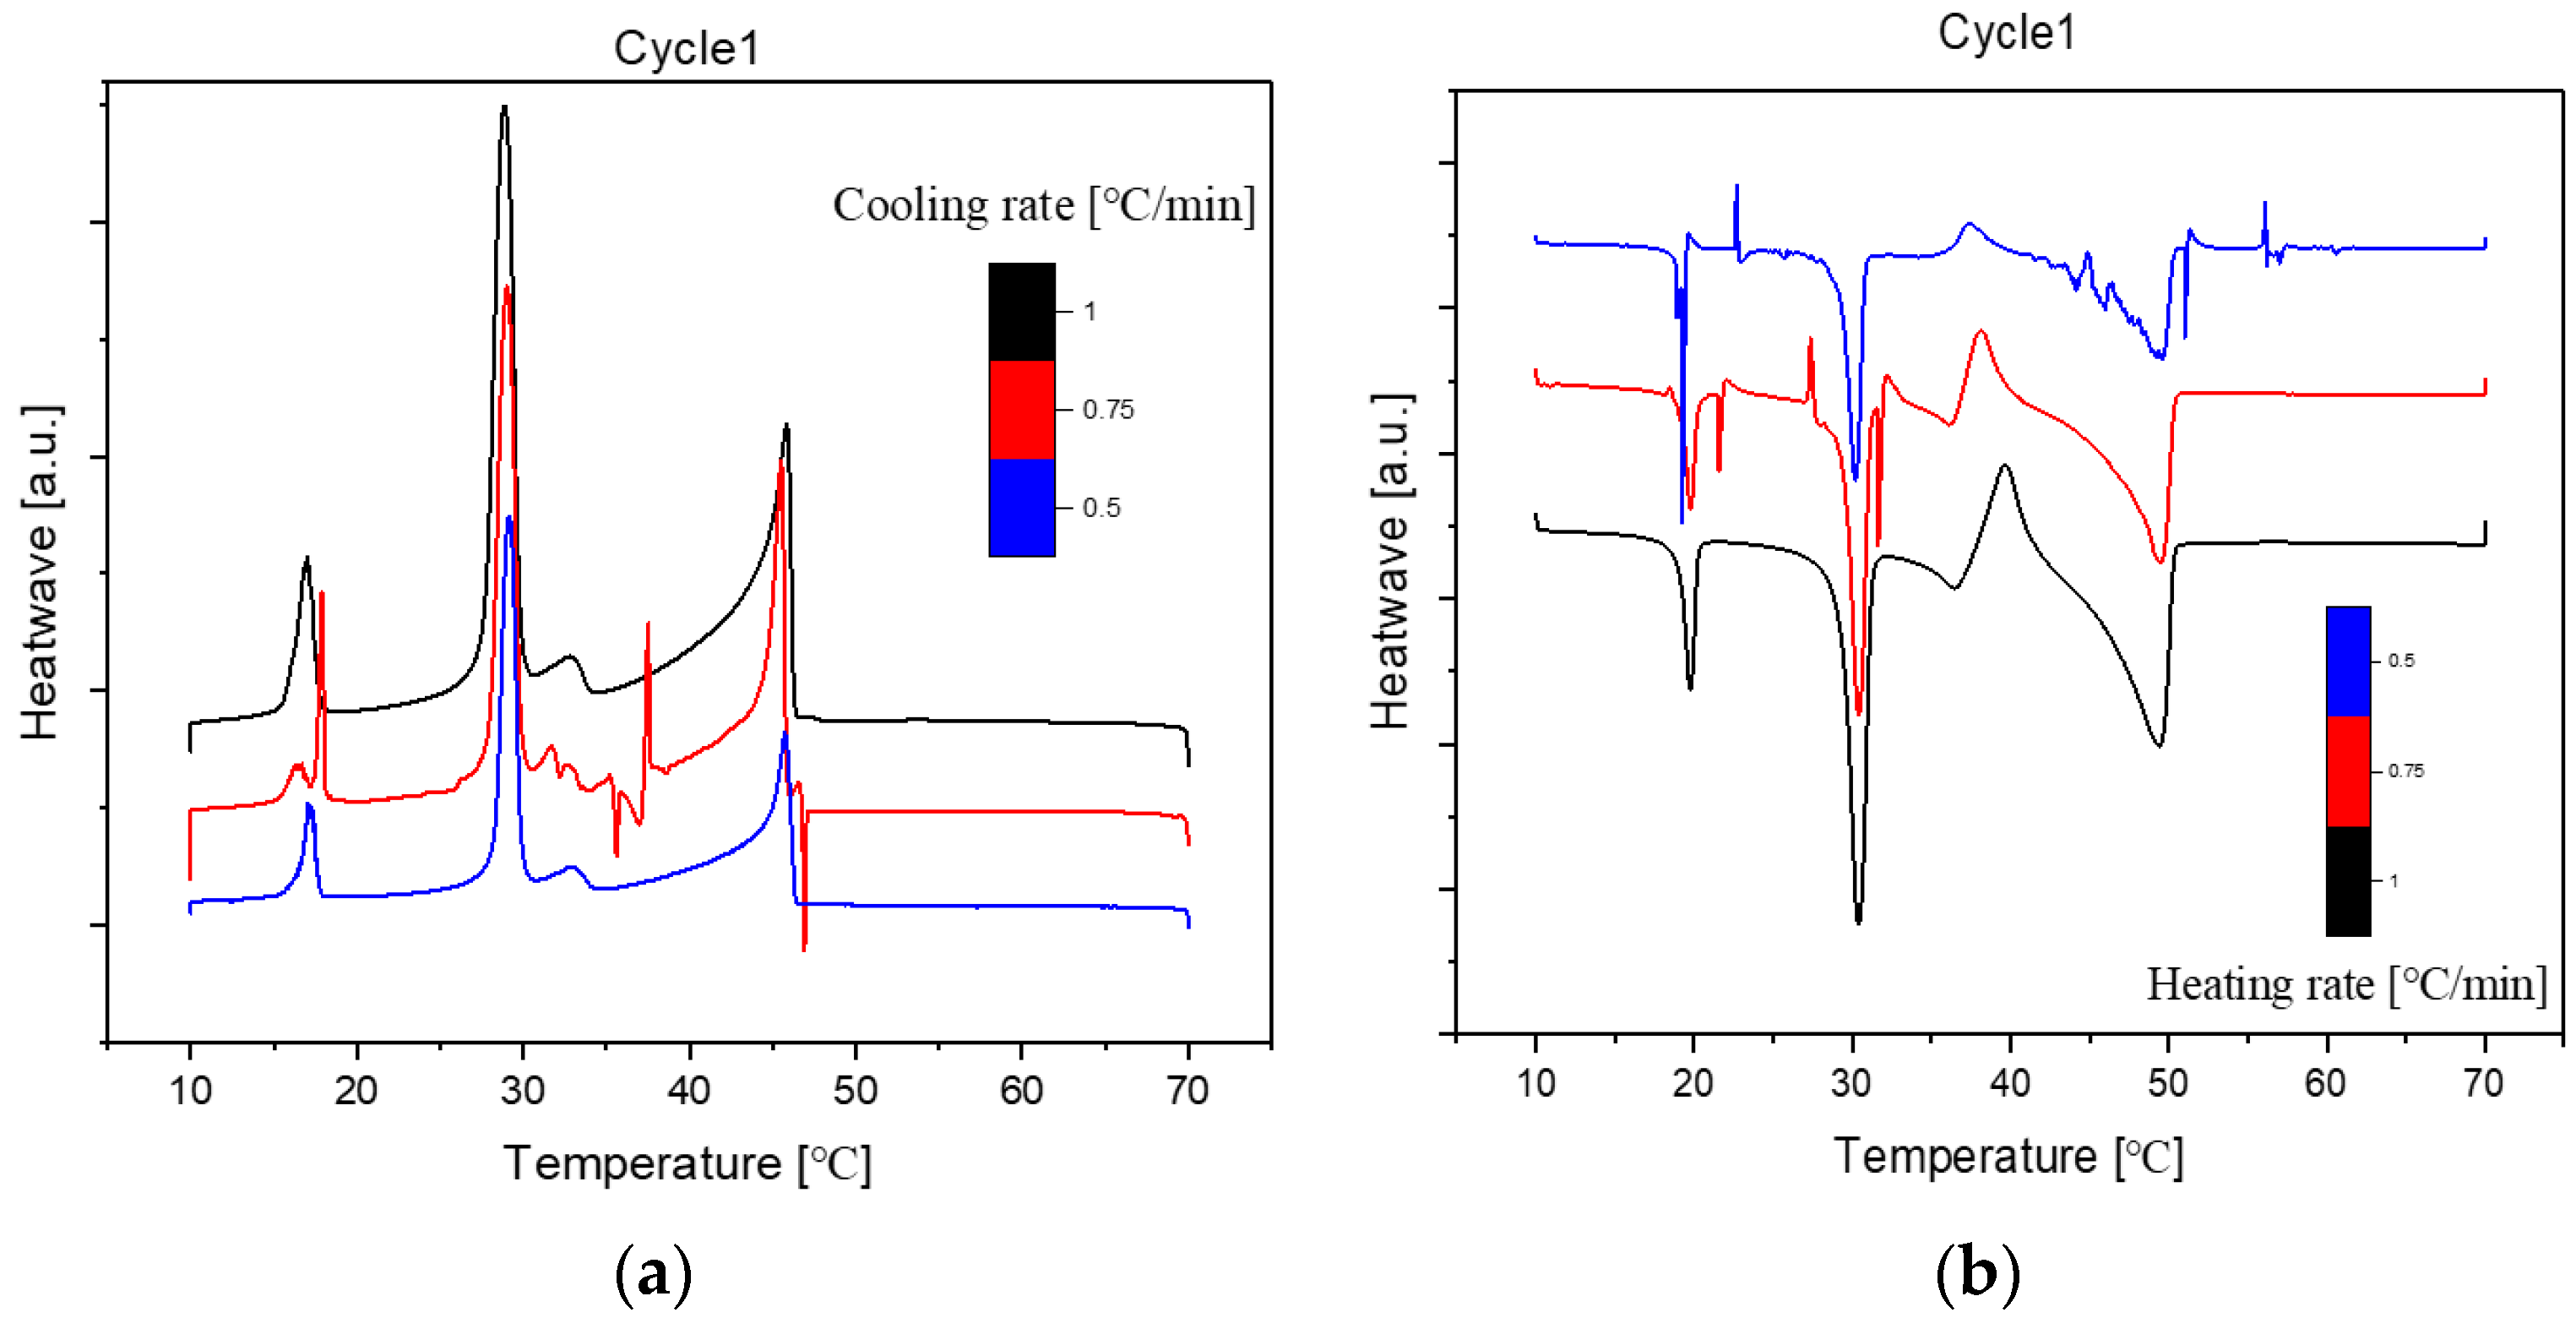
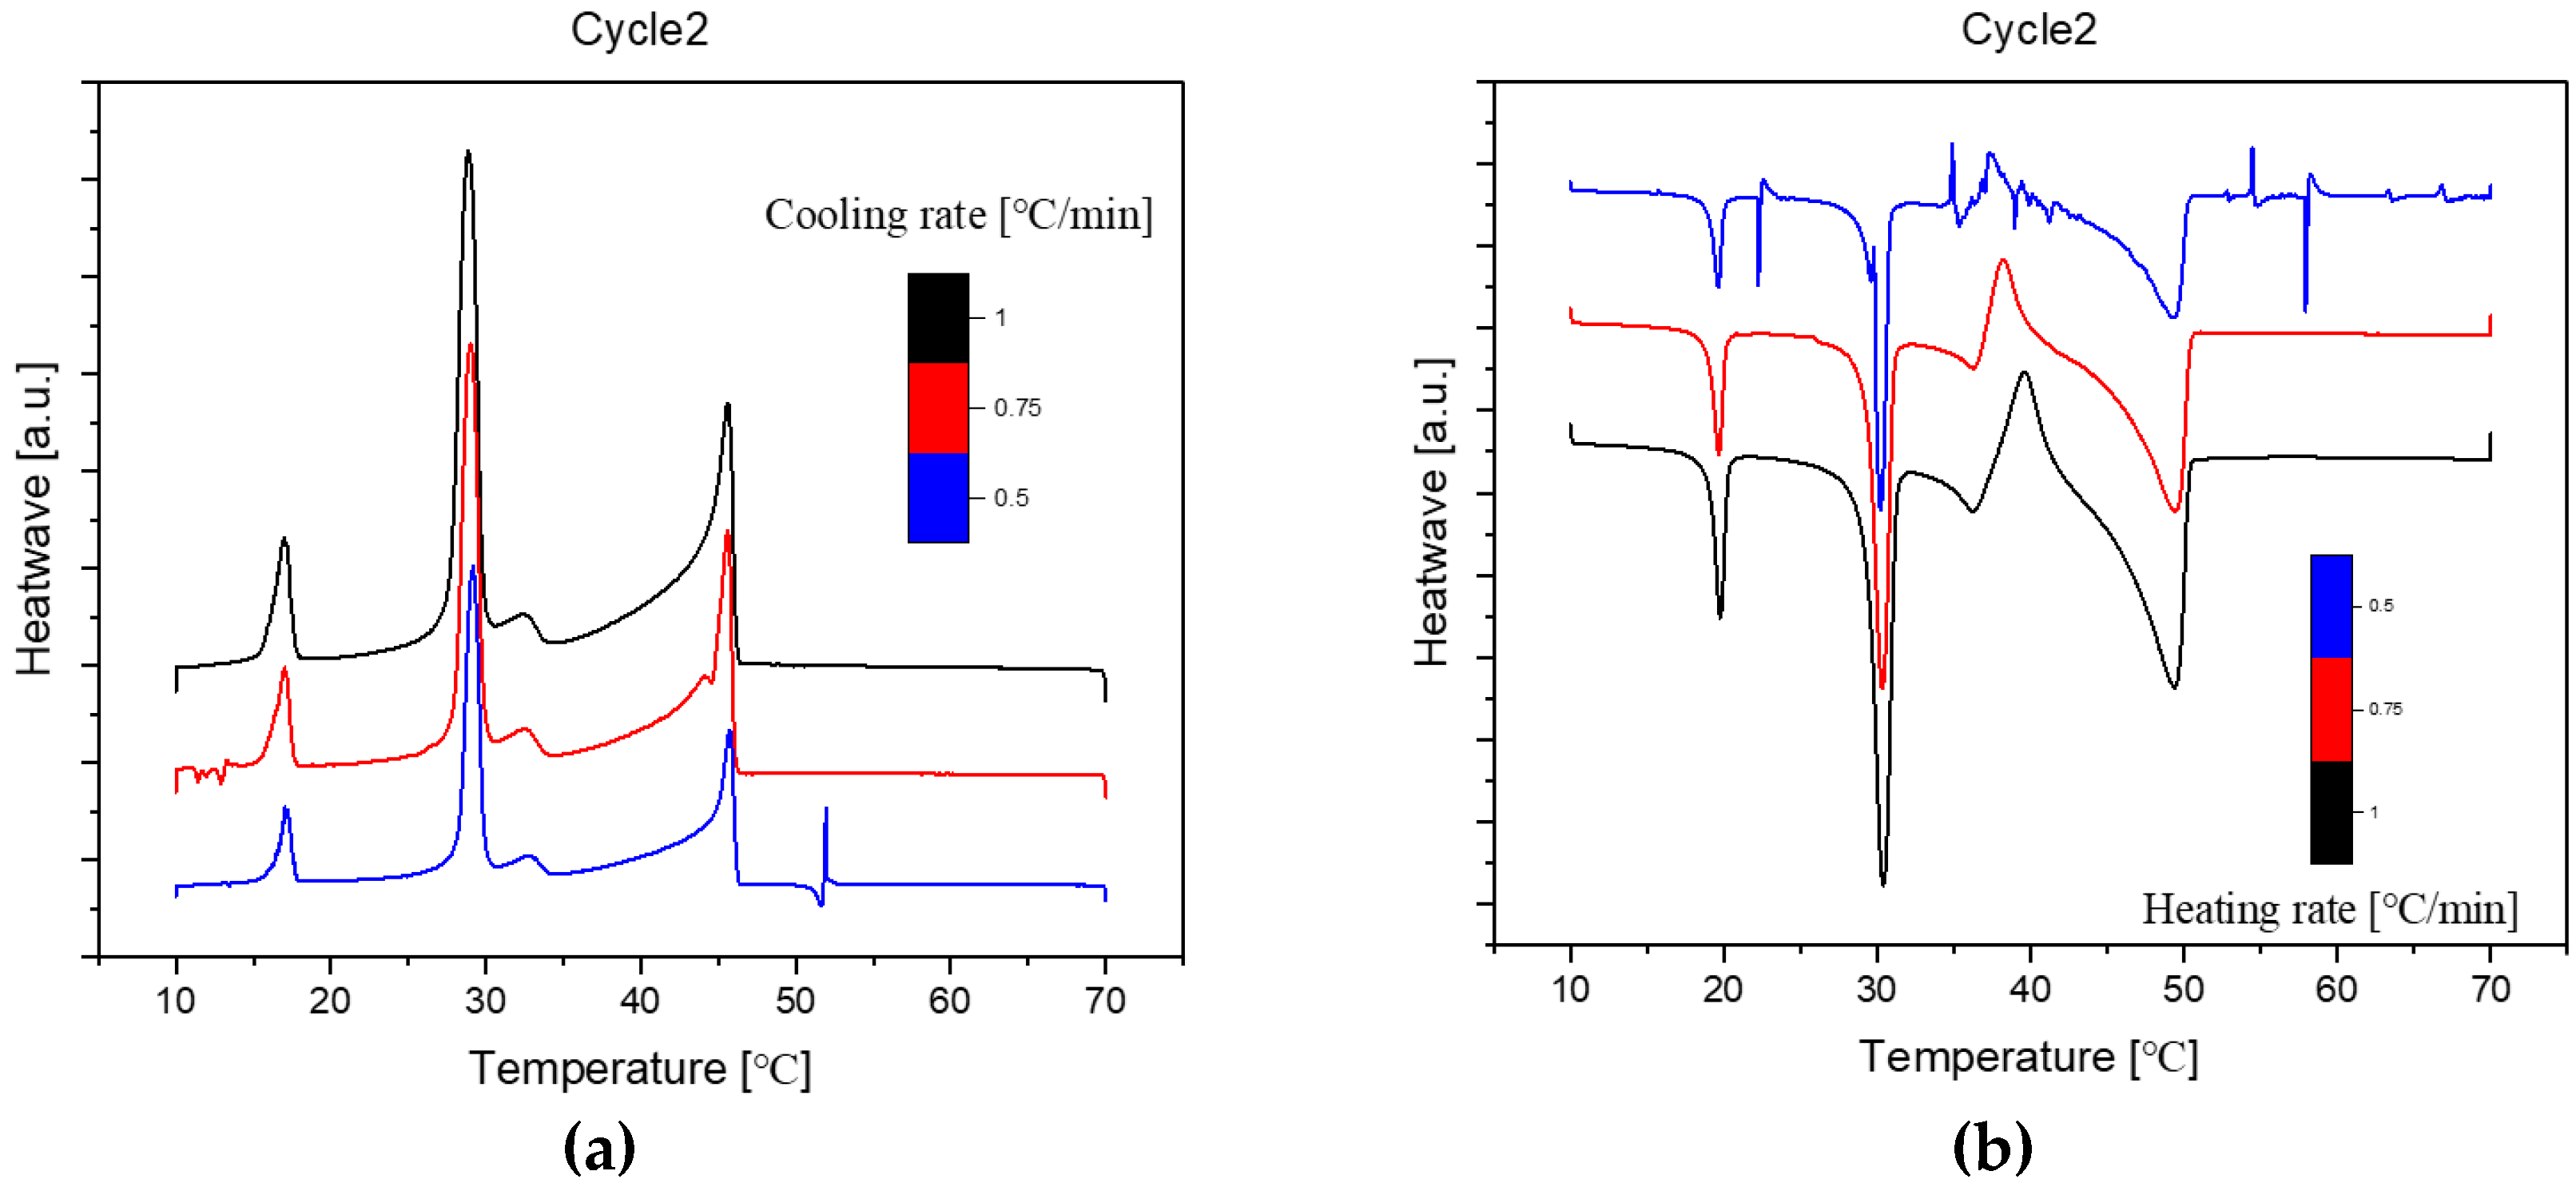
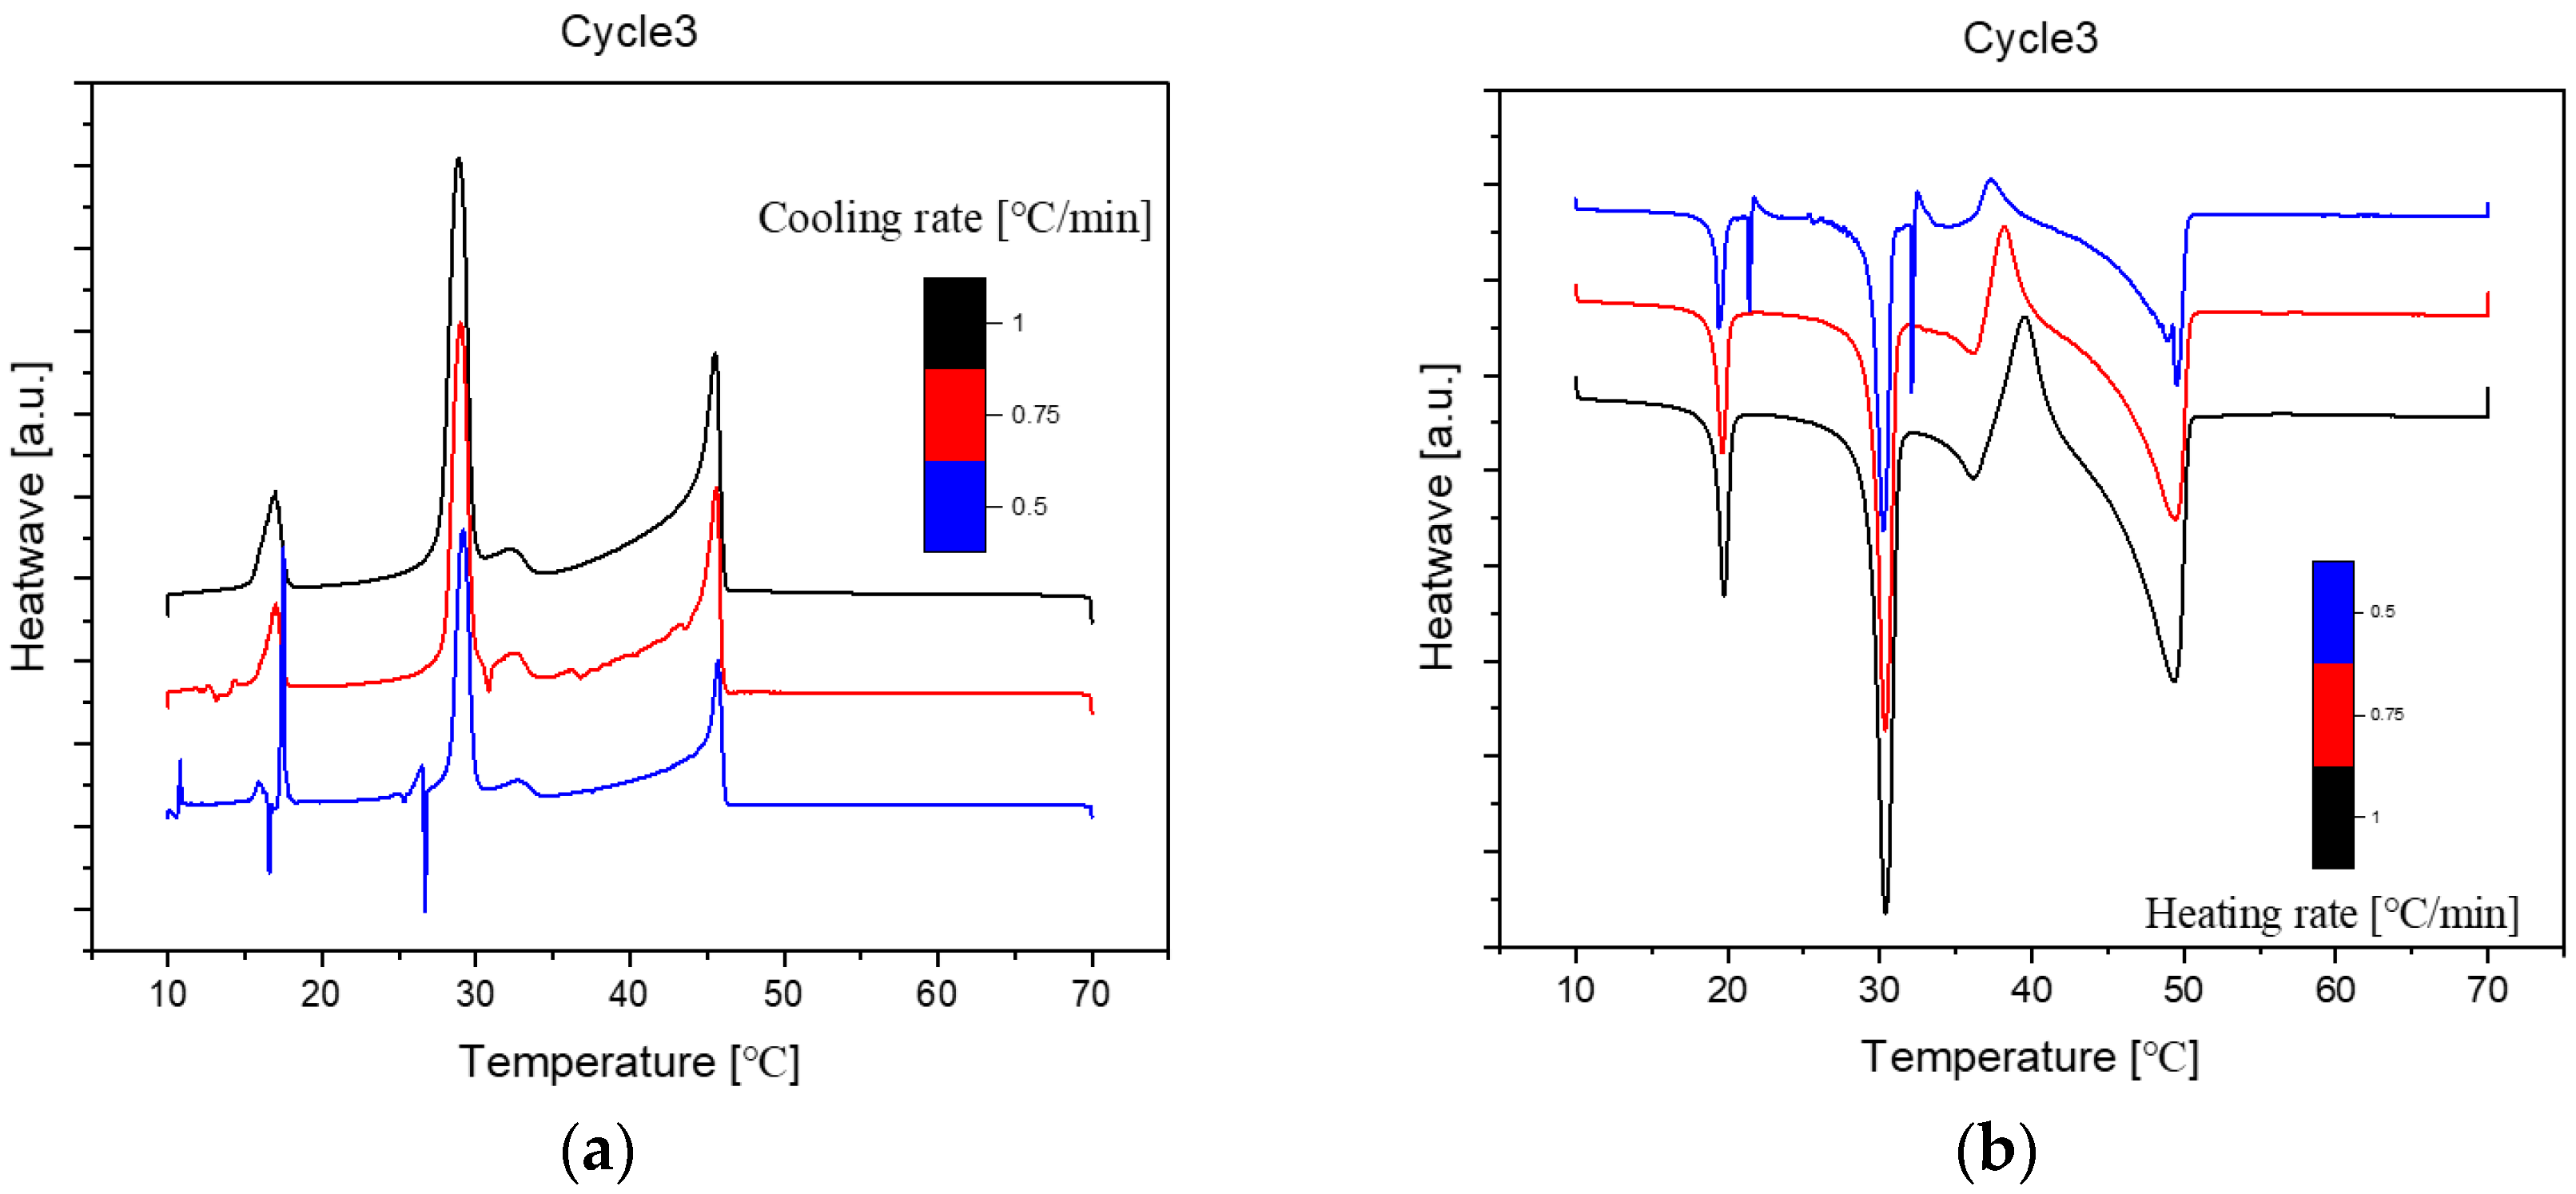
The DSC diagrams at different cooling or heating rates for the same sample are shown below. The sample was No.11, and the composition was 50% n-Nonadecane and 50% 1-Octadecanol. The altitude of the peaks was getting lower when the rate went down. It is because the rate of temperature rise during sample testing has a significant impact on resolution and sensitivity. In general, the faster the rate of warming, the lower the resolution and the higher the sensitivity. Conversely, the higher the resolution, the lower the sensitivity. As the ramp rate increases, the melt peak onset temperature does not change much, while the peak top and end temperatures increase, and the peak shape becomes wider. During the ramp-up process, fast ramp-ups lead to superimposed thermal effects, and individual peaks or melts of different phases are not well separated. During the cooling down process, the cooling rate affects the crystallization behavior, and a fast-cooling rate leads to a delay in crystallization, but this method can be used to optimize the processing of the product.
Besides, the overall peak shape was similar to the diagram at which the rate of 1℃/min. It means the sample we used for different-rate scanning was stable, so that can conclude the So it can be deduced that all samples are at the same stability.
Figure 6.
Differential Scanning Calorimetry (DSC) diagram at cooling(a)/ heating(b) different rates (1,0.75,0.5℃/min, Cycle 1).
Figure 6.
Differential Scanning Calorimetry (DSC) diagram at cooling(a)/ heating(b) different rates (1,0.75,0.5℃/min, Cycle 1).
Figure 7.
Differential Scanning Calorimetry (DSC) diagram at cooling(a)/ heating(b) different rates (1,0.75,0.5℃/min, Cycle 2).
Figure 7.
Differential Scanning Calorimetry (DSC) diagram at cooling(a)/ heating(b) different rates (1,0.75,0.5℃/min, Cycle 2).
Figure 8.
Differential Scanning Calorimetry (DSC) diagram at cooling(a)/ heating(b) different rates (1, 0.75, 0.5℃/min, Cycle 3).
Figure 8.
Differential Scanning Calorimetry (DSC) diagram at cooling(a)/ heating(b) different rates (1, 0.75, 0.5℃/min, Cycle 3).
3.1.3. Reproducibility
This part is the reproducibility of this experiment. Three samples were run at 1dCpm two more times and checked for the reproducibility of the whole experiment. As shown in
Figure 9, the shape and height of peaks are very similar, almost identical. So, we can confirm the reproducibility of this experiment was acceptable.
Figure 9.
Reproducibility Differential Scanning Calorimetry (DSC) diagram (1℃/min) with different compositions; (a)1-Octadecanol 0% / n-Nonadecane 100%; (b)1-Octadecanol 50% / n-Nonadecane 50%; (c)1-Octadecanol 100% / n-Nonadecane 0%.
Figure 9.
Reproducibility Differential Scanning Calorimetry (DSC) diagram (1℃/min) with different compositions; (a)1-Octadecanol 0% / n-Nonadecane 100%; (b)1-Octadecanol 50% / n-Nonadecane 50%; (c)1-Octadecanol 100% / n-Nonadecane 0%.
3.2. Phase diagram
3.2.1. Cooling phase diagram
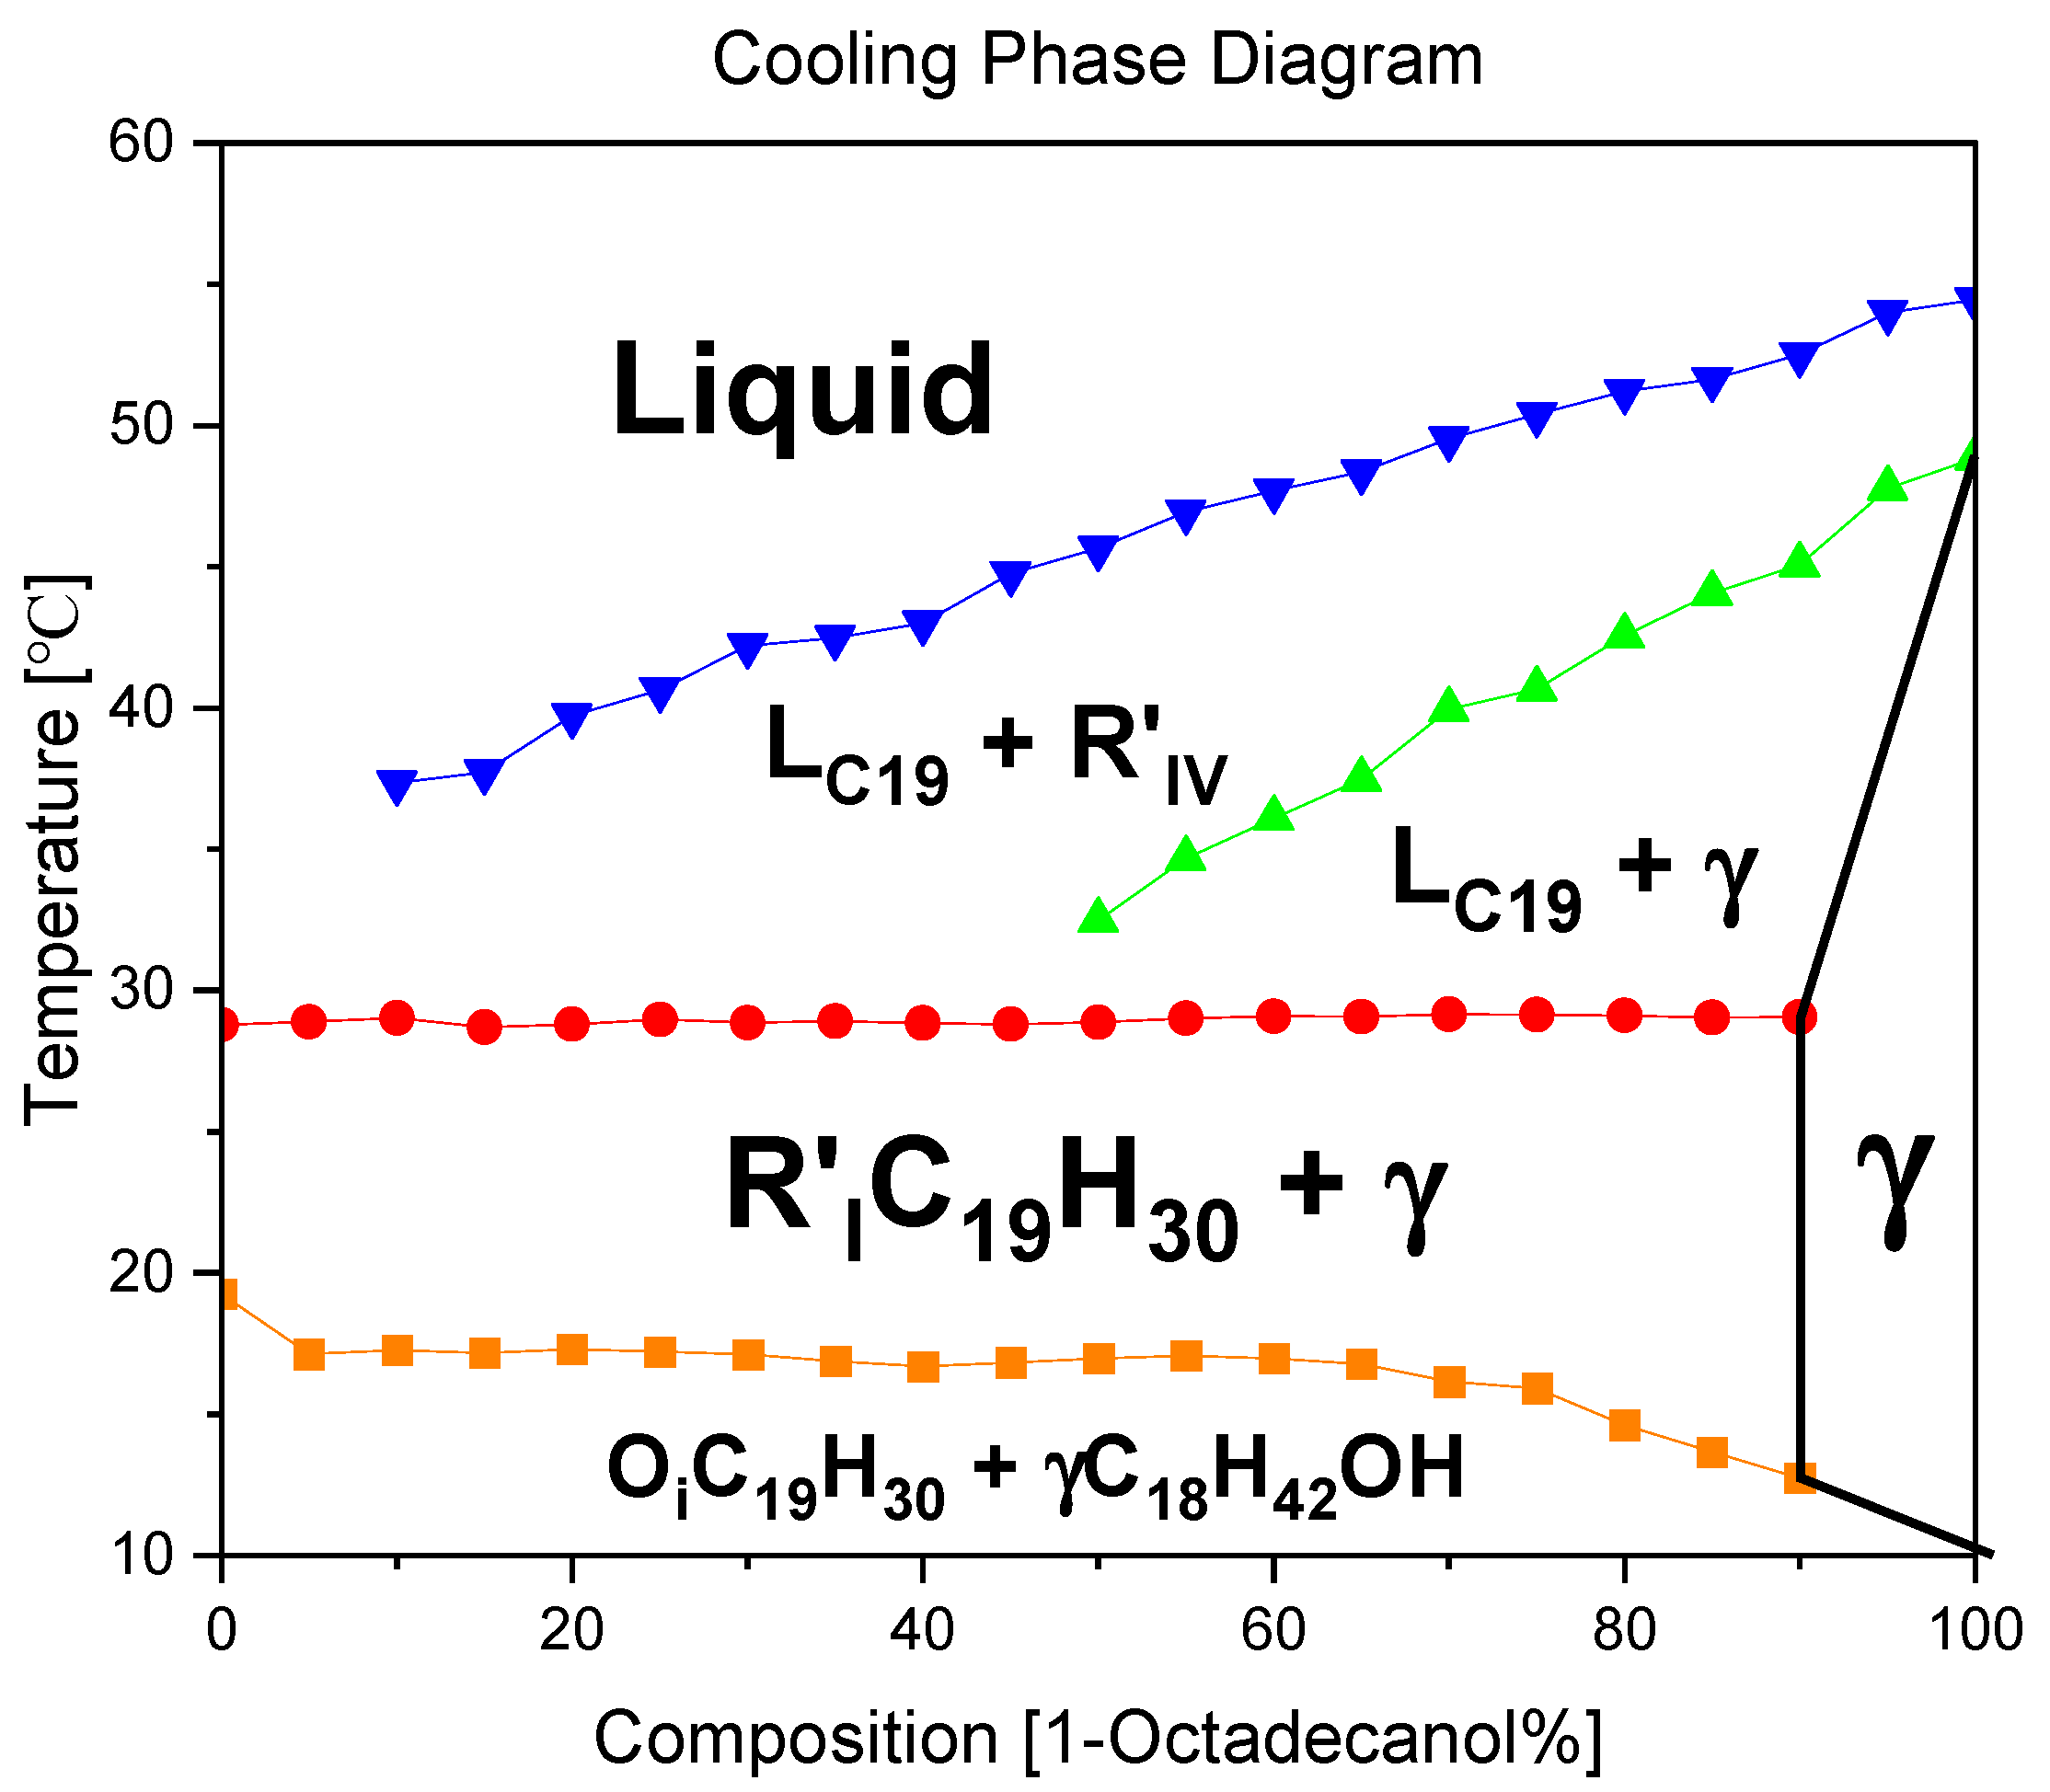
A binary system phase diagram was plotted by summarizing the peak temperatures in the DSC diagram. It shows the phase transitions of each partial material. We can confirm there’s no evidence of Eutectic/Peritectic reactions by reading the diagram.
From high temperature to low temperature, the phase transitions of 1-Octadecanol are Liquid → R’IV → Monoclinic (γ) (Cuevas-Diarte and Oonk, n.d.); on the other hand, the phase transitions of n-Nonadecane are Liquid → R’I → Orthorhombic (β).
[5]
Figure 10.
A binary system Phase Diagram of n-Nonadecane and 1-Octadecanol (Cooling) and Phases.
Figure 10.
A binary system Phase Diagram of n-Nonadecane and 1-Octadecanol (Cooling) and Phases.
3.2.2. Heating phase diagram
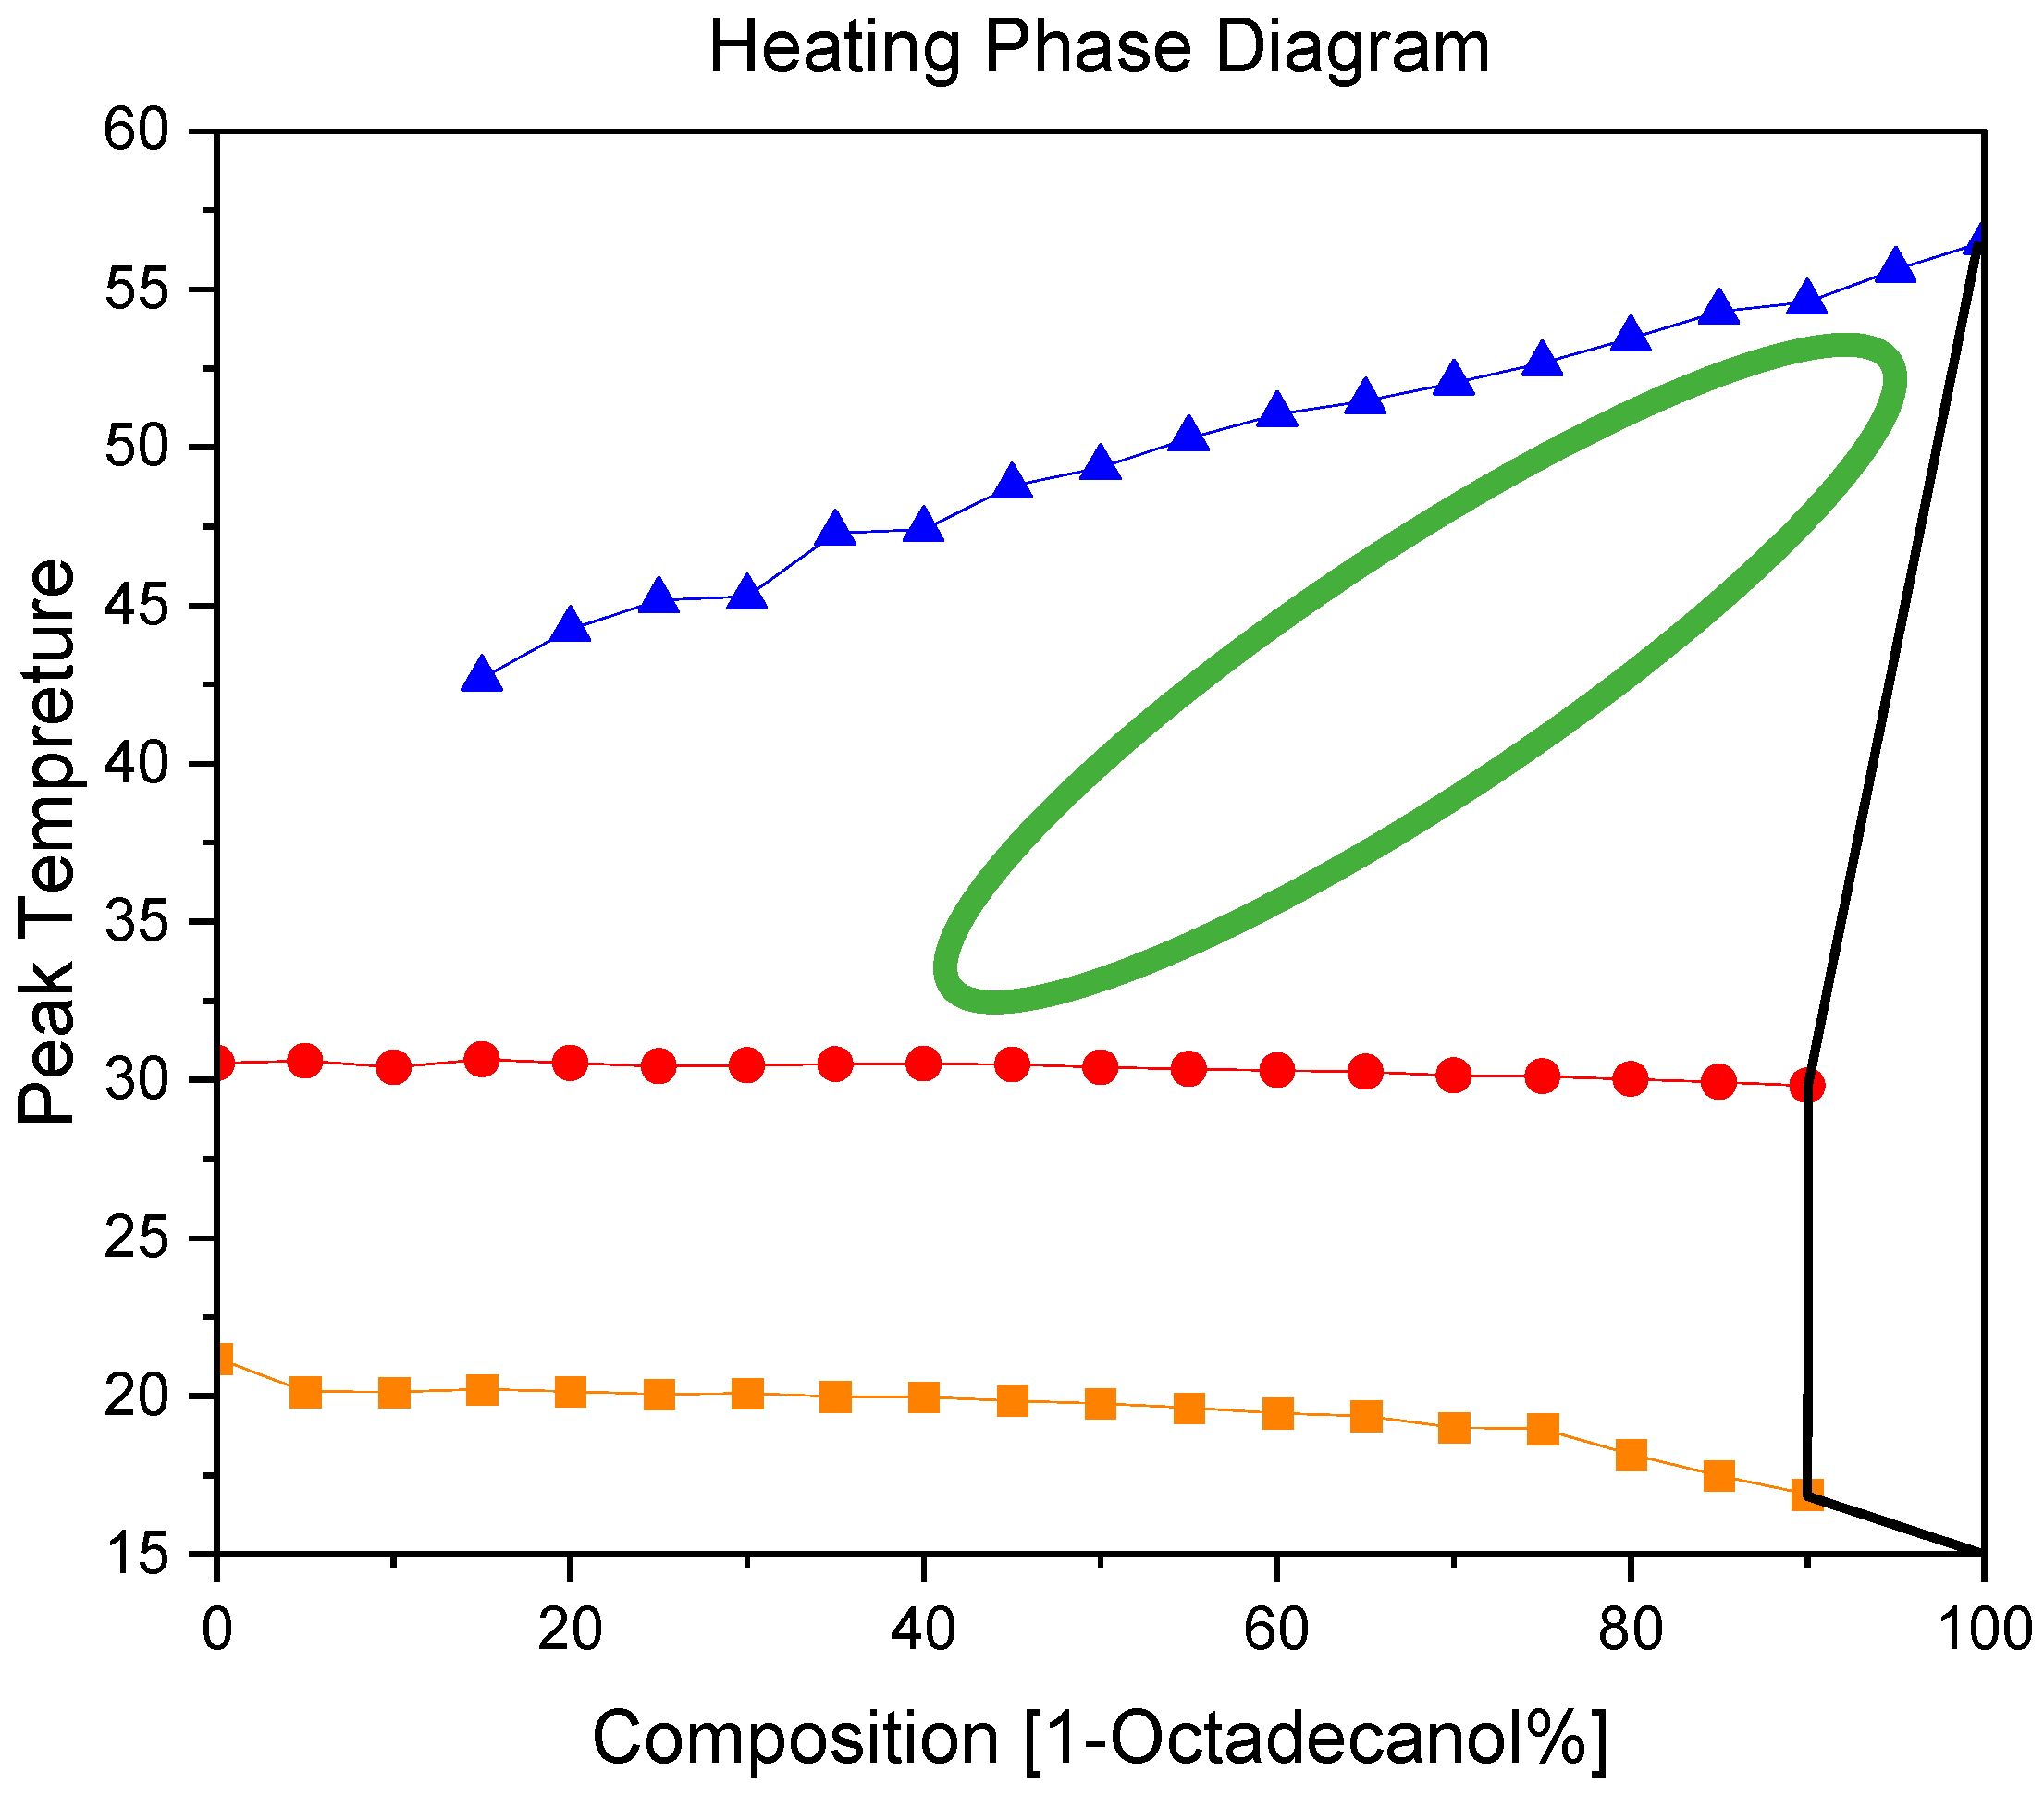
Comparing the Cooling and Heating Phase diagram, we can see the phase transition of 1-Octadecanol, which went from a stable phase into a rotator phase disappeared. It means the disordered phase is not thermodynamically stable in during heating. However, there was a phase transition there, but it was too weak, not strong enough for DSC to recognize it.
Figure 11.
A binary system Phase Diagram of n-Nonadecane and 1-Octadecanol (Heating).
Figure 11.
A binary system Phase Diagram of n-Nonadecane and 1-Octadecanol (Heating).
3.3. FTIR spectra
Seven of the samples in
Table 3.4 were utilized for the FTIR analysis. These seven samples’ composition are: 100%, 80%, 60%, 50%, 40%, 20%, 0% in percentage of 1-Octadecanol.
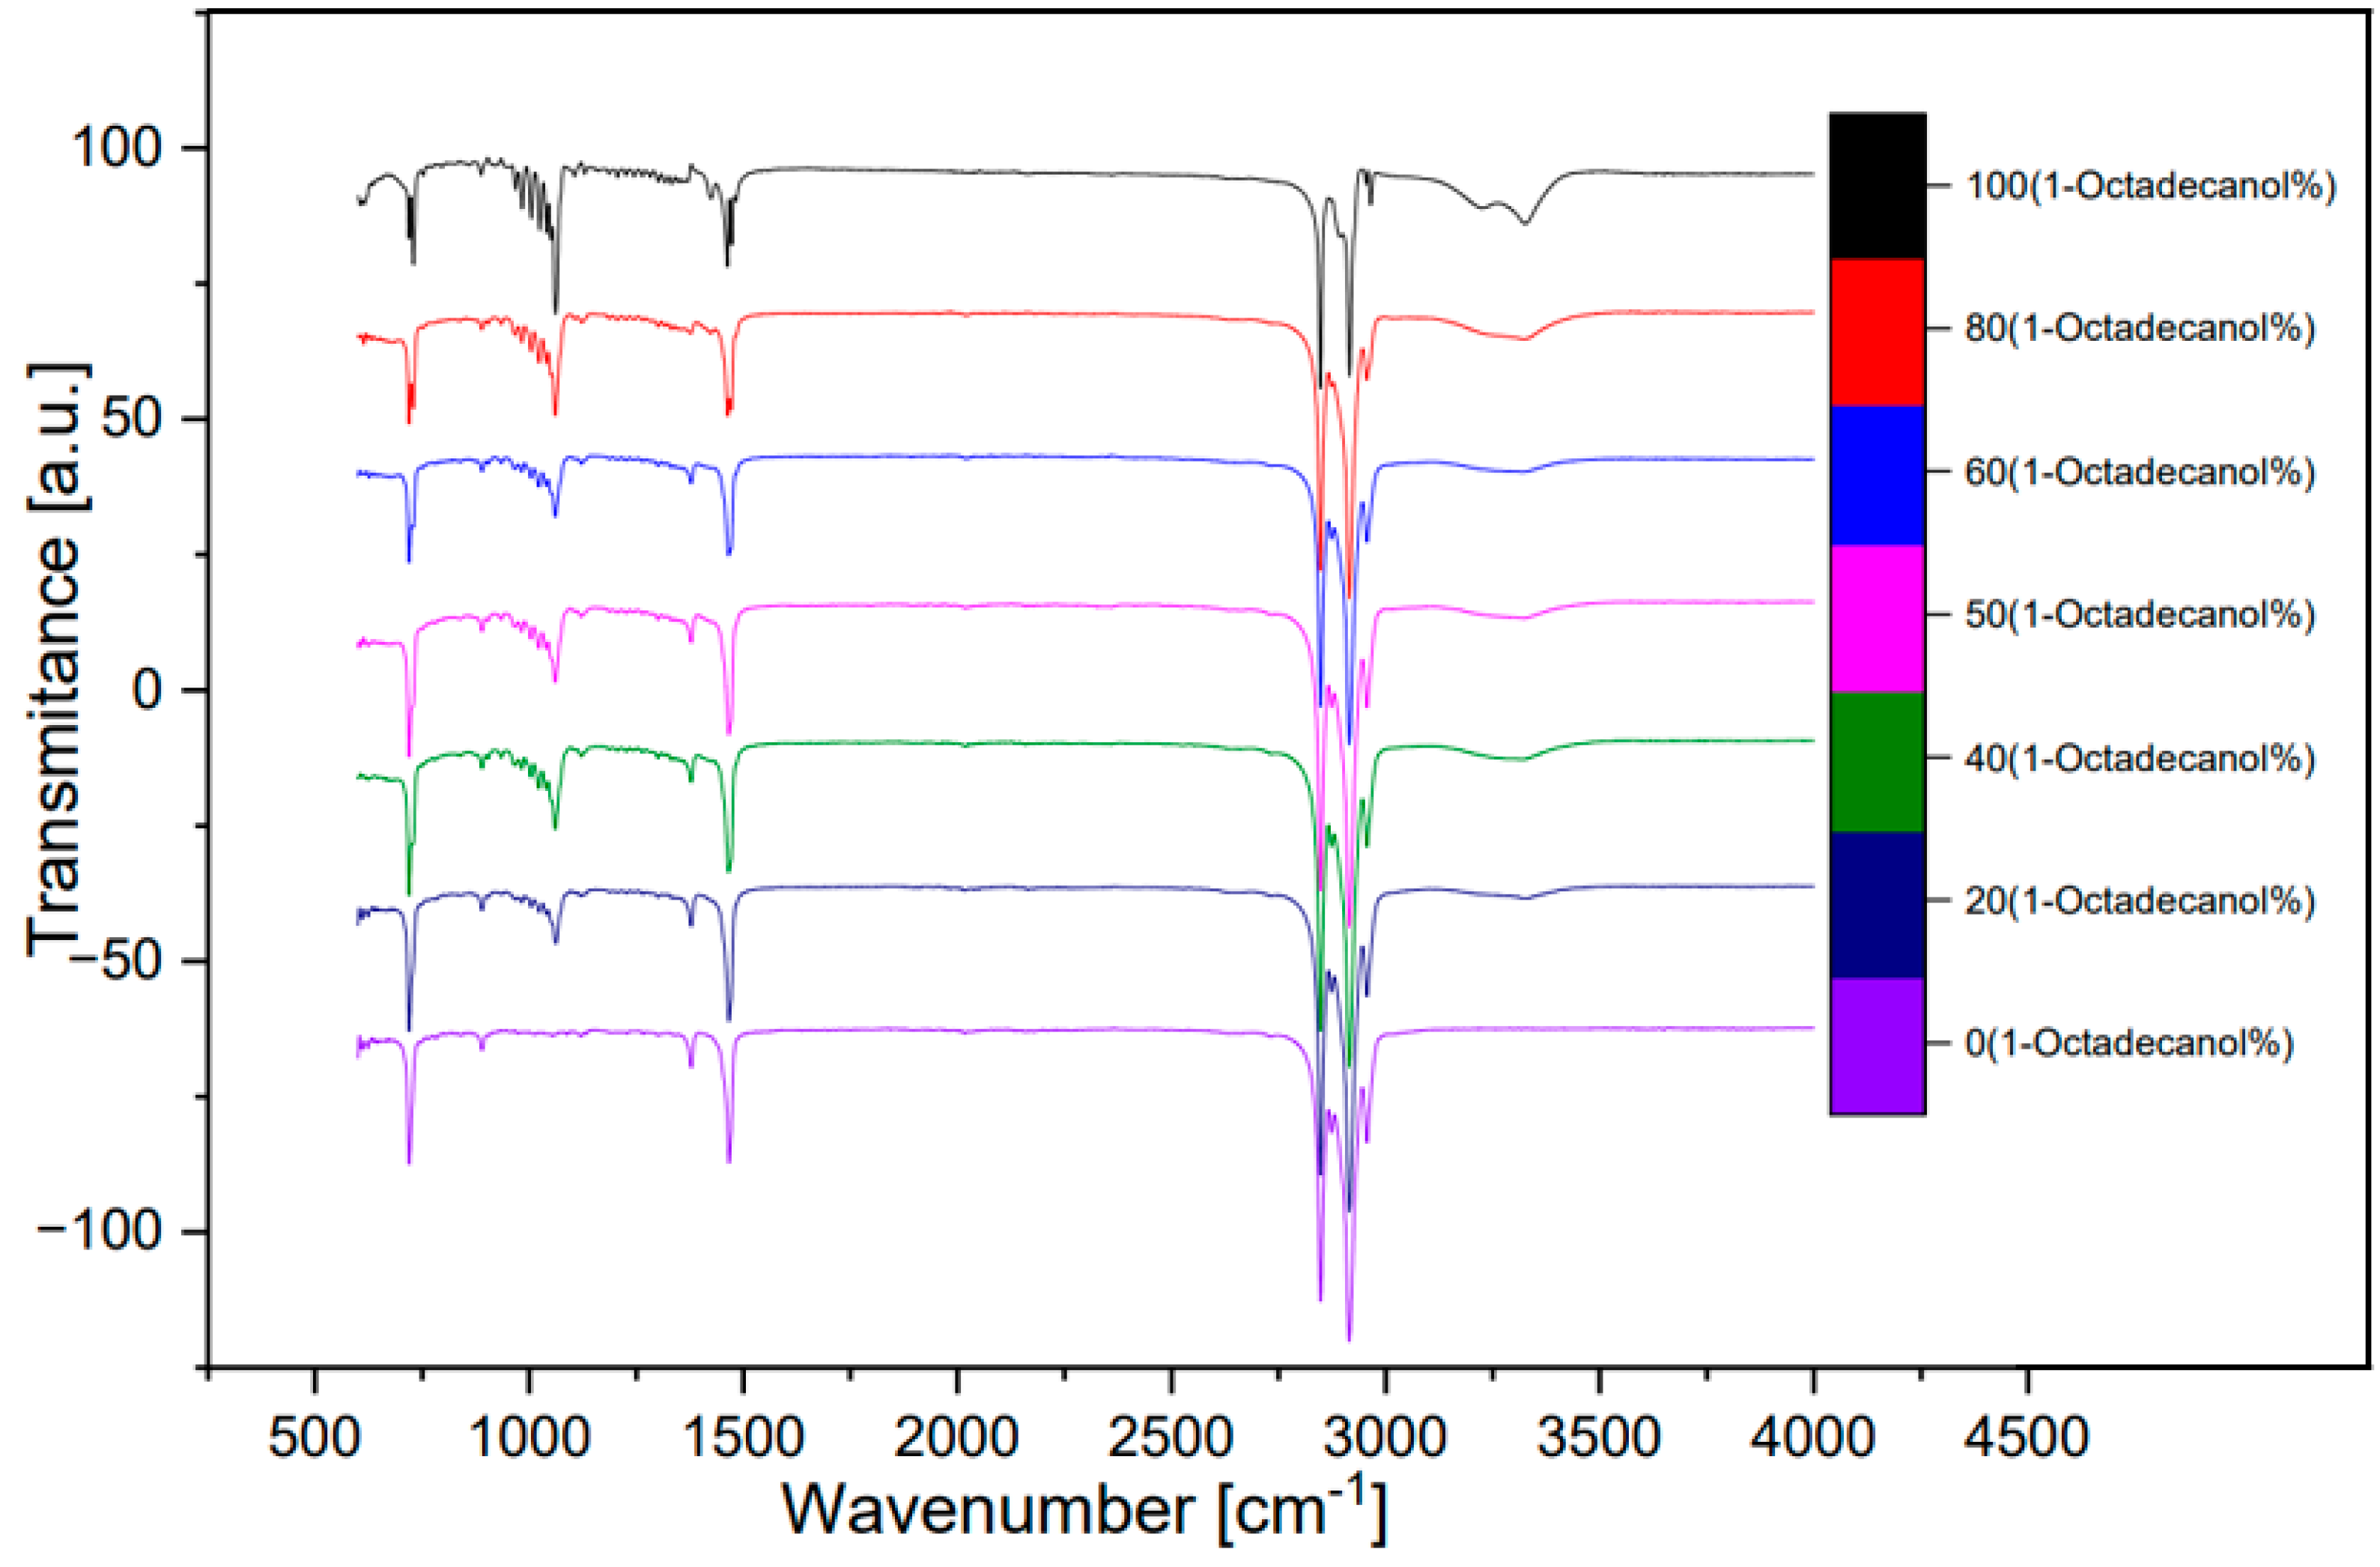
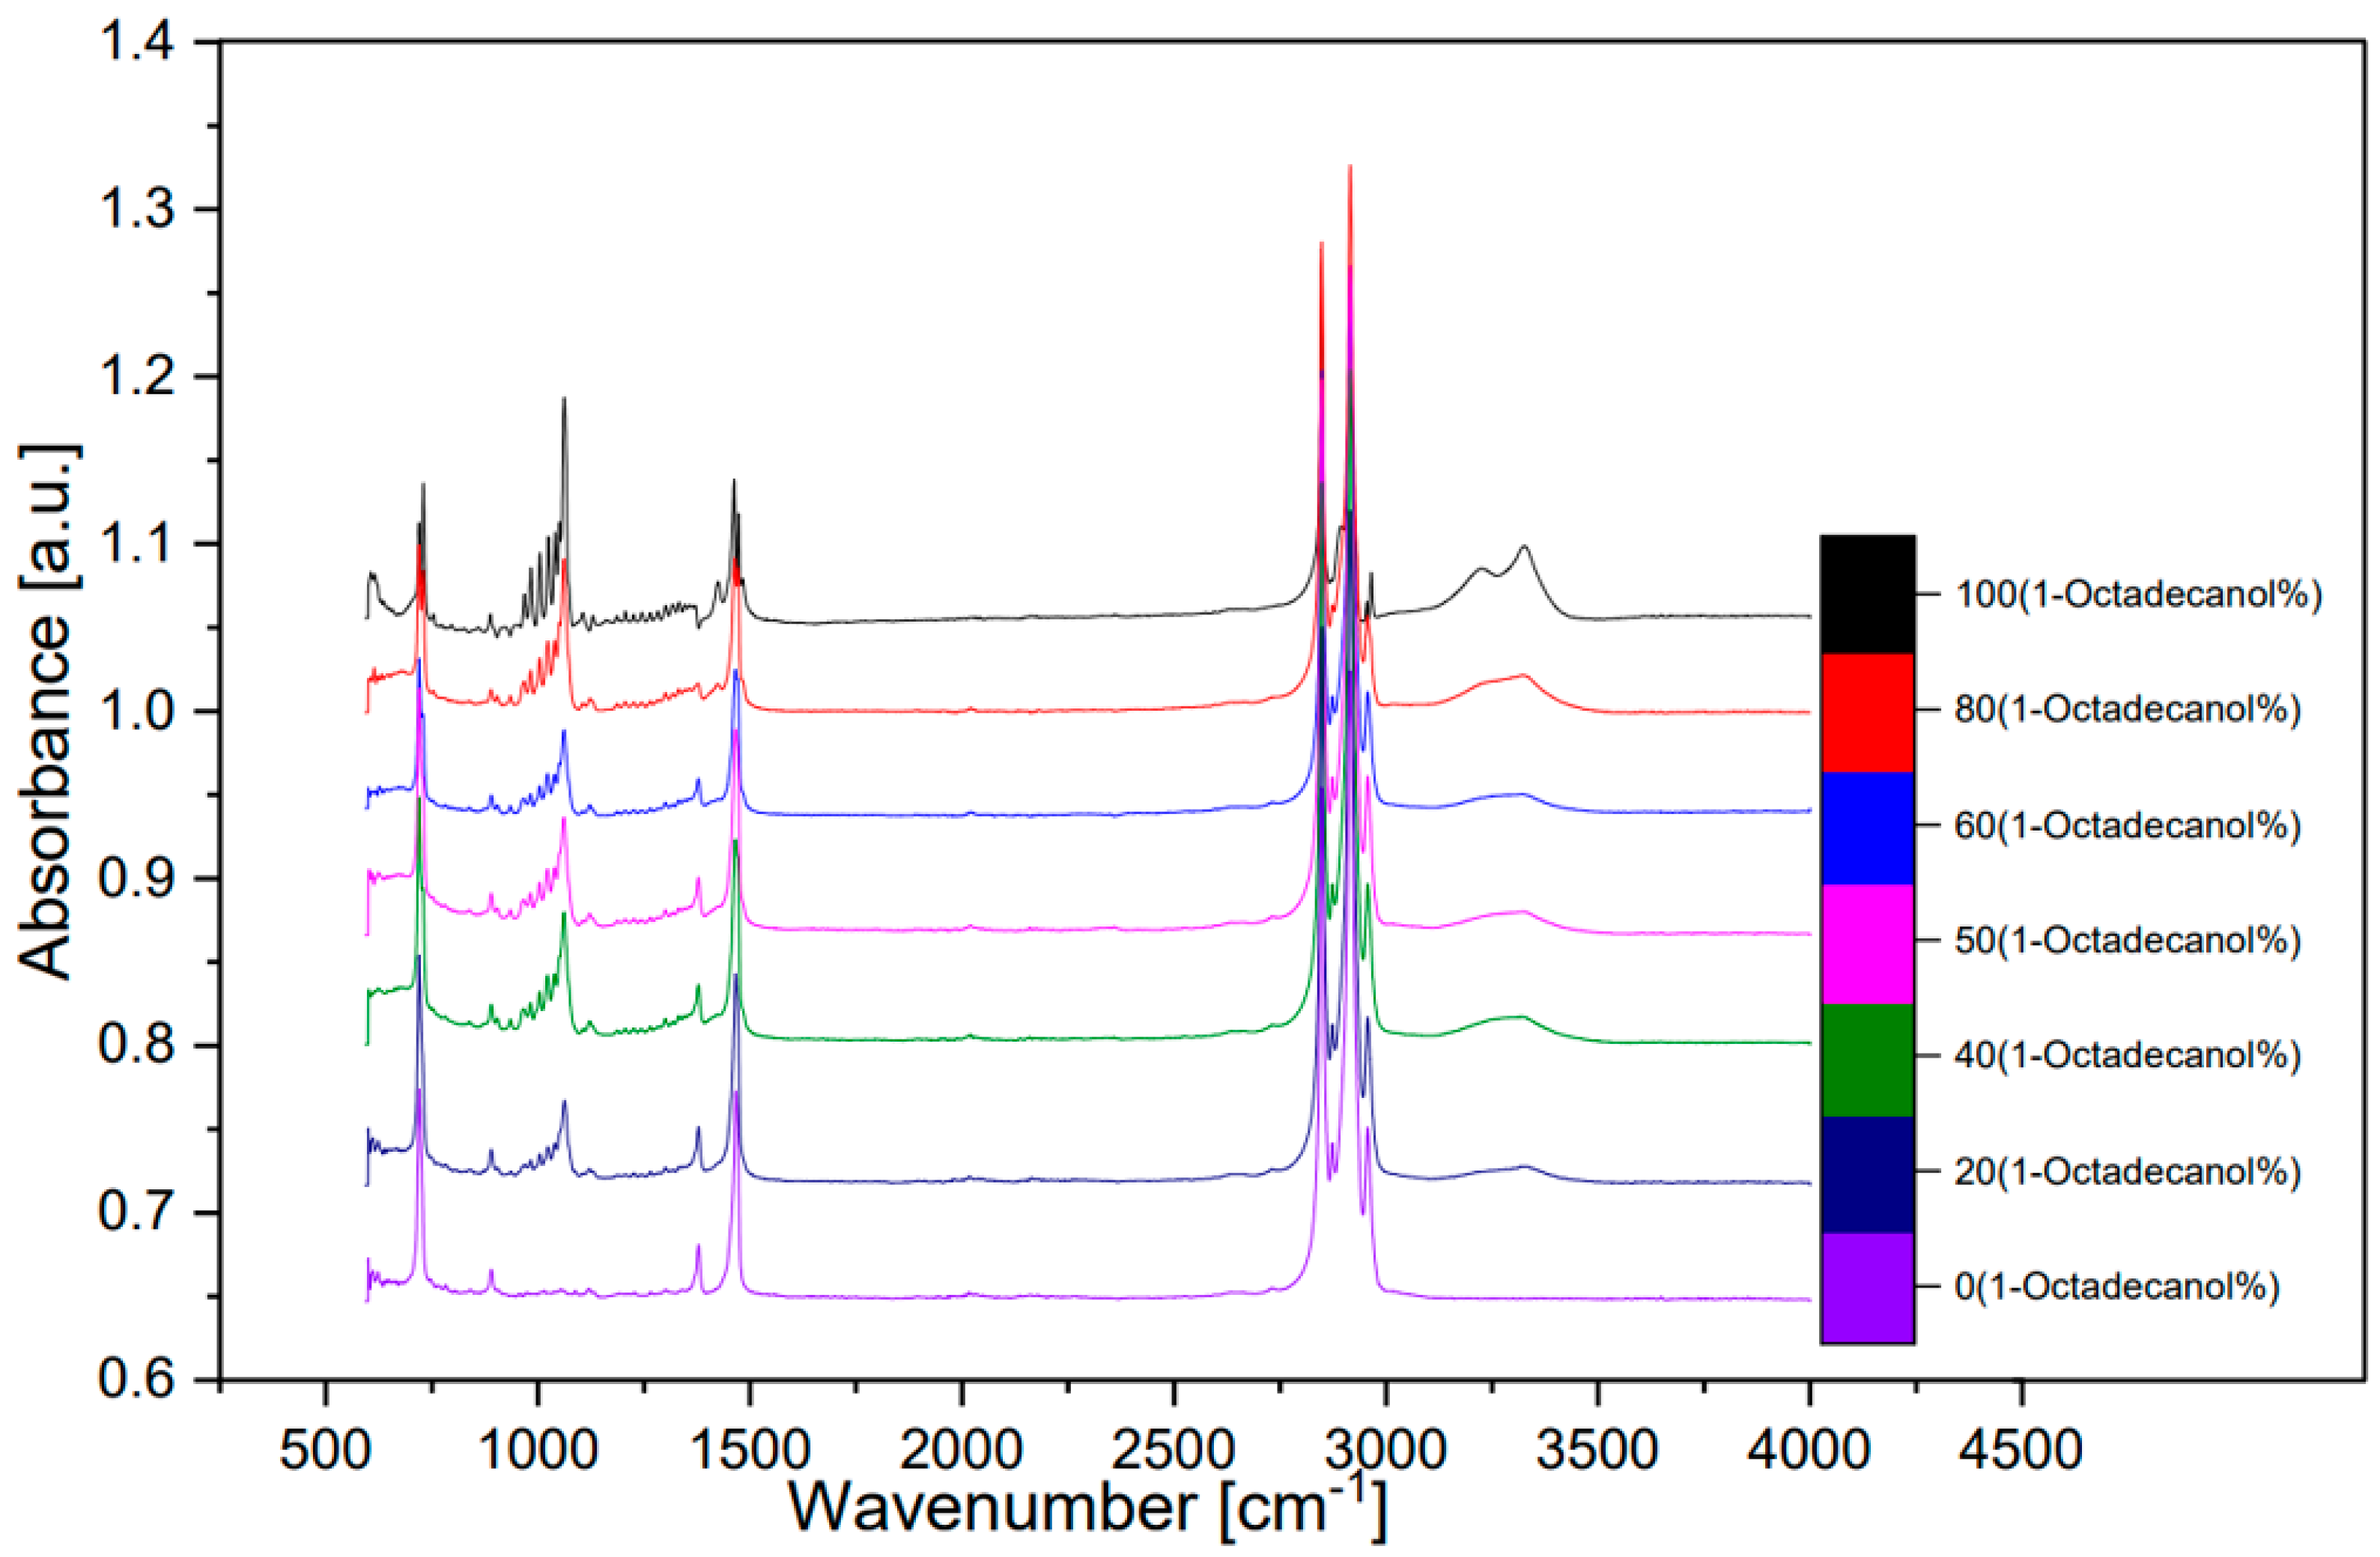
A FTIR spectra of these seven samples was shown below. A spectrum compared between transmittance and wavenumber (
Figure 12) and other spectra which compared with absorbance and wavenumber (
Figure 13, transformed from
Figure 12 by OMNIC). The peak around wavenumber 750cm-1 was out-of-plane bending of O-H bond. The peak around 1000 was stretching vibration of C-O bond. The peak around 1500 was bending vibration of C-H bond. The double-peak around 3000 was Saturated C-H stretching vibration absorption peak. An inconspicuous wide peak around 3300 was the O-H stretching vibration of intermolecular hydrogen bond.
[8]
Figure 12.
FTIR spectra (Transmittance).
Figure 12.
FTIR spectra (Transmittance).
Figure 13.
FTIR spectra (Absorbance).
Figure 13.
FTIR spectra (Absorbance).
4. Discussion
This project built up a n-Nonadecane and 1-Octadecanol binary system for simulating the partial composition of plant cuticle waxy layer, and numerical analysis methods for studying the phase transitions and crystal structure of the binary system.
In summary, the phase transition of the 1-Octadecanol and n-Nonadecane binary system is Liquid → R’IV → Monoclinic for 1-Octadecanol, and Liquid → R’I → Orthorhombic for n-Nonadecane. The phase transition from γ to the rotator phase, which of 1-Octadecanol, cannot be detected by DSC because of the weak signal.
According to the previous research
[9], the FTIR analysis results are shown as the peak around wavenumber 750cm
-1 was out-of-plane bending of O-H bond. The peak around 1000
-1 was stretching vibration of C-O bond. The peak around 1500
-1 was bending vibration of C-H bond. The double-peak around 3000
-1 was Saturated C-H stretching vibration absorption peak. An inconspicuous wide peak around 3300
-1 was the O-H stretching vibration of intermolecular hydrogen bond.
Author Contributions
Conceptualization, Wentao. Guo. ; Yi. Xing. and Wei. Su. ; methodology, Wentao. Guo. ; software, Guotao. Li. ; validation, Changjiang. Hou. , Yi. Xing. and Wei. Su.; formal analysis, Wentao. Guo. ; investigation, Changjiang. Hou. ; resources, Yi. Xing. ; data curation, Wentao. Guo. ; writing—original draft preparation, Wentao. Guo. Guotao. Li. ; writing—review and editing, Wei. Su. ; visualization, Guotao. Li. ; supervision, Yi. Xing. ; project administration, Wentao. Guo. ; funding acquisition, Changjiang. Hou. All authors have read and agreed to the published version of the manuscript.” Please turn to the CRediT taxonomy for the term explanation.
Funding
This work was supported by the National Key R&D Program of China (No. 2022YFE0208100), Key Research and Development Program of Hebei Province (No. 22373706D), Key Science and Technology Planning Project of HBIS Group Co., Ltd. (No. HG2020204–2), and Guangdong Province Engineering Laboratory for Air Pollution Control (20193236- 09-06).
Data Availability Statement
All the data can be collected by contacting wentao_guo@ustb.edu.cn.
Acknowledgments
The authors would like to express sincere gratitude to Prof. Kevin J. Roberts, Laksha Parameswaran, Alexander Jackson and Yu Liu from University of Leeds for their continued assistance throughout the project, providing advice and guidance that was essential for completing this project.
Conflicts of Interest
The funders had no role in the design of the study; in the collection, analyses, or interpretation of data; in the writing of the manuscript; or in the decision to publish the results.
References
- Author 1, Isaacson. T.; Author 2, Kosma. D.; Author 3, Matas. A.; Author 4, Buda. G.; Author 5, He. Y.; Author 6, Yu. B.; Author 7, Pravitasari. A.; Author 8, Batteas. J.; Author 9, Stark. R.; Author 10, Jenks. M.; Author 11, Rose. J. Cutin deficiency in the tomato fruit cuticle consistently affects resistance to microbial infection and biomechanical properties, but not transpirational water loss. The Plant Journal 2009, 60, 363–377.
- Author 1, Jetter. R.; Author 2, Riederer. M. Localization of the Transpiration Barrier in the Epi- and Intra-cuticular Waxes of Eight Plant Species: Water Transport Resistances Are Associated with Fatty Acyl Rather Than Alicyclic Components. Plant Physiology 2022, 170, 921–934.
- Author 1, Lee. T.; Author 2, Greenkorn. R.; Author 3, Chao. K. Statistical thermodynamics of group interaction in n-alkane-n-alkanol and n-alkanol-n-alkanol solutions. Chemical Engineering Science 1973, 28, 1005–1011. [CrossRef]
- Author 1, Anwar. M.; Author 2, Turci. F.; Author 3, Schilling. T. Crystallization mechanism in melts of short n-alkane chains. The Journal of Chemical Physics 2013, 139, 214904. [CrossRef] [PubMed]
- Author 1, Dirand. M.; Author 2, Bouroukba. M.; Author 3, Chevallier. V.; Author 4, Petitjean. D.; Author 5, Behar. E.; Author 6, Ruffier-Meray. V. Normal Alkanes, Multialkane Synthetic Model Mixtures, and Real Petroleum Waxes: Crystallographic Structures, Thermodynamic Properties, and Crystallization. Journal of Chemical and Engineering Data 2002, 47, 115–143.
- Author 1, Miquel. Àngel. Cuevas-Diarte.; Author 2, Y. Haget.; Author 3, N. B. Chanh.; Author 4, H. A. J. Oonk. In Molecular Mixed Crystals, 1st ed.; Publisher: Springer Nature Switzerland AG Gewerbestrasse 11: 6330 Cham, Switzerland, 2021; Volume 3, pp. 9–46.
- Author 1, Cholakova. D.; Author 2, Denkov. N. Rotator phases in alkane systems: In bulk, surface layers and micro/nano-confinements. Advances in Colloid and Interface Science 2019, 269, 7–24. [CrossRef] [PubMed]
- Author 1, Ventolà. L.; Author 2, Calvet. T.; Author 3, Cuevas-Diarte. MA.; Author 4, Solans. X.; Author 5, Mondieig. D.; Author 6, Négrier. P.; Author 7, van Miltenburg. JC. Solid state equilibrium in the n-alkanols family: the stability of binary mixed samples. Physical Chemistry Chemical Physics 2003, 5, 947–952.
- Author1, G. P. Hastie; Author 2, K. J. Roberts. Investigation of inter- and intra-molecular packing in the solid state for crystals of normal alkanes and homologous mixtures using FT-IR spectroscopy. Journal of Materials Science 1994, 1915–1919.
|
Disclaimer/Publisher’s Note: The statements, opinions and data contained in all publications are solely those of the individual author(s) and contributor(s) and not of MDPI and/or the editor(s). MDPI and/or the editor(s) disclaim responsibility for any injury to people or property resulting from any ideas, methods, instructions or products referred to in the content. |
© 2023 by the authors. Licensee MDPI, Basel, Switzerland. This article is an open access article distributed under the terms and conditions of the Creative Commons Attribution (CC BY) license (http://creativecommons.org/licenses/by/4.0/).
