1. Introduction
Water treatment using UV radiation is a common method employed to eliminate microorganisms present in water. This process relies on the use of specialized UV lamps that emit ultraviolet light at a specific wavelength, typically around 254 nanometers. This wavelength is effective in destroying the DNA of microorganisms, such as bacteria, viruses, and protozoa, rendering them inactive. This process is generally straightforward and does not require the addition of chemicals. However, managing UV lamps, monitoring UV intensity, and integrating with other methods can introduce some complexity [1,2,3,4,21].
The water treatment pilot unit is powered by a photovoltaic (PV) source and includes a discharge lamp used to generate ultraviolet radiation, thereby addressing the bacteriological issues associated with water quality. This lamp is continuously powered by a PV source through an inverter and an electronic ballast. The water treatment system also incorporates a motor pump that draws contaminated water from the input reservoir, a flow control valve to generate different flow rates, and a filter designed to enhance the quality of contaminated water [5,6,24]. The circulation of water between the input reservoir (contaminated water) and the output reservoir (disinfected water) occurs through the UV lamp, facilitated by a centrifugal motor pump [7,8,9].
The bond graph is a multidisciplinary modeling tool for dynamic systems, based on the exchange of energy among the various components of the system under consideration. Indeed, it is this energy exchange that determines the dynamics of any system . The bond graph provides a modeling approach applicable to all branches of physics. From the bond graph model, it is possible to conduct a structural analysis, derive system equations, and apply control laws. It is due to these features that we have chosen the bond graph as our modeling tool, to leverage the bond graph model of the energy source that we are going to establish, we can conduct a structural analysis, deduce the system equations, and apply the necessary (appropriate) control law to steer the energy system toward the desired operating point (optimal power) [10].
We know that robustness reflects the invariance of the input-output behavior with respect to modeling uncertainties and/or the variation of certain parameters of the process to be controlled or disturbances likely to act on the process during its operation evolution. The developed control ensures stability performance where the looped system must remain stable in a given range whatever the variations in the process or despite the presence of possible additive disturbances, also ensures the performance of the looped system. The development of a robust control is done from a nominal model that is most often linear. The calculated robust control ensures stability performance and closed-loop performance for a class of possibly non-linear processes. We will also develop a state model of the motor pump. Then, we presented the theory of control by sliding mode in continuous time. It is a robust control technique because it allows the outputs to converge towards their reference values even in the presence of uncertainties in the system. These properties allow us to confirm the relevance of using the sliding mode where we must control the water flow (in order to guarantee the best water quality according to the available energy). In order to validate the choice of a robust control, we checked the robustness of the regulator by comparing it to a proportional regulator in speed control, after changing the system parameters [11,12,16,17].
In this study, we will apply a sliding-mode control strategy to regulate the speed of the centrifugal pump motor, thereby controlling the water flow rate. Subsequently, we will conduct a comparative analysis between the outcomes of sliding-mode control and state feedback control, emphasizing the robustness of sliding-mode control in the face of parametric variations.
2. Bond-graph modeling of the energy system
2.1. Modeling of the photovoltaic source
The photovoltaic generator is a special finite energy source of non-linear current-voltage characteristic.
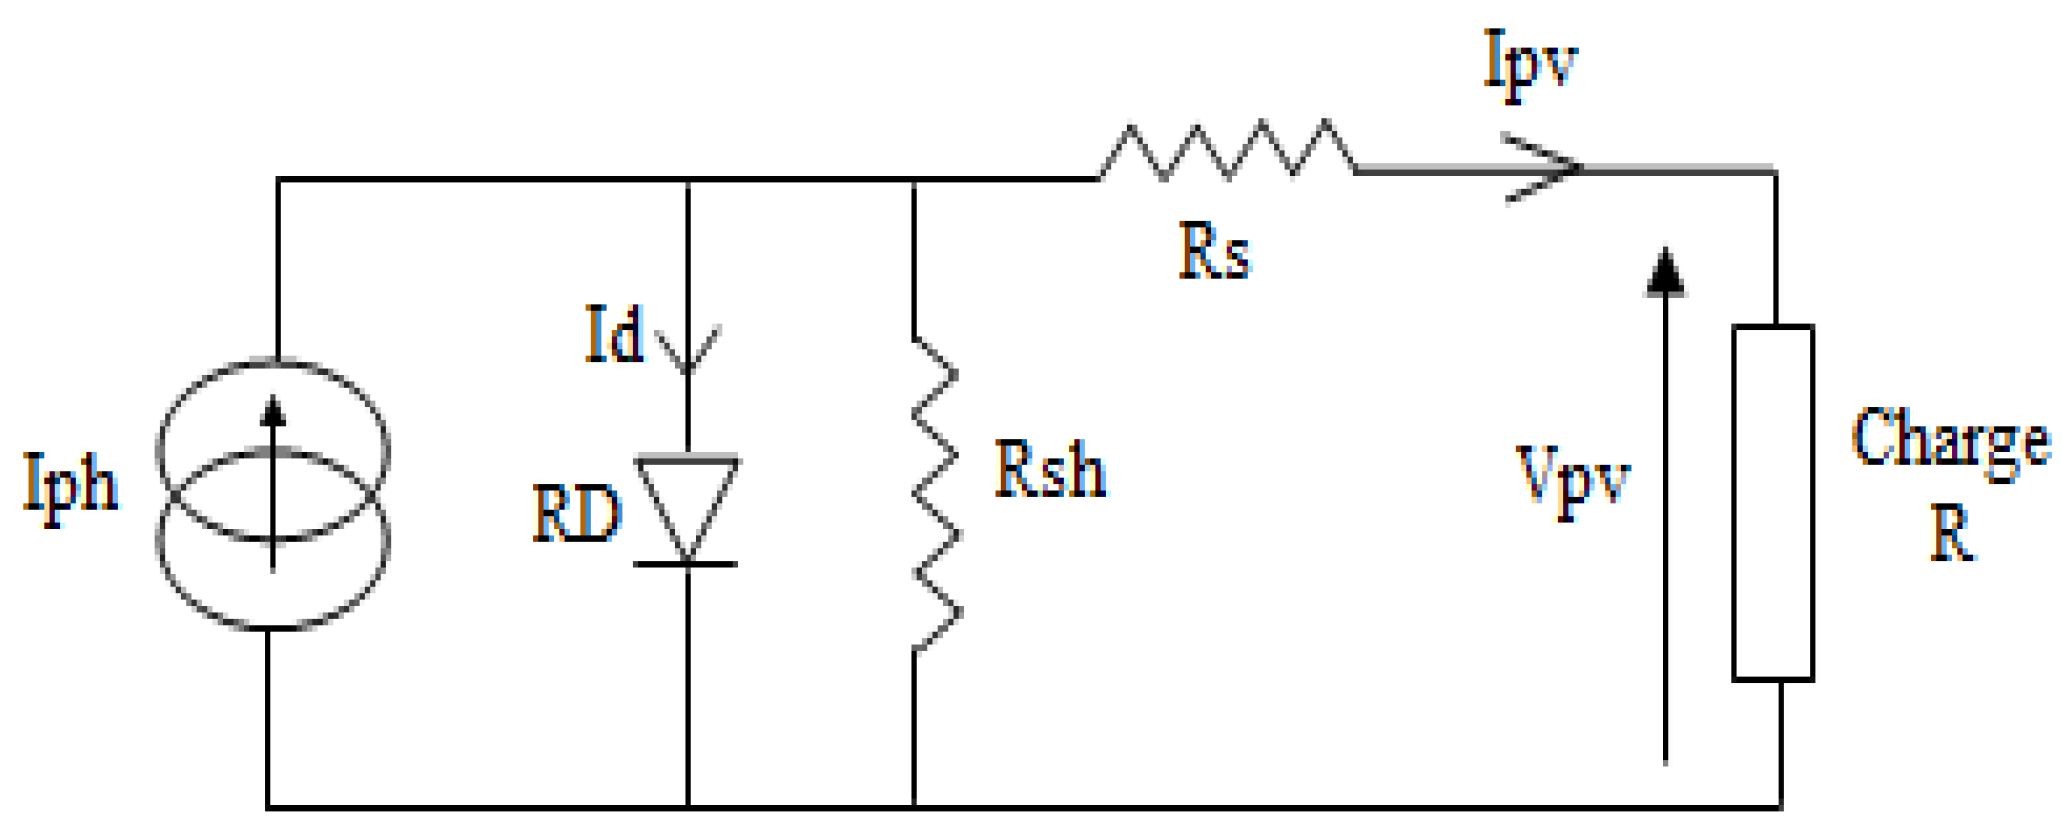
In order to take into account physical phenomena such as contact resistances and leakage current through the edges of the solar cells as well as cell ageing, the model is completed by two series resistances Rs and shunt Rsh as shown in the equivalent electrical diagram of the photovoltaic cell in
Figure 1 [13,14,15].
For the bond-graph representation of the photovoltaic diode, we model it by a nonlinear resistor whose current-voltage relationship is denoted by a nonlinear function, whose current is:
The model is reduced to the ideal model and the electrical characteristic of the PV generator is described by the following equation:
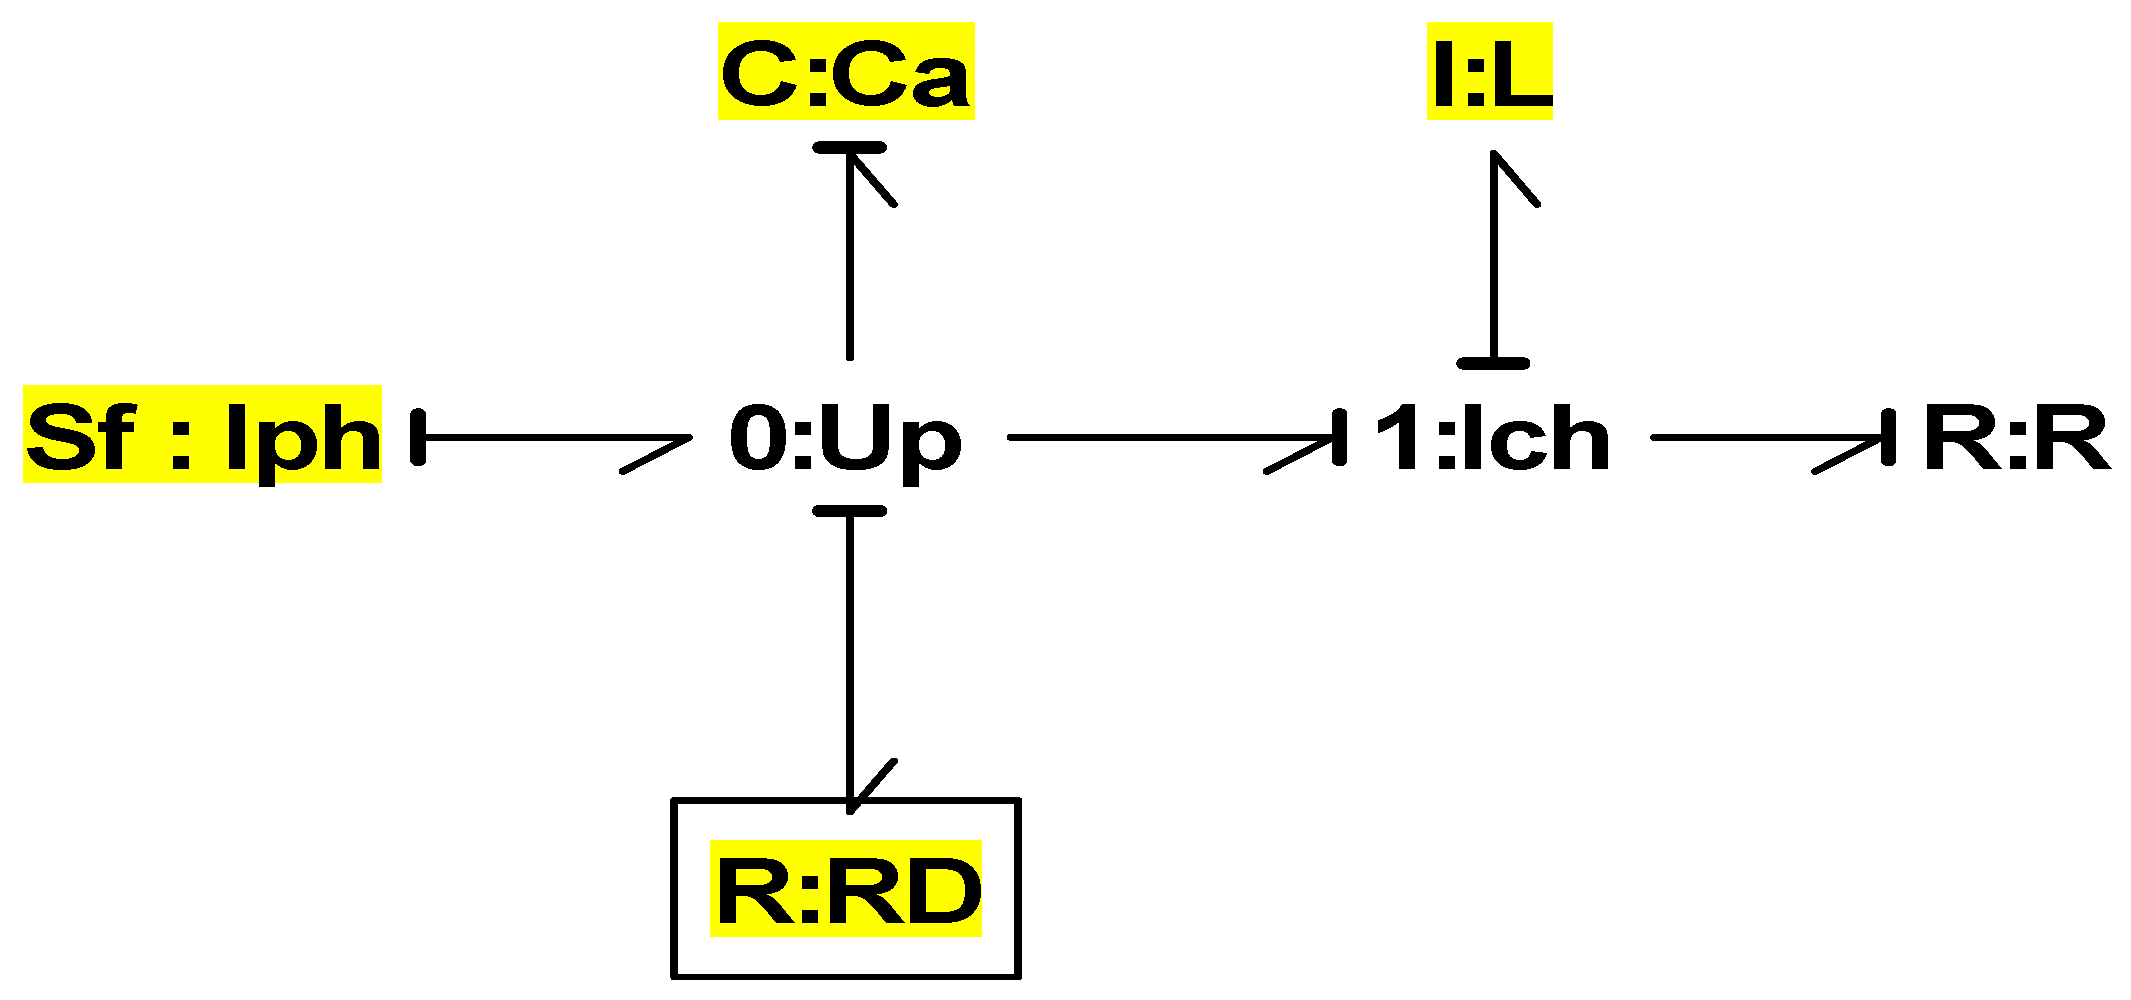
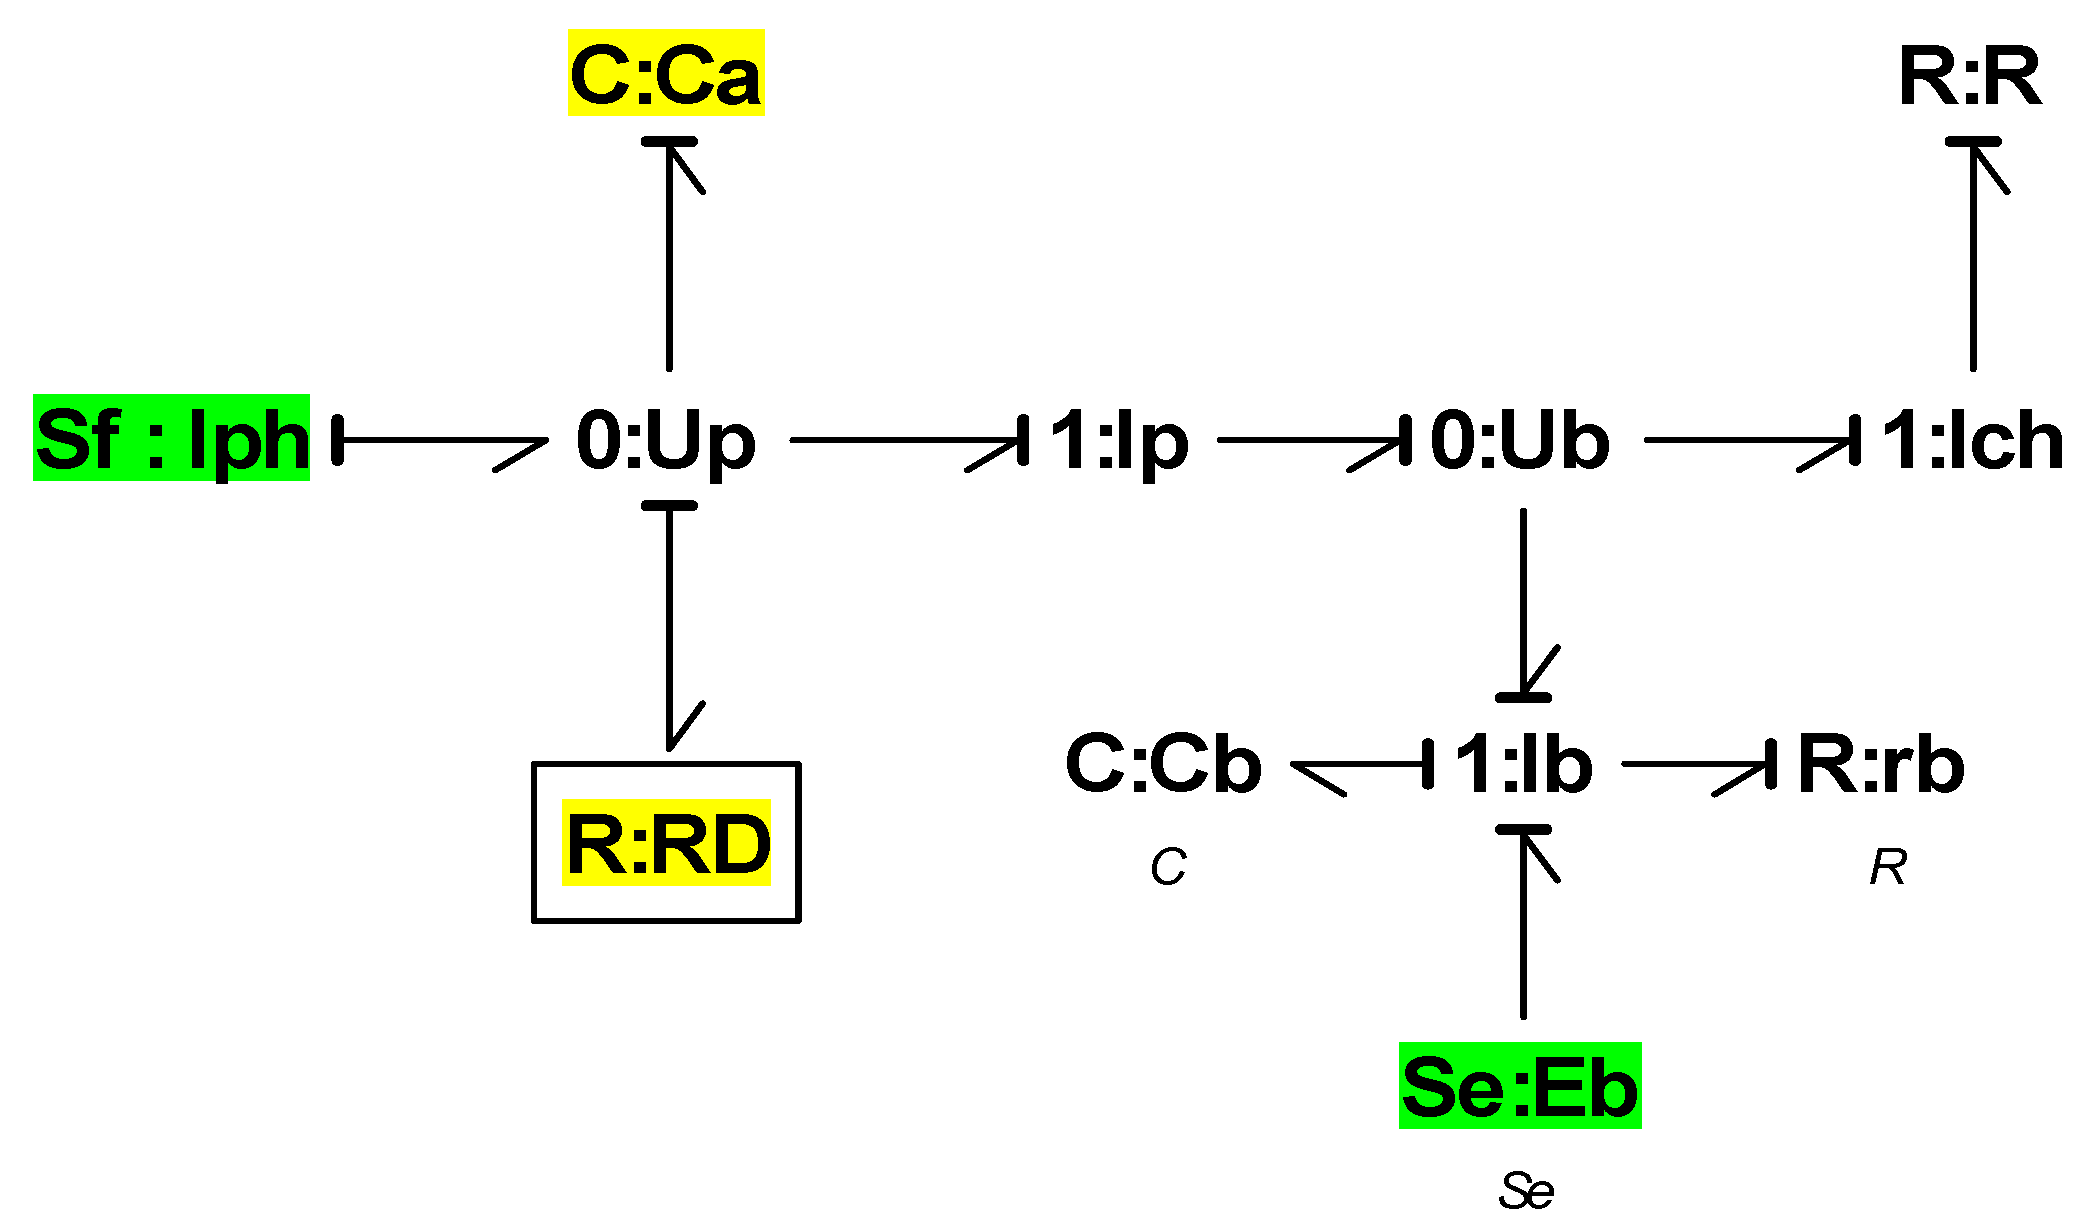
The bond-graph model of a photovoltaic source coupled to a RL load is given in
Figure 2. The capacitor Ca is often used in the PV system for start-up assistance during low sunlight [7,18].
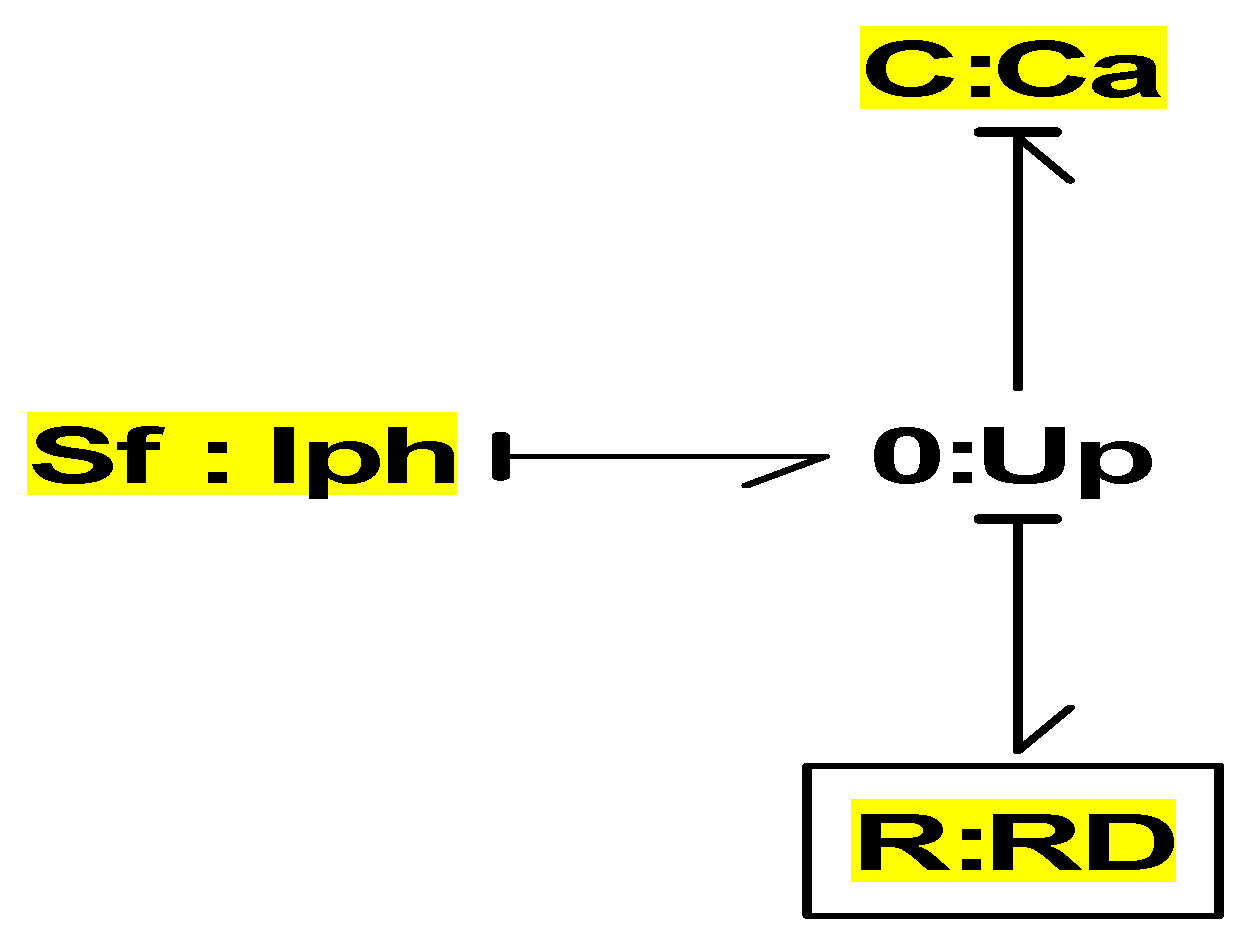
To simulate the characteristic of the photovoltaic panel I=f(V), we use the BG model represented by
Figure 3. In this simulation the receiver is a capacitor initially discharged.
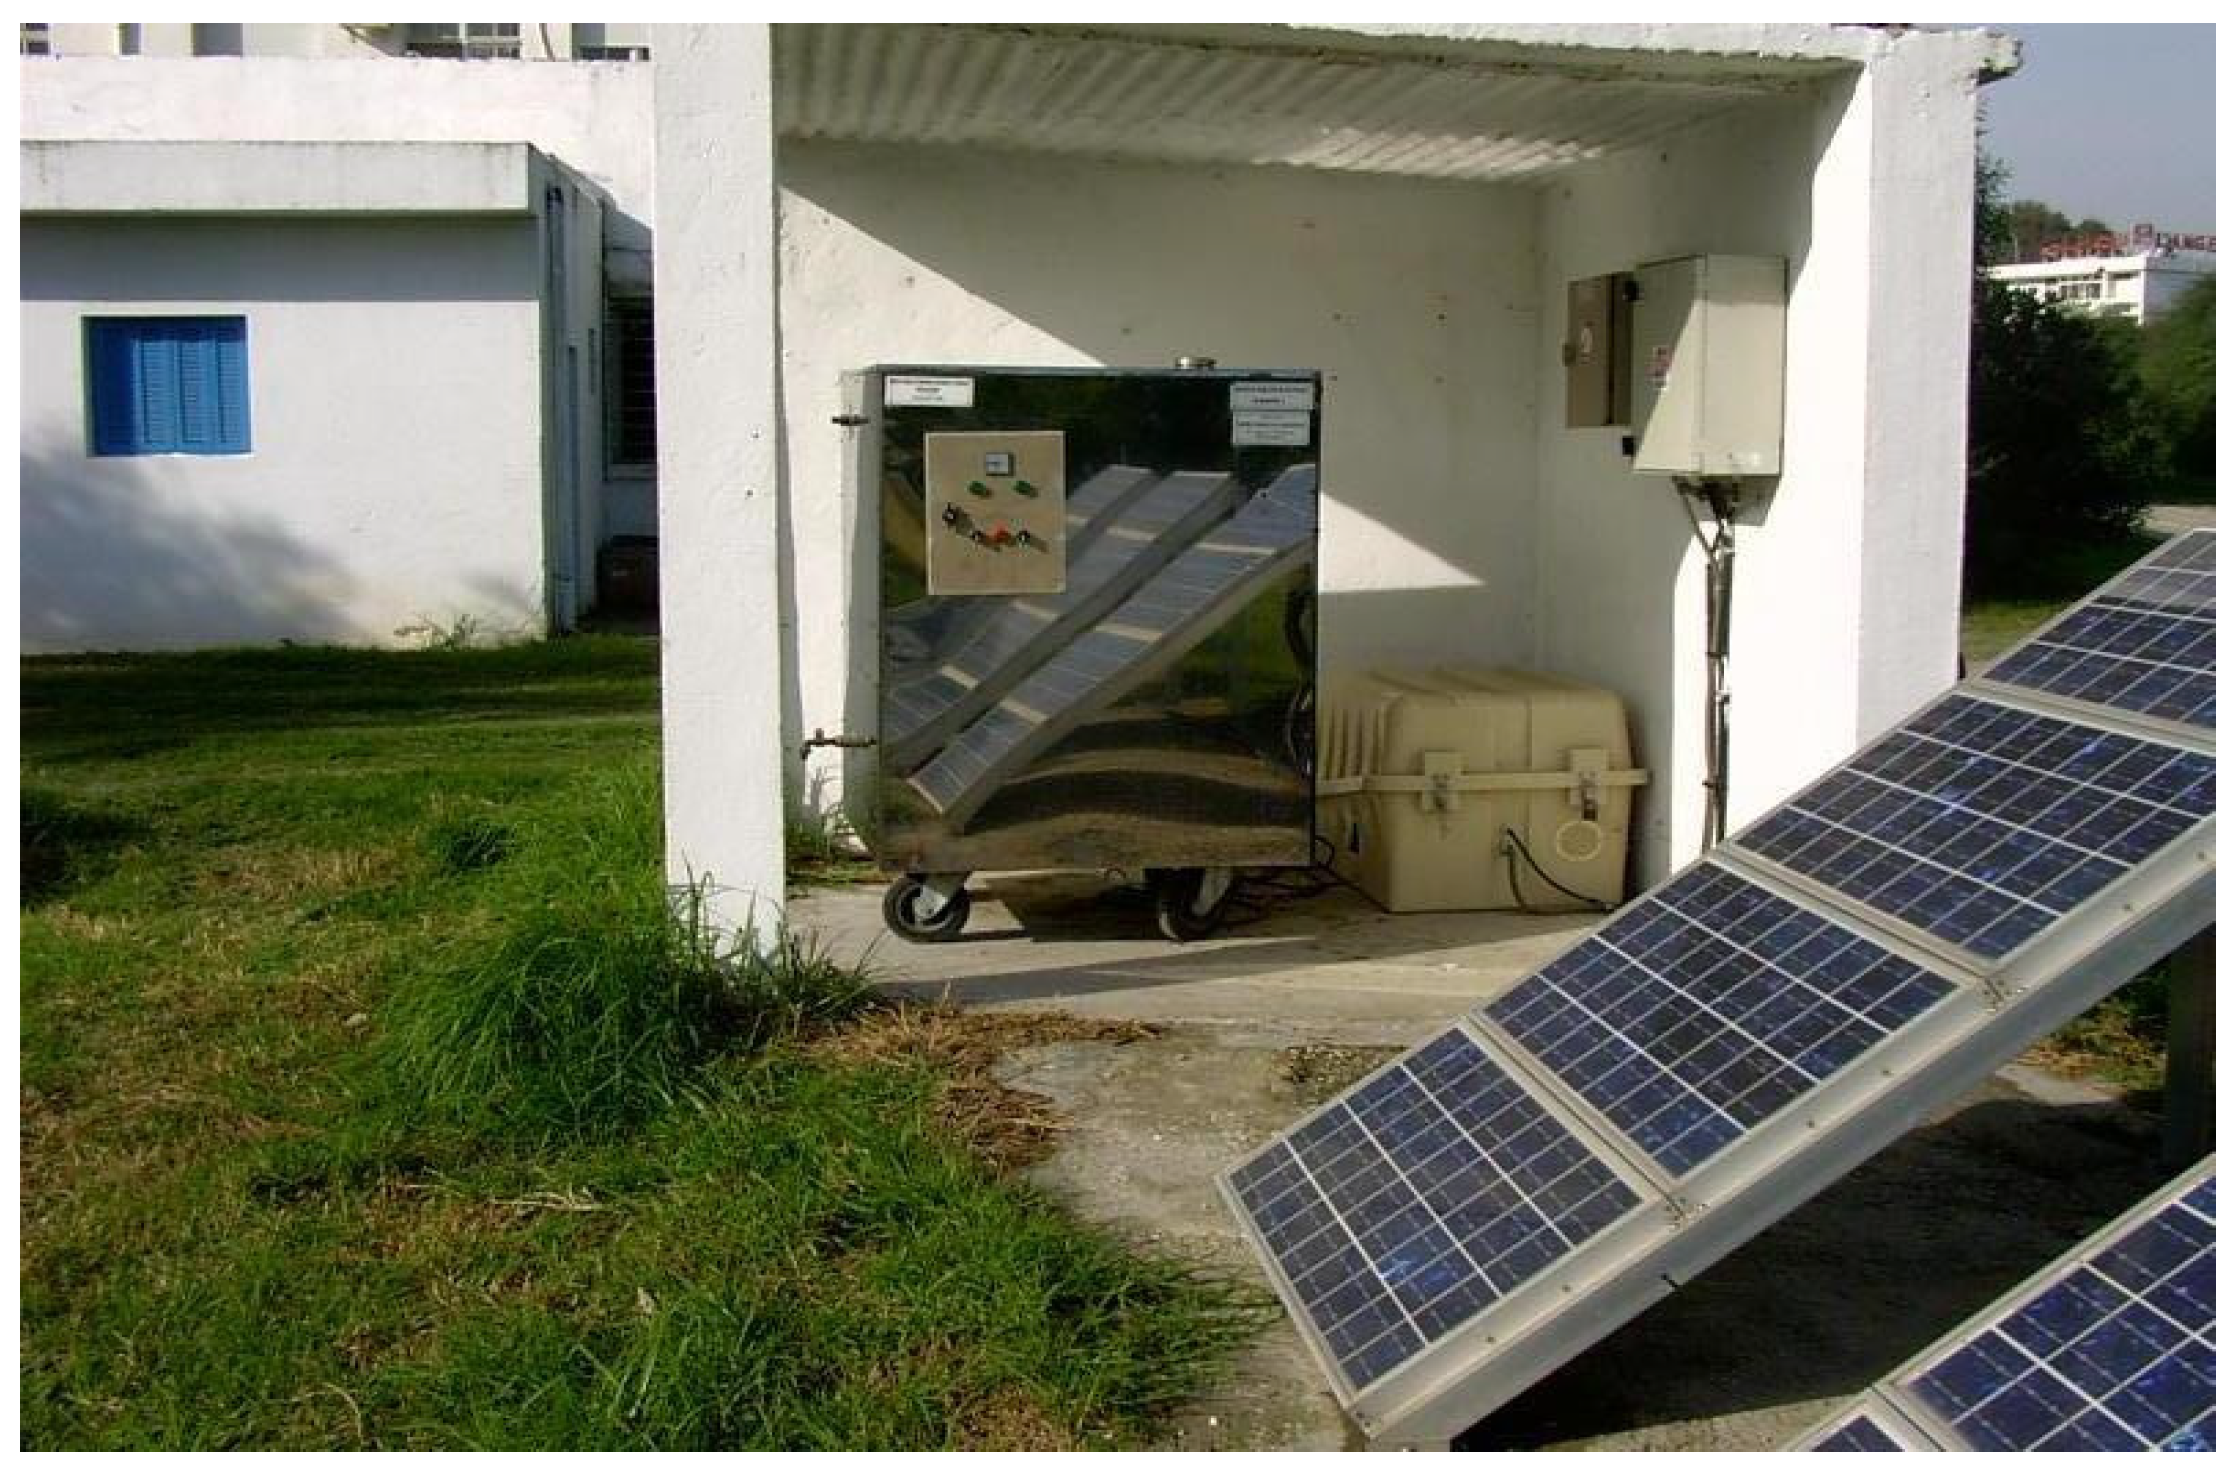
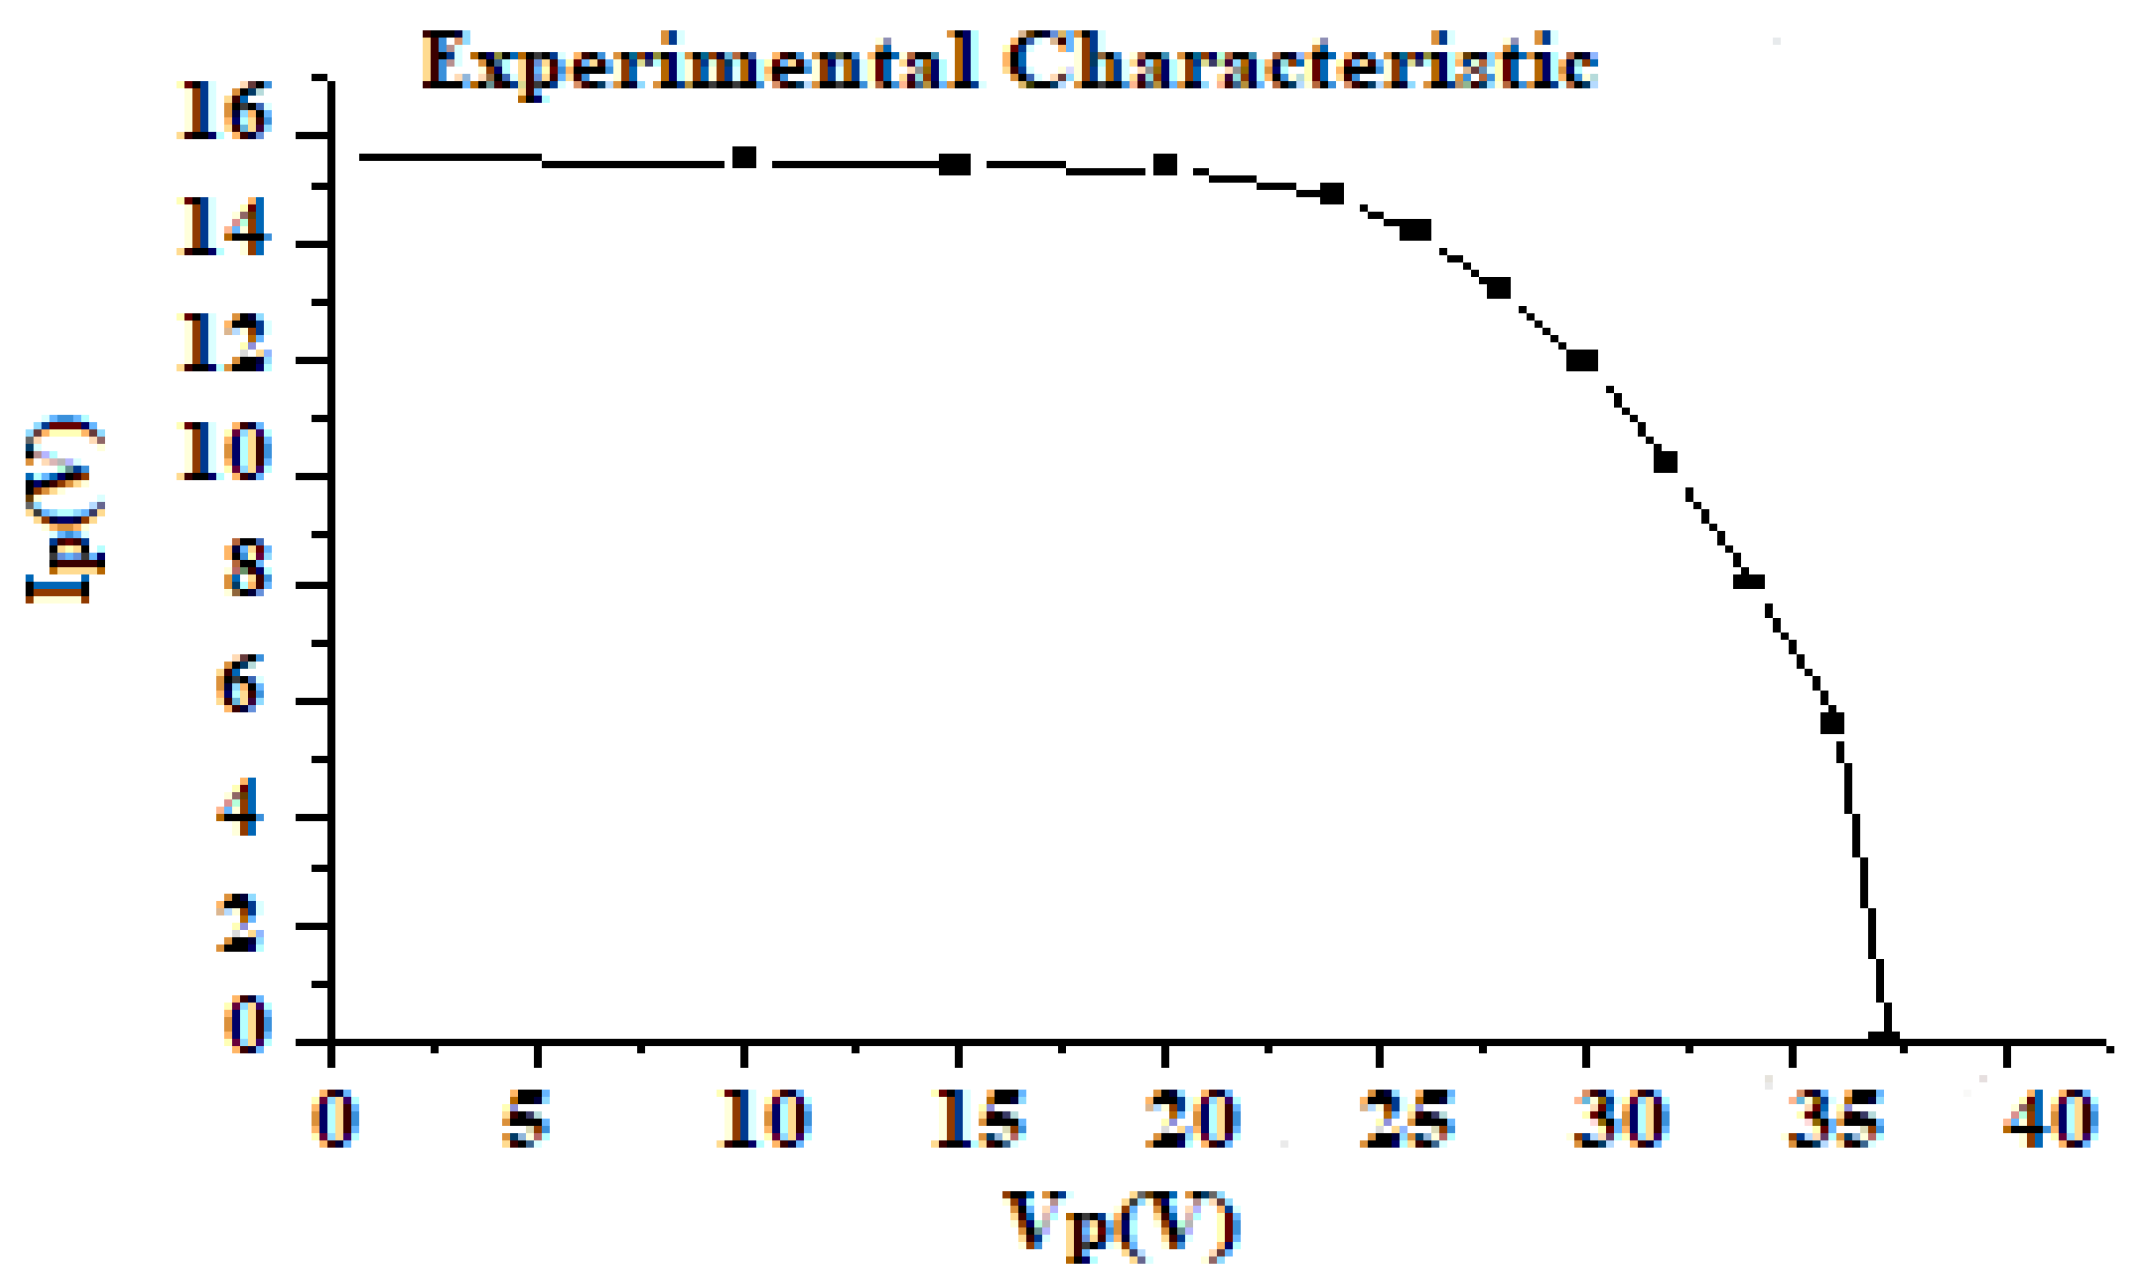
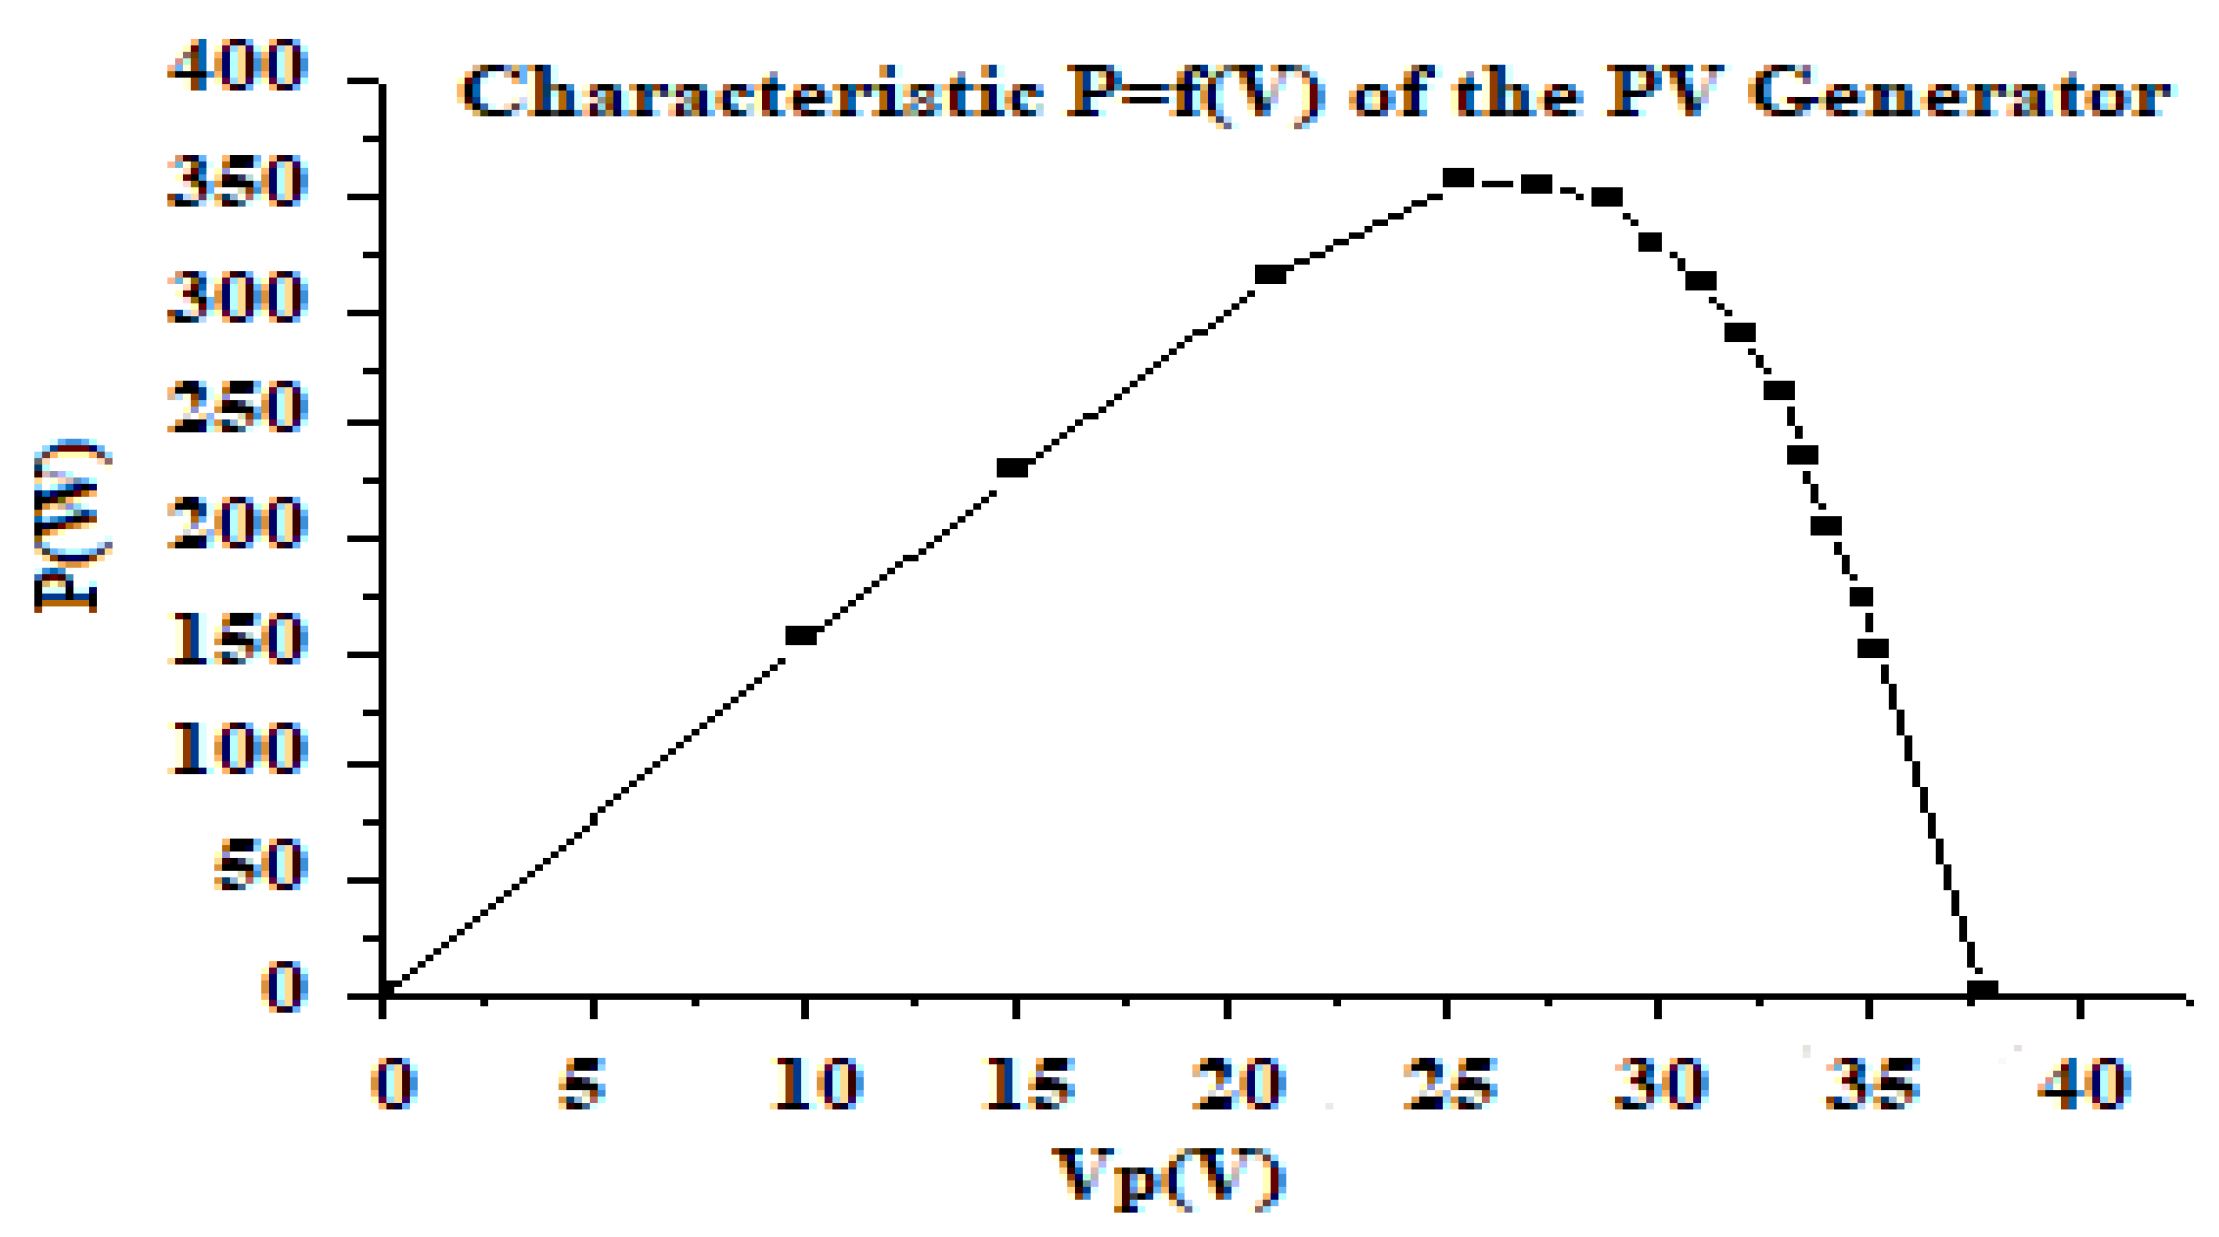
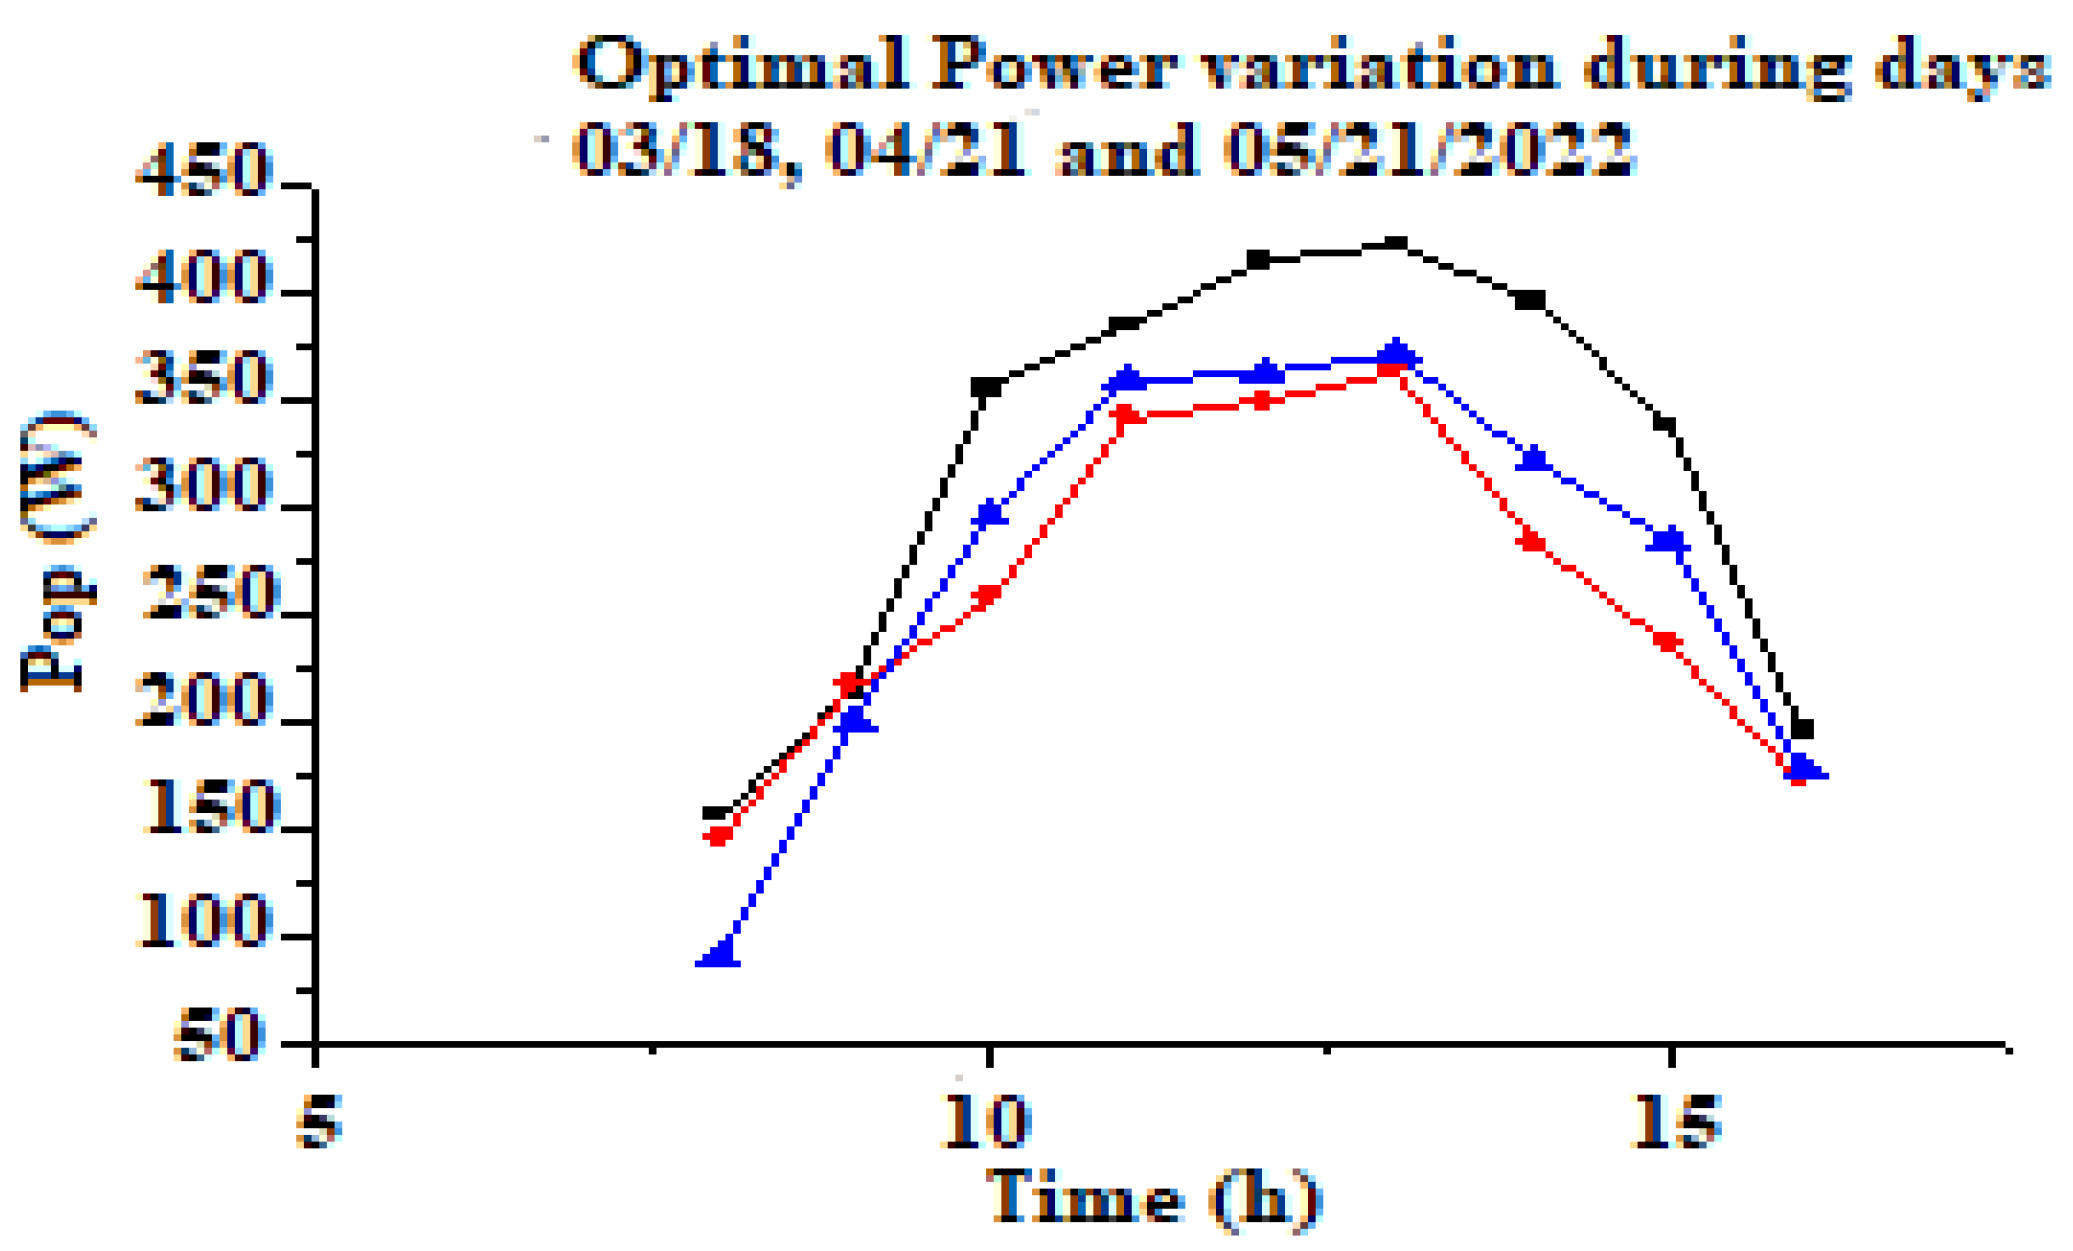
The parameters related to the PV source of the pilot unit are identified following an experimental characterization of the PV source, performed on the pilot unit. We present some results of this experimentation during one day.
Figure 4.
External view of the water treatment pilot unit.
Figure 4.
External view of the water treatment pilot unit.
The results of the PV field parameter identification used are:
Table 1.
Parameters identified for a PV field.
Table 1.
Parameters identified for a PV field.
| Iph(A) |
Is(mA) |
Rs(Ω) |
Rsh |
VT (V) |
| 15.8 |
0.0497 |
0.107 |
190.67 |
2.95 |
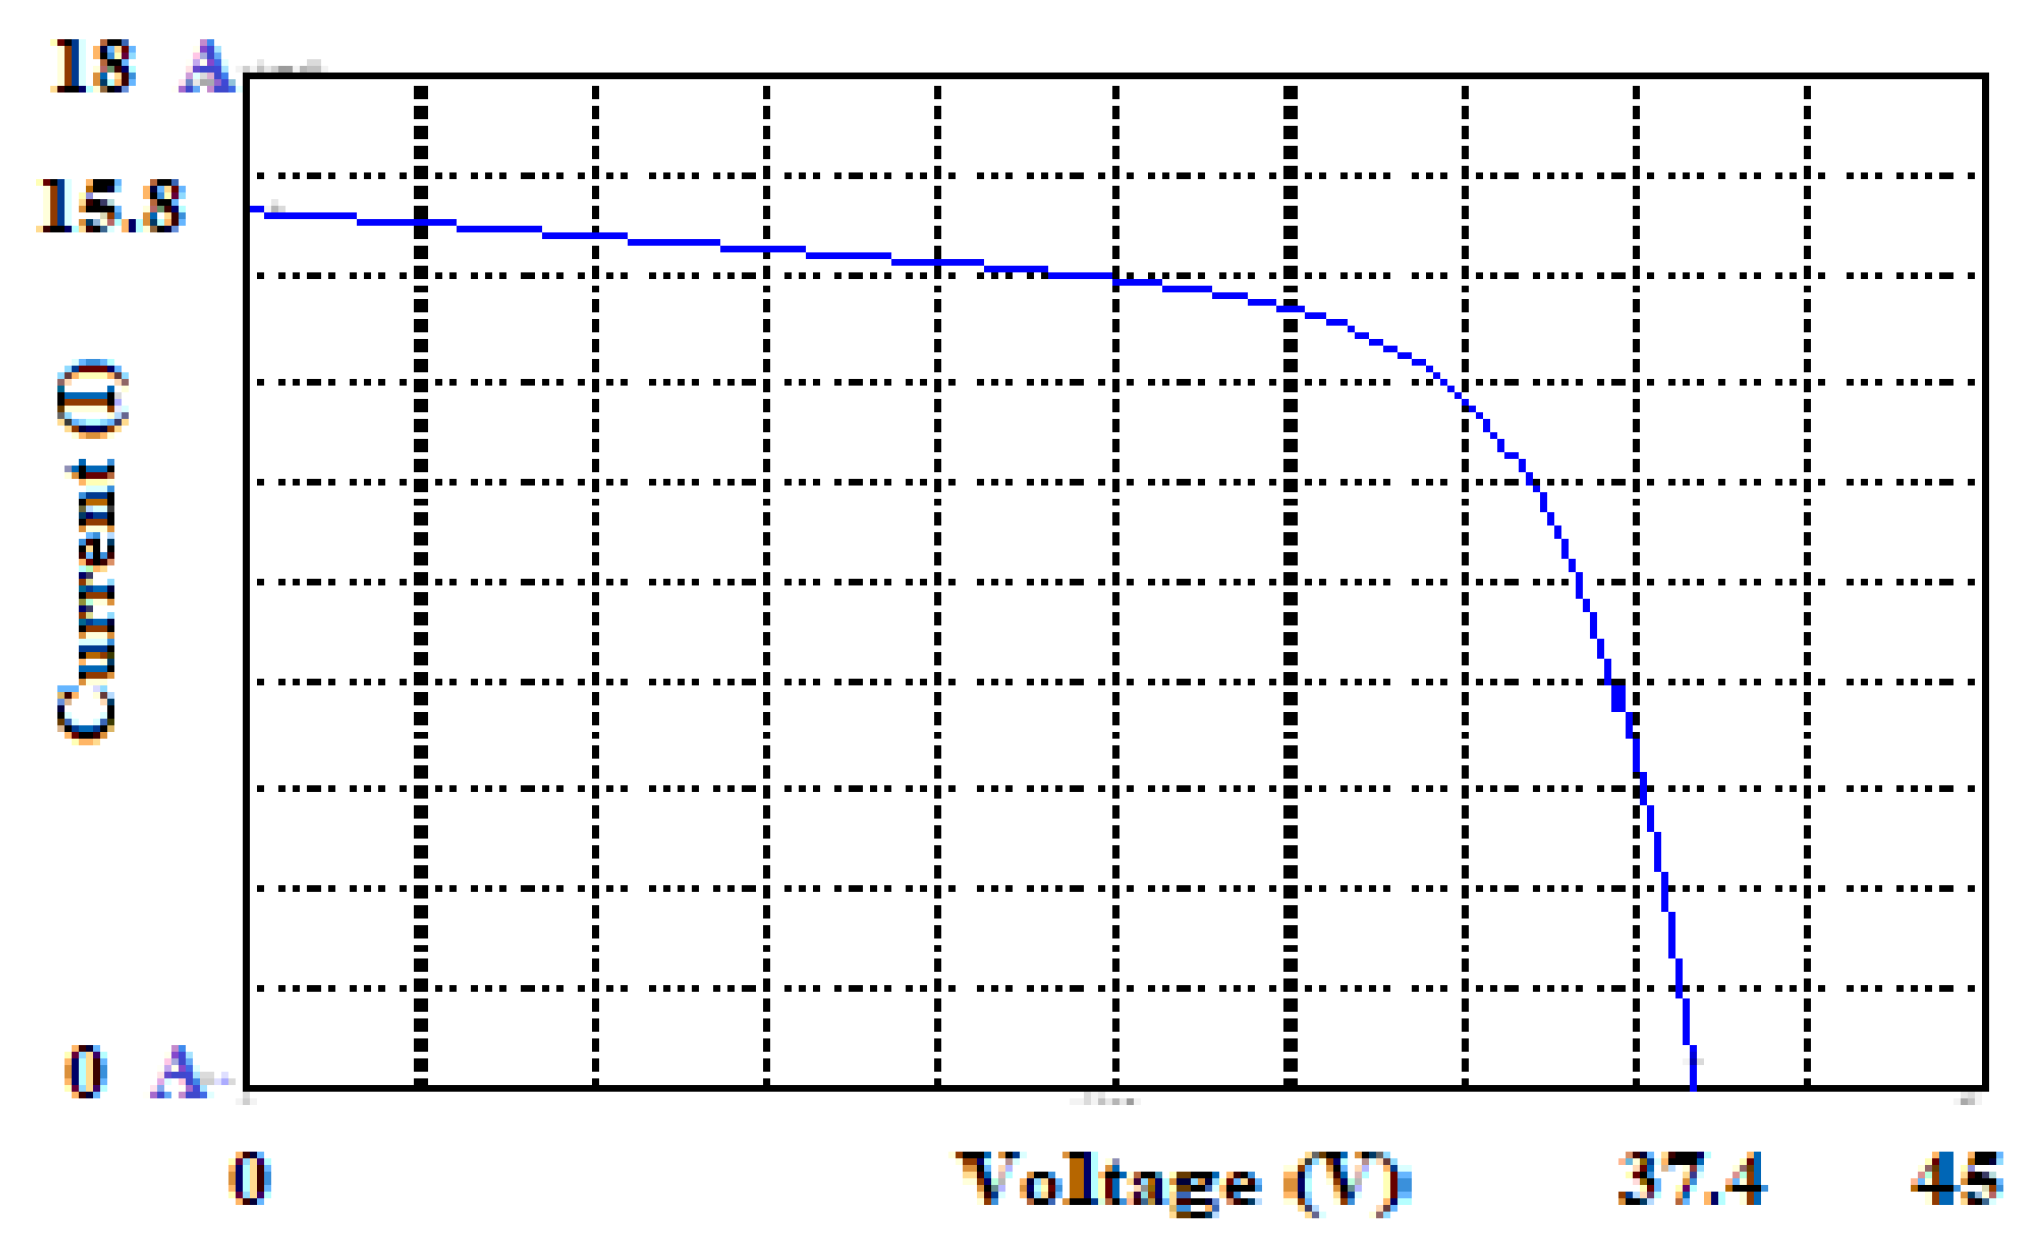
The simulated photovoltaic panel characteristic I = f (V) is shown in the following
Figure 5:
2.2. Modeling of energy storage batteries
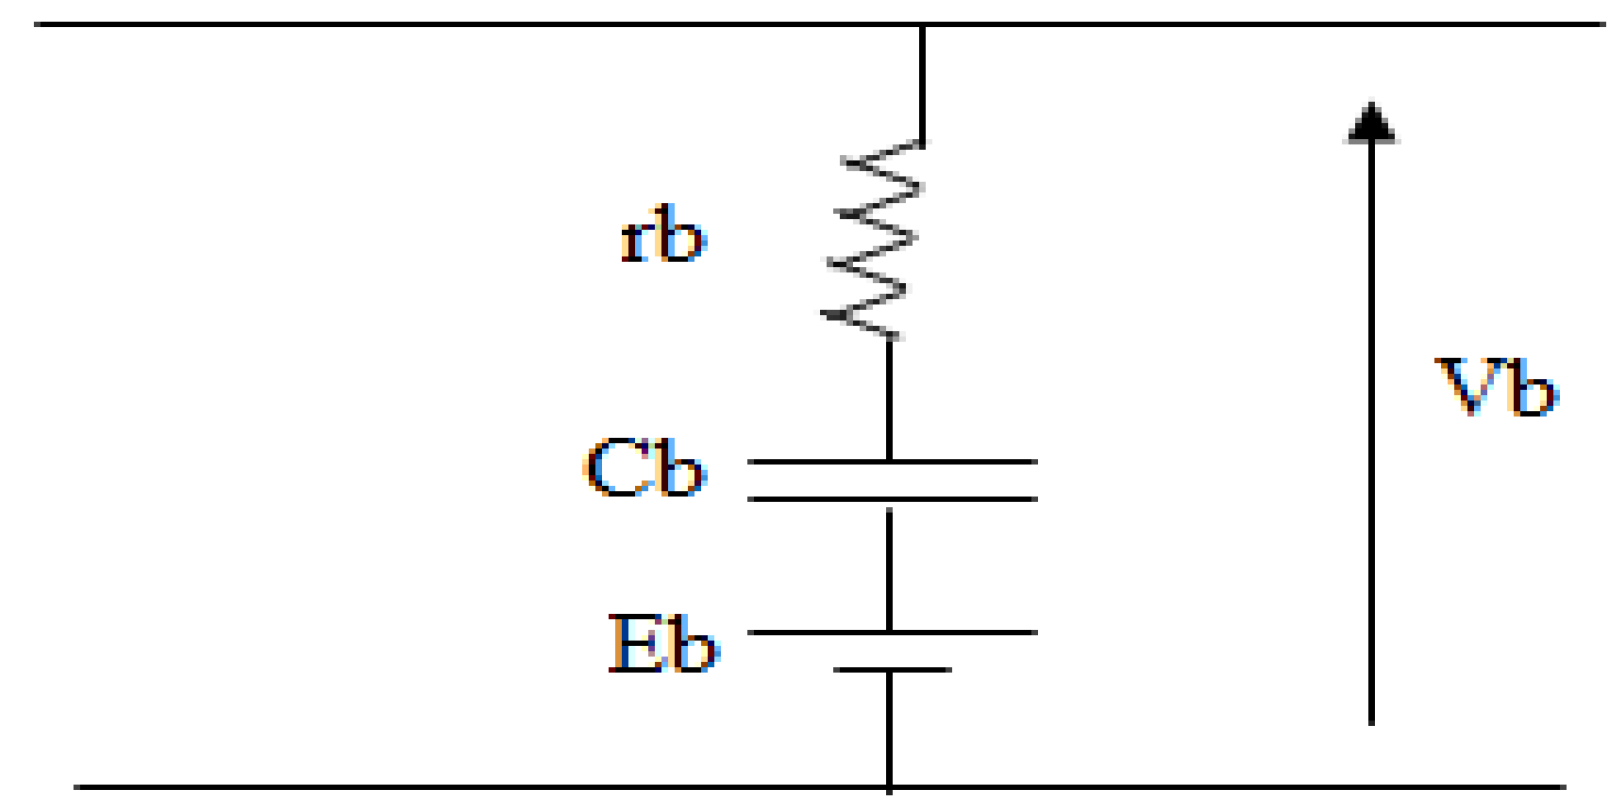
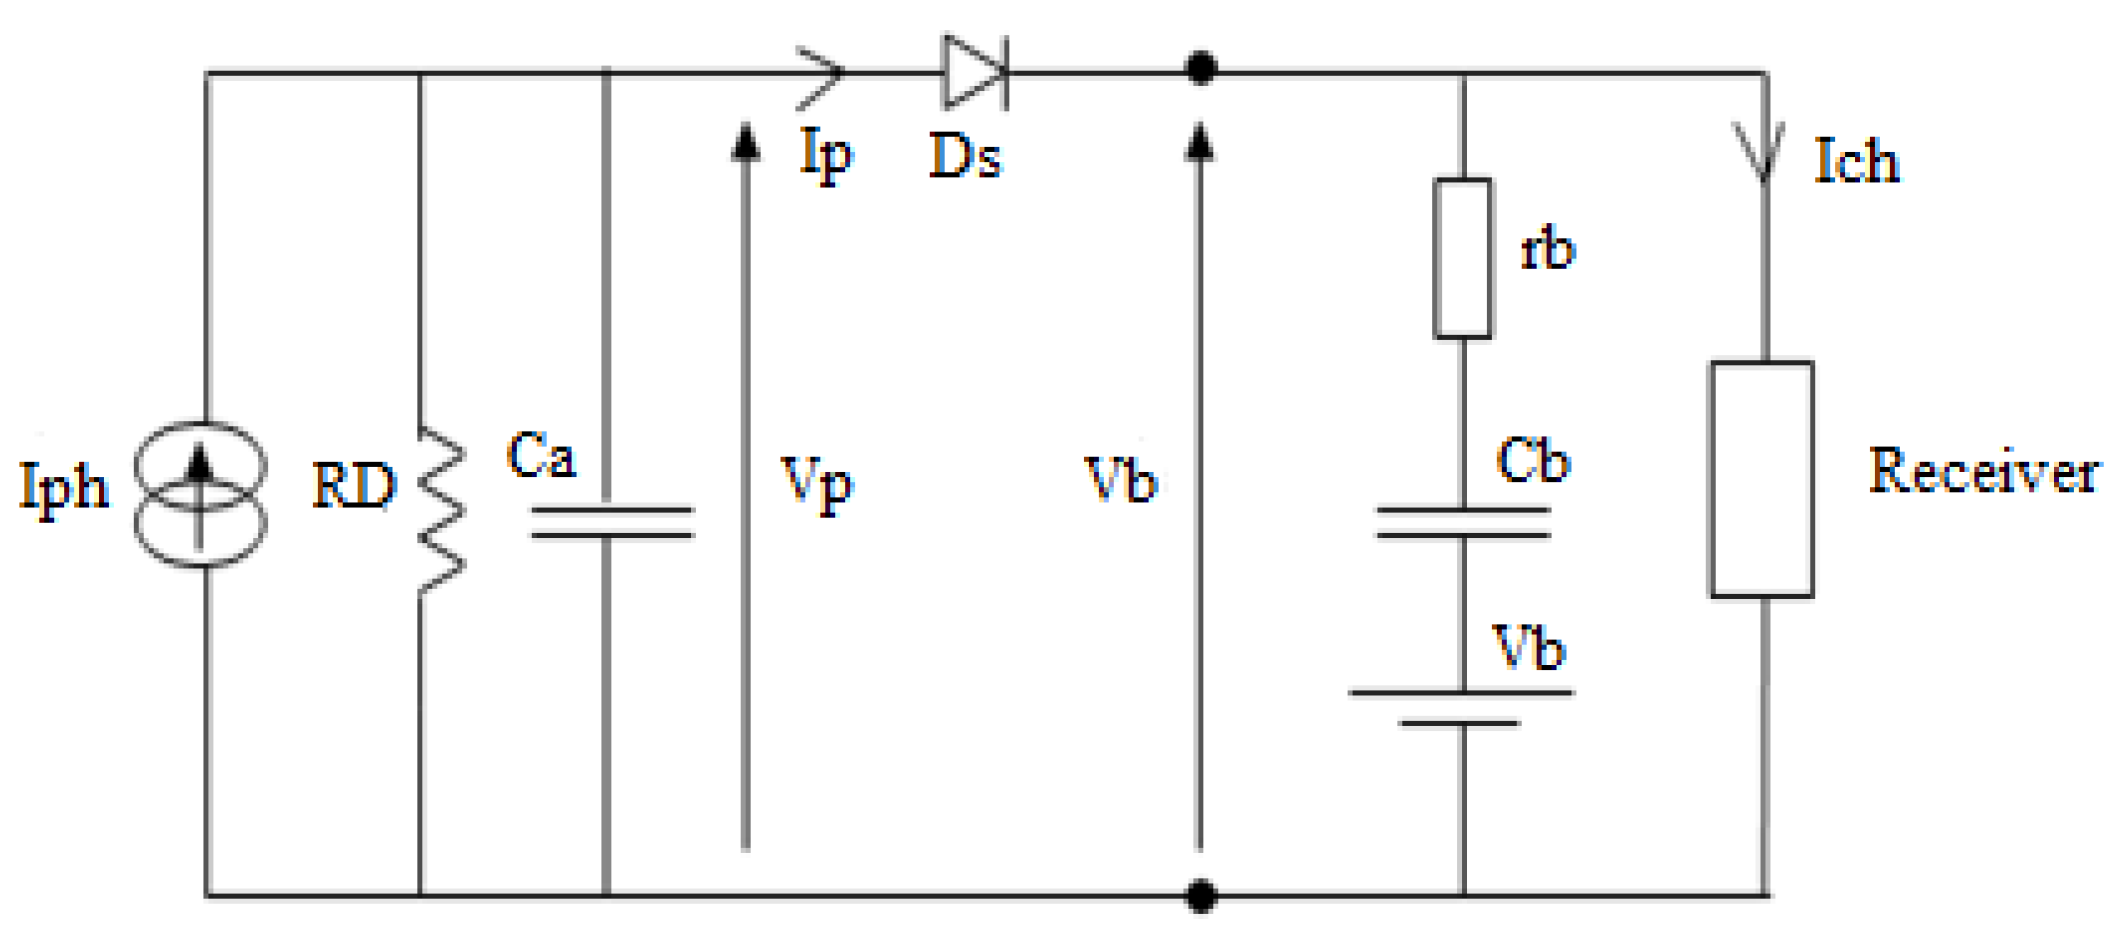
For an ideal model, the battery is represented by a simple voltage source Eb in series with a resistance rb (represents the internal resistance of the battery) and a storage capacity Cb to model the effect of charge and discharge of the battery [19].
Figure 9.
Equivalent electrical diagram of a battery.
Figure 9.
Equivalent electrical diagram of a battery.
This model has an advantage over other models. Indeed, it does not require direct or real time measurements (battery state of charge, acid concentration, battery current...).
The storage batteries used in the pilot water treatment unit studied can be modeled by a voltage source in series with a capacitor and a resistor (internal resistance of the battery), this is the simplified model of lead batteries.
Figure 10 shows schematically the simplest connection between a series-parallel grouping of batteries and a series-parallel grouping of photovoltaic modules. A protection diode Ds avoids the discharge of the accumulators through the photovoltaic cells during the non-illuminating periods.
The bon-graph model related to this electric circuit is represented by the following
Figure 11:
3. Modeling of the water treatment reactor
The UV water treatment reactor consists of a low-pressure discharge lamp powered by an electronic ballast.
3.1. Bond graph modeling of the ballast and the UV lamp
The electronic power supply (ballast) of a UV lamp can be broken down into three parts:
- ₋
The DC/AC converter: inverter;
- ₋
The transformer;
- ₋
The resonant circuit (oscillating);
3.1.1. Modeling of the DC/AC converter: inverter
The UV water treatment system is powered by a photovoltaic panel through a storage battery, so it has a continuous power supply of 24V. The resonant circuit requires a square voltage ±E, which is obtained with an inverter [7,20].
In our system, we use a single-phase inverter with its bond graph model is represented by the following
Figure 12:
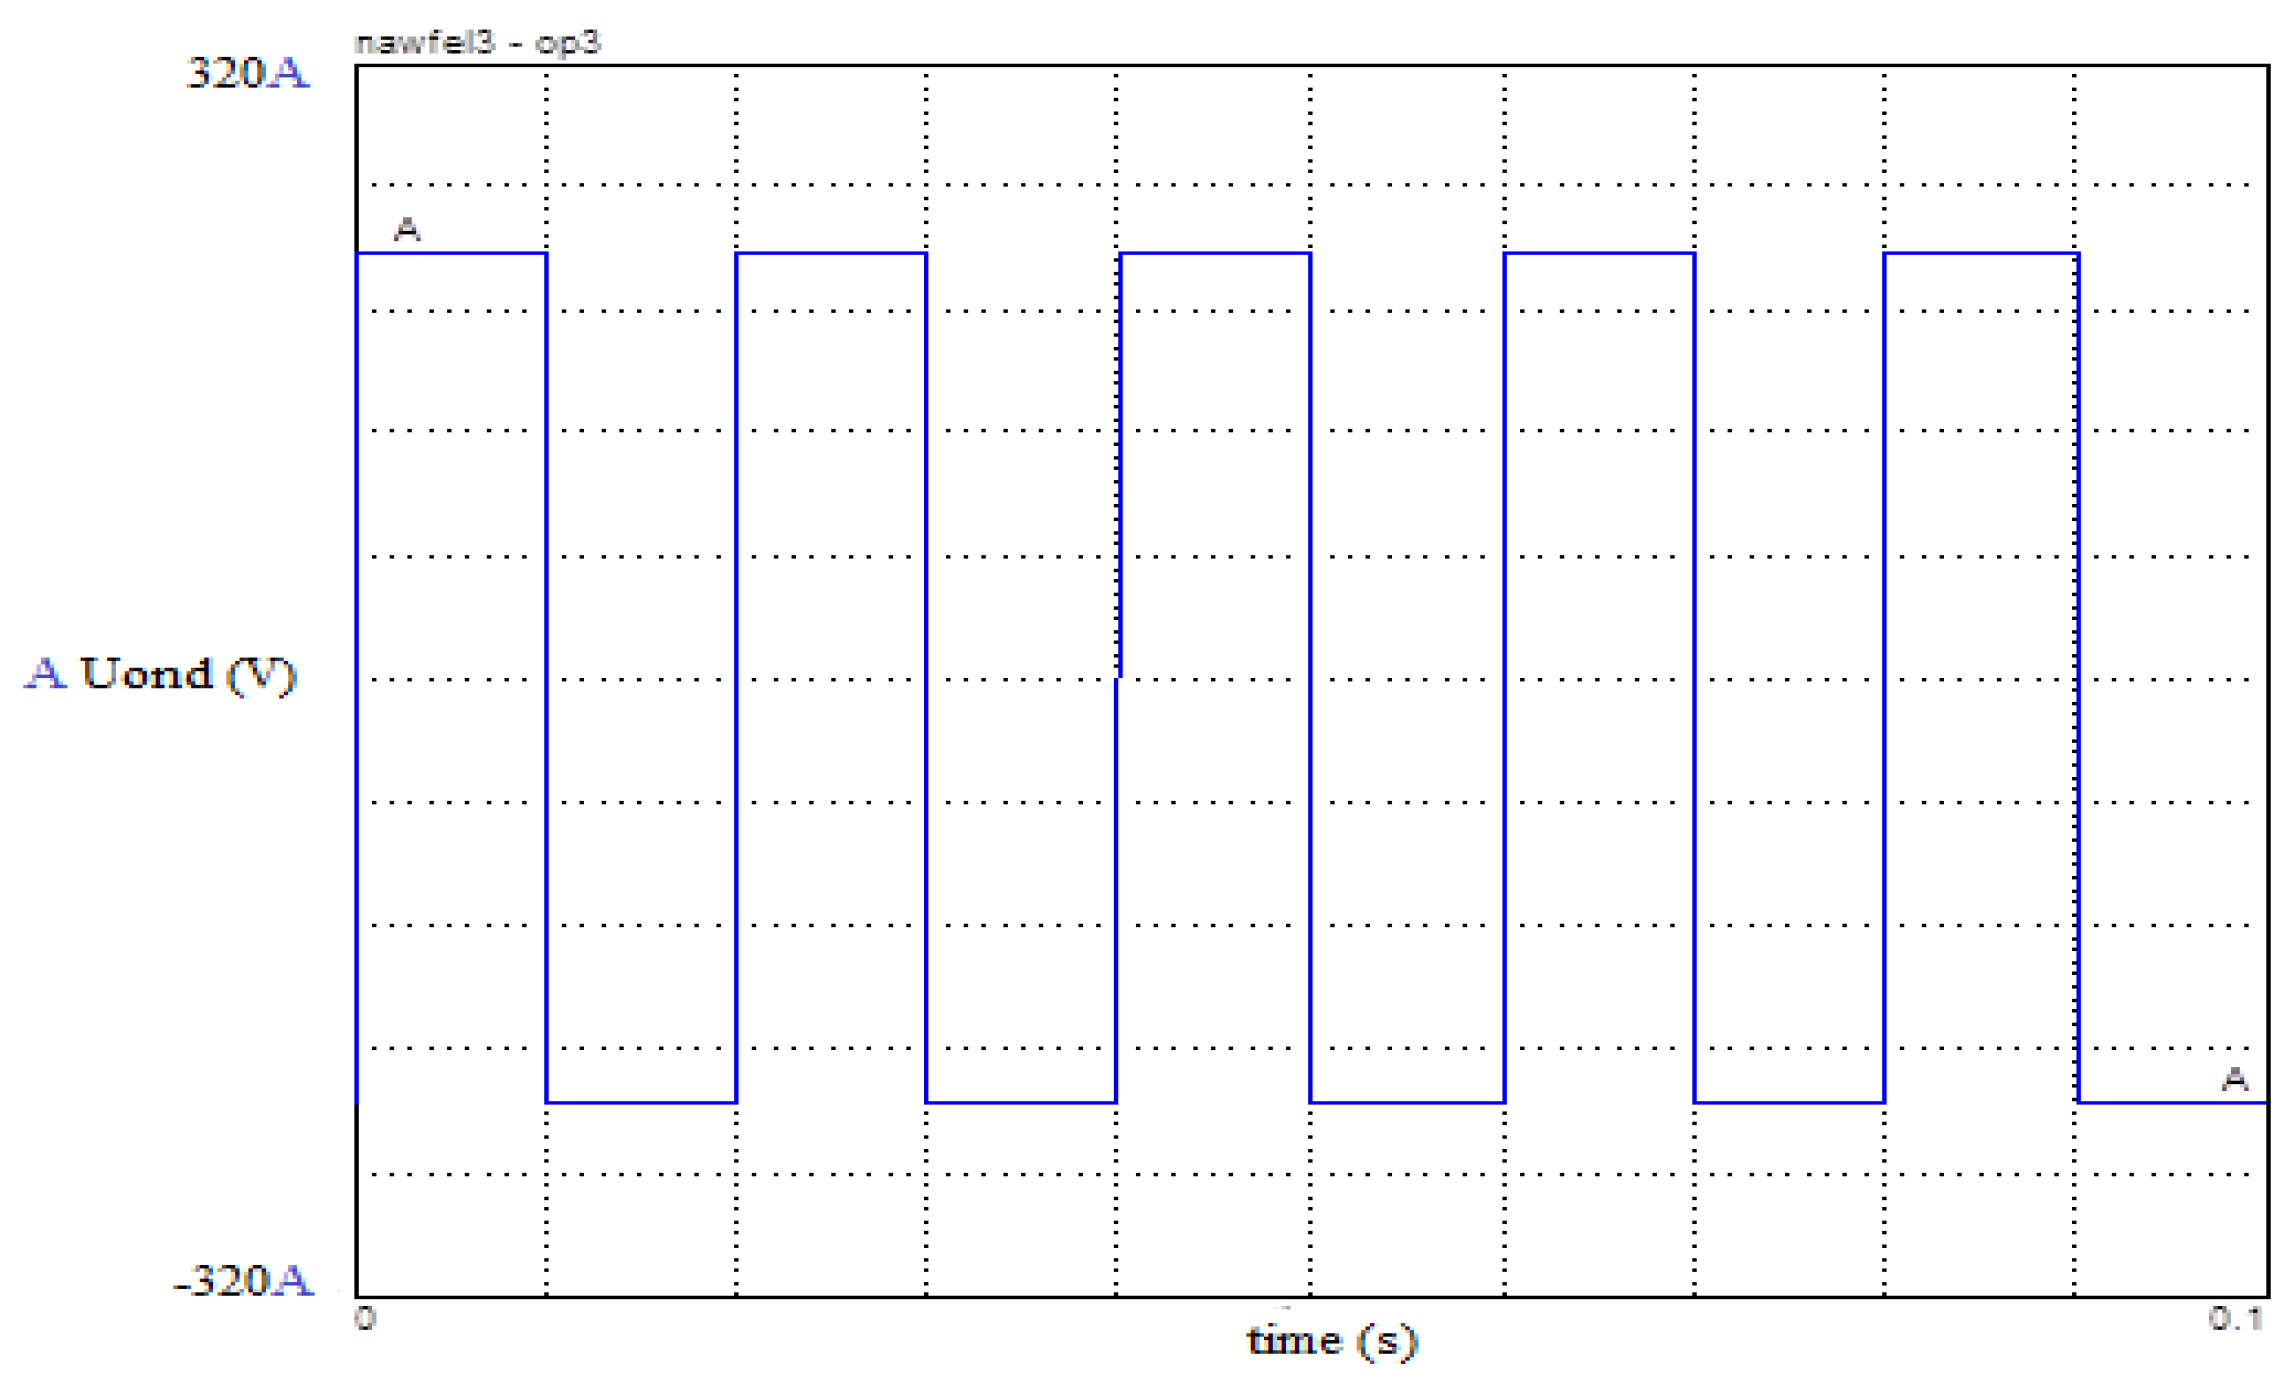
The simulation of the bond-graph model in the previous figure is shown as follows:
Figure 13.
Simulation of the output voltage of the inverter.
Figure 13.
Simulation of the output voltage of the inverter.
The output voltage varies between 220V and -220V, with a fixed frequency depending on the operation of the electronic ballast.
3.1.2. Modeling of the resonant circuit
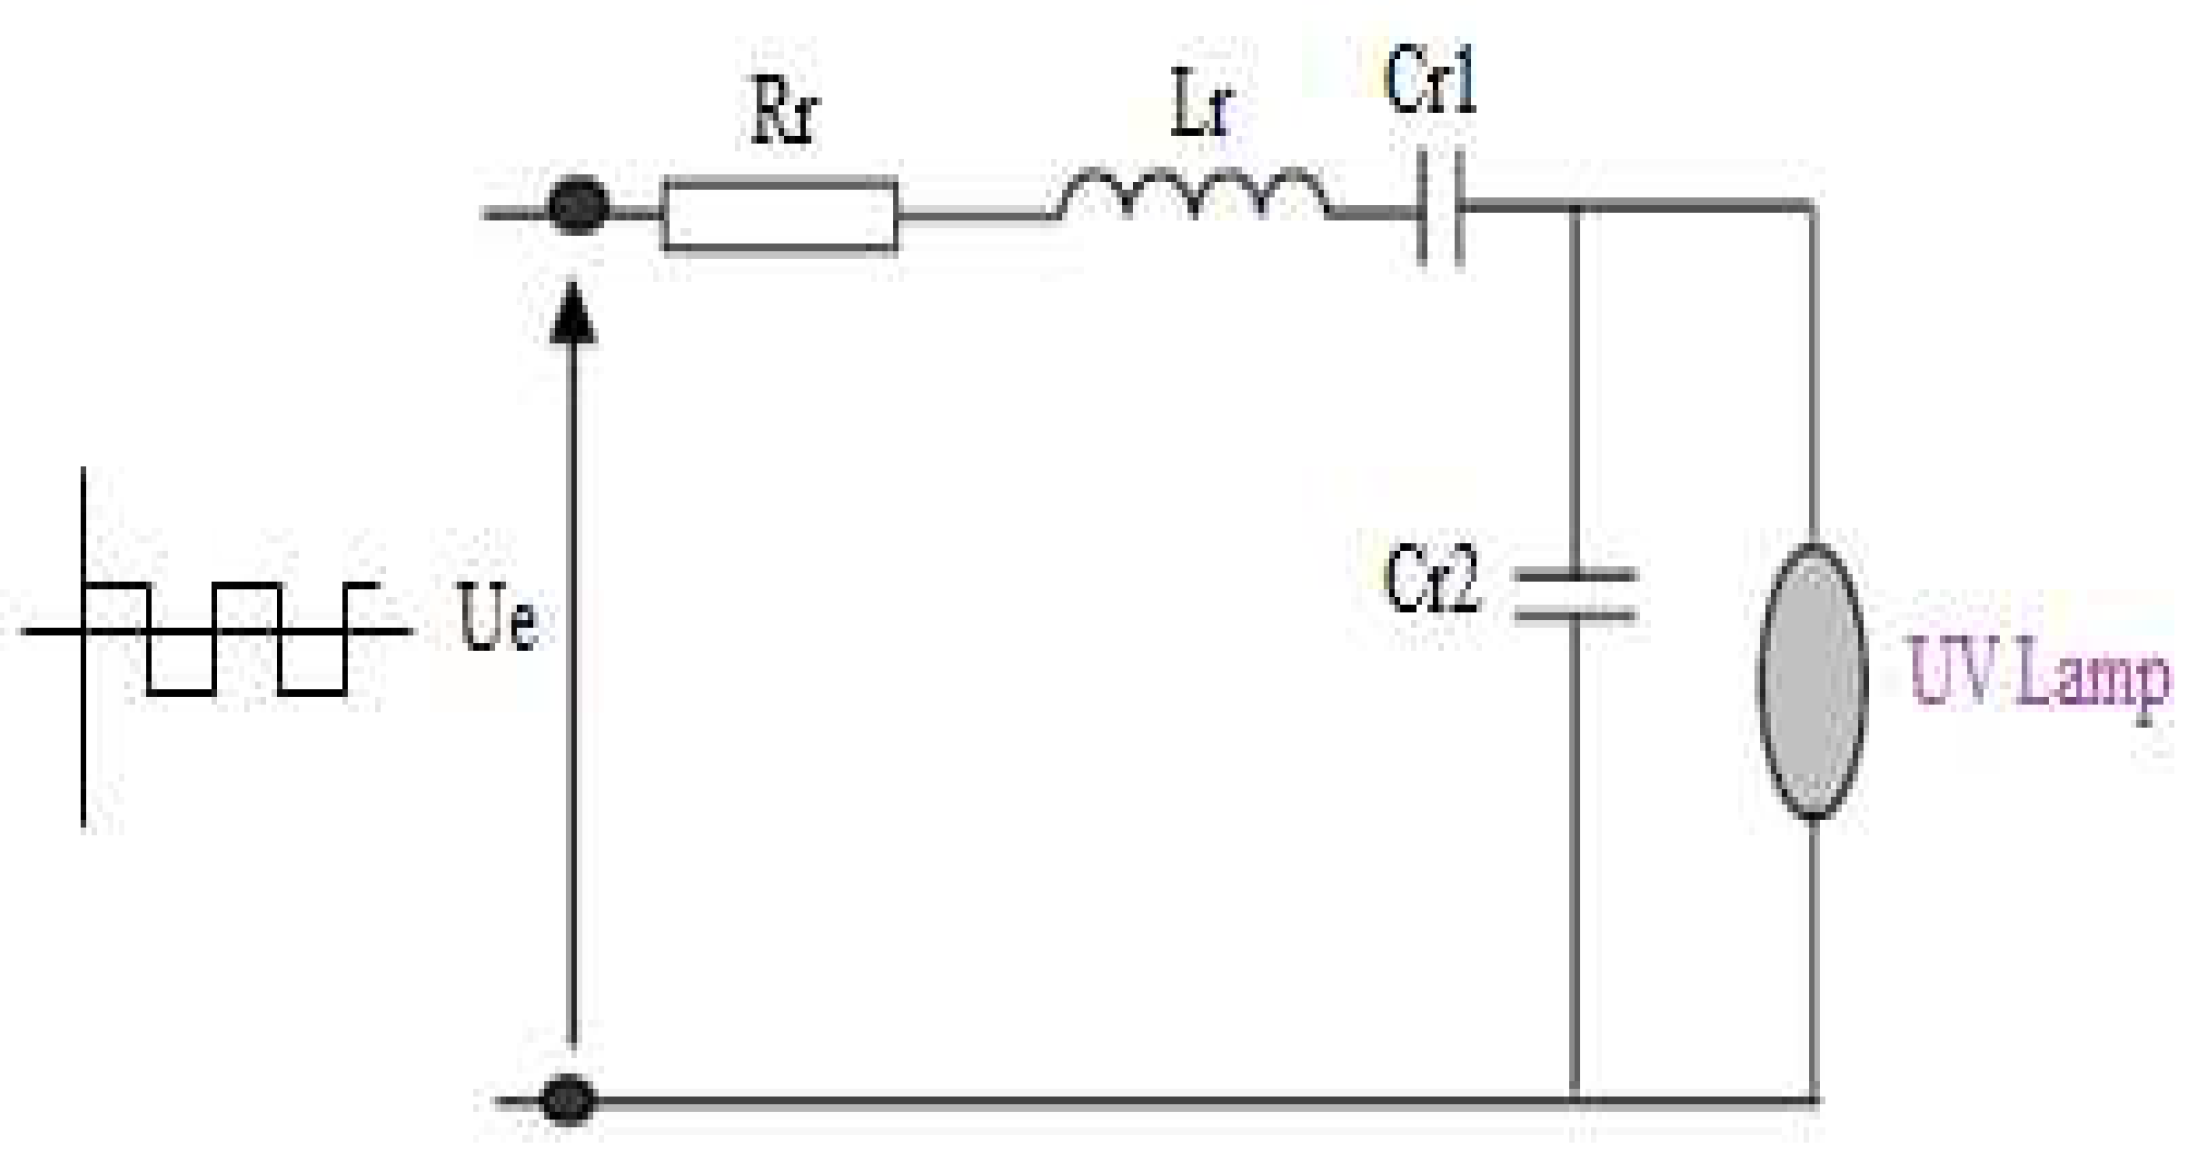
To start the lamp, we must create a short duration overvoltage at its terminals. This overvoltage is obtained thanks to a resonant circuit (RLC). The square voltage delivered by the DC/AC converter, drives a transformer to a resonant system formed by a resistor Rr in series with an inductance L and two capacitors Cr1 and Cr2. The receiver is a discharge lamp (UV) which can be assimilated to infinite impedance before the ignition and low value impedance after the ignition.
Taking into account the high impedance presented by the lamp before the ignition, the current chooses the shortest path and crosses Cr2. The overvoltage created by the resonant circuit, ignites the lamp, which by its low impedance value, short-circuits Cr2 [7,20].
Figure 14.
Electrical diagram of the power supply UV lamp.
Figure 14.
Electrical diagram of the power supply UV lamp.
Figure 15.
Bond-graph modeling of the resonant circuit.
Figure 15.
Bond-graph modeling of the resonant circuit.
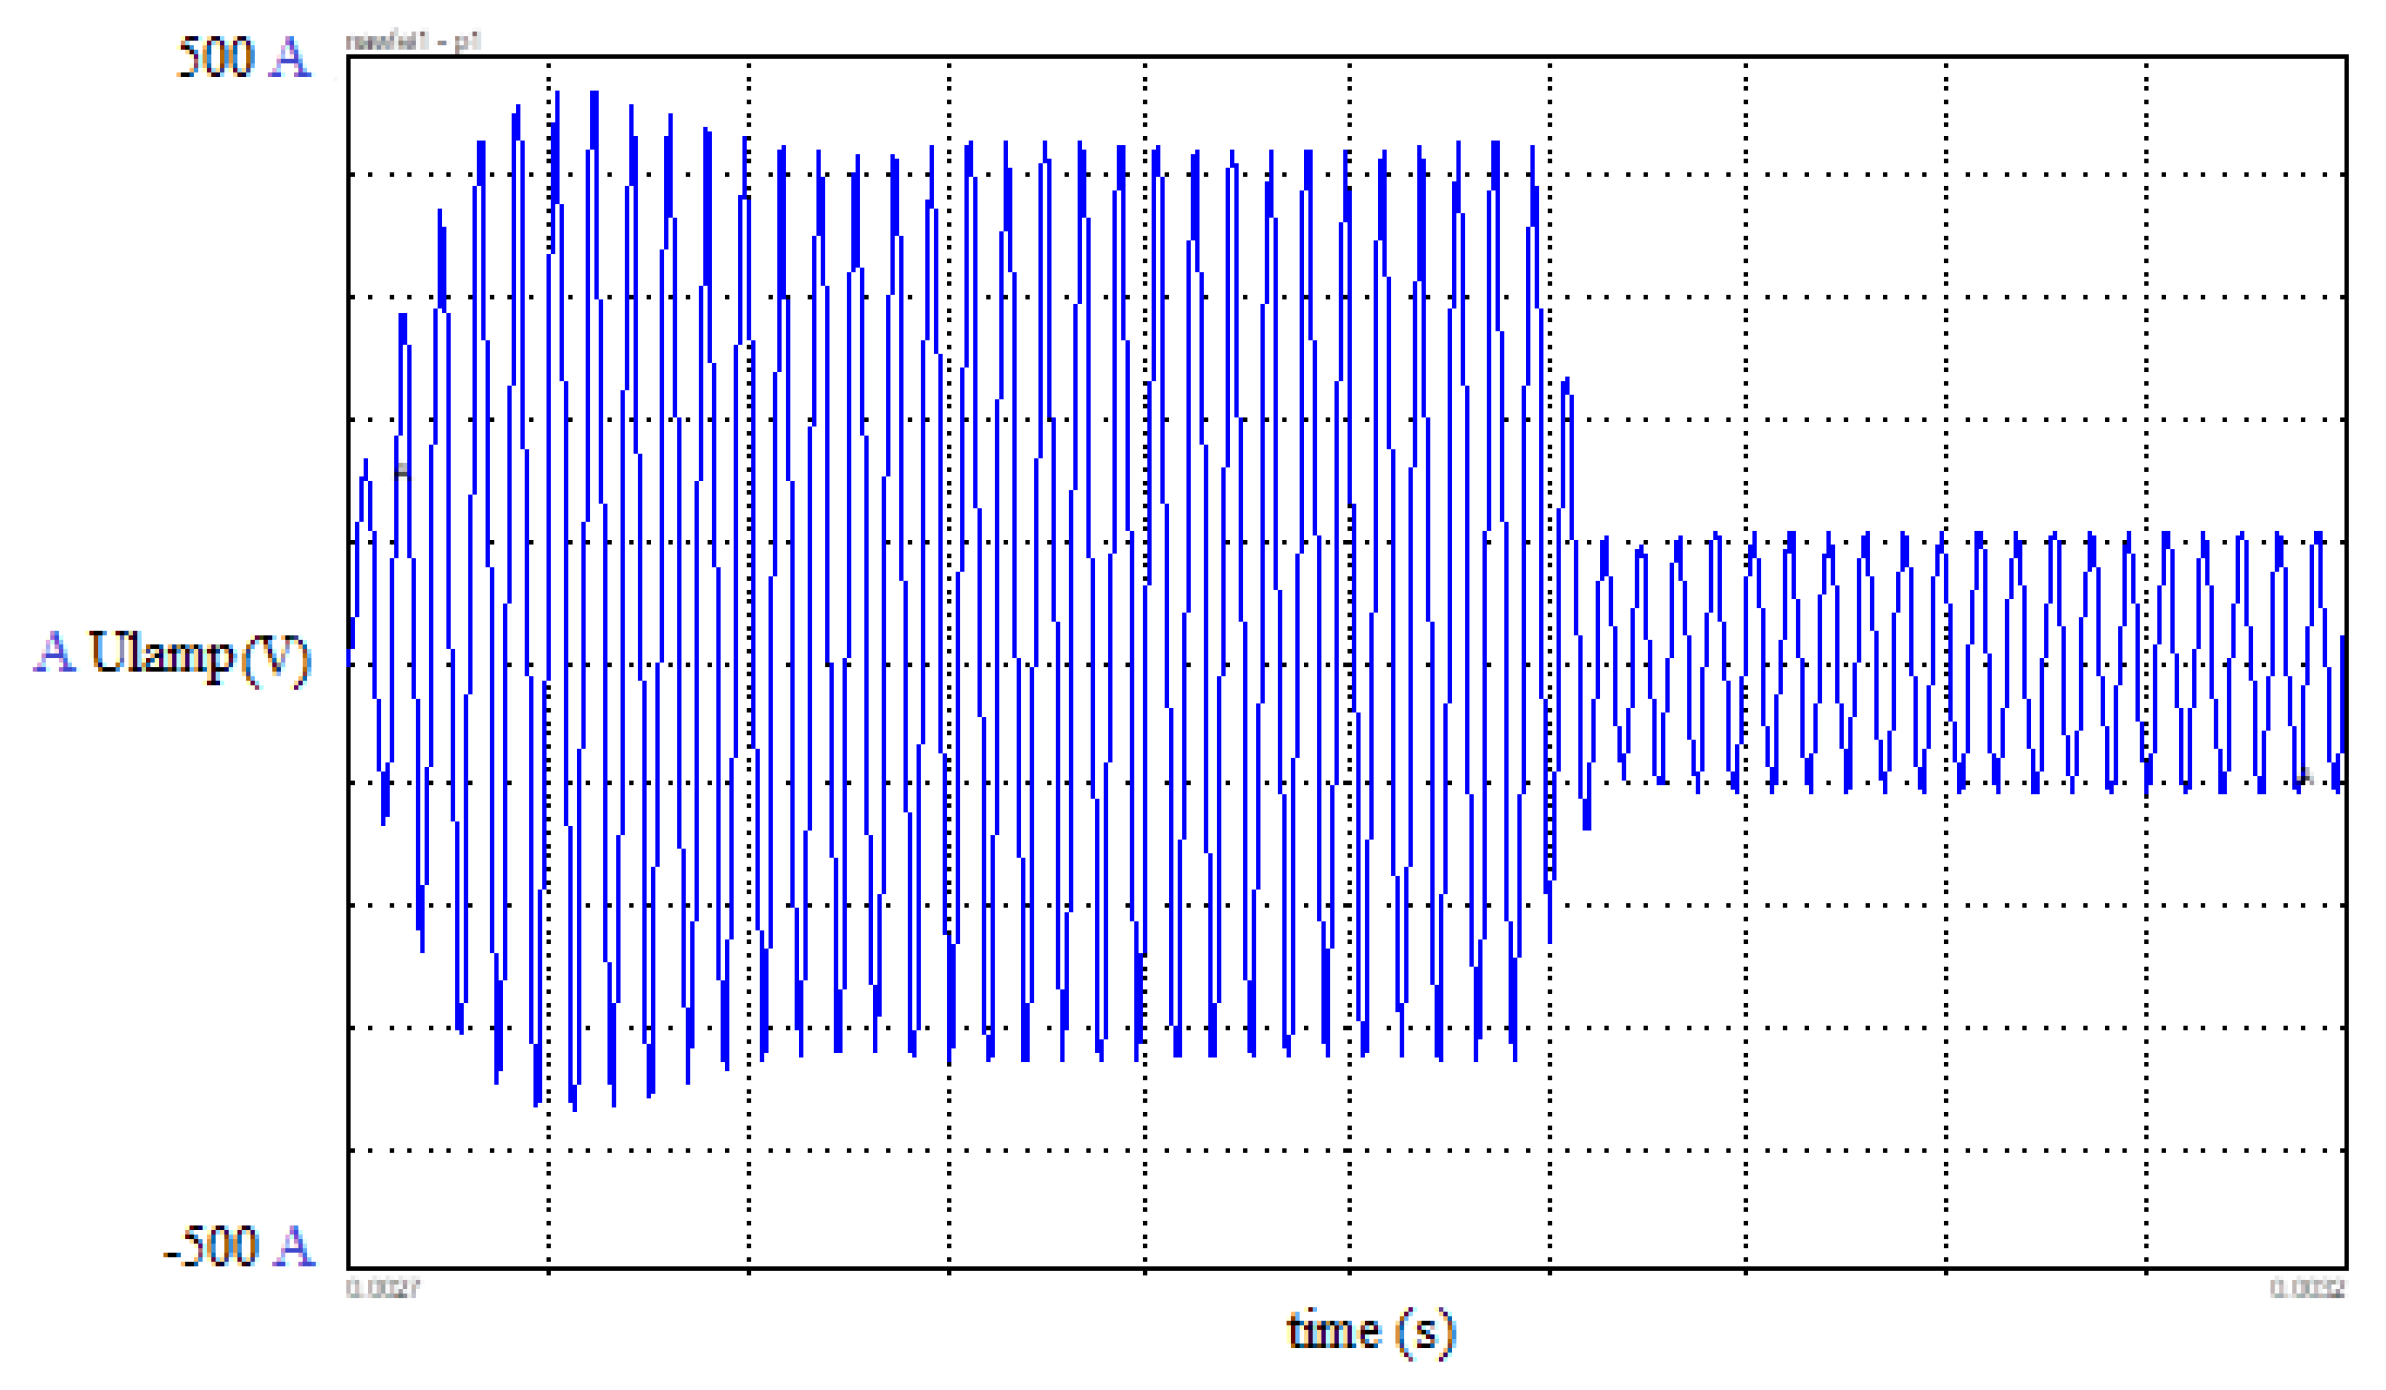
After the application of an overvoltage to the lamp terminals (400V ignition voltage), it takes at least 2 to 3 ms (overvoltage duration) for the lamp to ignite.
Figure 16.
Simulation of the resonant circuit.
Figure 16.
Simulation of the resonant circuit.
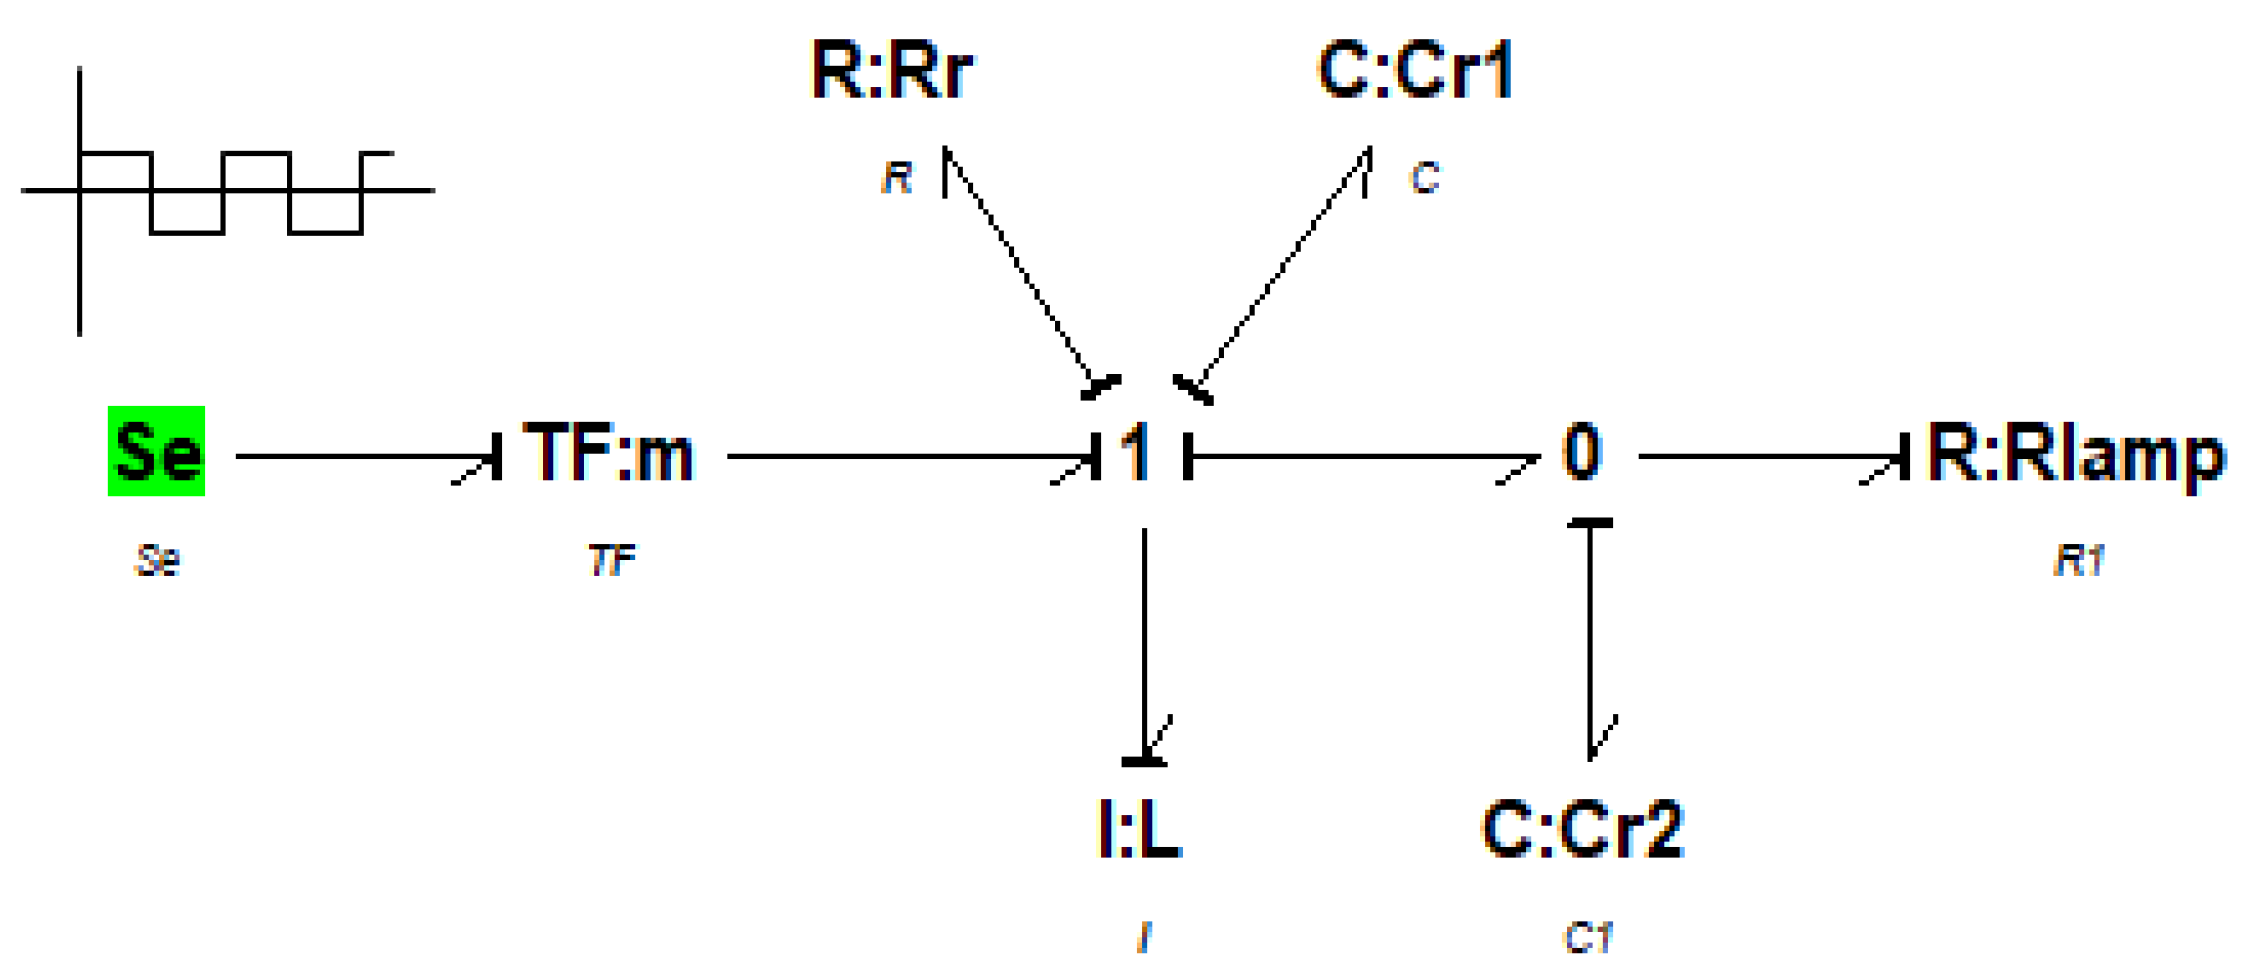
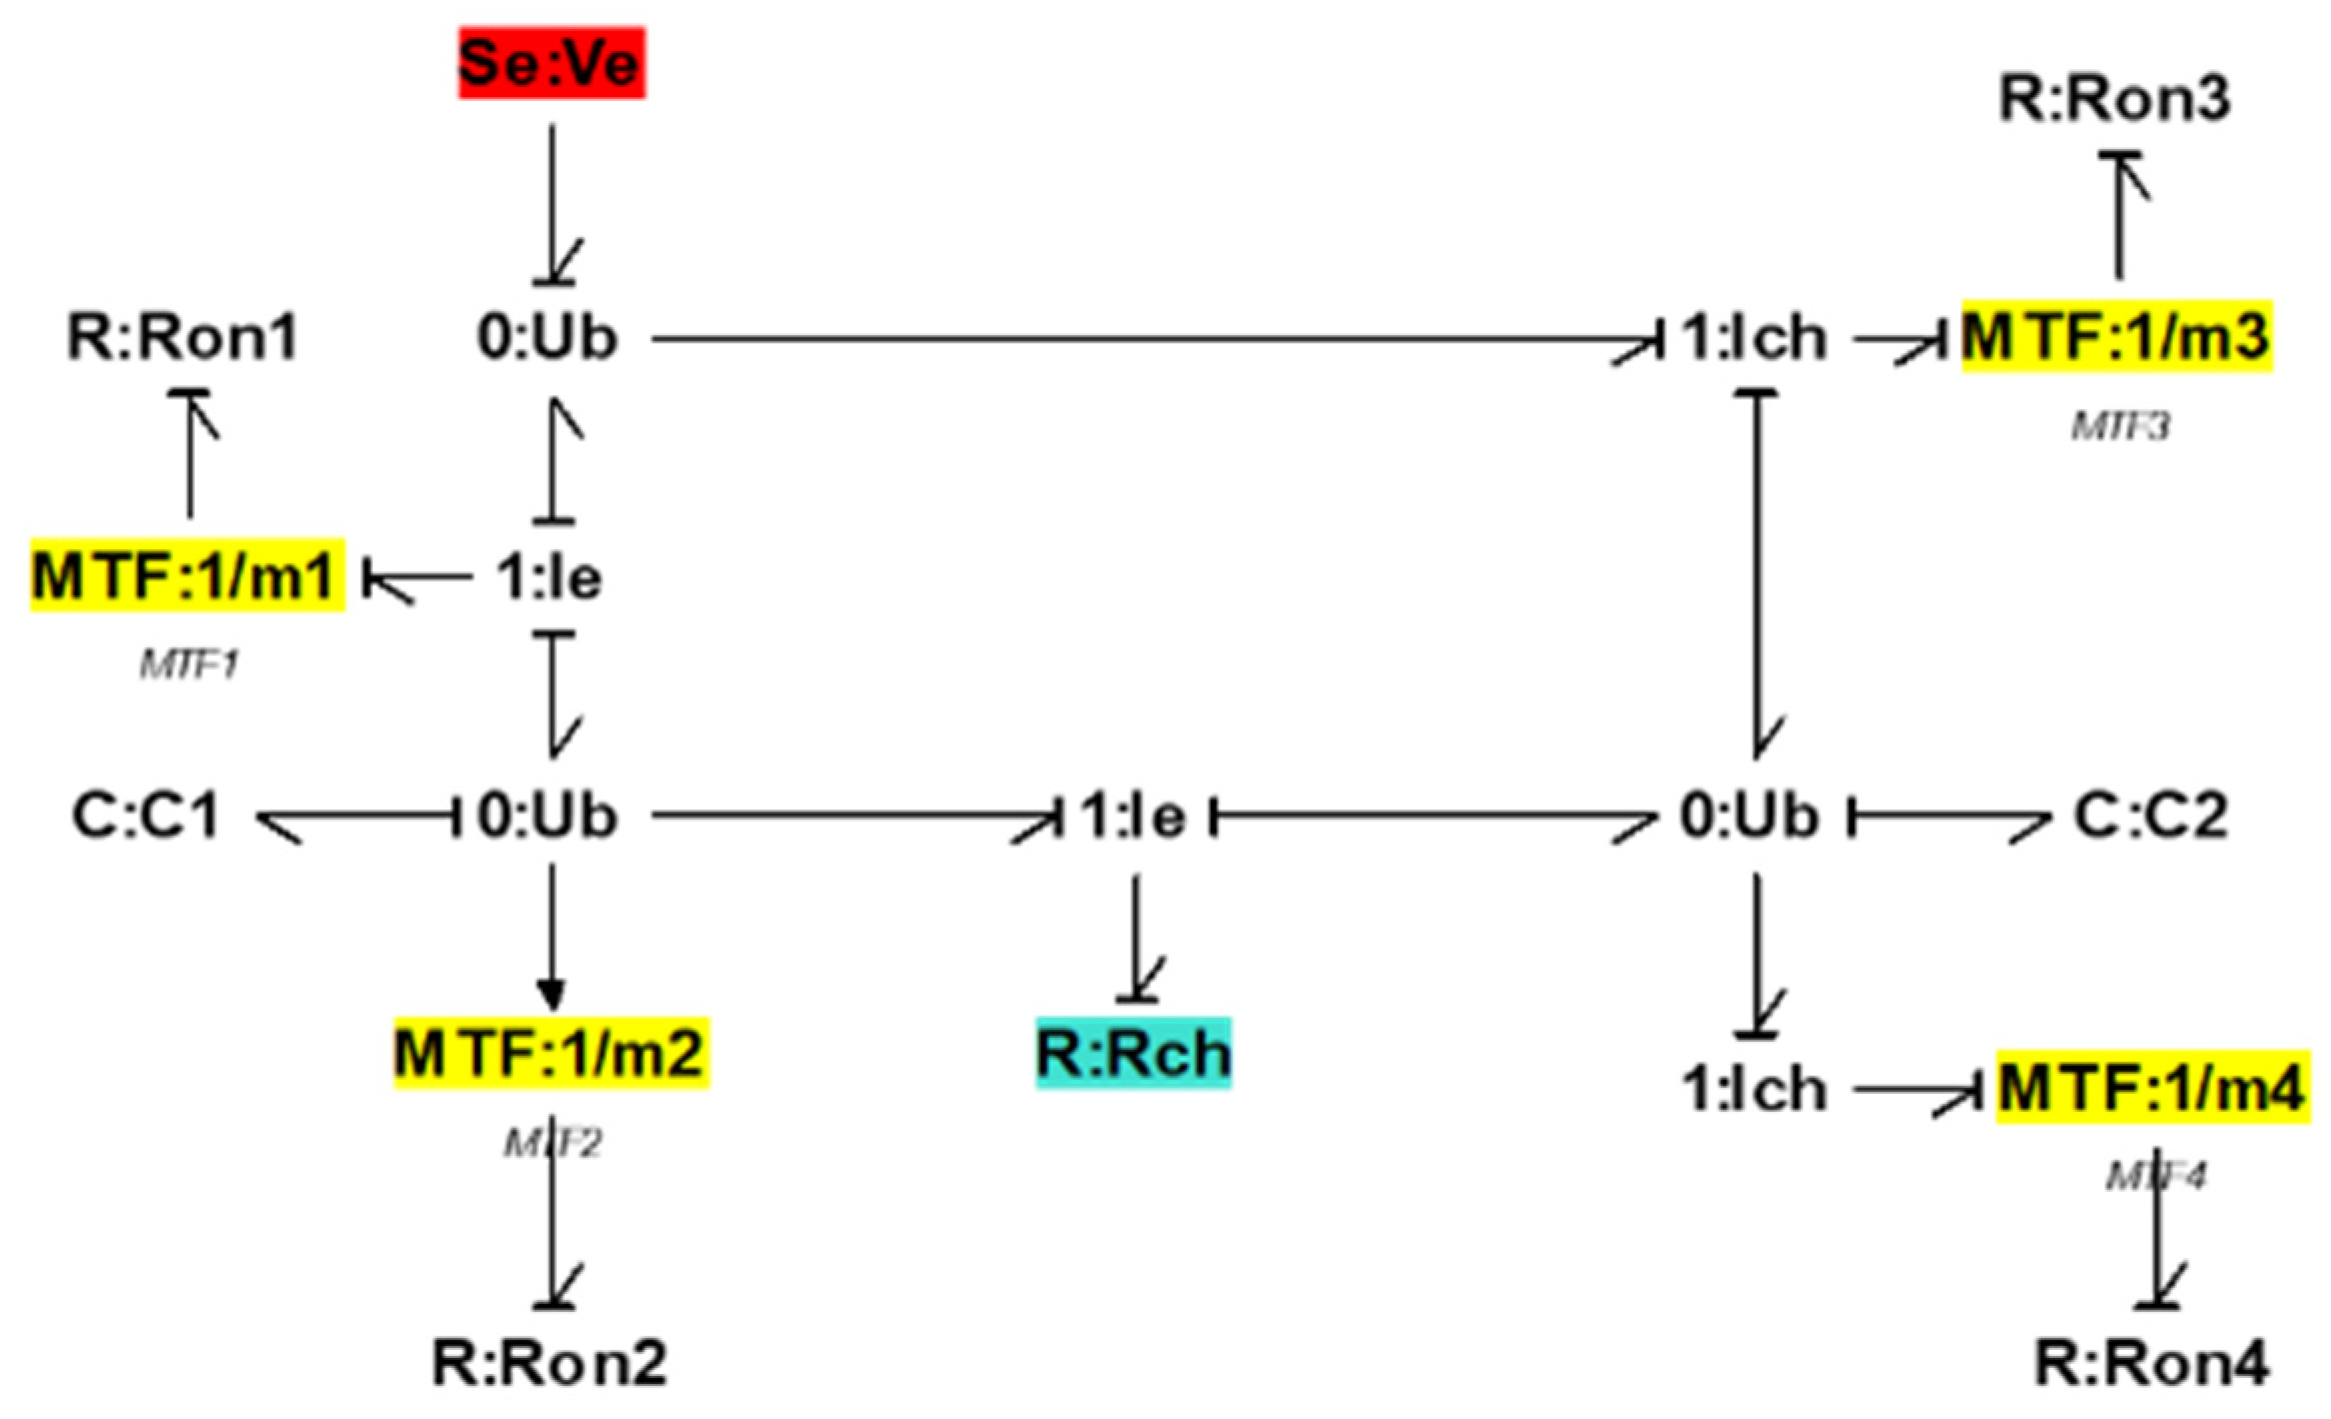
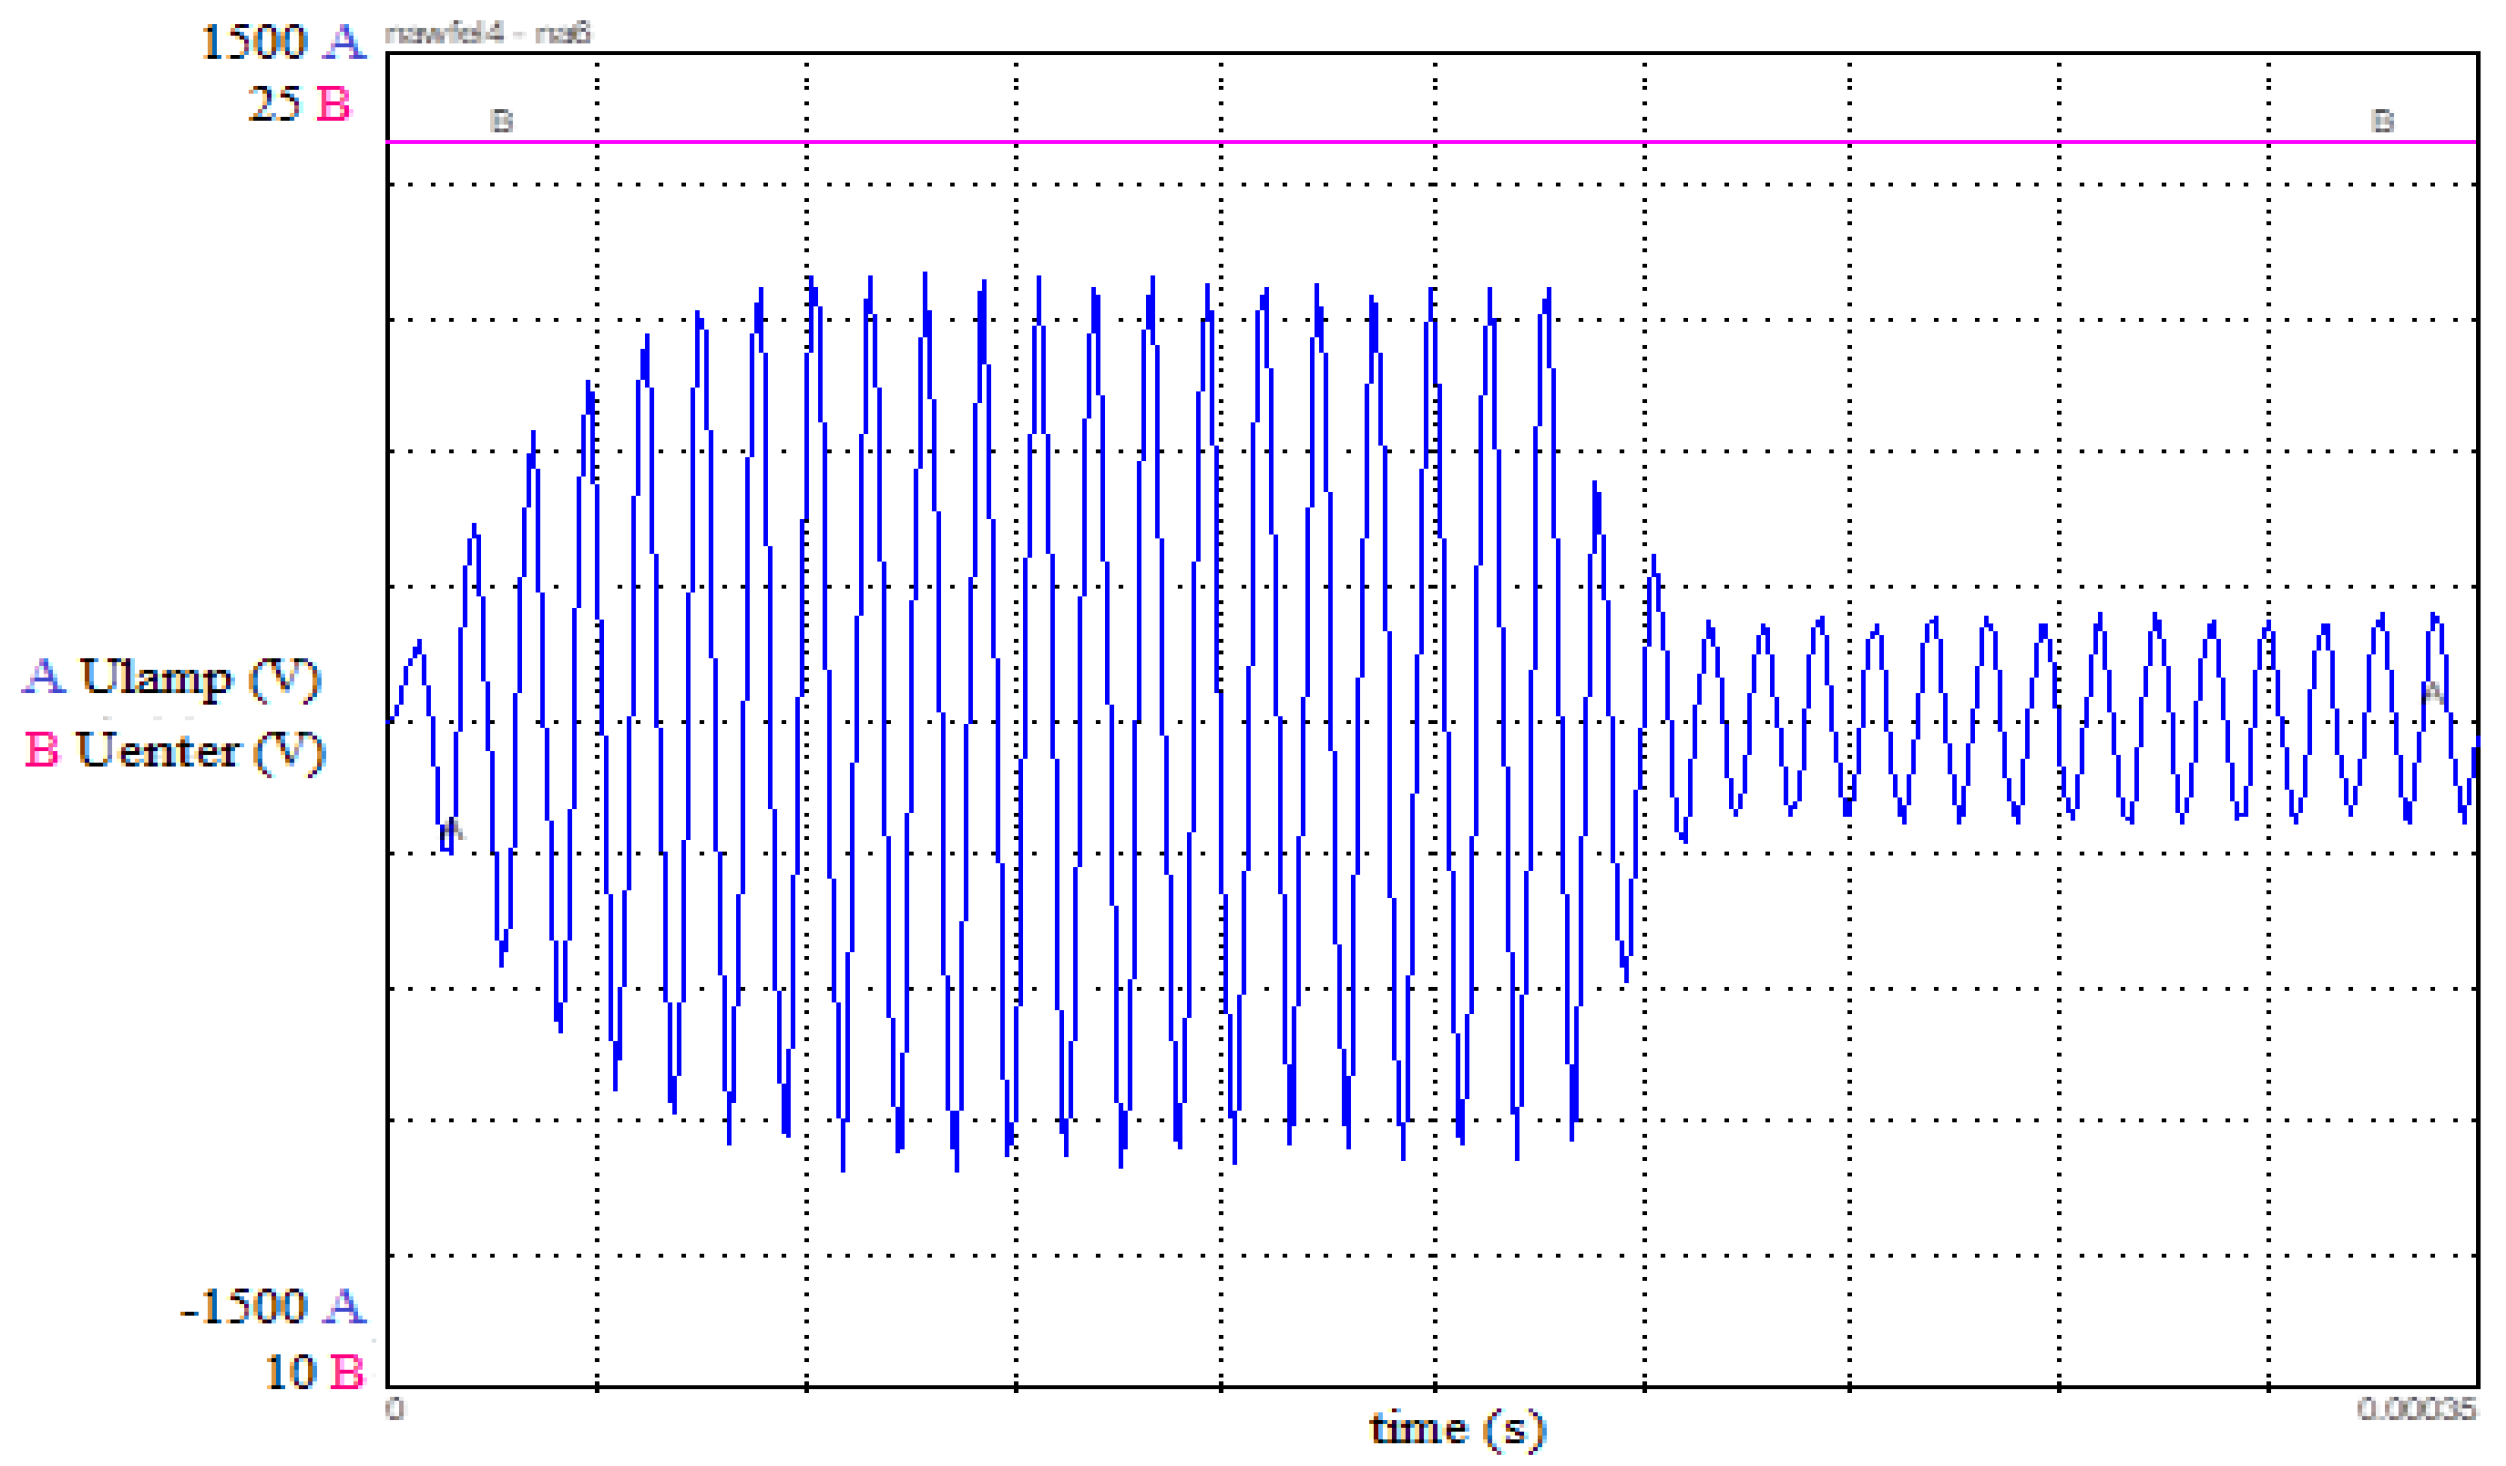
After having modeled the resonant circuit and the UV lamp, we can then replace the square voltage source by a DC voltage source (delivered by the photovoltaic panel) through an inverter (DC/AC converter).
The bond graph model and the simulation are shown in the following
Figure 17 and
Figure 18:
4. Bond-graph modeling of the hydraulic system
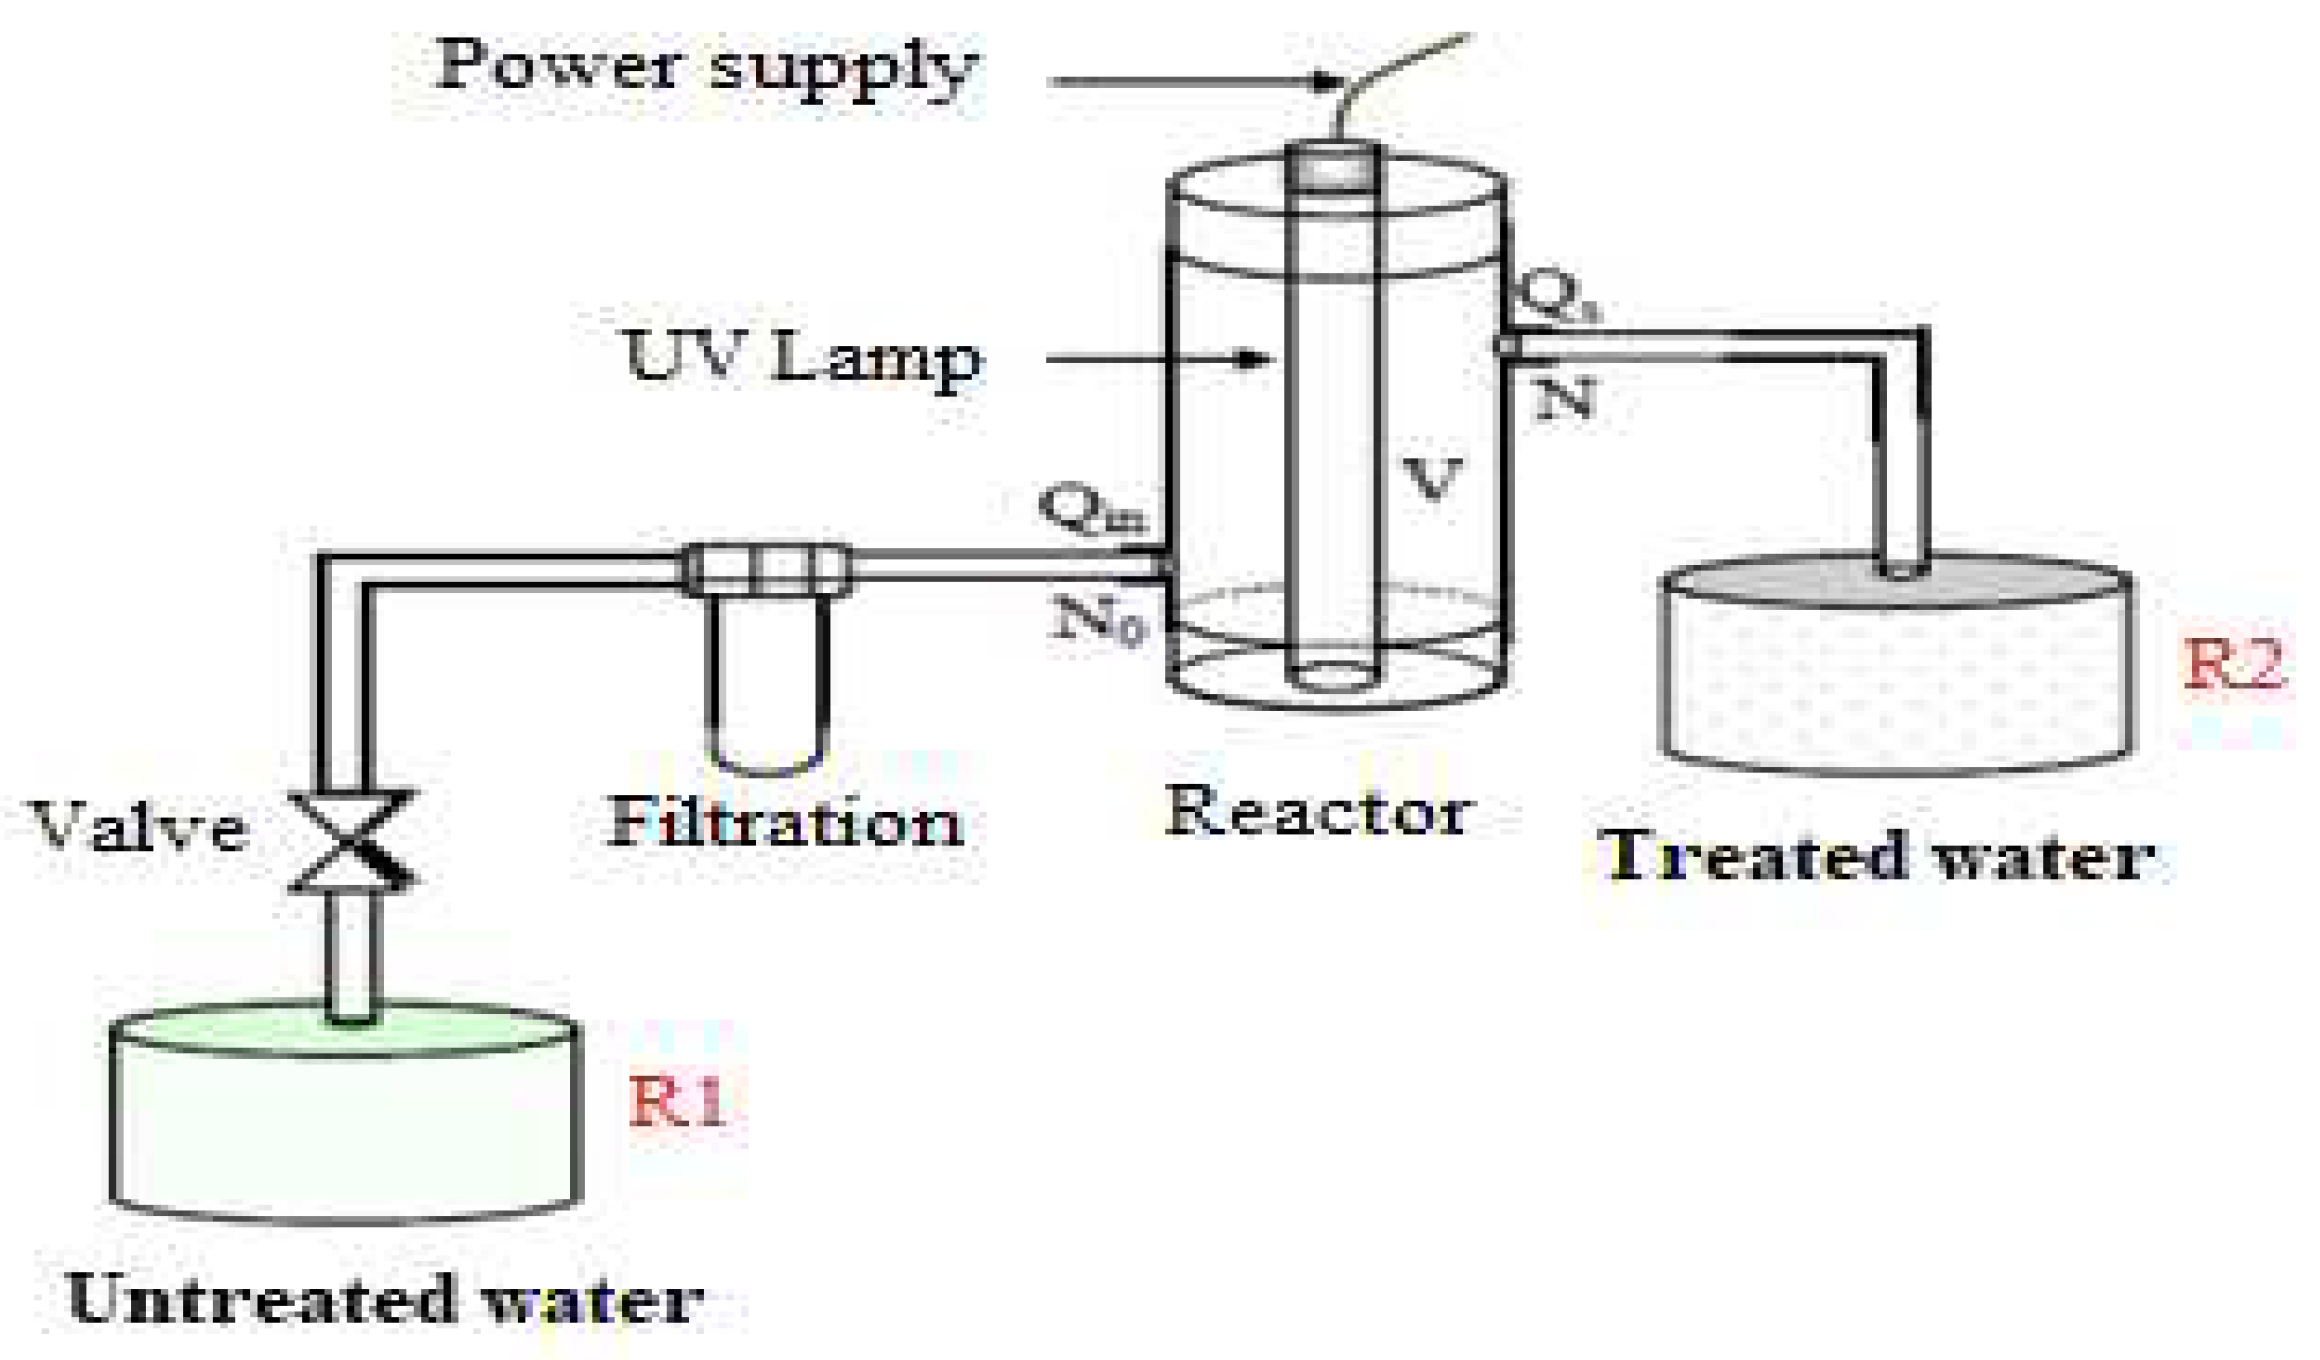
The water treatment operation consists of circulating the water stored in a first tank (R1) through a UV reactor (with the help of a motor pump) to crush viruses and bacteria.
The treated water is stored again in a second tank (R2), ready to be used.
Figure 19.
Schematic diagram of the UV treatment system.
Figure 19.
Schematic diagram of the UV treatment system.
4.1. Modeling of the DC Motor
The hydraulic system consists of a DC motor connected to a centrifugal pump.
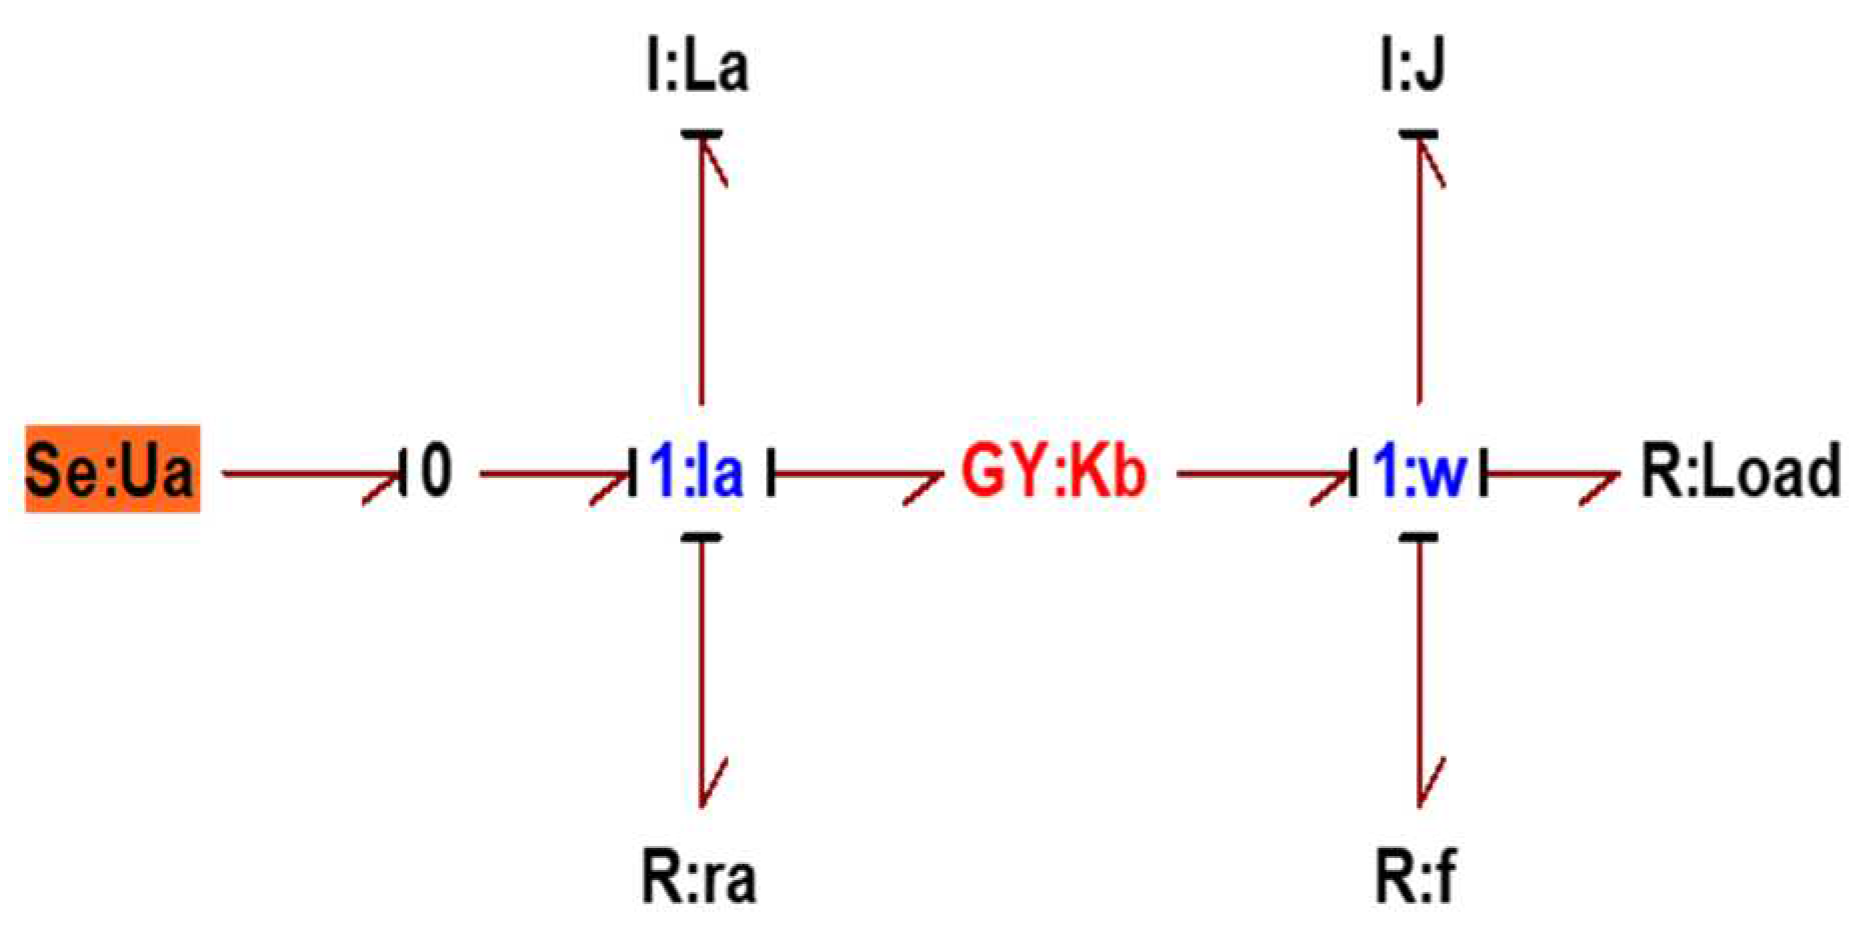
The bond-graph model of the DC machine takes into account the theory of electrical engineering and shows the electrical, electromagnetic and mechanical equations as in the classical model [20,22].
The dynamics of the DC motor is described by the following equations:
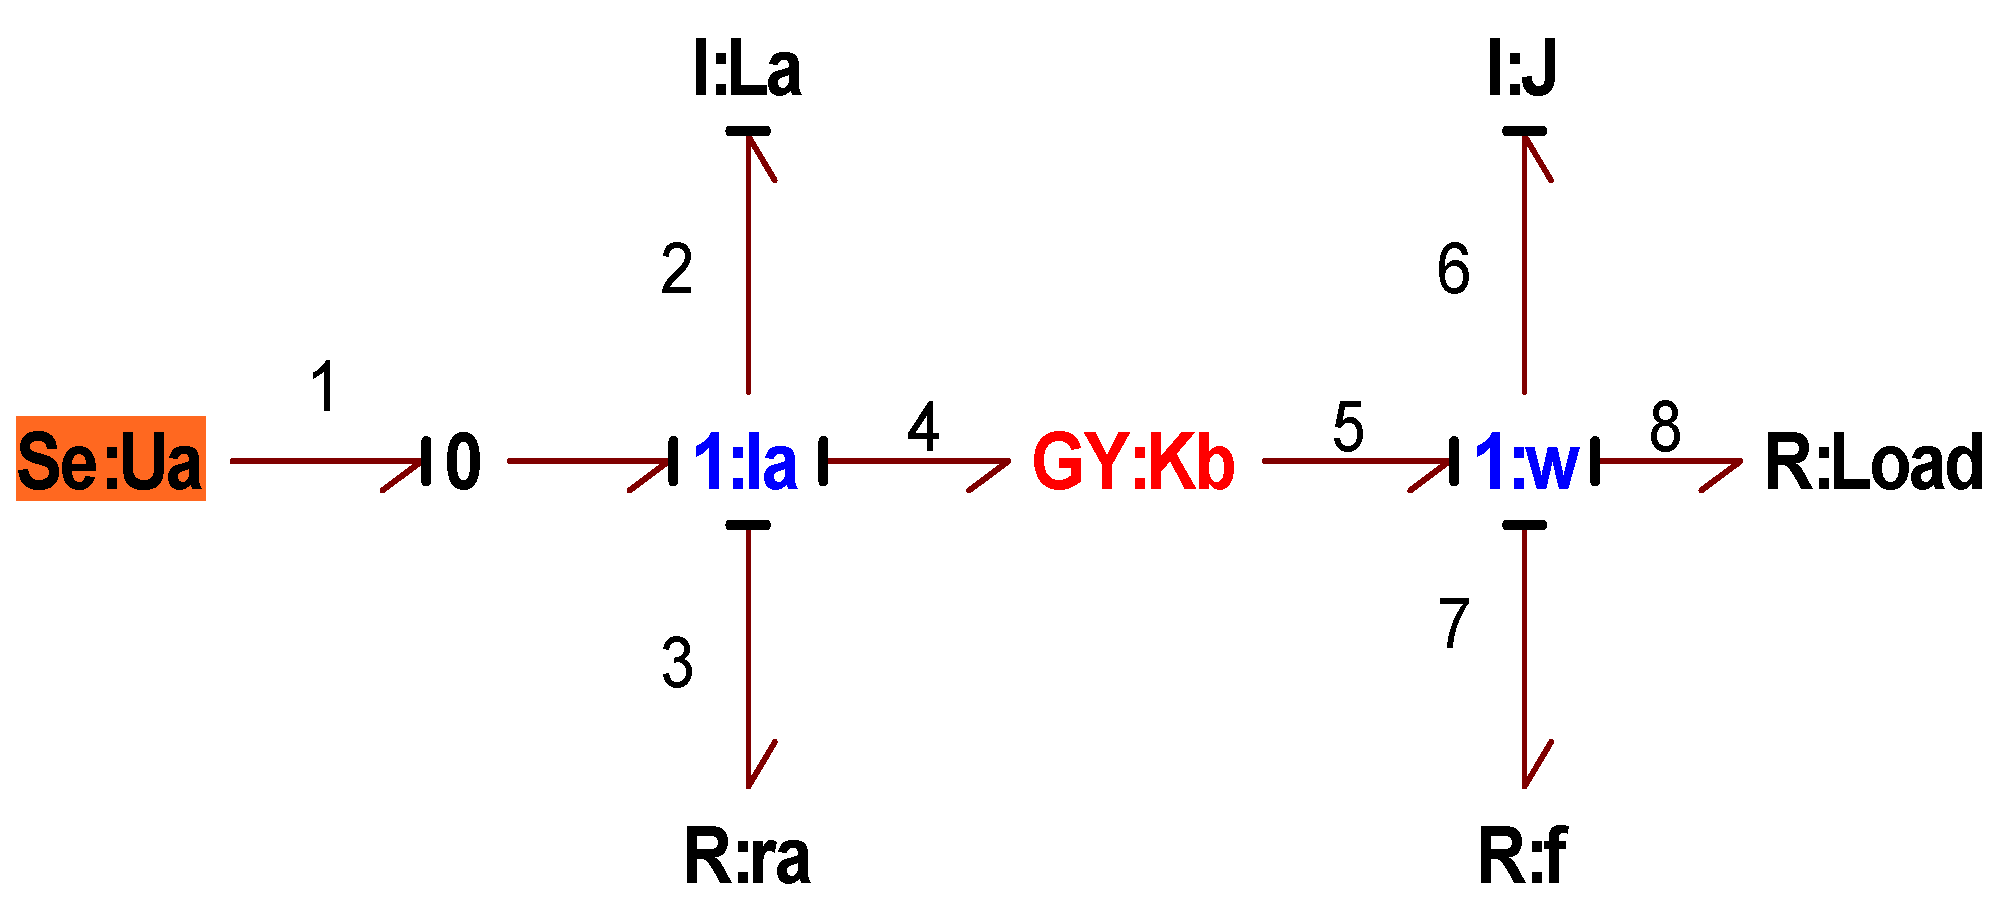
This figure represents the bond graph model of a DC motor:
Figure 20.
Bond graph model for a DC motor.
Figure 20.
Bond graph model for a DC motor.
4.2. Modeling of the centrifugal pump
The water treatment process consists of circulating the water through a UV reactor to kill viruses and bacteria. Turning on the centrifugal pump causes the impeller to rotate produces a pressure and a speed that determines the flow of the fluid in the hydraulic system [7,23].
The equations that define the operation of the centrifugal pump such as: the theory of elevation 'He', the pressure 'Pe' and the torque transmitted by the motor 'Te' are represented respectively as follows:
The pressure developed by the wheel is directly proportional to the angular velocity w. The shaft speed is proportional to the flow rate Q. The developed pressure and the transmitted torque have the following expressions respectively:
: pressure developed by the pump, : motor torque, r2, b2 : pump size, β2 : angle of exit of the vane,
The relation between the pressure supplied by the pump and the rotation speed (ω) can be modeled in bond-graph by a modulated gyrator element: “MGY” transforms the mechanical flow (motor torque) into hydraulic force (pressure).
The pressure losses in the pump are due to:
- Friction of the liquid threads between them and against the walls of the machine such as:
This friction is modeled in bond-graph by a resistive element R: fmp
The moment of inertia of the rotating parts of the pump having the expression:
This moment of inertia is modeled in bond-graph by an inertial element I : Jpt
The bond graph model associated with the centrifugal pump is shown in the following
Figure 21:
The height difference between the two tanks is modeled by a negative force source as shown in the following equation:
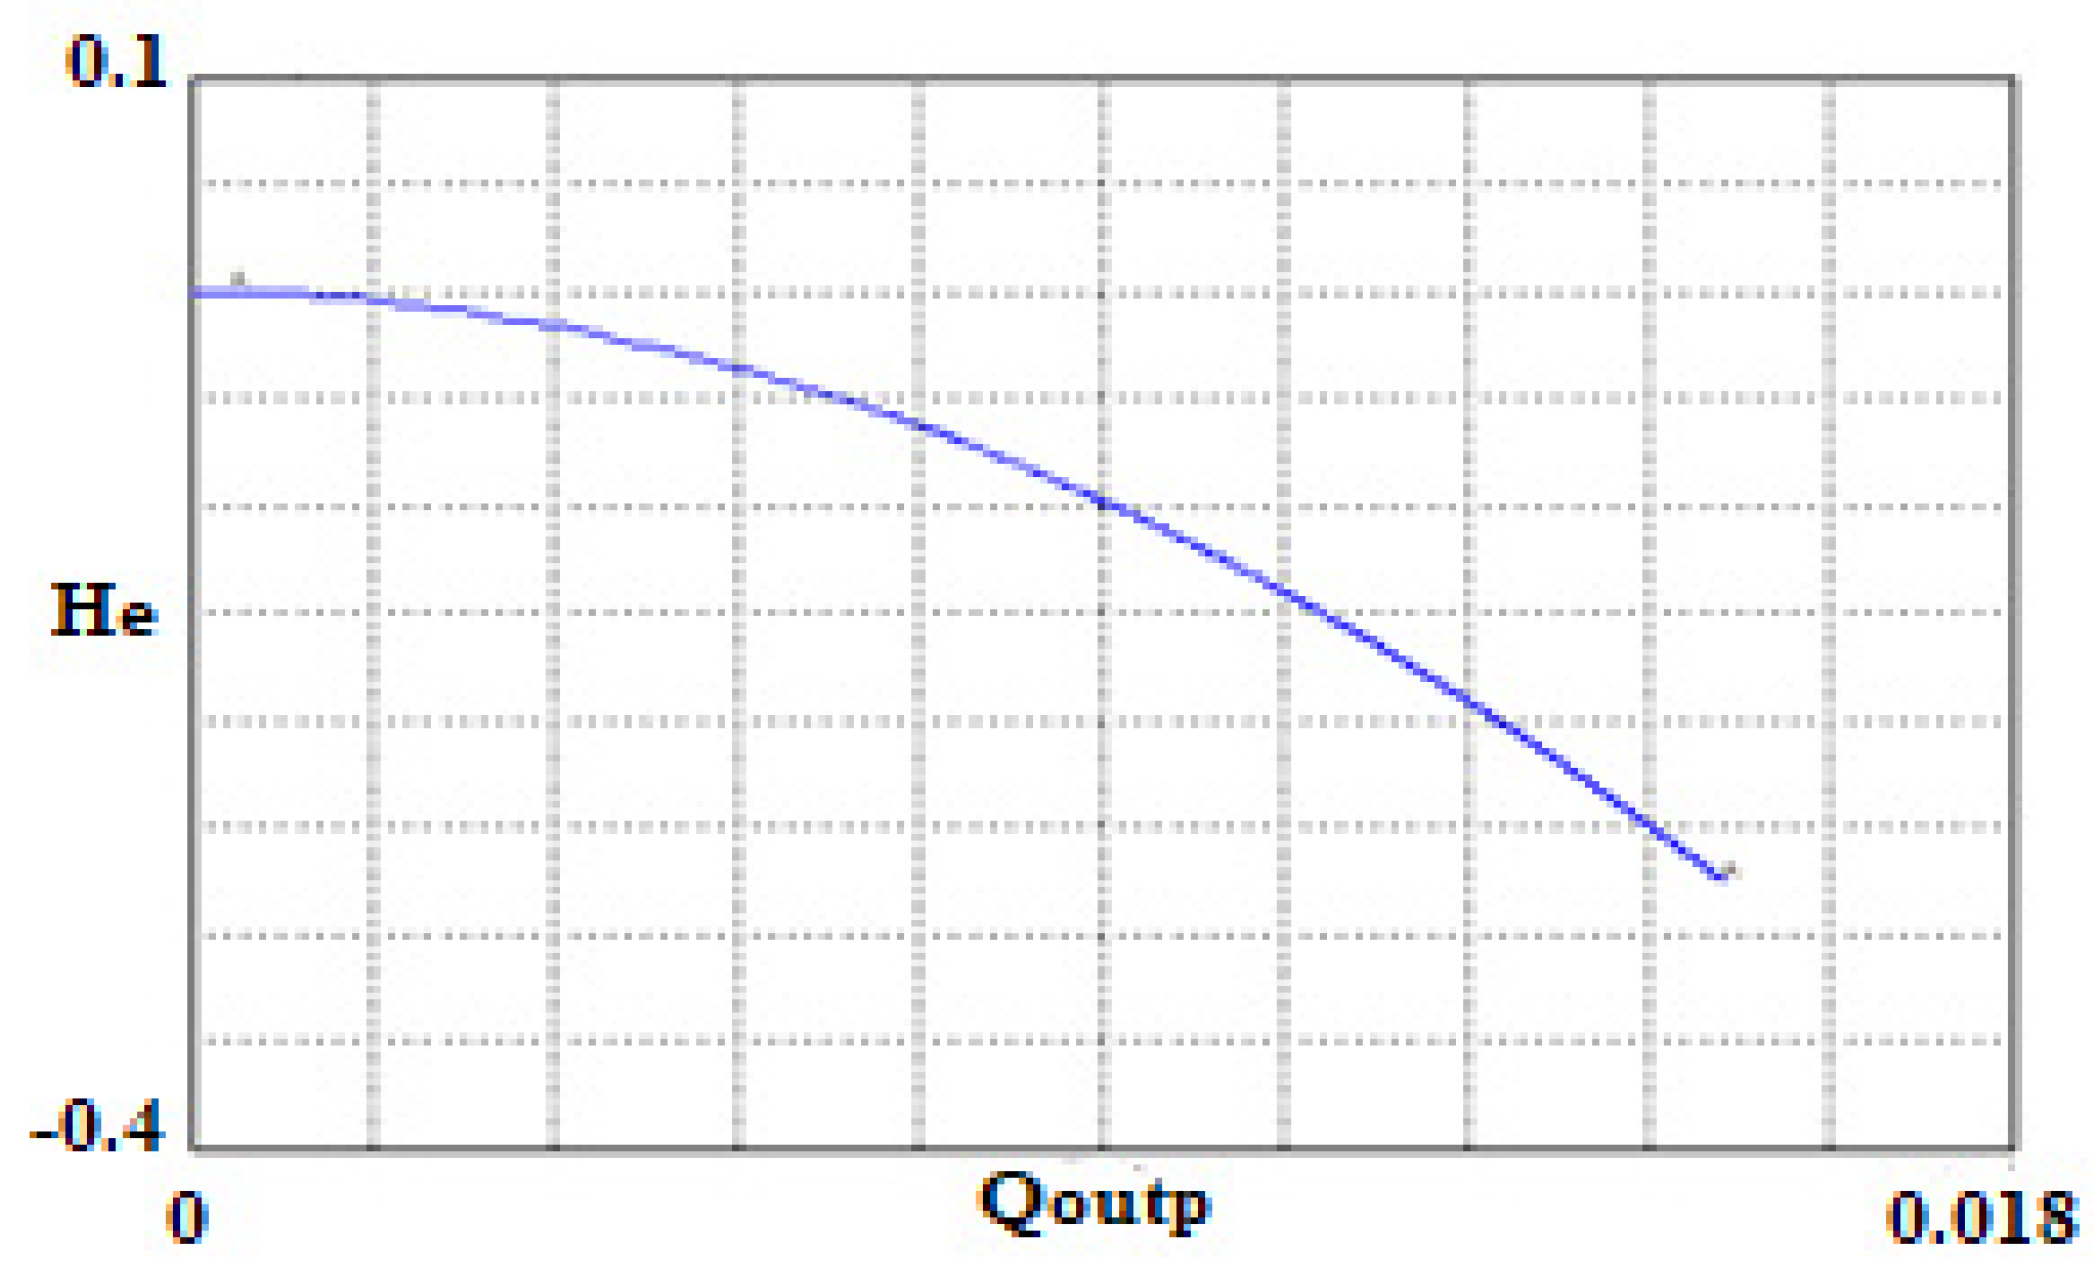
For a stationary regime (constant speed) the theoretical characteristic He = f(Q) of a pure centrifugal vacuum pump (isolated from the hydraulic network) is of the following form:
Figure 22.
Simulation of the He (Q) characteristic from the developed bond-graph model.
Figure 22.
Simulation of the He (Q) characteristic from the developed bond-graph model.
4.3. Global model of a water treatment system by bond graph
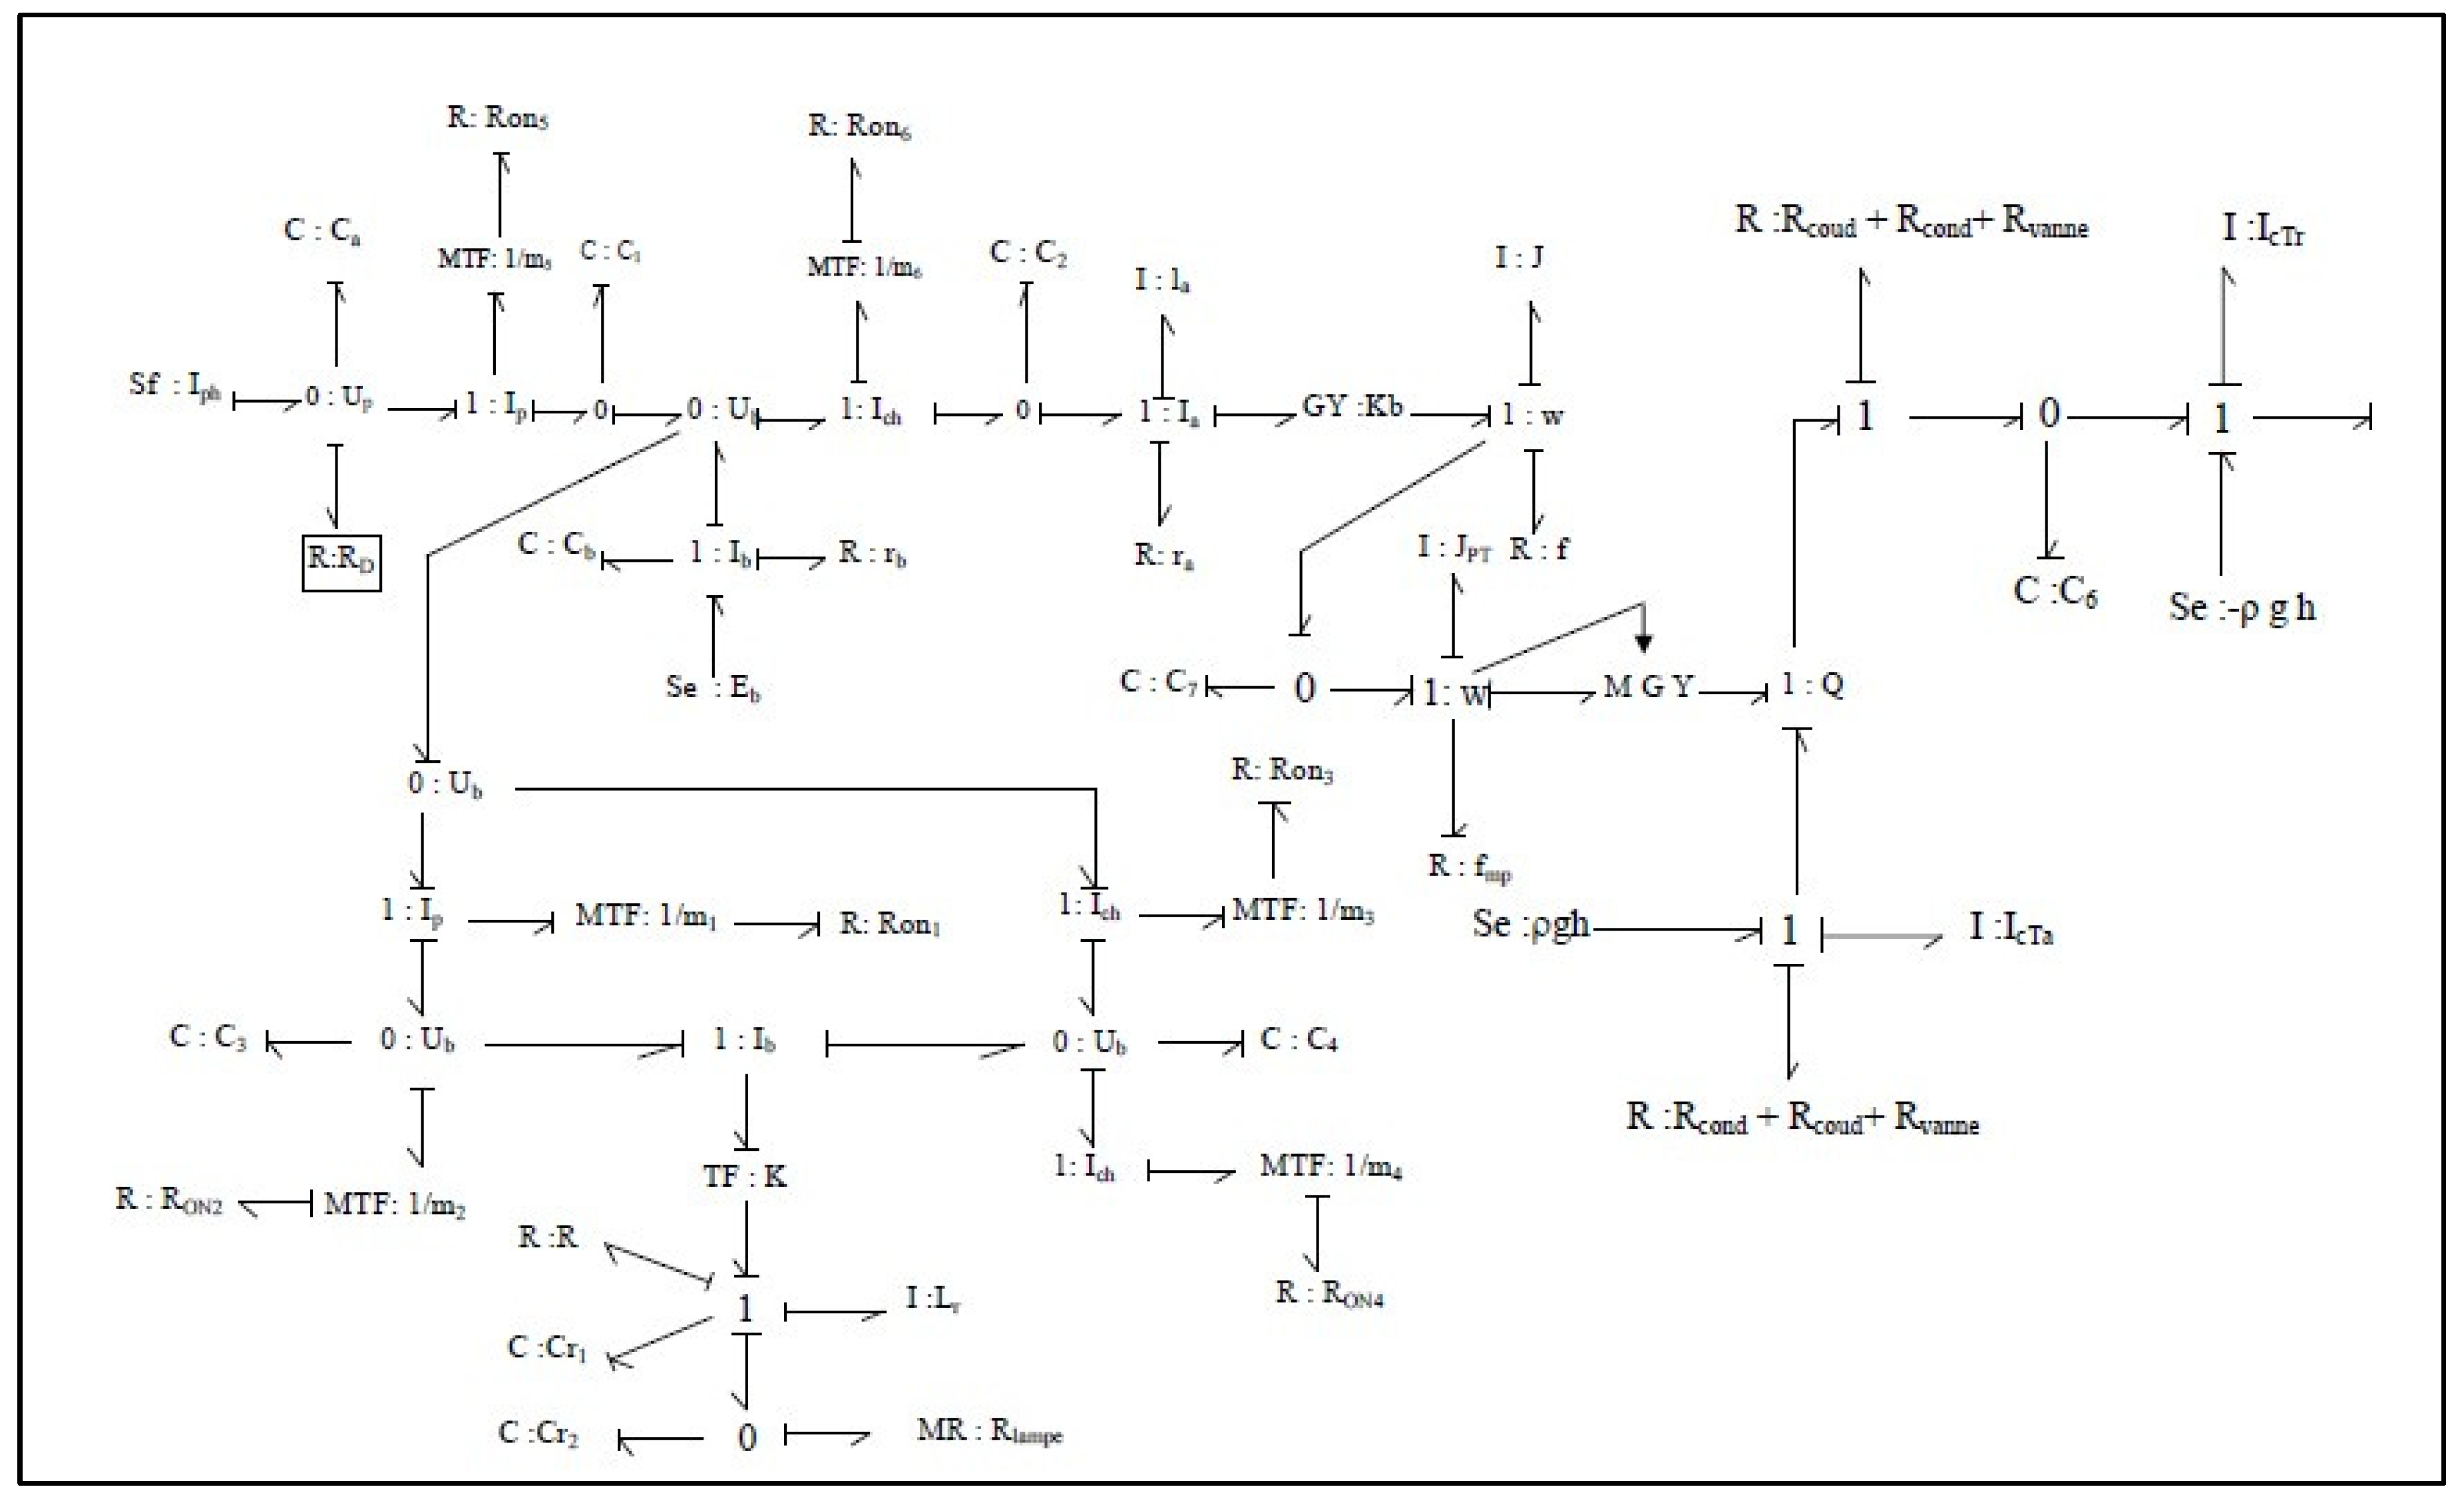
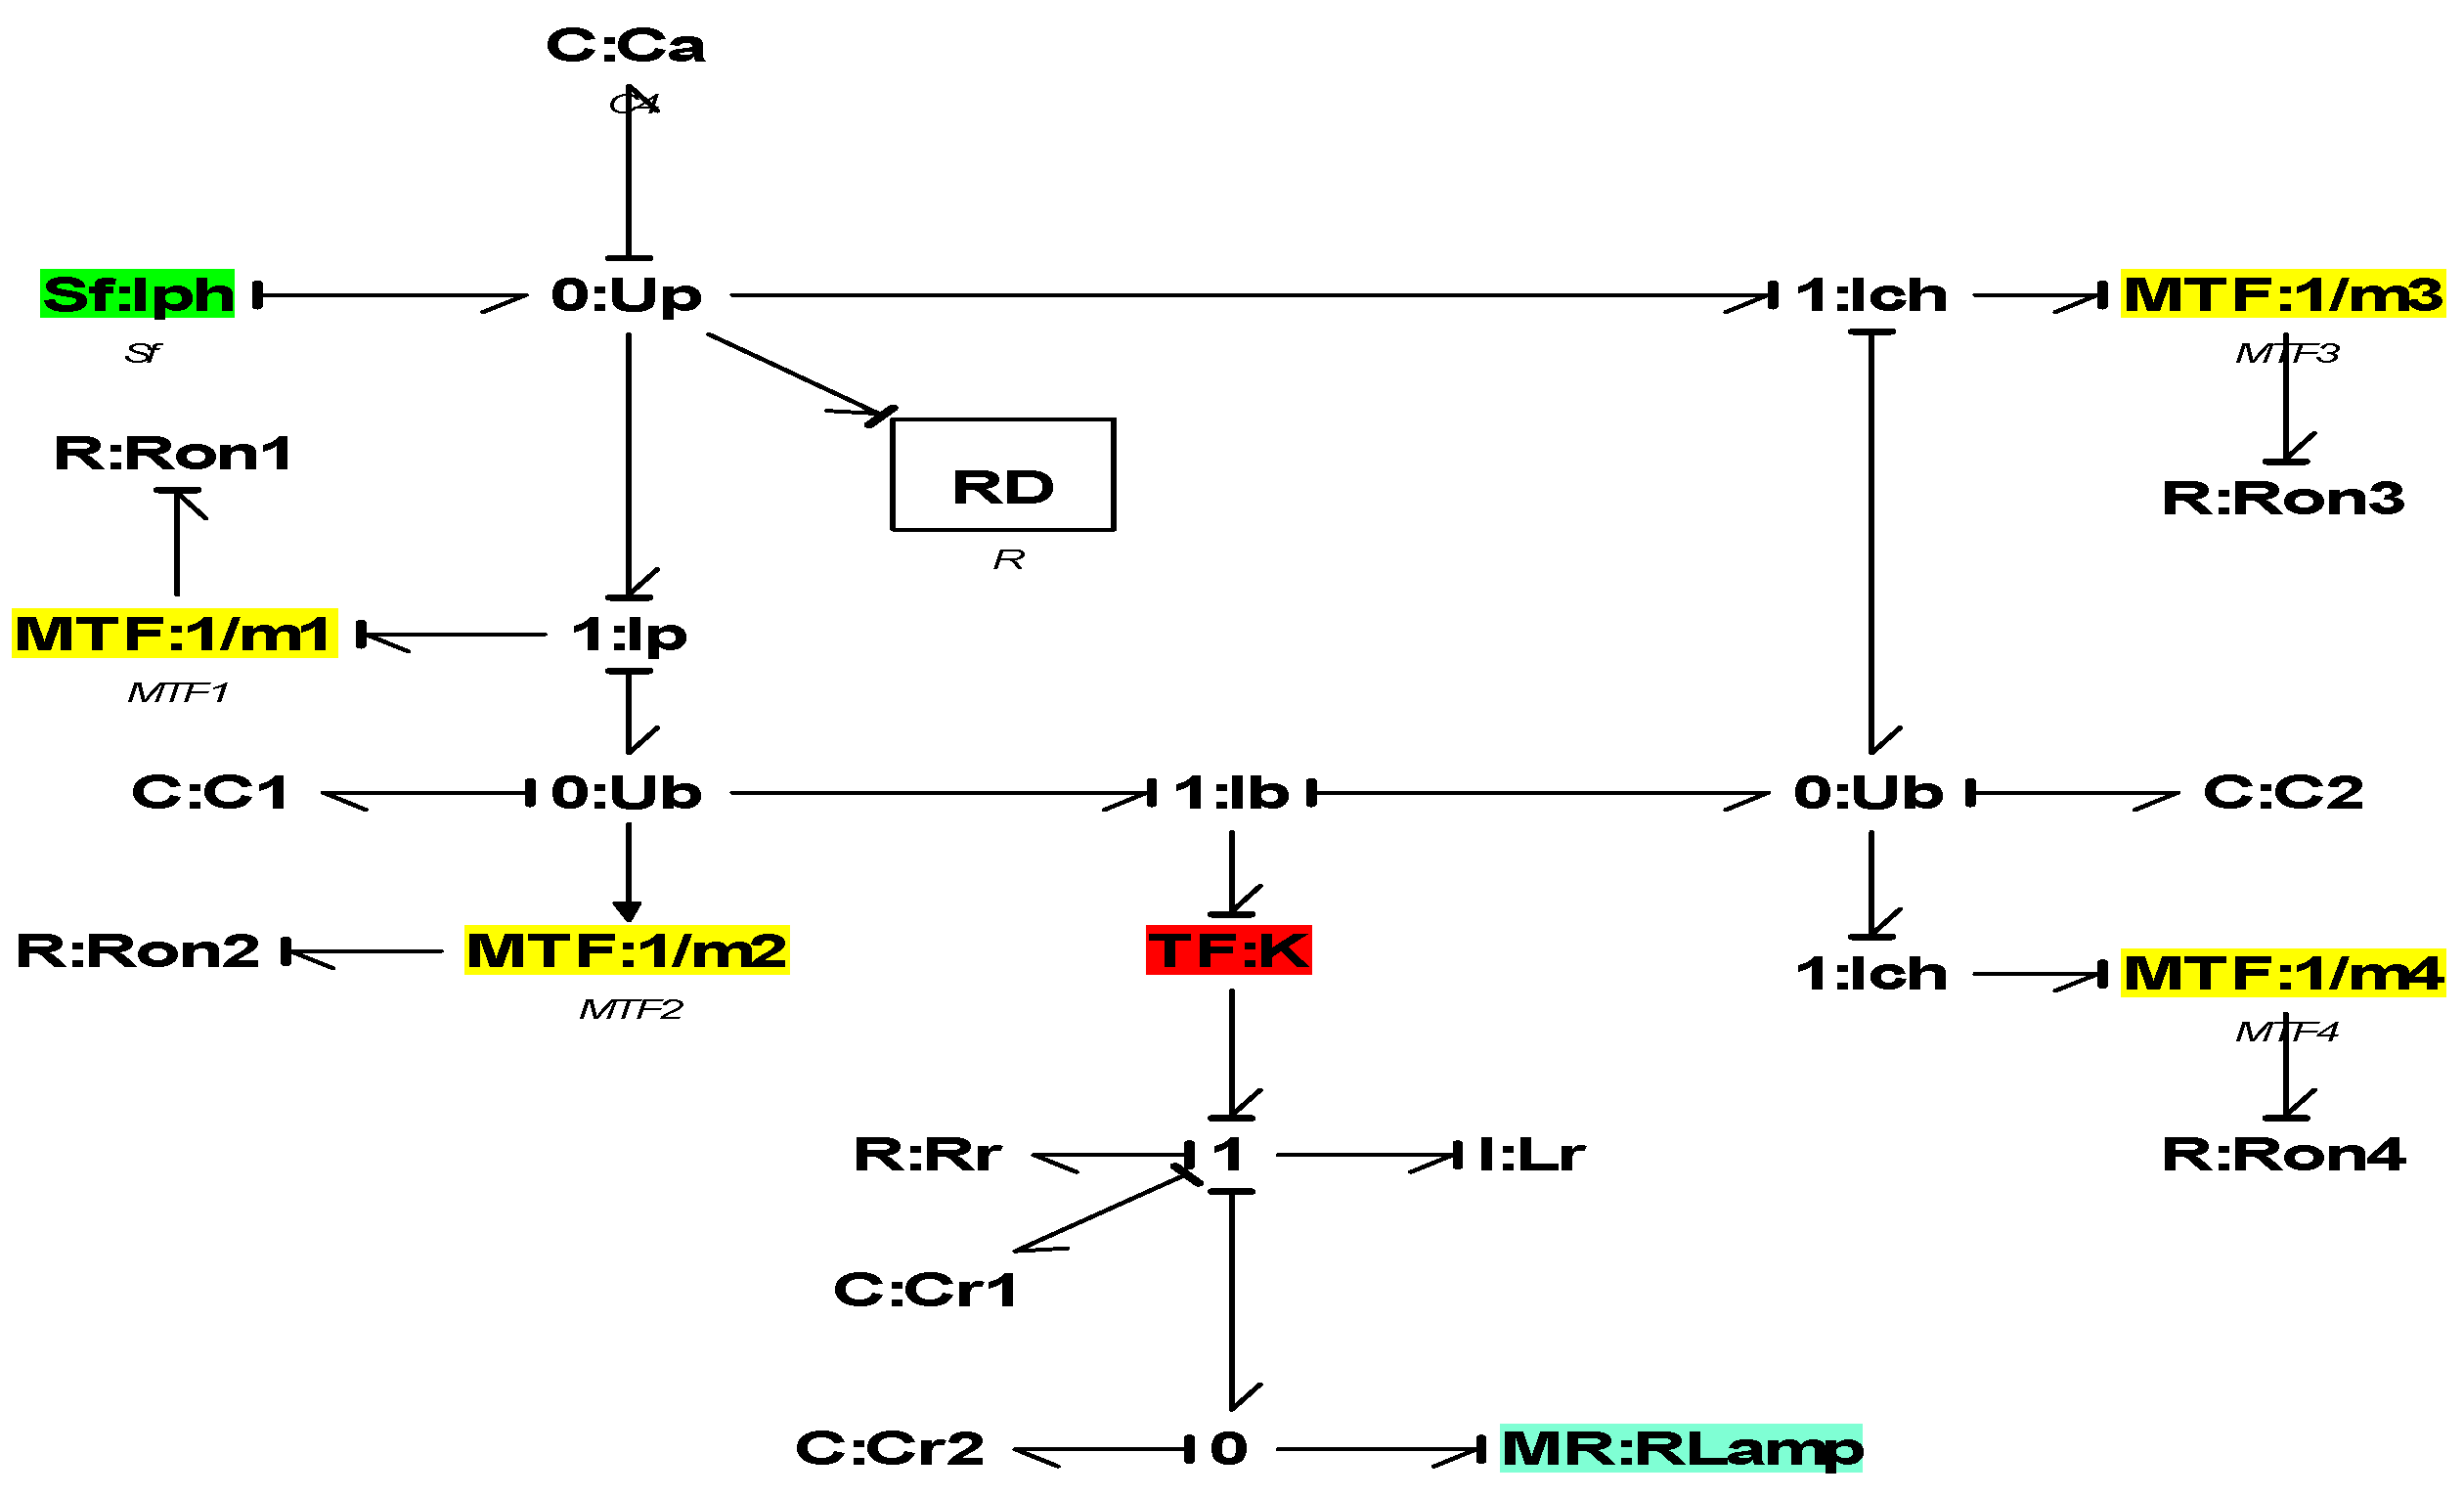
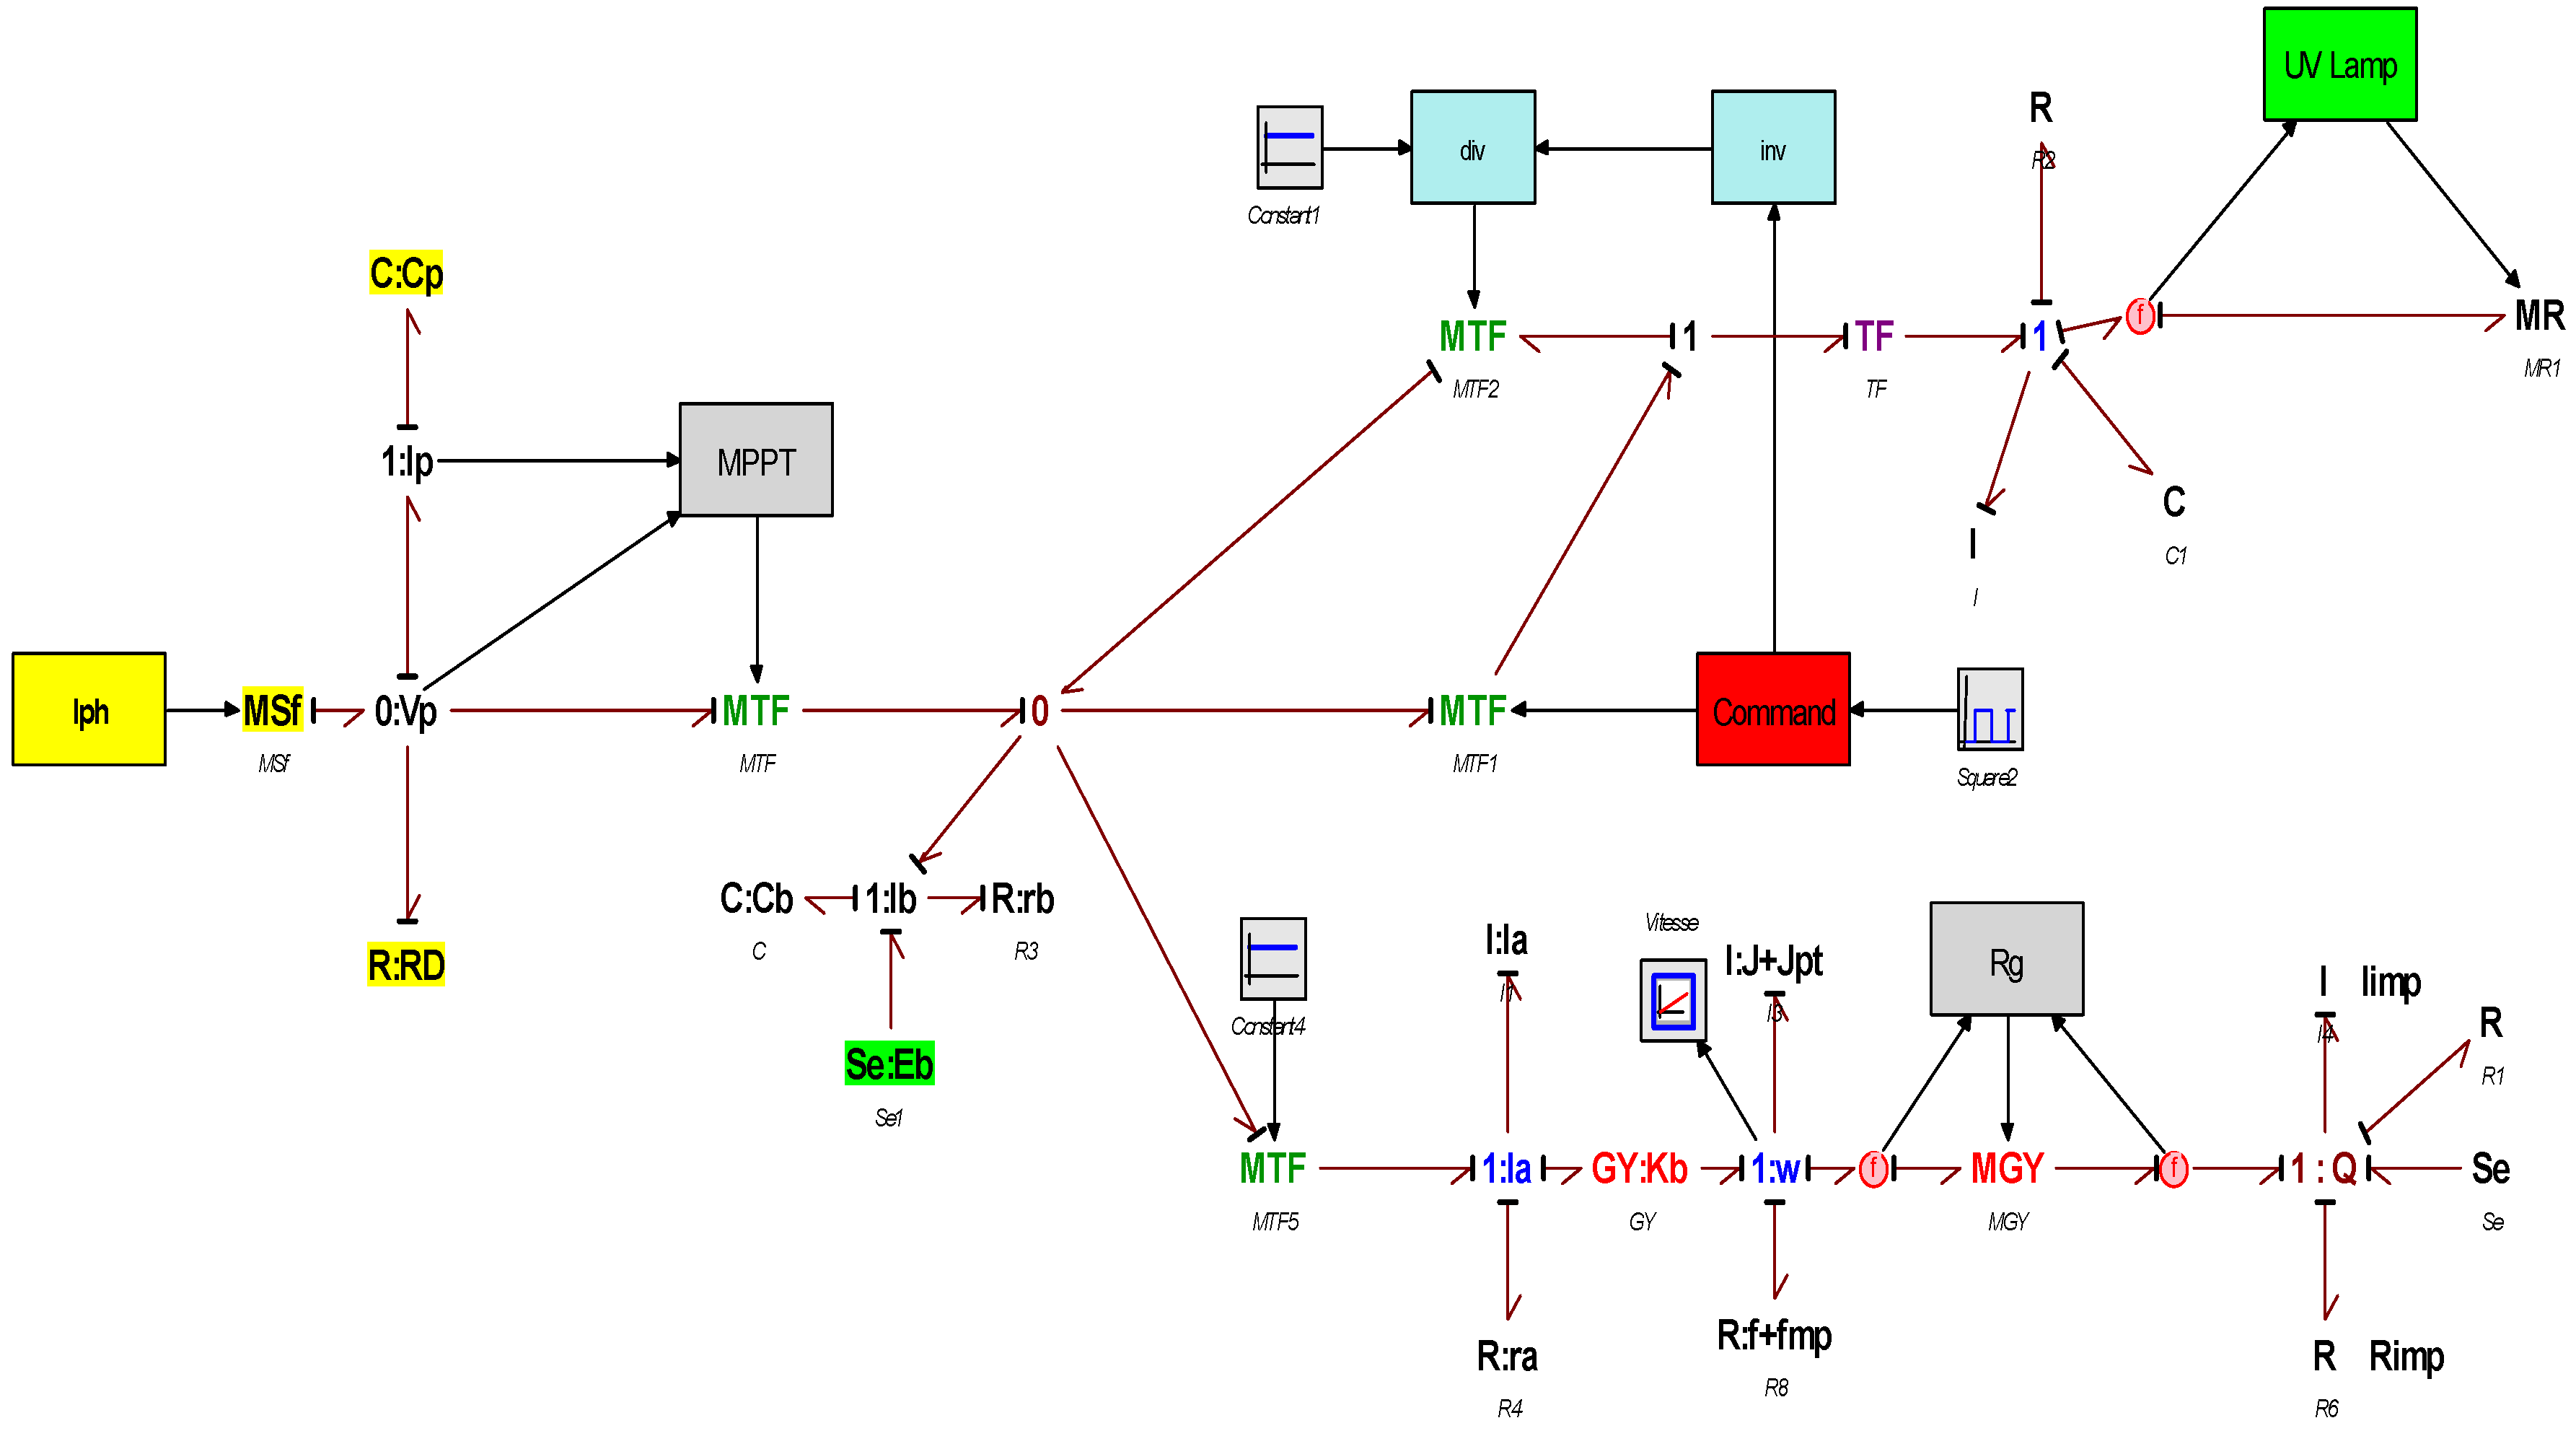
After modeling the different elements of the water treatment system and simulating the obtained models. We can deduce the global model BG following a combination of the different models obtained, which is presented in the following
Figure 23:
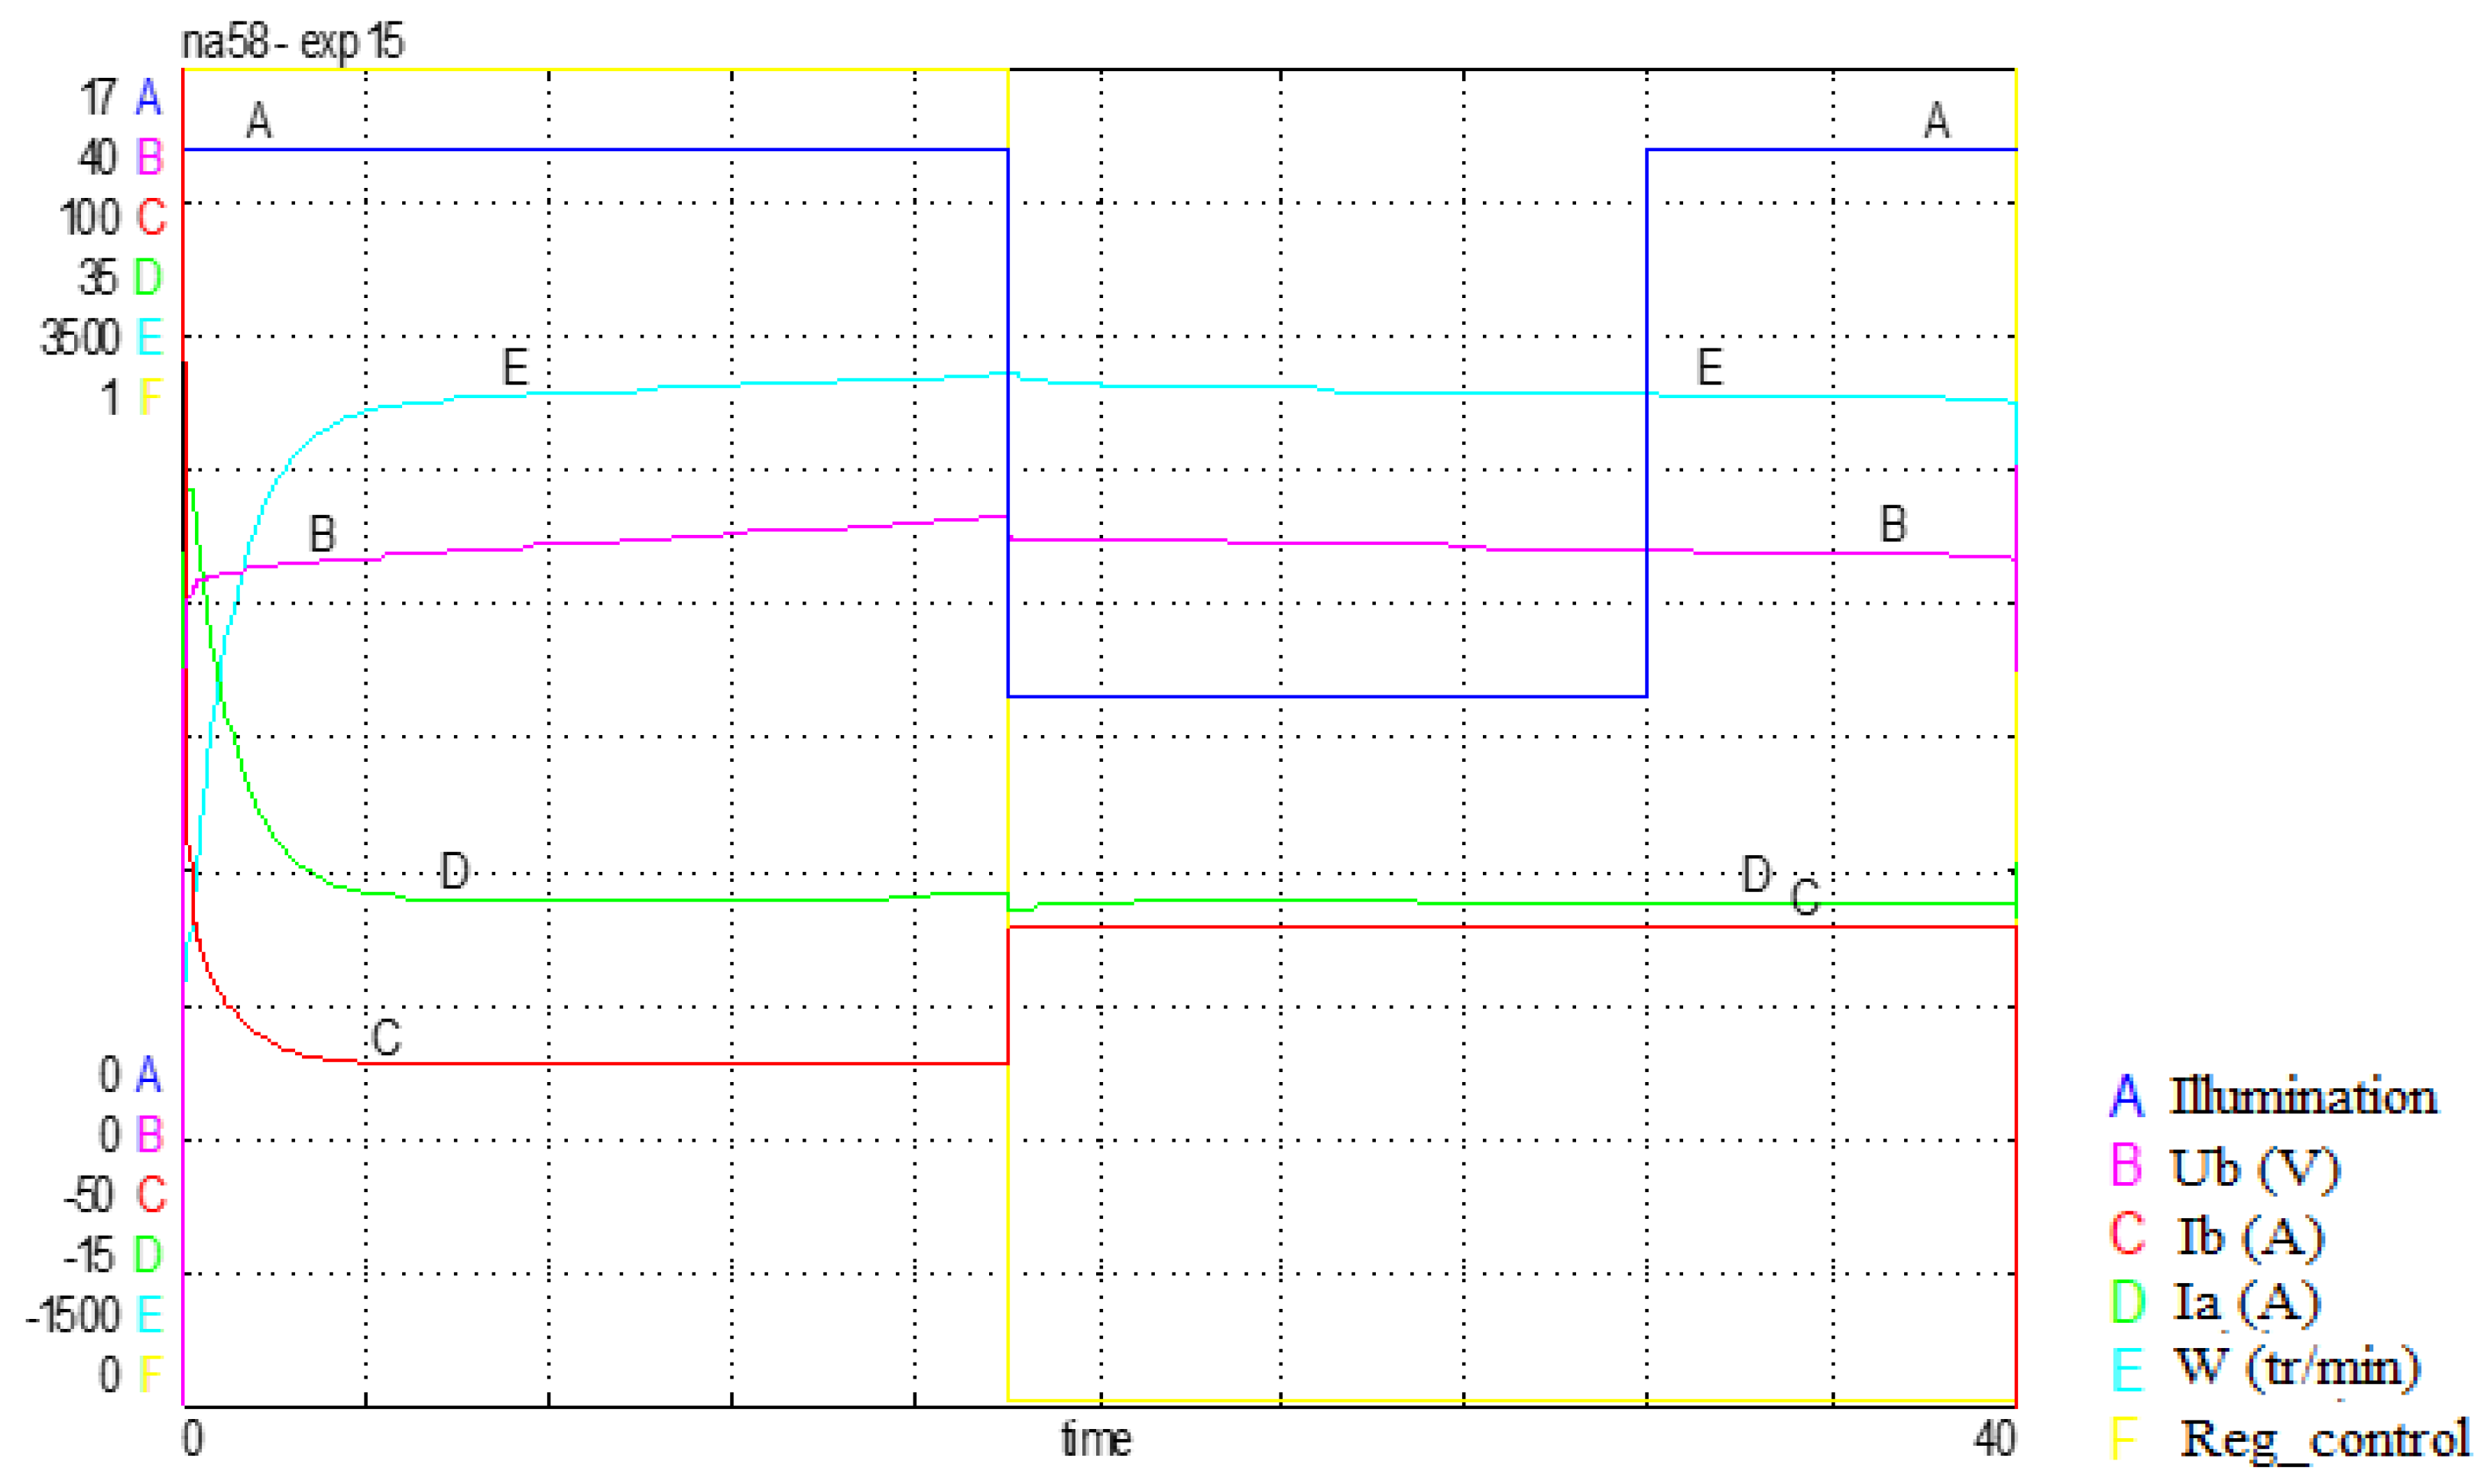
After having elaborated the complete bond-graph model of the pilot unit, an in-depth study can be started. Indeed from this model we can simulate various modes of operation, test the influence of the various parameters on the system in order to reach an optimal (desired) operation. As a first application of this model we simulate the case of a cloudy passage. The current “Iph” is proportional to the illumination, its value then undergoes a variation. The system should not be influenced by this disturbance because of the existence of energy storage batteries. This operation is illustrated in the following
Figure 24:
The simulation shows the influence of a cloud passage, the decrease of the voltage delivered by the PV generator leads to the switching of the charge controller from a charging phase to a discharging phase (i.e. supply of the receiver from the battery).
After the switching of the regulator, the sign of the battery current changes, but the armature current and the speed of the motor are hardly affected. After the passage of the cloud, the receiver remains powered by the battery (the controller does not switch again) until the battery is discharged.
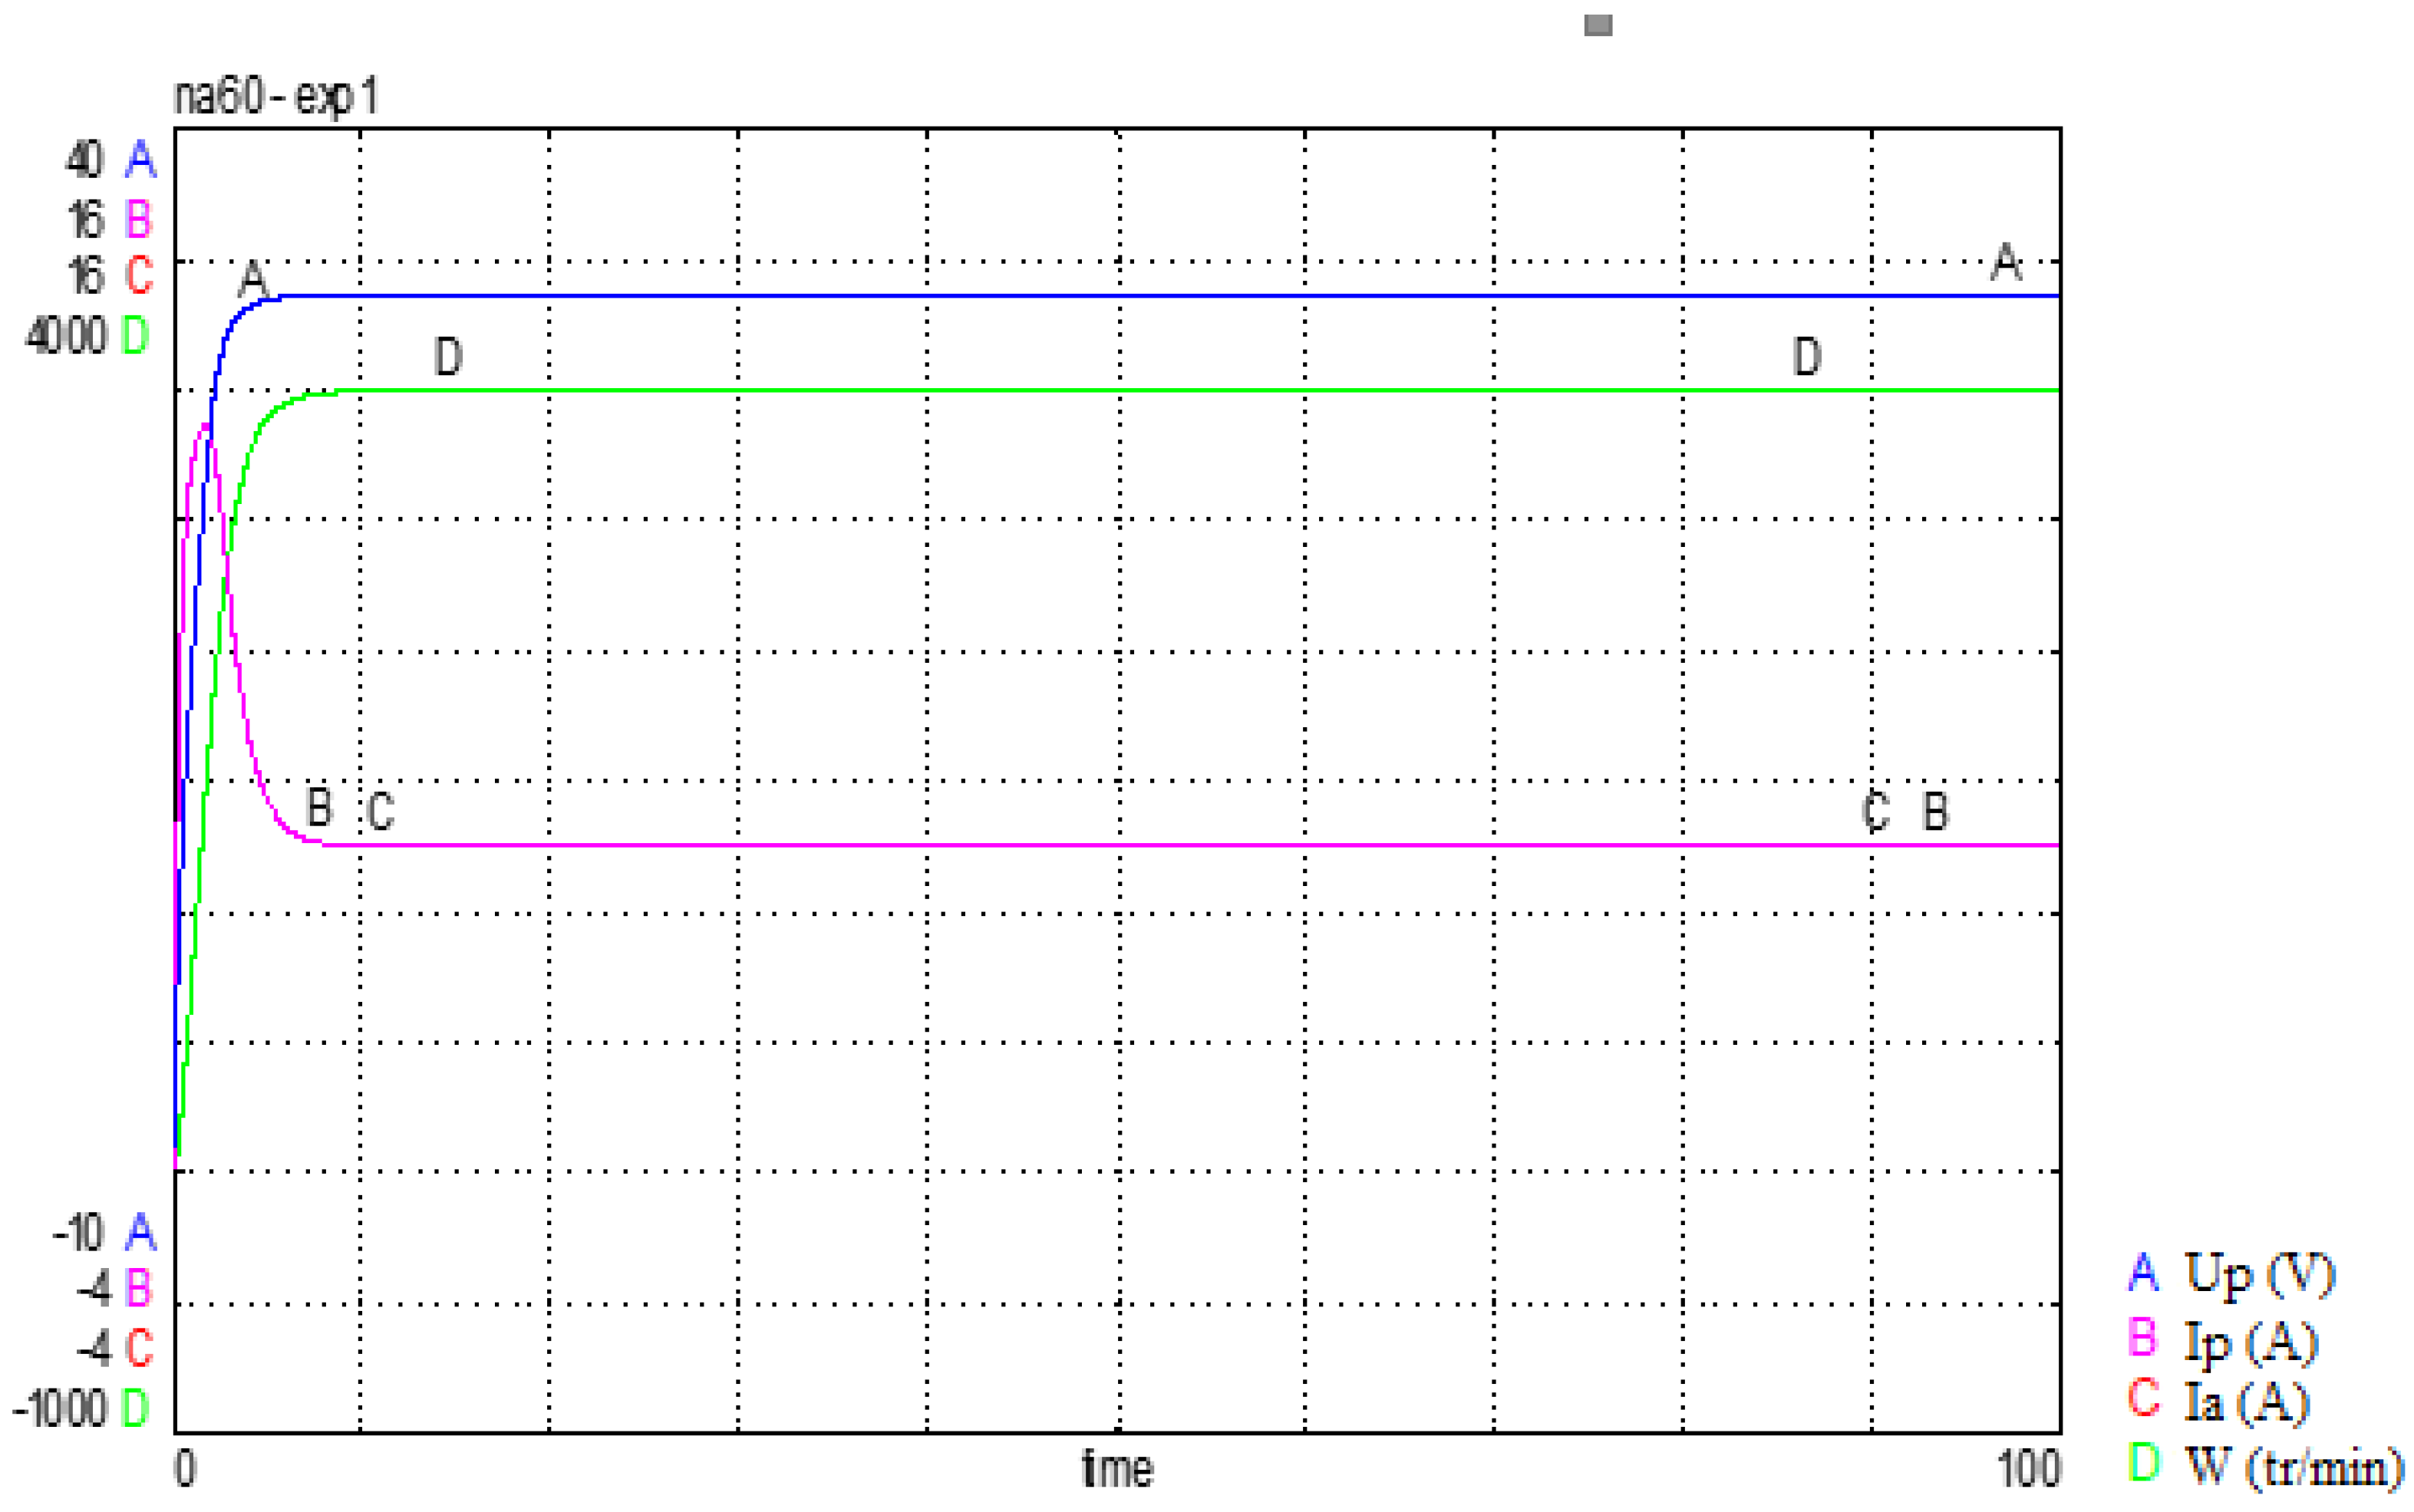
A second application of the model consists in predicting the behavior of the system in the absence of the batteries. The simulation translating the described operation is presented by the following
Figure 25:
From the simulation, it can be seen that the voltage delivered by the PV generator does not correspond to the optimal voltage.
The system no longer operates at the optimal operating point and therefore does not use the maximum energy delivered by the PV generator.
5. Structural analysis
5.1. Definition of a causal path
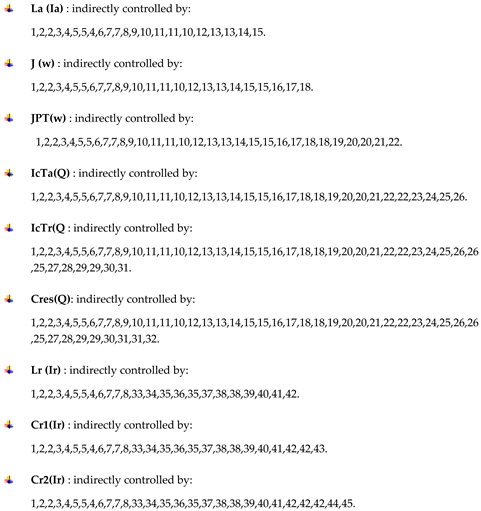
A causal path in a bond-graph structure is an alternation of links and building blocks, called "nodes" such that:
- ₋
For the acausal bond-graph, the sequence forms a simple chain.
- ₋
All nodes in the sequence have complete and correct causality.
- ₋
Two links in the causal path have opposite orientations at the same node.
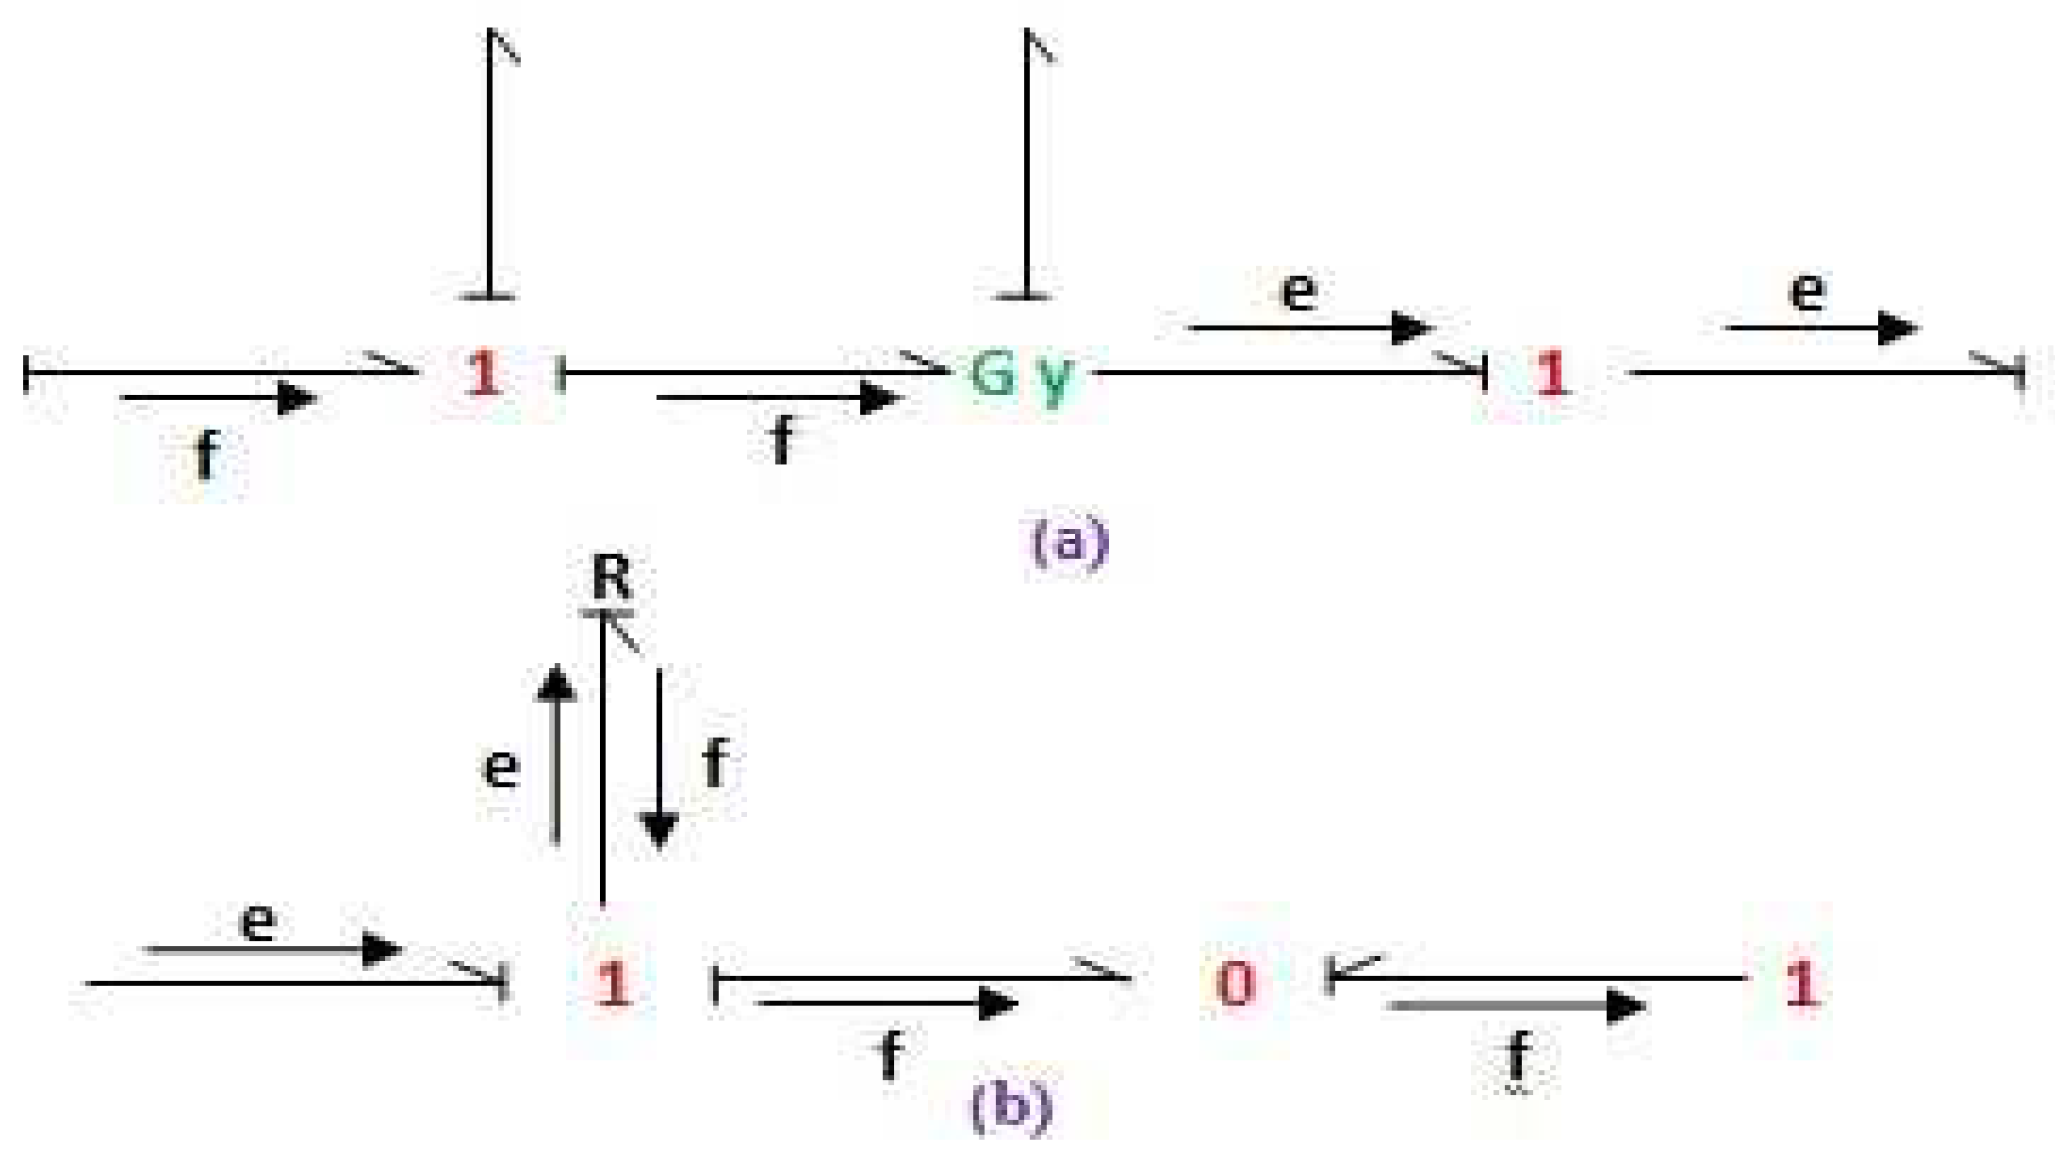
A causal path is mixed, if it is necessary to change the variable during the path. This is the case in the presence of a gyrator (
Figure 26a) where the path is called direct mixed, or when it is necessary to cross an element R, C or I, (
Figure 26b) which corresponds to an indirect mixed path.
The characteristic function of a causal path is defined as the function linking the output variable of the element corresponding to the origin of the path, to the input variable of the element forming the end of the path.
The characteristic function of an indirect mixed causal path is given by:
where ‘n
0’ and ‘n
1’ represent the total number of link orientation changes respectively at junctions “0” when following the flow variable, and at junctions “1” when following the effort variable.
5.2. Rank of the state matrix associated with the bond graph.
The rank of the state matrix associated with a bond graph initially in integral causality (or the zero pole number of the transfer function) is equal to the number of elements I and C (initially in integral) admitting a derivative causality when we put the bond graph in derivative causality.
5.3. Commandability - structural observability
A system modeled by bond-graph is strictly controllable (respectively observable) if and only if the following conditions are realized.
- o
There is a causal path linking a source (respectively a sensor) to each element I and C in integral causality when we put the bond graph in integral causality.
- o
All the elements I and C admit a derived causality when we put the B.G. in derived causality. If not dualize the sources (respectively the sensors) to put the remaining I and C in integral, in derived causality.
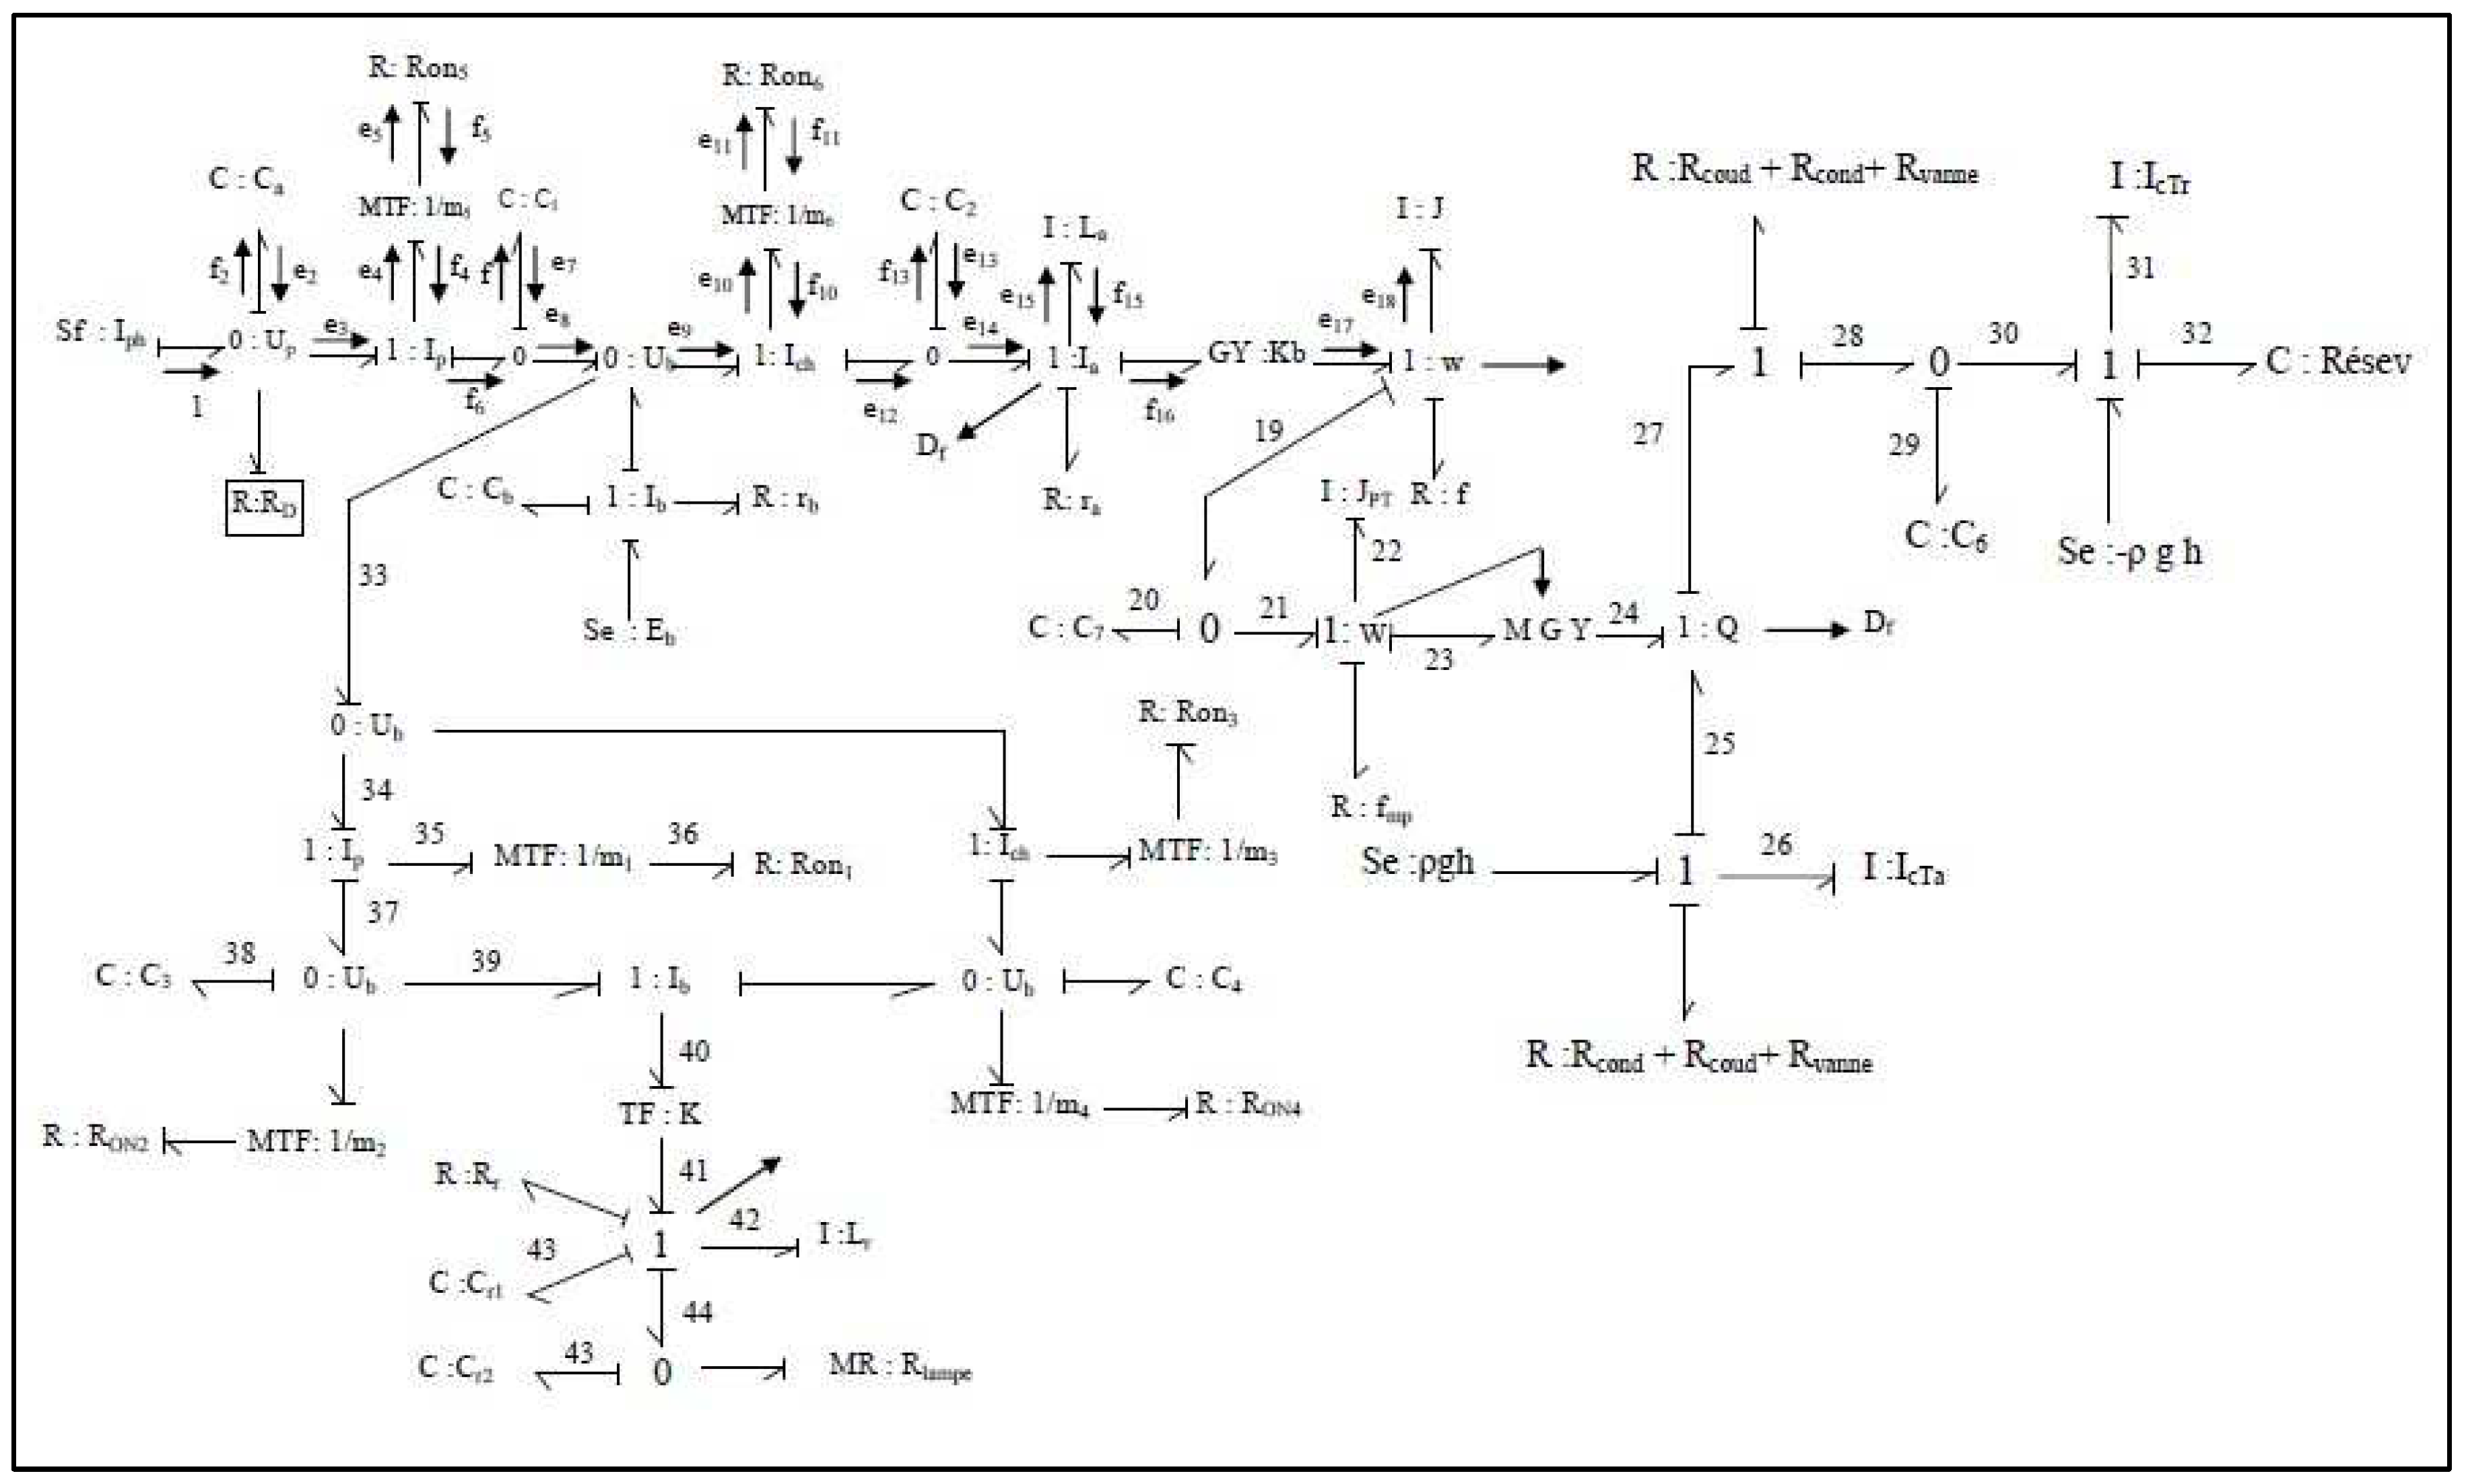
According to the global bond graph, the system is composed of 11 elements “C” and 5 elements “I” in integral causality admitting derivative causality when we put the bond-graph in derivative causality. The system is of order 16 where no conflict is encountered when we put “I” and “C” in causality integral.
Figure 27.
Global derived causal graph model of the pilot water treatment unit.
Figure 27.
Global derived causal graph model of the pilot water treatment unit.
Figure 28.
Global bond-graph model of the pilot water treatment unit and causal chains.
Figure 28.
Global bond-graph model of the pilot water treatment unit and causal chains.
6. Application of status feedback and sliding mode control of the DC motor pump speed
The control is of great industrial interest, especially in the field of electronics. The control of DC motors does not admit of a universal solution. Indeed, there are a number of modern methods that have shown their ability to handle a wide variety of applications of practical interest.
6.1. Control of a motor with contained current by the robust controller in sliding mode
The sliding mode control is divided into two parts [25,26,27]:
- ₋
Determining a region of state space such that once the system is in that region, it has the desired behavior.
- ₋
Finding a control law that drives the system into this region of state space.
In order to design a sliding mode control, it is necessary to define a sliding surface S (in the error space x), which guarantees the global stability of the system.
The switching function is a linear vector function of the state of the form:
x(t) ε ℝn ; It is a matrix of appropriate dimension.
6.1.1. Configuration and bond-graph model
The motor pump for water circulation in the UV reactor is of the continuous type. This pump is supplied from the storage battery (Ub). The corresponding bond-graph model is shown in the following
Figure 29:
6.1.2. Putting into equation
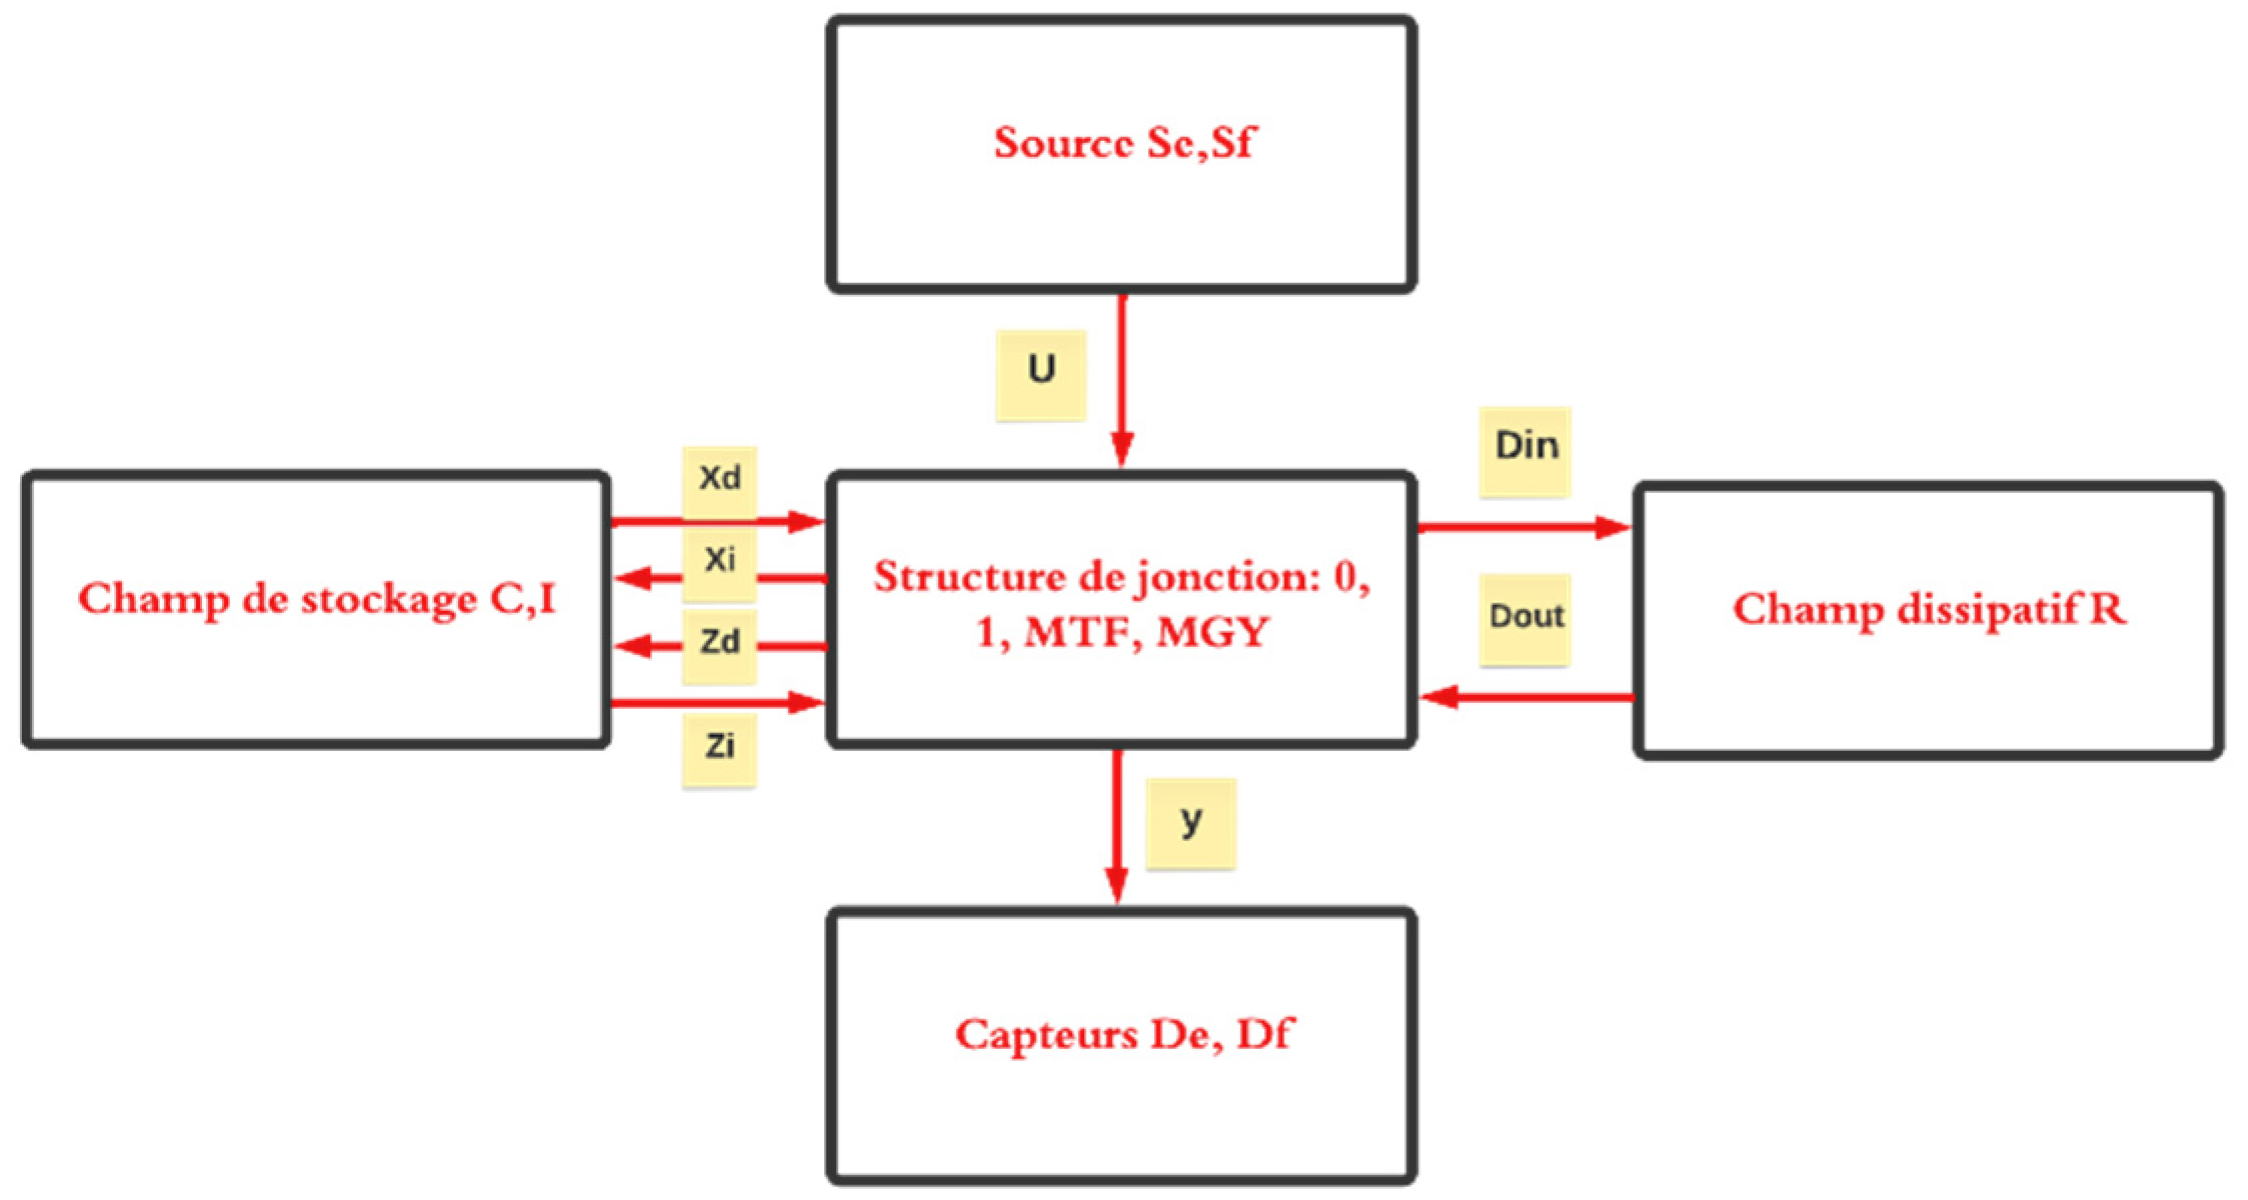
The bond graph model can be considered as a junction structure connected to four field’s sources, Sensors, dissipative field and storage field.
The vectors associated with this representation are:
X: the state vector composed of the variables p (magnetic flux) on the elements I and q (load on the C elements) split into xi and xd , the vectors associated with the components in integral and derivative causality.
: the derivative with respect to time of the state vector.
Z: the complementary of x splits into Zi and Zd .
u: input vector (sources)
y: output vector (sensors)
Din: input of the dissipative field "R".
Dout: output of the dissipative field "R".
Figure 30.
Decomposition of the bond-graph model into junction structure and four fields.
Figure 30.
Decomposition of the bond-graph model into junction structure and four fields.
This representation allows building the structure matrix; we are interested in the control of the subsystem constituted by the DC motor pump and the batteries. The vectors
X,
,
Z,
Din and
Dout are given respectively by:
Knowing that:
From the properties of the bond graph models we can write:
The causality being integral the structural relationship is then:
From the state equation deduced from the bond graph model we can deduce the often-used differential equation where the state vector is:
The equation of state found from the bond graph model can be obtained by performing the Laplace transform of the characteristic equations of the current motor.
6.1.3. Determination of the control law
Let's recall the sliding mode control law to be implemented:
With is moothing parameter.
The state variables of the system can be defined as the error:
- ₋
The speed:
- ₋
The current:
The equation of state of the system is of the form:
In sliding mode, after the performed transformation, the dynamics of the system became:
The determination of F is obtained by placing the eigenvalues of (A11 - A12F) in the left complex half-plane.
The order of the system is reduced, corresponding to a stable pole: P = -1, with state feedback: F = 0.247.
The sliding surface
is deducted:
The matrices L, M and N obtained are:
6.2. Control by state feedback
The control by state feedback consists in elaborating a control signal from the state variables, supposed at first to be measurable.
The state model of the system is given by:
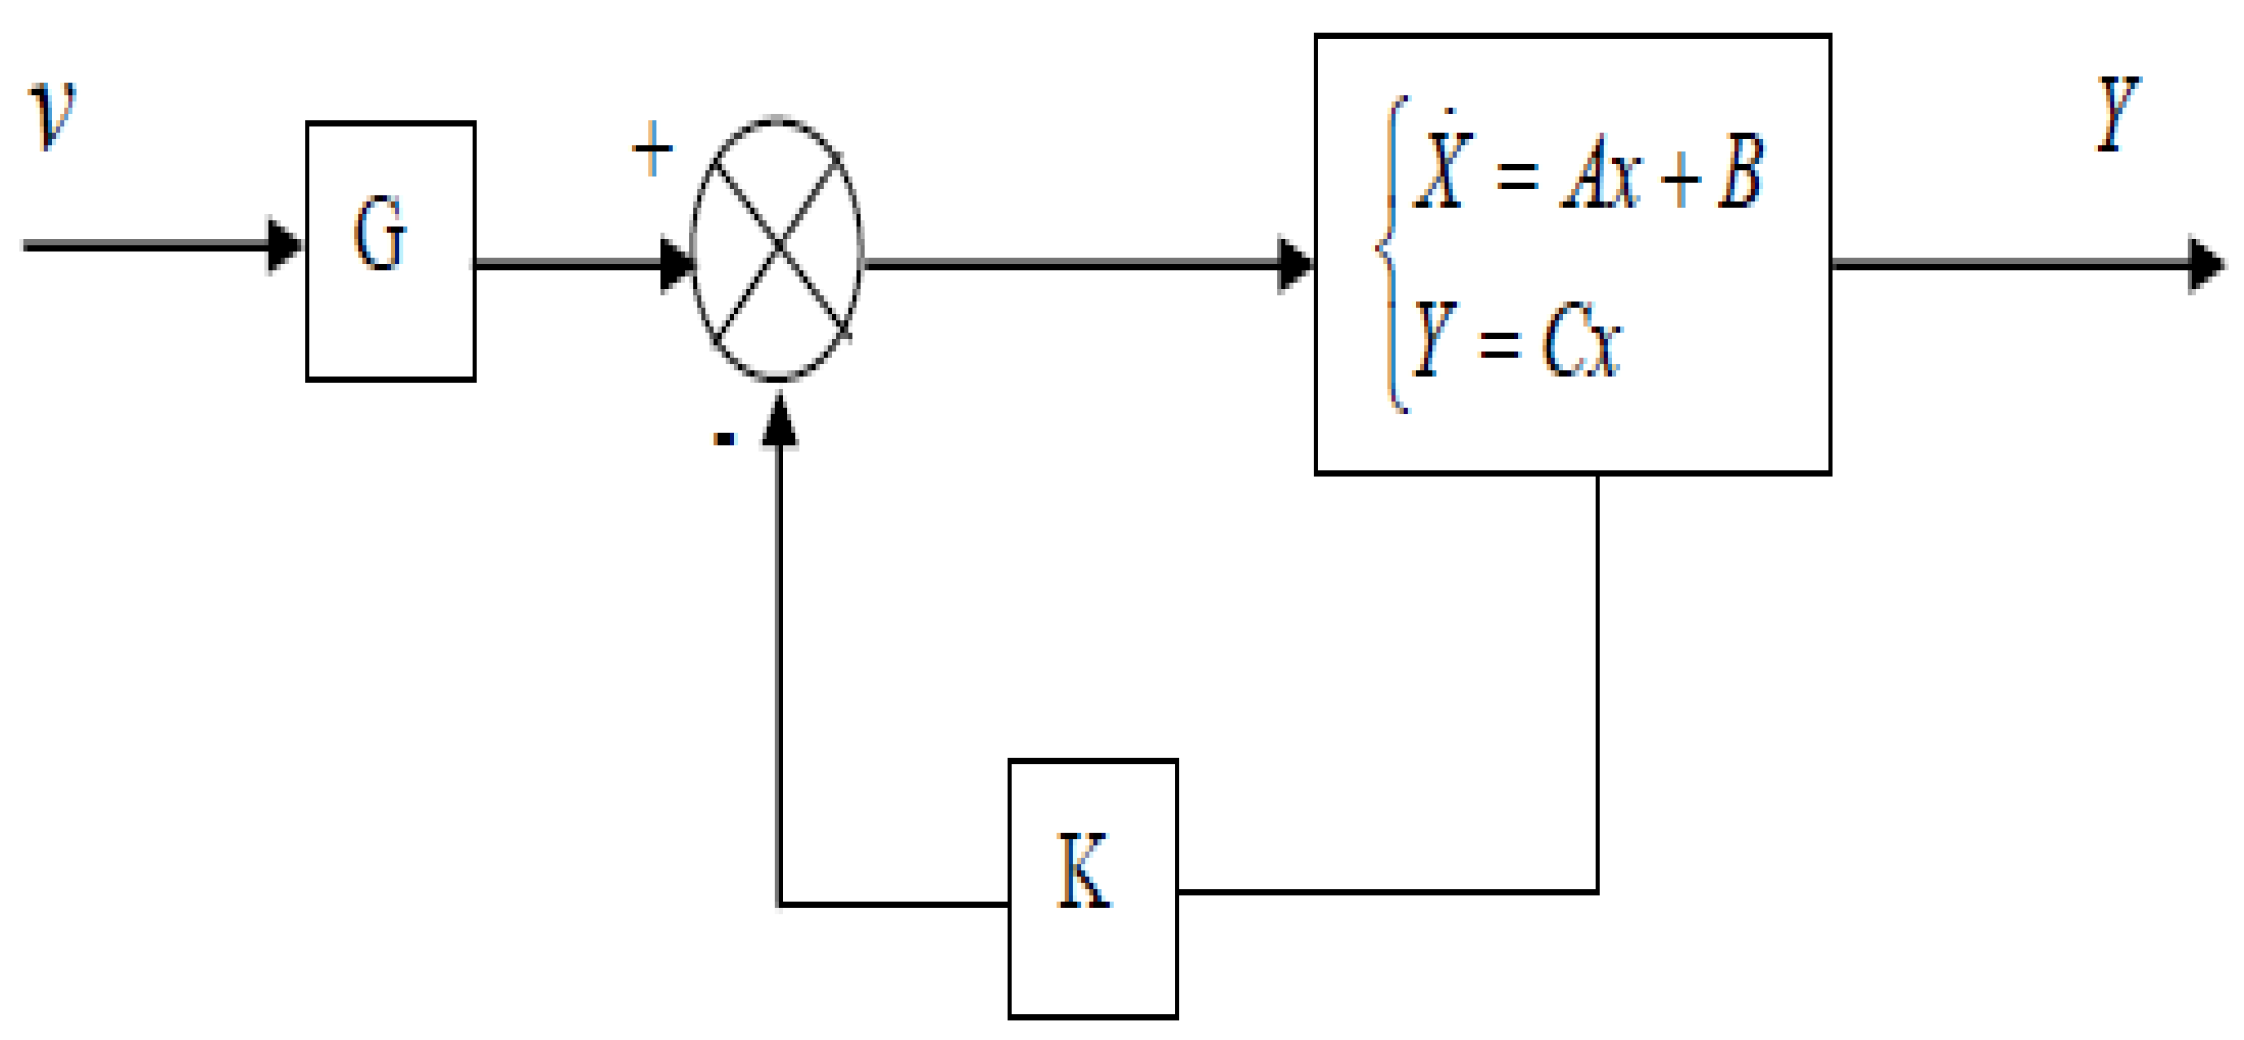
For this type of control, the state vector x is fed back to the control vector u by means of a feedback matrix K and forward by means of a coefficient G. Specifically, the parameter G should be chosen so that the tracking error is small in a certain direction.
The control vector has the following expression:
The closed loop process with the control law is shown in the following
Figure 31:
When we introduce the control expression into the equation of state (equation. 34), we obtain:
We find the new form of the equation of state, with a fundamental matrix: ,
since it is determinant by the poles (eigenvalues) of the system, one can therefore the dynamic behavior by the counter reaction matrix K, by imposing the poles of the closed loop, we see that the determination of the matrix K is not defined in a univocal way, it illustrates a univocally, it illustrates a certain degree of additional freedom.
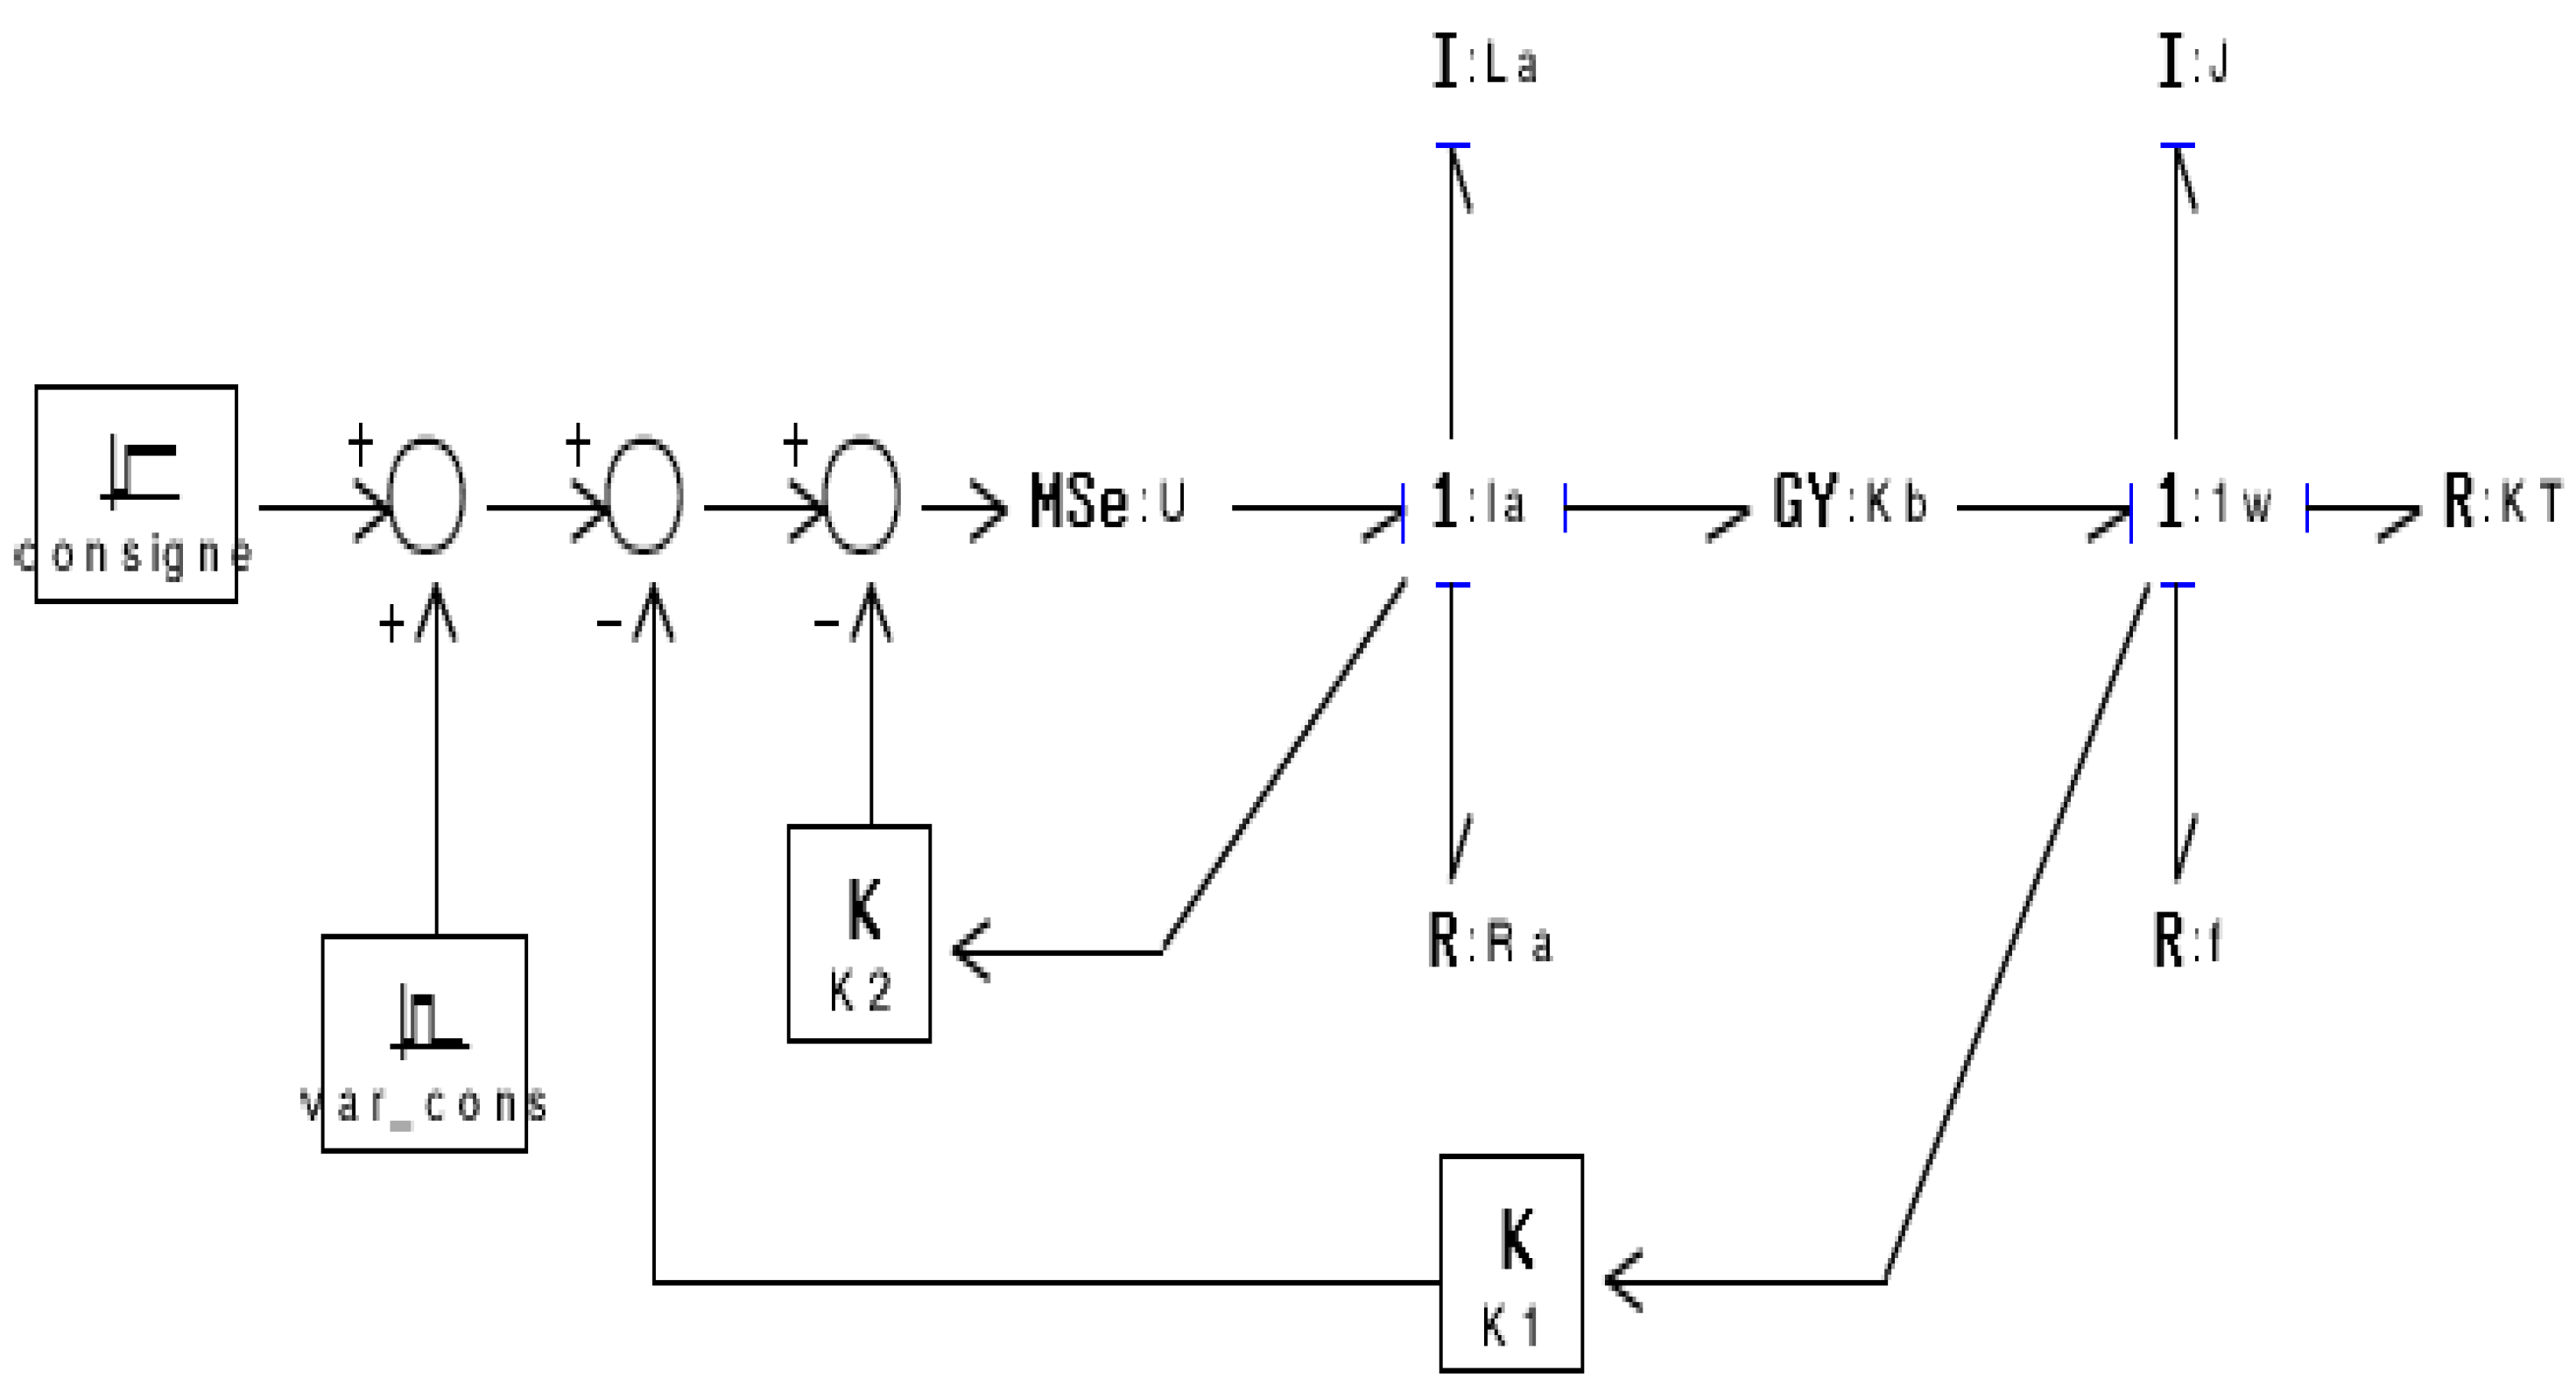
7. Experimental Simulations and Results
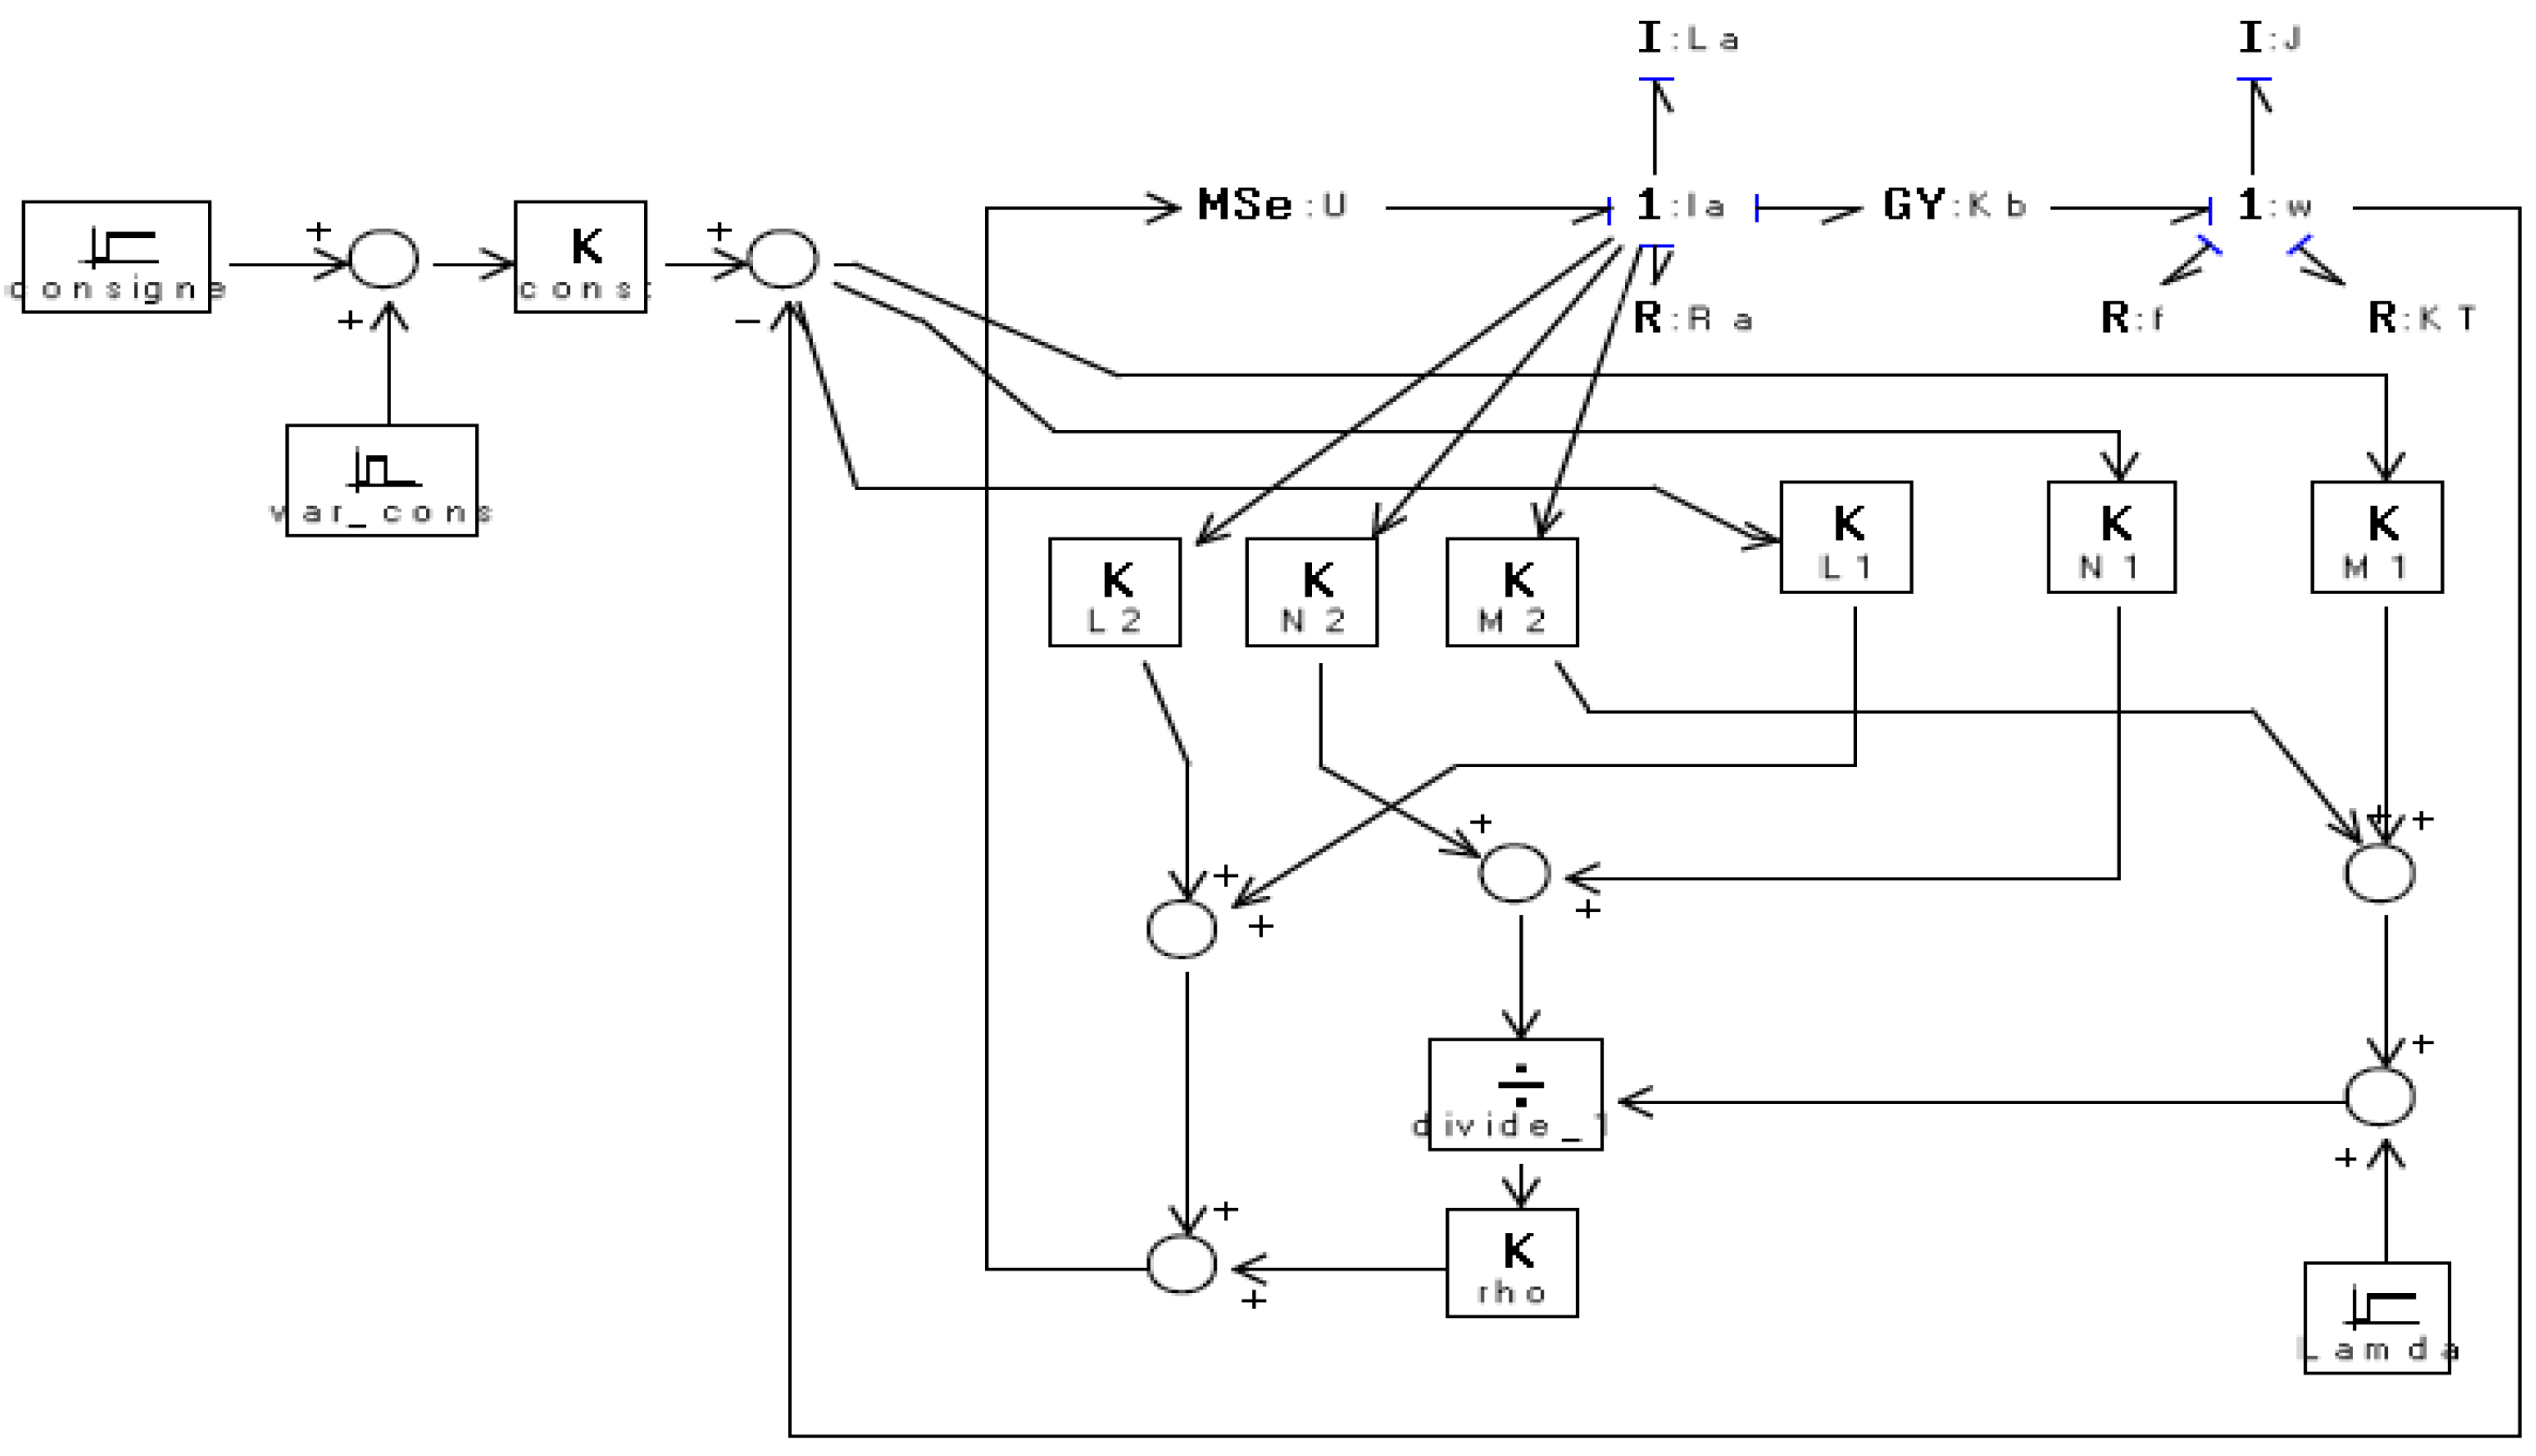
After calculating the parameters of the controller, we will apply this control law to the subsystem by the DC motor powered from the battery. The simulation diagram is presented in the following
Figure 32:
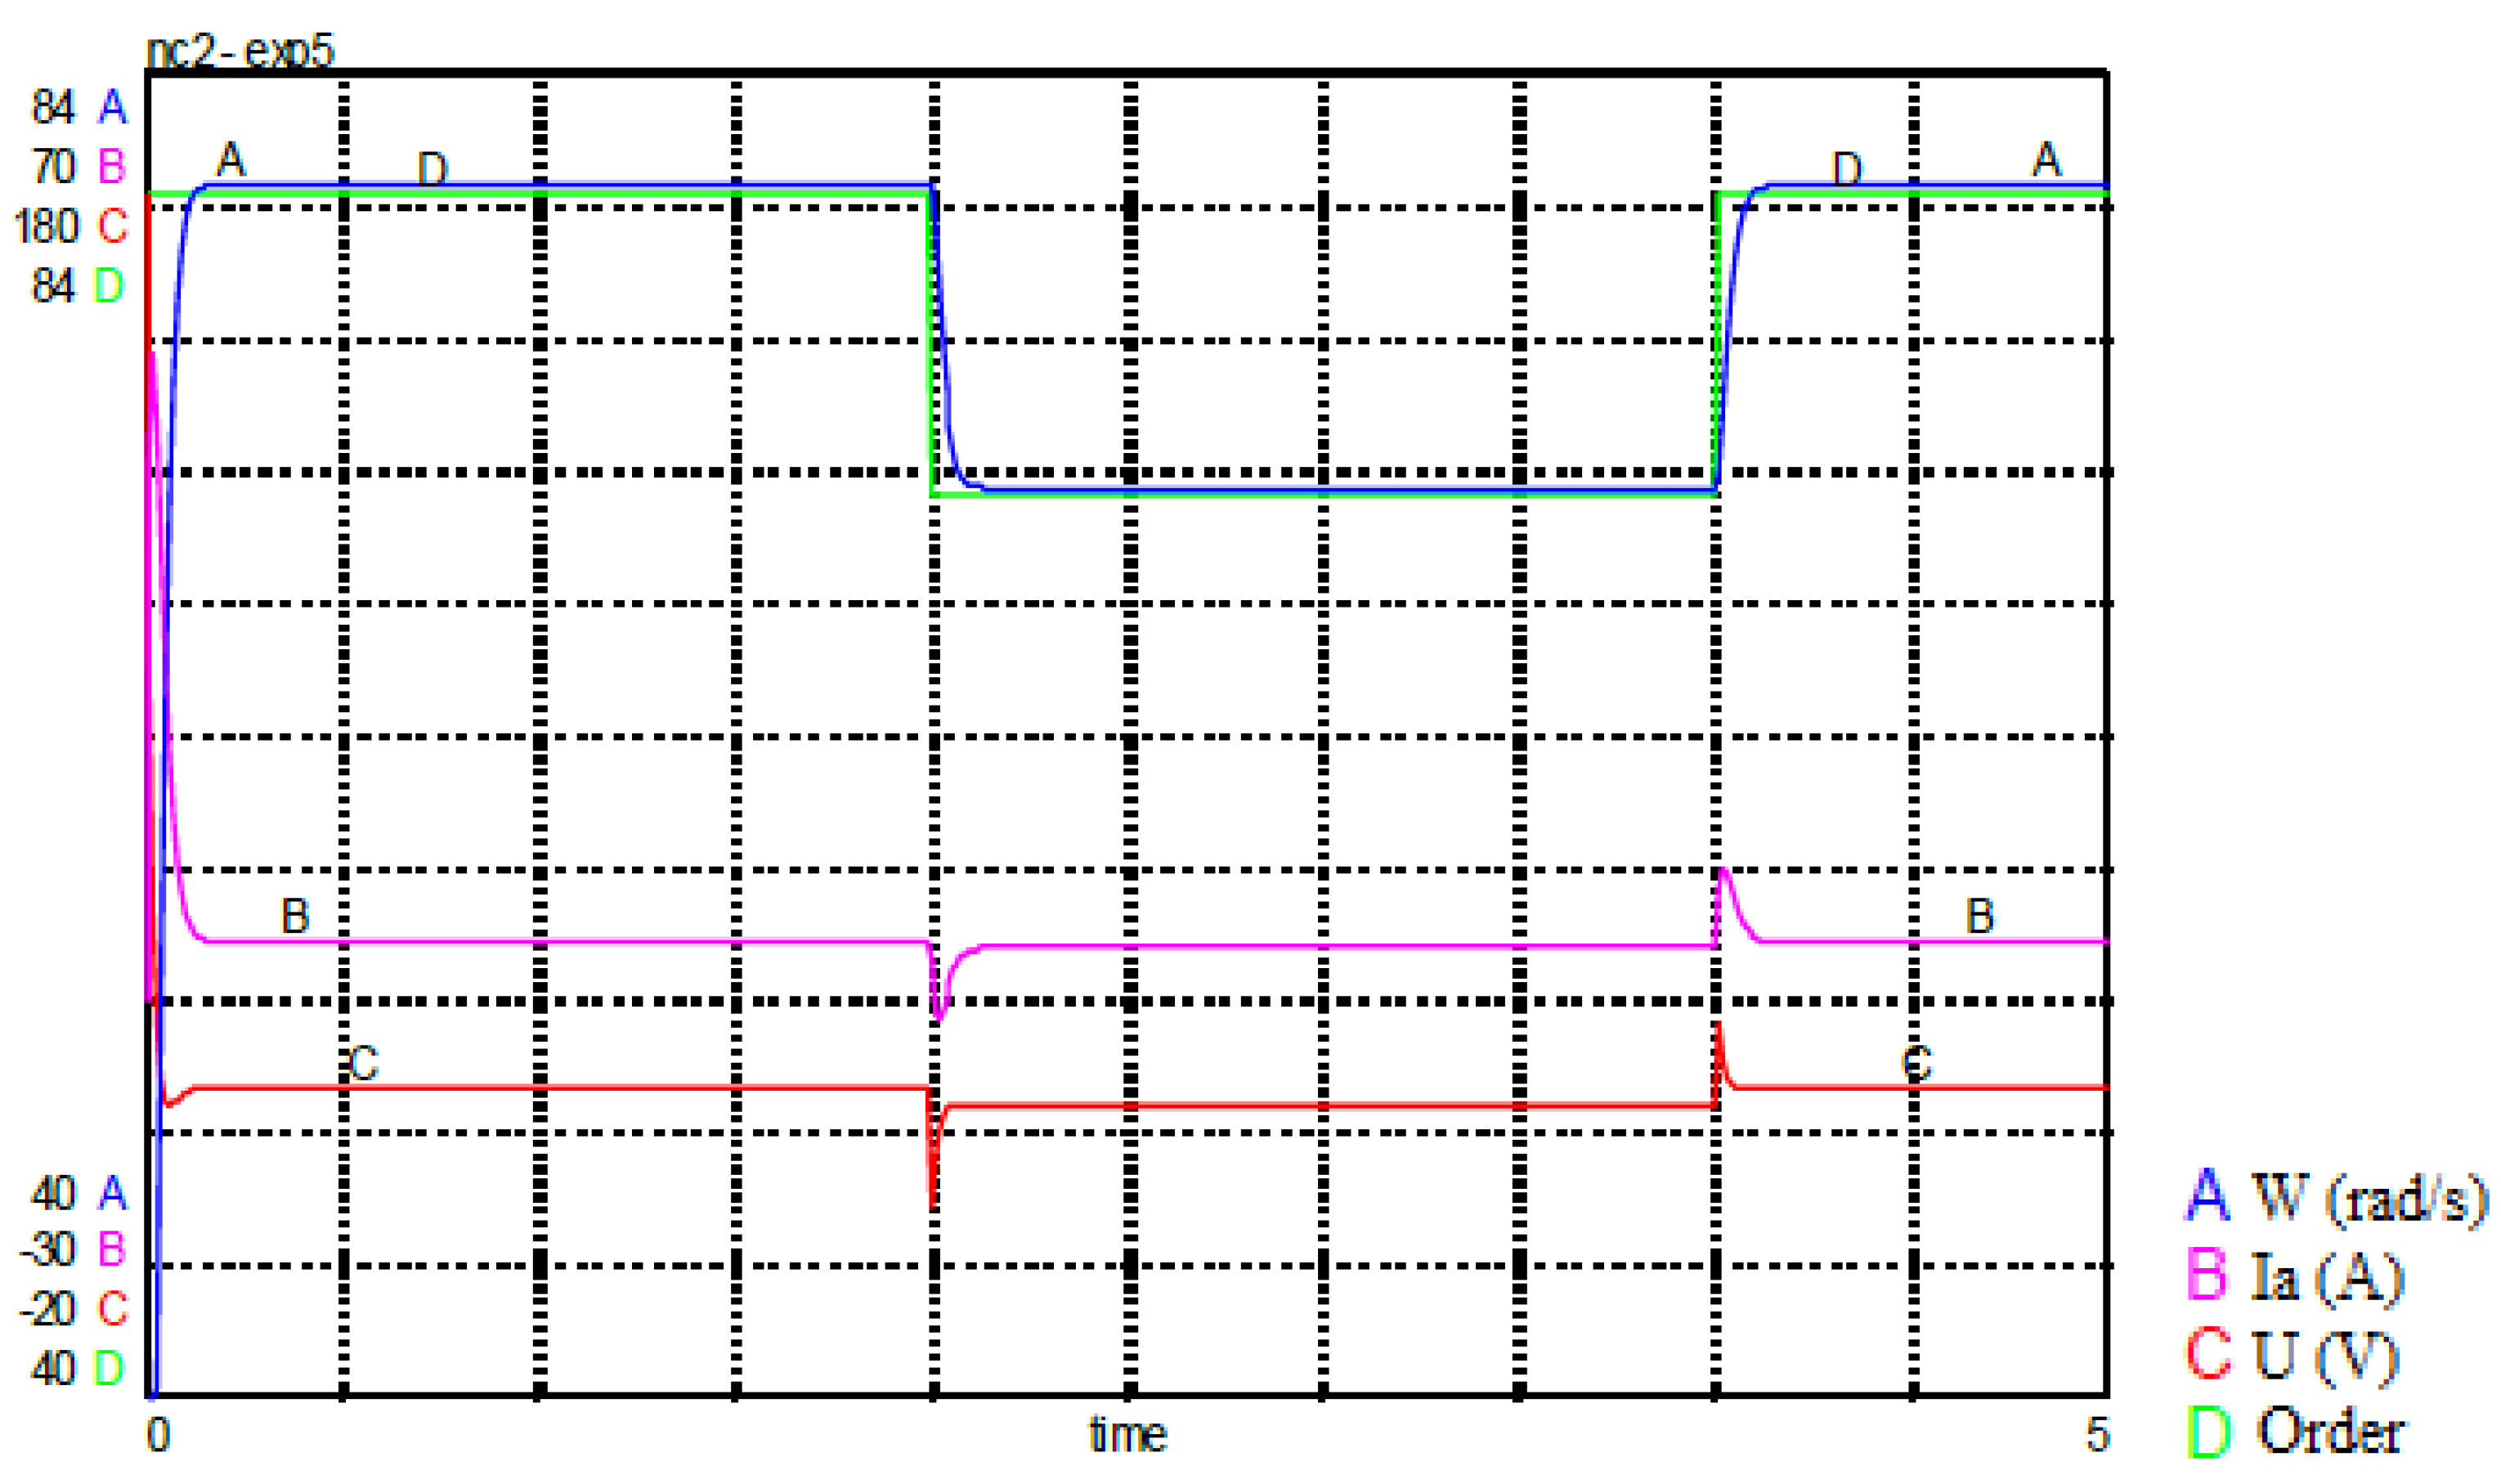
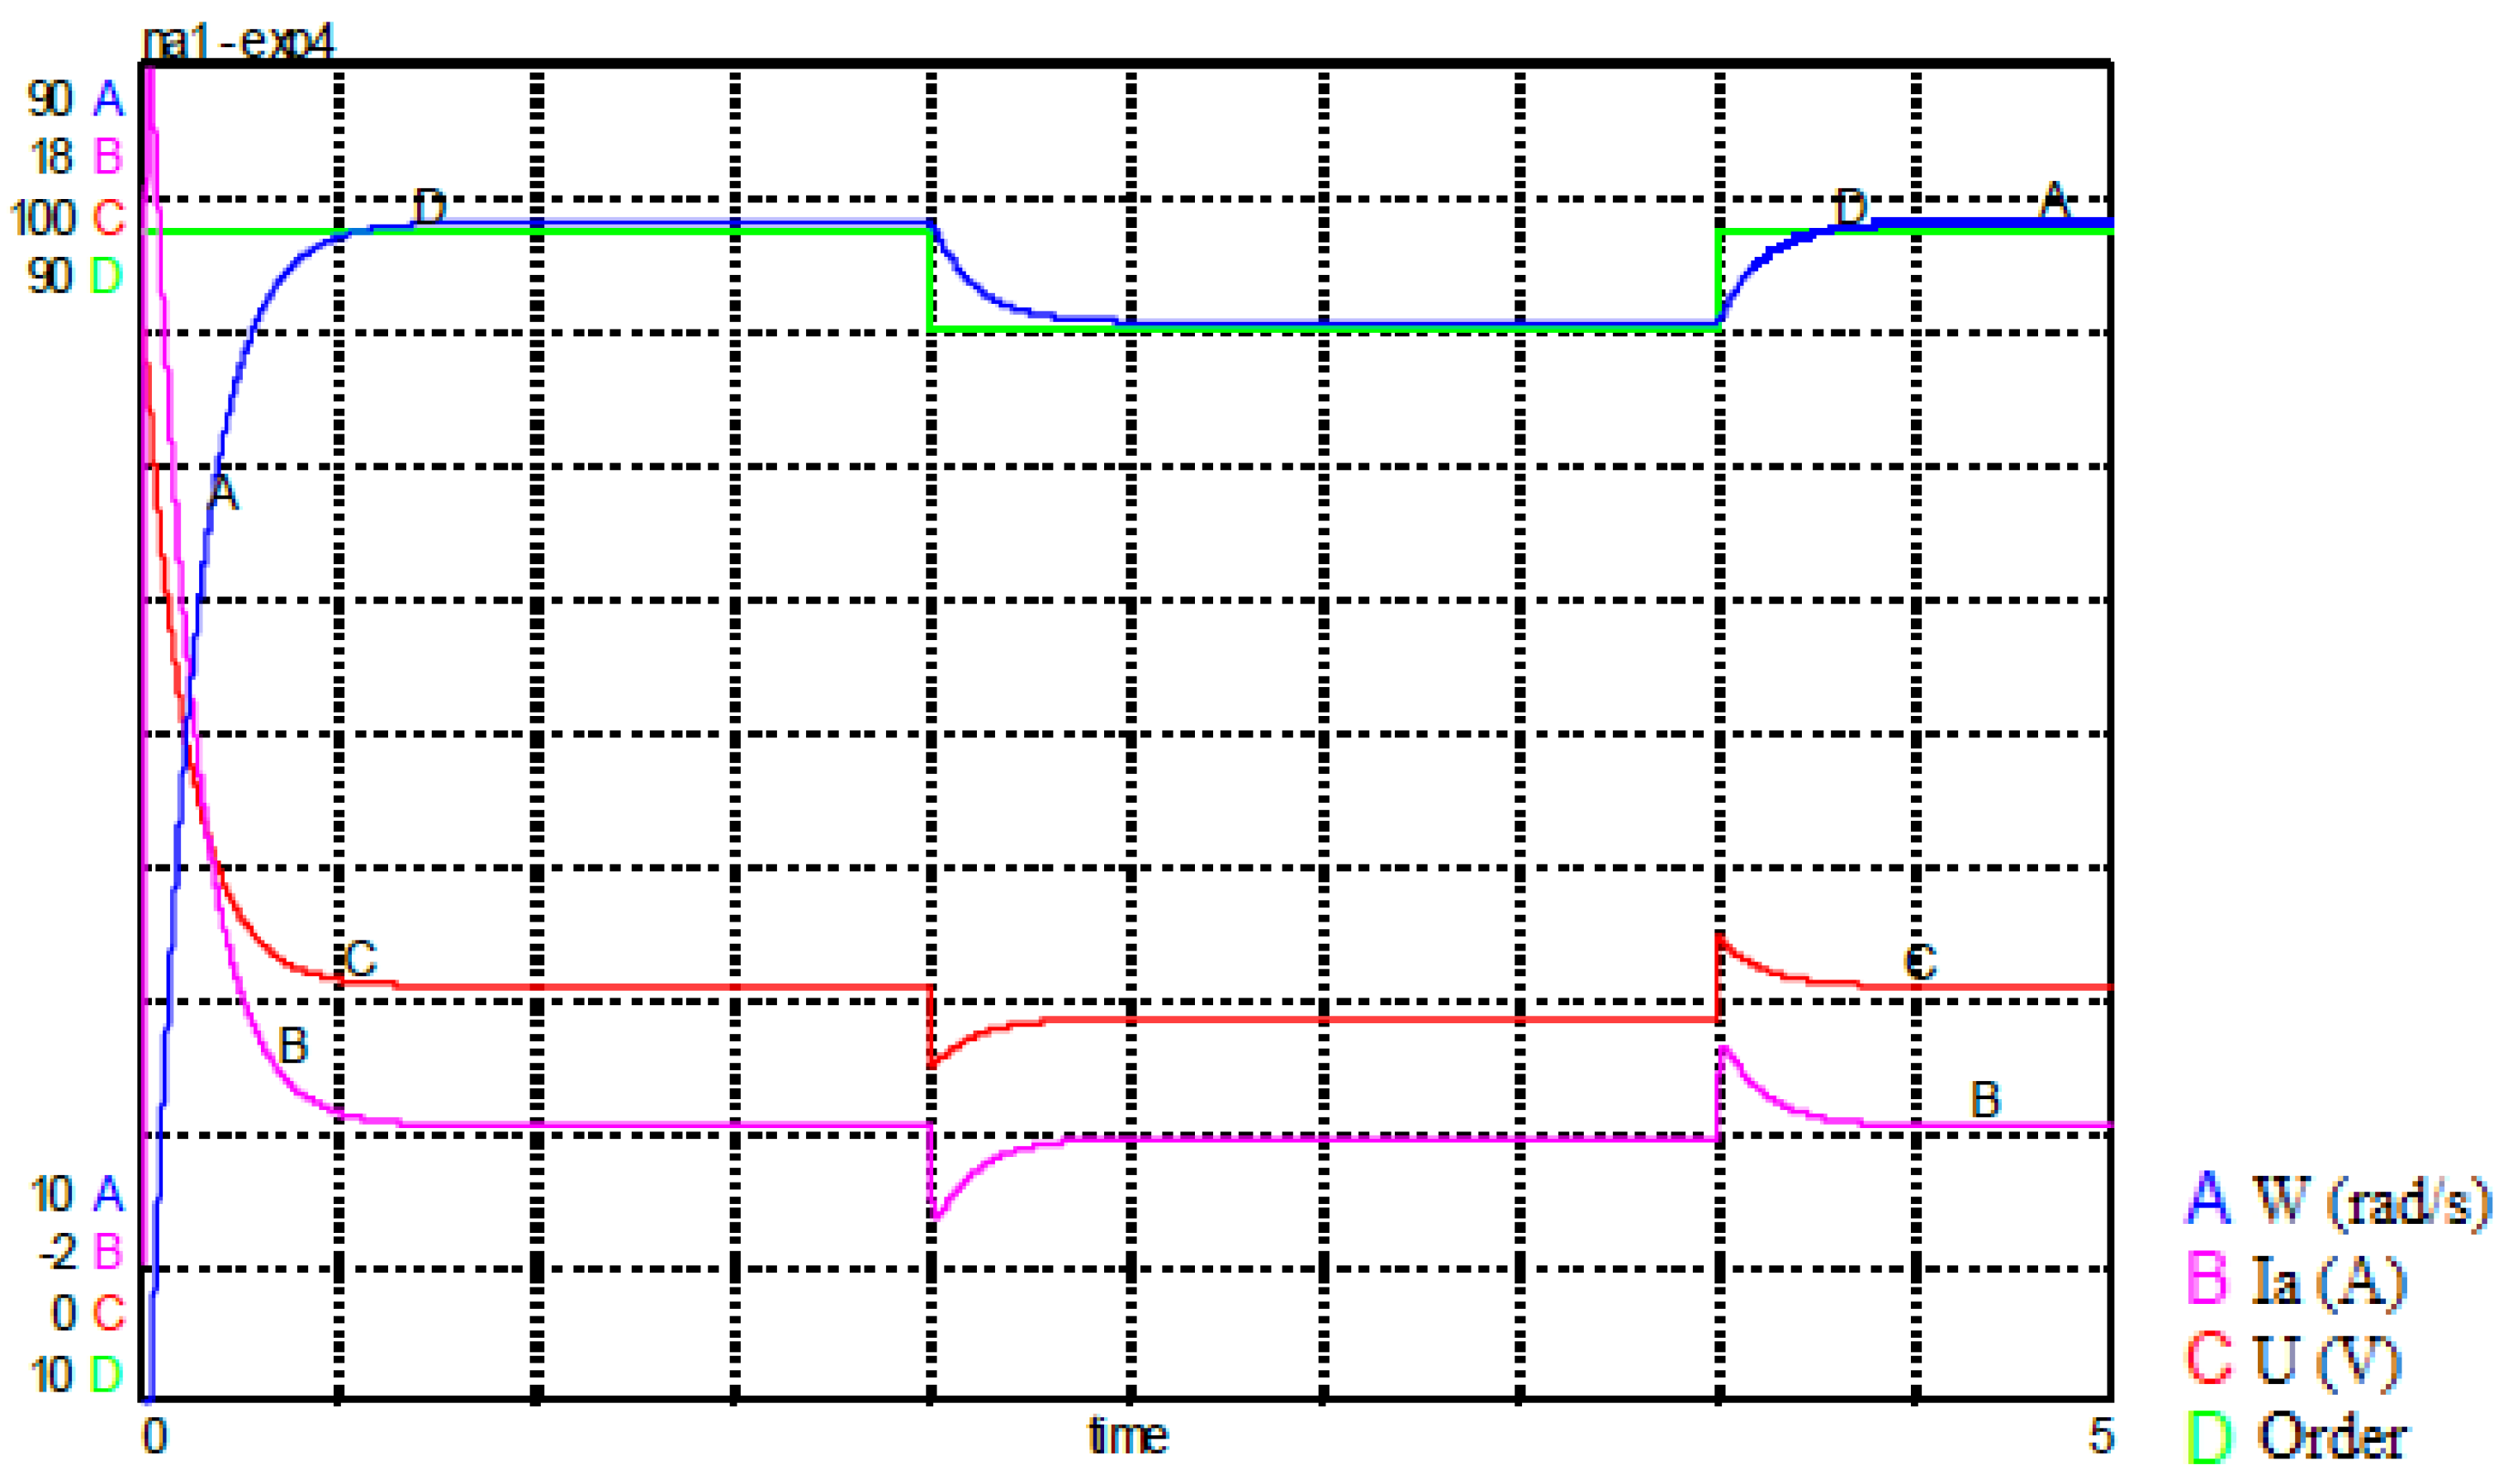
To test the developed model, we simulated the model with a variable set point.
The results of the simulations are shown in the following
Figure 33:
To justify the choice of a robust order, we used the order pole placement by state feedback, such as
U = -Kx + Gv, to control the speed of the DC motor. The chosen pole is 2±2j, the location is achieved by a suitable choice of the vector line K. The diagram and simulation results are presented respectively by the
Figure 34 and
Figure 35:
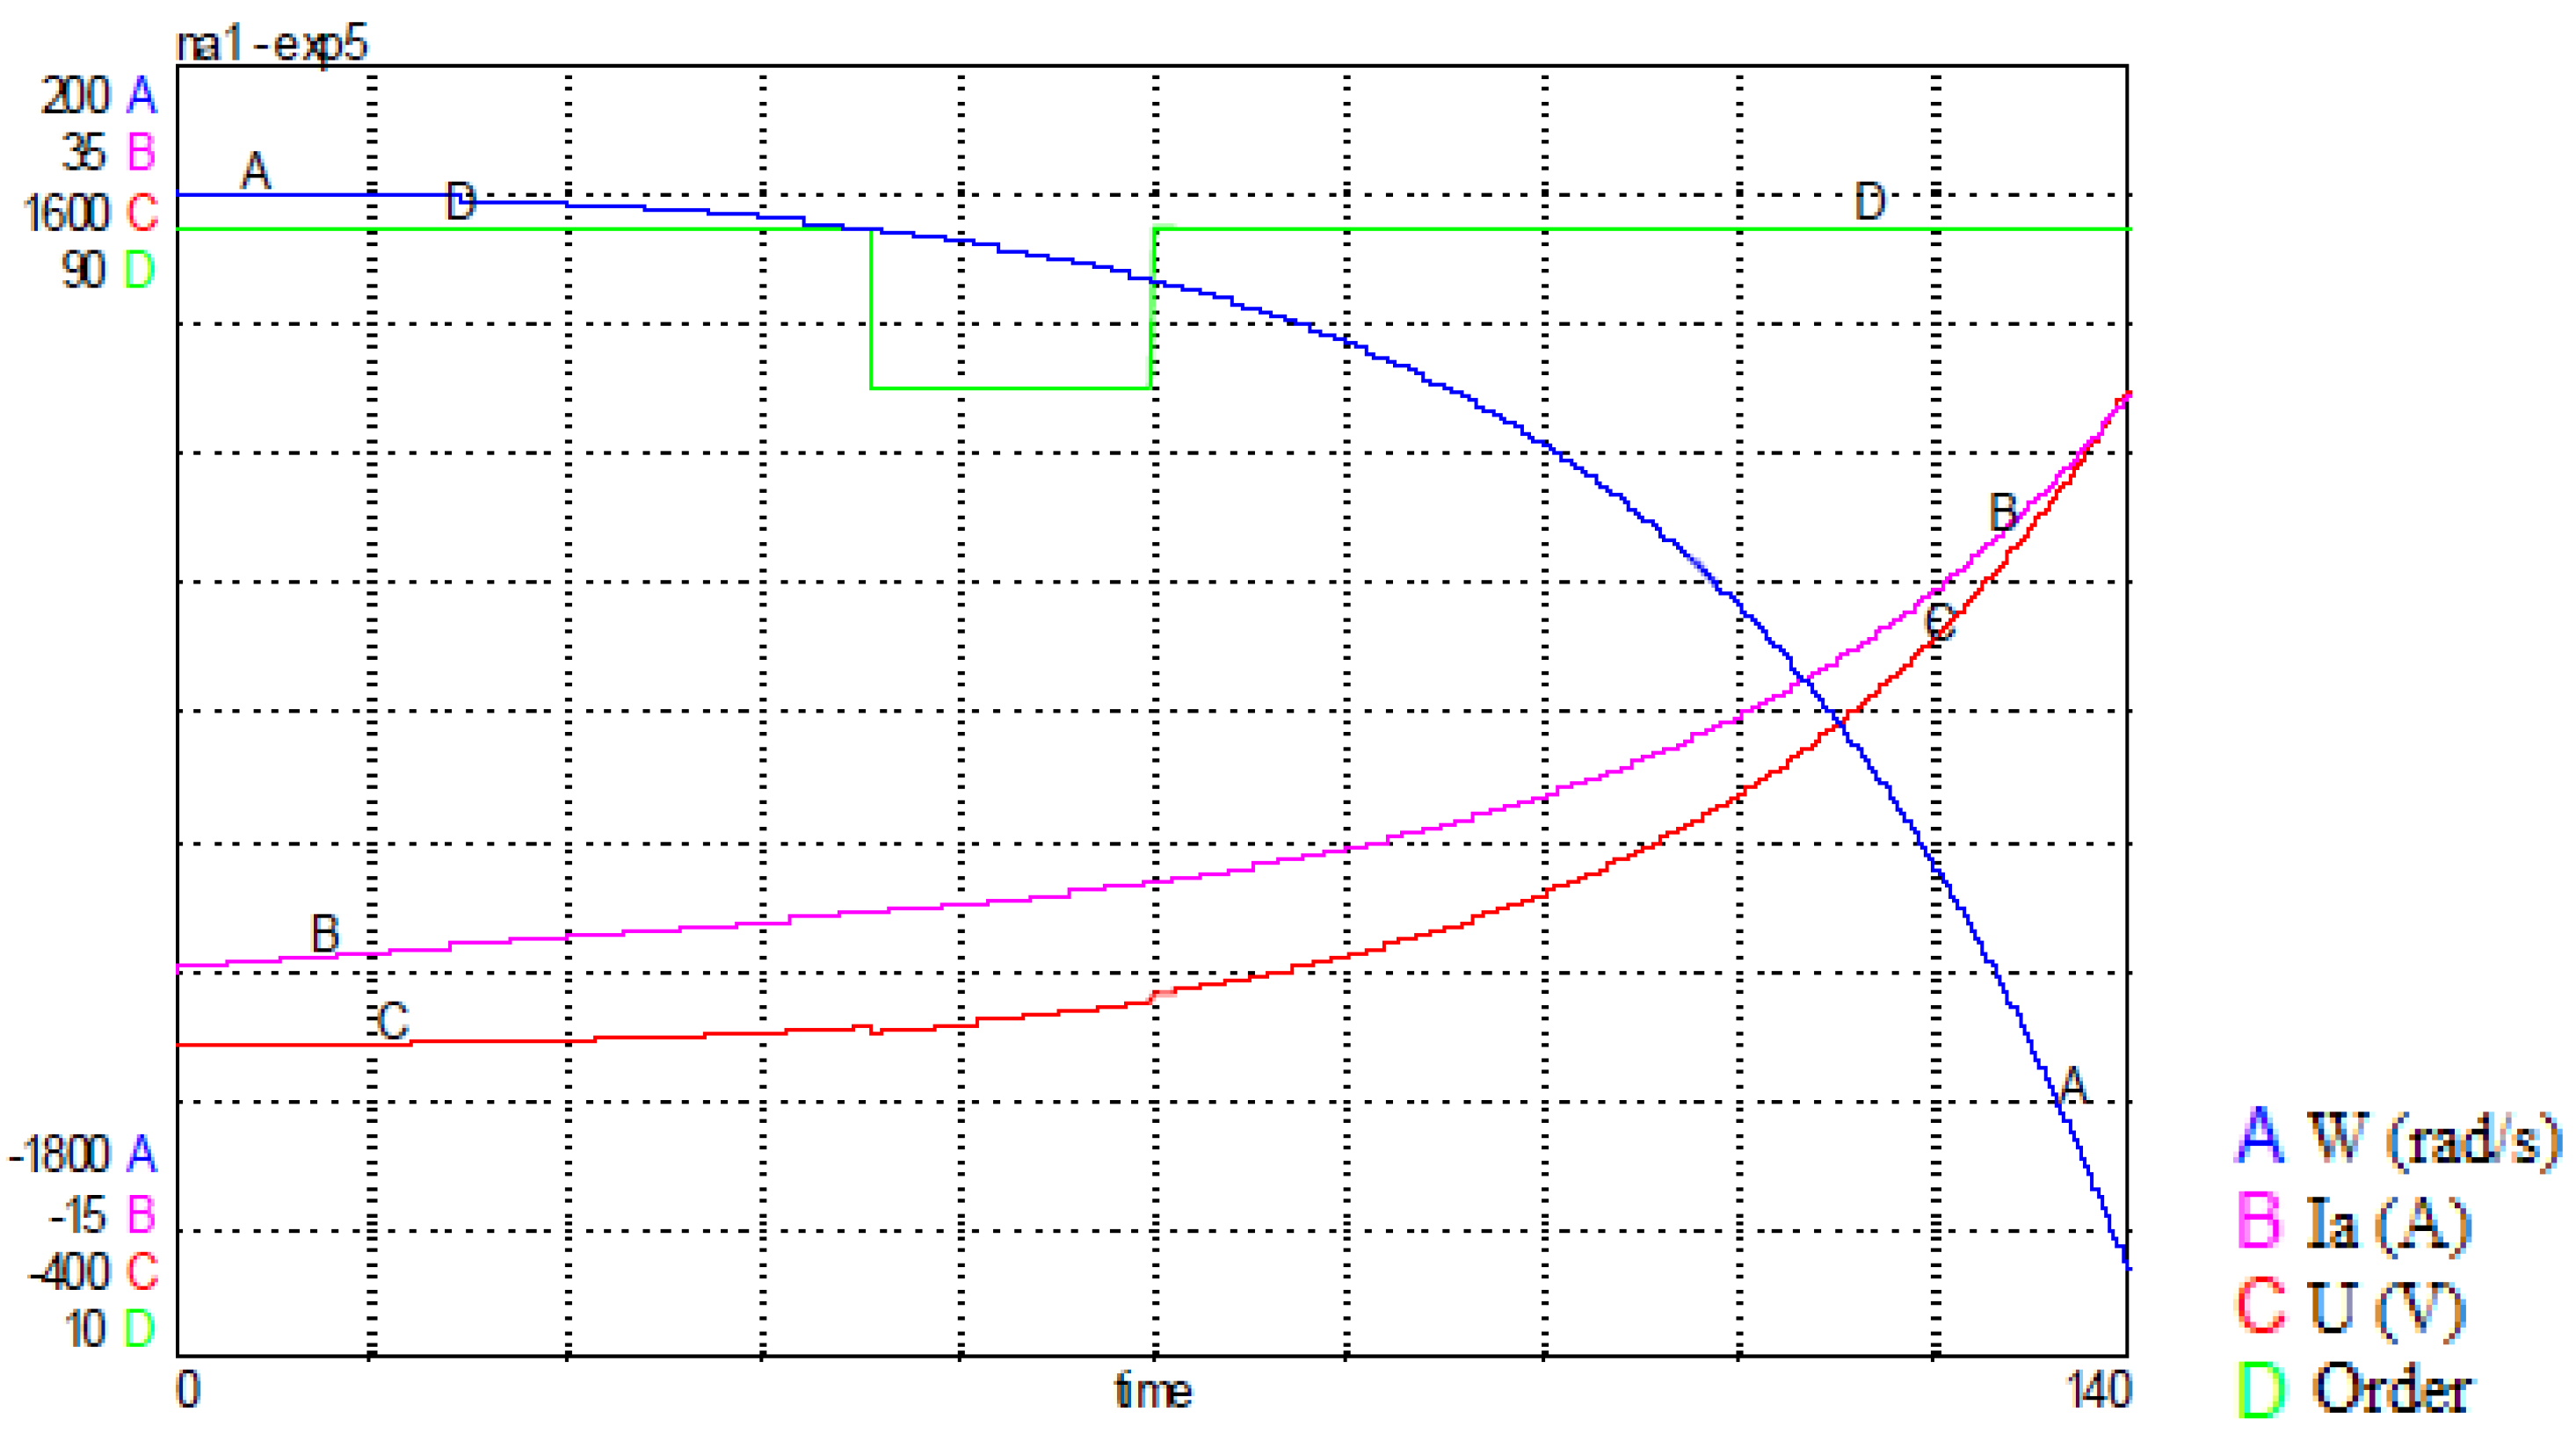
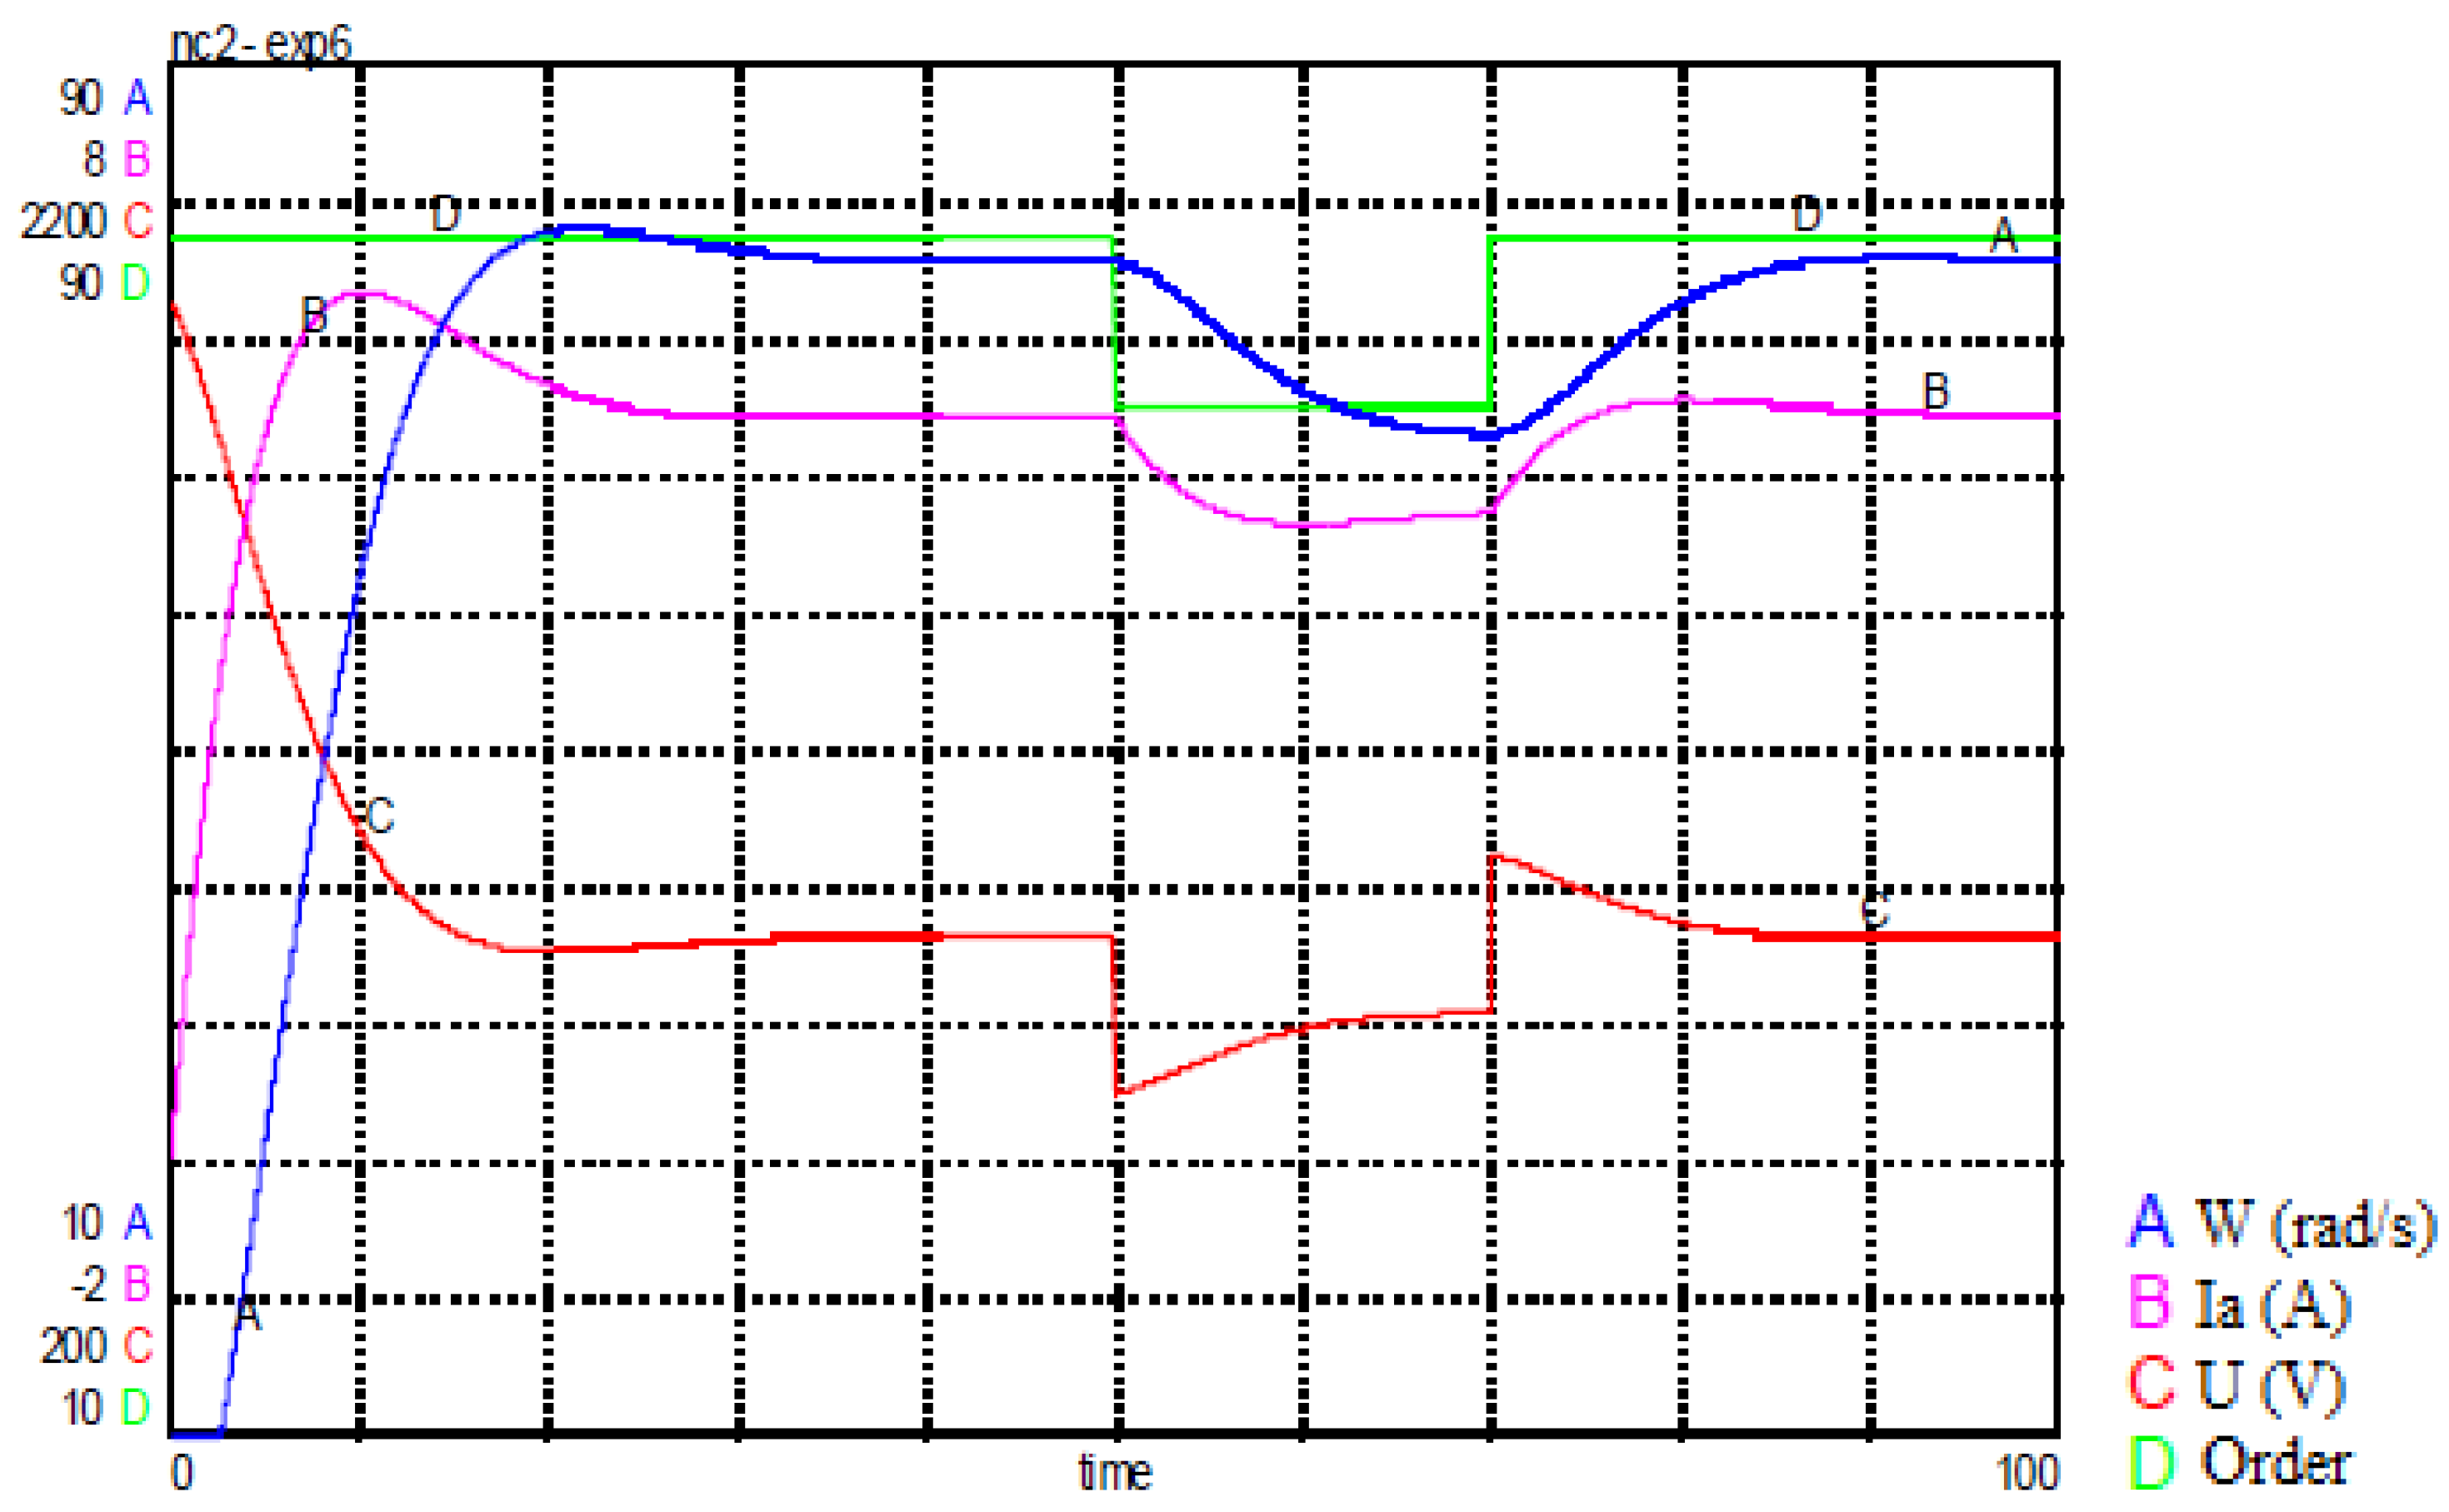
Secondly, we changed the motor time constant parameters. We note that the system diverges with state feedback control, but for the same parameters the system response is stable for sliding mode control.
the robustness of sliding-mode control is essential to ensure stable and reliable performance under real-life conditions often characterized by disturbances, uncertainties and parameter variations
8. Conclusion
In this study, we developed a modeling of various components of the pilot unit for water treatment using ultraviolet radiation, employing the bond graph approach—an modeling tool applicable to various physics domains such as electricity, mechanics, and hydraulics, providing a high level of modeling convenience. A structural analysis was conducted to investigate the controllability and observability of our nonlinear system. To assess the effectiveness of the developed bond graph model, we applied it to real operational scenarios by implementing two control methods, namely sliding mode and state feedback, applied to the motor of the pump to regulate the system's speed. Initially, we calculated the parameters of the associated controllers. Subsequently, we implemented these resulting control laws. A comparative study of the experimental results between sliding mode control and state feedback allowed us to highlight the robustness of sliding mode control in the face of parametric variations.
References
- MATSUMOTO, Takahiro, TATSUNO, Ichiro, et HASEGAWA, Tadao. Instantaneous water purification by deep ultraviolet light in water waveguide: Escherichia coli bacteria disinfection. Water, 2019, vol. 11, no 5, p. 968. [CrossRef]
- KAMEL, Ahmed, PALACIOS, Ana, FUENTES, Manuel, et al. Analysing the reciprocity law for uv-leds in water disinfection of escherichia coli, enterococcus faecalis, and clostridium perfringens. Water, 2023, vol. 15, no 2, p. 352.
- BECK, Sara E., WRIGHT, Harold B., HARGY, Thomas M., et al. Action spectra for validation of pathogen disinfection in medium-pressure ultraviolet (UV) systems. Water research, 2015, vol. 70, p. 27-37. [CrossRef]
- BEN SAID, Myriam, BEN MUSTAPHA, Mounir, et HASSEN, Abdennaceur. The impact of power supply frequency of a low pressure UV lamp on bacterial viability and activities. Desalination and Water Treatment, 2015, vol. 53, no 4, p. 1075-1081.
- OUELHAZI, Khira, CHAABENE, A. Ben, SELLAMI, Anis, et al. Multivariable model of an ultraviolet water disinfection system. Desalin. Water Treat, 2017, vol. 67, p. 89-96. [CrossRef]
- MINZU, Viorel, RIAHI, Said, et RUSU, Eugen. Optimal control of an ultraviolet water disinfection system. Applied Sciences, 2021, vol. 11, no 6, p. 2638. [CrossRef]
- SAID, Riahi, ZITOUNI, Naoufel, MINZU, Viorel, et al. Modeling and Simulation of a UV Water Treatment System Fed by a GPV Source Using the Bond Graph Approach. Engineering, Technology & Applied Science Research, 2022, vol. 12, no 3, p. 8559-8566. [CrossRef]
- RIAHI, Saïd, MAMI, Abdelkader, et MÎNZU, Viorel. Simulation Study for a UV Water Disinfection Unit Powered by a Photovoltaic System. IJCSNS, 2022, vol. 22, no 1, p. 175.
- ZITOUNI, Naoufel, GAMMOUDI, Rabiaa, BRAHIM, Khiari, et al. Database for control a complex water treatment system powered by photovoltaic generator for deep learning. In : 2022 International Conference on Electrical, Computer and Energy Technologies (ICECET). IEEE, 2022. p. 1-6.
- GONZÁLEZ, Gilberto. Analysis of loading effect of systems in a bond graph approach with application to a synchronous machine. Proceedings of the Institution of Mechanical Engineers, Part I: Journal of Systems and Control Engineering, 2012, vol. 226, no 2, p. 243-255. [CrossRef]
- CHOLAHAN, Varin, WONGVANICH, Napasool, et TANGSRIRAT, Worapong. Robust Constant Exponent Coefficient Fixed-Time Control Based on Finite-Time Extended Sliding Mode Observer of Permanent Magnet Synchronous Motors. Energies, 2023, vol. 16, no 21, p. 7454. [CrossRef]
- ADHIKARI, Prottay M., VANFRETTI, Luigi, CHANG, Hao, et al. Real-Time Control of a Battery Energy Storage System Using a Reconfigurable Synchrophasor-Based Control System. Energies, 2023, vol. 16, no 19, p. 6909. [CrossRef]
- TAPIA SÁNCHEZ, Roberto, MEDINA RÍOS, J. Aurelio, et PAZ, Antonio Ramos. Bond graph based control of a solar array. Simulation, 2018, vol. 94, no 12, p. 1063-1080.
- NGUYEN, Xuan Hieu et NGUYEN, Minh Phuong. Mathematical modeling of photovoltaic cell/module/arrays with tags in Matlab/Simulink. Environmental Systems Research, 2015, vol. 4, p. 1-13.
- HAHM, Jehun, BAEK, Jaeho, KANG, Hyoseok, et al. Matlab-based modeling and simulations to study the performance of different MPPT techniques used for photovoltaic systems under partially shaded conditions. International Journal of Photoenergy, 2015, vol. 2015. [CrossRef]
- WANG, Yuqin, ZHANG, Haodong, HAN, Zhibo, et al. Optimization design of centrifugal pump flow control system based on adaptive control. Processes, 2021, vol. 9, no 9, p. 1538. [CrossRef]
- SHAHGHOLIAN, Ghazanfar et MAGHSOODI, Mojtaba. Analysis and simulation of speed control in DC motor drive by using fuzzy control based on model reference adaptive control. Cumhuriyet Üniversitesi Fen Edebiyat Fakültesi Fen Bilimleri Dergisi, 2016, vol. 37, no 3, p. 197-211. [CrossRef]
- ZITOUNI, Naoufel, ANDOULSI, Ridha, SELAMI, Anis, et al. Modelling of nonlinear pilot disinfection water system: A bond graph approach. Leonardo J. Sci, 2012, vol. 20, p. 15-30.
- ZITOUNI, N., KHIARI, B., ANDOULSI, R., et al. Modelling and non linear control of a photovoltaic system with storage batteries: A bond graph approach. IJCSNS Int. J. Comput. Sci. Netw. Secur, 2011, vol. 11, no 6, p. 105-114.
- ZITOUNI, N., ANDOULSI, R., SELLAMI, A., et al. A new Bond Graph Model of a Water Disinfection System Based on UV Lamp Feed by Photovoltaic Source: Simulation and Experimental Results. Journal of Automation & Systems Engineering, 2011, vol. 5, no 2, p. 79-95.
- VÉLEZ-COLMENARES, J. J., ACEVEDO, A., et NEBOT, E. Effect of recirculation and initial concentration of microorganisms on the disinfection kinetics of Escherichia coli. Desalination, 2011, vol. 280, no 1-3, p. 20-26. [CrossRef]
- ANDOULSI, R., MAMI, A., DAUPHIN-TANGUY, G., et al. Modelling and simulation by bond graph technique of a DC motor fed from a photovoltaic source via MPPT boost converter. Proceeding of CSSC’99, 1999, p. 4181-4187.
- BENCHOUIA, Nedjem Eddine, ELIAS, Hadjadj Aoul, KHOCHEMANE, Lakhdar, et al. Bond graph modeling approach development for fuel cell PEMFC systems. International Journal of Hydrogen Energy, 2014, vol. 39, no 27, p. 15224-15231. [CrossRef]
- AISSA-BOKHTACHE, Aicha, ZEGAOUI, Abdallah, KELLAL, Mohamed, et al. Optimization based on fuzzy logic control of discharge lamp-electronic ballast system for water purification. Electric Power Components and Systems, 2016, vol. 44, no 17, p. 1981-1990. [CrossRef]
- Zitouni.N, Andoulsi.R, Sellami.A, Mami.A, and Hassen.A, Sliding-Mode Control for an artificial neural network Analysis and Design of treatment water system. J. Electrical Systems 7-2 (2011): 237-257.
- TRUONG, Thanh Nguyen, VO, Anh Tuan, et KANG, Hee-Jun. Neural Network-Based Sliding Mode Controllers Applied to Robot Manipulators: A Review. Neurocomputing, 2023, p. 126896. [CrossRef]
- DURSUN, Mustafa. Enhancement Fractional-Order Sliding Mode Controller Design for Induction Motor Vector Control. Iranian Journal of Science and Technology, Transactions of Electrical Engineering, 2023, vol. 47, no 3, p. 1059-1080. [CrossRef]
Figure 1.
Equivalent electrical circuit of a single diode photovoltaic generator.
Figure 1.
Equivalent electrical circuit of a single diode photovoltaic generator.
Figure 2.
Bond-graph model of a photovoltaic source coupled to an RL load.
Figure 2.
Bond-graph model of a photovoltaic source coupled to an RL load.
Figure 3.
Simplified bond graph of the PV model.
Figure 3.
Simplified bond graph of the PV model.
Figure 5.
Characteristic of the photovoltaic panel used in the pilot water treatment unit.
Figure 5.
Characteristic of the photovoltaic panel used in the pilot water treatment unit.
Figure 6.
Experimental characteristic I= f (V) of the PV panel during the day 21/05/2022 under an illumination of 89.3 and a temperature of 32°C.
Figure 6.
Experimental characteristic I= f (V) of the PV panel during the day 21/05/2022 under an illumination of 89.3 and a temperature of 32°C.
Figure 7.
Experimental characteristic P= f (V) of the PV panel during the day 21/05/2022 under an illumination of 89.3 and a temperature of 32°C.
Figure 7.
Experimental characteristic P= f (V) of the PV panel during the day 21/05/2022 under an illumination of 89.3 and a temperature of 32°C.
Figure 8.
Variation of the optimal power during the days 18/03/2022, 21/04/222 and 21/05/2022.
Figure 8.
Variation of the optimal power during the days 18/03/2022, 21/04/222 and 21/05/2022.
Figure 10.
Installation of a storage battery coupled to a PV source.
Figure 10.
Installation of a storage battery coupled to a PV source.
Figure 11.
Bond-graph model of a photovoltaic source coupled to a storage battery.
Figure 11.
Bond-graph model of a photovoltaic source coupled to a storage battery.
Figure 12.
Bond-graph model of a single inverter.
Figure 12.
Bond-graph model of a single inverter.
Figure 17.
Bond-graph model of the irradiation system.
Figure 17.
Bond-graph model of the irradiation system.
Figure 18.
Simulation of the ultraviolet irradiation system.
Figure 18.
Simulation of the ultraviolet irradiation system.
Figure 21.
Bond graph model of the centrifugal pump.
Figure 21.
Bond graph model of the centrifugal pump.
Figure 23.
Overall model of UV water treatment unit.
Figure 23.
Overall model of UV water treatment unit.
Figure 24.
Simulation of the operation following a cloudy passage.
Figure 24.
Simulation of the operation following a cloudy passage.
Figure 25.
Simulation of operation without storage battery.
Figure 25.
Simulation of operation without storage battery.
Figure 26.
Direct (a) and indirect (b) causal paths.
Figure 26.
Direct (a) and indirect (b) causal paths.
Figure 29.
Bond-graph model of a DC motor powered by a DC source.
Figure 29.
Bond-graph model of a DC motor powered by a DC source.
Figure 31.
State feedback control system.
Figure 31.
State feedback control system.
Figure 32.
System simulation diagram with robust control.
Figure 32.
System simulation diagram with robust control.
Figure 33.
System simulation with robust controller.
Figure 33.
System simulation with robust controller.
Figure 34.
Simulation diagram of the system with state feedback control.
Figure 34.
Simulation diagram of the system with state feedback control.
Figure 35.
Simulation of the system with state feedback control.
Figure 35.
Simulation of the system with state feedback control.
Figure 36.
Simulation with control by pole placement (constant modified time).
Figure 36.
Simulation with control by pole placement (constant modified time).
Figure 37.
System simulation with robust controller (time constant modified).
Figure 37.
System simulation with robust controller (time constant modified).
|
Disclaimer/Publisher’s Note: The statements, opinions and data contained in all publications are solely those of the individual author(s) and contributor(s) and not of MDPI and/or the editor(s). MDPI and/or the editor(s) disclaim responsibility for any injury to people or property resulting from any ideas, methods, instructions or products referred to in the content. |
© 2023 by the authors. Licensee MDPI, Basel, Switzerland. This article is an open access article distributed under the terms and conditions of the Creative Commons Attribution (CC BY) license (http://creativecommons.org/licenses/by/4.0/).
