1. Introduction
Although driving is essential to everyday life, 70% of road accidents have resulted from driver’s distraction [
1,
2]. Driver error and factors such as drowsiness and fatigue can result in significant fatal vehicle crashes [
3,
4,
5]. Various research have been proposed to improve the car lateral control [
5]. A study on car accidents stipulated that a lane departure avoidance approach could prevent almost 31% of fatal car accidents [
6].
Studies were conducted on driver assistance systems, which indicated that implementing an assistive system into a car driving operation reduces the driver’s workload [
7]. Continuous haptic steering guidance was developed to assist the driver in keeping their lane by providing a feedback torque in response to the centre lane deviation [
8], which was validated as effective in lowering the driver’s workload and enhancing the target trajectory achievement [
9,
10,
11]. However, this haptic guidance for lane-keeping assistance was developed based on the car-road model but did not consider human behaviour. The human uncertainty could limit performance.
Several researchers have modelled the human driving behaviour in the car-road closed-loop haptic system to enhance driving performance during lane-keeping tasks [
12,
13]. The link between the driver’s vision and his steering behaviour with force feedback was investigated by Franck Mars [
14,
15] when driving through the curve. Nevertheless, their output models were based on driving intention variables. The driving behaviour and the vehicle dynamics were modelled from mathematical principles, with many assumptions leading to instability. Different Controllers were developed to adjust the uncertainty or reduce the lateral displacement by compensating the driving behaviour and yaw angle error.
Model predictive control (MPC) is a feedback control algorithm that uses the model to optimize and predict the future output of the system. A multivariable controller monitors the work simultaneously by considering all interactions between system variables. It can consider constraints, such as speed limit, lateral range on the input, and more system states. Based on the above characteristics, researchers have used MPC to compensate for driving behaviour by providing a steering action to minimize the cost function involving car path errors and dynamics. To minimise the steering angle error, Keen and Cole [
16] designed a steering compensator deriving from a linear MPC by applying the formal system identification technique to the double lane-changing tasks. Pick et al. proposed an MPC combined with PID to control the driver’s steering, braking and accelerating by optimizing a cost function that takes into consideration the lateral errors and speed deviations [
17]. However, the controller could not compensate for different driving behaviours or styles. Moreover, the driving behaviour was modelled as a linear and time-invariant system. The driver-car-road system is complex in a real environment, with various time-varying driver tasks and actions. Therefore these control approaches should consider the system as non-linear and time-varying.
To predict the driving behaviour control action and minimize the lateral displacement error, Guo et al. [
18] combined (MPC) [
19] and the PID. The PID controller was designed to compensate for the driver’s braking and accelerating control by minimizing the longitudinal velocity error. The neural response system and neuromuscular of the driver were taken into consideration. The MPC developed in [
20] was further enhanced by including the vehicle inverse information to the longitudinal driver control. This approach was expanded using the MPC to control a non-linear time-variant driver steering operation. The driver steering controller was developed, and the driving steering behaviour model was used as a non-linear time-varying controller, a non-linear vehicle dynamic with the path preview and the state feedback was incorporated to solve an MPC loss function to produce a driving command. However, the non-linear dynamics of the vehicle were approximated by a set of linearised models, and assumptions were made on different driving skills (highly skilled, less skilled, and novice driver steering).
Stochastic MPC (SMPC)-based driver steering controller where the road condition preview point approach, preview time (icy, wet, and dry), weights condition, and time delay was proposed by Qu et al. [
21]. The cost function, which involved the weighted combination of lateral path error and human driver control, was minimized by the SMPC. They used the disturbance of the internal vehicle with the dynamic road friction coefficient to design the driver steering knowledge on various road conditions. Although this control model has a good tracking path, it is essential to note that the road friction coefficient and vehicle internal dynamic formulations were based on mathematical and many other assumptions.
Some researchers also used proportional-integral-derivative (PID) control to mimic and control the steering wheel behaviour. Shida et al. [
22] developed a PID control approach with Particle Swarm Optimisation where the driving behaviour was modelled as a PID with conventional feedback, and the PSO minimized an evaluation function to find the best PID gain (Kp, Ki, Kd) that will reduce the driving simulation error and the model error. Nevertheless, the Fixed control parameter was used, making the controller-less robust. Menhour et al. [
23] proposed two PIDs combined with a Linear Quadratic Regulator to minimize the yaw angle and the lateral displacement error in the trajectory tracking task. An LQR and the linear matrice inequality optimization obtained the PID parameters. Due to its robustness and stability, the controller overcomes uncertainties. However, only the trial and error method was used; it relied on the accuracy of the driver-vehicle model and required a fast processor. Also, it could not handle various driving behaviours. A PID controller was also designed by Niu [
24] and Sun to monitor the robot driver’s accelerator leg. The parameters were derived from a critical proportioning method obtained from the mathematical transfer function of a robot’s accelerator leg. The controller cannot resist uncertainty and a non-linear system because the driving behaviour model was made from a mathematics approach with many assumptions. A fuzzy PID controller was proposed to reduce the displacement error and match the tracking error. The fuzzy controller was used to improve the overshoot (decrease) and the response speed (reduce the rising time) [
25]. But It needed a vast, distinct rule base. The fuzzy scale factor is difficult to adjust.
Ercan et al. [
26] designed an MPC to support the driver in a haptic-shared control system to keep the vehicle in the lane and reduce the workload. The loss function considered the driver arm impedance model. The controller estimated and updated the best guidance torque, which assisted the driver in keeping in the lane by reducing its workload. An advanced MPC-based haptic controller combined with LQR was developed to enhance driving behaviour based on cognitive processes. The future state of the driving model was forecasted by a cognitive controller involving an LQR. The cost function with various constraints on steering angle, yaw rate, lateral velocity, and torque assistance was optimized to provide an assistive torque during a steering action [
27]. Efremov et al. [
28] developed an MPC controller that used driver environment restriction to support the driver in lateral tasks. The main aim of the MPC controller was to predict the optimized guiding steering wheel angle from a reference steering angle conducted by the driving action. In a curvature, the sideslip angle and the slip ratio on the tire forces were delimited and taken as a constraint for the MPC objective function. However, the driver arm impedance model was derived from mathematical assumptions; therefore, it will lack robustness. Furthermore, some controllers did not consider an optimal human model, which Could not compensate for different driving steering behaviour errors or styles.
Although several controllers have been extensively evaluated to model and control driving behaviour in the above review, no study has investigated the data-driven controller considering various driving styles in haptic feedback systems. This study presents a proposed robust controller that uses the data-driven technique, the genetic algorithm offline, to minimize the fitness function and provide the best PID parameter. Moreover, this PID gains controller will be used as the output of the fuzzy-PID controller online due to the dynamic change in driving behaviour response to improve different driving performances by minimizing the car’s lateral displacement and orientation angle errors.
This paper is structured as follows:
Section 2 presents the relevant works used to achieve the objective of this research work, such as the design of a driving behaviour model by an artificial neural network and the optimisation of PID controller using GA.
Section 3 formulates the problem, highlighting the proposed data-driven controller design and structure.
Section 4 describes the experiment and driving simulator; the simulation and results are presented in
Section 5. An extensive discussion is provided in
Section 6. Lastly, the conclusion that consolidates state of the art evaluate in this paper is presented in
Section 7
2. Relevant works
2.1. Artificial Neural Network Model for Driving Behaviours
Most driving behaviour models were designed based on mathematical and empirical techniques, the first principle of physics where many assumptions and simplifications arose. Driving behaviour is a complex task and should be considered as a non-linear and time-varying system. So modelling human driving behaviour from mathematical and physical principles will decrease the matching performance between the model and the real driving intention. Artificial neural network (ANN), which is an intelligent approach, can provide a model without prior knowledge of the driver-vehicle road system. Furthermore, it reacts and makes decisions as the human brain [
29]. Some researchers have used various ANN to develop driving behaviour models in lane-changing and lane-keeping systems. Backpropagation was mainly utilised to map the driving steering behaviour based on input data and output data [
30,
31].
Backpropagation is an ANN training algorithm that minimises the deviation between the ANN output and the desired output by gradually adjusting the weights in all connections according to the desired output target in the node. Such backpropagation-trained neural network (BPNN) is made of a multilayer feed-forward neural network with three or more layers of interconnected neurons. It includes an input layer, hidden layer and output layer [
32]. The framework of the BPNN is designed based on the input and output data characteristics. The hidden layer tends to be distributed between themselves, codifying each aspect of the input data. This paper will map the driving behaviour based on data from the driver and the vehicle provided.
Figure 1 represents the driving behaviour model with the haptic steering feedback force using the BPNN.
.
This model is made with three layers such as two input units(
) for
Figure 1, hidden units(
), two output units (
). The input variable of these BPNNs is the car’s position error and orientation angle error. Steering wheel angle and acceleration are the output variables. The number of hidden neurons in the hidden layer is ten (10). The input neuron or units are joined to the hidden neuron through the weights
, and the hidden unit is connected to the output neuron through
.The input data of the BPNN can
and the BPNN output forward algorithm is defined by equation (
2)
where :
is the actual output;
is the weight, and i represent the starting unit’s (neuron) identifier and j the output unit’s (neuron) identifier. The backpropagation algorithm is expressed in equation(3) [
33]. This is the adjusting calculation of the weights joined to the output.
where:
is the error coefficient;
r the coefficient;
the actual input
where:
represents the desired output;
the actual output.
The achievement of the correction of the weights is formulated as follows
2.2. Optimising PID controllers using GA
PID Controller is one of the most used to enhance the transient response. In this paper, the PID controller utilises the feedback errors from the driver-vehicle system and constantly varies the steering wheel angle according to the car’s position error and orientation angle error. The general PID controller used in this study is shown in Equation (
8). The proportional control and integral control reduce the steady-state errors (Deviation between the car’s desired position and orientation and the actual position and orientation angle). The derivative controller improves the system response speed.
where :
is the difference between the car’s actual lateral position, orientation and the car’s desired position and orientation;
represents the proportional gain,
the integral gain,
the derivative gain.
Genetic Algorithm (GA) has been used in optimizing PID controllers because it can prospect a huge search region of PID gains and find the optimal set by optimising the system error or other performance indexes. The individual from a new generation reproduced by a population (collection of individuals) seems to produce a better performance than the previous individual [
34]
The GA-PID was chosen due to the complexity of human driving behaviour and the non-linearity of the car-road-vehicle system with a haptic feedback interface. The GA combined with the PID compensator optimises the gains, minimizing the BPNN driving behaviour error, including the car’s position and orientation angle error. One set of PID gains represents one of the individuals in a GA population. The optimisation technique assesses each parameter set due to a loss function, Integral Time Absolute Error (ITAE), on the car’s lateral displacement and orientation error, indicating the PID controller’s performance. A new generation generates a recent PID gain set using the GA’s selection, crossover and mutation action. The action will repeat until the optimal PID gains set minimises the loss function (ITAE).
3. Proposed data-driven controller
This controller is designed based on the drivers’ data profile because of the non-linearity and the complexity of the individual human behaviour and personality. The BPNN representing the driver was mapped using real data collected from various driving behaviours or scenarios. The GA used this driving behaviour model to optimise the ITAE cost function to provide the optimal PID parameters offline, as shown in
Figure 2. This figure depicts the diagram of the GA-PID structure used in this paper, where the GA is used to produce the best PID parameters (
) that provide the best driving steering angle
by compensating the driving error (
) committed by the driver whose model was mapped by a BPNN. This controller minimises the cost function, i.e. ITAE, as shown in Equation (
10). The optimal PID parameters emanating from different driving behaviours were then used to map the inputs and the outputs membership function of the Fuzzy-PID controller integrated into the system to operate online.
3.1. Modelling driving behaviour using BPNN
As mentioned before, due to the complexity and the non-linearity of driving behaviour, the BPNN training algorithm was chosen to map these behaviours because it consistently adjusts the weights in all connections according to the desired output target to minimise the error between the driver’s ANN output and the desired output. The driving behaviour designed model was presented in
Figure 1 where the data used emanated from driving tasks.
3.1.1. Data
The real-time data were collected from matlab simulink after conducting multiple driving simulator experiments with different drivers. These data were classified based on their performances.
The driving behaviour is characterised by the driver’s movement on the steering wheel, the acceleration, the car’s lateral position, and the vehicle orientation angle error. The BPNN will be framed based on the input variable, such as the car lateral deviation, the car orientation angle error, and the speed. . The following equation represents the output variable, such as the steering wheel angle and the acceleration.
Training data is a portion of real data used to train the BPNN model. Validating data are samples of origin data used to evaluate the BPNN model, while the testing data are used to examine the correctness of the model. In this work, 75% of the real data generated by the drivers and the vehicle (car position, speed, acceleration, orientation angle, steering wheel angle) are randomly selected for training data, 15% of data used for validation and 15% for testing.
3.1.2. Data Processing: Normalised and denormalised data
normalisation in BPNN can be seen as the data preparation procedure. It primarily converts the input or output value of a given data set to a scale without affecting input variation [
35]. Z score normalisation, one of the normalisation techniques, has been used in this paper.
This method provides a Z-score value that shows how far a data point is from the mean value, as shown in equation(6).
where
x is the evaluated value,
is the mean and
is the standard deviation. According to Mohammed Z, z-score standardisation in BPNN speeds up the learning process by reducing the number of epochs [
36]. This paper applied z-score normalisation on the input and output data since the range between the input (displacement and orientation errors) was significant. The range of target data(steering wheel angle and car acceleration) was substantial.
Denormalisation data is a technique that is used to retrieve the original data which was subjected to normalisation. This approach links the BPNN to the physical. Equation (
7)is used to recover the original data structure, such as the steering wheel angle and the car acceleration data.
where
x is the retrieve value,
is the mean and
is the standard deviation.
3.2. GA-PID Structure for Controller Design
In a PID controller, the parameters are the key to improving the system response, which in this study are optimized by GA in this paper. The cost function of GA needs to be defined from the control performance to obtain the optimal PID parameters. The ITAE shown in Equation (
9) is widespread. The criterion used to evaluate the performance of a PID controller. The lower the ITAE, the better the PID controller [
34]
In this paper, the ITAE of the car’s lateral position and the car’ orientation angle will be used as the cost function, where is defined as equation (
10)
where:
is the difference between the desired car’s position and the actual position, and
constitutes the deviation between the target car’s orientation angle and the actual orientation angle,
T illustrate the optimisation simulation time. The loss function J will be minimised with the following constraints for each driving behaviour:
The GA applied to this controller comprises three genetic operators: selection, cross-over, and mutation.
Selection in GA is the technique of choosing individuals from the population (PID parameters). The selection was made based on fitness values derived from the fitness function J(equation 10). The probability of selection is higher for the fitter solution because it will generate more offspring. This selection can also be made randomly.
Cross-over combines two parents’ genetic information (Chromosomes) to produce a new generation (offspring or new PID parameters), which is finding the best solution. The newly generated chromosomes are supposed to be better than their parent.
A mutation prevents a population of genetic information(chromosomes) from being similar by changing a bit in a genetic sequence from its initial position. This process is used to search for the best solution.
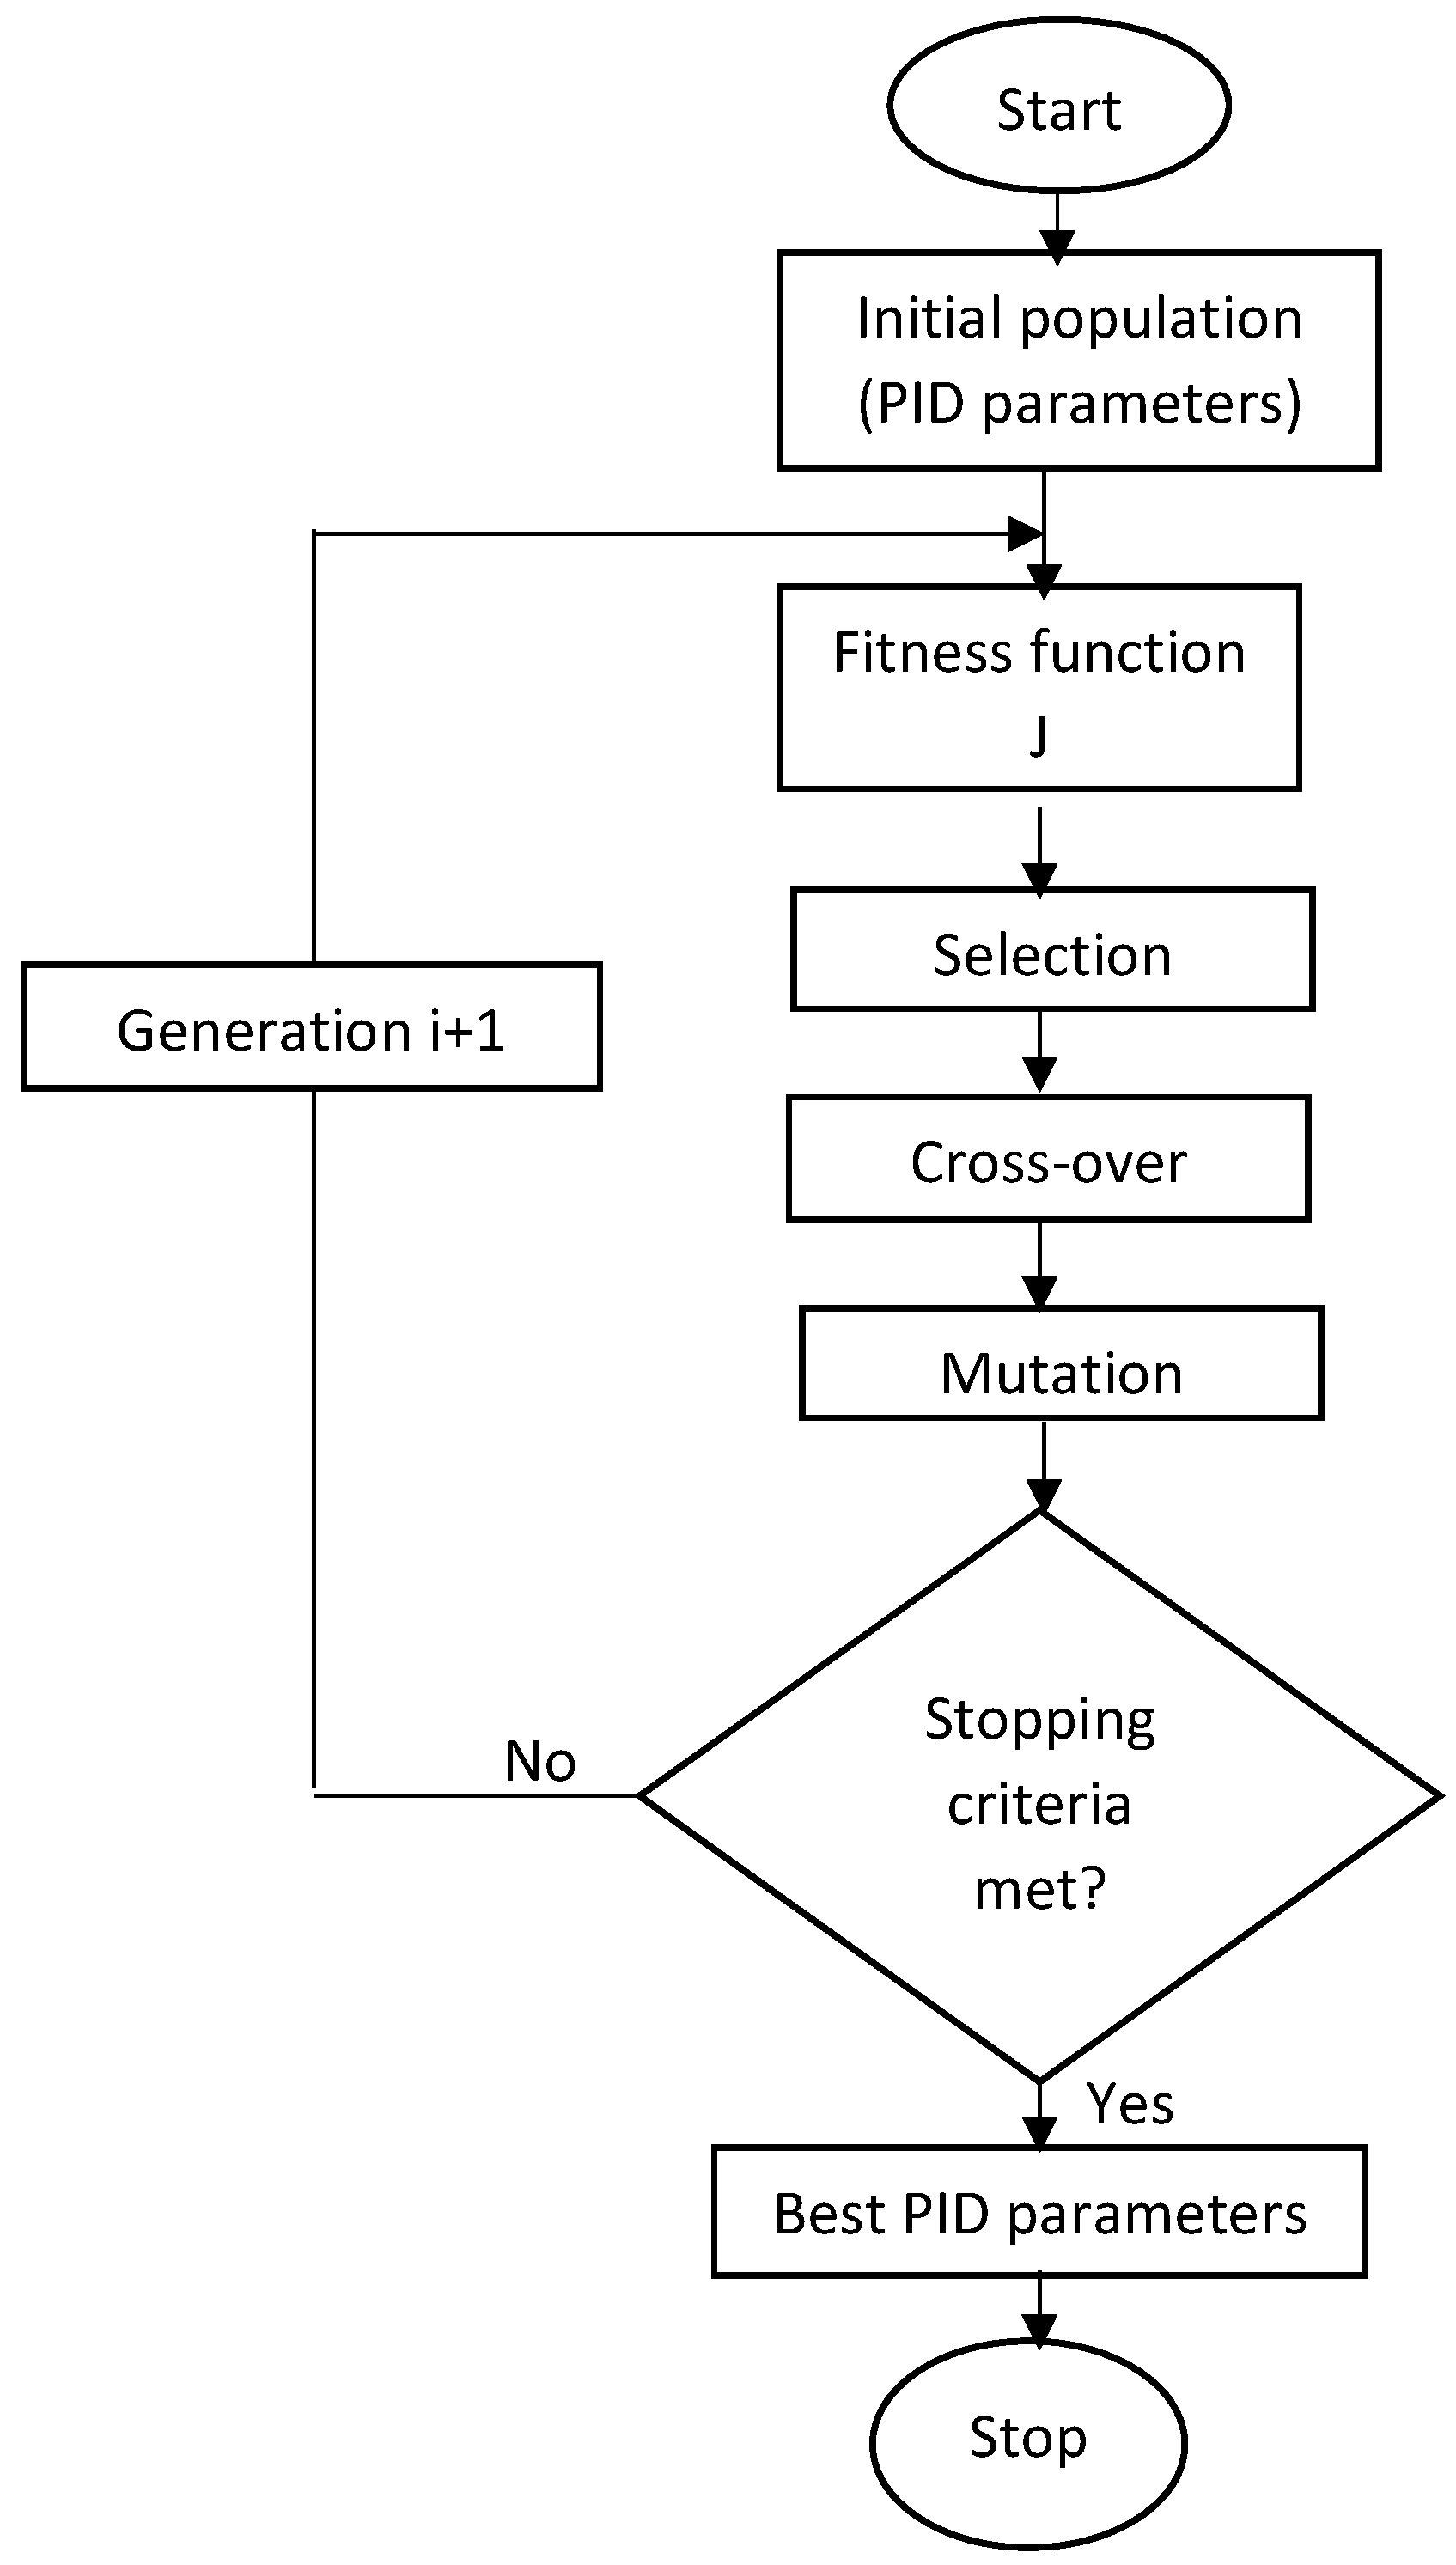
Figure 3 is the flowchart which illustrates the GA PID controller The population (PID parameters) is first initialised in the GA-PID structure. Then the GA is applied through selection, cross-over and mutation to explore the best gains of the PID controller. If the best criteria are not satisfied, the new generation will replace the old one, and the process will repeat until the stopping criteria are met.
3.3. Fuzzy-PID contoller
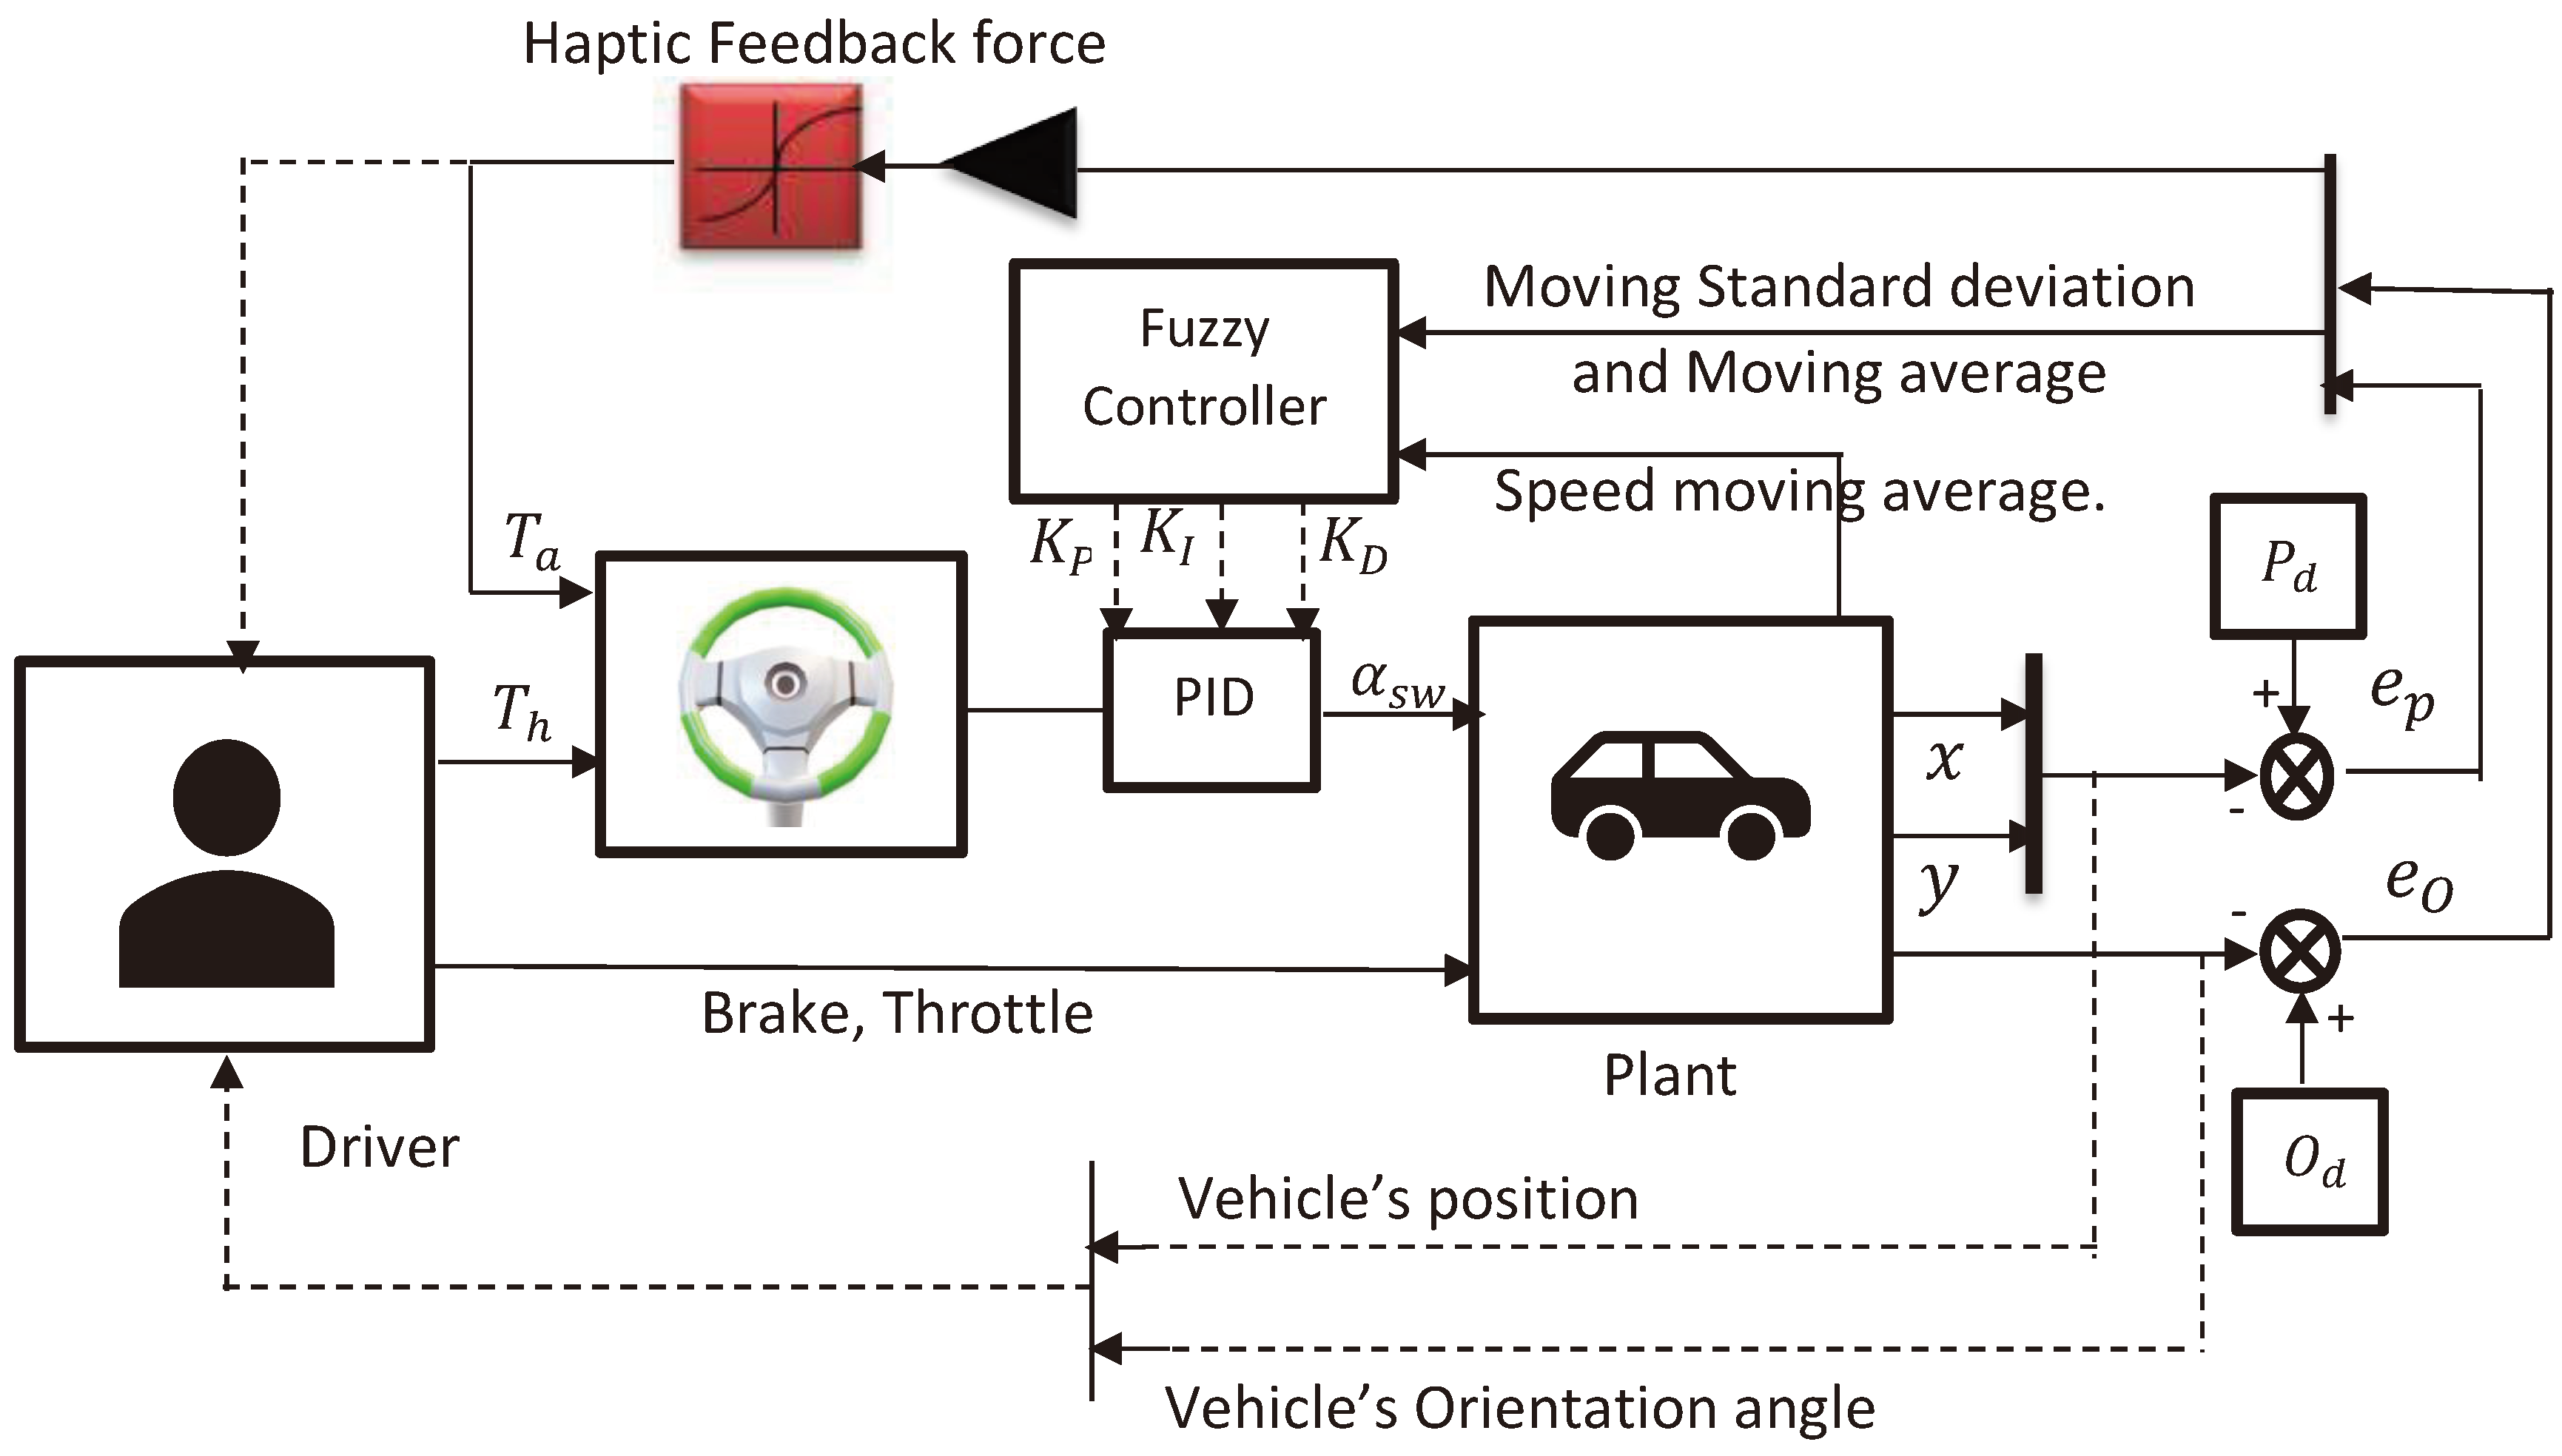
The GA-PID applied to the driver steering wheel angle enhanced the performance by reducing the car position and car orientation angle error in the lane-keeping task. However, the personality variation in different driving behaviours and the dynamic change in operating conditions (speed, position error, orientation error) make this controller-less robust. For each scenario or driving behaviour, the GA optimise the lateral position and orientation angle error based on BPNN behaviour by providing the optimal PID parameter sets. We proposed a fuzzy-PID controller where the fuzzy logic’s output membership function is defined based on optimal PID parameters obtained by the Genetic Algorithm discussed earlier for different driving scenarios. This controller integrates the fuzzy logic technique into the PID controller. The fuzzy logic part of the controller automatically tuned the PID parameters (
) at different driving behaviour and various driving profiles, such as the car’s position error, the car’s orientation angle error, the car speed with haptic feedback forces to improve its robustness (flexibility and compatibility). This fuzzy-PID controller aims to account for the imprecision and uncertainties in different driving behaviours and profiles.
Figure 4 is the block diagram illustrating the proposed Fuzzy-PID compensator. The steering wheel angle (
) is directly affected when the PID gains are consistently adjusted using the online fuzzy logic rules; therefore, it will impact the car’s lateral displacement and orientation angle. The human driver in this diagram replaced the BPNN that was trained using the data of the same driver in
Section 2.
The fundamental structure of the fuzzy logic controller is shown in
Figure 5.
The knowledge base was acquired after the parameters of the PID parameter sets were optimised by the GA.
3.3.1. Fuzzification
Fuzzification is the action of converting numerical input data into linguistic terms [
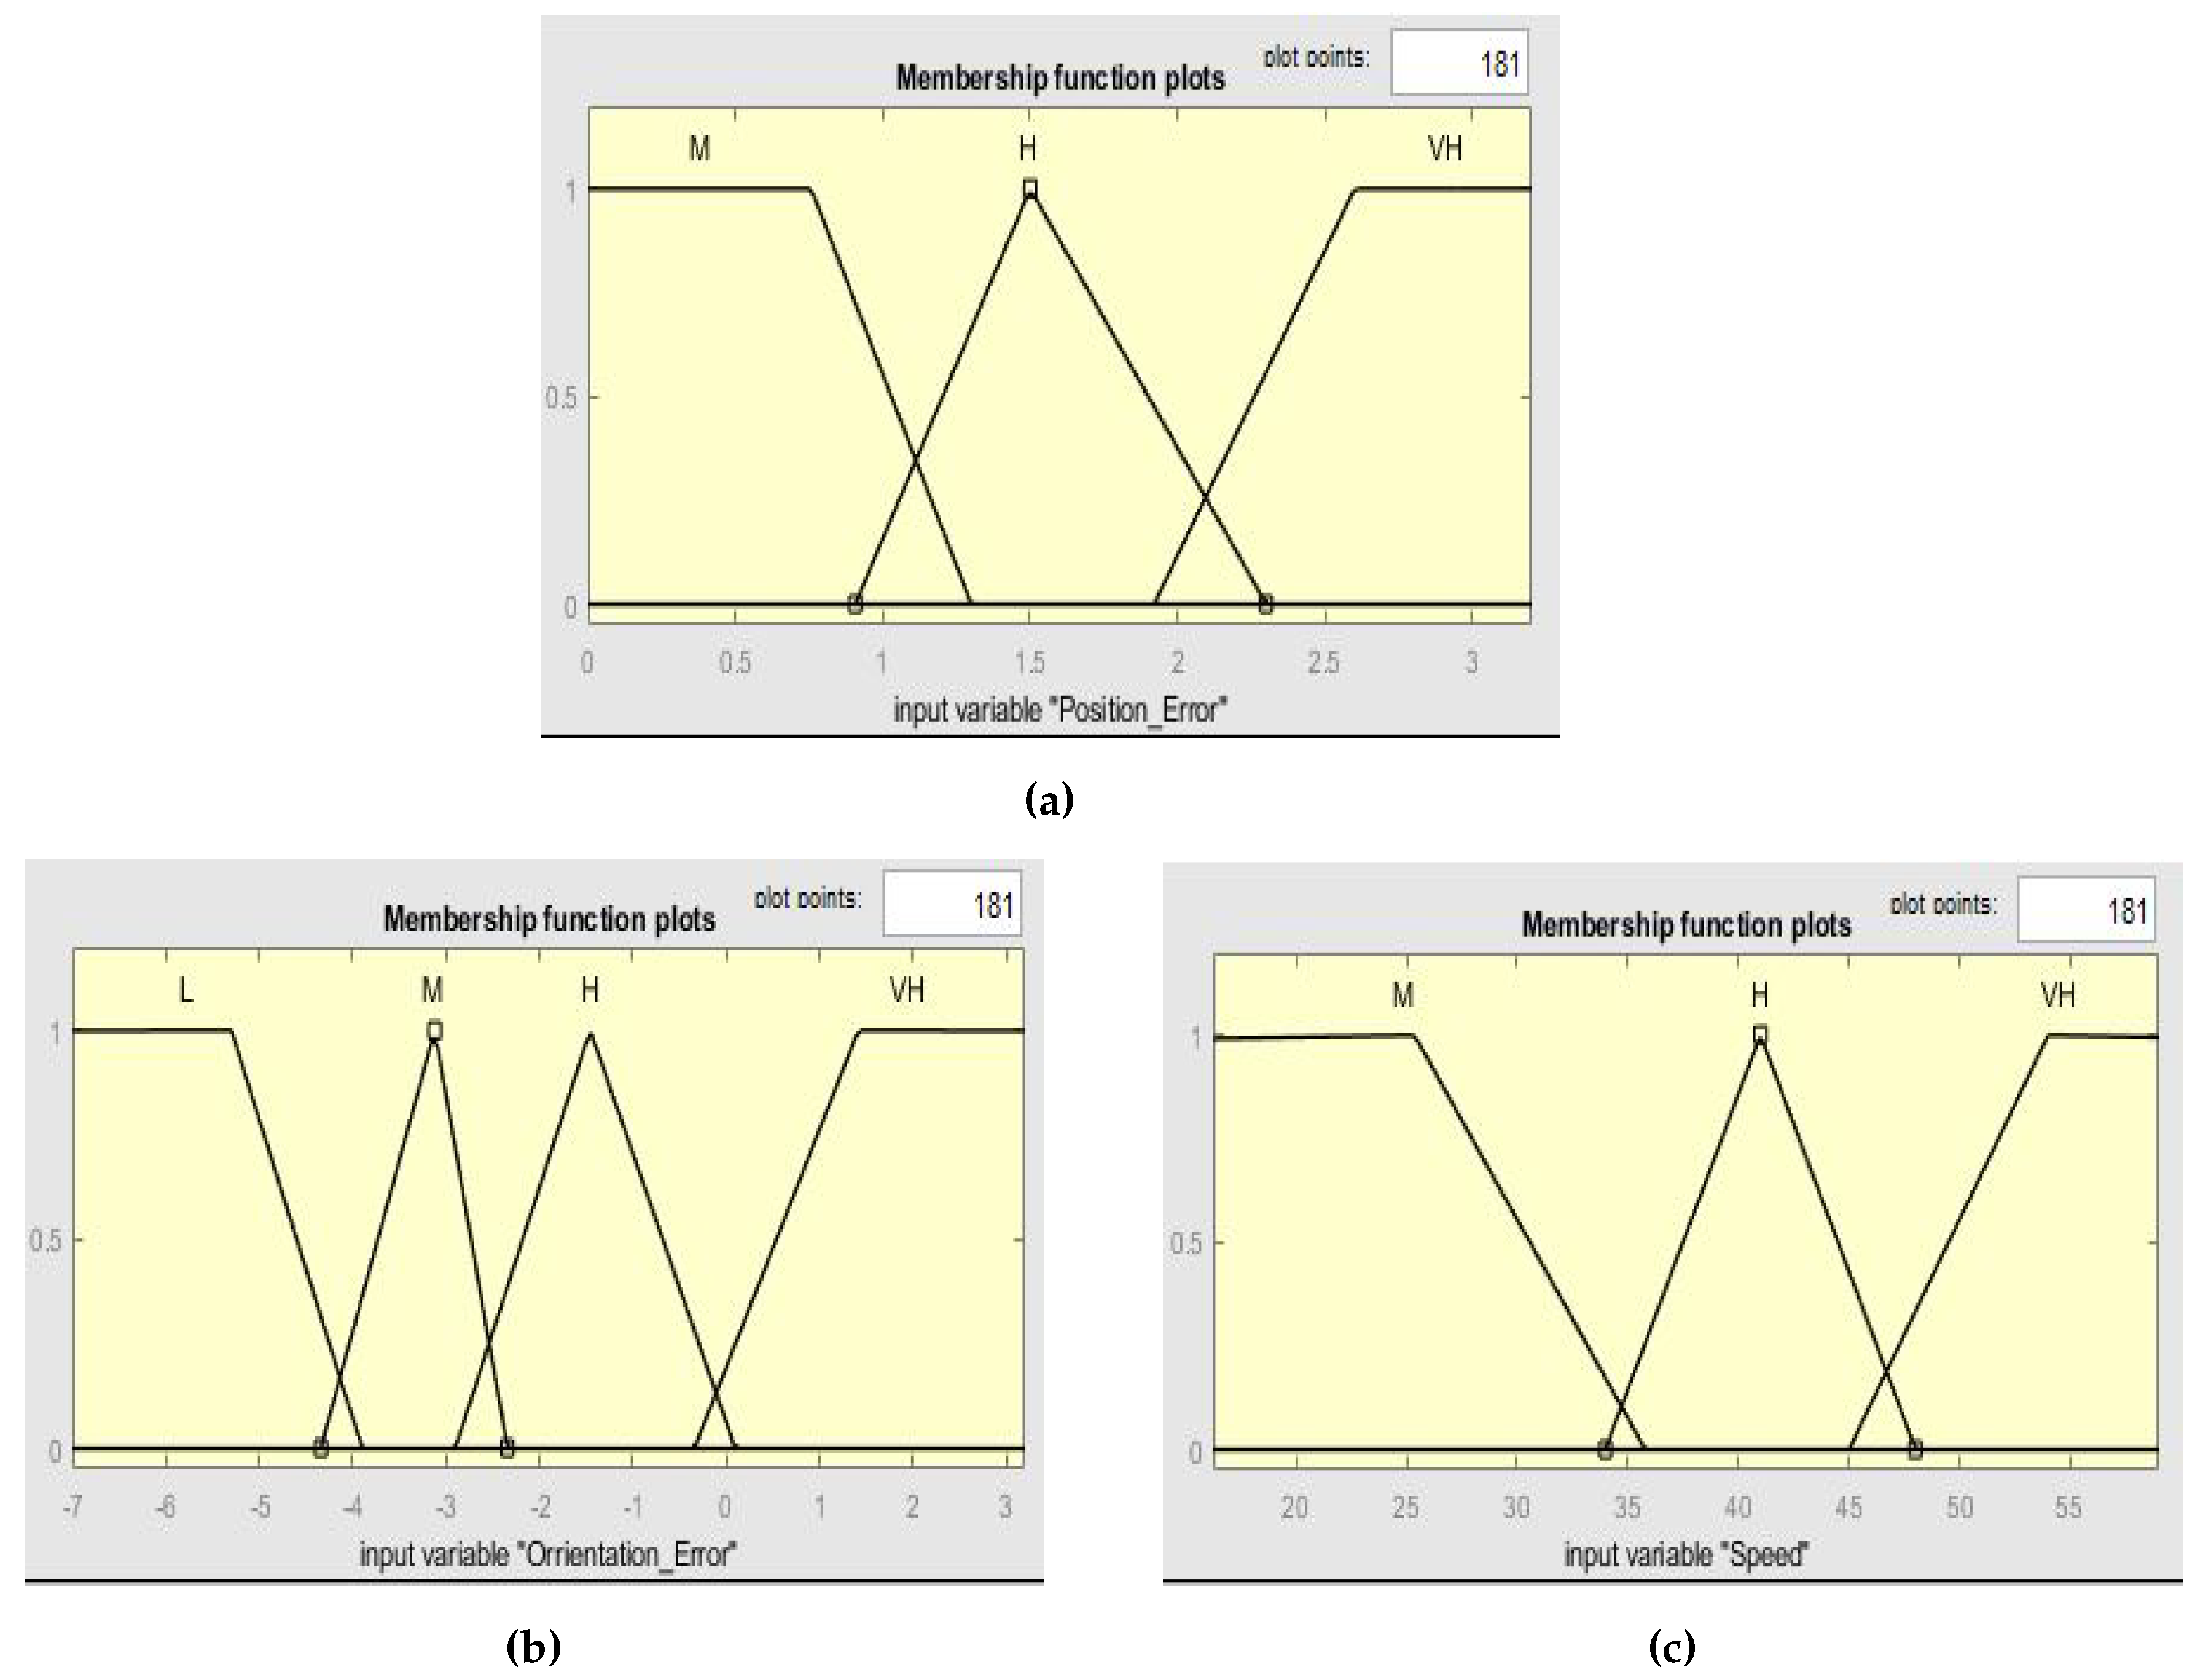
37]. The car’s lateral position error, orientation angle error, and speed are driving profiles used as the input to the fuzzy controller, representing the membership function. Each membership is a fuzzy set which is divided between three (3) and four(4) fuzzy subsets given in the linguistic terms (
L,
M,
H,
). The fuzzy subsets of this controller were selected based on the car’s lateral position error, orientation angle error and the car’s speed analysis derived from various driving behaviours or scenarios. This input membership is shown in
Figure 6.
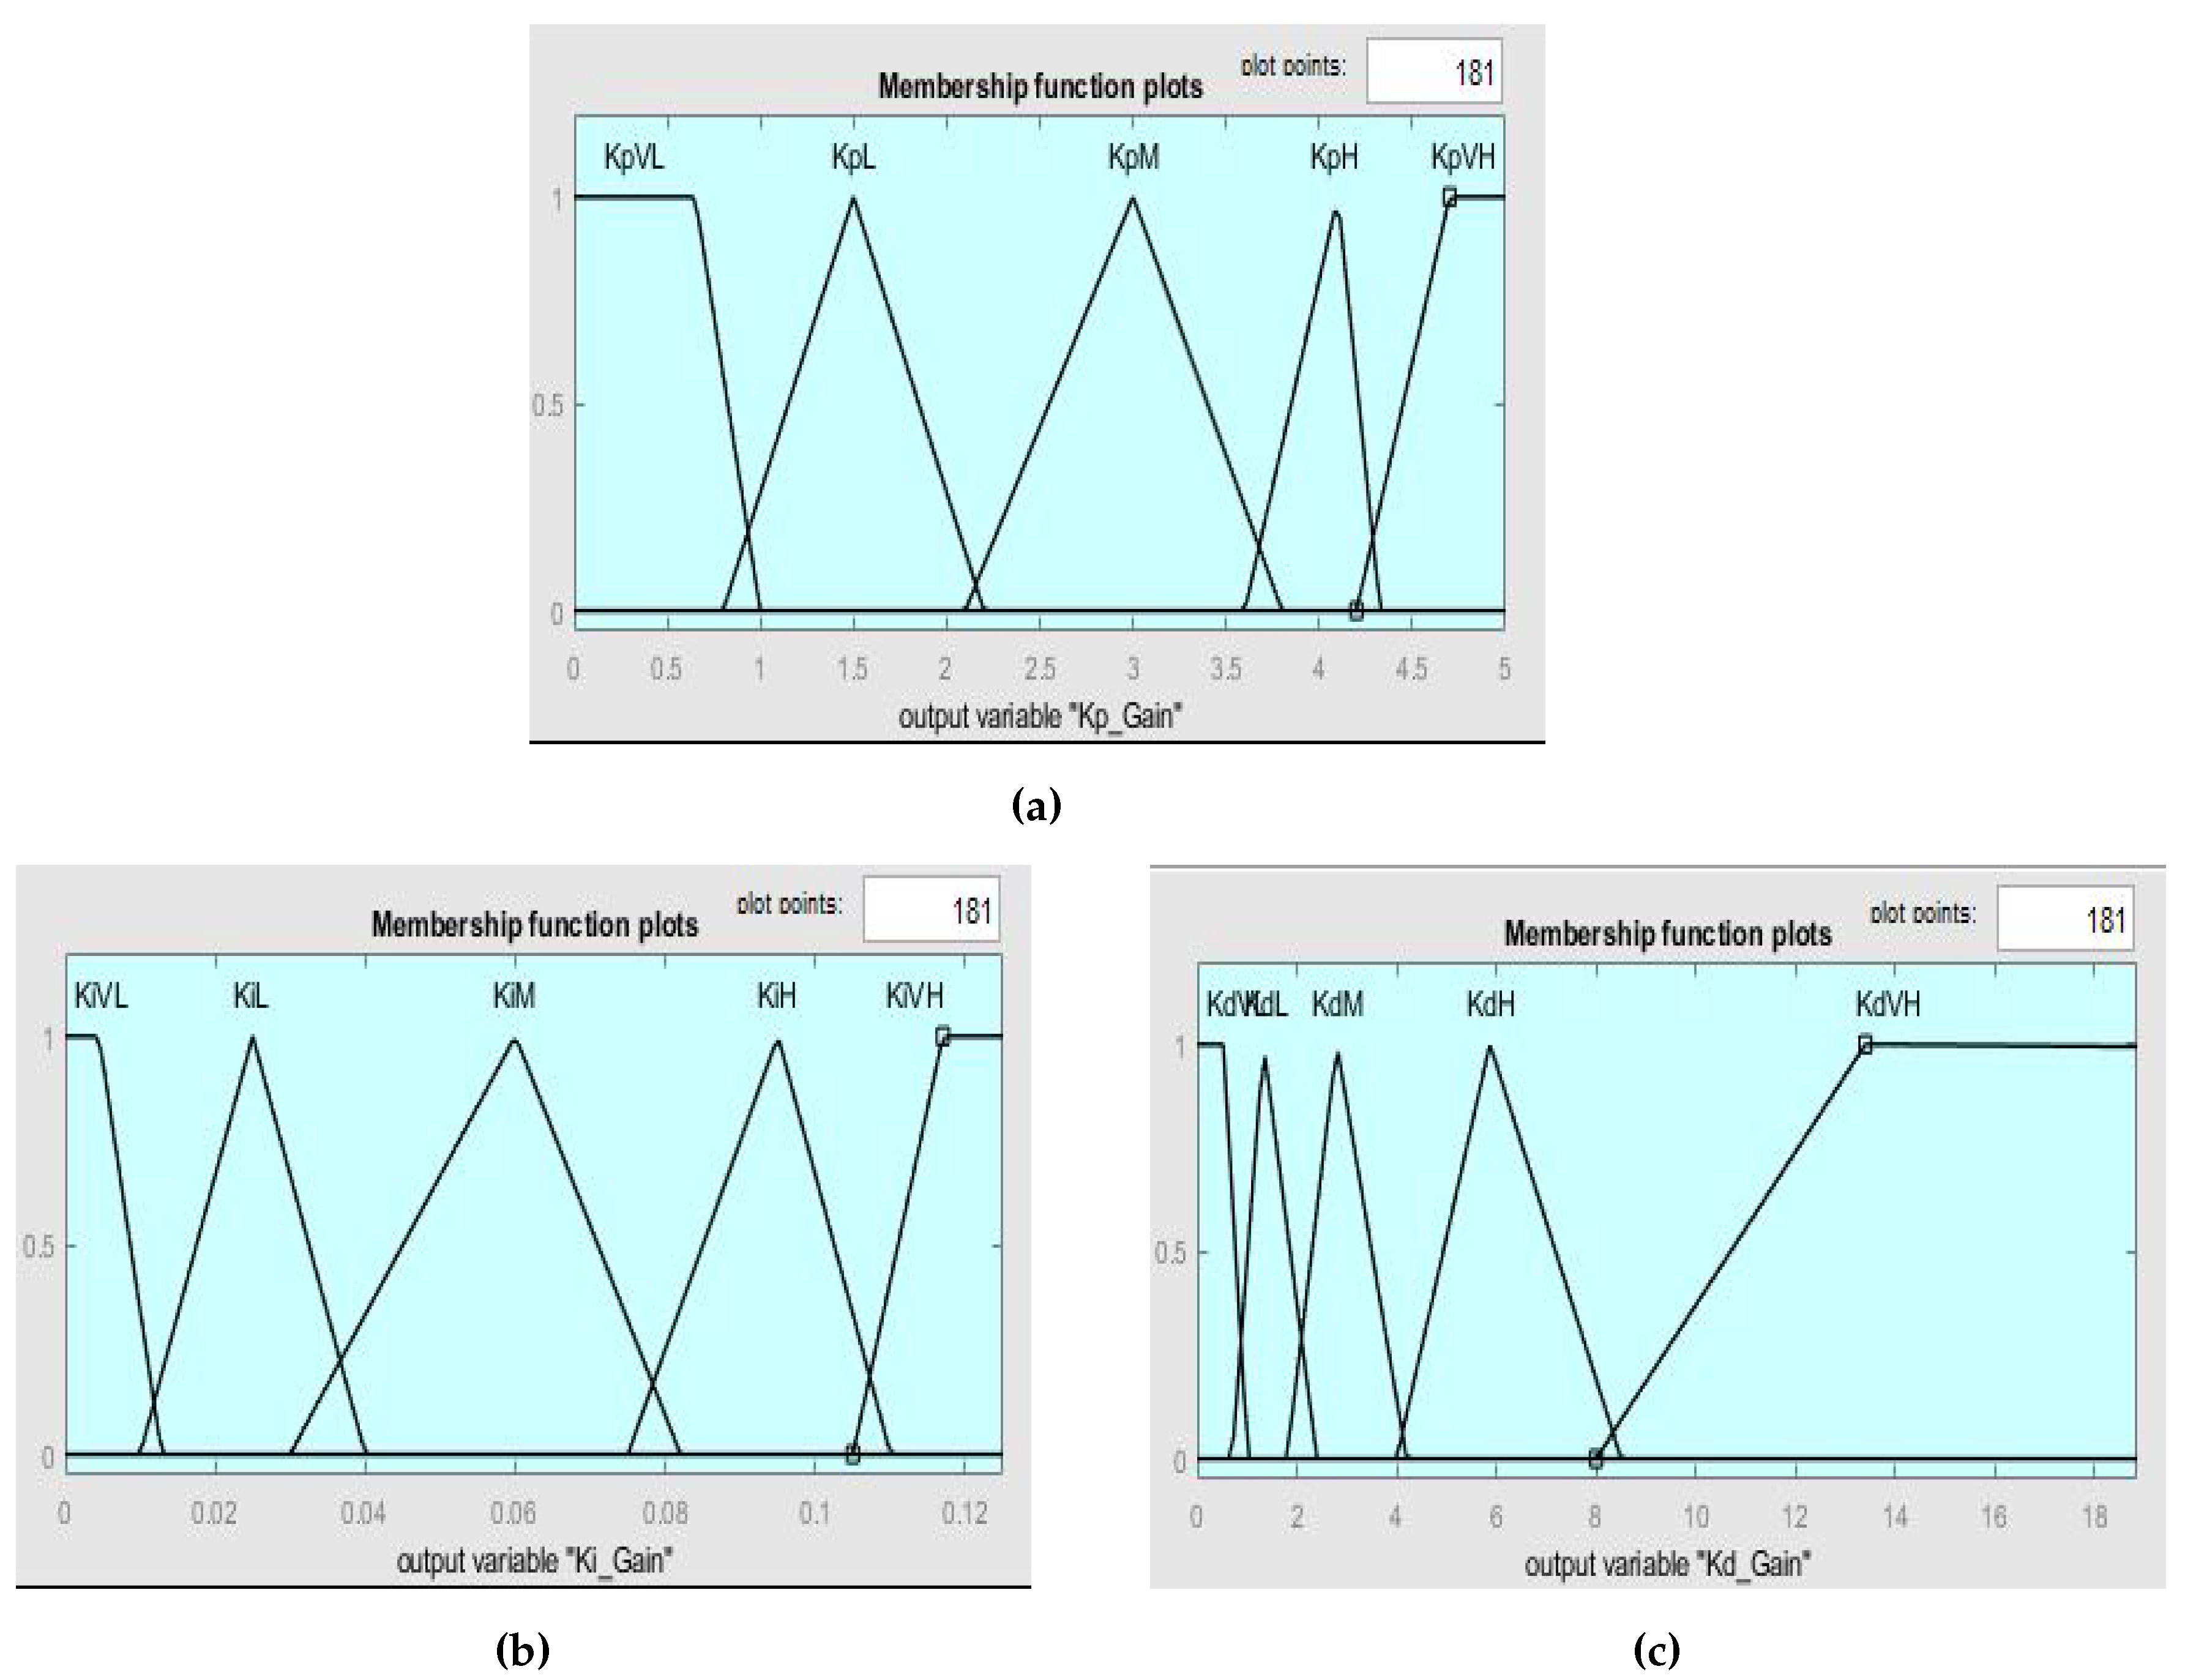
The output variables of the Fuzzy-PID are the PID parameters. The output membership function of the fuzzy controller is made of the PID parameters (
), and these parameters were automatically calculated according to the driving scenarios or driving behaviour optimised by the GA. Each parameter is defined by a fuzzy set divided into four (5) fuzzy subsets with different linguistic terms (
,
,
,
,
) as indicated in
Figure 7. The output and the input of the system have a linguistic relationship. The variation of these PID parameters set from one driving style to another is better to provide the compatibility and flexibility of the controller.
3.3.2. Fuzzy Rules Base
The fuzzy rule base in the fuzzy controller is used to model the interaction between the input and output fuzzy set by using an IF-THEN structure. The output fuzzy variables (PID parameters
) are determined by the input membership function(
,
, speed) by fuzzy rule IF THEN. A fuzzy rule base is given in the following form.
where:
is the
fuzzy rule;
are the inputs fuzzy subset of the car’s lateral position error, the car’s orientation angle error and the fuzzy subset of the vehicle’s speed, respectively
represent the fuzzy output control variable of the proportional gain(
), integral(
) and derivative gains(
).
In this process, the Mamdani [
38] fuzzy inference system is used to map input membership to output because it can interpret linguistic terms used, is easily integrated, and can control uncertainties and non-linear systems. The fuzzy logic uses the linguistic representation of the input fuzzy subset and integrates the fuzzy rules to produce the output linguistic variable based on the respective fuzzy subset values as presented in
Table 1. Each driving behaviour has its fuzzy rule based on the changes in car position error, orientation angle error and speed. This rule base is used to produce the best driving response.
3.3.3. Defuzzification
In this study, defuzzification is the technique that maps the fuzzy subset (
) of the system and the appropriate membership degree to provide the PID parameters result in a crisp value. Based on the study developed in a fuzzy control system by Chen et al. [
39], the equation illustrating the mathematical formula that produces the final output value by defuzzification was derived in this study.
where:
are respectively the membership values of the subset
,
and
;
represents the single variables (
) of fuzzy output of
4. Experiments Set up and driving simulator
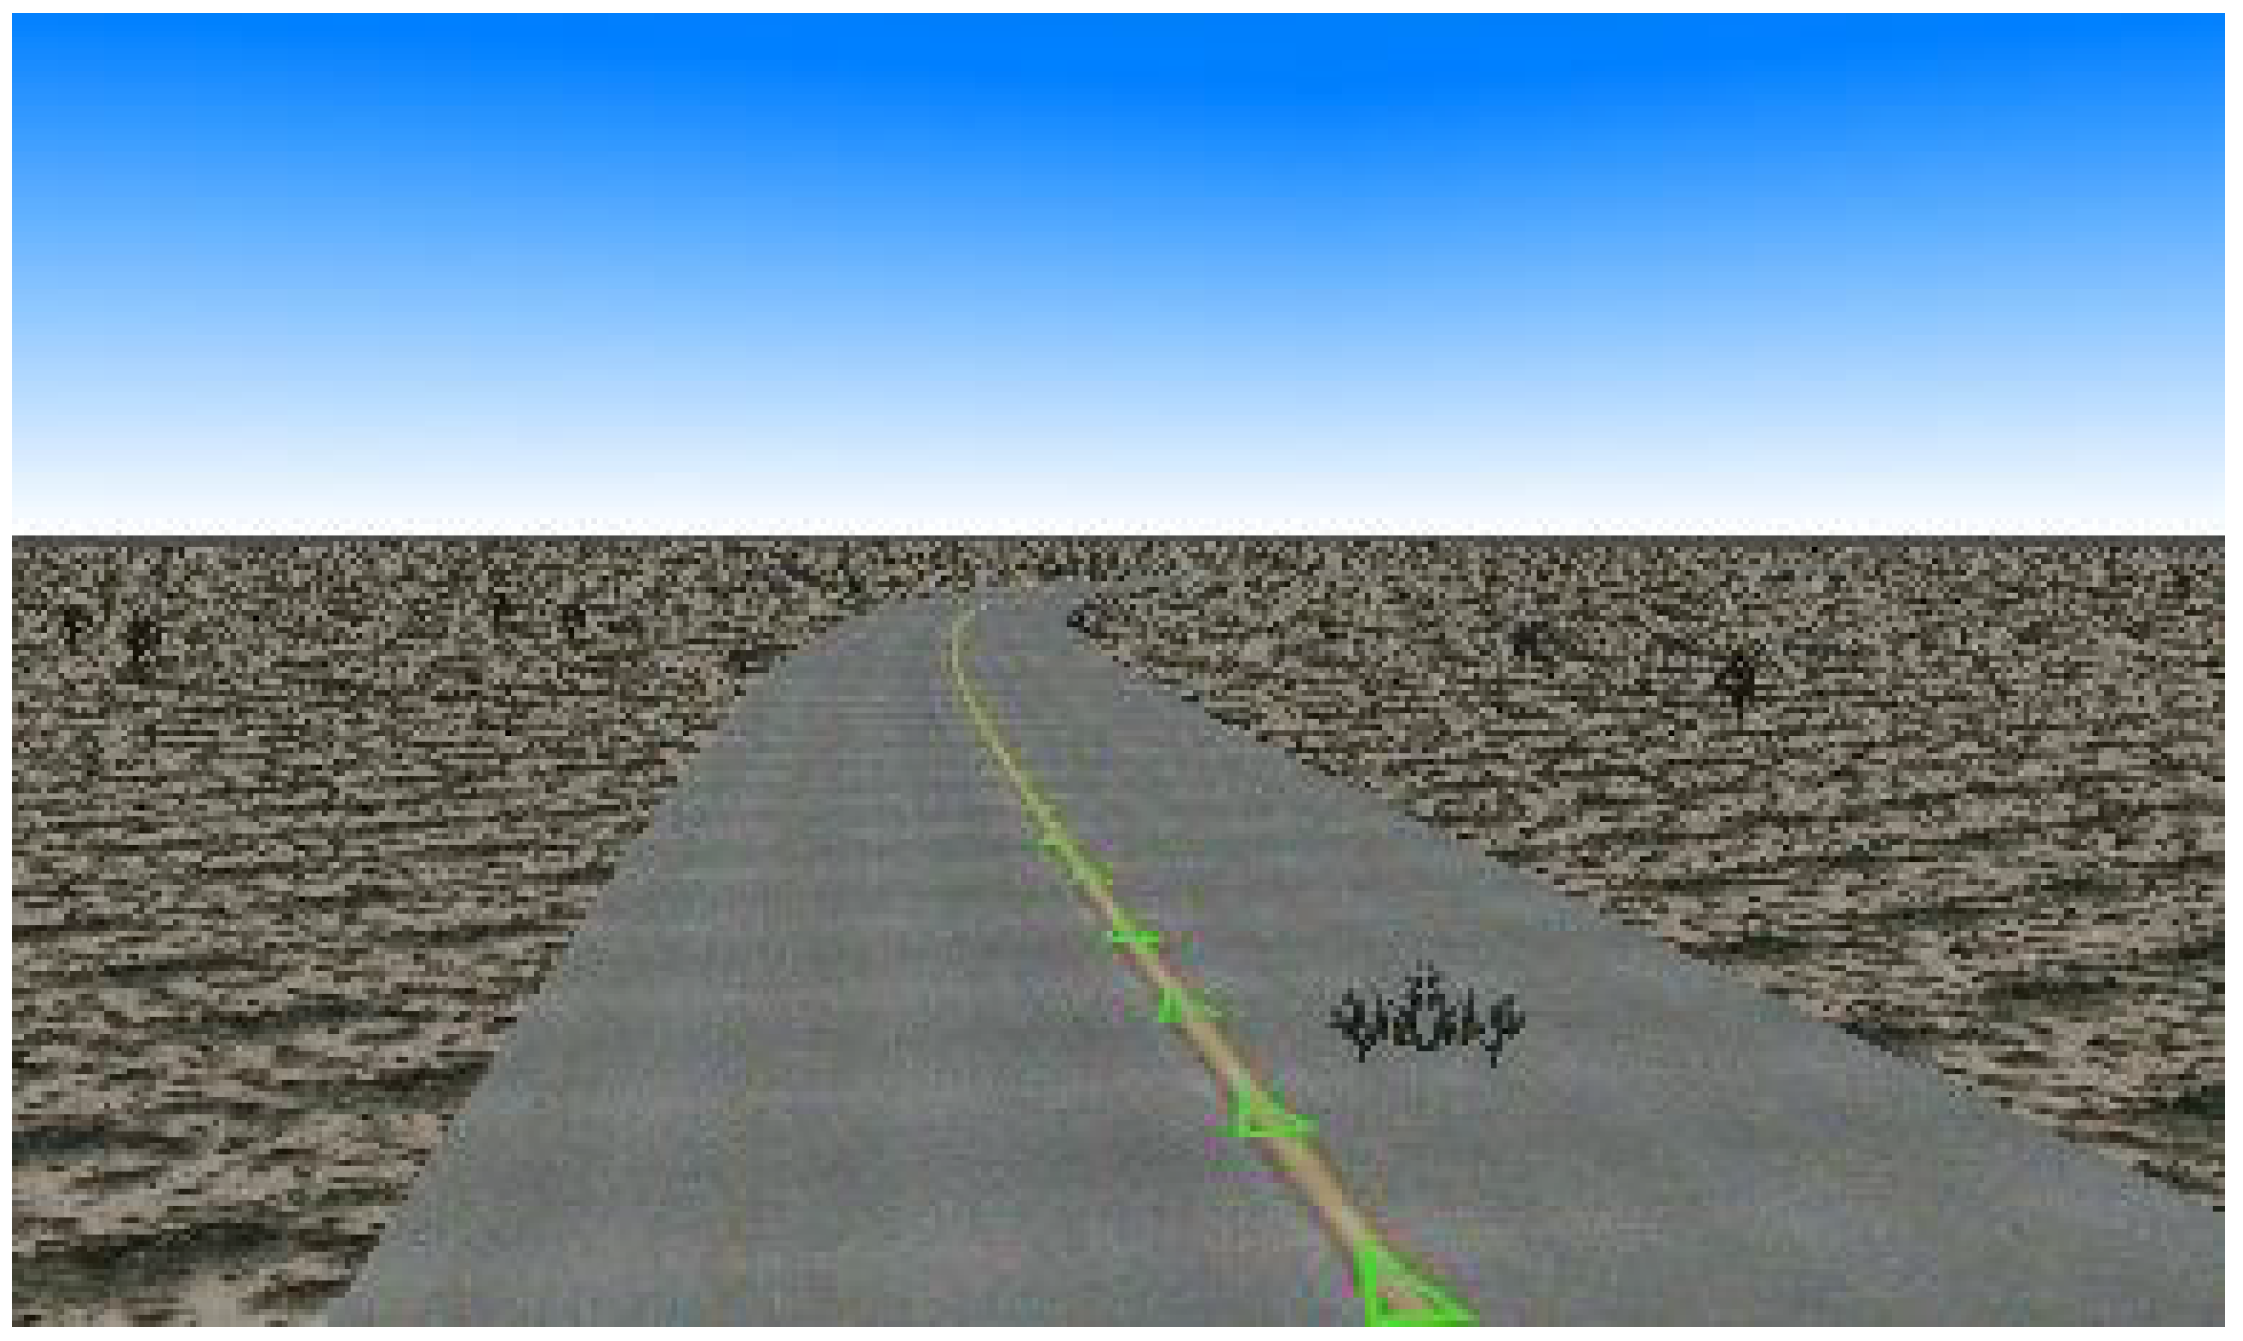
This work used a driving simulator, and two experiments took place. In the first experiment, five drivers, four males and one female aged between 23 and 34 participated in two scenarios. The data collected were used to map the driving behaviours, contributing to the design of optimal GA-PID parameters offline and, later, the design of the proposed Fuzzy-PID controller. In the second experiment, seven (7) subjects participated in the same driving simulator aged between 19-34 with five males and two females. All these drivers had driver’s licenses with different years of experience. In the first scenario, the driver was asked to drive the vehicle by following a centre line(green line as displayed in
Figure 8 with a haptic feedback system and without any controller.
After the first scenario, the same drivers were asked to drive the car by following a given centre line, the centre line with steering wheel haptic feedback and a data-driven controller.
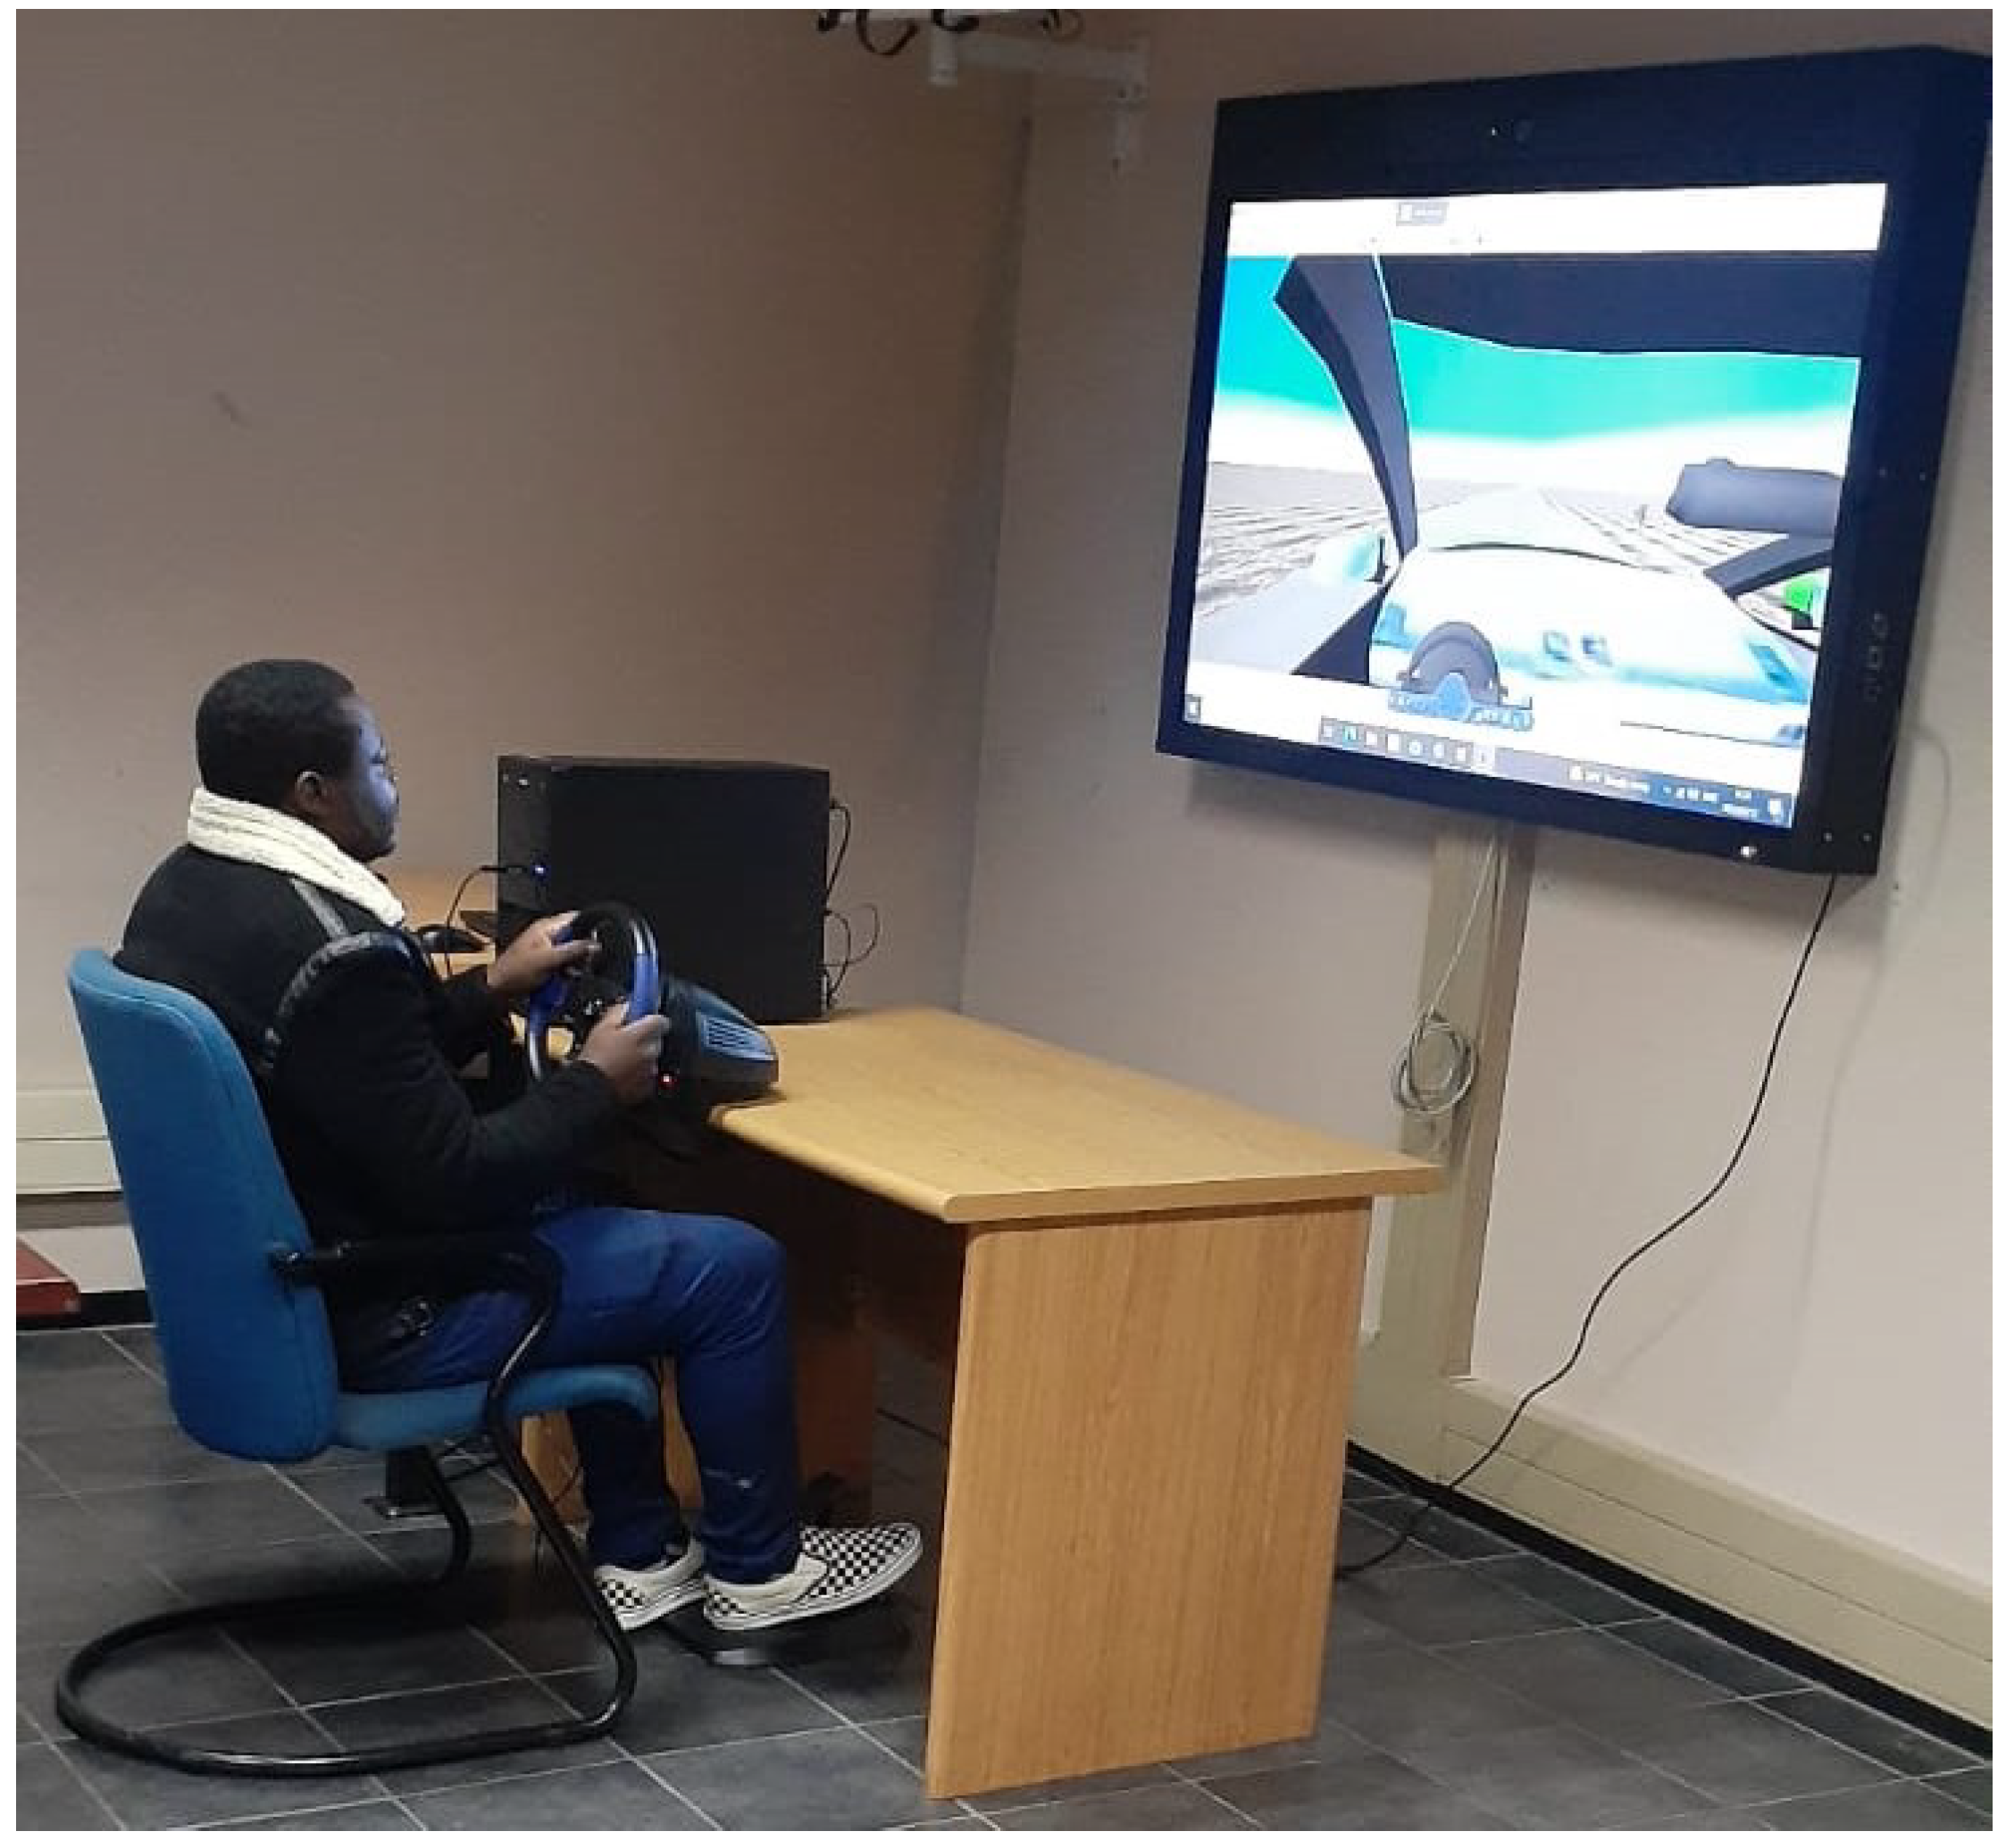
Figure 9 illustrates the participant driving in a complete simulator set.
4.1. Driving simulator
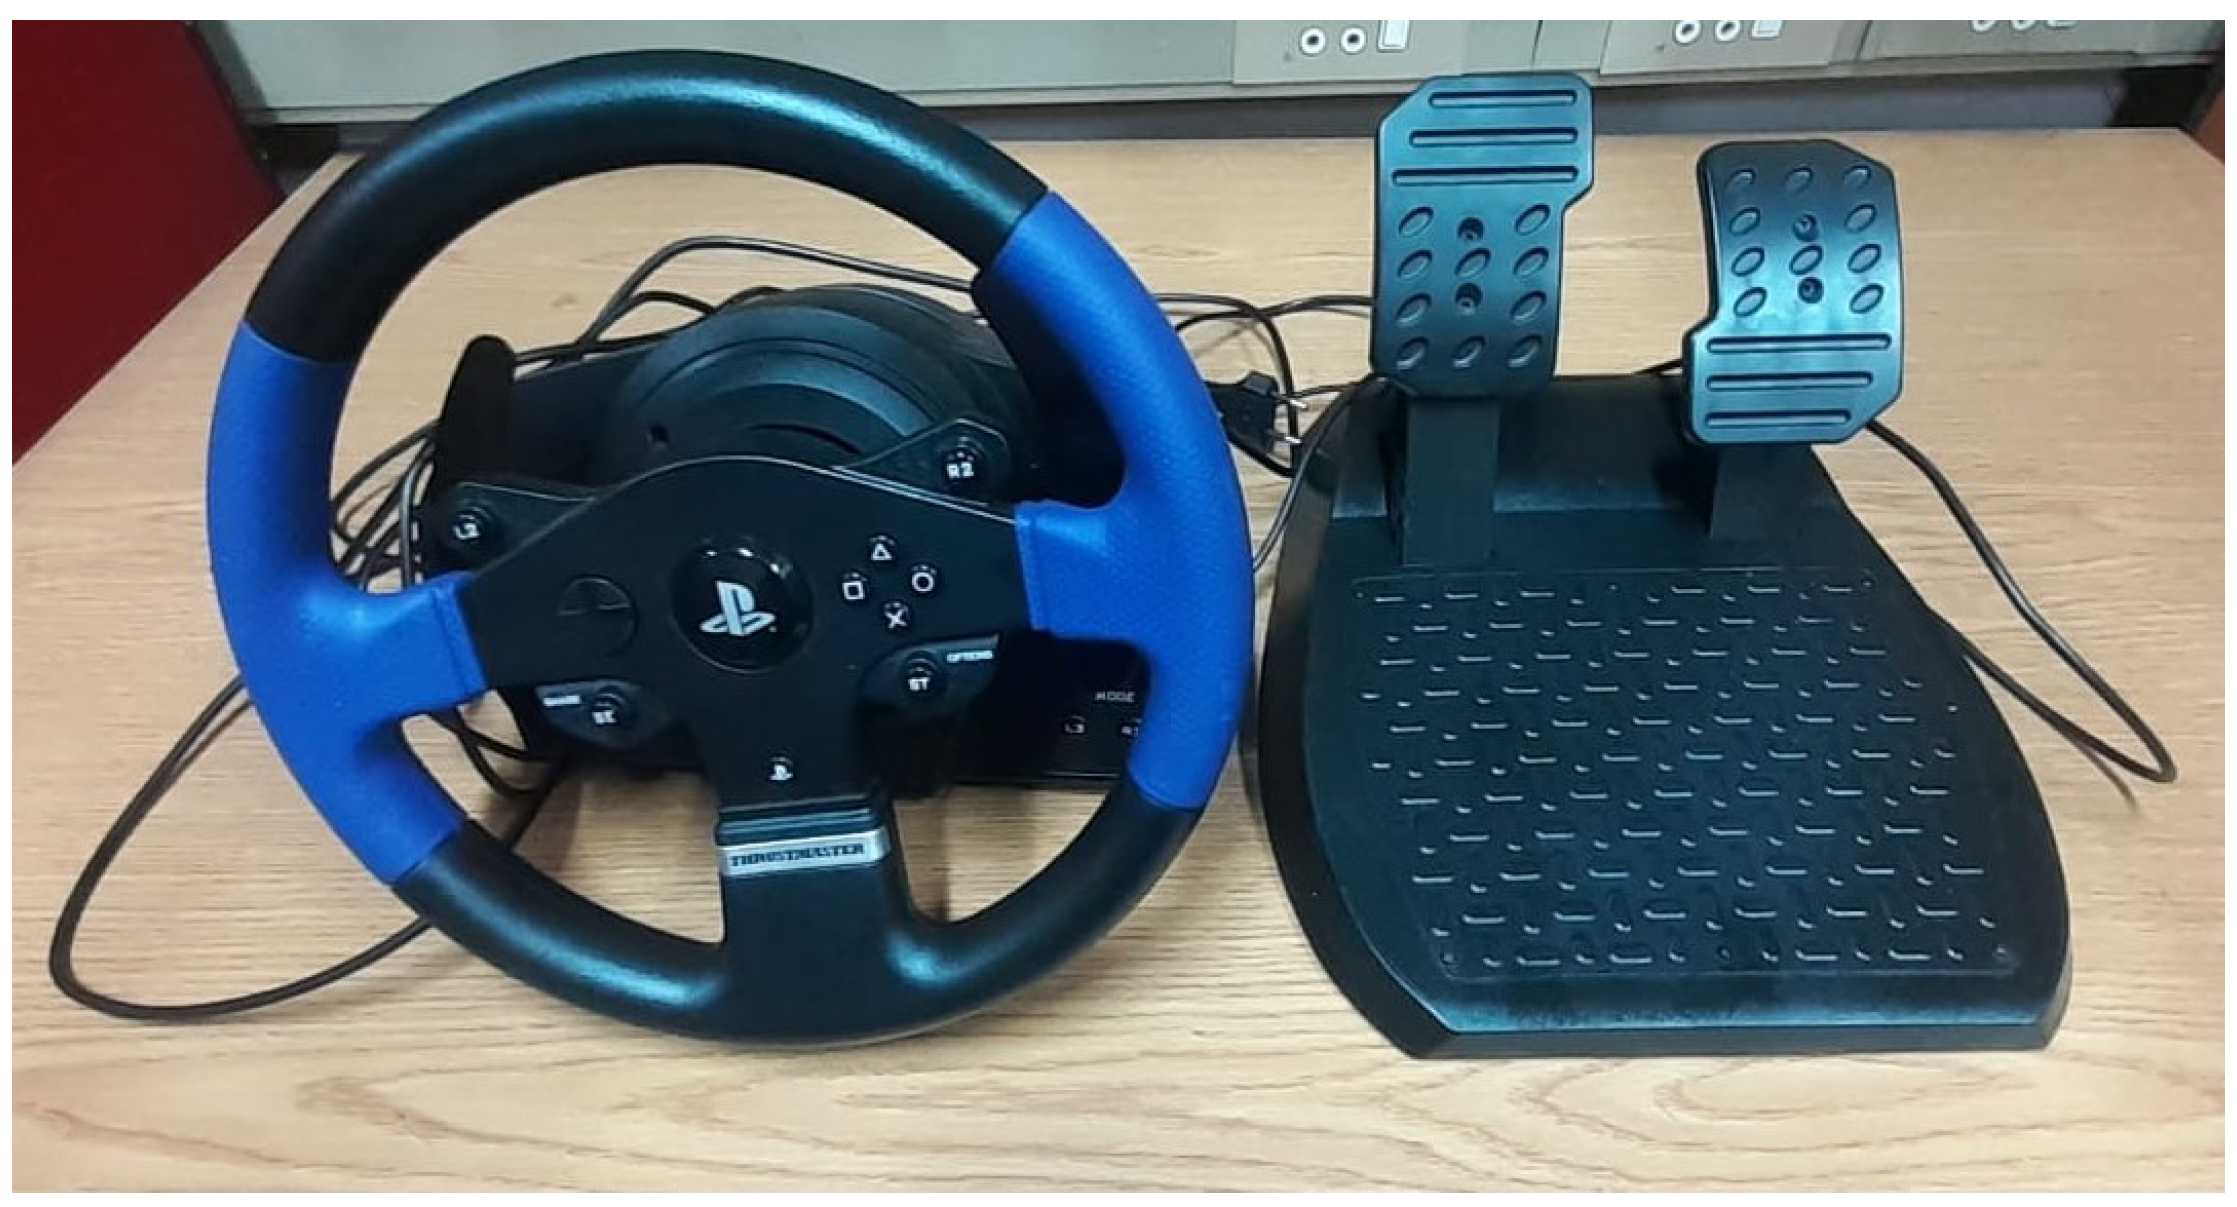
The stationary-based driving simulator was monitored by a computer and made of two key components such as a haptic feedback steering wheel(T150) force feedback mounted on a tabletop with two pedals(accelerator and brake) as shown in
Figure 10
The driving scene was displayed on an LCD monitor (resolution of 3840x2160), and the driver view option was selected as shown in
Figure 11. The car driving simulator and environment used Matlab Simulink, and the virtual reality of Matlab Simulink ran on Windows 10.
4.2. Computation Resources
The driving simulator was controlled by a haptic feedback steering wheel (T150) through an Intel core (TM) i5 10400 Dell computer with a 64-bit operating system, a processor of 2.90Hz, and a RAM of 8GB. This gives the drivers a simple haptic steering wheel dynamic sensation.
5. Simulation and results
5.1. Driving behaviour using BPNN
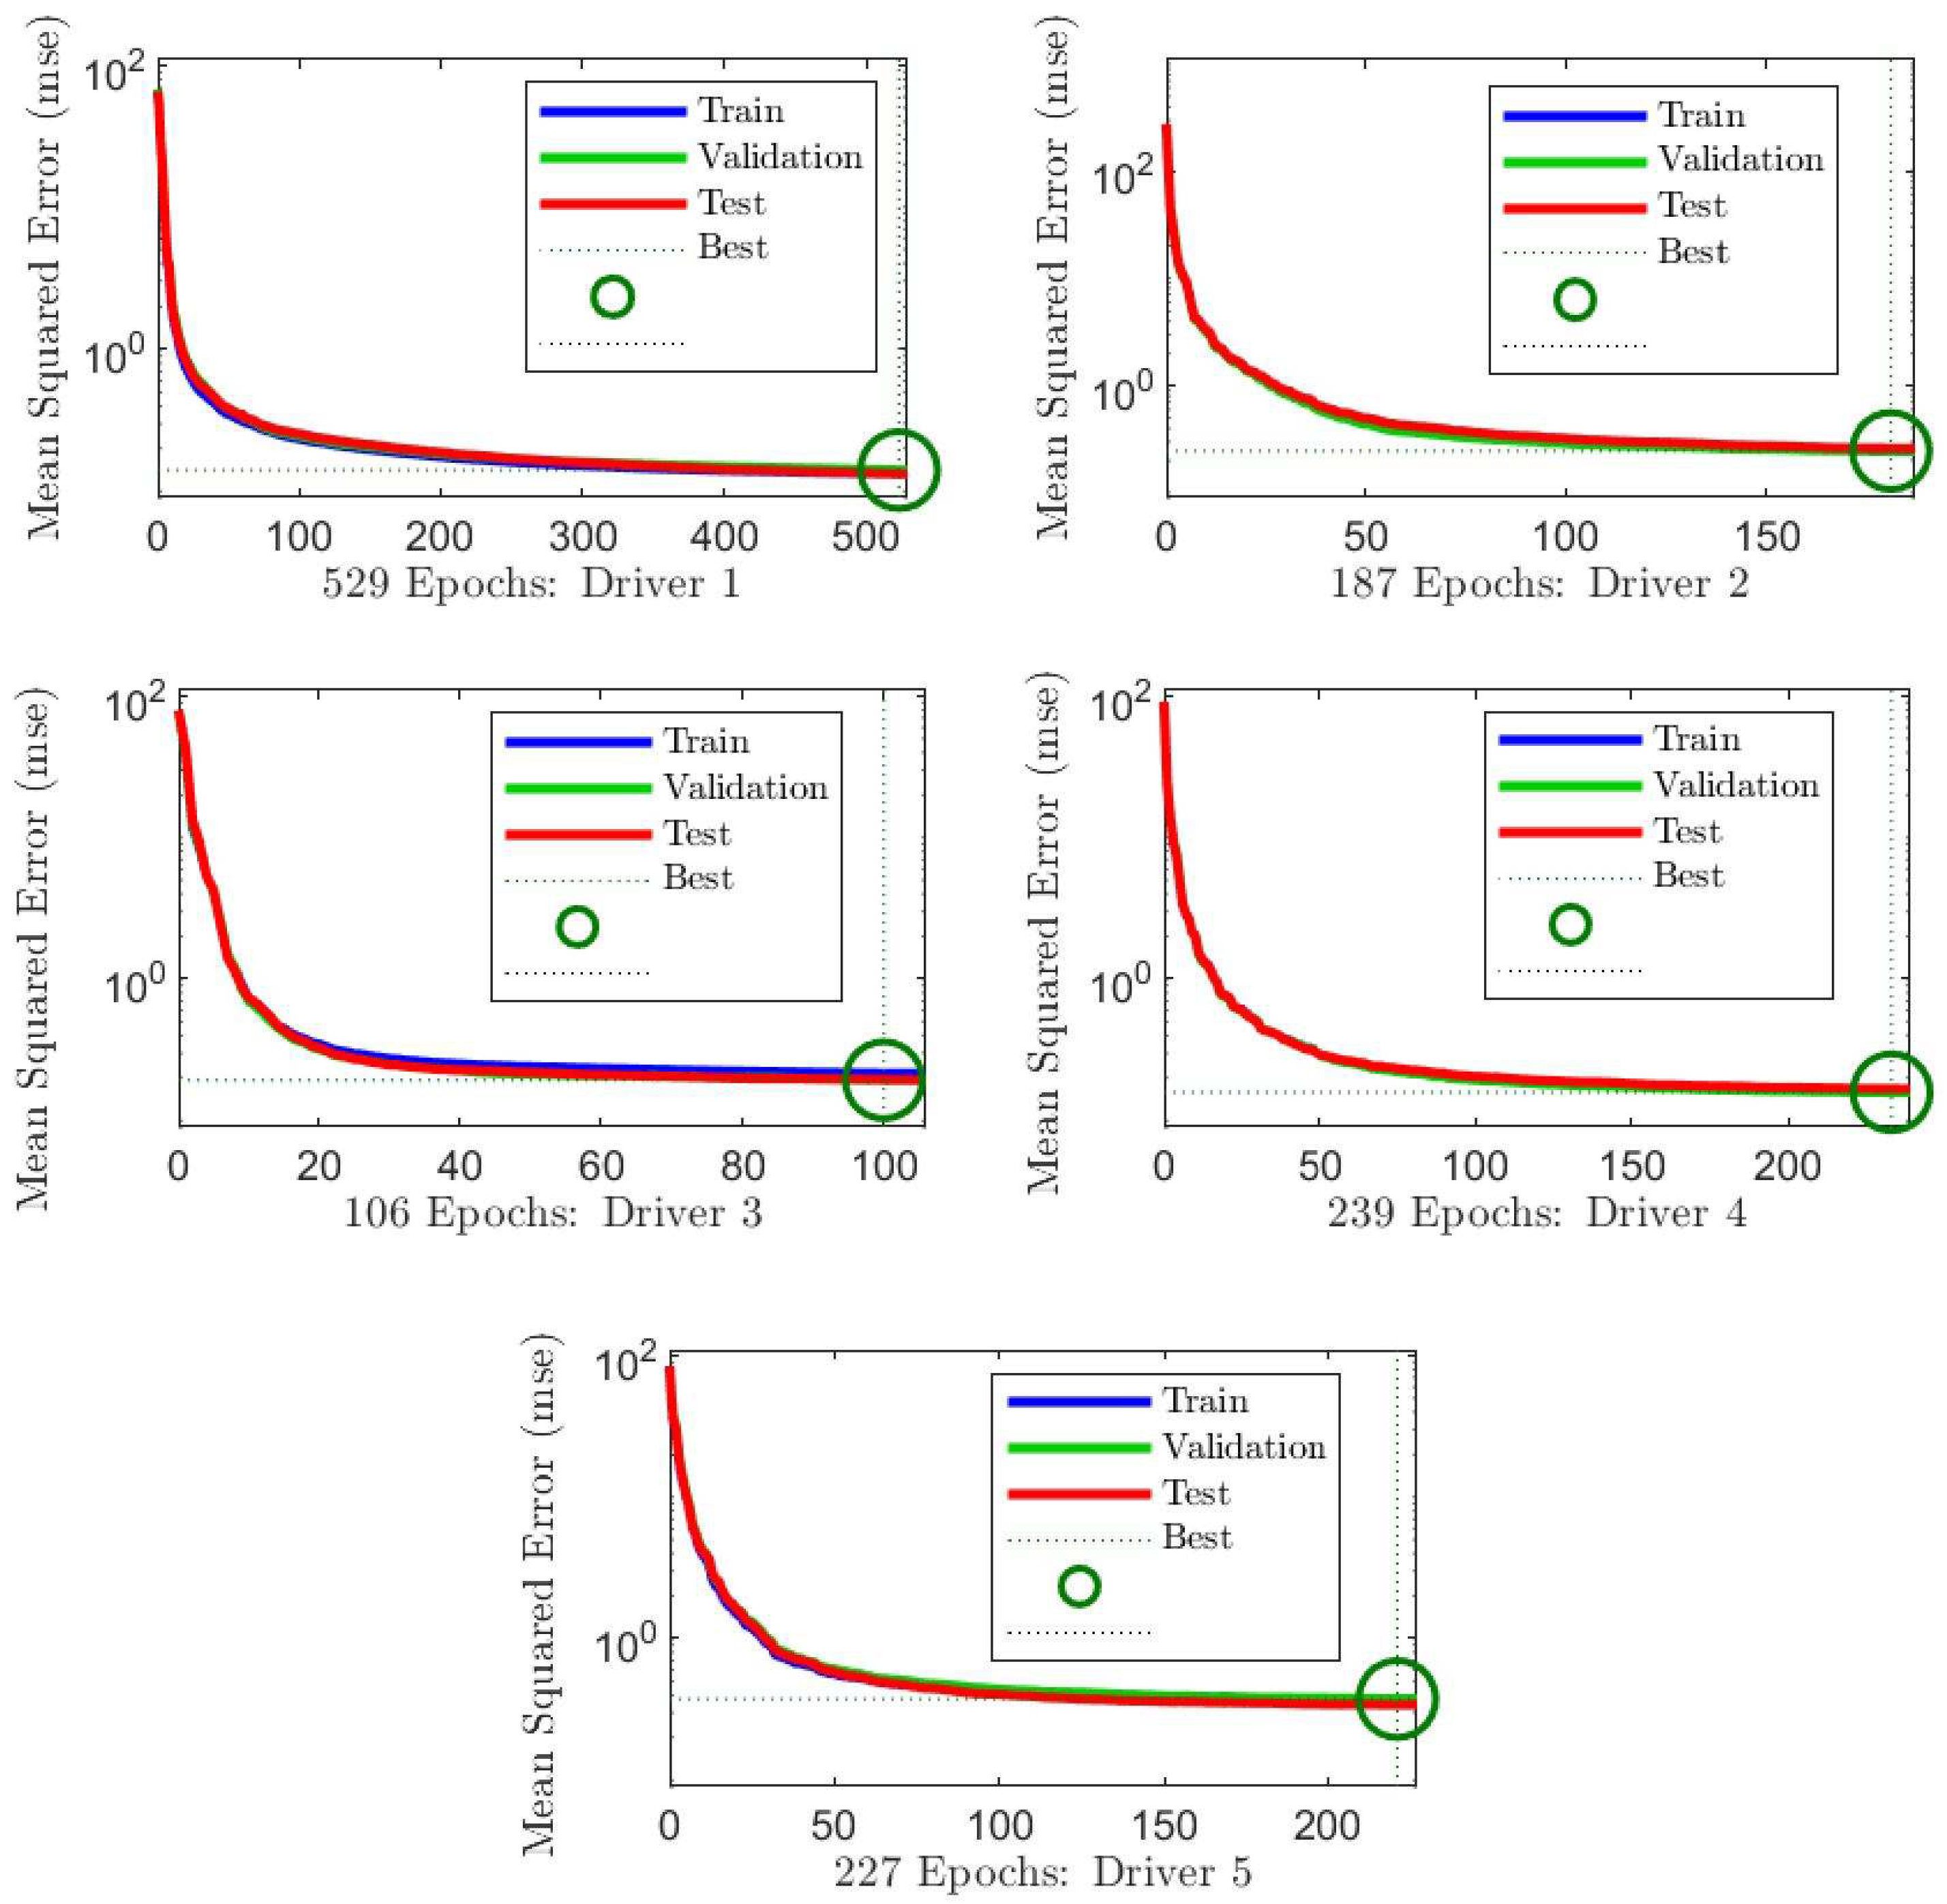
After conducting the first experiment, the real data was collected through Matlab Simulink. Different driving behaviours were mapped offline using the BPNN tool in Matlab.the simulated results are presented in the followings graph(
Figure 12) and
Table 2.
Table 2 illustrates the performance analysis of BPN for different driving behaviour as the curve is presented in
Figure 12. Due to the Z-score normalised data, the BPN has a low MSE (Mean Square Error)for all the driving behaviour, which fluctuated between 0.14 and 0.37; therefore, it is accurate. They all expressed an excellent regression.
5.1.1. Offline GA-PID Parameters Results
After mapping different driving behaviours, the GA-PID was simulated, and the results providing the best Pid parameters after optimising the ITAE loss function are shown in
Table 3.
Table 3 presents various optimised PID parameters for different driving behaviour.
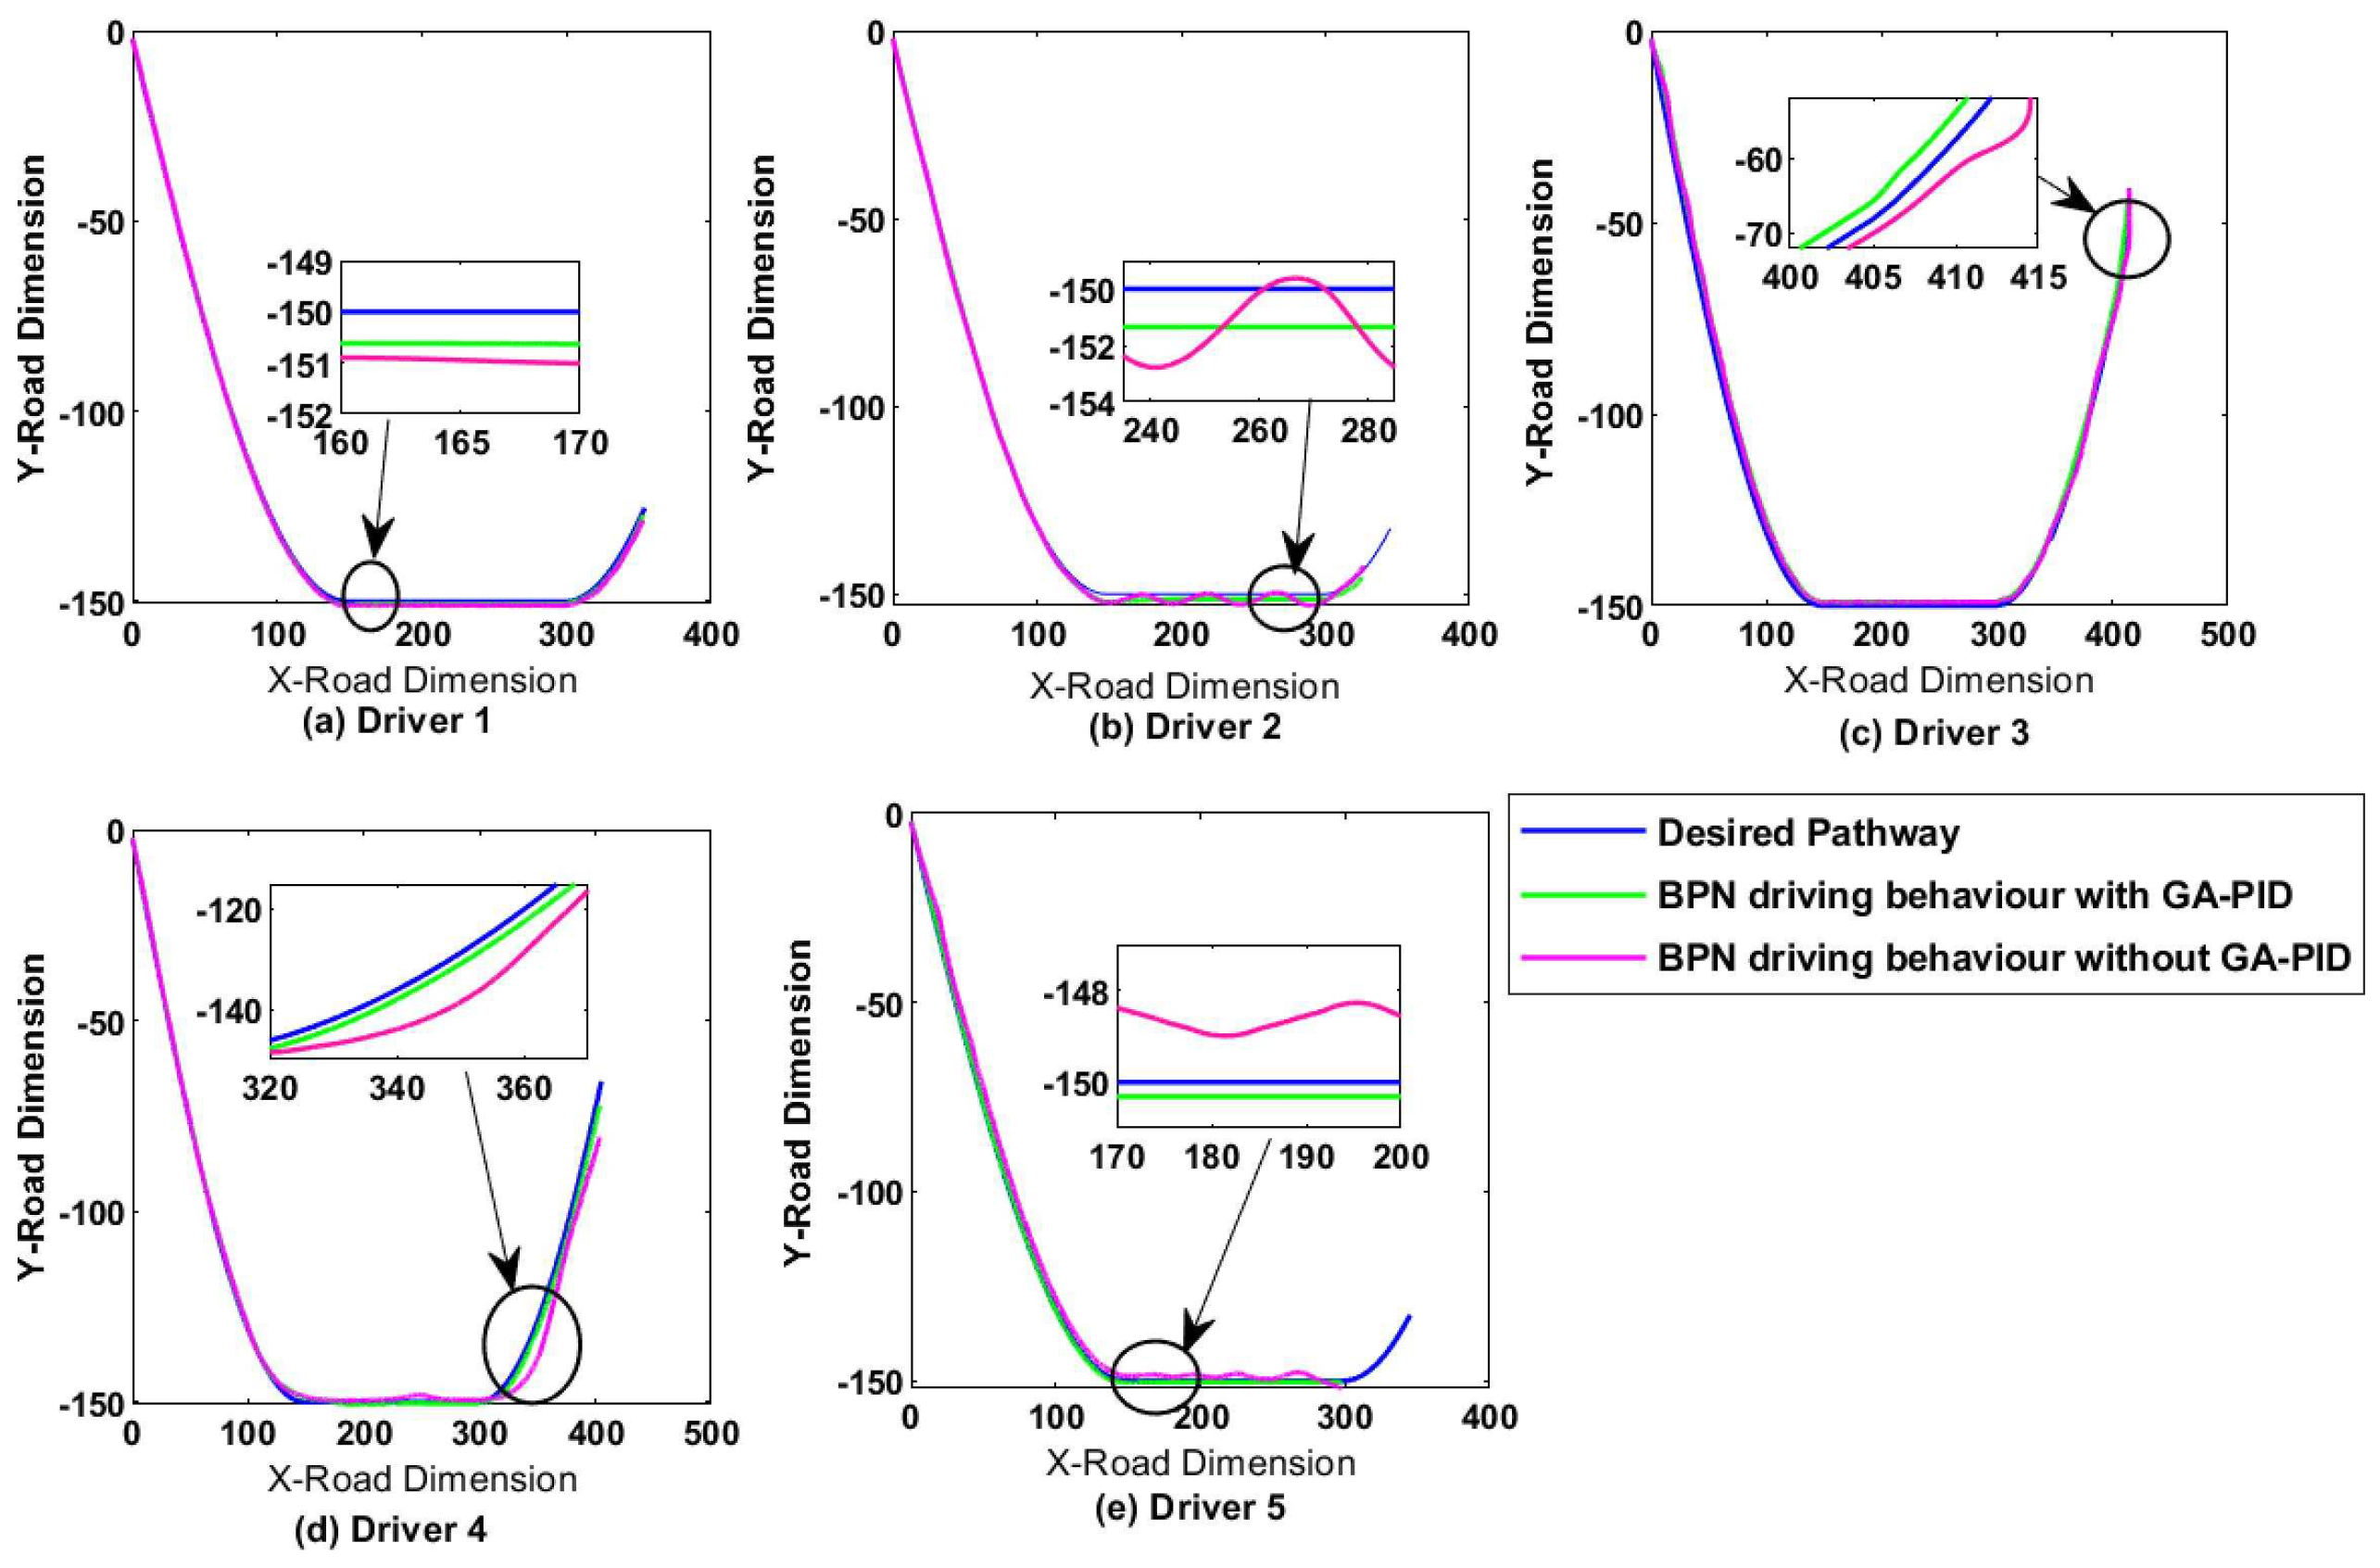
Figure 13 and shows different BPN driving behaviour due to car position with and without GA-PID controller. The curve from driver 1 to driver 5 indicated that the driving behaviour without GA-PID controller has higher car position error with reference to the driving pathway. However, the system combined with GA-PID significantly improves car position and driver behaviour. The car position is closer to the desired pathway for all drivers, leading to less error.
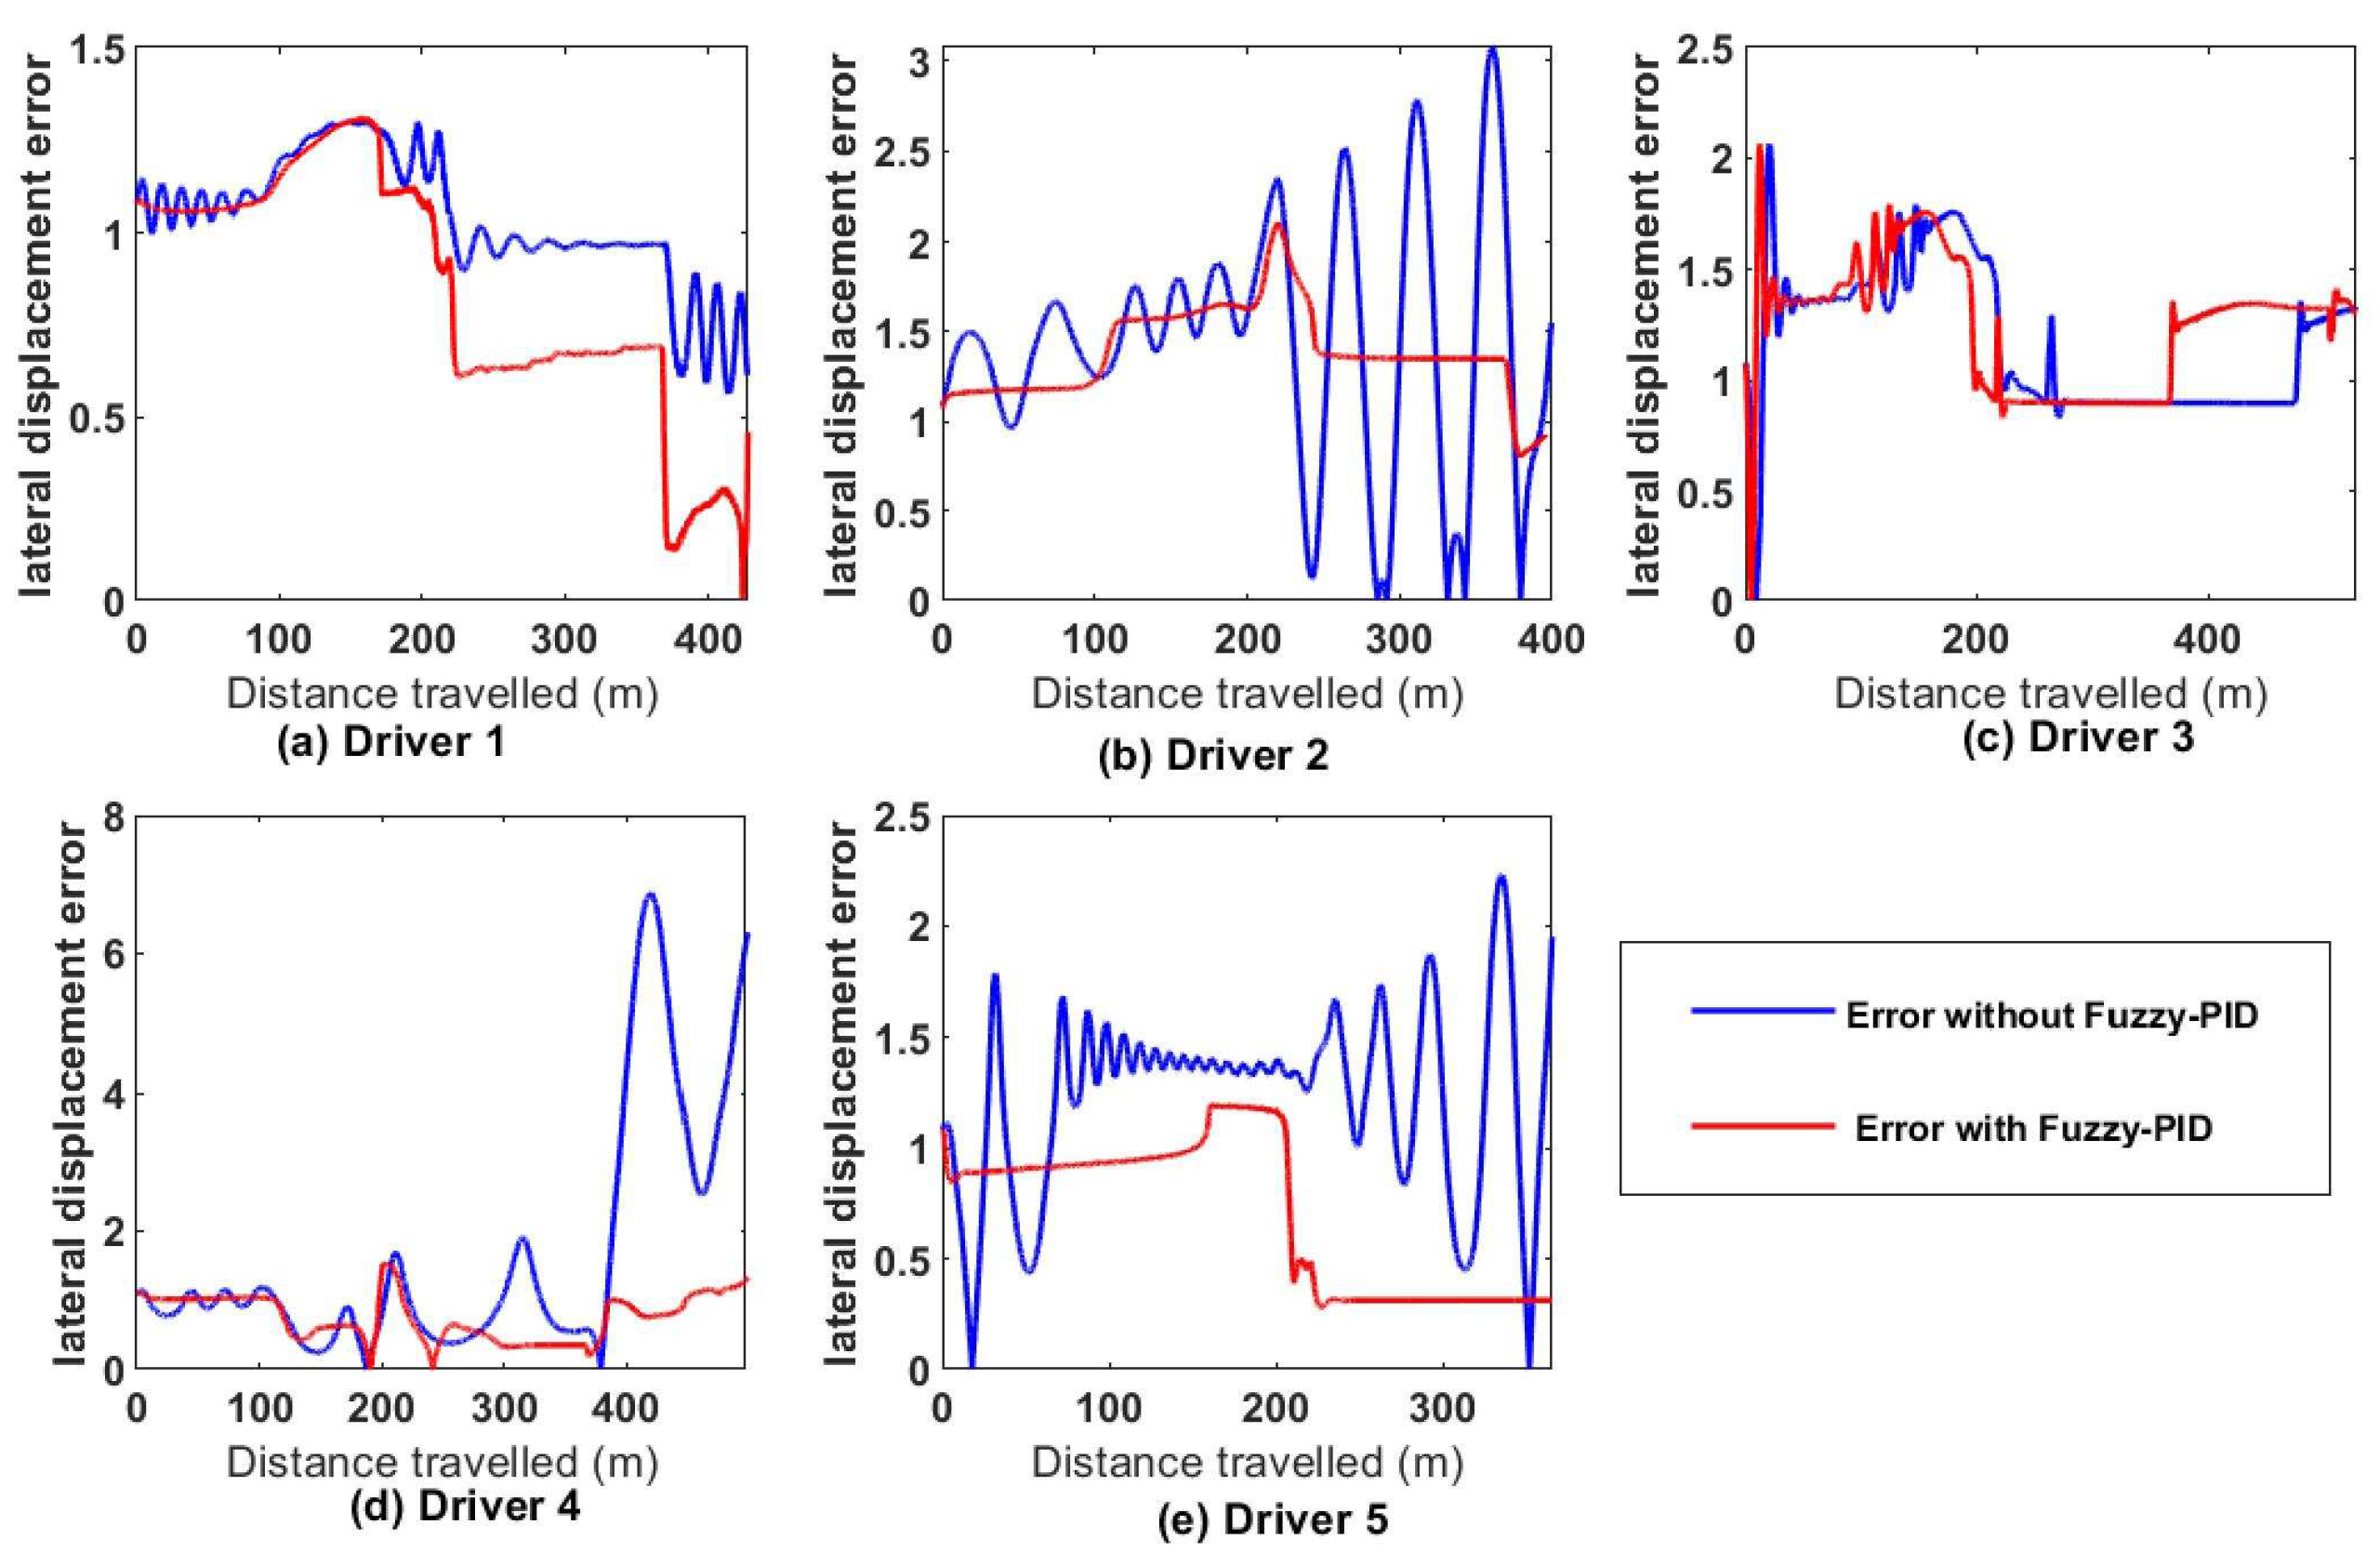
Figure 14 represents various BPNN driving behaviour errors after a given task. This graph clearly shows that from driver 1 to 5, the error is lower for the BPN driving behaviour with the GA PID controller for the straight and corner roads as the road shape is indicated in
Figure 13. This result also demonstrates the difference in the lateral trajectory of various BPNN driving behaviours indicated in
Figure 13.
5.1.2. ITAE for car’s position based on GA-PID conroller
The graphs displayed in
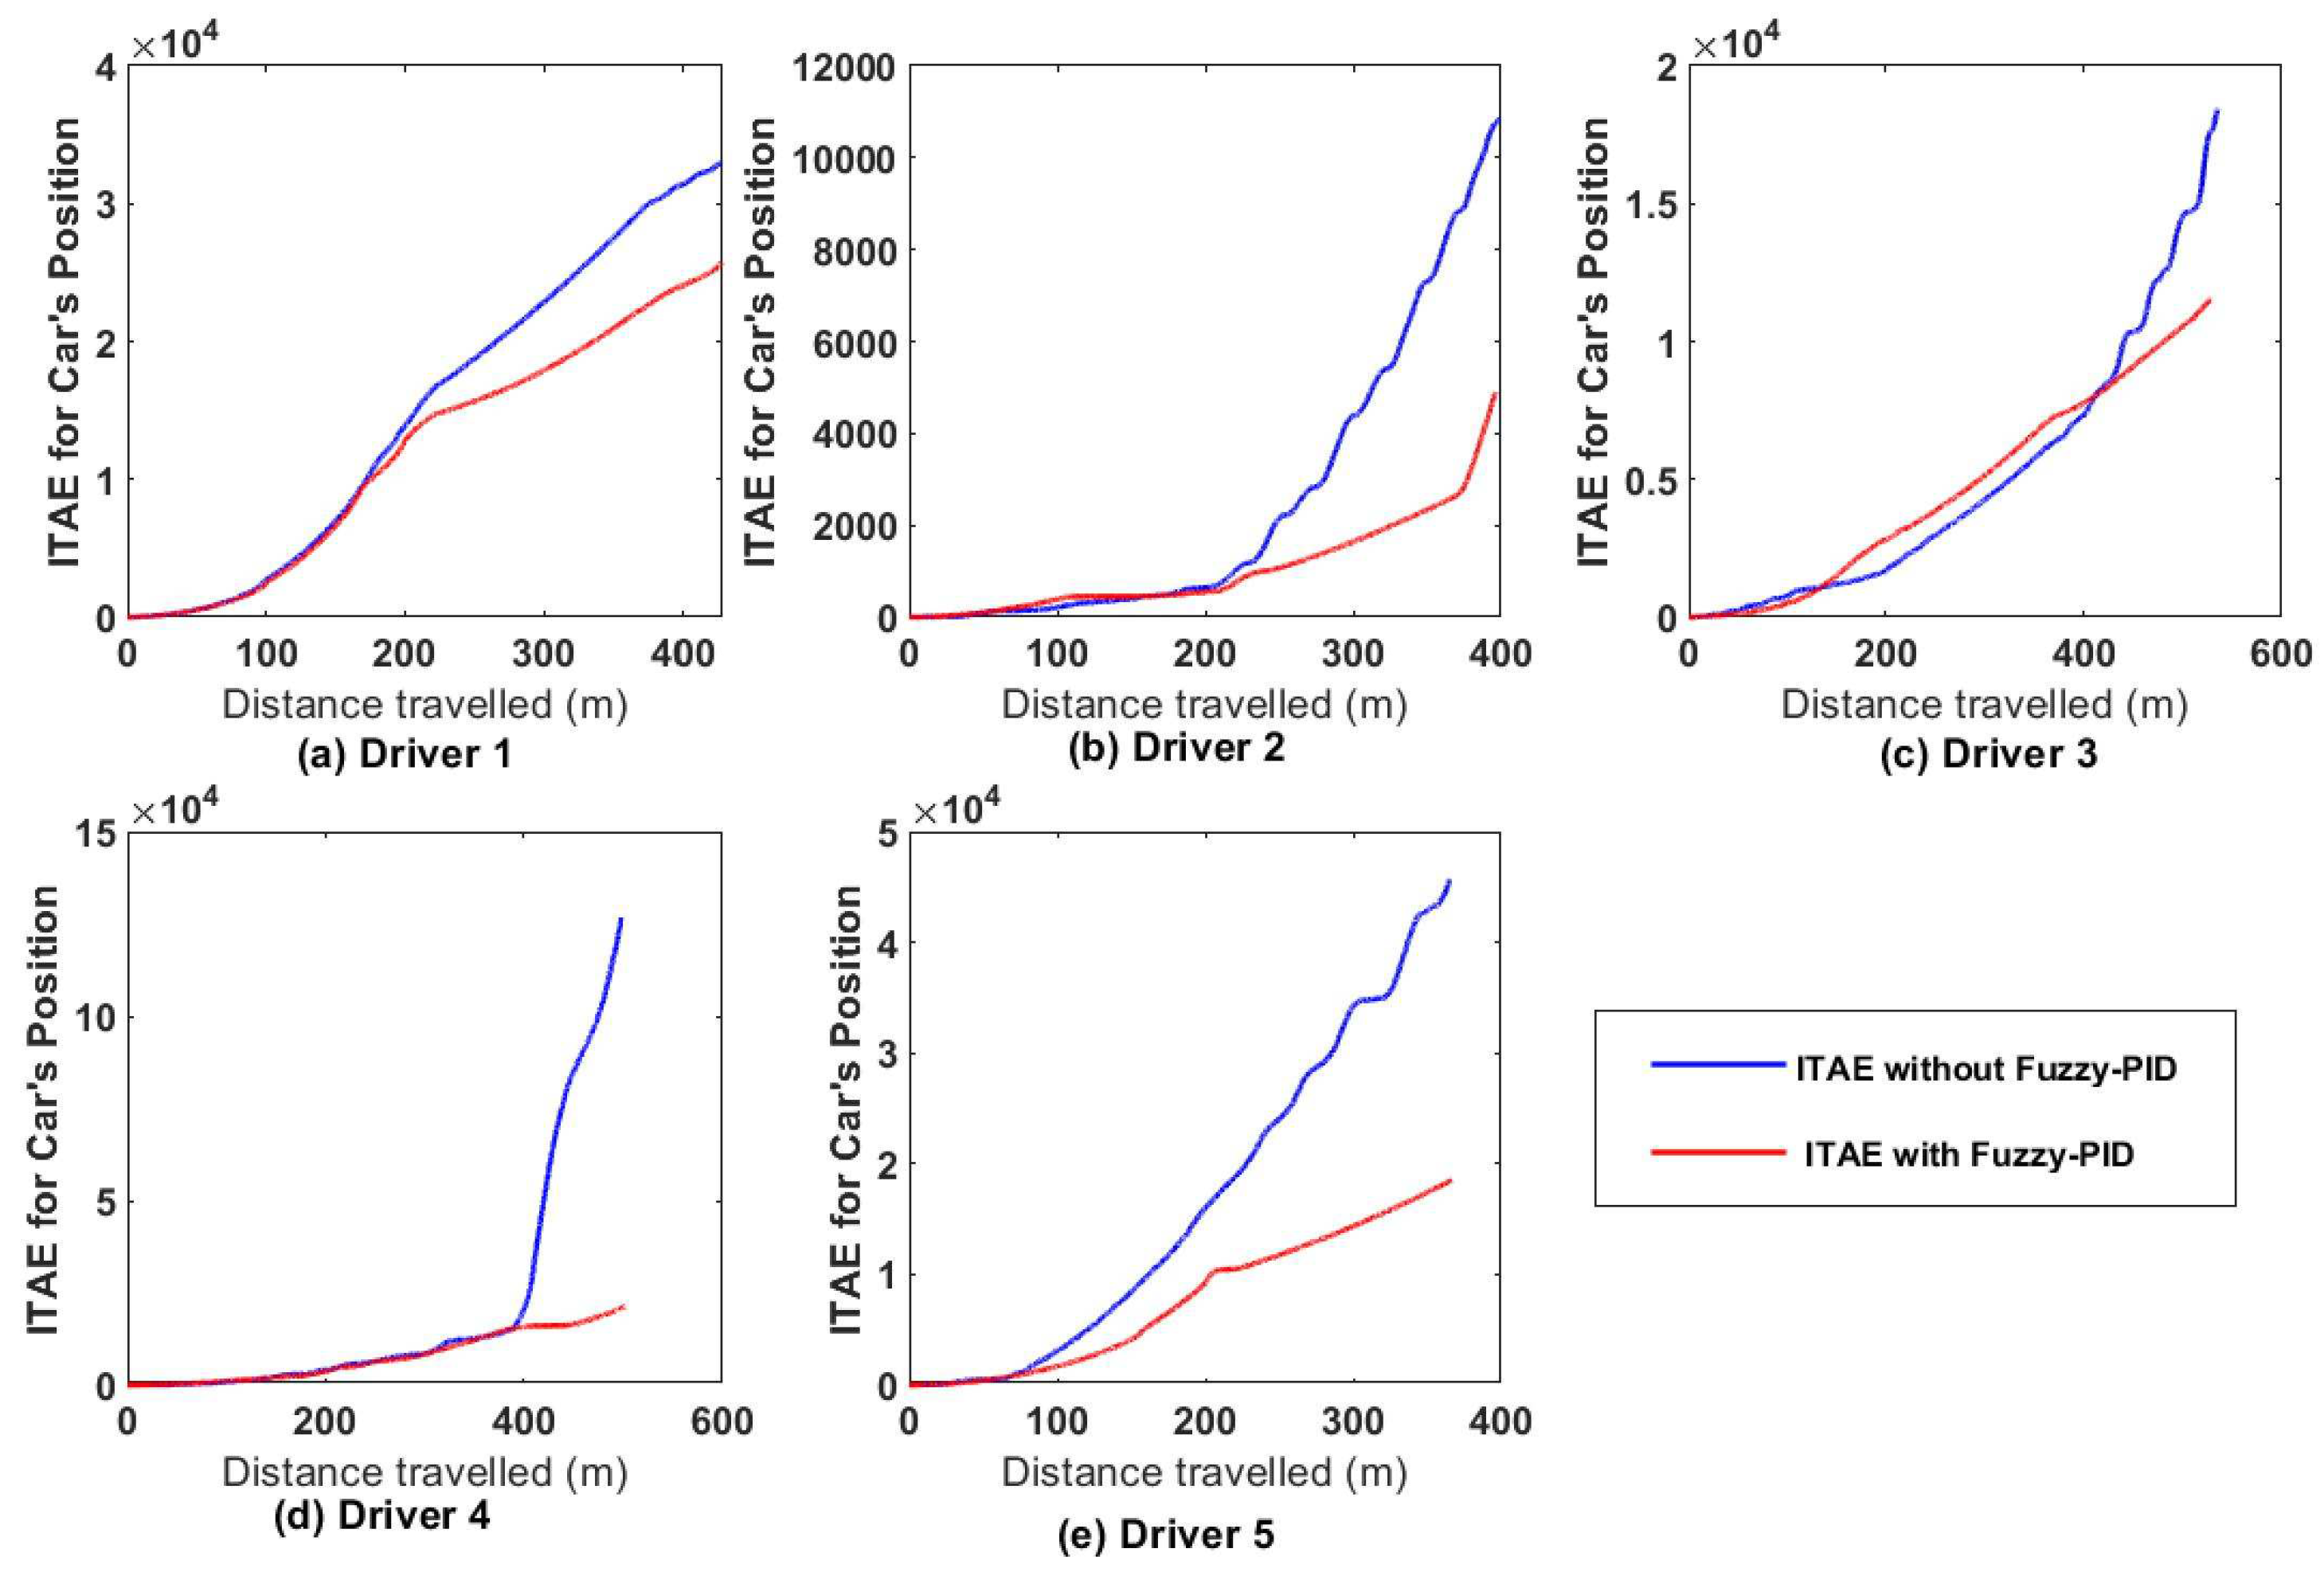
Figure 15 result from the performance index ITAE(Integral Time Absolute Error)of different BPNN driving behaviour based on the vehicle car’s lateral displacement after a given task. For This study, the lower the ITAE, the better the performance of the GA-PID.The curve of the ITAE related to the BPNN diving behaviour combined with the GA-PID is significantly low from driver 1 to 5 compared to the system without the compensator.
Table 4 illustrate the performance index (ITAE) on PID-GA on driving behaviour based on the car’s lateral displacement as mentioned above. The result enumerated in this table (
Table 4)confirmed the result displayed in
Figure 15. The car’s lateral displacement error improvement in this table varies from 22% to 83% . After evaluating these results, we noticed that the PID-GA compensator notably impacts the driving style by reducing car position error and slightly affecting car orientation.
5.1.3. ITAE for car’s orientation based on GA-PID conroller
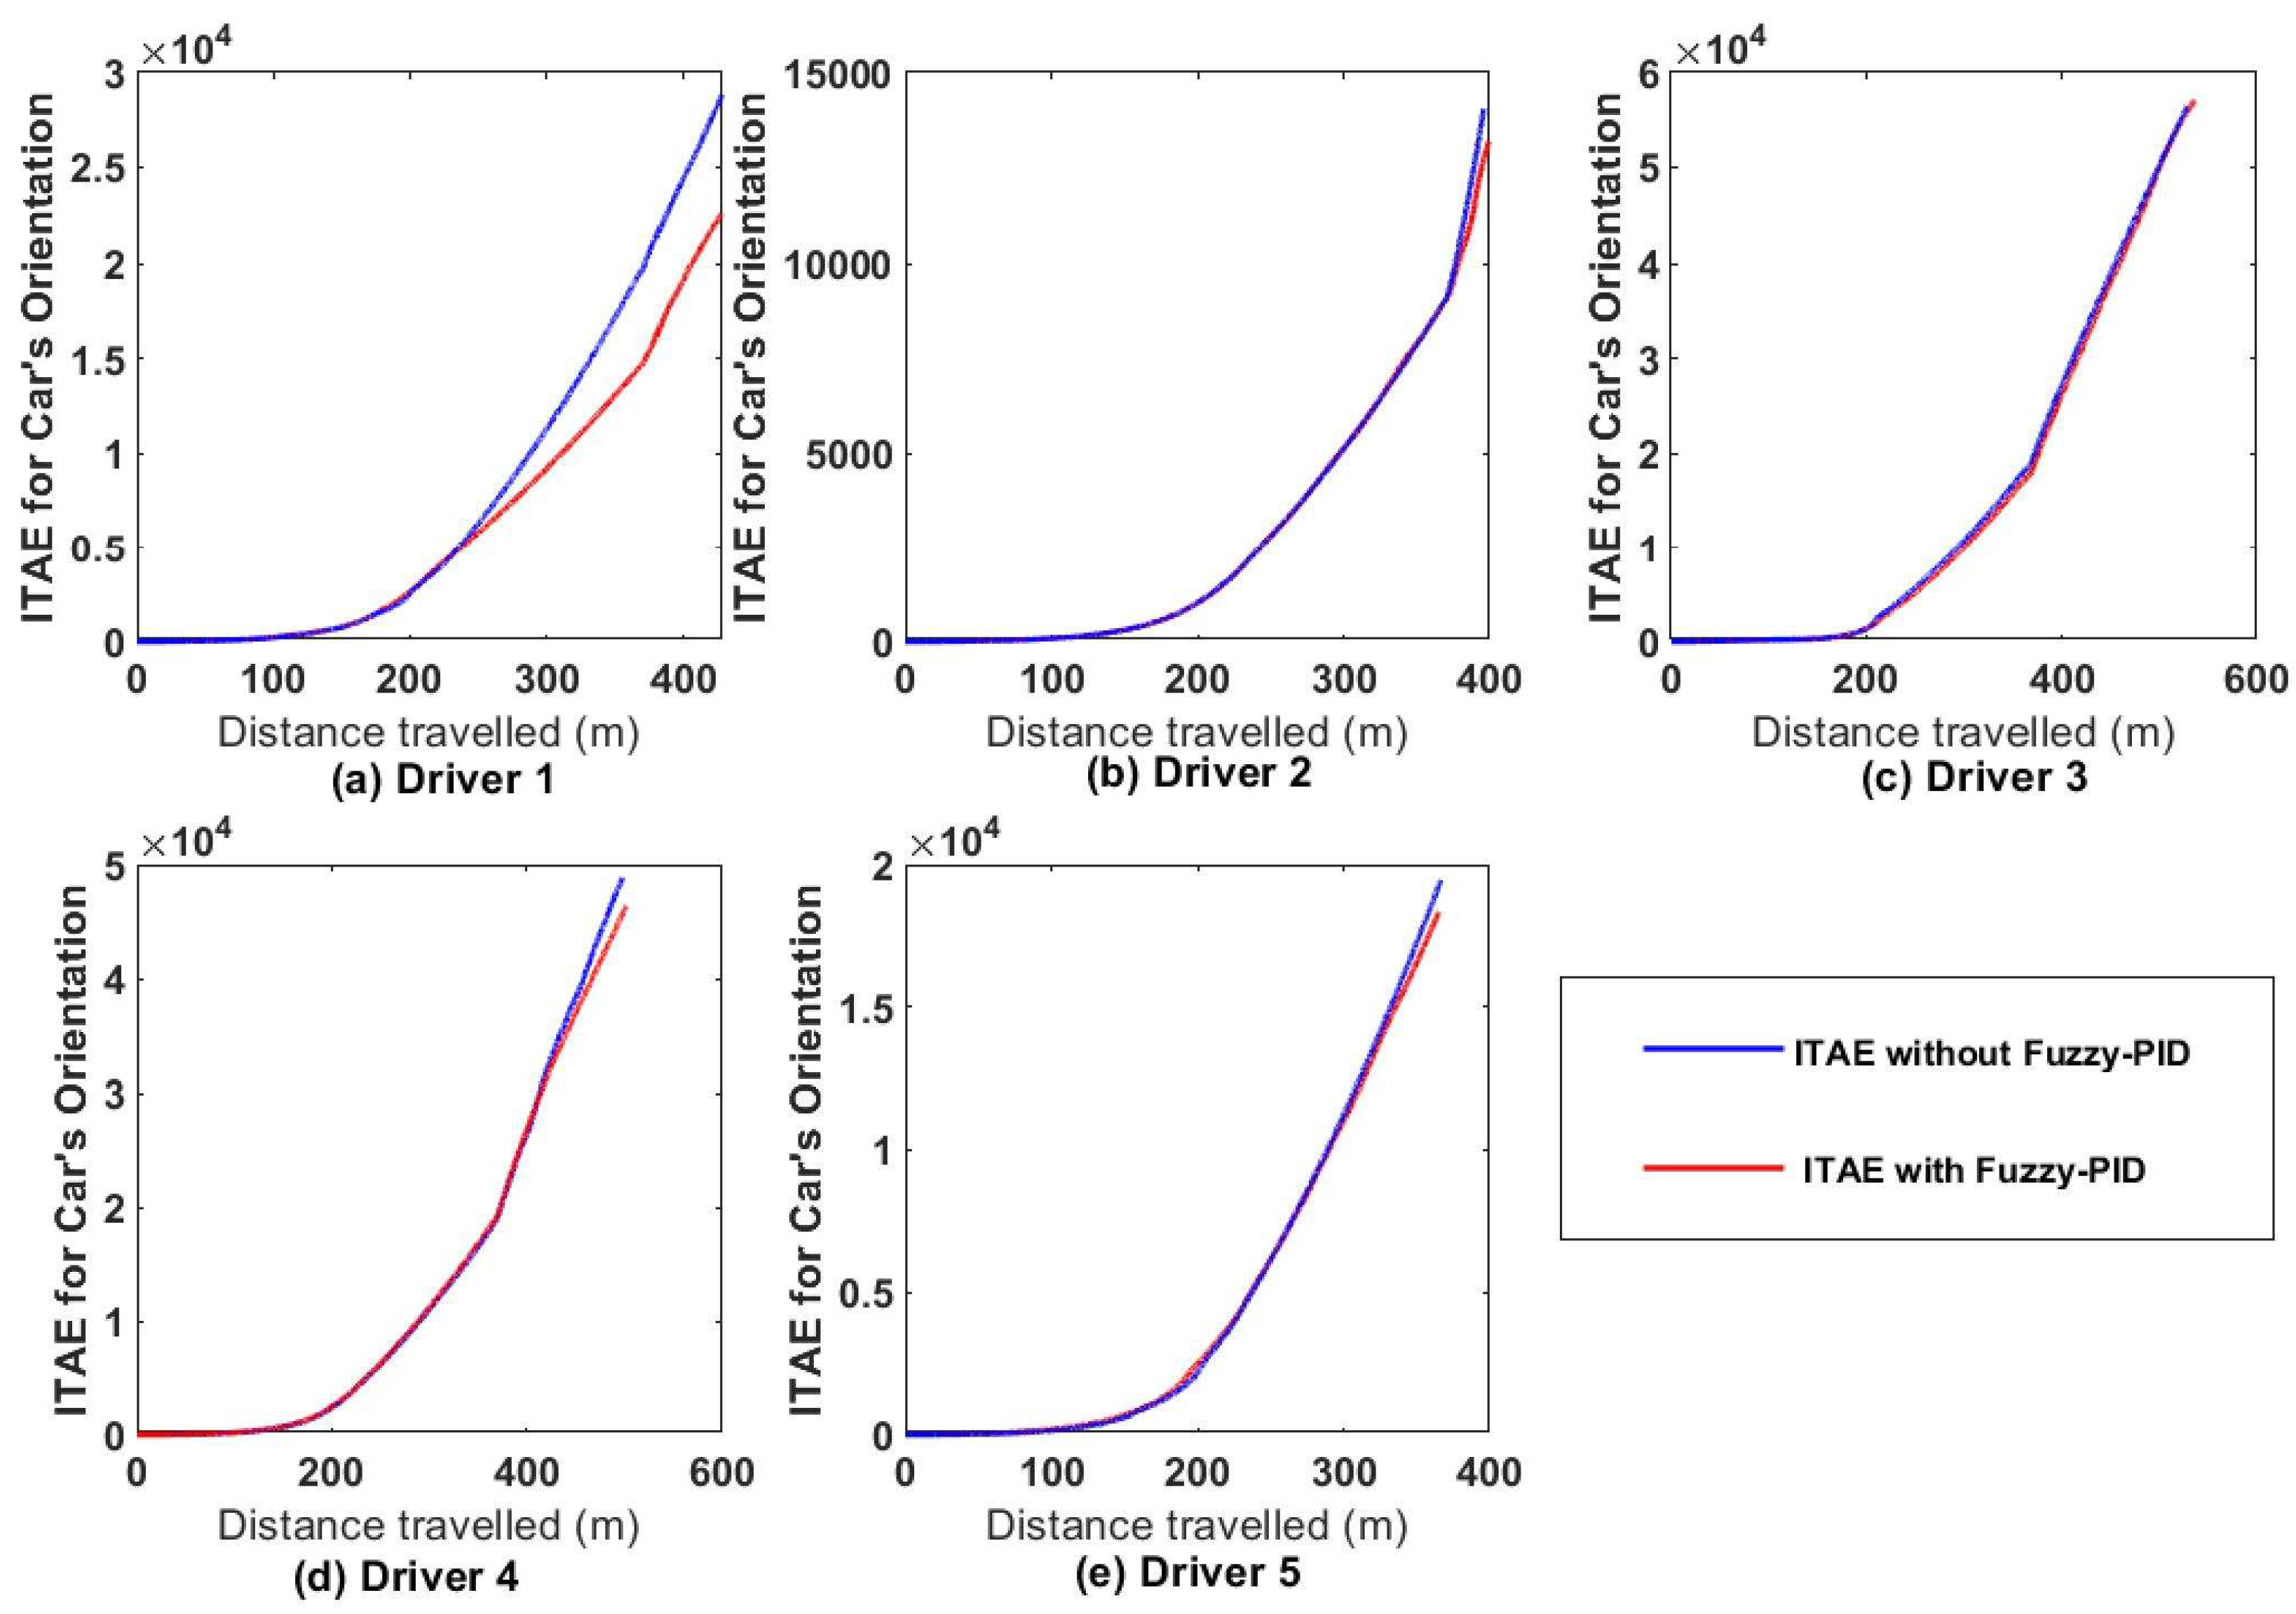
Due to individual personalities, different driving behaviour based on orientation was also compensated by the GA-PID, and this can be seen from the performance index(ITAE)indicated in
Figure 16 and the results recorded in
Table 5. The ITAE curve of the car’s orientation error of various driving behaviours with the GA-PID is under the curve of the car’s orientation without the controller for all the drivers after a task. The improvement value produced in
Table 5 indicates that the enhancement varies from 1.2% to 7.22% and validates the result displayed in
Figure 16. The slight impact on car orientation error is due to the constant movement of the driver on the steering wheel angle during the driving task.
5.2. Applied Fuzzy-PID
After experimenting with the proposed data-driven controller, the graphs representing the PID parameters (
,
,
) in
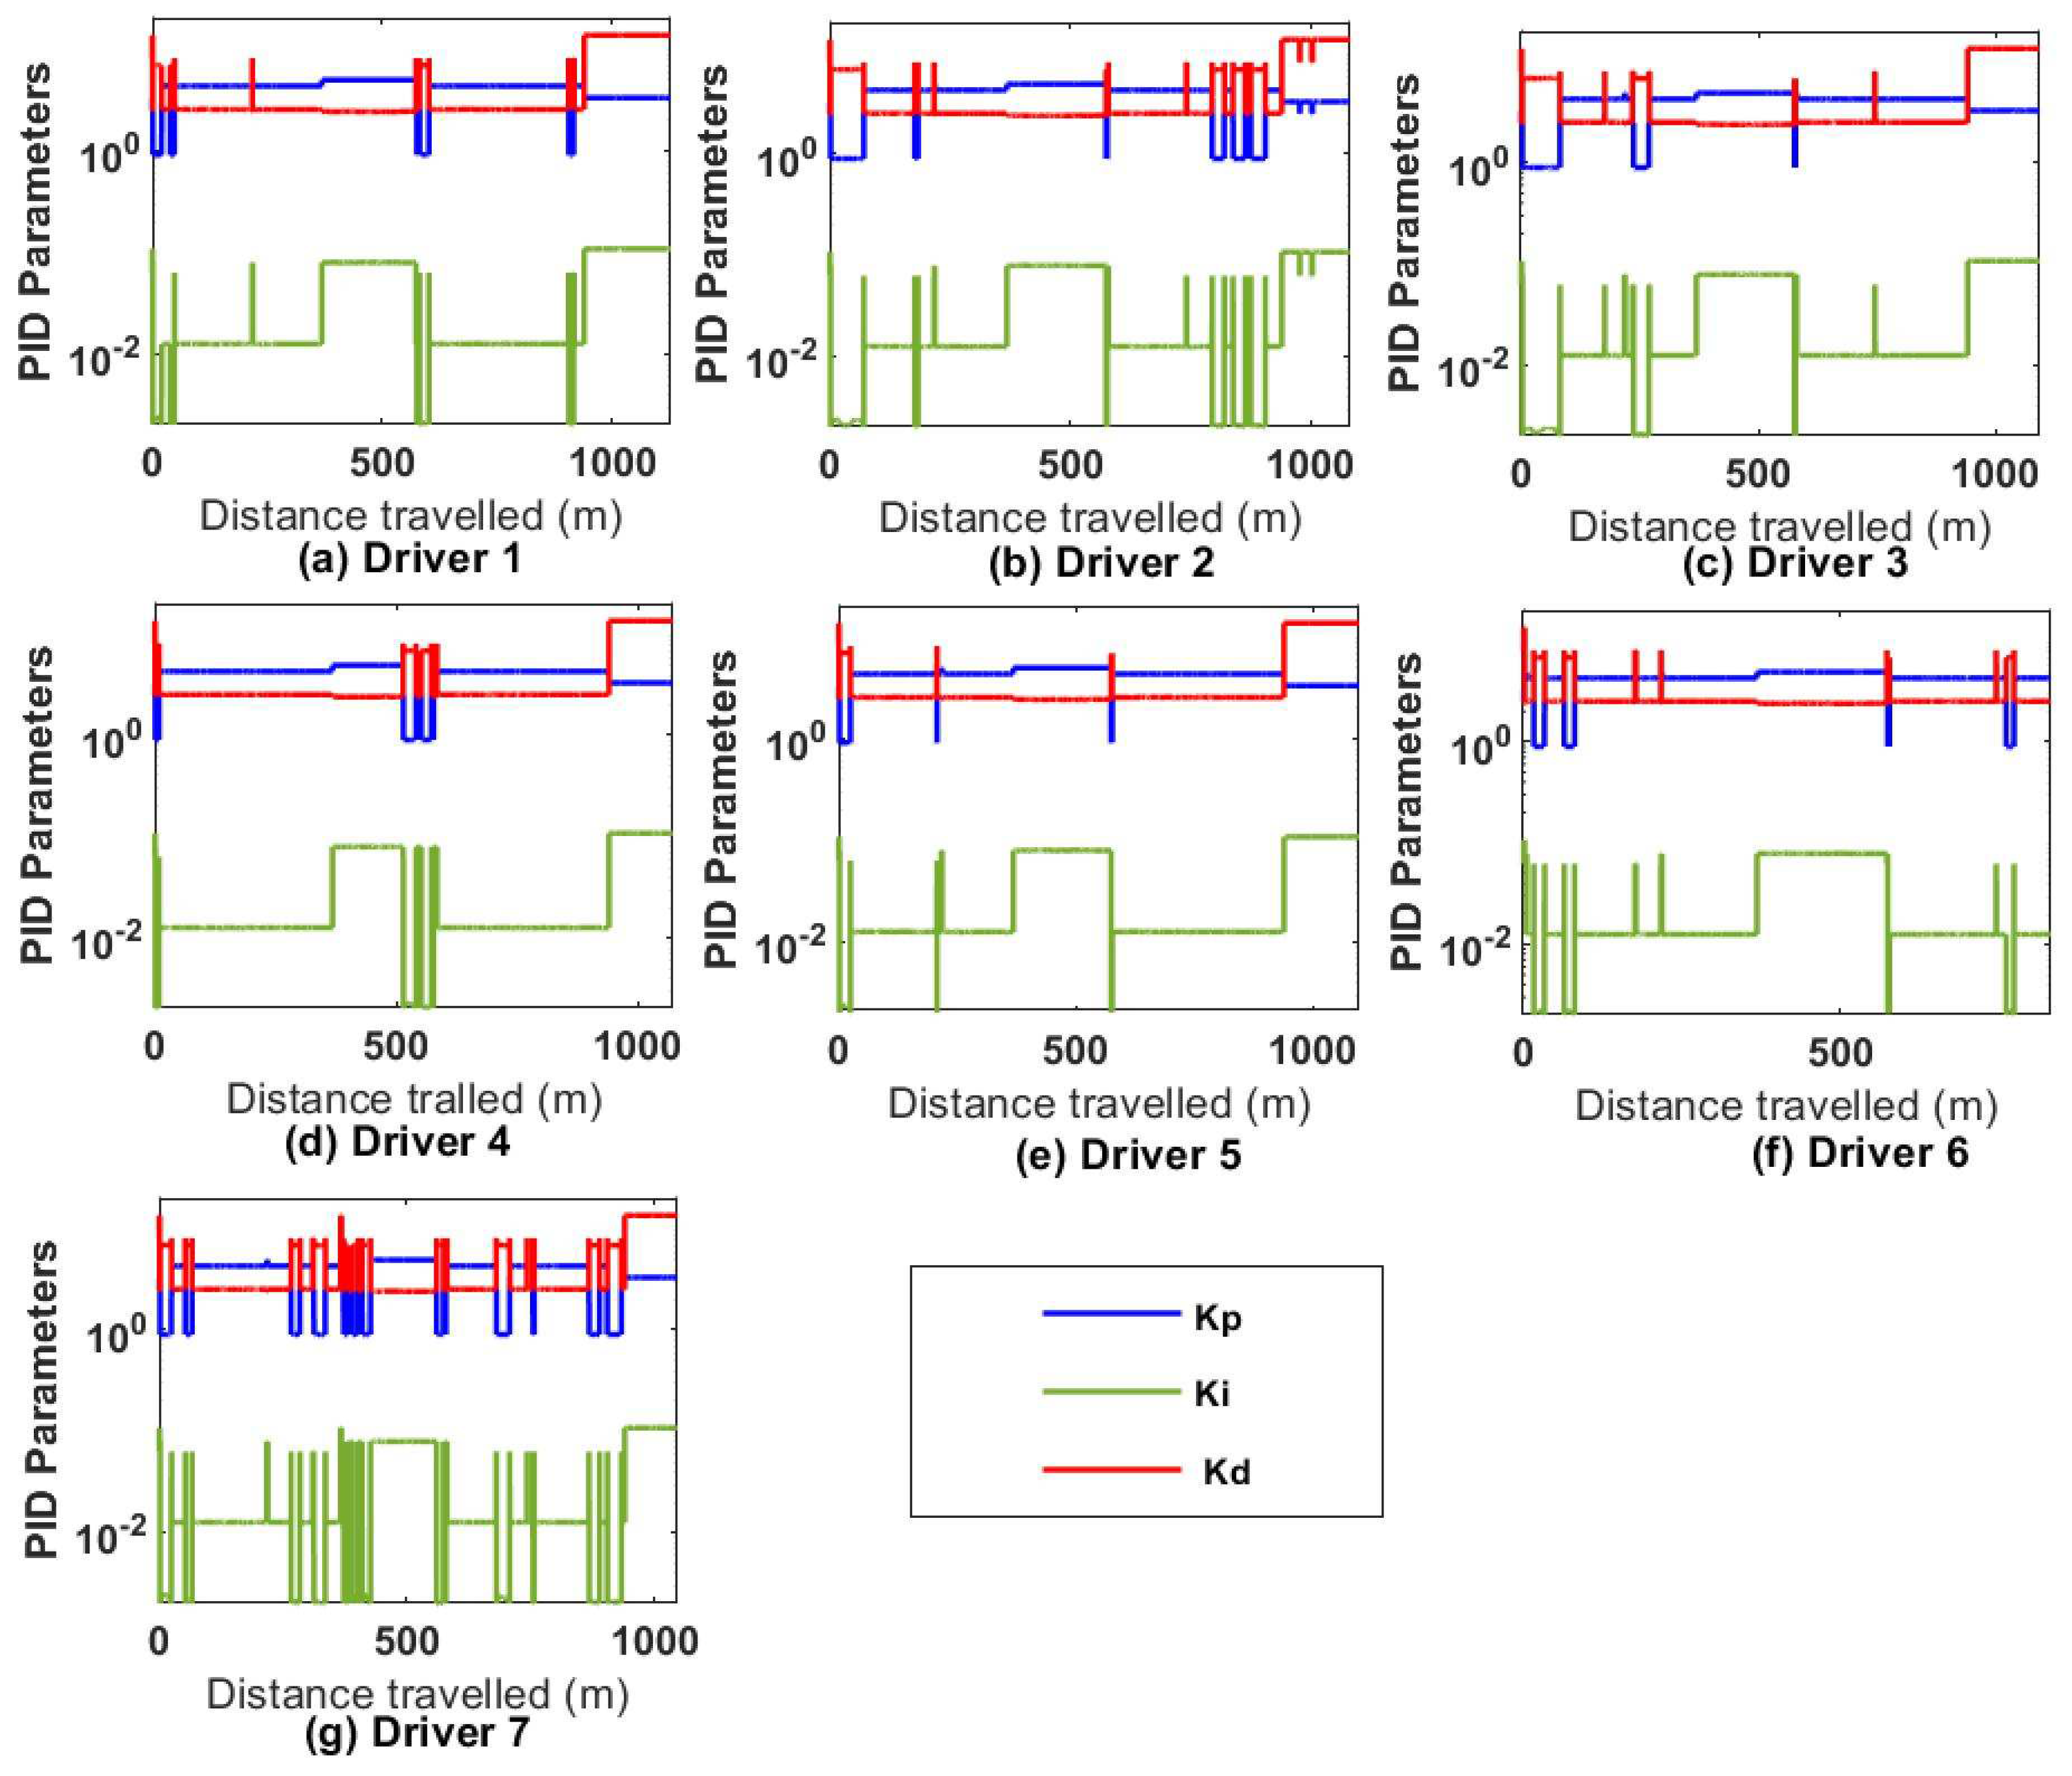
Figure 17 were generated for each driving behaviour. These results show the variation of PID Parmenter for individual driving behaviour. The variation differs from the driver because each driver has a personality or identity. Many variations of driving behaviour generated more change in the PID parameters, which can be seen in drivers 2,6,7. The purpose of this variation was to keep the car position on the centerline and to reduce the car orientation angle for each driving behaviour. This change of PID gains is due to the input membership of the fuzzy logic, which comprises the car position, orientation error and the car’s speed following the line, keeping the vehicle in a straight line or deviating line.
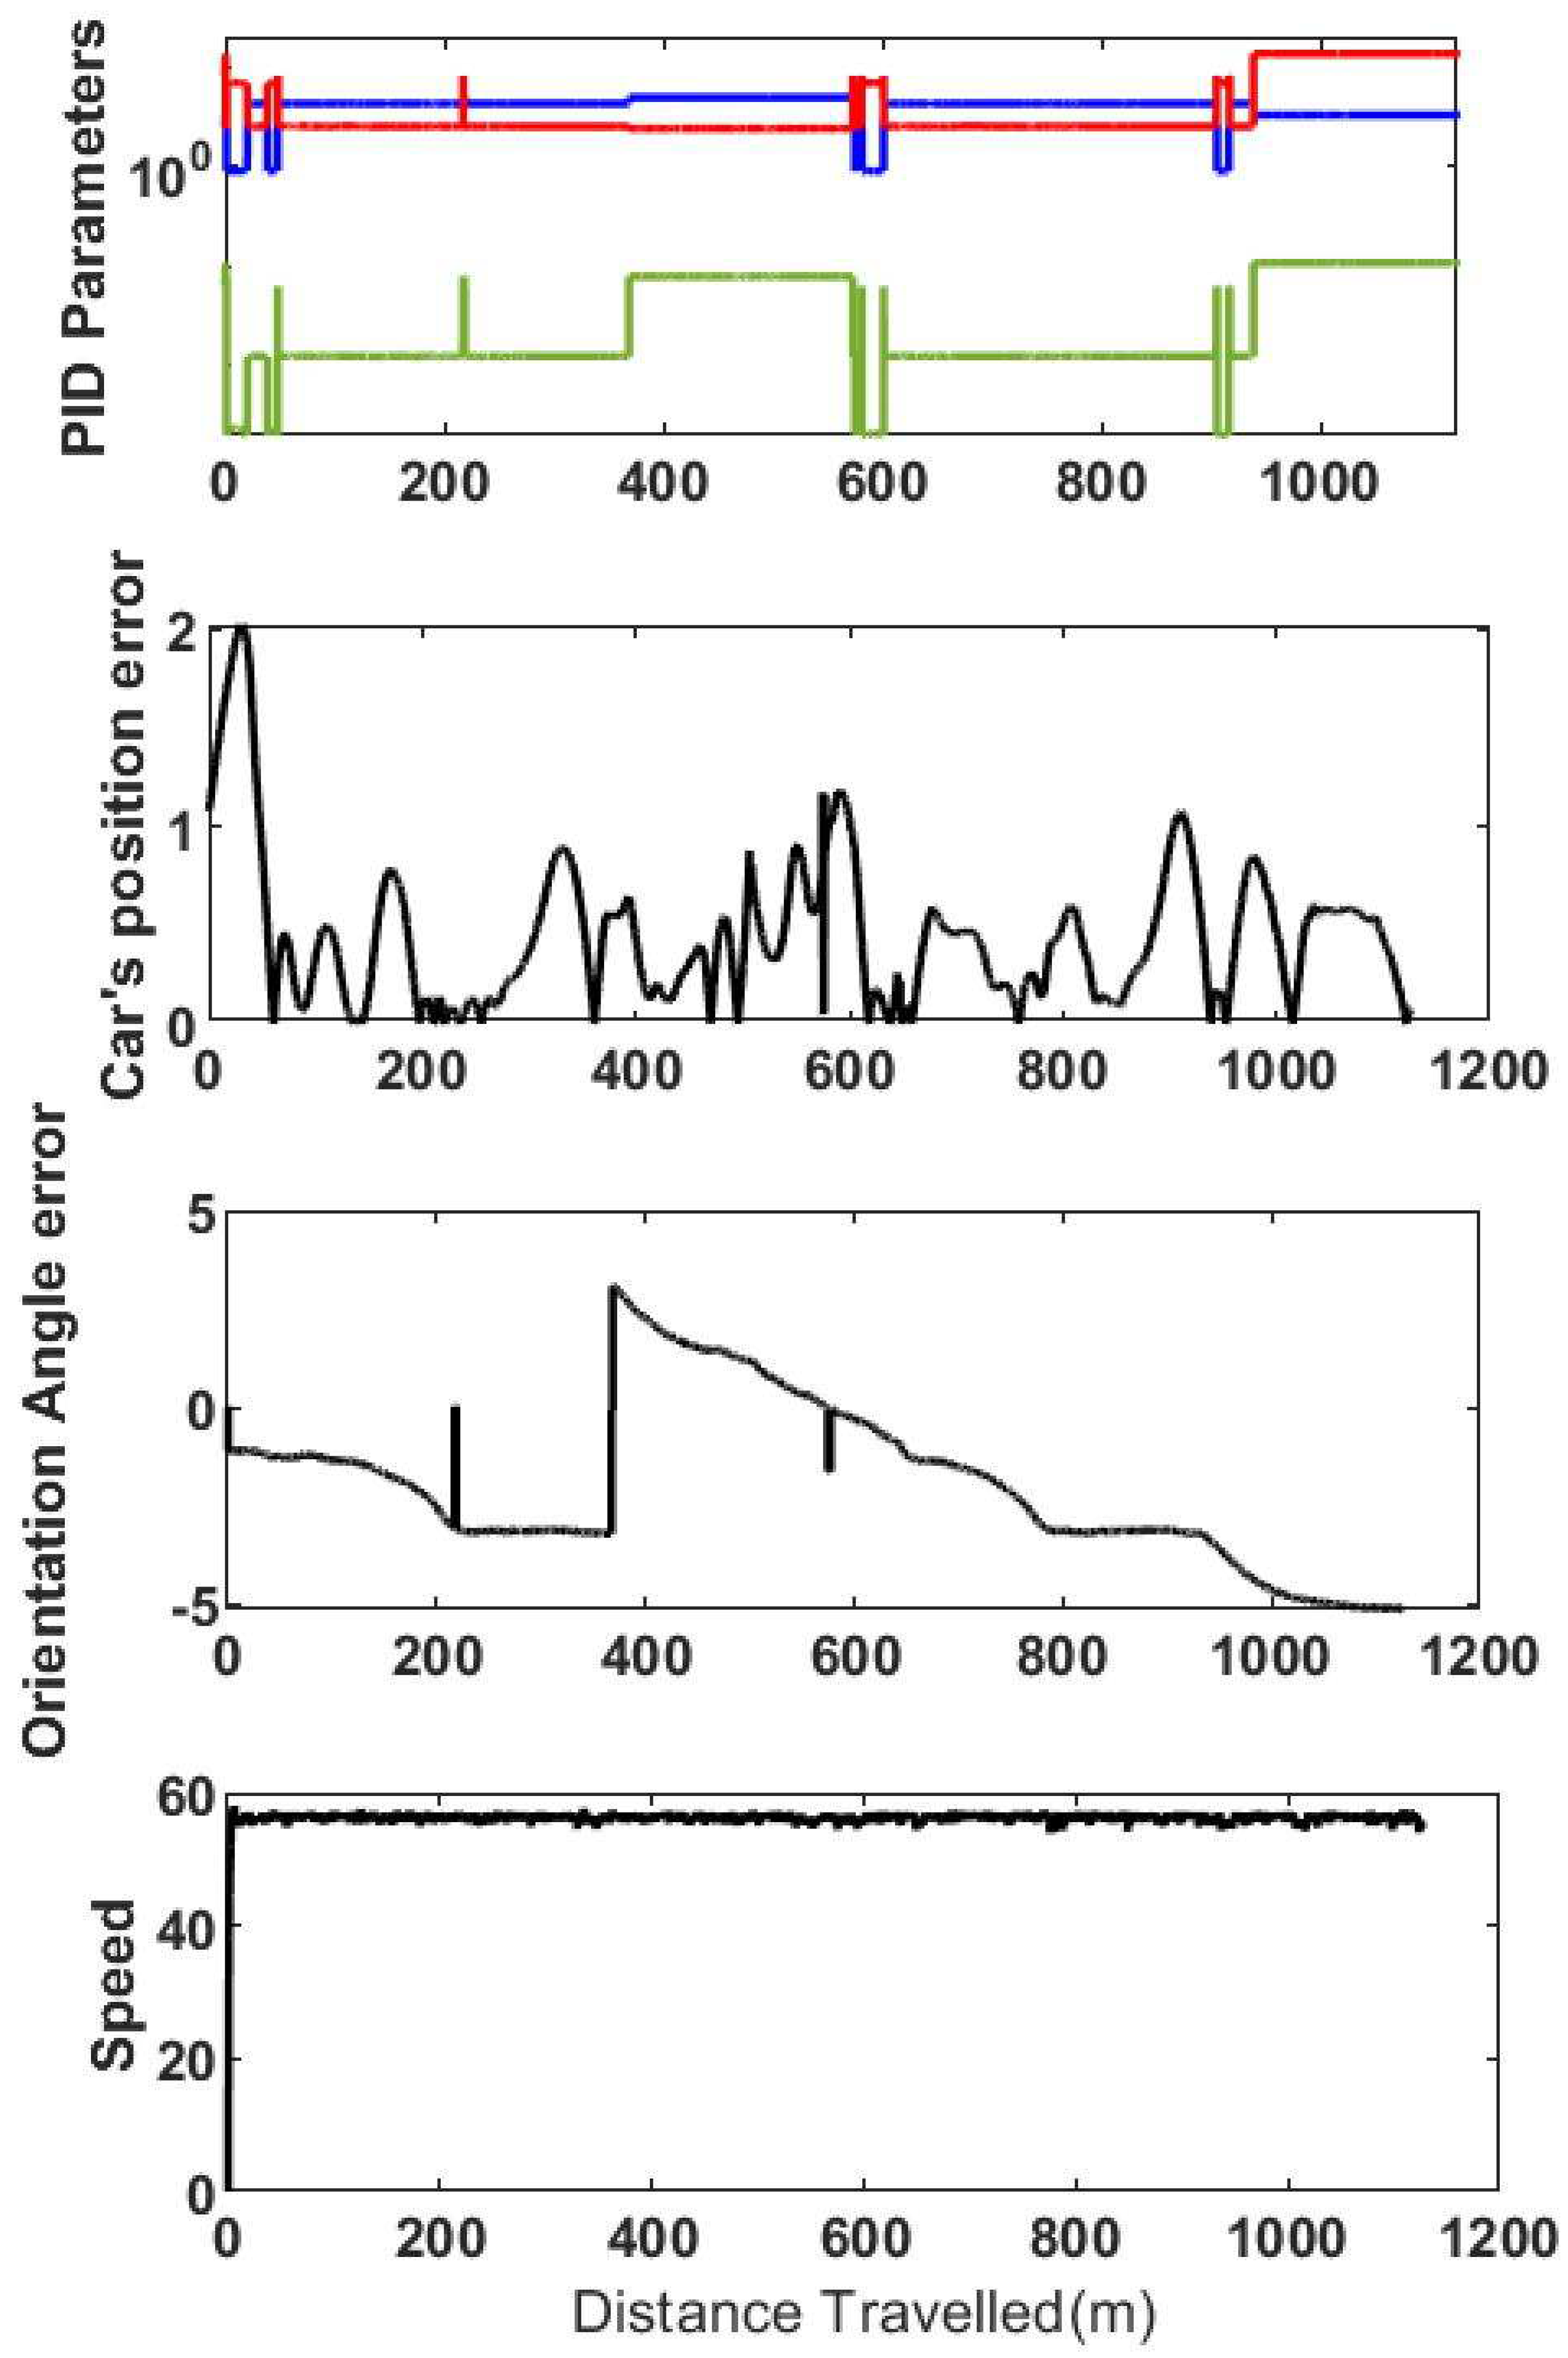
Figure 18 displays how the optimal Fuzzy PID parameters set are dynamically obtained due to the variation of the car’s lateral error, the orientation angle error and the speed for driver one (1) and two (2) after a given task. For the first 100 m for driver one, the car’s position error has risen to pick value at 30m while the orientation decreased under 0 angle, and the speed is at 53.8m/s. This driving profile allows the PID controller parameter set to change dynamically. Between 100m and 210m, the PID gain set is constant because the position error, the orientation angle error, and the speed are within the boundary to obtain optimal gains. The orientation angle error drastically changes between 210m and 225m, forcing the Fuzzy logic to provide the best PID parameter set for this situation. This automatic update of the PID parameters can be observed through the travelled distance. The same interpretation can be applied to driver 2. Let’s observe the driving profile and the corresponding PID parameter set between 800m and 900m. The parameters set has been changing due to the increase in the car’s lateral position error(1.5m), the decrease in the car’s orientation angle error(-3.7), and the car’s speed(54.5m/s). These results demonstrate that the optimal fuzzy-PID parameter changes in different situations to improve the controller performance(flexibility or robustness) by reducing the car’s position and orientation angle error for various individual driving styles.
The speed generated without the fuzzy-PID during the driving sees
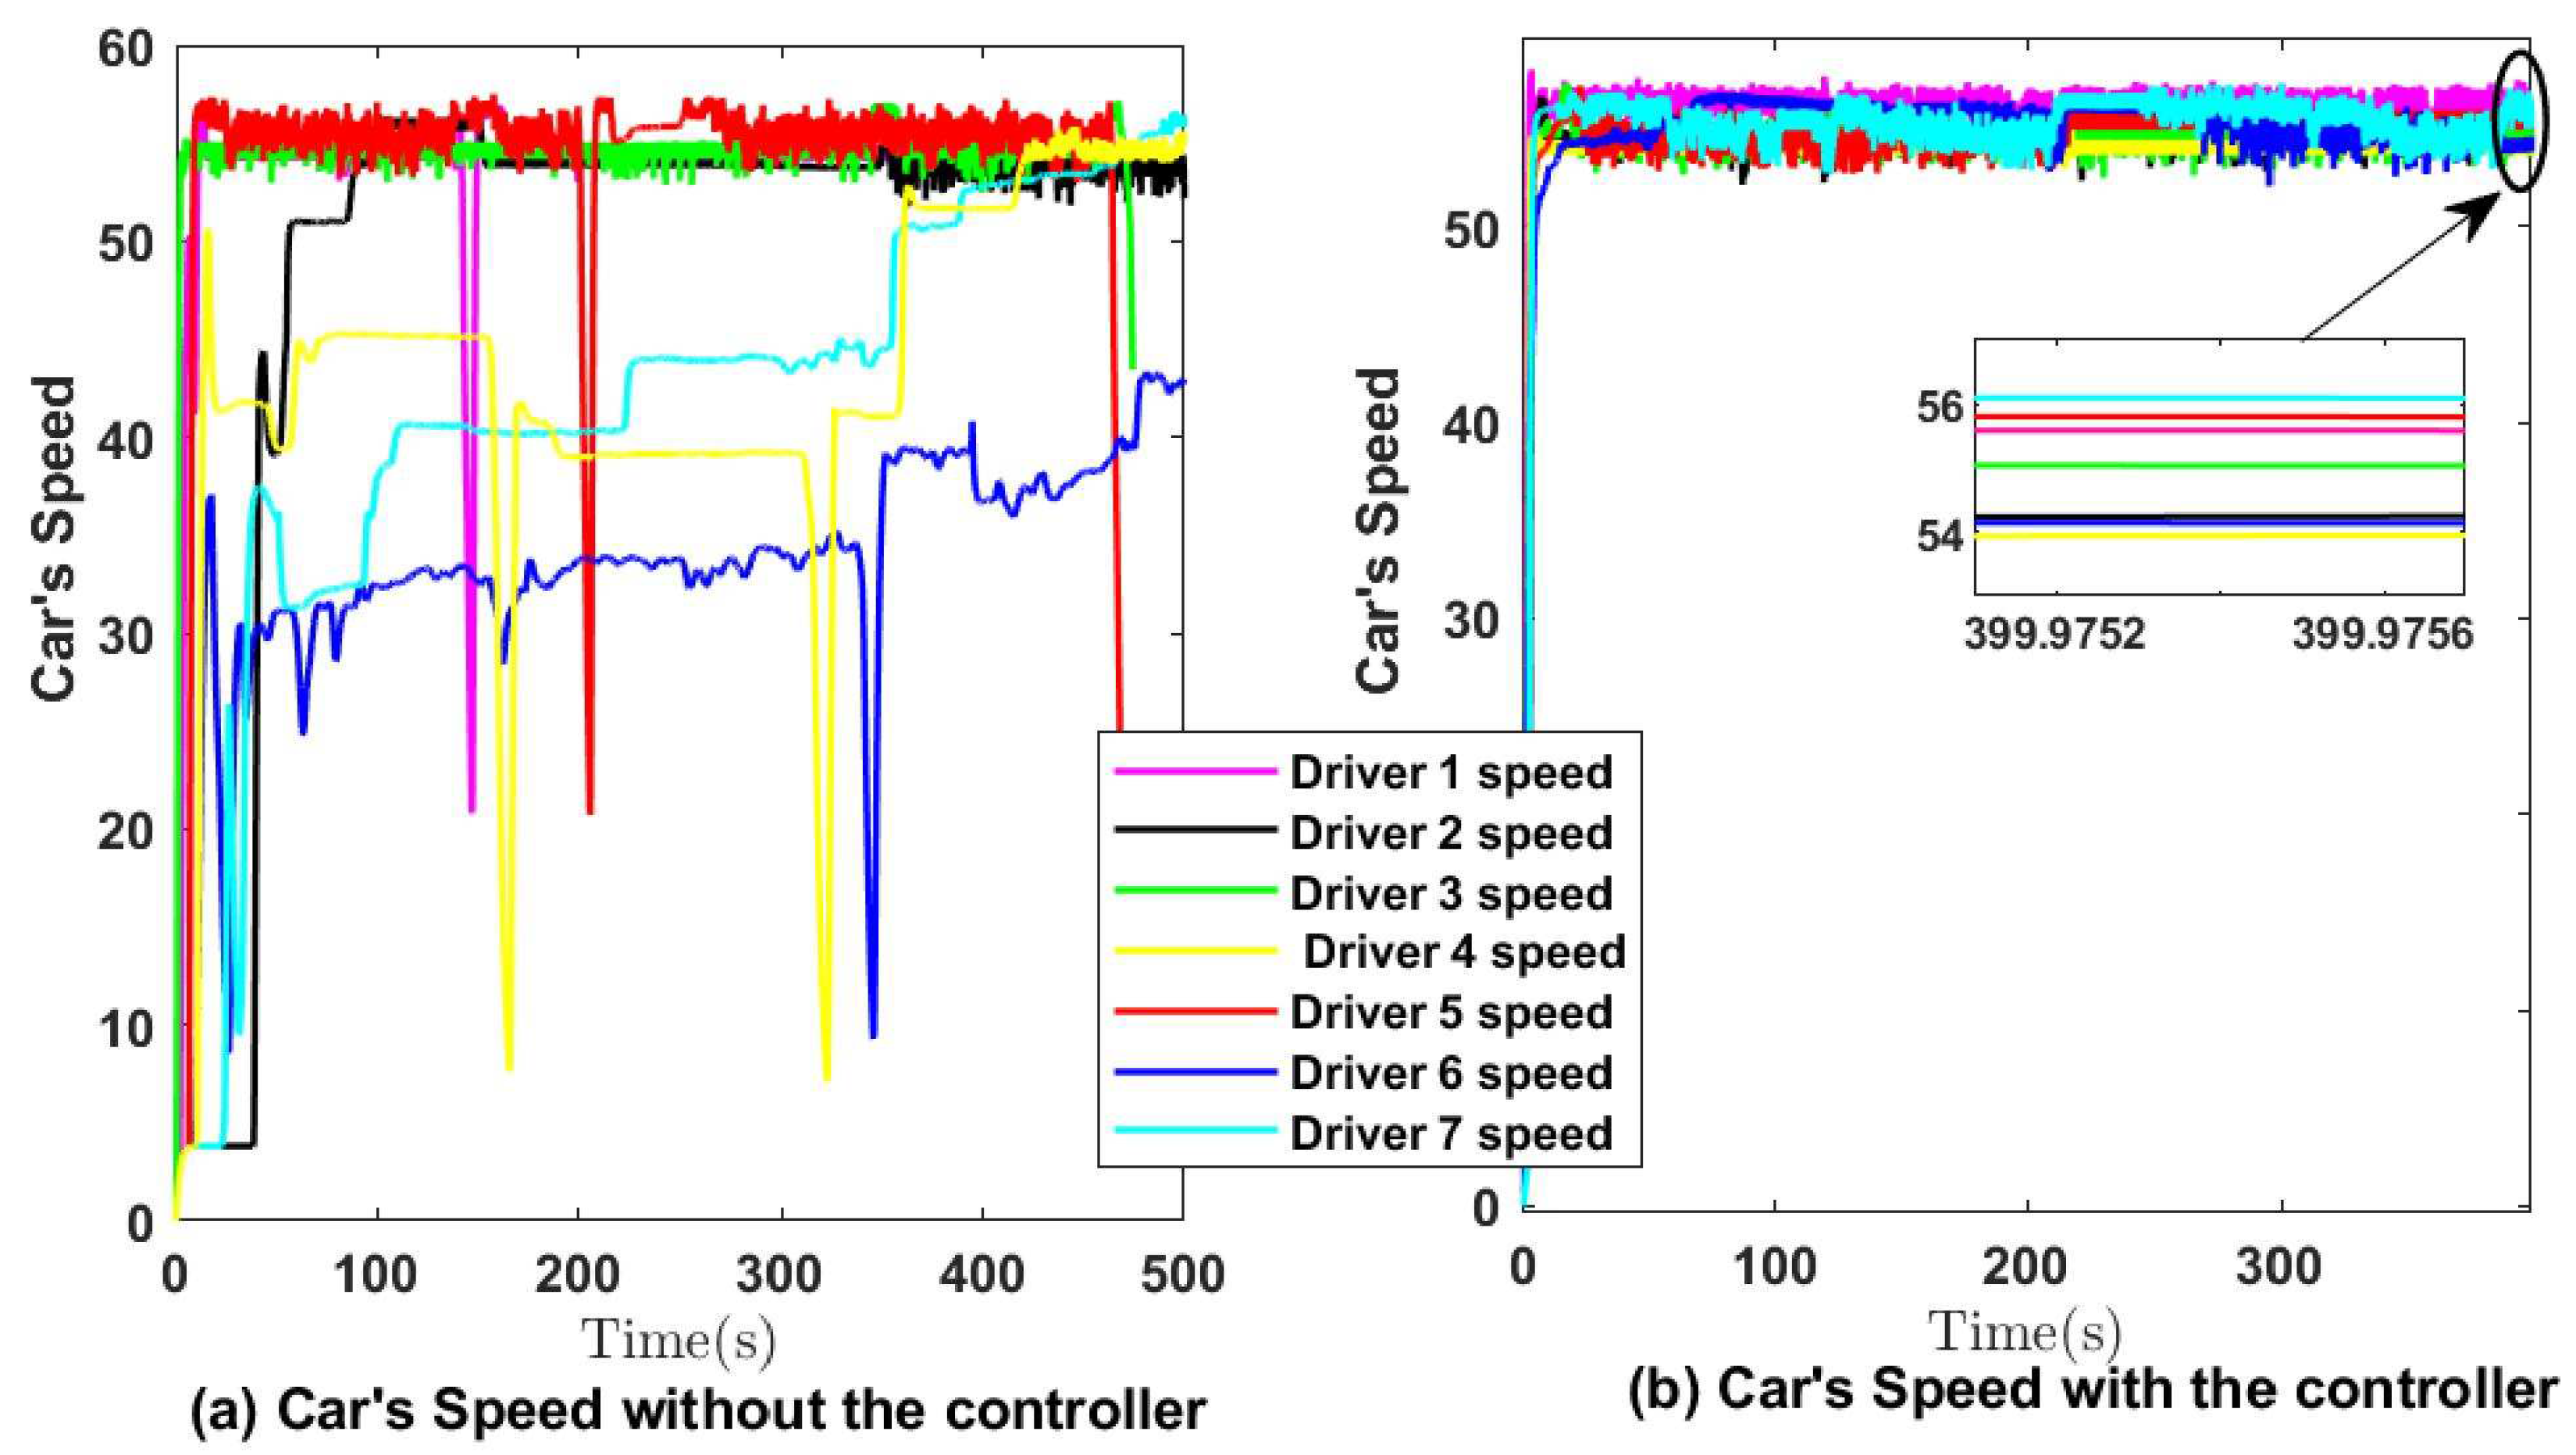
Figure 19 indicated a significant variation in individual diving style. The variation is due to the steering wheel’s sensitivity that keeps the car on the centre line because it can easily control a steering wheel at a low speed. The same driving behaviour generated less speed variation with the fuzzy-PID proposed compensator; this means that the obtained fuzzy-PID parameter set was turned to stabilise the steering wheel angle, keep the car on the centre line, and simplify the car yaw angle. The average car’s speed provided in
Table 6 confirms the statement mentioned above. The average speed results in this table show how the Fuzzy-PID controller assisted various drivers appropriately at a high and constant speed compared to the system without.
5.3. Driving results
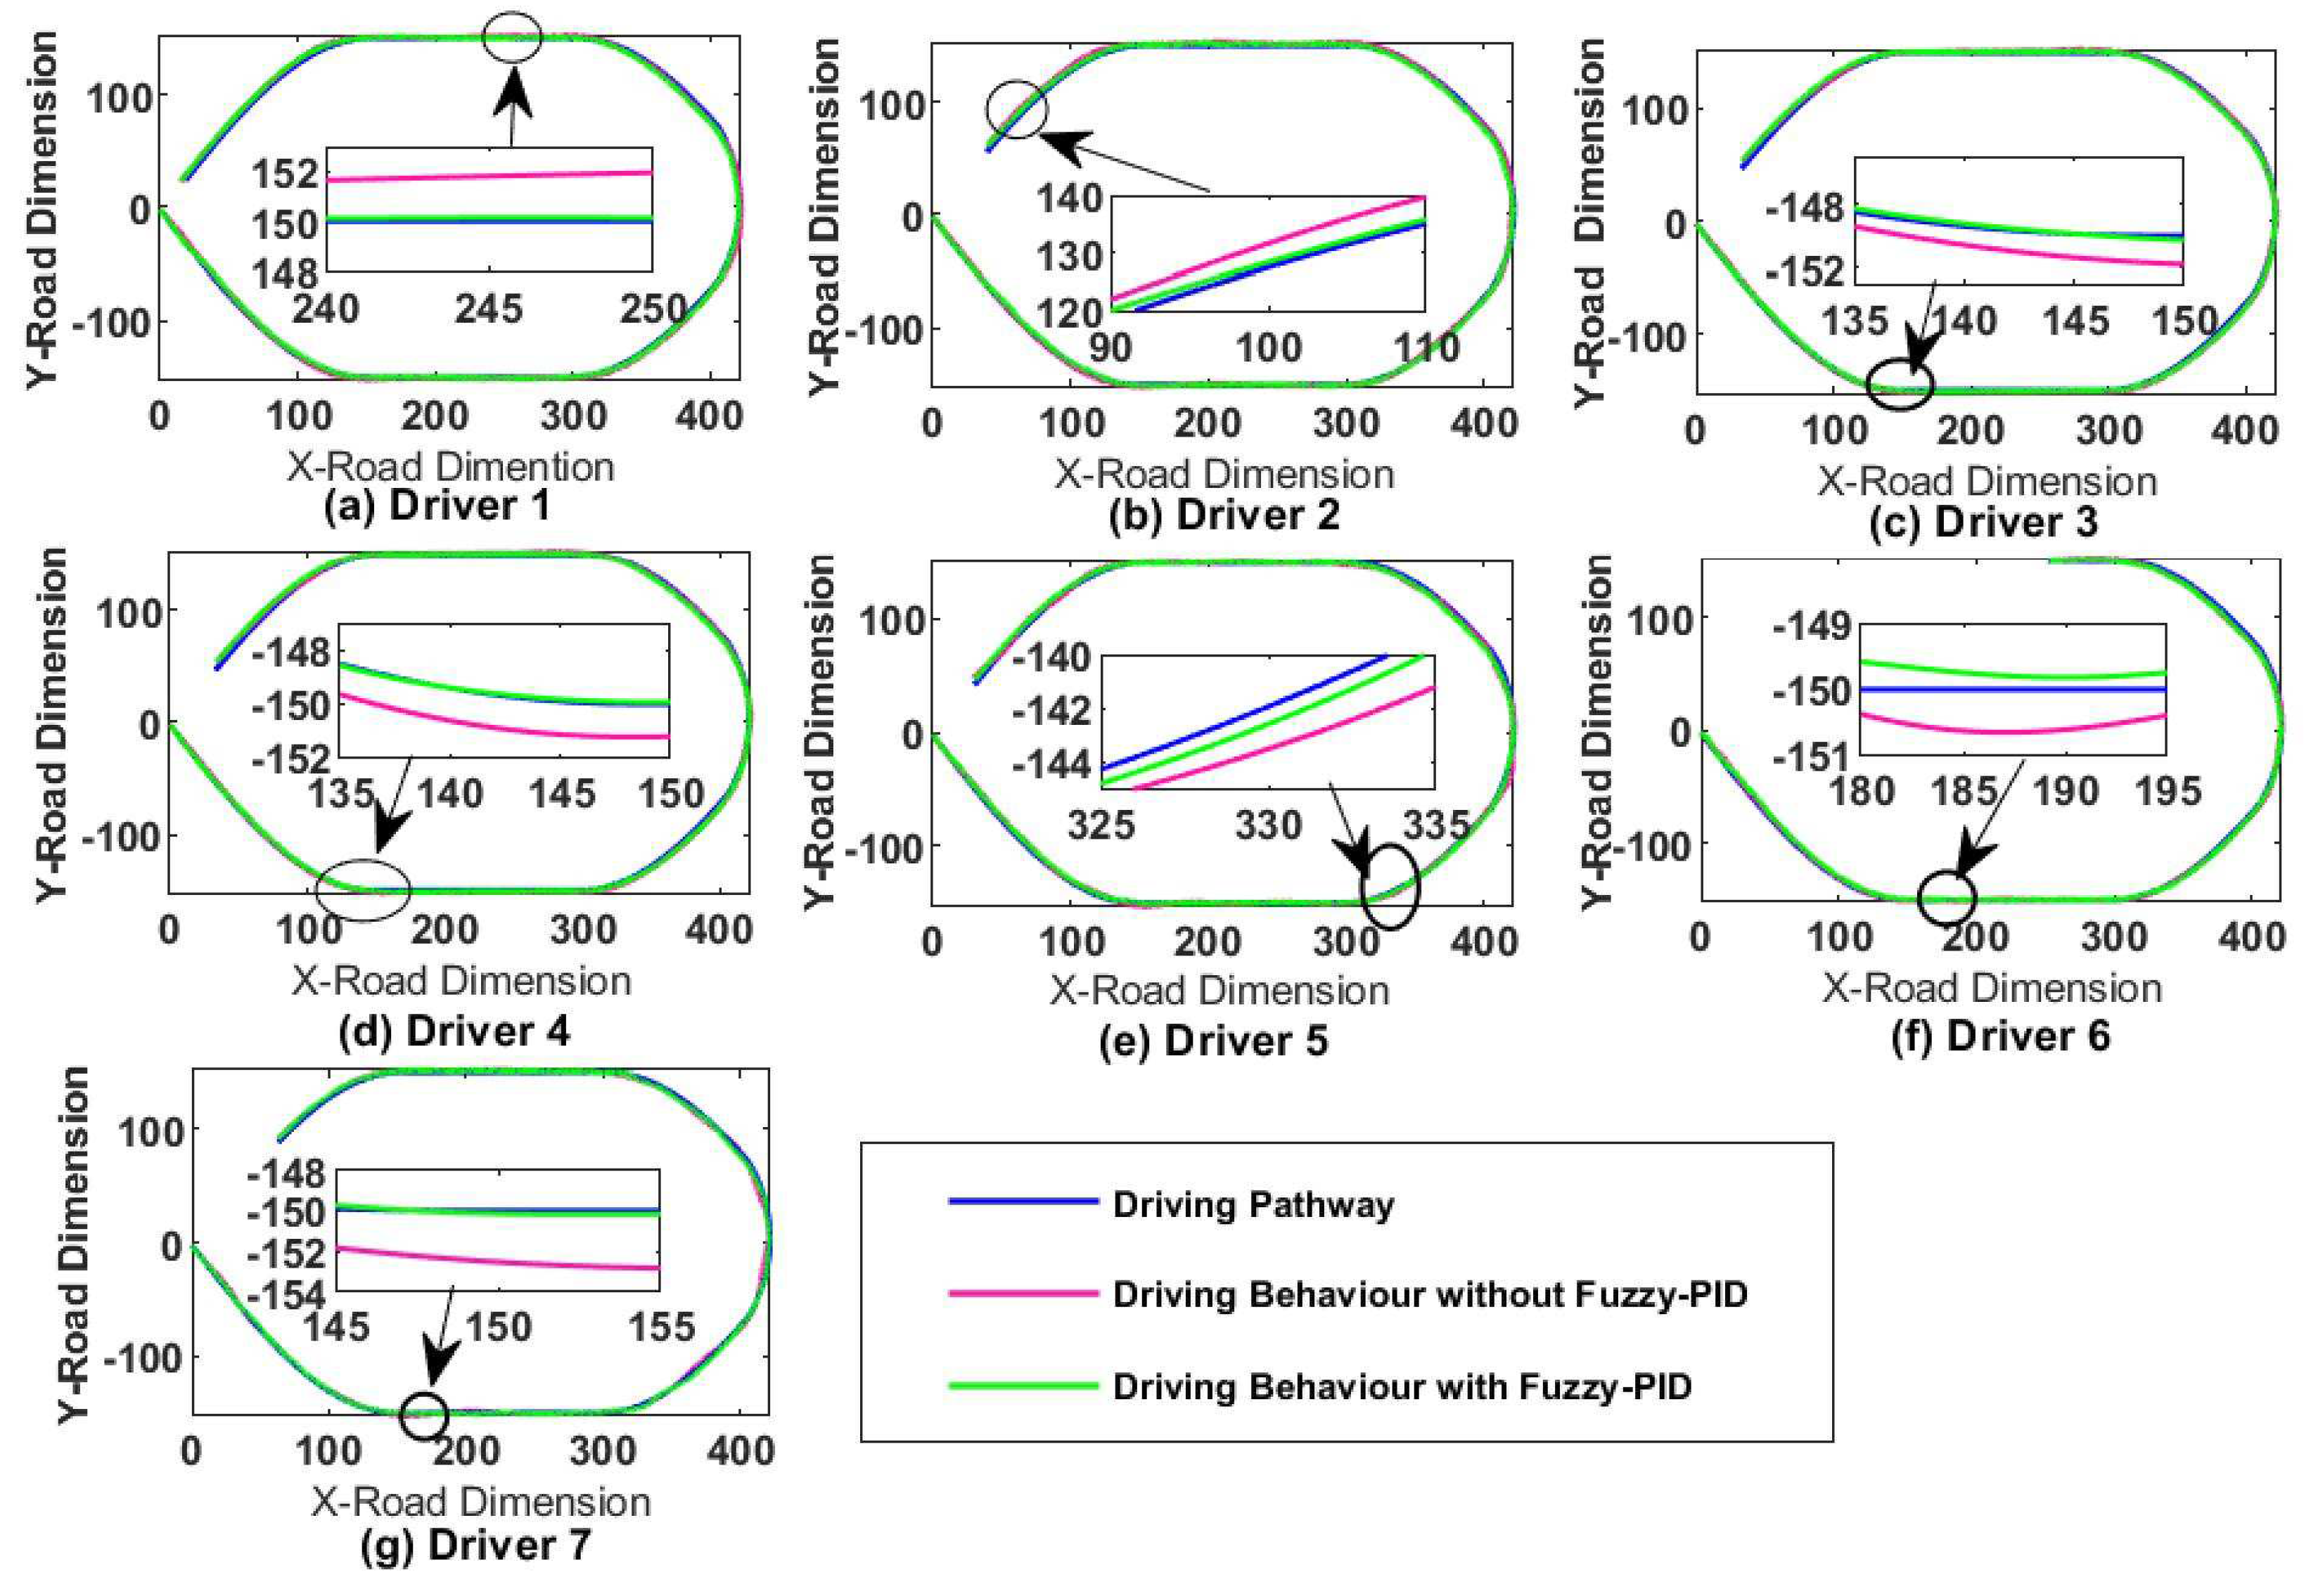
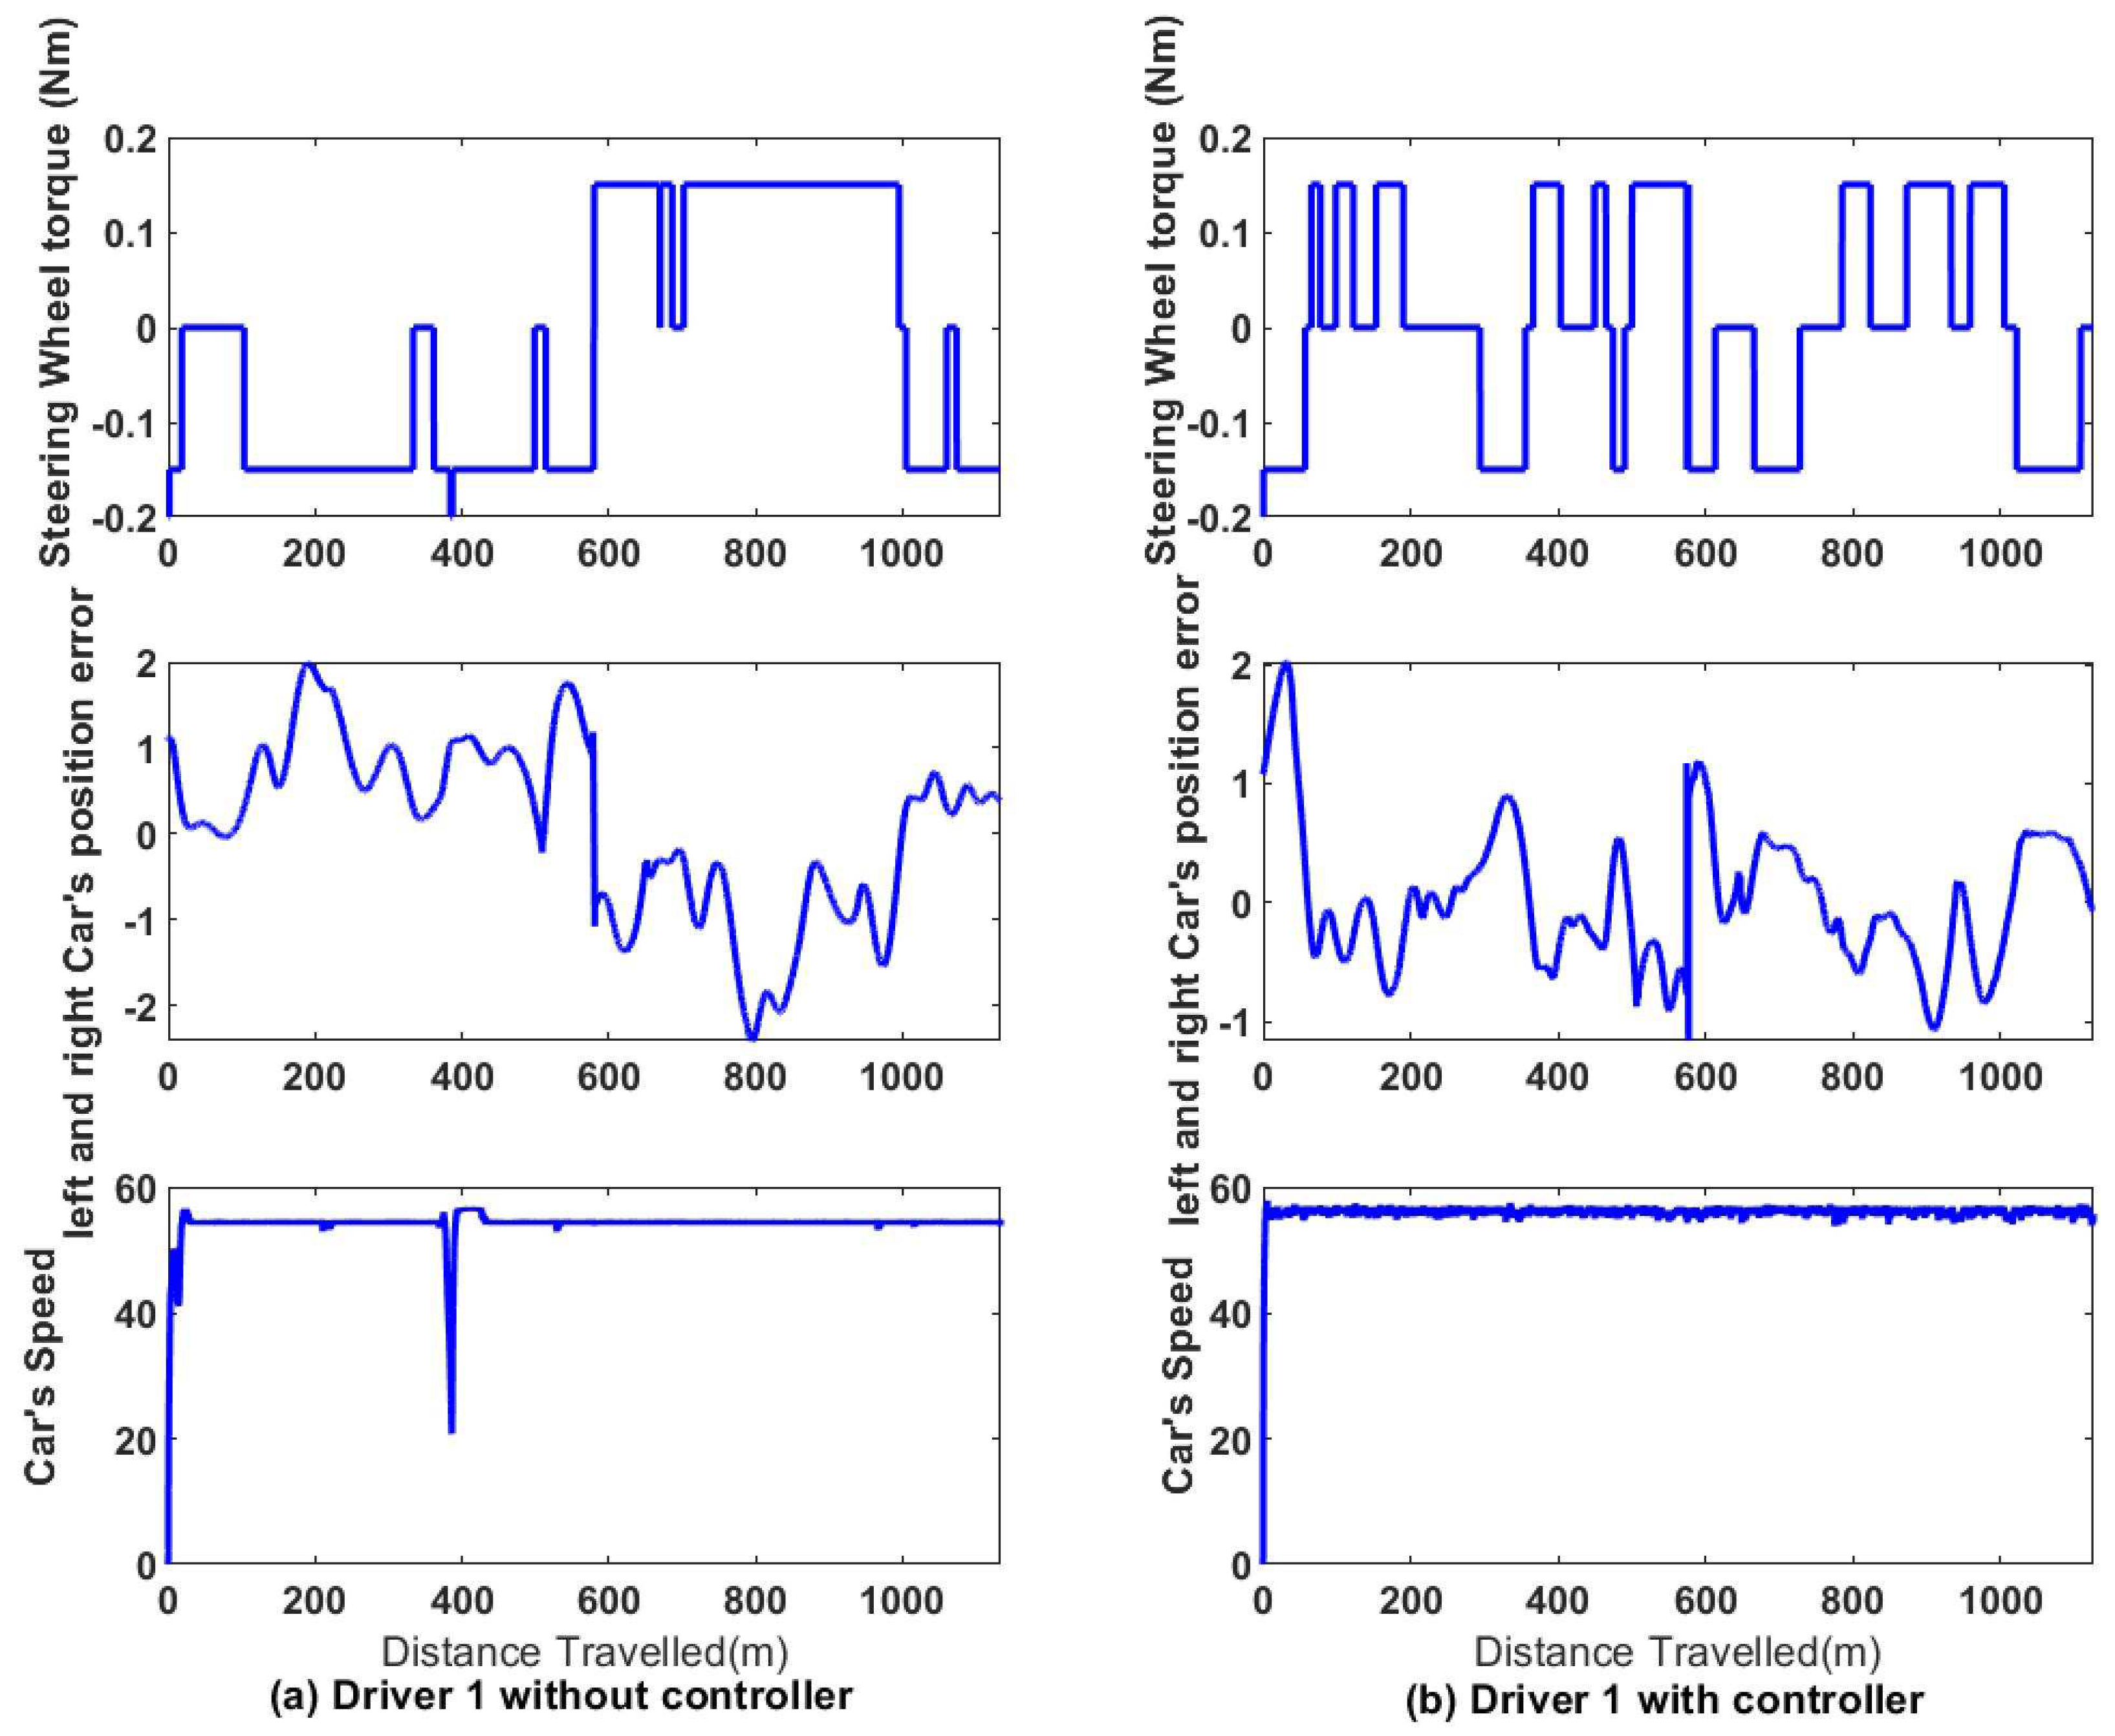
Figure 20 below represents the seven driving behaviours for a specific pathway in two different situations. The results show how the Fuzzy-PID compensator assisted the driver in getting closer to the desired centerline in a straight line or when the car is subjected to a turn.
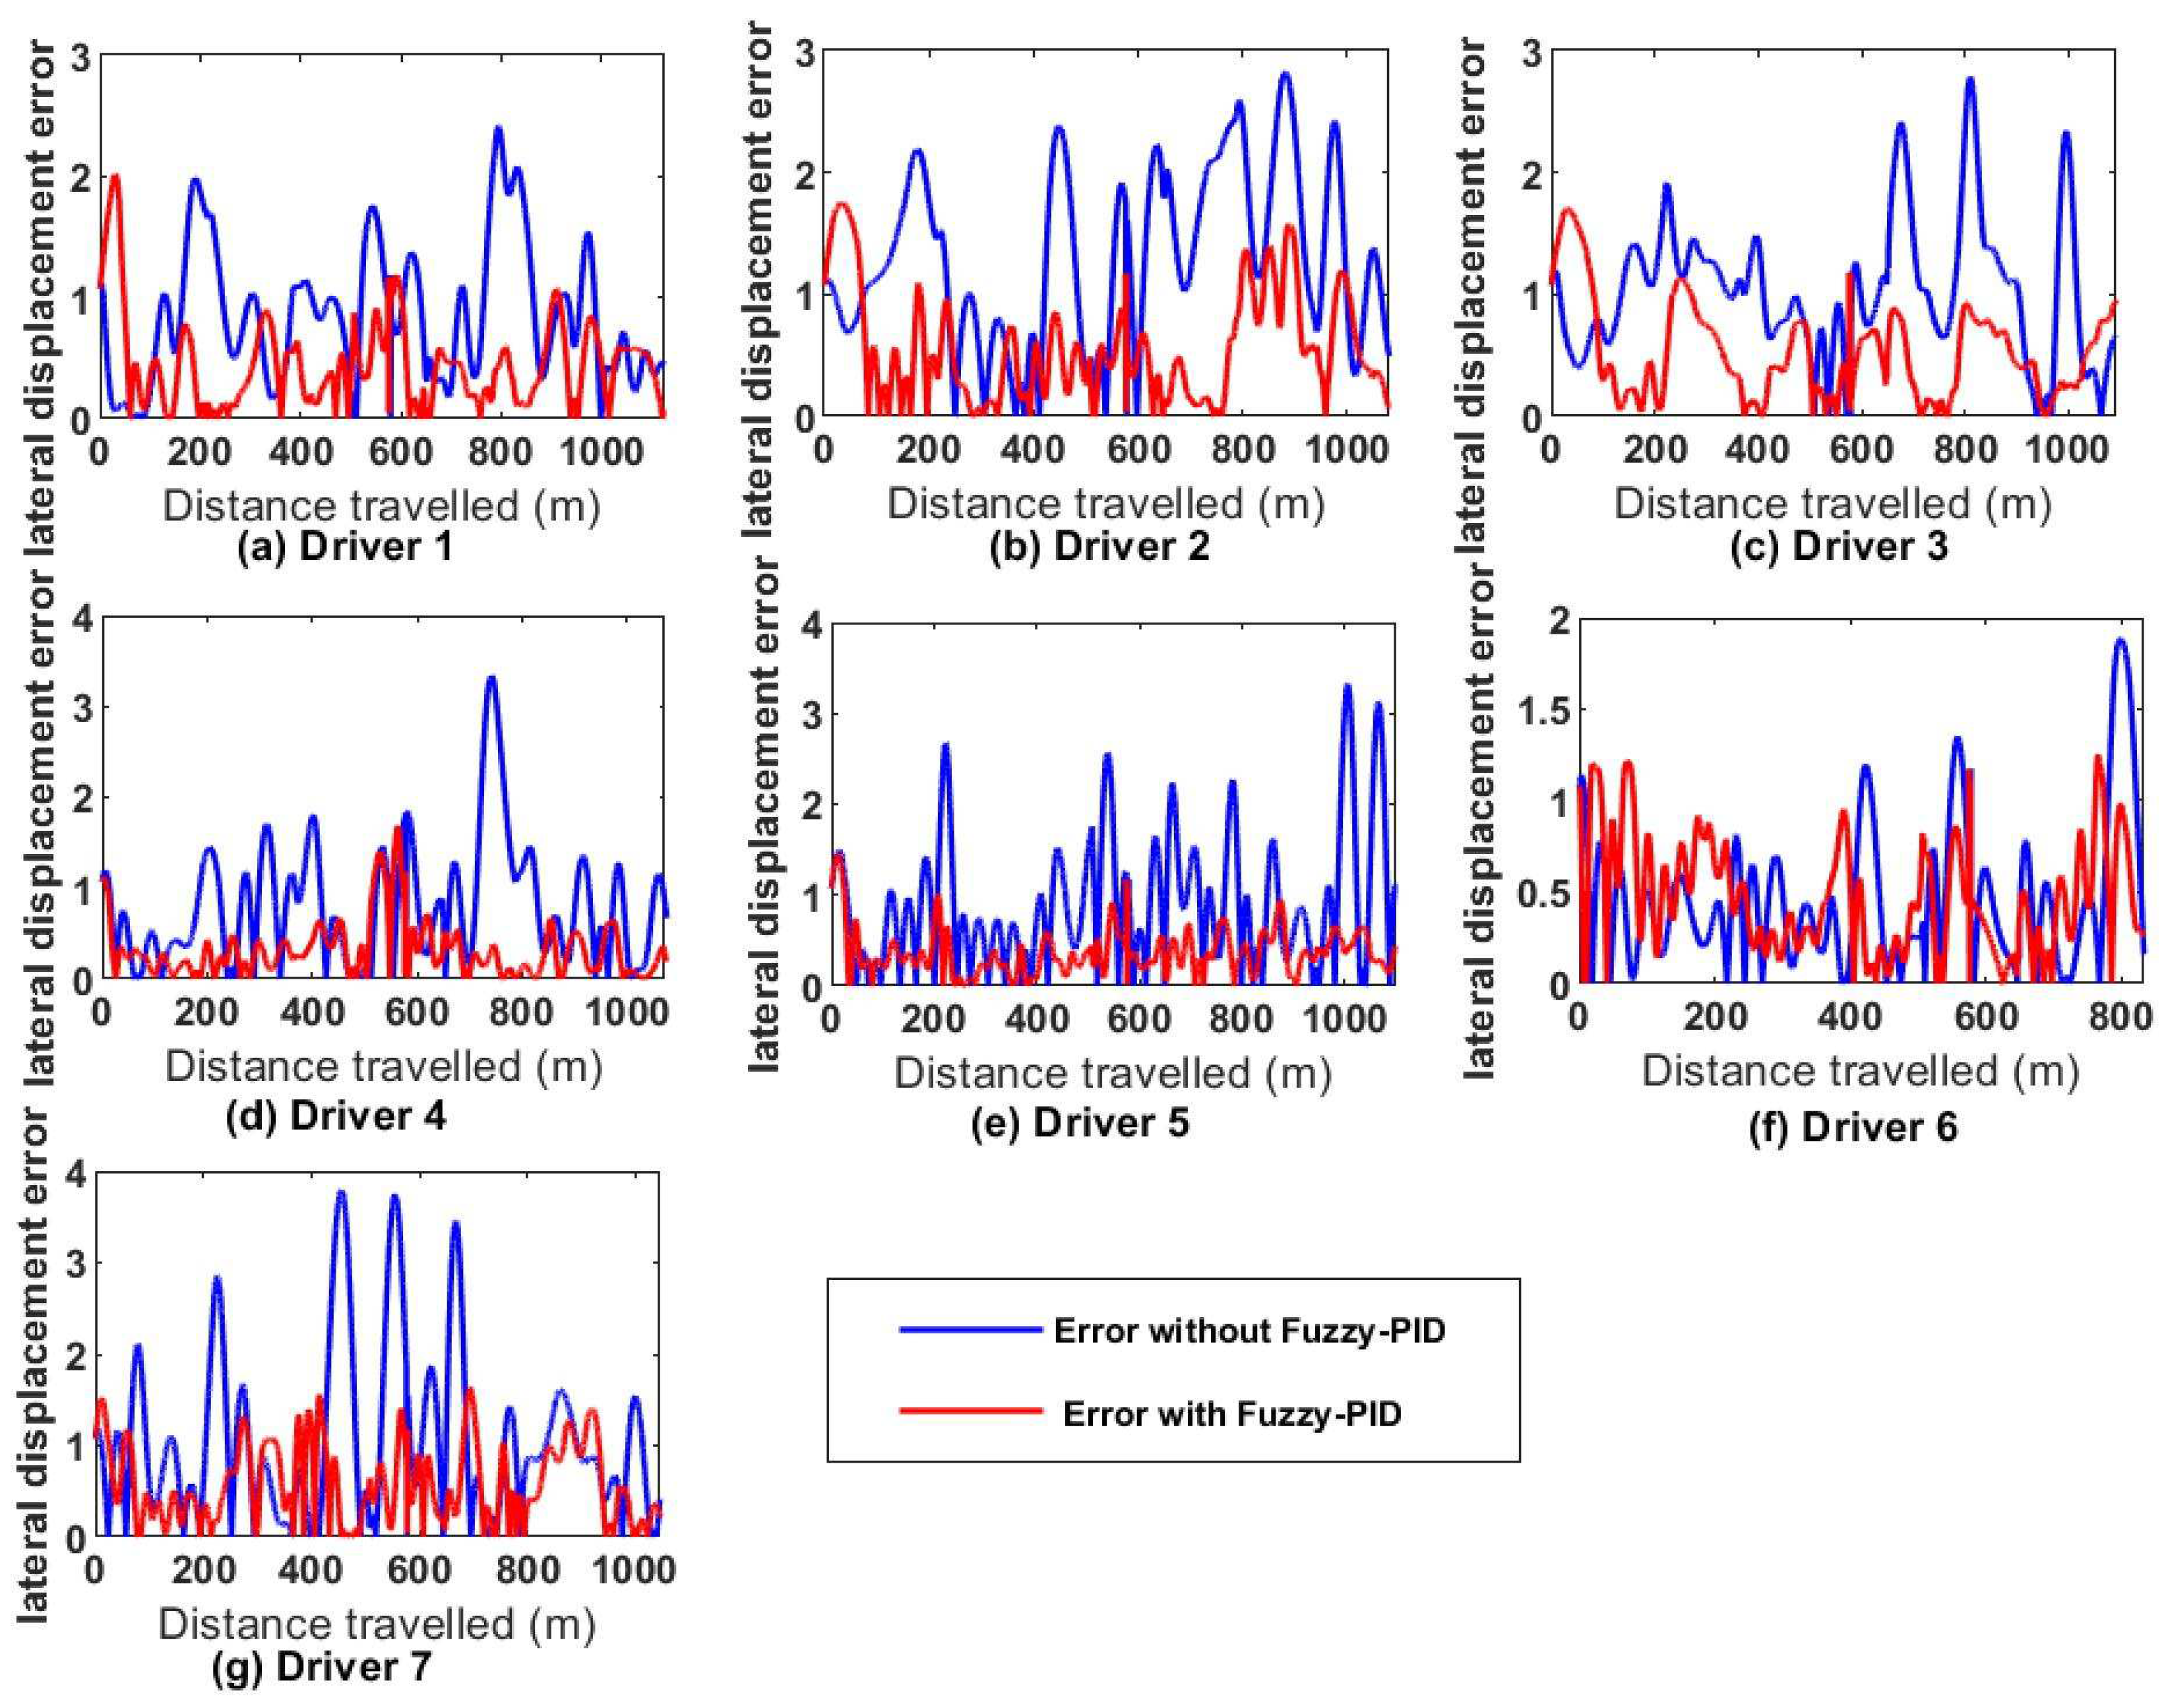
Figure 21 presents the curves representing the car’s lateral displacement error for sen driving behaviours with the data-driven controller (Fuzzy-PID) and without in function of the distance travelled by following a centre line. This result stipulates that the curve which illustrates the car’s lateral displacement error is higher for the driving behaviour without the compensator for all subjects (drivers). Based on the performance index of any task, the lower the error, the better the controller. The data-driven controller (Fuzzy-PID), based on his fuzzy rules and input and output fuzzy subset, tuned the PID parameters set to adjust the car’s position close to the reference, which is the centerline for the seven drivers. This difference in error corroborates with the result displayed in
Figure 20
5.4. Integral Time Absolute Error (ITAE) for Car Position
The outcome displayed in
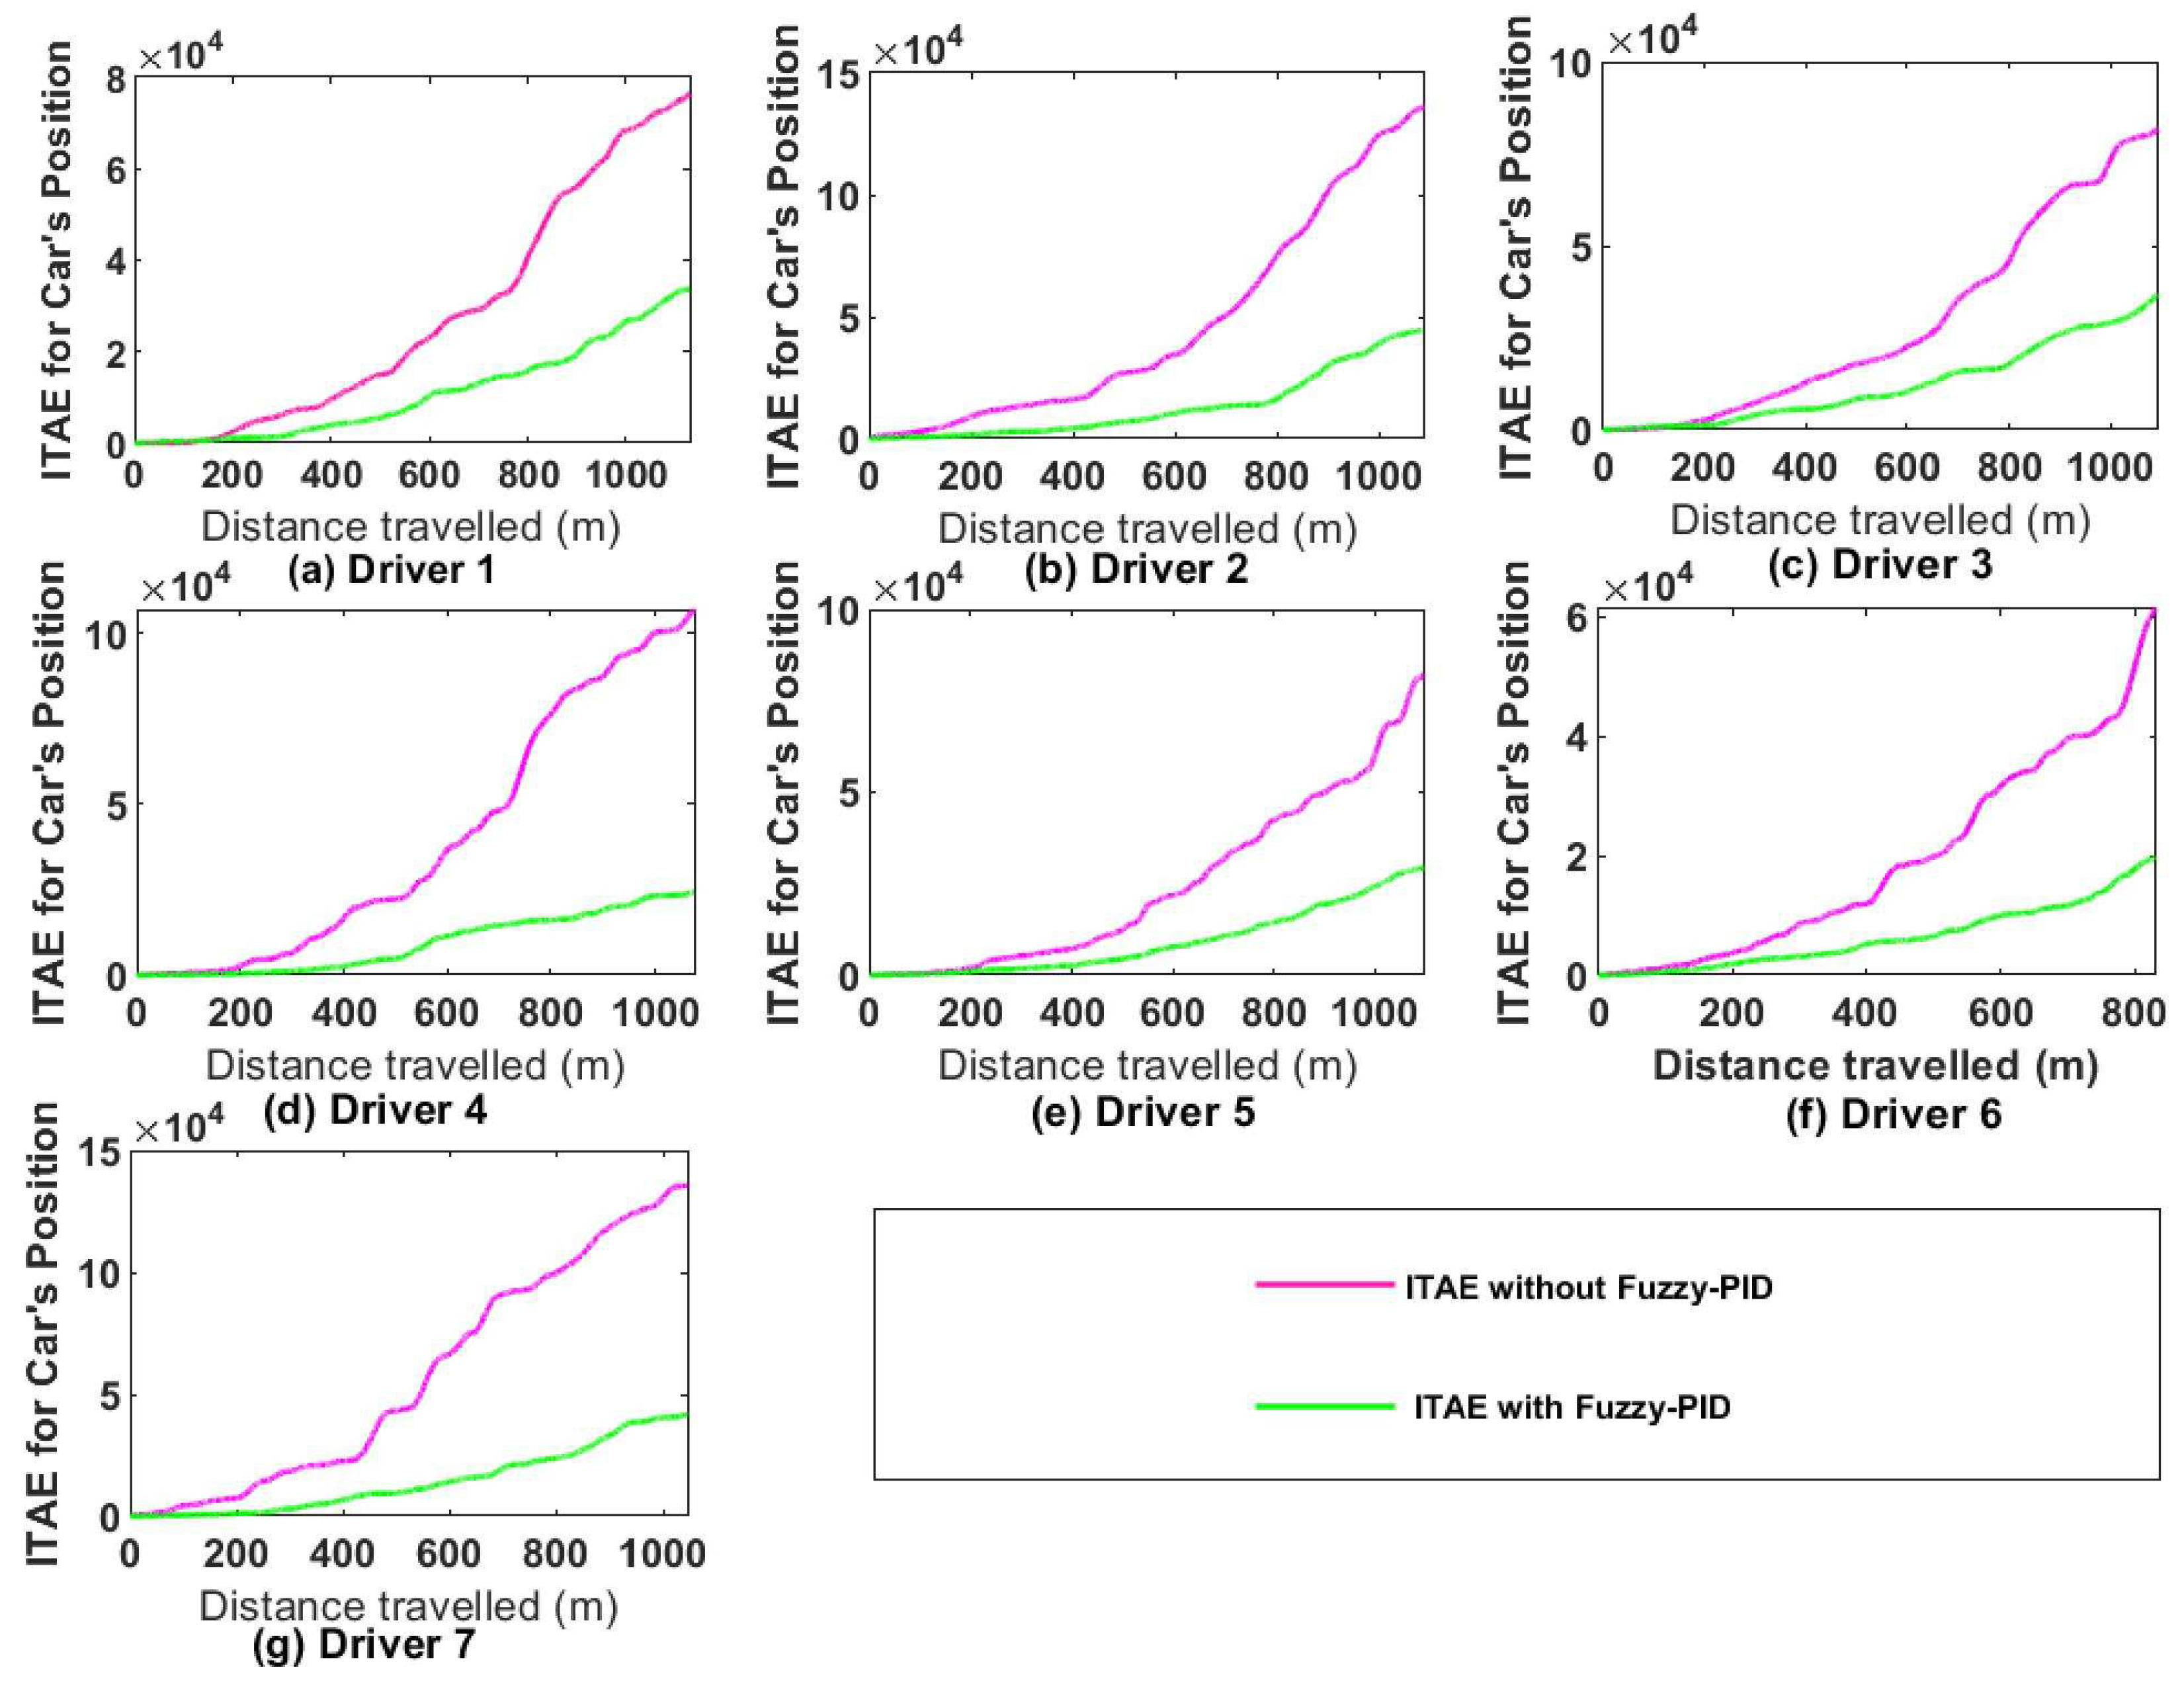
Figure 22 indicates the curve of the performance index (ITAE) of seven driving behaviours in car lateral displacement between a system with Fuzzy-PID and the system without for a given distance. The curve representing the performance index (ITAE) with fuzzy-PID is low, unlike the curve without the seven driving behaviours. These results show how the performance index is lower for the task duration of the driving behaviour combined with the Fuzzy-PID. It is essential to highlight that low ITAE is observed from drivers 1 to 7.
Table 7 compares the total Integral Time Absolute Error of the car position between the driving behaviour with Fuzzy-PID and without for a given job. This table confirms the curve presented in
Figure 22. The presented values demonstrate that the driving behaviour error due to the car position and the desired pathway is significantly low for all the drivers with the compensator (Fuzzy-PID). The improvement recorded varies between 56% to 77%. The progress noticed in each driving behaviour reveals the Fuzzy-PID controller’s robustness for this line-keeping scenario.
5.5. Integral Time Absolute Error (ITAE) for Car Orientation
Figure 23 and
Table 8 show how the performance index (ITAE) of the car orientation for various driving behaviours has been affected by the fuzzy-PID controller for a given task. The curves and the
Table 8 indicated the improvement of the driving behaviour for car orientation for all the drivers. This improvement is low for some drivers while significant for others. The enhancement fluctuates between 6.1% to 63%.
5.6. Haptic feedback torque
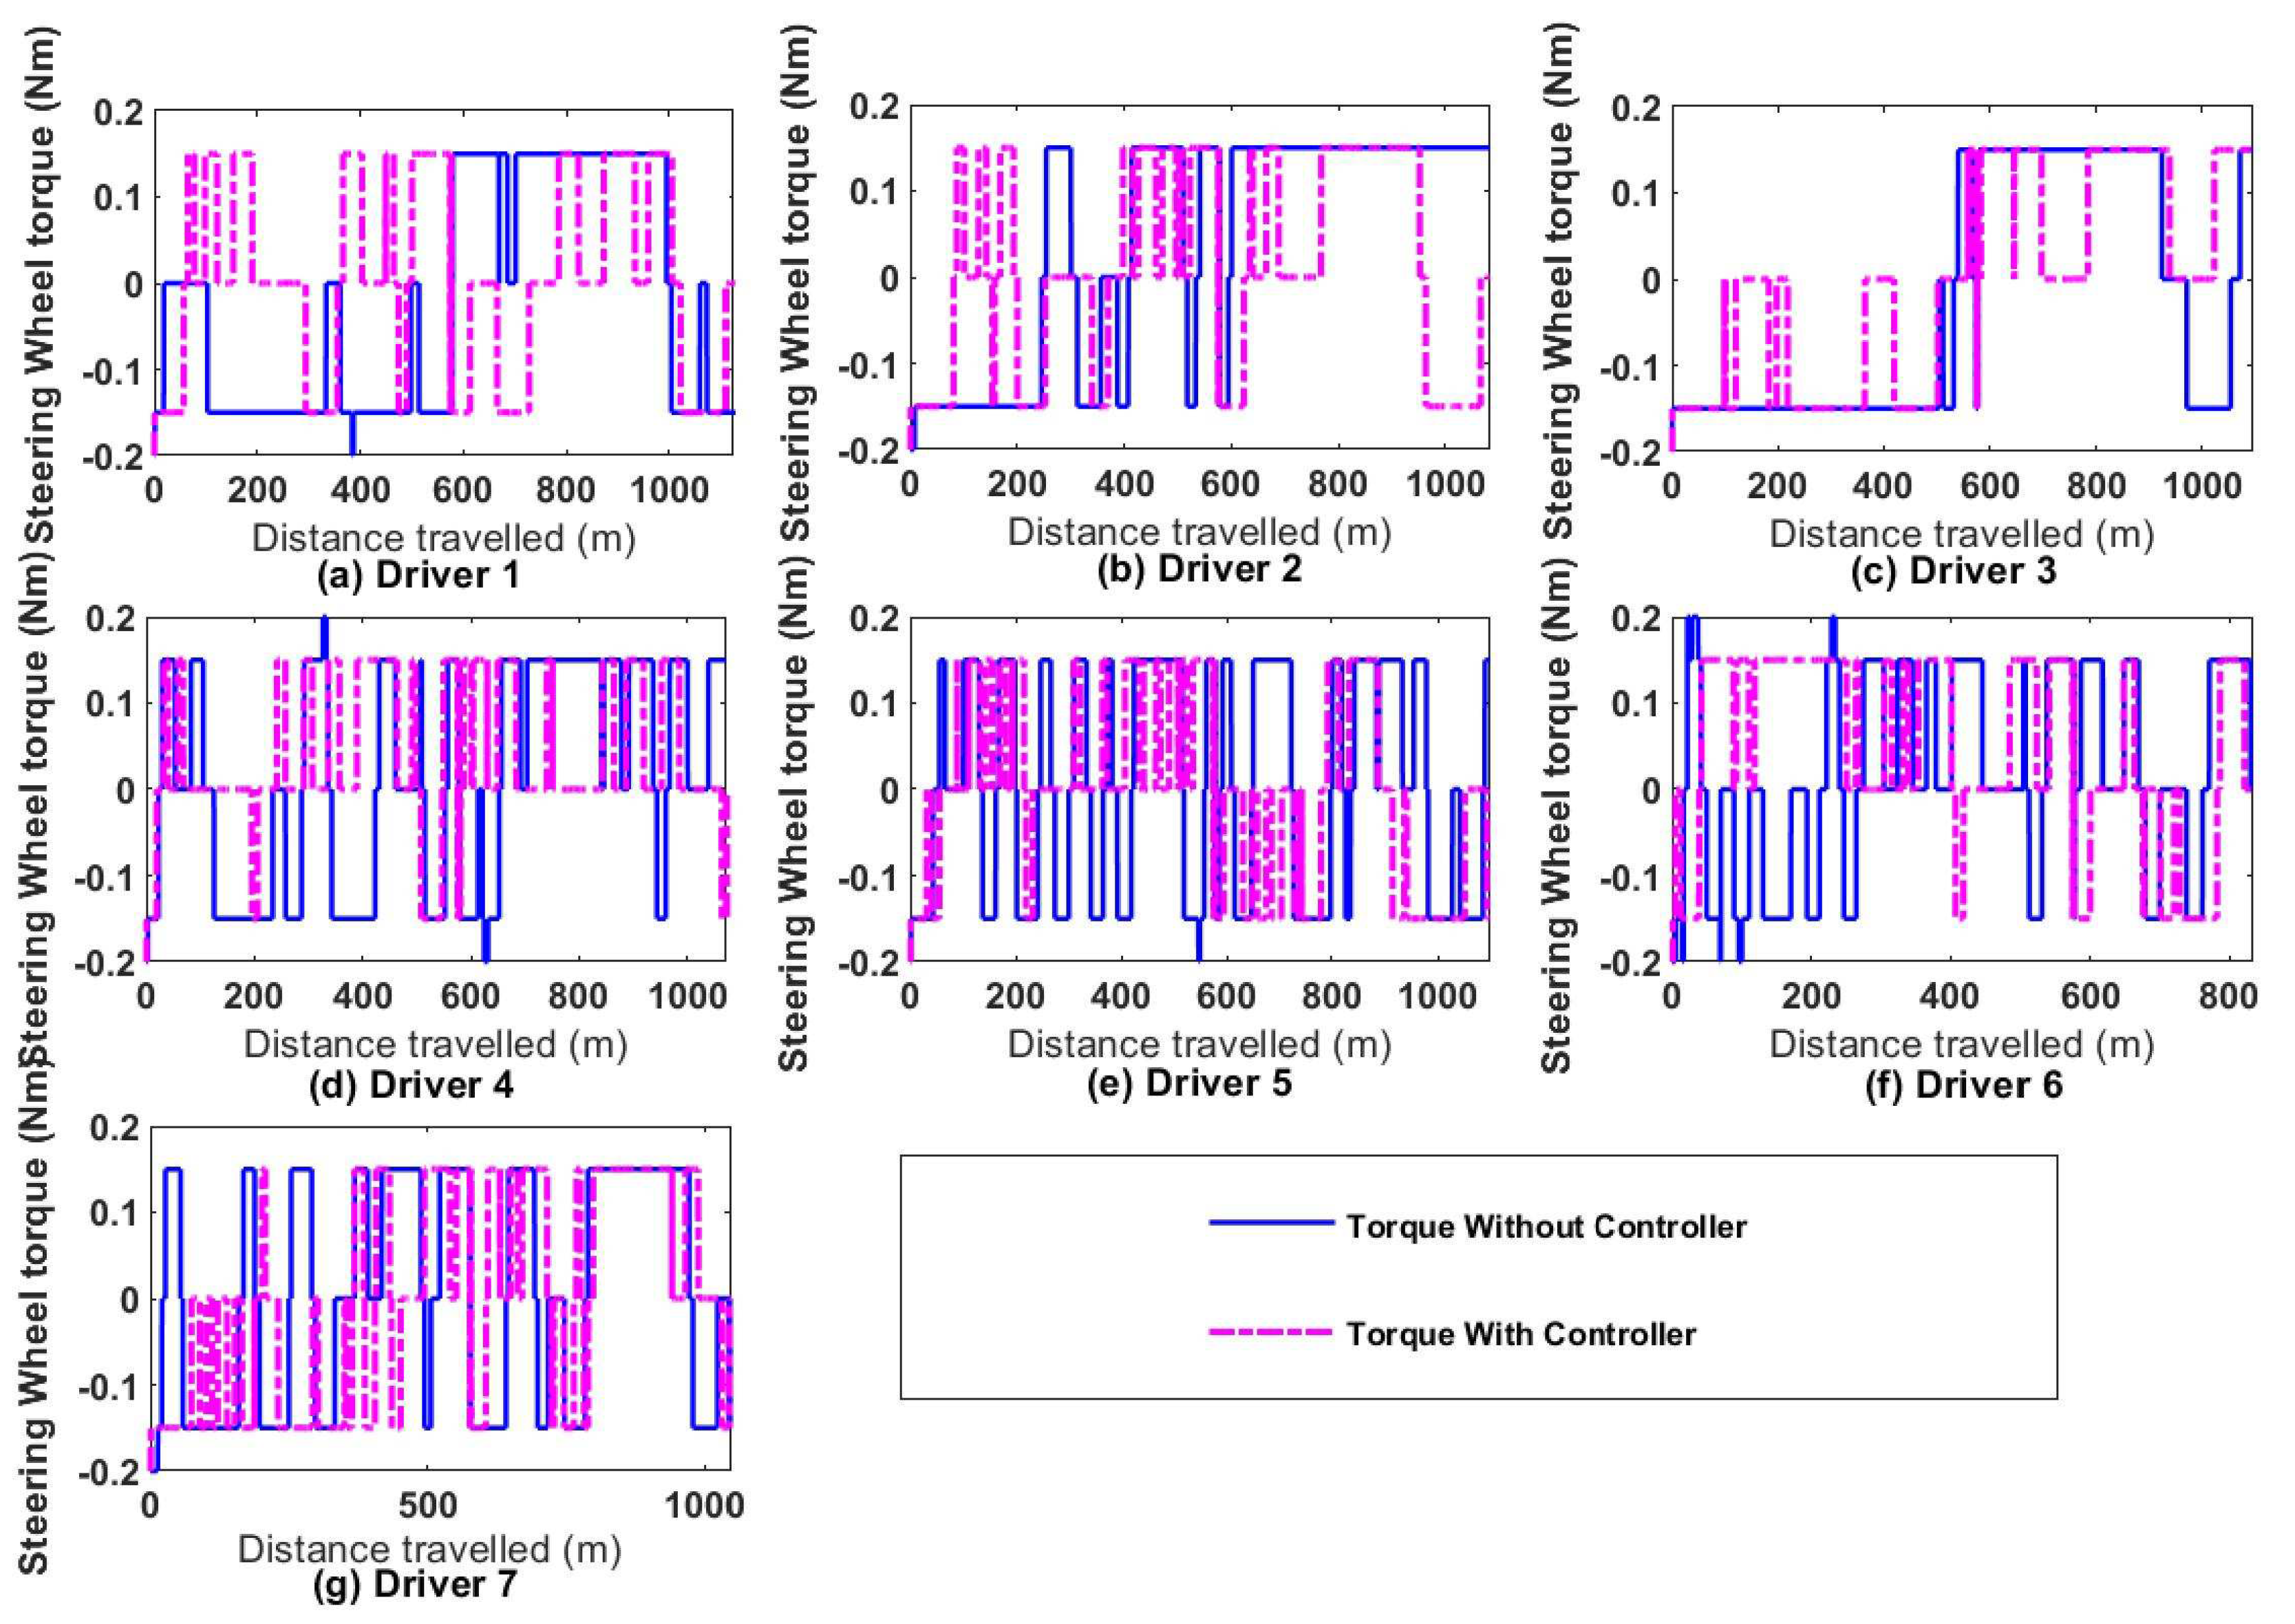
Figure 24 compares the driver’s use of haptic feedback torque on the steering wheel in two situations (with and without the Fuzzy-PID). The driver with higher performance or with the controller shows less assistive feedback torque, unlike the system without. This can be proven by looking at how often the haptic force feedback curve keeps on the origin line of the X-axis because, at the origin, the torque is zero (0), meaning that the drivers do not need any assistance.
Table 9 indicates the total torque needed for each driving behaviour after a complete task. The values are small with the proposed Fuzzy-PID compared to the system without this controller.
Reducing the assistive feedback torque on the steering wheel diminishes the conflict between the driver and the haptic feedback system. Furthermore, the after-effect during continuous haptic feedback torque is also reduced.
The outcome presented in
Figure 25 confirms that the bandwidth haptic feedback guidance provided the assistive steering wheel torque when the predicted car’s lateral displacement error exceeded 0.3m with reference to the lane centre. The amount of haptic assistive torque depends on the car’s position, the error bandwidth and the driving speed. These results show that when the car’s lateral error exceeds the following interval [0.3 m -0.3m], and the car’s speed lower than 30m/s, the bandwidth assistive guidance provided a torque of ±0.2N.m and when the speed exceeded 30m/s, the assistive steering wheel torque was ±0.15N.m. This force difference is because the steering wheel angle is too sensitive at high velocity. In addition, when the car’s position is within the mentioned interval, the drivers are not assisted. The haptic forces feedback with the controller shows that the driver, in many situations, drove within the required interval compared to the scenario without the controller. The curve representing the torque feedback with the Fuzzy-PID controller stays more at the zero (0) axis, unlike the curve without.
6. Discussion
In this study, the proposed driving behaviour controller was designed. This fuzzy-PID controller combined the fuzzy logic technique with the PID controller, which considered the non-linearity of human behaviour, individual driving styles and the complexity of the human-car-road system to minimise the car position and orientation error following a centre line, unlike a system without. This section of the paper will analyse and highlight the performance of the proposed model-free driving behaviour controller with a haptic force feedback system through several results obtained after conducting experiments.
Due to the non-linearity of the driving behaviour, which can be caused by multiple factors such as unique driving style, weather conditions, and road structure, the BPNN was used as the driving behaviour model architecture. The driving simulator data was collected, processed, trained, tested, and validated. The Results displayed in
Figure 12 shows the performance of the BPNN plot for various driving behaviour where the training, validation, and testing curve performance (MSE) decrease with the Epoch number.
Table 2 illustrated how the mean square error was low (from 0.14 to 0.37), the regression value was between 80.3% to 93%, and the epochs fluctuated between 100 and 520. These results show the flexibility of the driving behaviour BPNN because it handled multiple driving input characteristics (position and orientation angle error) and output action (steering wheel angle, car’s acceleration). In addition, it has shown its adaptability to non-linear driving behaviour or dynamic systems where its weight was well updated for a change of situation to improve the driving behaviour action. The driving behaviour BPNN model presented in
Figure 13 demonstrated how well the model was closer to the driving simulator pathway; this result was also due to the data processing (data normalisation and denormalisation). In this study, the driving behaviour model was mapped by a BPNN and the data-driven controller was opted for. A GA-PID controller was used where the genetic algorithm approach found the optimal PID controller gains offline to avoid manual tuning. In the process of this controller, the ITAE was used as the fitness function (combined car’s position error and orientation angle error) and the performance index. The GA was used to search for the best PID controller gains that minimised the ITAE index.
Table 2 presents different optimal PID parameters est obtained by the GA for a given travelled distance, and
Figure 15 and
Figure 16 show how low the ITAE criterion for a car’s lateral displacement and orientation is with a system with GA-PID compare to a system without, this observation can also be seen in
Table 2 and
Table 3 where the improvement is noticed (22% to 83% for car’s position and 1.2% to 21.8% for the car’s orientation). It can be concluded that the GA provides a low ITAE index for all driving behaviours based on the car’s position and orientation angle, which shows evidence of the performance of the GA-PID controller to get closer to the desired pathway.
Based on the individual driver’s personality, human being inaccuracy and uncertainties during a given driving task, the Fuzzy-PID controller used the fuzzy logic approach to provide the best PID gains set that improve the performance of the controller by monitoring various driving profiles such as the car’s lateral displacement error, car’s orientation error, and the speed, which create uncertainty operating condition for each driver. Based on the current driving task of each driver, the Fuzzy logic section adjusted the parameters set (
,
,
) of the PID controller dynamically, which directly impacted the steering wheel angle and therefore, enhanced the performance of the controller by reducing the car’s lateral error and car’s orientation angle. The results indicated in
Figure 18 show that the PID parameters set are changing dynamically based on the change in driving profile, such as speed, variation of car’s lateral error and car orientation angle error for a travelled distance. The results indicated in
Figure 22,
Figure 23 and
Table 7,
Table 6 also revealed the robustness and the adaptability of the Fuzzy-PID controller meaning its ability to encounter different driving behaviour for various drivers.
Figure 19 illustrates the unstable driving speed of a system without a controller. This variation is due to the instability of the steering wheel angle; the same graph shows various constant speeds with the system with the Fuzzy-PID controller. Tablet5 shows that the Fuzzy-PID controller impacted the driving speed. The average car’s speed is low (33.3m/s to 54m/s) for driving behaviour without a controller and high (53.7m/s to 56.12m/s). These pieces of information affirm that the Fuzzy-PID controller improves the car’s lateral position or orientation angle and enhances the driving ability by allowing the individual to use a high and constant speed when keeping the vehicle on a centre line for a given task.
The haptic feedback torque results also point out that the drivers were not assisted when the lateral error was within the bandwidth ([0.3m -0.3m]),
Figure 25 and
Table 9 demonstrated that the driving behaviour with the fuzzy-PID controller drove for some distance without the haptic feedback assistance. The values shown in
Table 9 affirmed that the proposed controller had improved the driving skill of all the drivers because the total amount of torque recorded for a travelled distance with the system without the Fuzzy-PID controller is higher, unlike the total amount of driving behaviour with the proposed controller which is lower. This Table also revealed that the improvement of driving without assistive torque varies from 29% to 59.32%, which means that the proposed data-driven Fuzzy-PID controller has significantly reduced the drivers after effect caused by the continuous haptic guidance.
In conclusion, all the procedures and performances obtained in this work, such as the car’s lateral position, orientation angle error improvement, the driving speed enhancement and the low assistive haptic feedback force, exhibit that various driving behaviours of different drivers and changed situations was controlled by designing an effective combined Fuzzy logic and a PID controller parameter set. The fuzzy logic input and output profile were determined by mapping the driving behaviour based on BPNN; then, the BPNN model and the GA-PID were used to find the best fitness function that generated the optimal PID parameter set.
7. Conclusion
This paper presented a proposed model-free Fuzzy-PID controller, which addressed the challenges of minimising different driving behaviour errors caused by the individual driving style(Car’s position and orientation angle, the car’s speed) and the road geometric situation ( straightway and corner road). This proposed controller combined the Fuzzy logic technique with the PID controller, which did not need a mathematical model. The genetic algorithm obtained the optimal PID gains set utilised in the proposed Fuzzy-PID controller, which minimised the simultaneous loss function ITAE of the car’s position and orientation error offline. This Dynamic change of the PID parameters set in different driving situations or styles adjusted the steering wheel angle, allowing the car’s position and orientation angle to get closer to the desired pathway.
The discussion and the experimental results analysis of the proposed controller revealed that the performance index ITAE of the car’s lateral displacement error and ITAE for the car’s orientation angle error for induvial driving behaviours was reduced significantly; the lower ITAE, the better controller performance. Furthermore, the small influence of haptic steering wheel feedback torque (low aftereffect) on drivers and the ability of each driving behaviour performance in different operating situations consolidated the performance of the Fuzzy-PID controller to handle various driving styles. The simulation and experiment outcomes have validated the proposed fuzzy-PID controller’s flexibility, effectiveness, and robustness in driving behaviour.
However, future research needs to enhance the proposed controller by further improving the driving behaviour error by considering the road condition (dry, ice). In addition, a further study on a new controller that will take into consideration the conflict between the haptic steering feedback torque and the driver will improve the comfortability of the driver.
Author Contributions
Conceptualisation, S.D., S.I.N.T., and K.D.; methodology, S.I.N.T. and S.D.; validation, S.D., K.D., and S.I.N.T., L.Q; formal analysis, S.I.N.T.; resources, S.D., S.I.N.T., and K.D.; L.Q writing—original draft preparation, S.I.N.T.; writing—review and editing, S.D., S.I.N.T., and K.D., L.Q; supervision, S.D. and K.D. All authors have read and agreed to the published version of the manuscript.
Funding
This research is partly funded by the National Research Foundation of South Africa (Grant: 145975), and Scientific Research Foundation of Department of Education of Yunnan Province (Grant:2022J0635).
Acknowledgments
Our gratitude and appreciation go to the National Research Foundation, French South Africa Institute of Technology (F’SATI), and all members and colleagues of the Tshwane University of Technology (TUT), especially the Department of Electrical Engineering, for providing the facilities and material to conduct this research.
Conflicts of Interest
The authors declare no conflict of interest.
References
- Aufrère, R.; Gowdy, J.; Mertz, C.; Thorpe, C.; Wang, C.C.; Yata, T. Perception for collision avoidance and autonomous driving. Mechatronics 2003, 13, 1149–1161. [Google Scholar] [CrossRef]
- Sun, P.; Song, R.; Wang, H.; Thorpe, C.; Wang, C.C.; Yata, T. Analysis of the causes of traffic accidents on roads and countermeasures. Safety and environmental engineering 2007, 2. [Google Scholar]
- Langlois, P.H.; Smolensky, M.H.; Hsi, B.P.; Weir, F.W. Temporal patterns of reported single-vehicle car and truck accidents in texas, usa during 1980-1983. Chronobiology international 1985, 2, 131–140. [Google Scholar] [CrossRef]
- Summala, h.; Mikkola, T. Fatal accidents among car and truck drivers: effects of fatigue, age, and alcohol consumption. Human factors 1994, 36, 315–326. [Google Scholar] [CrossRef] [PubMed]
- Pack, A.I.; Pack, A.M.; Rodgman, E.; Cucchiara, A.; Dinges, D.F.; Schwab, C.W. Characteristics of crashes attributed to the driver having fallen asleep. Accident analysis and prevention 1995, 27, 769–775. [Google Scholar] [CrossRef] [PubMed]
- Navarro, J.; Mars, F.; Young, M.S. Lateral control assistance in car driving: Classification, review and future prospects. IET Intell. Transp. Syst. 2011, 5, 207–220. [Google Scholar] [CrossRef]
- Jermakian, J.S. Crash avoidance potential of four passenger vehicle Technologies. Accid. Anal. Prev. 2011, 43, 732–740. [Google Scholar] [CrossRef]
- Endsley, M.R.; Kaber, D.B. Level of automation effects on performance, situation awareness and workload in a dynamic control task. Ergonomics 1999, 42, 462–492. [Google Scholar] [CrossRef]
- Abbink, D.A.; Mulder, M.; Boer, E.R. Haptic shared control: Smoothly shifting control authority? Cogn. Technol. Work. 2012, 14, 19–28. [Google Scholar] [CrossRef]
- Kienle, M.; Dambock, D.; Bubb, H.; Bengler, K. The ergonomic value of a bidirectional haptic interface when driving a highly auto mated vehicle. Cognition 2013, 15, 475–482. [Google Scholar]
- Mulder, M.; Abbink, D.A.; Boer, E.R. The effect of haptic guidance on curve negotiation behavior of young, experienced drivers. In Proceedings of the IEEE International Conference on Systems, Man and Cybernetics, Singapore, 12–15 October 2008; pp. 804–809. [Google Scholar]
- Goodrich, K.H.; Schutte, P.C.; Flemisch, F.O.; Williams, R.A. Application of the h-mode, a design and interaction concept for highly automated vehicles, to aircraft. In Proceedings of the IEEE/AIAA 25TH Digital Avionics Systems Conference, Portland, ON, USA, 15–19 October 2006; pp. 1–13. [Google Scholar]
- Wang, Z.; Zheng, R.; Kaizuka, T.; Nakano, K. Driver-automation shared control: Modeling driver behaviour by taking account of reliance on haptic guidance steering. In Proceedings of the IEEE Intelligent Vehicles Symposium (IV), Changshu, China, 26–30 June 2018; pp. 144–149. [Google Scholar]
- Saleh, L.; Chevrel, P.; Mars, F.; Lafay, J.F.; Claveau, F. Human-like cybernetic driver model for lane keeping. IFAC Proc. Vol. 2011, 44, 4368–4373. [Google Scholar] [CrossRef]
- Mars, F. Driving around bends with manipulated eye-steering coordination. Journal of Vision. 2008, 8, 10. [Google Scholar] [CrossRef] [PubMed]
- Sentouh, C.; Chevrel, P.; Mars, F.; Claveau, F. A sensorimotor driver model for steering control. In Proceedings of the 2009 IEEE International Conference on Systems, Man and Cybernetics, San Antonio, TX, USA, 11–14 October 2009; pp. 2462–2467. [Google Scholar]
- Keen, S.D.; Cole, D.J. Bias-free identification of a linear model predictive steering controller from measured driver steering behavior. IEEE Trans. Syst. Man, Cybern. Part B Cybern. 2012, 42, 434–443. [Google Scholar] [CrossRef] [PubMed]
- Prokop, G. Modeling human vehicle driving by model predictive online Optimization. Veh. Syst. Dyn. 2001, 35, 19–53. [Google Scholar] [CrossRef]
- Guo, H.; Ji, Y.; Qu, T.; Chen, H. Understanding and modeling the human driver behavior based on mpc. In Proceedings of the 7th IFAC Symposium on Advances in Automotive Control the International Federation of Automatic Control, Tokyo, Japan, 4–7 September 2013; pp. 133–138. [Google Scholar]
- Qu, T.; Chen, H.; Cong, Y.; Yu, Z. Modeling the driver behavior based on model predictive control. Proceedings of International Conference on Advanced Vehicle Technologies and Integration, Changchun, China, 16-19 July 2012. [Google Scholar]
- Qu, T.; Chen, H.; Ji, Y.; Guo, H.; Cao, D. Modeling driver steering control based on stochastic model predictive control. In Proceedings of the 2013 IEEE International Conference on Systems, Man, and Cybernetics, Manchester, UK, 13–16 October 2013; pp. 3704–3709. [Google Scholar]
- Shida, Y.; Okajima, H.; Matsuno, D.; Matsunaga, N. Evaluation of steering model depending on gazing distance by using driving simulator. In Proceedings of the 2016 16th International Conference on Control, Automation and Systems (ICCAS), Gyeongju, Korea, 16–19 October 2016; pp. 39–44. [Google Scholar]
- Menhour, L.; Lechner, D.; Charara, A. Vehicle steering control based on robust control for high lateral accelerations: Experimental evaluation. In Proceedings of the 13th International IEEE Conference on Intelligent Transportation Systems, Funchal, Portugal, 19–22 September 2010; pp. 587–592. [Google Scholar]
- Niu, Z.; Sun, Y. Control modeling for accelerator leg of robot driver. In Proceedings of the 2009 International Asia Conference on Informatics in Control, Automation and Robotics, Bangkok, Thailand, 1–2 February 2009; pp. 170–174. [Google Scholar]
- Dan, X.; Yong-bin, C.; Kai-qi, H.; Jian-zhong, Y. Controlling strategy research on active front steering system. 2011 international conference on consumer electronics, communications and networks (CECNet); 2011; pp. 4871–4874. [Google Scholar]
- Ercan, Z.; Carvalho, A.; Gokasan, M.; Borrelli, F. Modeling, identification, and predictive control of a driver steering assistance system. IEEE Trans.-Hum.-Mach. Syst. 2017, 47, 700–710. [Google Scholar] [CrossRef]
- Lazcano, A.M.R.; Niu, T.; Akutain, X.C.; Cole, D.; Shyrokau, B. Mpc-based haptic shared steering system: A driver modelling approach for symbiotic driving. IEEE/ASME Trans. Mechatronics 2021, 26, 1201–1211. [Google Scholar] [CrossRef]
- Efremov, D.; Hanis, T.; Klauco, M. Haptic driver guidance for lateral driving envelope protection using model predictive control. In Proceedings of the 2020 IEEE Intelligent Vehicles Symposium (IV), Las Vegas, NV, USA, 19 October–13 November 2020; pp. 1992–1997. [Google Scholar]
- Ruslan, F.A.; Zakaria, N.K.; Adnan, R. Flood modelling using artificial neural network. 2013 IEEE 4th Control and System Graduate Research Colloquium Shah Alam, Malaysia, 19-20 August 2013; pp. 116–120. [Google Scholar]
- MacAdam, C.C.; Johnson, G.E. Application of elementary neural networks and preview sensors for representing driver steering control behaviour. Veh. Syst. Dyn. 1996, 25, 3–30. [Google Scholar] [CrossRef]
- Zheng, J.; Suzuki, K.; Fujita, M. Predicting driver’s lane-changing decisions using a neural network model. Simul. Model. Pract. Theory 2014, 42, 73–83. [Google Scholar] [CrossRef]
- Ying, S.; Jianguo, Q. A method of arc priority determination Based on Back-Propagation Neural Network. 2017 4th International Conference on Information Science and Control Engineering (ICISCE), Changsha, China, 21–23 July 2017; pp. 38–41. [Google Scholar]
- Buscema, M. Backpropagation neural networks. subst. mis 1998, 33, 73–83. [Google Scholar]
- Korkmaz, M., Aydoğdu, Ö., & Doğan, H. Design and performance comparison of variable parameter nonlinear PID controller and genetic algorithm based PID controller. 2012 International Symposium on Innovations in Intelligent Systems and Applications, Trabzon, Turkey, 2-4 July 2012; pp. 1–5.
- Budiman, E., Widians, J. A., Wati, M., & Puspitasari, N. Normalized Data Technique Performance for Covid-19 Social Assistance Decision Making-case: student’s internet data social assistance during learning from home due COVID-19. 2020 3rd International Conference on Information and Communications Technology (ICOIACT), Yogyakarta, Indonesia, 24-25 November 2020; IEEE; pp. 493–498.
- Al-Faiz, M. Z., Ibrahim, A. A., & Hadi, S. M. The effect of Z-Score standardization (normalization) on binary input due the speed of learning in back-propagation neural network. Iraqi Journal of Information and Communication Technology 2018, 1.
- Kumar, R., & Kumar, M. Improvement power system stability using unified power flow controller based on hybrid fuzzy logic-PID tuning in smib system. 2015 International Conference on Green Computing and Internet of Things (ICGCIoT), Greater Noida, India, 08-10 October 2015; pp. 815–819.
- Yakout, A. H., Kotb, H., Hasanien, H. M., & Aboras, K. M. Optimal fuzzy PIDF load frequency controller for hybrid microgrid system using marine predator algorithm. IEEE Access 2021, 9, 54220–54232.
- Chen, G., & Pham, T. T.Introduction to fuzzy sets, fuzzy logic, and fuzzy control systems. CRC press, 2000.
Figure 1.
Driving behaviour model using BPNN.
Figure 1.
Driving behaviour model using BPNN.
Figure 2.
Driver behaviour controller using GA-PID.
Figure 2.
Driver behaviour controller using GA-PID.
Figure 3.
Genetic Algorithm flowchart of GA-PID.
Figure 3.
Genetic Algorithm flowchart of GA-PID.
Figure 4.
various driving behaviour control due to Fuzzy-PID controller.
Figure 4.
various driving behaviour control due to Fuzzy-PID controller.
Figure 5.
Basic structure of fuzzy logic.
Figure 5.
Basic structure of fuzzy logic.
Figure 6.
The membership function of car Displacement (a), Orientation (b) error and Speed (c).
Figure 6.
The membership function of car Displacement (a), Orientation (b) error and Speed (c).
Figure 7.
The membership function of (a), The membership function of (b) The membership function of (c).
Figure 7.
The membership function of (a), The membership function of (b) The membership function of (c).
Figure 8.
line keeping Pathway.
Figure 8.
line keeping Pathway.
Figure 9.
A subject participating in the simulator.
Figure 9.
A subject participating in the simulator.
Figure 10.
Haptic feedback steering wheel(T150).
Figure 10.
Haptic feedback steering wheel(T150).
Figure 11.
Stationary driving simulator:driver’s view.
Figure 11.
Stationary driving simulator:driver’s view.
Figure 12.
Performance plot of BPNN for different drivers.
Figure 12.
Performance plot of BPNN for different drivers.
Figure 13.
Various BPNN driving behaviour control due to GA-PID controller after a given task.
Figure 13.
Various BPNN driving behaviour control due to GA-PID controller after a given task.
Figure 14.
Car’s position error using the BPNN Model with and without the GA-PID .
Figure 14.
Car’s position error using the BPNN Model with and without the GA-PID .
Figure 15.
ITAE for car’s position using BPNN Model with and without GA-PID.
Figure 15.
ITAE for car’s position using BPNN Model with and without GA-PID.
Figure 16.
ITAE for car’s orientation using BPNN Model with and without GA-PID.
Figure 16.
ITAE for car’s orientation using BPNN Model with and without GA-PID.
Figure 17.
Optimal Fuzzy-PID parameters set generated from various drivers after a given task.
Figure 17.
Optimal Fuzzy-PID parameters set generated from various drivers after a given task.
Figure 18.
Fuzzy-PID parameters change with the car’s position error, orientation angle error and car’s speed in different drivers.
Figure 18.
Fuzzy-PID parameters change with the car’s position error, orientation angle error and car’s speed in different drivers.
Figure 19.
Car’s speed without and with controller for the seven drivers.
Figure 19.
Car’s speed without and with controller for the seven drivers.
Figure 20.
Seven driving behaviours with and without the Fuzzy-PID controller after a given task.
Figure 20.
Seven driving behaviours with and without the Fuzzy-PID controller after a given task.
Figure 21.
Car’s position error with and without the Fuzzy-PID controller after a travelled distance.
Figure 21.
Car’s position error with and without the Fuzzy-PID controller after a travelled distance.
Figure 22.
ITAE for car’s position with and without Fuzzy-PID controller.
Figure 22.
ITAE for car’s position with and without Fuzzy-PID controller.
Figure 23.
ITAE for car’s orientation with and without Fuzzy-PID controller.
Figure 23.
ITAE for car’s orientation with and without Fuzzy-PID controller.
Figure 24.
Applied haptic feedback steering wheel torque with and without the Fuzzy-PID controller on various drivers.
Figure 24.
Applied haptic feedback steering wheel torque with and without the Fuzzy-PID controller on various drivers.
Figure 25.
Haptic feedback torque change with error, speed, and with and without the Fuzzy-PID controller.
Figure 25.
Haptic feedback torque change with error, speed, and with and without the Fuzzy-PID controller.
Table 1.
Fuzzy logic control rules base sample.
Table 1.
Fuzzy logic control rules base sample.
| Input Variable |
Output Variable |
| ep |
eo |
speed |
Kp |
Ki |
Kd |
| L |
M |
H |
KpH |
KiL |
KdL |
| L |
H |
H |
KpH |
KiL |
KdL |
| L |
VH |
H |
KpVH |
KiM |
KdVL |
| M |
M |
H |
VL |
VL |
H |
| M |
VH |
H |
VL |
VL |
H |
| H |
M |
M |
VH |
M |
VL |
| L |
M |
L |
M |
H |
VH |
| H |
M |
L |
VH |
VL |
M |
| H |
H |
L |
VH |
VL |
M |
| L |
l |
H |
M |
H |
VH |
Table 2.
Performance analysis for BPNN with z-score Normalised Data.
Table 2.
Performance analysis for BPNN with z-score Normalised Data.
| BPN |
|
|
|
|
|
| Performances |
Driver 1 |
Driver 2 |
Driver 3 |
Driver 4 |
Driver 5 |
| MSE |
0.14049 |
0.2452 |
0.19276 |
0.15823 |
0.37388 |
| Epochs |
523 |
181 |
100 |
233 |
221 |
| Regression |
0.93 |
0.869 |
0.886 |
0.916 |
0.803 |
Table 3.
PID Parameters obtained from a GA.
Table 3.
PID Parameters obtained from a GA.
| PID Parameters |
Driver 1 GA-PID |
Driver 2 GA-PID |
Driver 3 GA-PID |
Driver 4 GA-PID |
Driver 5 GA-PID |
| Kp |
3.3 |
1 |
4.904 |
1.313 |
4.987 |
| Ki |
0.108 |
0 |
0.08 |
3.81E-06 |
0.0035 |
| Kd |
13.543 |
6.866 |
2.399 |
6.891 |
4.416 |
Table 4.
Performance index for car’s position using BPNN with and without GA-PID.
Table 4.
Performance index for car’s position using BPNN with and without GA-PID.
| Scenario |
Performance Index for car’s position |
ITAE
Driver 1
|
ITAE
Driver 2
|
ITAE
Driver 3
|
ITAE
Driver 4
|
ITAE
Driver 5
|
| Driving behaviour without GA-PID |
32980.38 |
10829.86 |
18419.31 |
126787.6 |
45695.87 |
| Driving behaviour with GA-PID |
25737.86 |
4903.1 |
11542.43 |
21467.32 |
18523.59 |
| Improvement |
7242.52 |
5926.76 |
6876.88 |
105320.3 |
27172.28 |
| Percentages |
21.96% |
54.73% |
37.34% |
83.07% |
59.46% |
Table 5.
Performance index for car’s orientation using BPNN with and without GA-PID.
Table 5.
Performance index for car’s orientation using BPNN with and without GA-PID.
| Scenario |
Performance Index for Car,s Orientation |
ITAE
Driver 1
|
ITAE
Driver 2
|
ITAE
Driver 3
|
ITAE
Driver 4
|
ITAE
Driver 5
|
| Driving behaviour without GA-PID |
28847.46 |
14056 |
57108.31 |
48903.29 |
19472 |
| DRiving behaviour with GA-PID |
22565.04 |
13193.2 |
56420.41 |
46398.59 |
18340.5 |
| Improvement |
6282.42 |
862.80 |
687.90 |
2504.70 |
1131.50 |
| Percentages |
22% |
6.14% |
1.20% |
5.12% |
5.81% |
Table 6.
Average Car’s Speed with and without Fuzzy-PID for various driving behaviours.
Table 6.
Average Car’s Speed with and without Fuzzy-PID for various driving behaviours.
| Scenario |
Driver 1 |
Driver 2 |
Driver 3 |
Driver 4 |
Driver 5 |
Driver 6 |
Driver 7 |
| Driving Speed without Fuzzy-PID |
56.1204 |
54.4615 |
53.9873 |
53.8683 |
54.7353 |
55.0315 |
55.0937 |
| Driving Speed with Fuzzy-PID |
53.853 |
54.5193 |
49.5171 |
43.0751 |
52.6064 |
33.3196 |
41.7989 |
Table 7.
Car’s position performance index with and without the Fuzzy-PID controller.
Table 7.
Car’s position performance index with and without the Fuzzy-PID controller.
| Scenario |
Performance Index for car position |
ITAE
Driver 1
|
ITAE
Driver 2
|
ITAE
Driver 3
|
ITAE
Driver 4
|
ITAE
Driver 5
|
ITAE
Driver 6
|
ITAE
Driver 7
|
| Driving behaviour without Fuzzy-PID |
76150.91 |
136021.6 |
81759.06 |
106950.6 |
82891.66 |
61278.152 |
135595.3 |
| Driving behaviour with Fuzzy-PID |
33634.73 |
44330.49 |
36789.21 |
24357.55 |
29514.59 |
19682.56 |
41600.55 |
| Improvement |
42516.18 |
91691.07 |
44969.85 |
82593.03 |
53377.07 |
41595.592 |
93994.76 |
| Percentages |
56% |
67% |
55% |
77% |
64% |
68% |
69% |
Table 8.
Car’s orientation performance index with and without the Fuzzy-PID controller.
Table 8.
Car’s orientation performance index with and without the Fuzzy-PID controller.
| Scenario |
Performance Index for Car Orientation |
ITAE
Driver 1
|
ITAE
Driver 2
|
ITAE
Driver 3
|
ITAE
Driver 4
|
ITAE
Driver 5
|
ITAE
Driver 6
|
ITAE
Driver 7
|
| Driving behaviour without Fuzzy-PID |
248431.6 |
258389.1 |
219338.83 |
304274 |
228586 |
225661.2 |
295849.9 |
| Driving behaviour with Fuzzy-PID |
231439 |
216183.4 |
113396.1 |
210842.6 |
214620.7 |
82985.34 |
181997 |
| Improvement |
16992.59 |
42205.66 |
105942.73 |
93431.33 |
13965.30 |
142675.88 |
113852.9 |
| Percentages |
7% |
16% |
48.30% |
30.71% |
6% |
63% |
38% |
Table 9.
Haptic Feedback steering wheel Torque compared with and without the Fuzzy-PID controller.
Table 9.
Haptic Feedback steering wheel Torque compared with and without the Fuzzy-PID controller.
| Scenario |
Haptic Feedback Steering wheel Torque |
|
Driver 1
|
Driver 2
|
Driver 3
|
Driver 4
|
Driver 5
|
Driver 6
|
Driver 7
|
| Feedback Torque without Fuzzy-PID |
1485.2 |
1816.7 |
1665.2 |
1485.6 |
1677.2 |
1149.7 |
1911 |
| Feedback Torque with Fuzzy-PID |
890.35 |
1006.4 |
980.75 |
604.4 |
959.9 |
819.1 |
1217.4 |
| Improvement |
594.85 |
810.3 |
684.45 |
881.2 |
717.3 |
330.6 |
693.6 |
| Percentages |
40% |
45% |
41% |
59% |
43% |
29% |
36% |
|
Disclaimer/Publisher’s Note: The statements, opinions and data contained in all publications are solely those of the individual author(s) and contributor(s) and not of MDPI and/or the editor(s). MDPI and/or the editor(s) disclaim responsibility for any injury to people or property resulting from any ideas, methods, instructions or products referred to in the content. |
© 2023 by the authors. Licensee MDPI, Basel, Switzerland. This article is an open access article distributed under the terms and conditions of the Creative Commons Attribution (CC BY) license (http://creativecommons.org/licenses/by/4.0/).


