The initial virtual screening involved 100 compounds, and seven potential ligands were subsequently selected based on their most negative energy affinity to the MAGEB1 target. These selected ligands include Imatinib, Amentoflavone, Bilobetin, Ginkgetin, Bafetinib, Diosmin, and Hypericin, with energy affinity ranging between -9.9 kcal/mol and -9.7 kcal/mol. Next, attention was focused on these seven compounds for further repeatability testing via docking. General Speaking, this additional step is important to confirm and consolidate the results obtained from the initial virtual screening. Repeatability testing is critical to ensuring results are consistent and reliable. The main results of this work that all seven substances, (Imatinib, Amentoflavone, Bilobetin, Ginkgetin, Bafetinib, Diosmin and Hypericin), have continued to show high binding energy with the MAGEB1 protein even after repeatability tests using docking is certainly interesting. This suggests that these molecules might have a strong affinity and stable interaction with the target protein with energy affinity ranging between -9.9 kcal/mol and -9.7 kcal/mol.
Table 1 shows the docking results of selected potential ligands with MAGEB1 target by Autodock Vina [
9] with Pyrx program [
10].
However, it is important to consider several aspects before drawing definitive conclusions:
The following step of this work focused on investigation of selected best ligands to narrow down the list for further investigation. The research was evaluated toxicity through theoretical studies with the pKCSM server[
11], a valuable step in prioritizing compounds that may have a better safety profile. The parameters provided by pKCSM, such as AMES toxicity, Max. tolerated dose, hERG inhibition, oral toxicity in rats, hepatotoxicity, skin sensitization, and toxicity in T.Pyriformis, cover key aspects of safety evaluation[
11].
The toxicity parameters you mentioned, such as AMES toxicity, Max. tolerated dose (MTD), inhibition of hERG I and hERG II, acute oral toxicity in rats, chronic oral toxicity in rats, hepatotoxicity, skin sensitization and toxicity in T.Pyriformis , cover several dimensions of safety and can be instrumental in selecting compounds for subsequent development. Let's look briefly at some of these parameters[
11]:
Hepatotoxicity: Evaluates the harmful potential of the molecule for the liver.
A detailed comparative analysis of the toxic effects of the selected ligands, including Imatinib, Amentoflavone, Hypericin, Ginkgetin, Diosmin, Bafetinib, and Bilobetin were showed in Table . The parameters considered, such as Oral Rat Chronic Toxicity (LOAEL), Oral Rat Acute Toxicity (LD50), and Max. tolerated dose (human), provide valuable insights into the potential safety profiles of these compounds. From these results by pKCSM , it seems that Diosmin has shown high values for Oral Rat Chronic Toxicity (LOAEL), Oral Rat Acute Toxicity (LD50), and Max. tolerated dose (human). These high values suggest that Diosmin may have a lower potential for toxicity in these specific contexts, making it a candidate that could be well-tolerated by the human organism. It showed a Max. tolerated dose(human) with a value of 0.565 (logmg/kg/day) ( See below
Table 1).
It's crucial to interpret these results in the context of the specific experimental conditions and the relevance of these toxicity parameters to human health. Additionally, the actual concentrations and dosages used in your experiments and their relationship to these toxicity values should be carefully considered.
Table 1.
shows the comparison of best binding energies of selected potential ligands with Melanoma-associated antigen B1 by Autodock Vina with Pyrx program. Docking analysis was evaluated by Blind Docking approach.
Table 1.
shows the comparison of best binding energies of selected potential ligands with Melanoma-associated antigen B1 by Autodock Vina with Pyrx program. Docking analysis was evaluated by Blind Docking approach.
| Compounds |
Binding Energy (1) (Kcal/mol) |
Binding Energy (2) (Kcal/mol) |
| Hypericin |
-9.9 |
-9.9 |
| Amentoflavone |
-9.8 |
-9.9 |
| Imatinib |
-9.9 |
-9.8 |
| Bilobetin |
-9.8 |
-9.8 |
| Ginkgetin |
-9.9 |
-10 |
| Bafetinib |
-9.7 |
-9.7 |
| Diosmin |
-9.7 |
-9.7 |
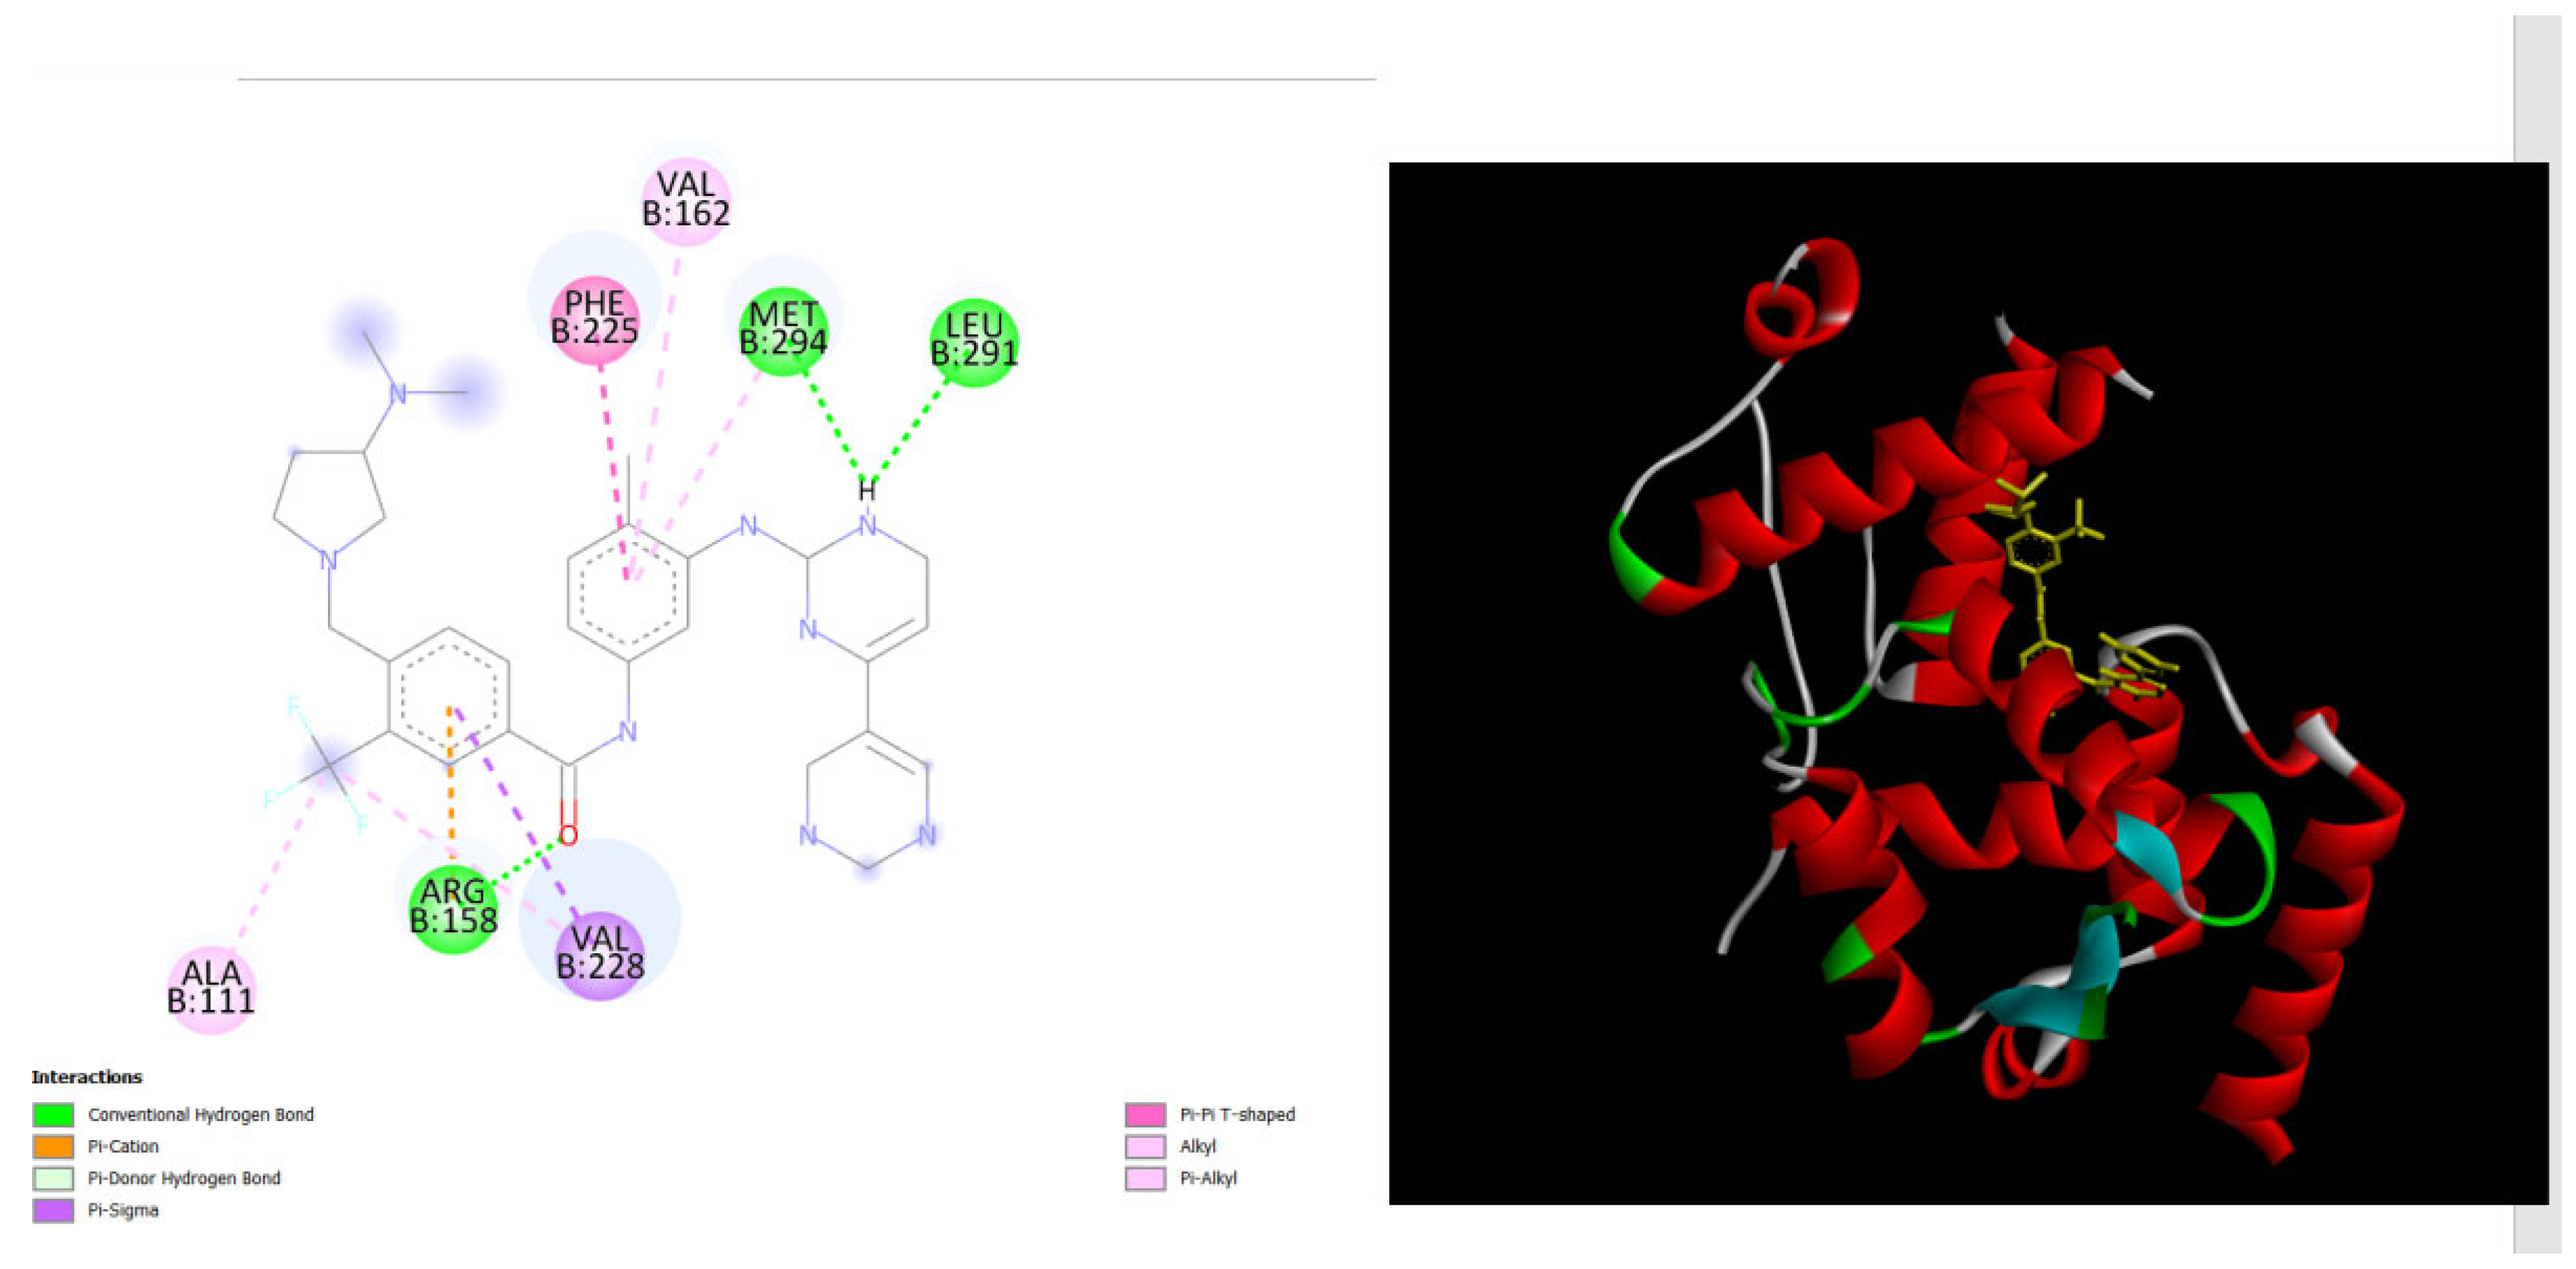
Figure 1.
displays the docking outcomes of with Melanoma-associated antigen B1 in conjunction with Bafetinib within the Ligand Binding Site, as analyzed by Autodock Vina through Pyrx program. On the left side, 2D diagrams illustrate the residue interactions between the target and Bafetinib. Meanwhile, the right side exhibits the Ligand Binding Site of the protein, highlighting the specific location of Bafetinib.
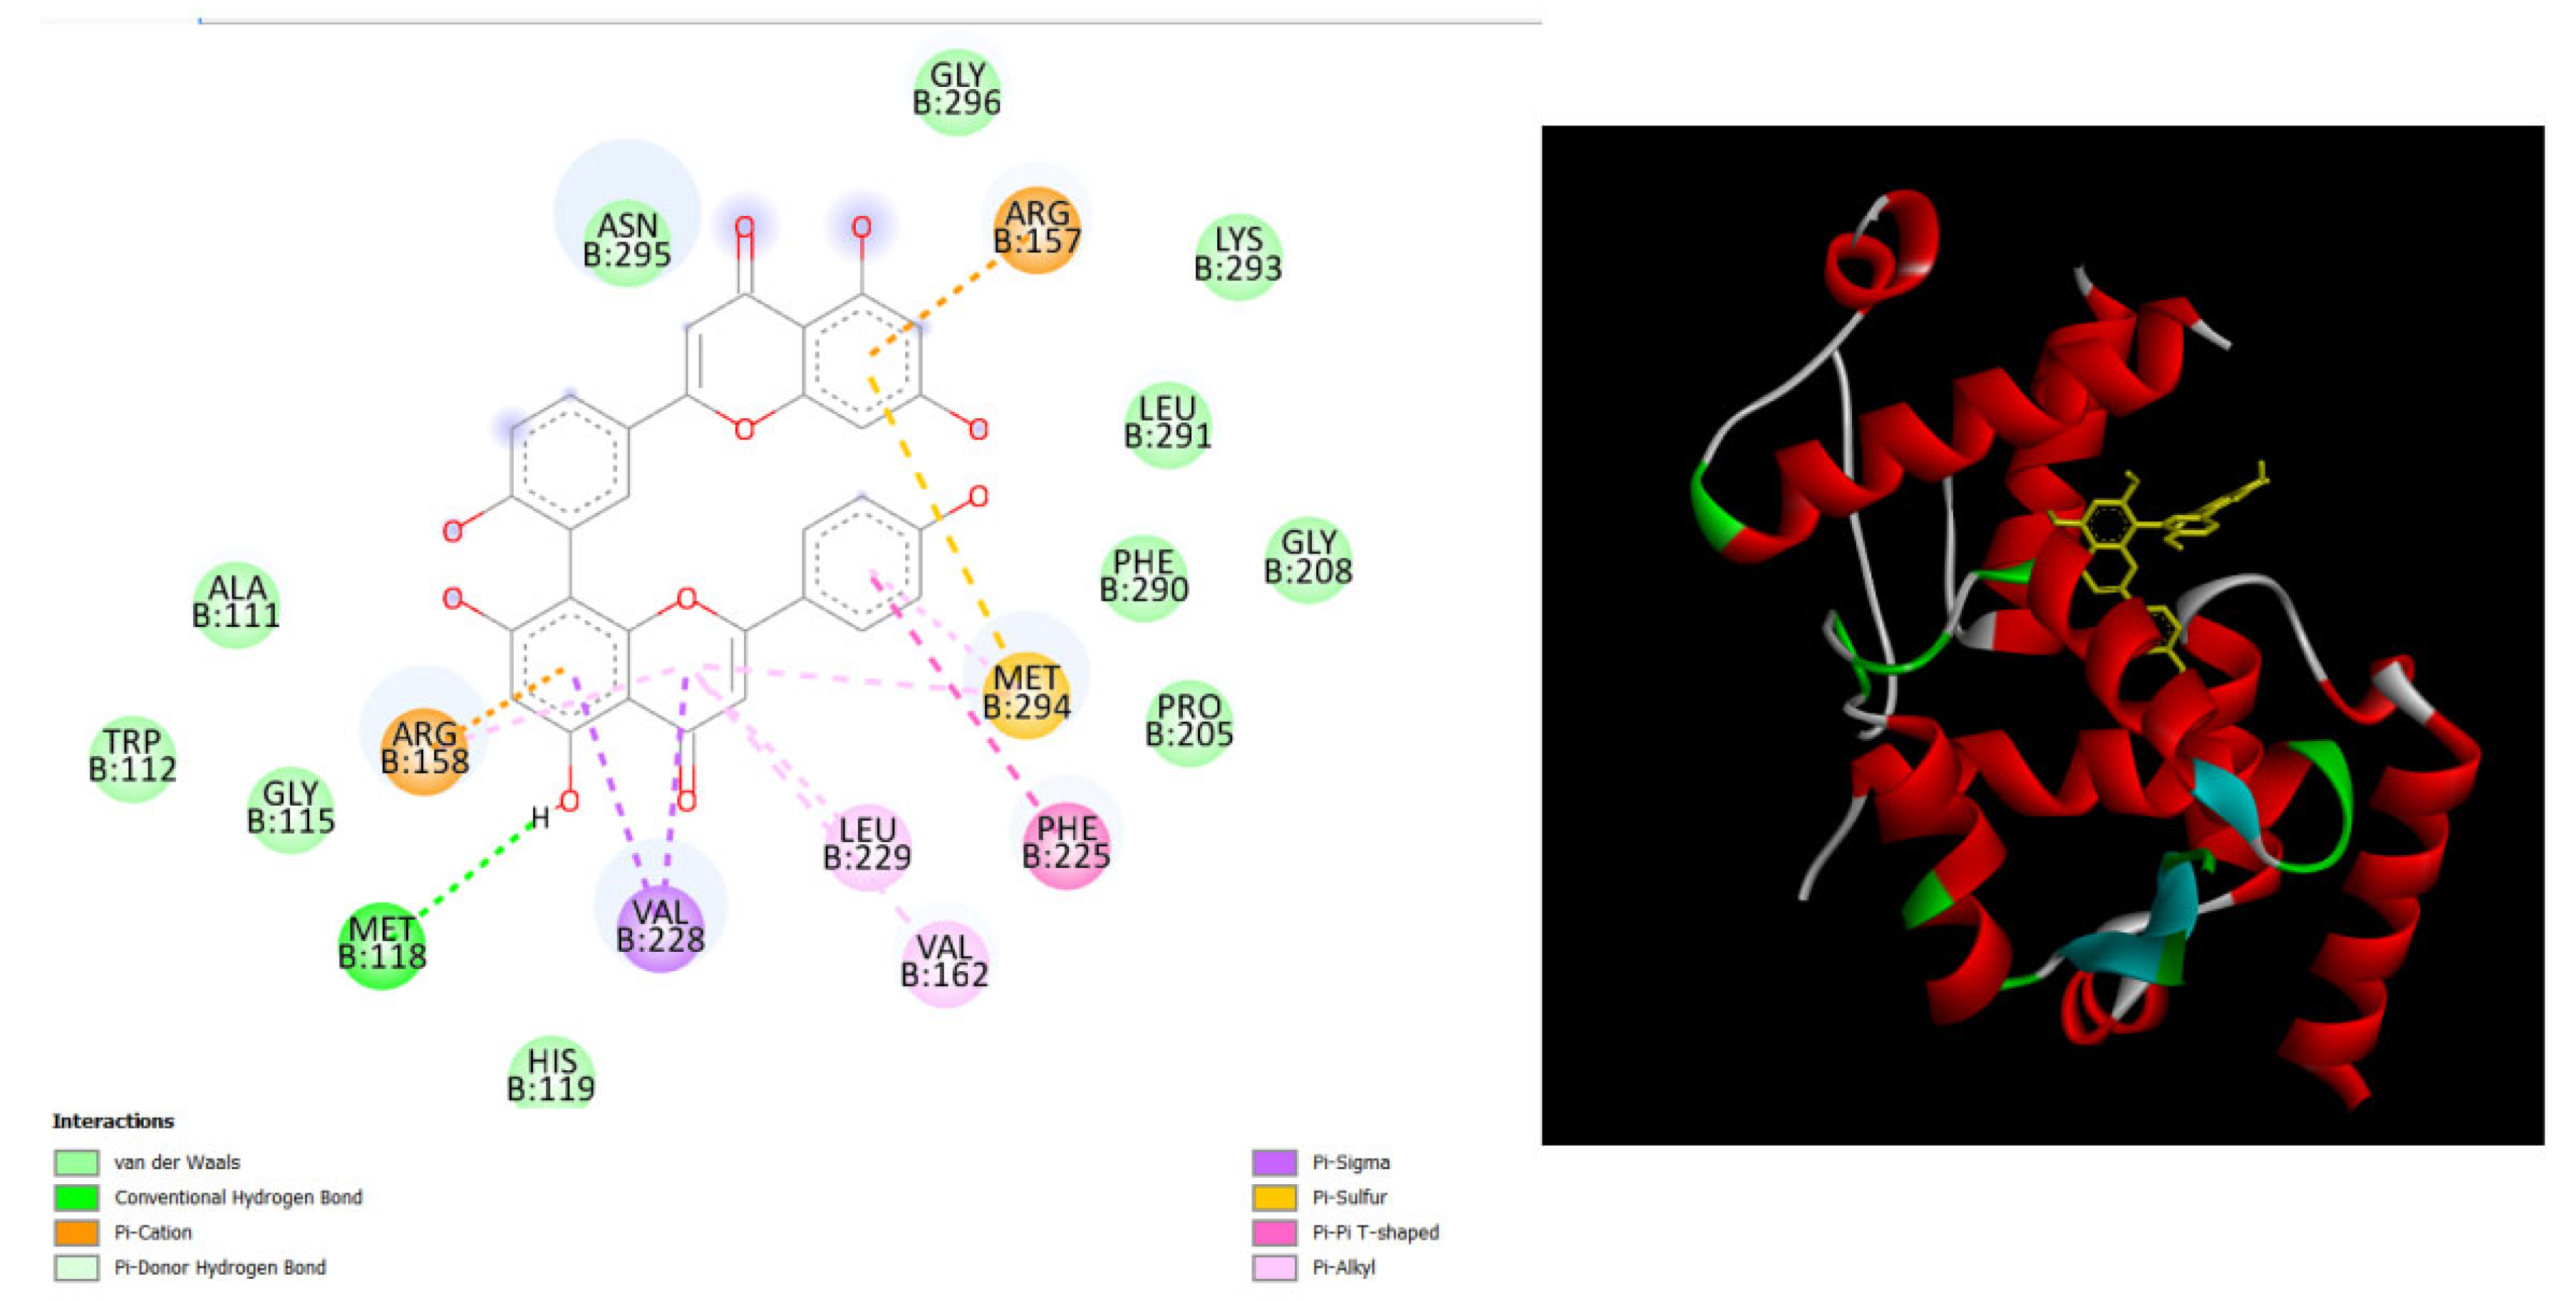
Figure 2.
displays the docking outcomes of with Melanoma-associated antigen B1 in conjunction with Amentoflavone within the Ligand Binding Site, as analyzed by Autodock Vina through Pyrx program. On the left side, 2D diagrams illustrate the residue interactions between target and Amentoflavone. Meanwhile, the right side exhibits the Ligand Binding Site of the protein, highlighting the specific location of Amentoflavone.
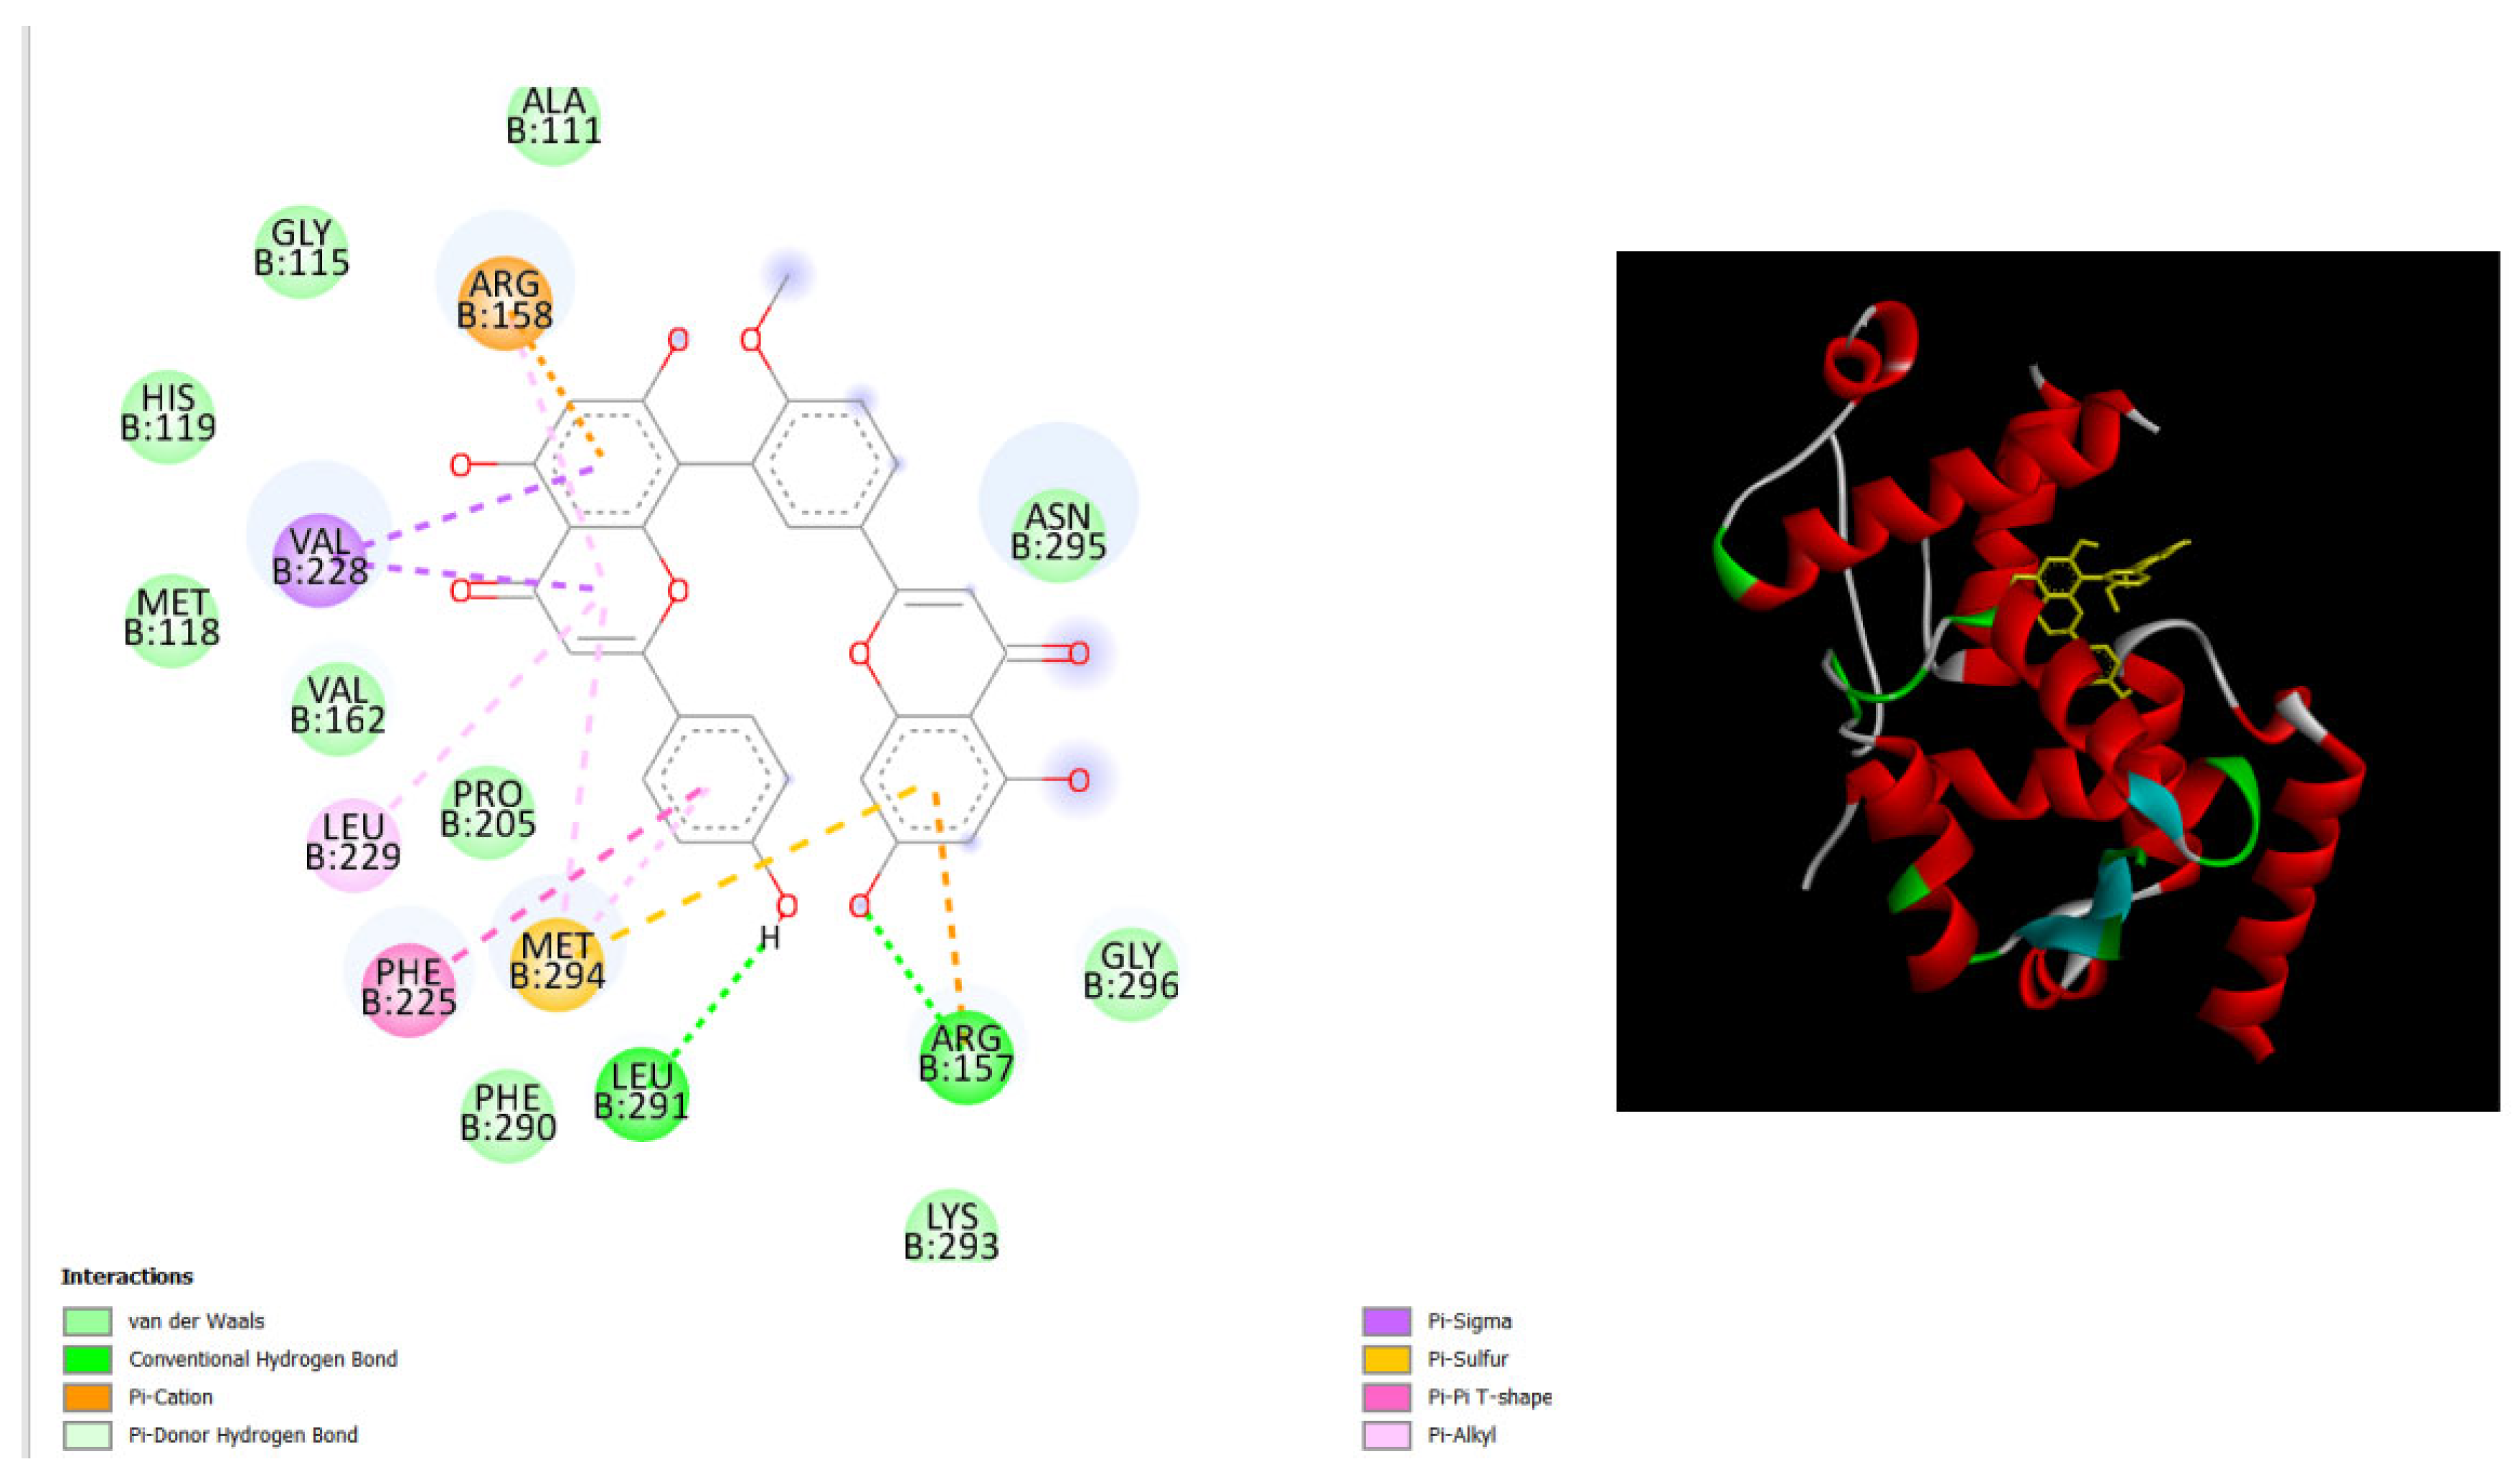
Figure 3.
displays the docking outcomes of with Melanoma-associated antigen B1 in conjunction with Bilobetin within the Ligand Binding Site, as analyzed by Autodock Vina through Pyrx program. On the left side, 2D diagrams illustrate the residue interactions between target and Bilobetin. Meanwhile, the right side exhibits the Ligand Binding Site of the protein, highlighting the specific location of Bilobetin.
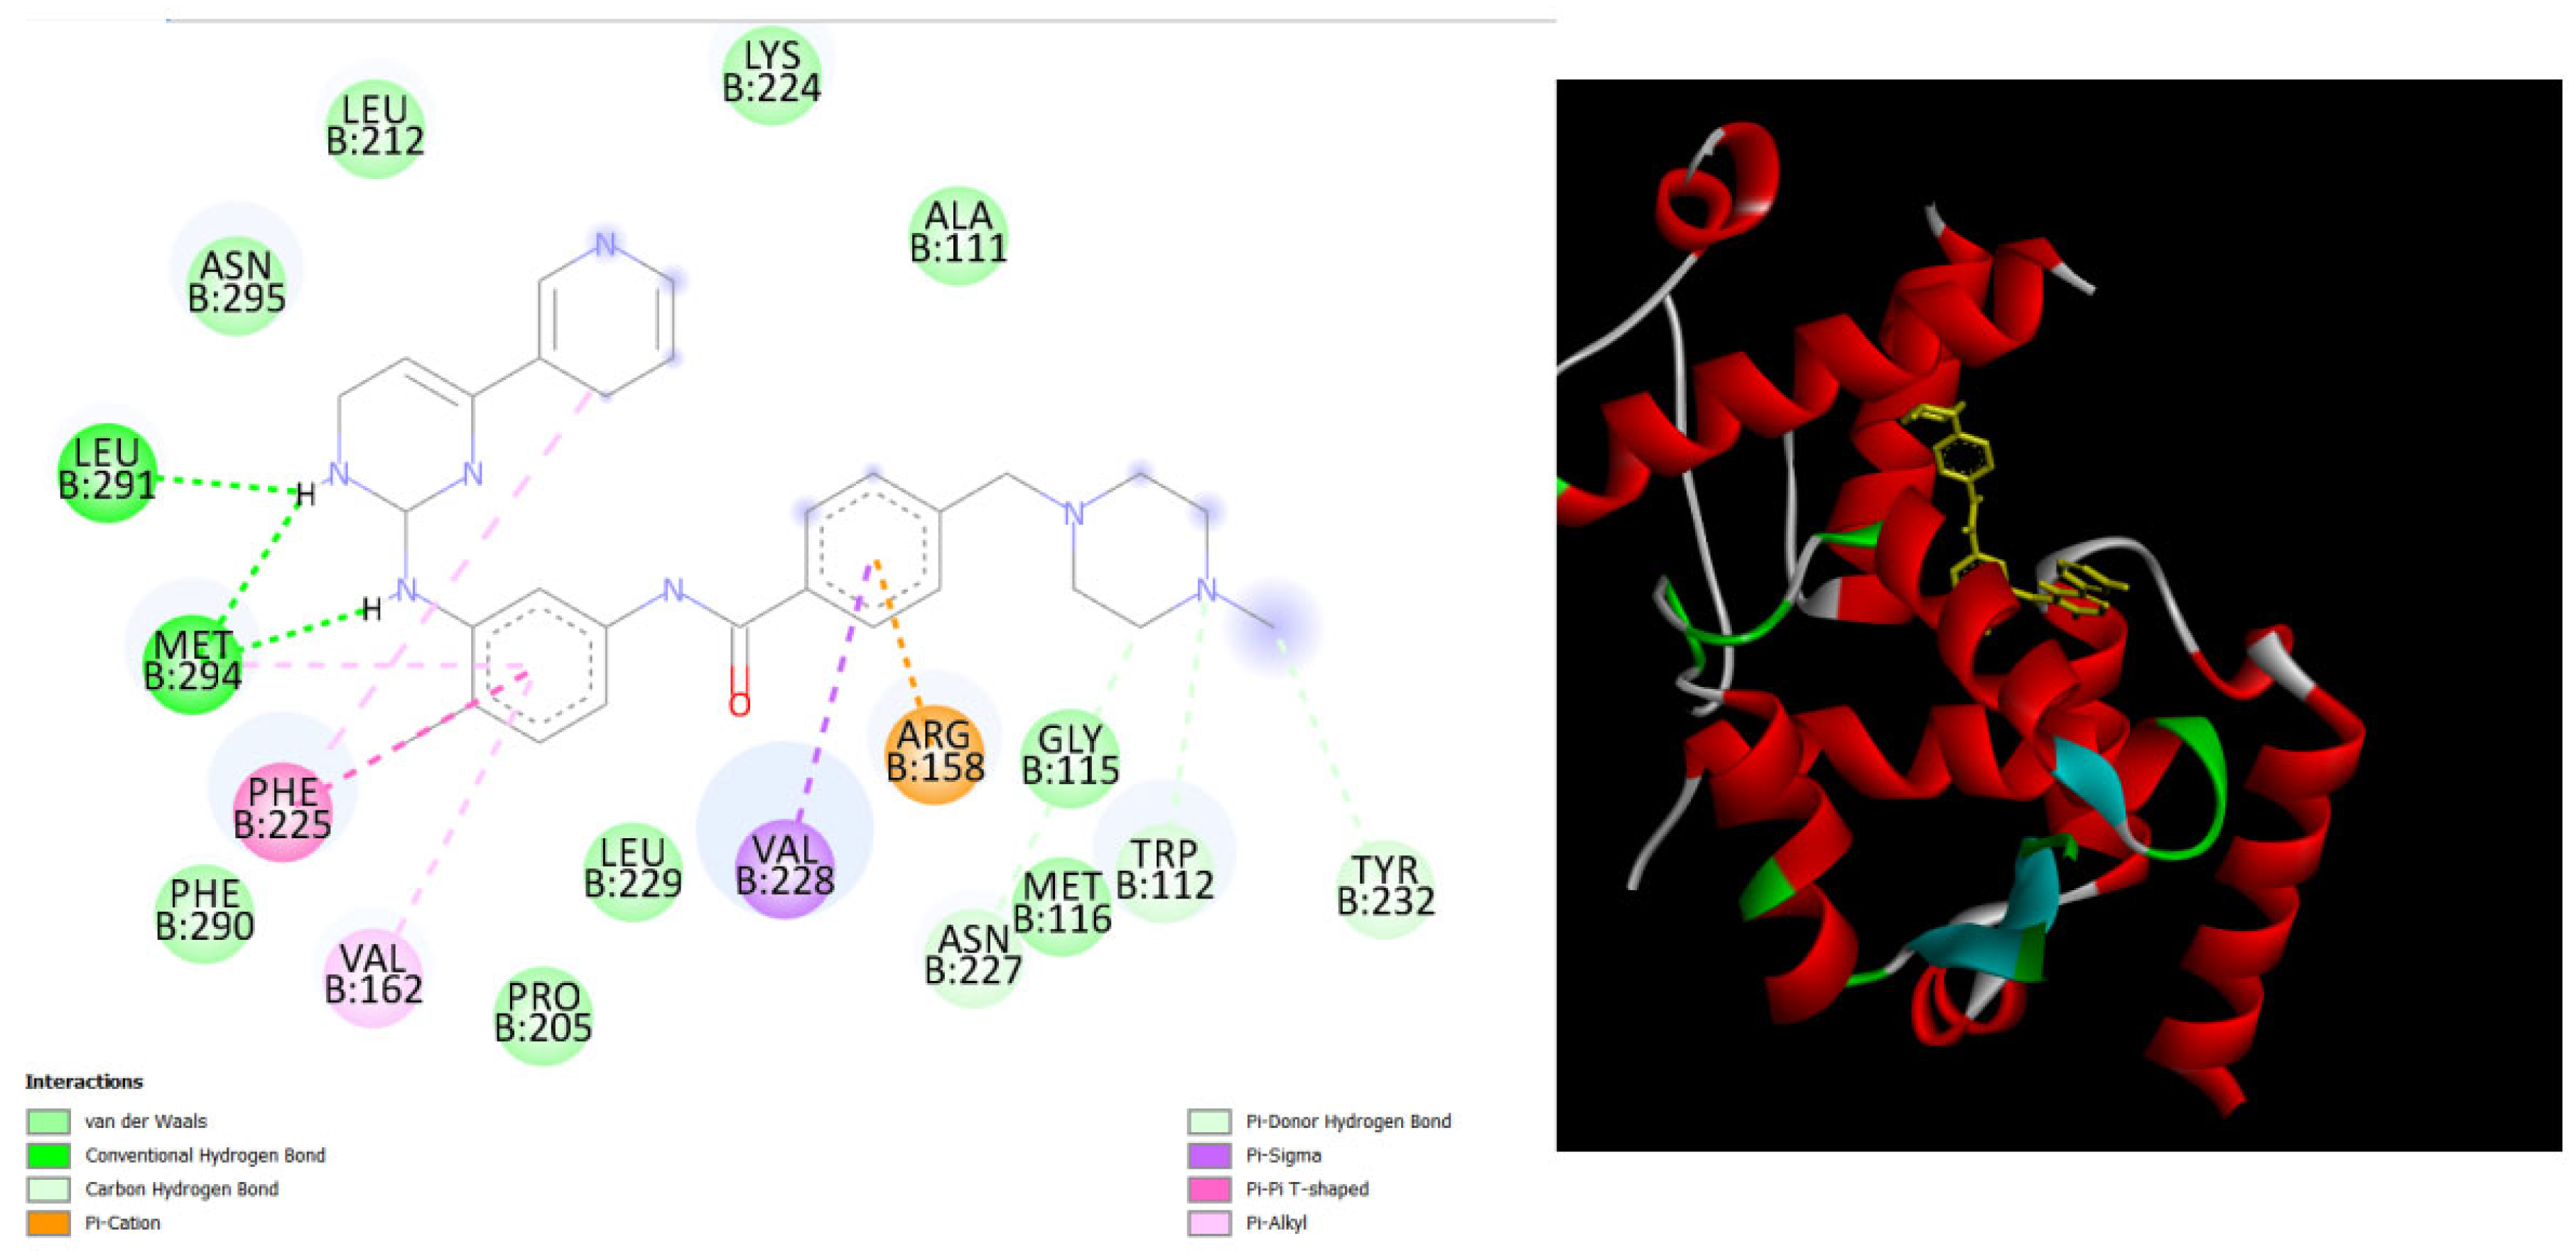
Figure 4.
displays the docking outcomes of with Melanoma-associated antigen B1 in conjunction with Imatinib within the Ligand Binding Site, as analyzed by Autodock Vina through Pyrx program. On the left side, 2D diagrams illustrate the residue interactions between target and Imatinib. Meanwhile, the right side exhibits the Ligand Binding Site of the protein, highlighting the specific location of Imatinib.
Figure 5.
displays the docking outcomes of with Melanoma-associated antigen B1 in conjunction with Ginkgetin within the Ligand Binding Site, as analyzed by Autodock Vina through Pyrx program. On the left side, 2D diagrams illustrate the residue interactions between target and Ginkgetin. Meanwhile, the right side exhibits the Ligand Binding Site of the protein, highlighting the specific location of Ginkgetin.
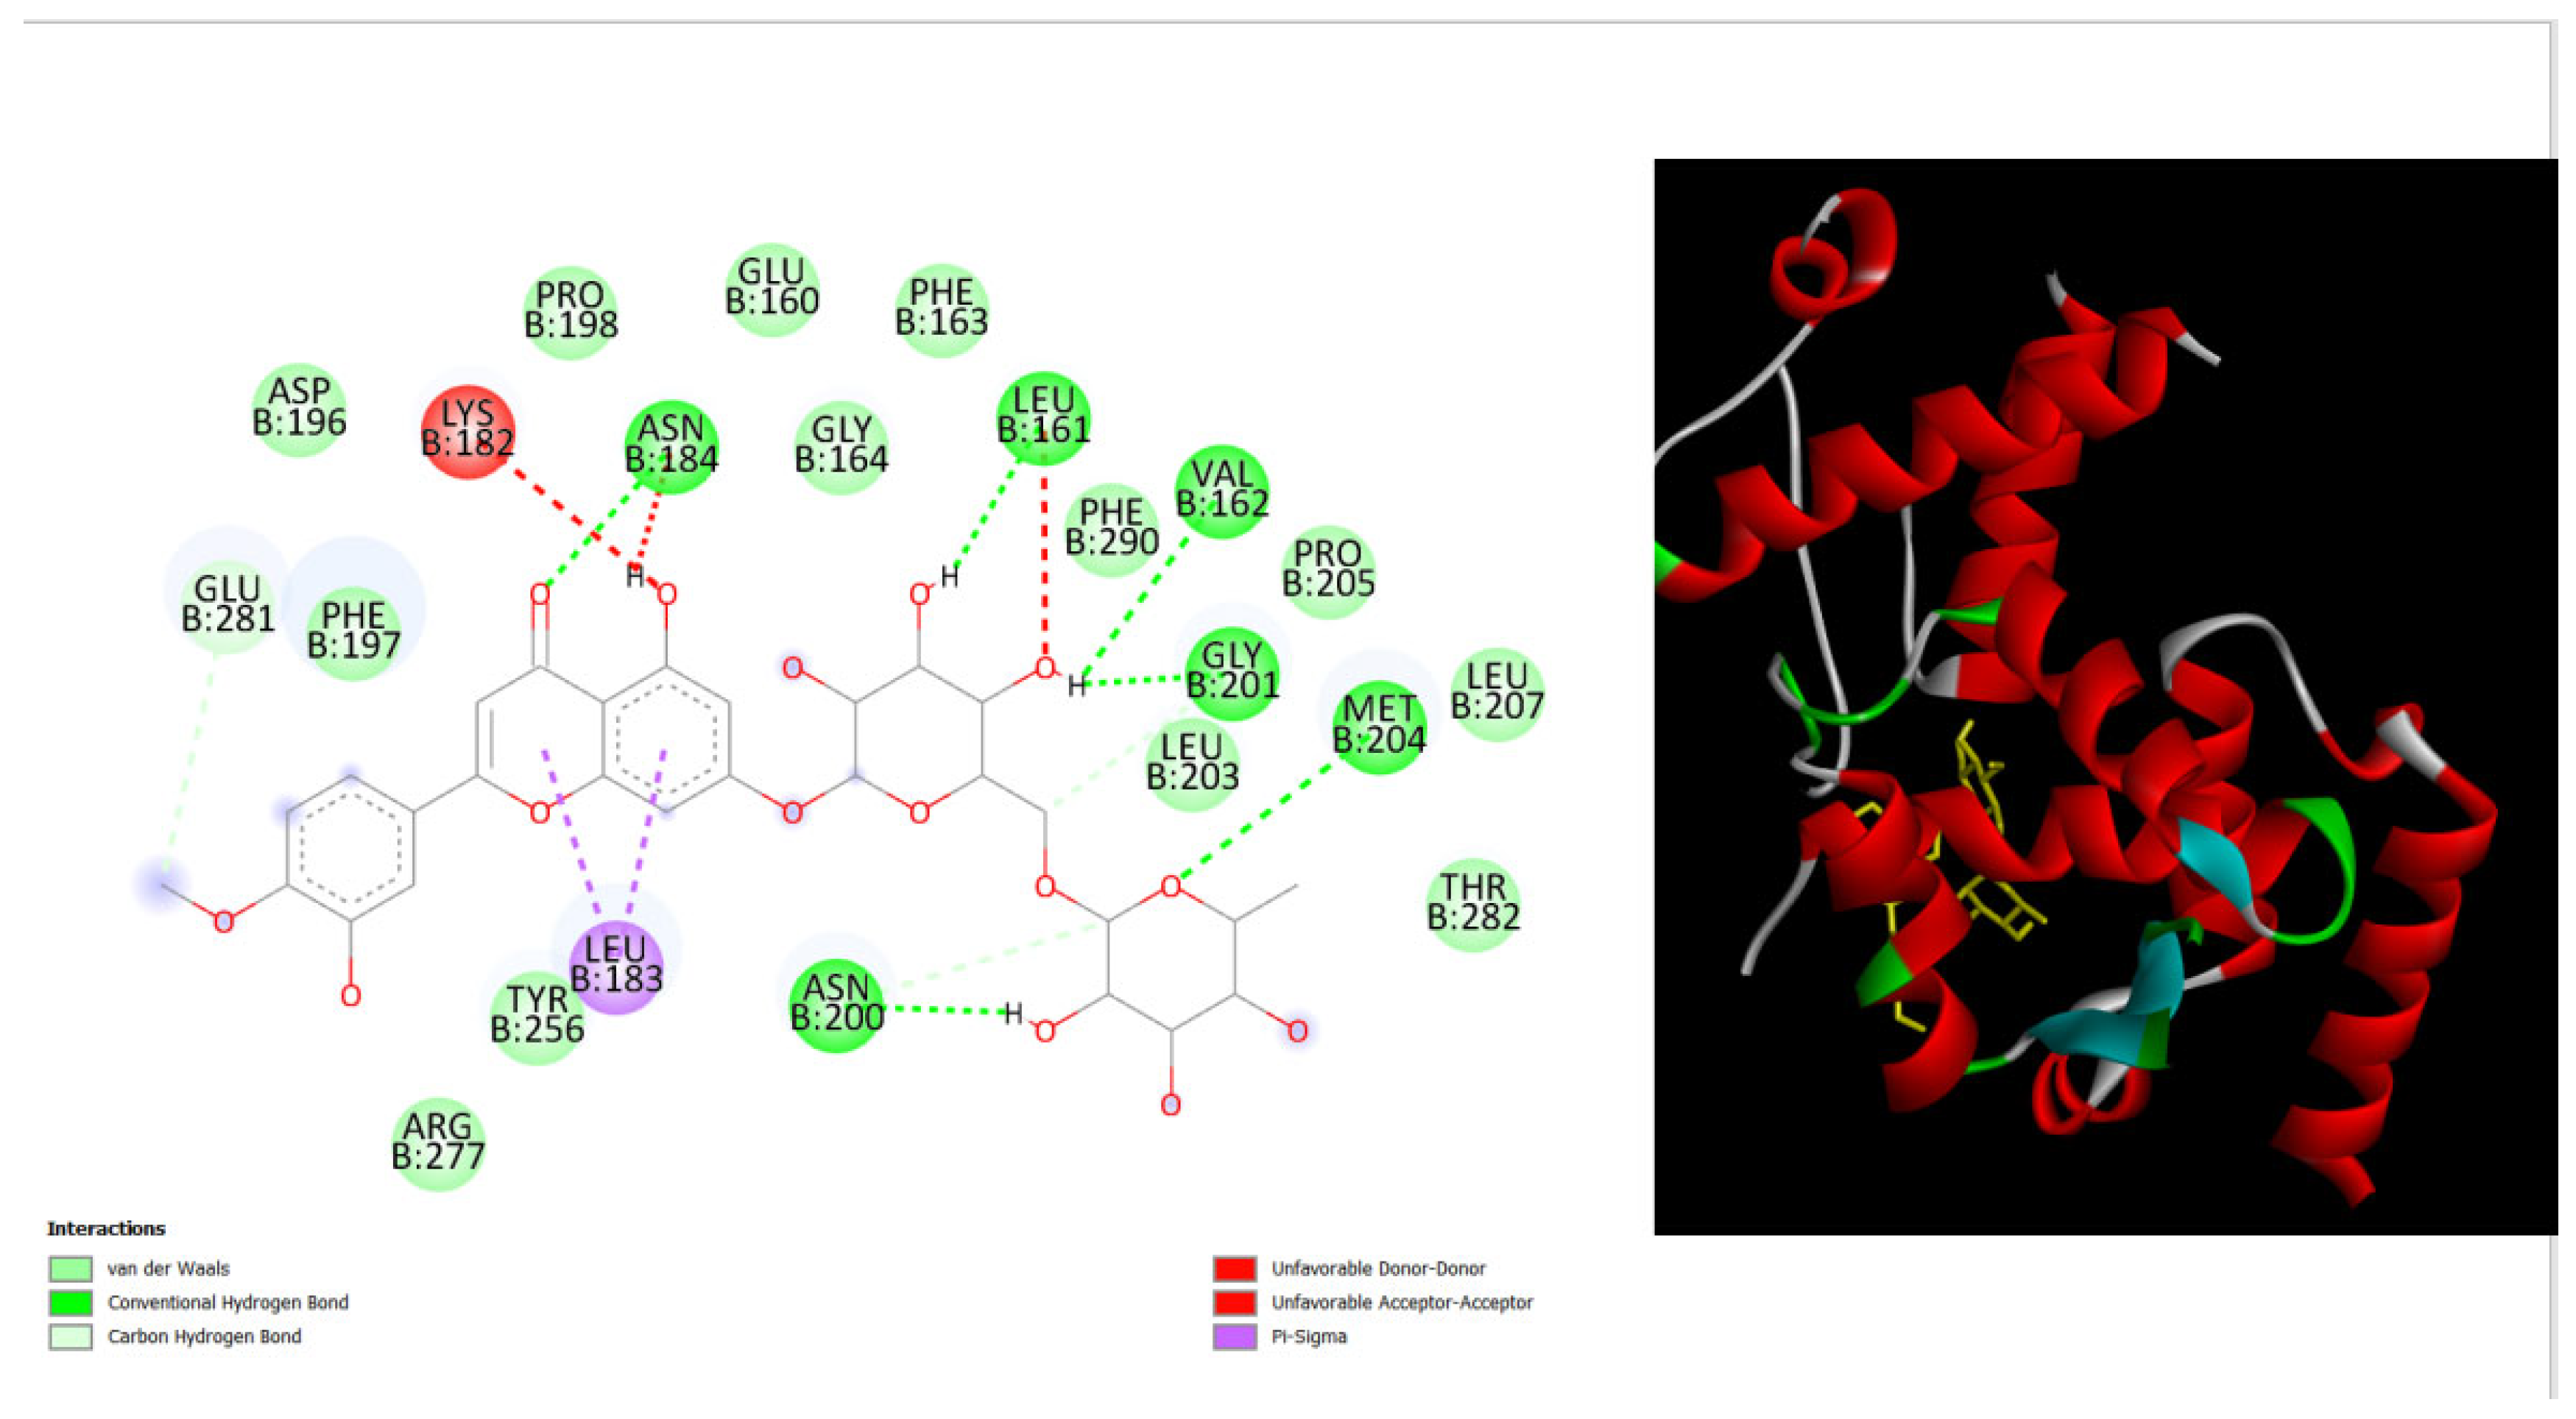
Figure 6.
displays the docking outcomes of with Melanoma-associated antigen B1 in conjunction with Diosmin within the Ligand Binding Site, as analyzed by Autodock Vina through Pyrx program. On the left side, 2D diagrams illustrate the residue interactions between target and Diosmin. Meanwhile, the right side exhibits the Ligand Binding Site of the protein, highlighting the specific location of Diosmin.
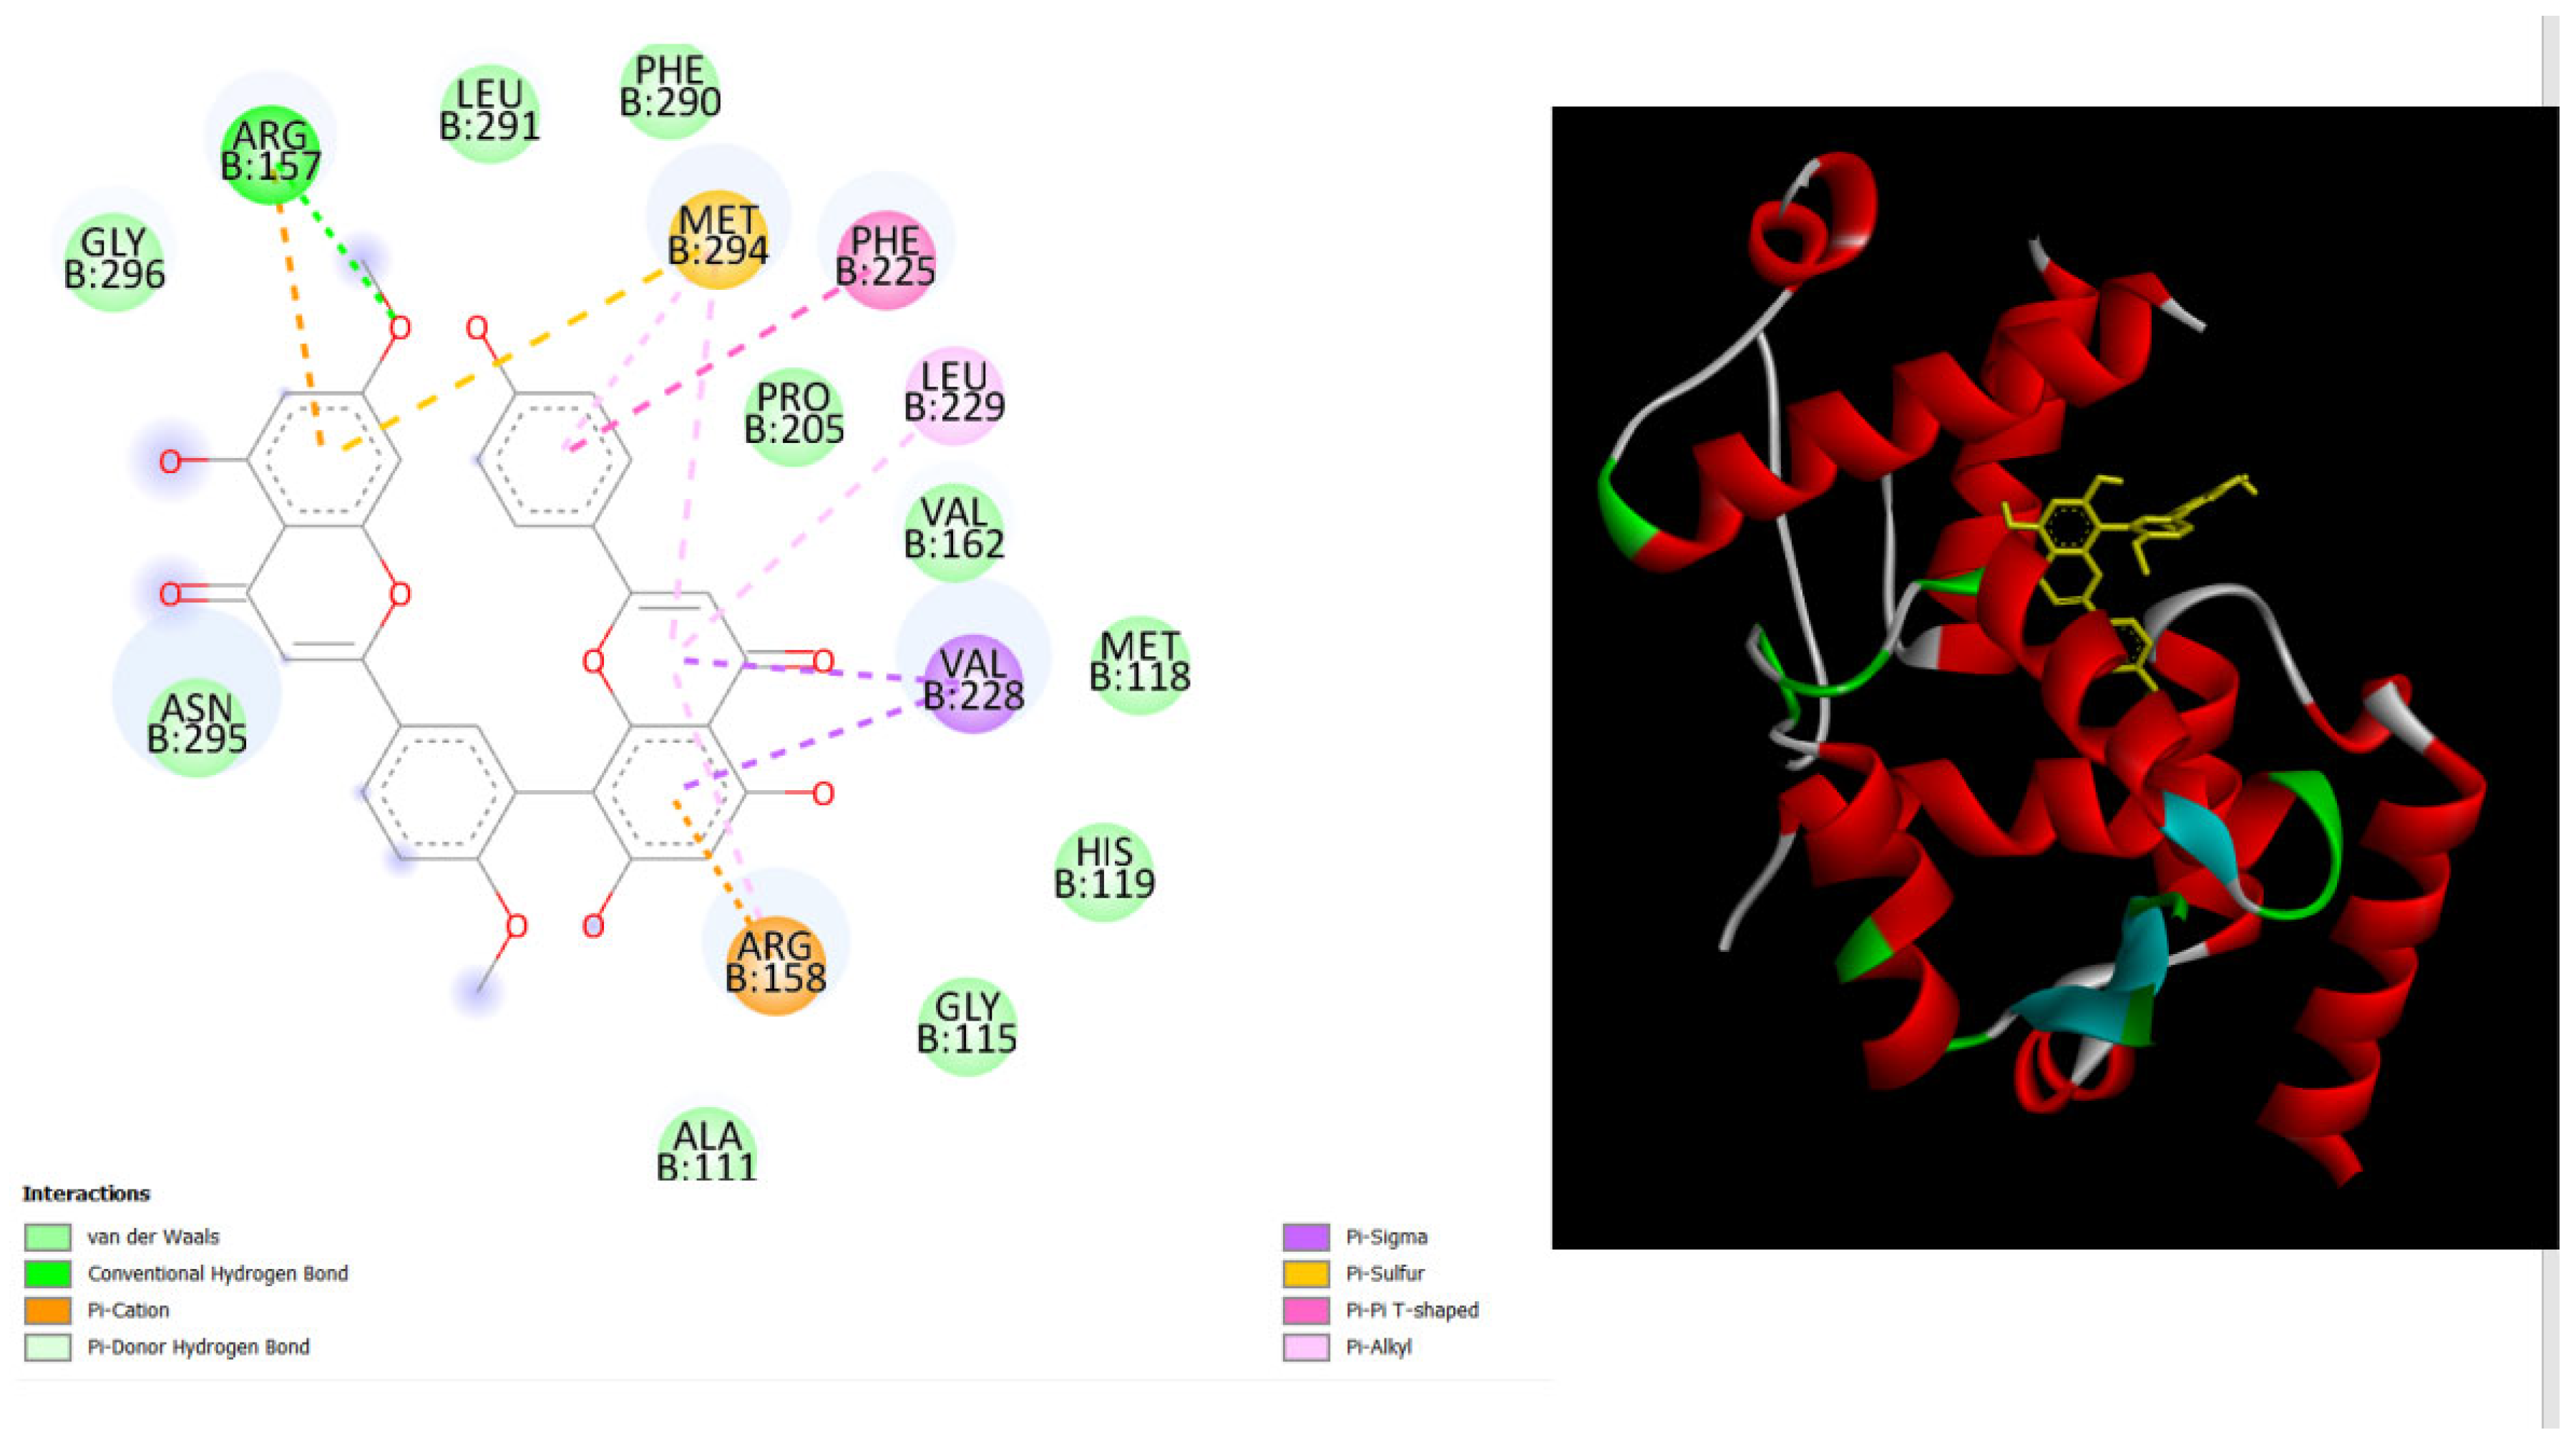
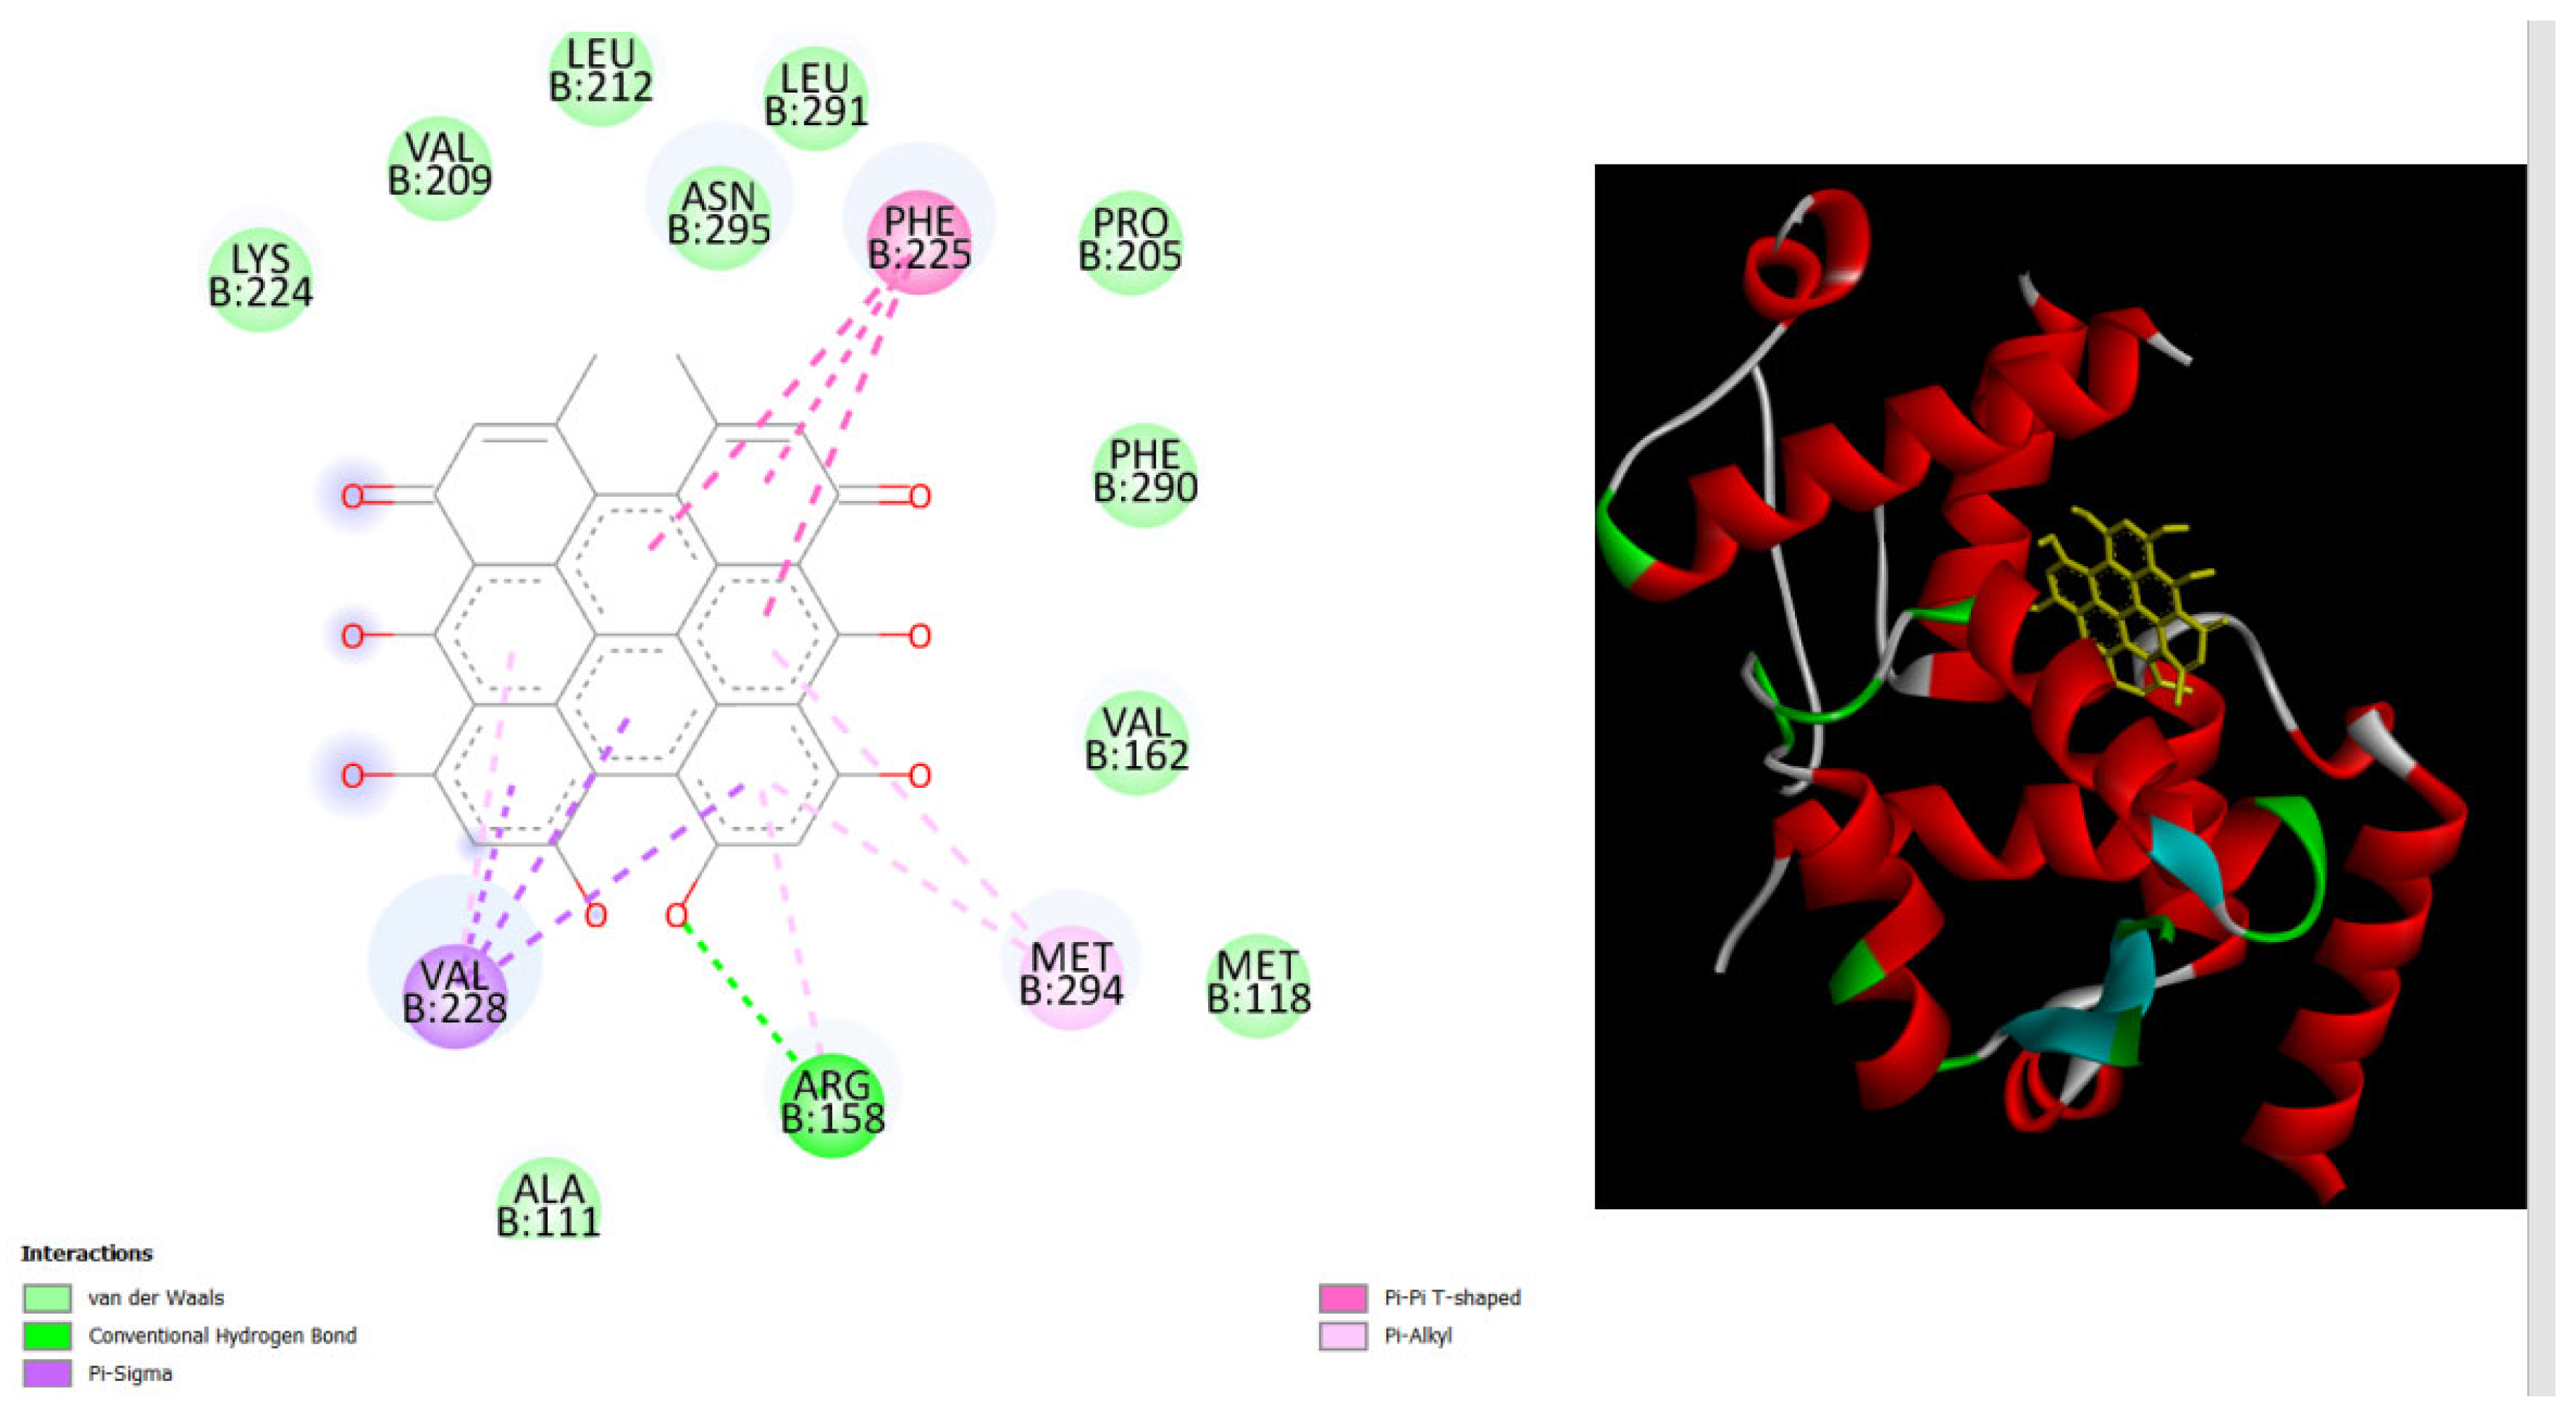
Figure 7.
displays the docking outcomes of with Melanoma-associated antigen B1 in conjunction with Hypericin within the Ligand Binding Site, as analyzed by Autodock Vina through Pyrx program. On the left side, 2D diagrams illustrate the residue interactions between target and Hypericin.Meanwhile, the right side exhibits the Ligand Binding Site of the protein, highlighting the specific location of Hypericin.
Table 2.
Shows the comparison of predicted toxicity parameters with Imatinib, Amentoflavone, Hypericin, Diosmin, Ginkgetin, Bilobetin and Bafetinib, through pKCSM Server.
Table 2.
Shows the comparison of predicted toxicity parameters with Imatinib, Amentoflavone, Hypericin, Diosmin, Ginkgetin, Bilobetin and Bafetinib, through pKCSM Server.
| Compounds |
AMES
toxicity |
Max.
tolerated dose(human) (logmg/kg/day) |
hERG I inhibitor |
hERG II inhibitor |
Oral Rat Acute Toxicity (LD50) (mol/kg) |
Oral Rat Chronic Toxicity (LOAEL)
(log mg/kg_bw/day) |
Hepatotoxicity |
| Hypericin |
no |
0.438 |
no |
yes |
2.482 |
2.421 |
no |
| Amentoflavone |
no |
0.438 |
no |
yes |
2.527 |
3.572 |
no |
| Imatinib |
no |
0.317 |
no |
yes |
2.9 |
1.409 |
no |
| Bilobetin |
no |
0.437 |
no |
yes |
2.56 |
2.217 |
no |
| Ginkgetin |
no |
0.437 |
no |
yes |
2.733 |
2.475 |
no |
| Bafetinib |
no |
0.383 |
no |
yes |
2.85 |
1.321 |
no |
| Diosmin |
no |
0.565 |
no |
yes |
2.512 |
3.343 |
no |
