Preprint
Article

Geochemical and Mineralogical Features of Triassic Dolomites From the Area of Upper Silesia in Poland

Altmetrics

Downloads

83

Views

19

Comments

0

Submitted:

04 December 2023

Posted:

05 December 2023

You are already at the latest version

Alerts
Abstract
Detailed description of carbonate minerals different in magnesium content of Triassic dolomites were presented in this article. The tests were carried out to determine geochemical and miner-alogical features in the terms of their geoengineering properties. The following carbonate phas-es were identified: a low-Mg calcite, a high-Mg calcite, a proto-dolomite, an ordered dolomite and a huntite. The following research methods were used: microscopic analysis, X-Ray Diffrac-tion, X-Ray Fluorescence and Electron probe microanalysis. The samples were collected from the Tarnowice formation which is the lower part the profile of the Upper Muschelkalk. On the basis of the results the chemical formulas of carbonate phases were calculated. The ranges of Mg and Ca content were presented in formulas. The results indicate of Mg in low-Mg calcite ranges from 0.6 to 1.2%, in high-Mg calcite from 7.47 to 10.41%. In proto-dolomite it ranges from 10.96 to 11.78%. In ordered dolomite Mg content is stoichiometric value for dolomite – 13.18%. Due to the reduced Mg content in identified huntite (the value ranges from 13.62% to 17.76), this carbonate phase was named as de-huntite.
Keywords: 
Subject: Environmental and Earth Sciences  -   Geography

1. Introduction

The area of Upper Silesia, including the area of Bytom and Piekary Śląskie, is an area where Triassic carbonate rocks occur, including Lower, Middle and Upper Muschelkalk formations [1,2]. These rocks in contrast to the limestone deposits of the area of Opole Silesia [3,4,5,6,7,8,9,10,11,12,13,14,15] have not been thoroughly investigated in terms of the presence of carbonate phases with different magnesium content. In the limestones of Opole Silesia, five carbonate phases were identified, characterized by different Mg content: low-magnesium calcite, high-magnesium calcite, proto-dolomite, ordered dolomite and huntite.
The Middle Muschelkalk deposits, including the Tarnowice Unit [16], have not been the subject of detailed research in the term of identifying carbonate phases with different magnesium content. However, due to the probability of the presence of carbonate phases with different amounts of Mg in them, mainly high-magnesium calcite, which was identified in the rocks of the lower Muschelkalk of the area of Opole Silesia, rocks of the Tarnowice Unit were chosen as the subject of the study.
During earlier studies of the Triassic carbonate rocks from the area of Opole Silesia, which are formations of the lower and partly middle Muschelkalk, the presence of the following carbonate phases was identified: low-magnesium calcite, high-magnesium calcite, proto-dolomite, ordered dolomite and huntite. The presence of these phases made it possible to determine the conditions of carbonate rocks’ sedimentation and the diagenetic processes that these rocks underwent. Due to the probability of the presence of these mineral phases in the rocks of the Tarnowice Unit, which are formation of the upper part of the Middle Muschelkalk [16,17,18], it was worth undertaking research that allowed to obtain new data on the presence of carbonate phases with different magnesium content and geochemical composition of the carbonate rocks. Based on the research results, it was also possible to determine the sedimentation conditions in which the rocks of the Tarnowice Unit were formed and the diagenetic processes that influenced the final structure of the carbonate rocks.
The results of the research and the conclusions formed on the basis of the results will be a source of new data on the mineral composition and genesis of the rocks of the Tarnowice Unit.

2. Materials and Methods

2.1. Materials

The subject of this project are carbonate rocks of the Tarnowice Unit from selected areas of the Upper Silesia (Silesian Voivodeship). The study zone includes the area of Piekary Śląskie and Bytom (Figure 1). The samples were given symbols depending on the sampling location: LZ- Lazarówka Quarry (area of Bytom – Sucha Góra City), PSK- Piekary Śląskie City, Mieczysław Karłowicz Street, PSZ- Piekary Śląskie City, Zawisza Czarny Street.

2.2. Methods

Microscopic observations in transmitted light, were made in the Laboratory of the Department of Applied Geology, using the Zeiss Axioscope, cooperating with the K 300 image analyzer. Thin plates were made from six carbonate rock samples. Observations were made at x100 and x200 magnifications. Phase identification by X-ray diffraction (XRD) was done in the laboratory of the Solid State Department, in Institute of Physics, Faculty of Mathematics, Physics and Chemistry of the University of Silesia. The tests were performed using the EMPIRIAN diffractometer by PANALITYCAL. The XRF analysis was also performed in the laboratory of the Solid State Department, Institute of Physics, Faculty of Mathematics, Physics and Chemistry of the University of Silesia. The X-Ray Fluorescence Spectrometer (XRF), model ZSX Primus II by Rigaku, was used for the research. It uses wavelength dispersion for measurements. The maximum lamp voltage is 60 kV (rhodium lamp). Measuring range Be - U. Measurements are non-standard (fundamental parameters method). Microprobe measurements were carried out at the Institute of Non-Ferrous Metals in Gliwice. Three samples were delivered in the form of polished sections, made of rocks with numbers: PSK2, PSZ3 and LZ1. The content of the following elements were measured: C, O, Mg, Al, Si, Ca, Mn and Fe. The tests were performed by X-ray microanalysis using the JXA 8230 X-ray microprobe made by JEOL. The accelerating voltage was 15kV, the electron beam current was 20nA. Quantitative analyzes of the chemical composition were carried out using the wavelength dispersion (WDS) method. The size of the analyzed area, resulting from the characteristics of the electron beam and the X-ray excitation area, is of the order of 1µm3. The maps of the element distribution were made using the energy dispersive method (EDS). The standards used were: pure metals for Fe, Mn and aluminum oxide (Al2O3) as the standard for aluminum and oxygen, calcium silicate (CaSiO3) as the standard for silicon and calcium, iron sulfide (Fe2S) as the standard for sulfur (for sample LZ1), diamond as the standard and magnesium oxide (MgO) as a magnesium standard. The supplied samples were sputtered with a gold layer.

3. Results

3.1. Mineralogical and petrographic characteristics of samples

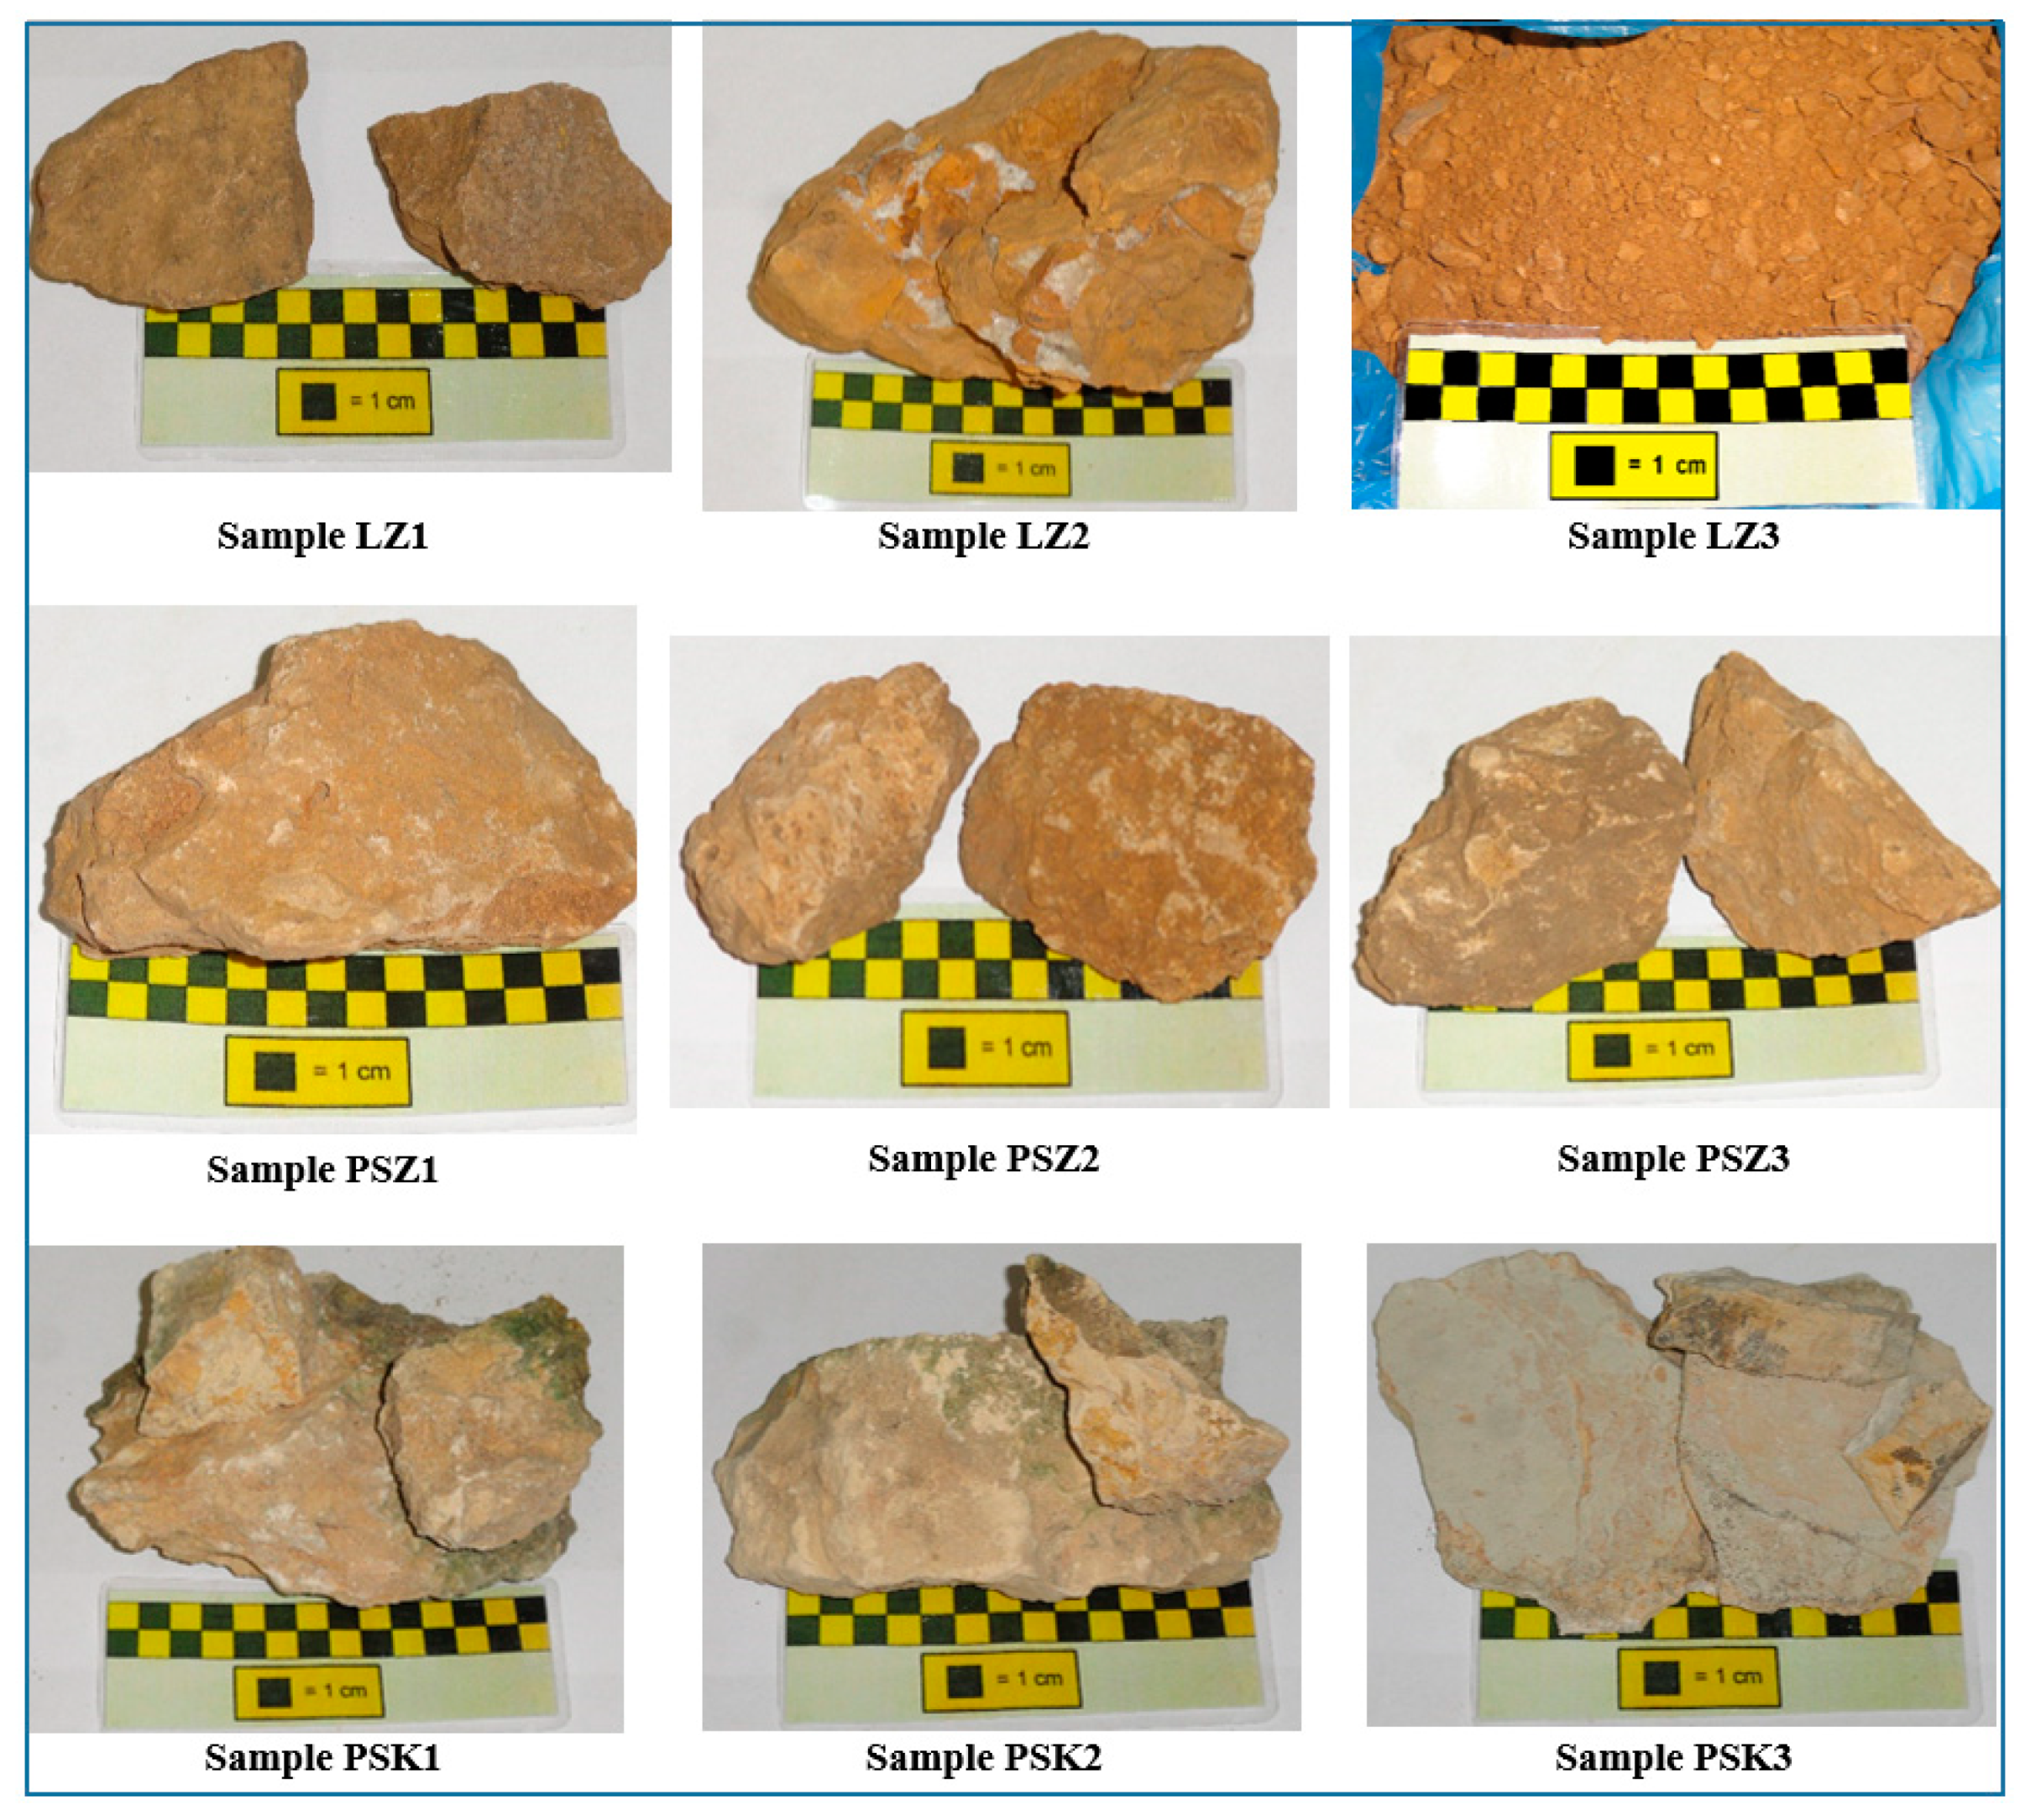
During this project two types of rocks were studied: lime dolomites and dolomites. Photographs of the samples are shown in the figure below (Figure 2).
Samples taken from the Lazarówka quarry are characterized by a dark brown color and low compactness, especially the LZ3 sample. It could be probably the effect of weathering processes The rocks show a sparite texture and a chaotic, compact, in places porous structure. The exception is the LZ3 sample – it is unconsolidated rock. Reaction with hydrochloric acid, either weak or occurring after pulverization, strongly indicates dolomite predominance. It can therefore be concluded that these are probably dolomitic limestones or lime dolomites. The data obtained by applying X-ray Diffraction and X-Ray Fluorescence (XRF) will provide more detailed information about these rocks. In the case of rocks taken from the area of Piekary Śląskie, from Karłowicz and Zawisza Czarny Streets, the reaction with hydrochloric acid occurs after pulverization, which indicates the dolomite dominance. Thus, these rocks can be defined as dolomites. The rocks taken from the area at Zawisza Czarny Street present a brown or light brown color, a dolosparite texture and a compact, chaotic structure. The rocks taken from the area of Karłowicz Street are characterized by a gray color, a dolosparite texture and a compact, disordered structure.
Six samples of carbonate rocks were subjected to microscopic examination.
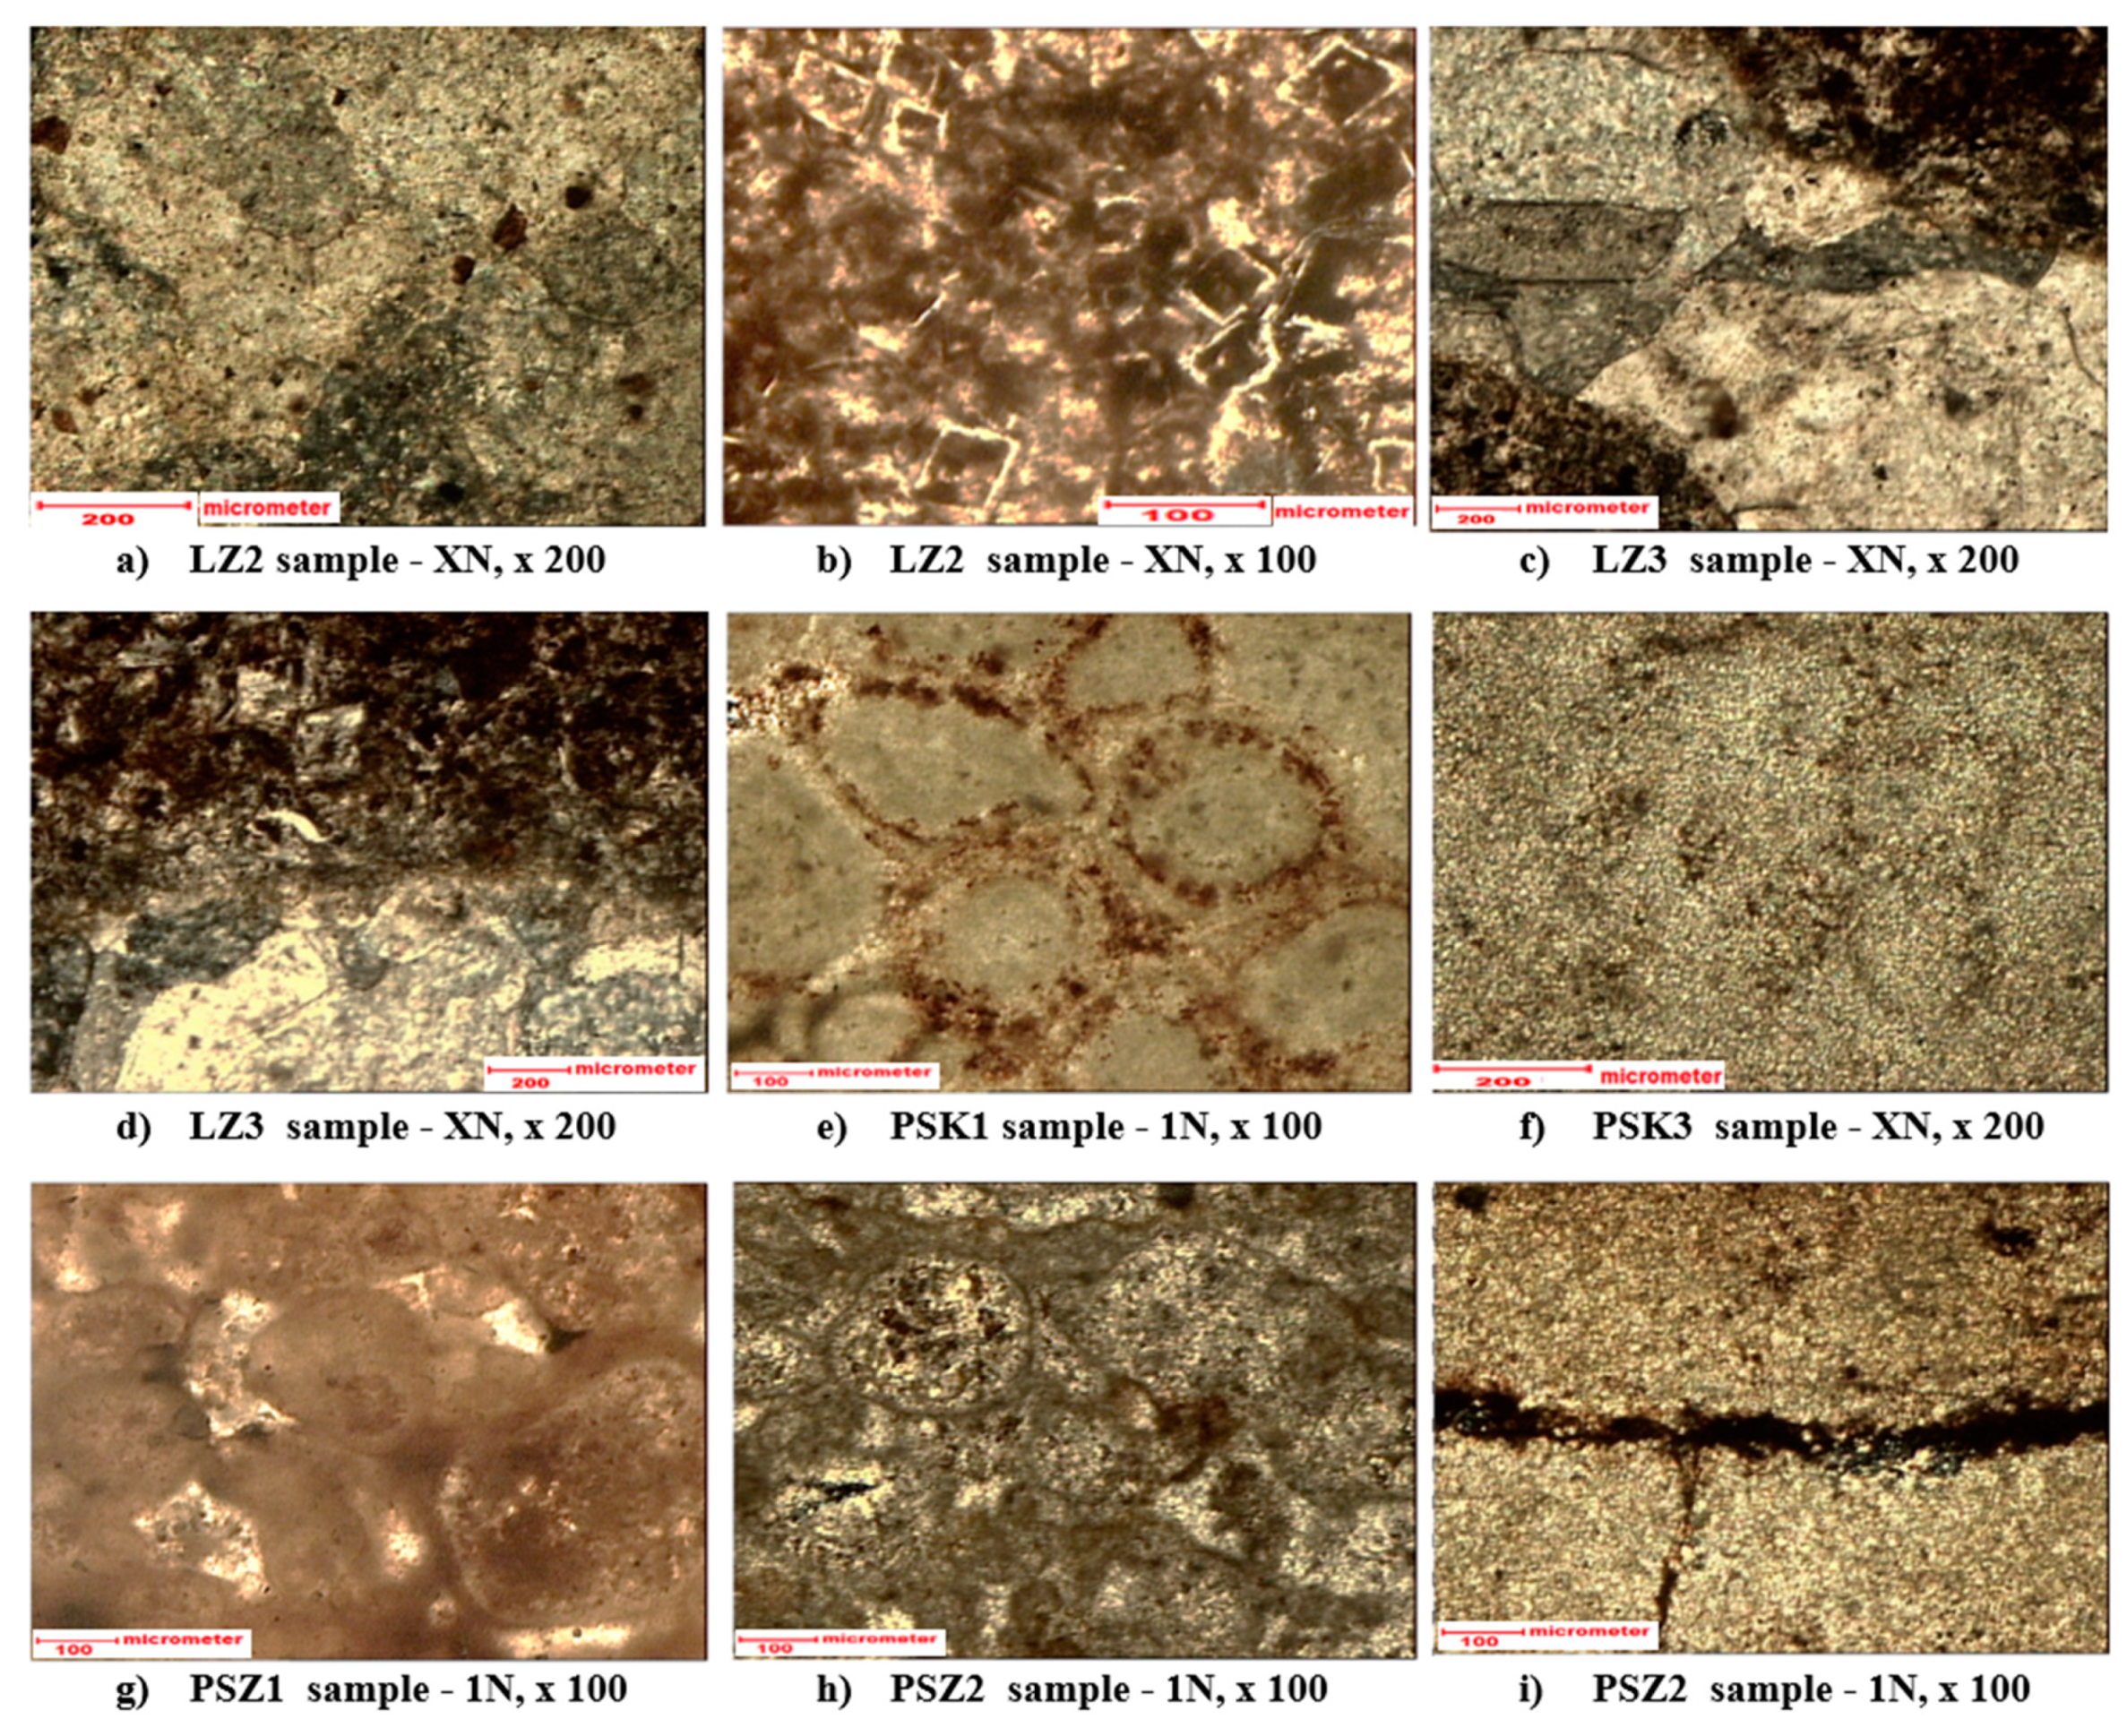
The rocks from the Lazarówka Quarry in the microscopic images have a sparite texture (samples LZ2, LZ3 - Figure 3a, c, d, e), in some places biomorphic (Sample LZ2 - Figure 3b). The structure is chaotic, compact. Sparite rocks contain veins built of coarse-crystalline calcite (Figure 3a, d, e), as well as euhedral, rhombohedral dolomite crystals (Figure 3c, e). Dolomite crystals are often filled with iron compounds (Figure 3c), so they can be treated as dolomite pseudomorphs. Rocks with a biomorphic texture include oval bioclasts, bonded with contact cement, with pores in some places (Figure 3b). In the mineral composition, dolomite and calcite as well as admixtures of Fe compounds were determined. The samples from Piekary Śląskie have a biomorphic (samples PSK1, PSZ1, PSZ2 - Figure 3f, g, h, l, m, o) or sparite (samples PSK3, PSZ2 - Figure 3i, j, k, n) texture. The structure is compact, chaotic. Samples with a biomorphic texture similar to rocks from the Lazarówka Quarry include oval or elongated bioclasts, bonded with microsparite or sparite cement. The cement is porous or contact (Figure 3f, g, h, l, m, o). Some bioclasts have a rim made of iron compounds (Figure 3f, g). The interior of some bioclasts is filled with micrite or microsparite (Figure 3f, g, h, l, m, o). Rocks with a sparite texture are built of a rock mass. Concentrations of iron compounds are present here (Figure 3k, n), stylolites filled with Fe compounds can also be observed (Figure 3k). In addition, single, fine grains of chalcedony (Figure 3j) and quartz (Figure 3k) were identified in some samples. In the mineral composition carbonate minerals dominate. Iron compounds, chalcedony and quartz are present in smaller amounts.

3.2. Results of X-Ray Diffraction

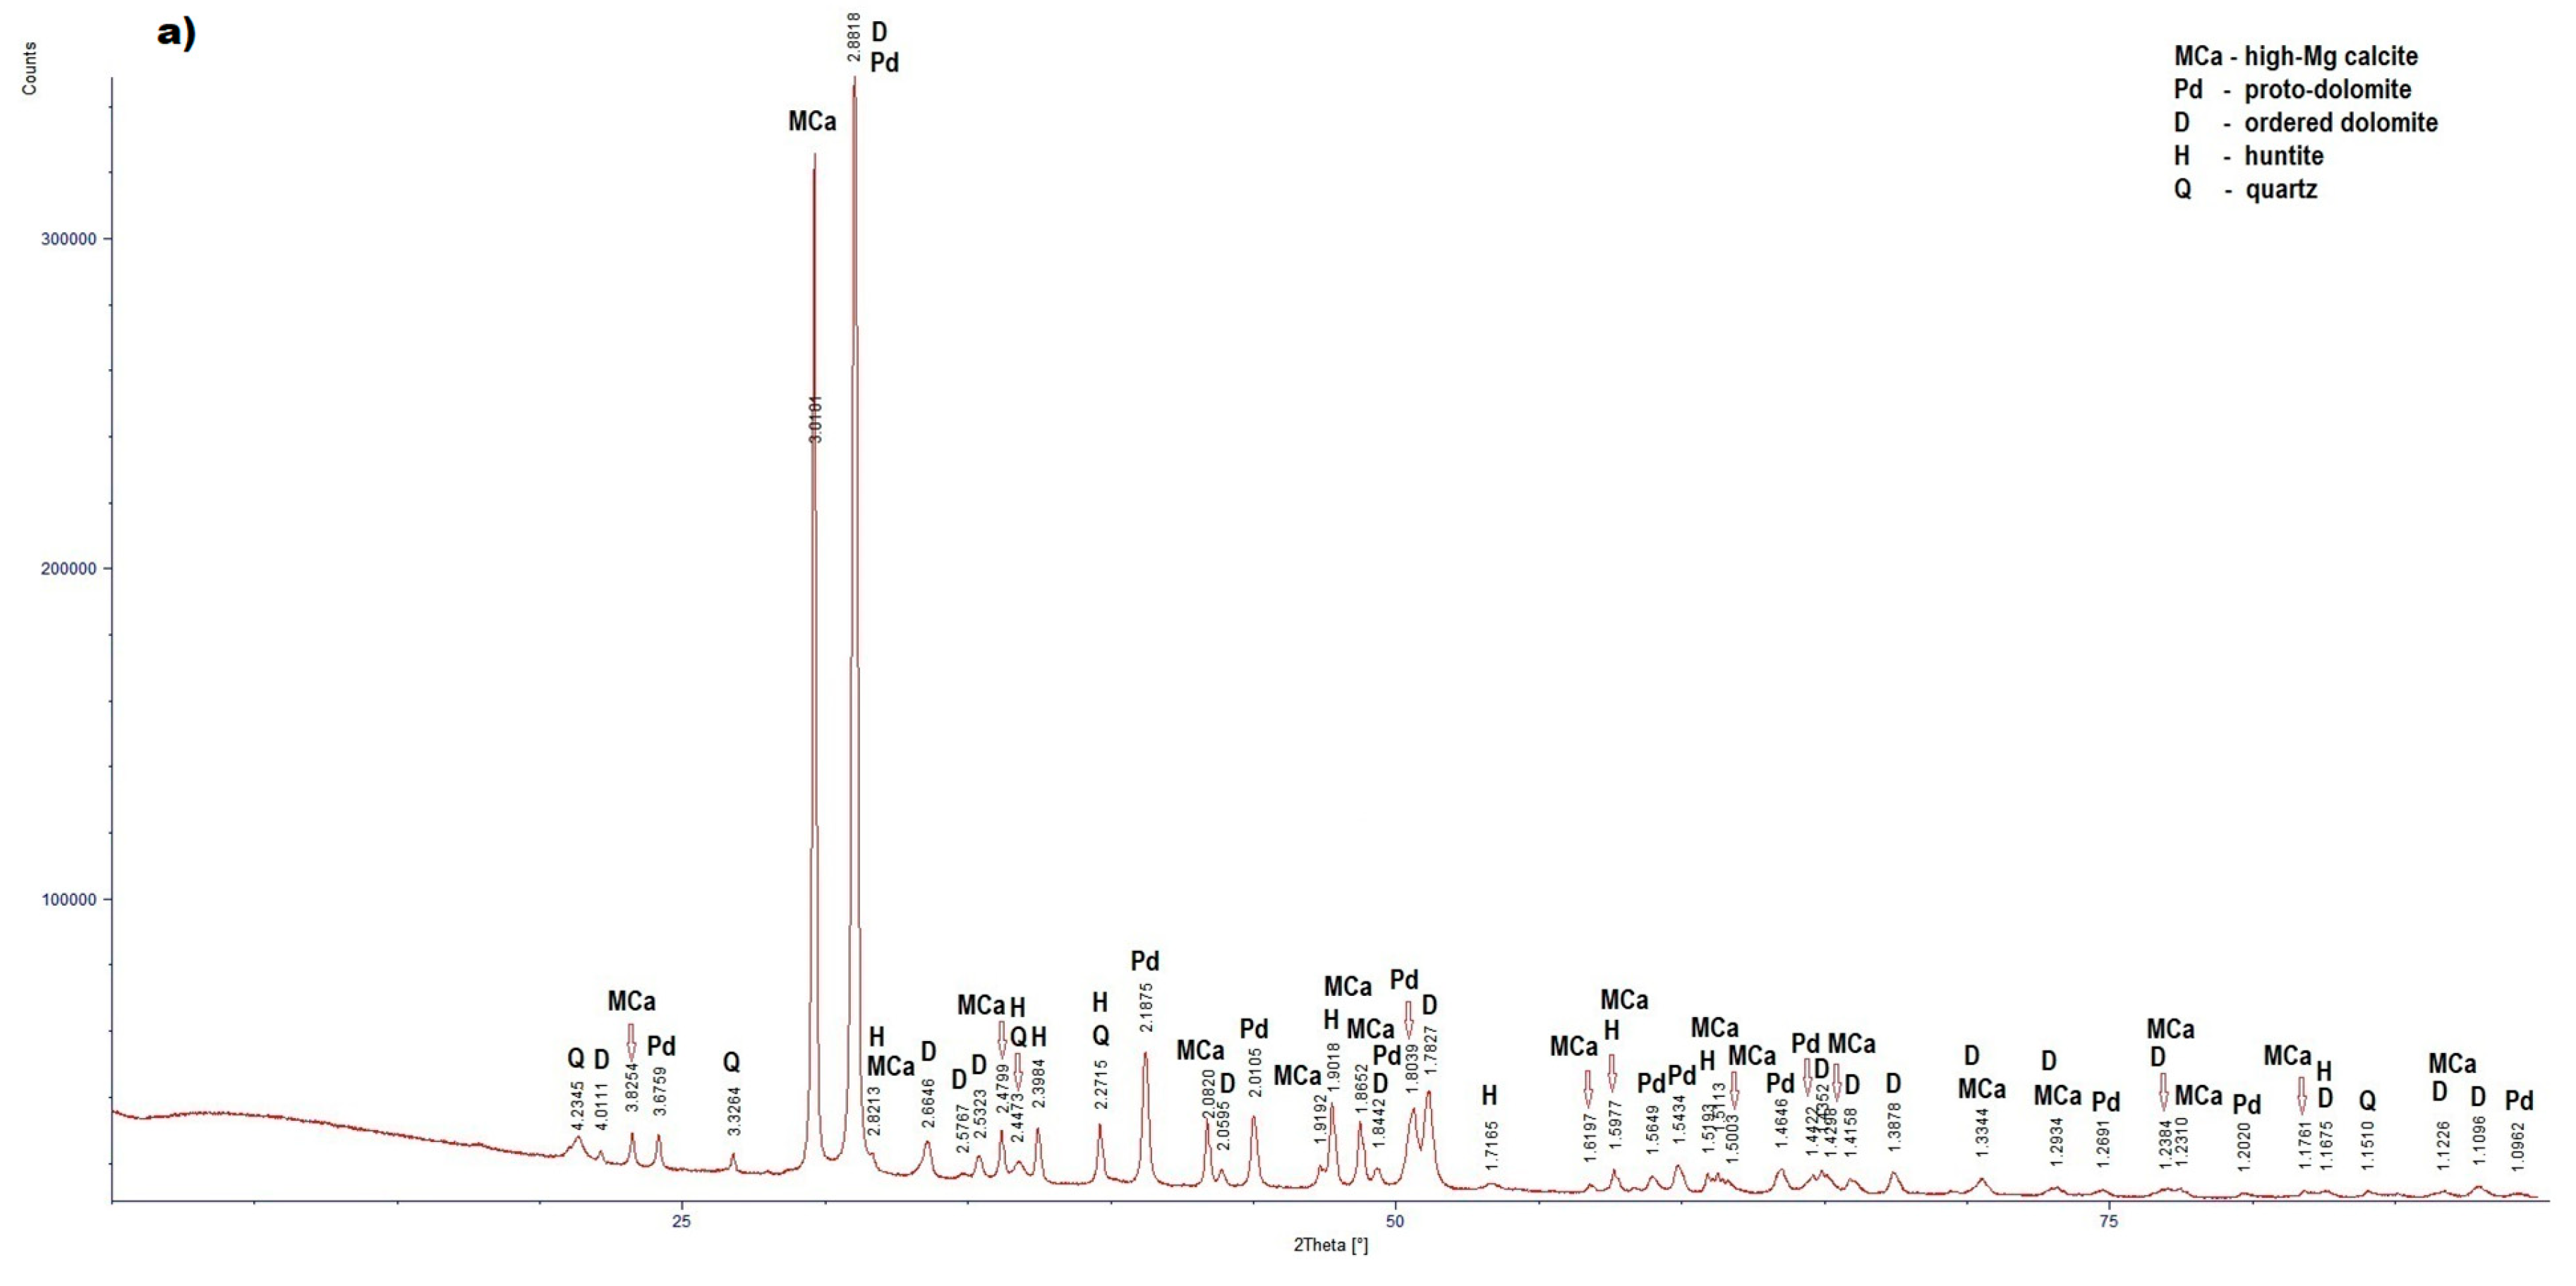
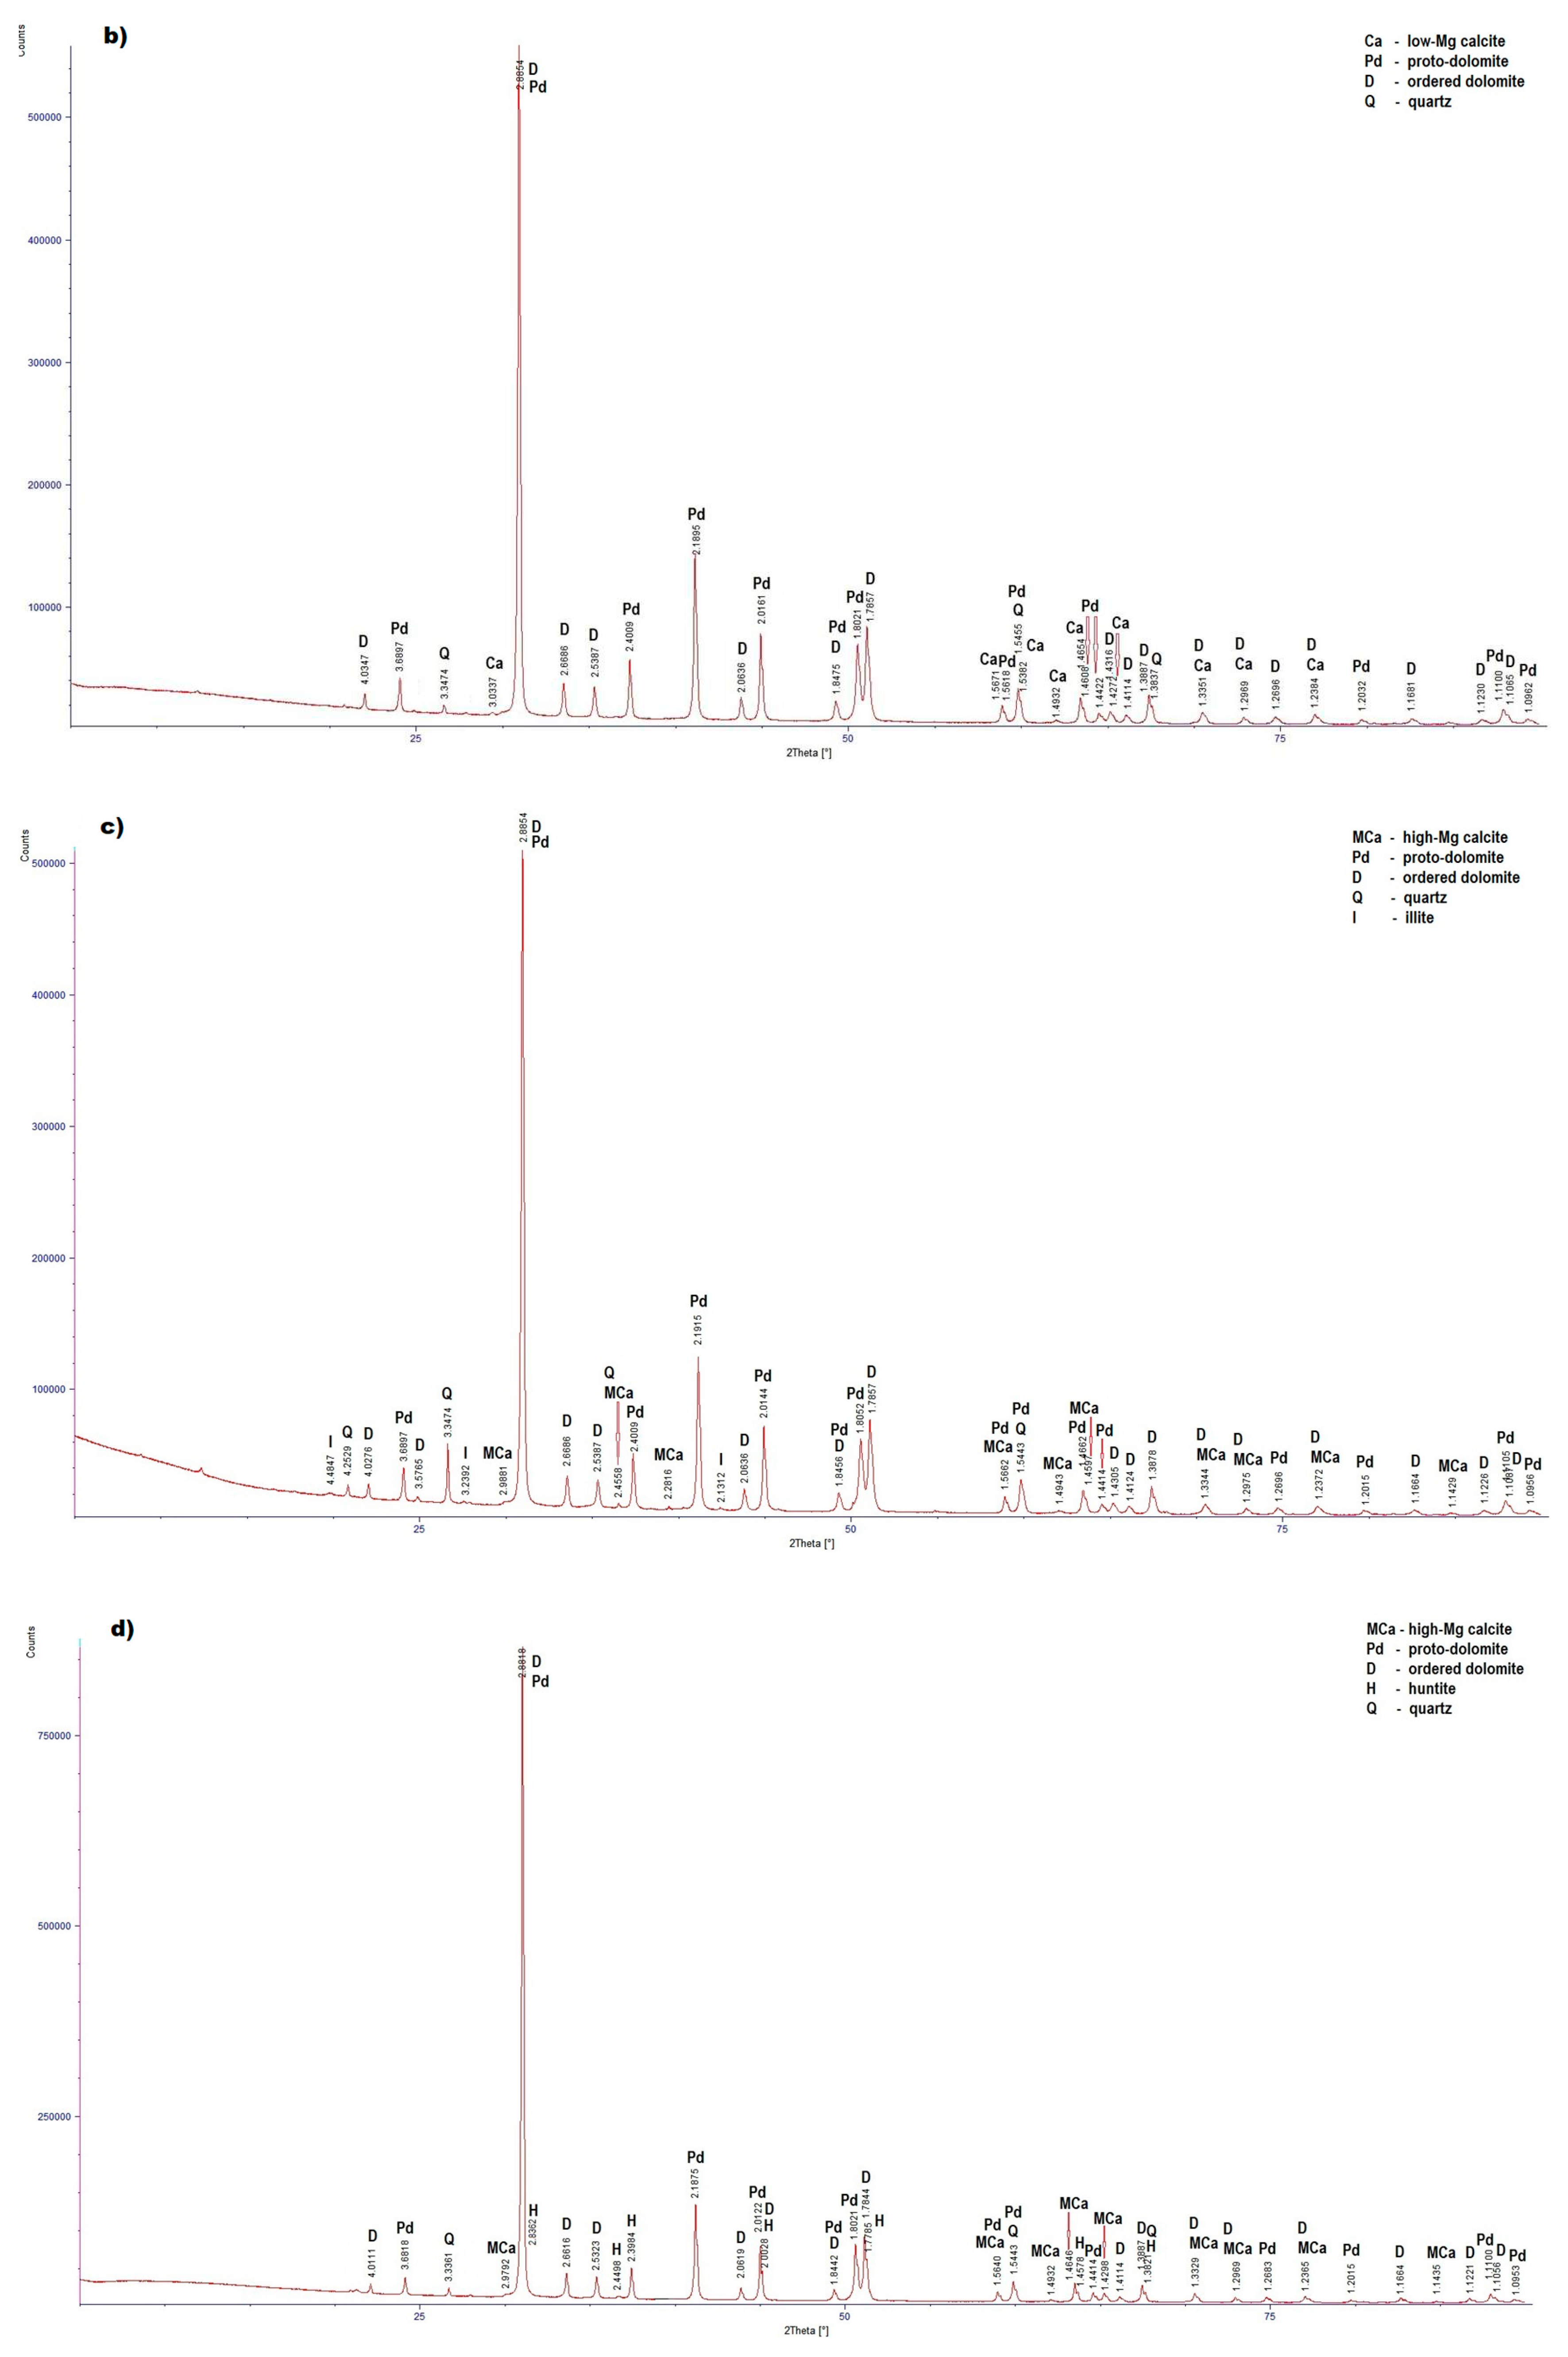
The Table 1 and Figure 4 present the results of X-ray diffraction of the examined carbonate rocks of the Tarnowice Unit. The results of X-ray diffraction show that dolomite dominate in the examined rocks. Low-magnesium calcite was determined only in the PSK1 sample (Figure 4b). In this rock, apart from the dominant dolomite and the lesser amount of low-magnesium calcite, quartz was also determined. In the samples, apart from dolomite, high-magnesium calcite is present. Huntite was identified in the LZ2 and PSZ1 samples (Figure 4a, d). From non-carbonate minerals, quartz was determined in the diffraction patterns of all the samples (Figure 4), and additionally illite in the sample PSK3 (Figure 4c). The X-ray diffraction results indicate that the dominant calcite phase in the examined rocks is high-magnesium calcite. Based on the results of X-ray diffraction, it can be concluded that the rocks the rocks from the Lazarówka quarry can be described as calcareous dolomites, while the rocks from the area of Piekary Śląskie represent dolomites, with a small amounts of calcite or, in the case of some rocks, huntite.

3.3. Results of X-Ray Fluorescence

By XRF analysis, the elements present in the studied carbonate rocks were determined. The dolomites’ test results are given in Table 2, Table 3 and Table 4. The results of the study of the elemental composition indicate that the highest percentage present the elements building carbonate minerals, i.e. Ca, Mg, C, O (Table 2). These elements are part of carbonate phases such as: low-magnesium calcite, high-magnesium calcite, dolomite phases and huntite. In smaller amounts, the following elements were determined: Na, Al, Si, K, Mn, Fe, F, P, S, Cl, Ti, Cr, Ni, Cu, Zn, Sr, Ba and Pb, and in some samples Rb, Br, Co, As and Cd.
Manganese and iron can be substitutions for Ca and Mg in carbonate minerals. Strontium and barium are elements originally present in aragonite, an unstable phase of calcium carbonate, which, like high-magnesium calcite, is transformed into low-magnesium calcite during diagenesis. Ni, K, Si, Al, as well as some Fe, Br and Cd will be included in the composition of aluminosilicates - mainly feldspars and clay minerals. S, Ti, Cr, some Fe, Ni, Cu, Zn Pb will probably be bound in sulfides and oxides. During sedimentation processes, Ni is incorporated into the structures of clay minerals. Nor can it form sulfides and arsenides. What appear together with Fe and Mn in smithsonite. Chlorine is bound in chlorides and phosphorus is present in organic matter.
The content of individual elements, basic oxides included in the minerals of the examined rocks, MgCO3 content and the value of the ratio of Ca to Mg were calculated (Table 3).
Based on the obtained data, the position of the studied carbonate rocks was presented according to the classification of Chilingar [20] and Pettijohn [21] (Table 4).
The data presented in Table 4 indicate that the studied carbonate rocks represent lime dolomites, some samples LZ2, LZ3 and PSZ1, in the classification of Pettijohn [21] – calcareous dolomites. Therefore, these rocks, apart from the mineral dolomite, also contain calcite phases, including high-magnesium calcite. This confirms the results of X-Ray diffraction.

3.4. Results of microprobe measurements

Three samples in the form of polished sections made of rocks were tested – LZ1, PSK2 and PSZ3. Quantitative measurements of the following elements were carried out: C, O, Mg, Al, Si, Ca, Mn and Fe. As part of the EDS microprobe analysis, maps of distribution of elements were made. Moreover, quantitative analysis using the EDS method and quantitative analysis at points using the WDS method were done. The results were normalized to 100%. On the basis of the measured Ca, Mg, C and O contents of carbonate phases building the examined dolomites were identified. Furthermore chemical formulas of studied carbonate phases were calculated. Other elements, such as Si, Al, Fe, Mn, are probably bound in silicates and aluminosilicates. Fe and S could be bound in pyrite. Because these elements occur in small amounts, the formulas of the minerals they form have not been determined.
Sample LZ1 - rock from the Lazarówka quarry
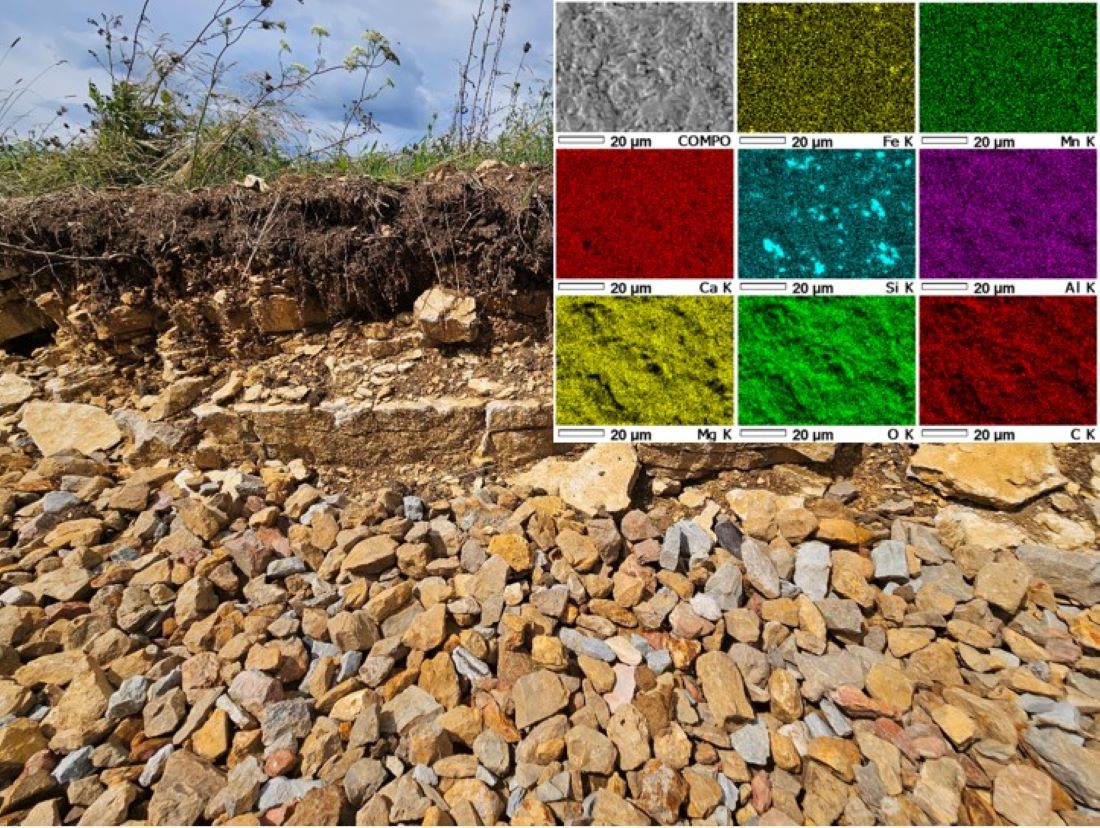
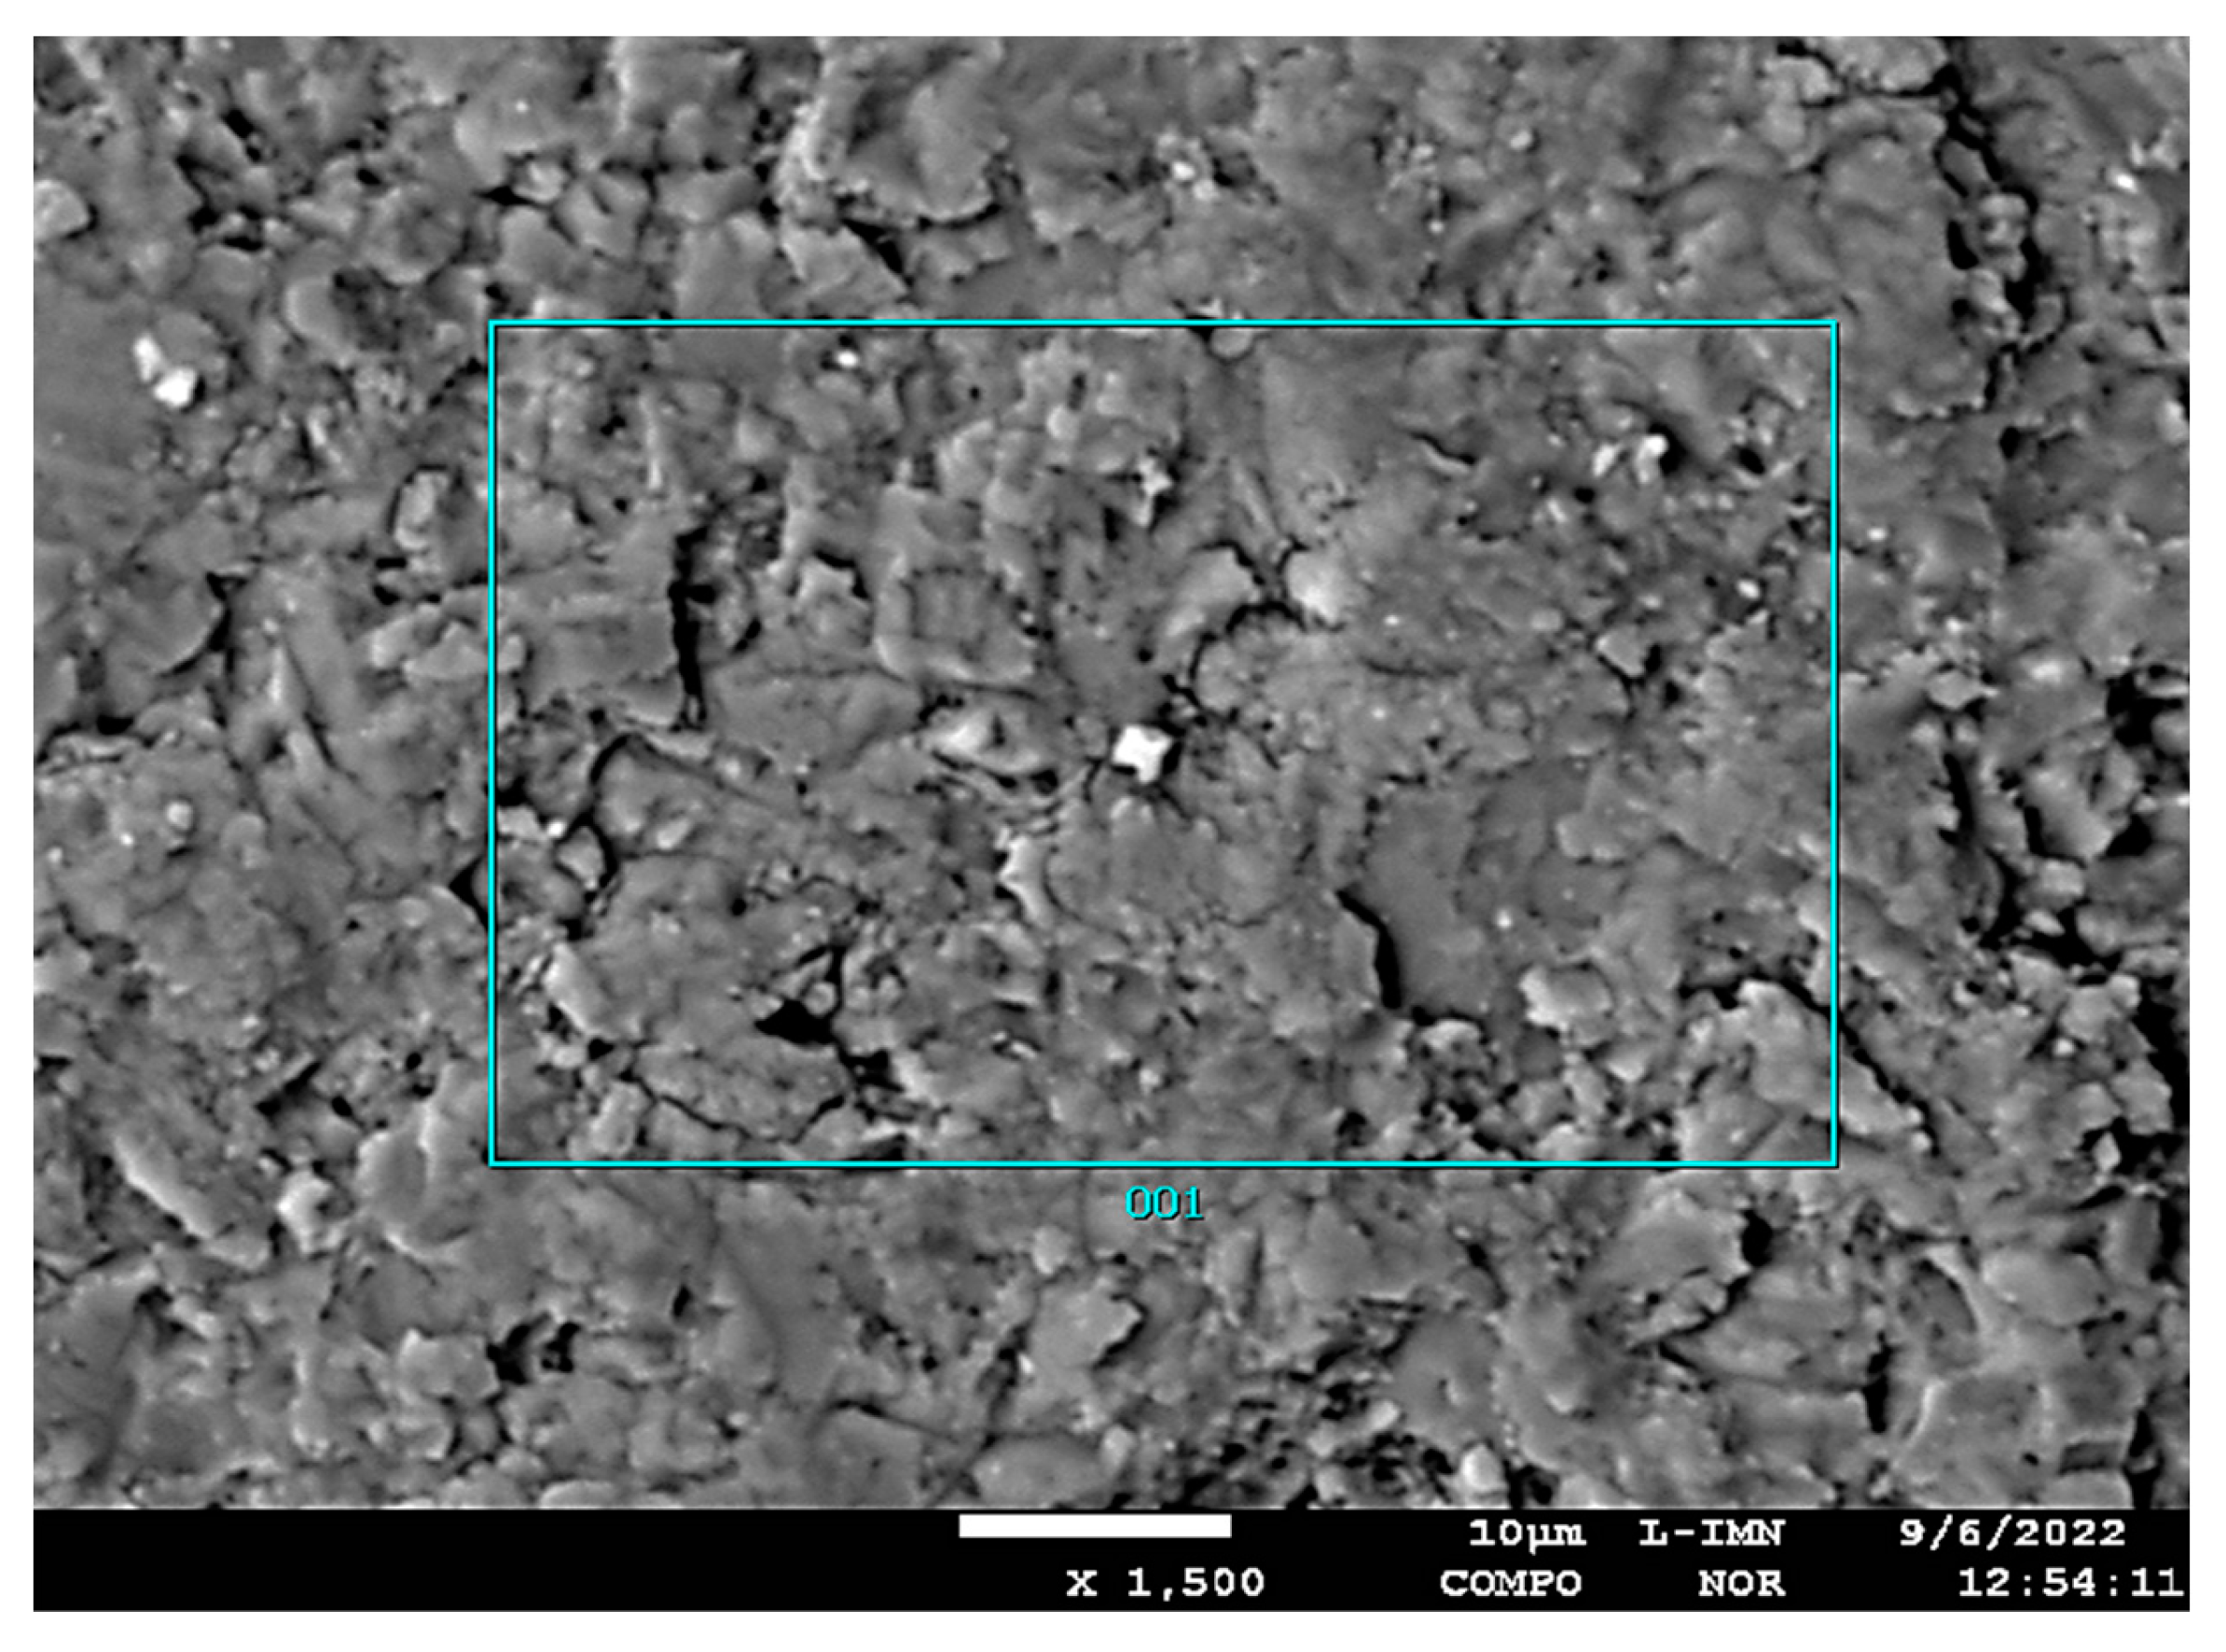
In the first stage of microprobe analysis, the distribution of the following elements was measured: Mn, Ca, S, Si, Al, Mg, O, C and Fe in the first micro-area of the LZ1 sample (Figure 5).
Superposition of Ca and Mg images distribution allows to determine the presence of these elements in the same areas, which indicates the presence of calcium-magnesium carbonate phases. The superposition of Fe and S images distribution allows to determine the presence of iron sufhides – pyrite in the sample. And the ocurrence of Si and Al in the same areas of Si nad Al images indicate the presence of aluminosilicates. The rest of Si is probably connected with silicate mineral – quartz.
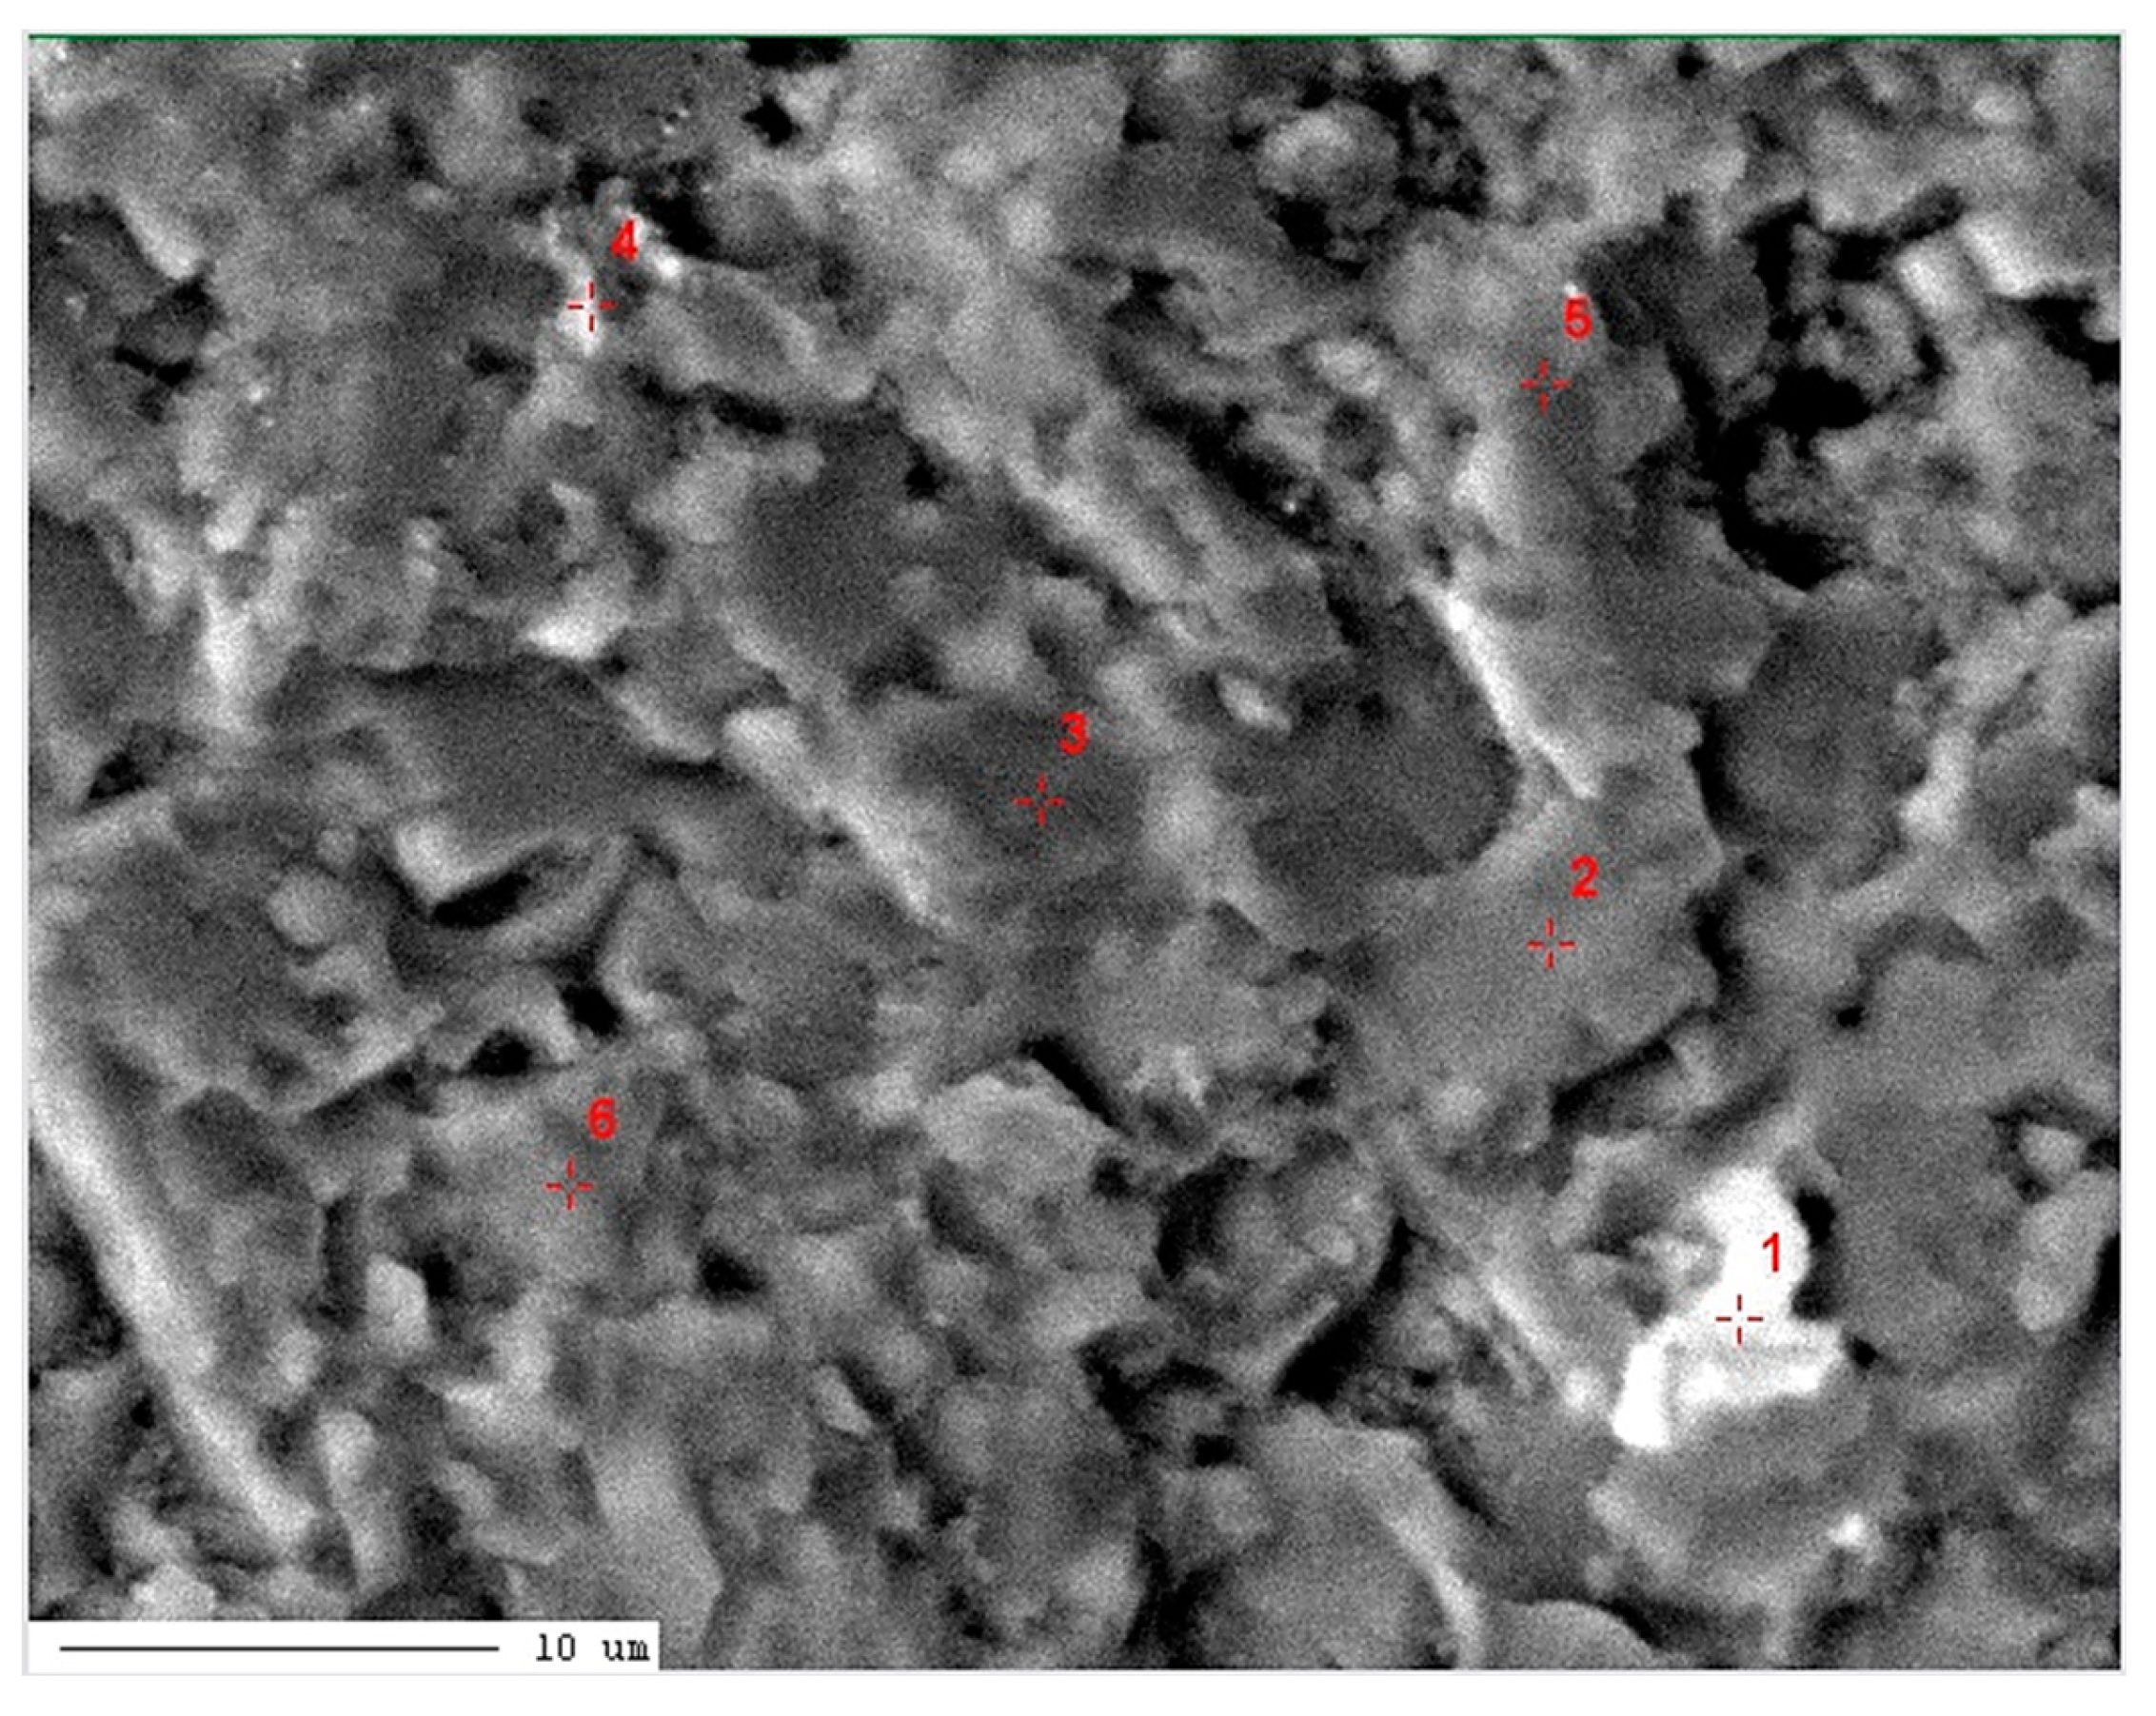
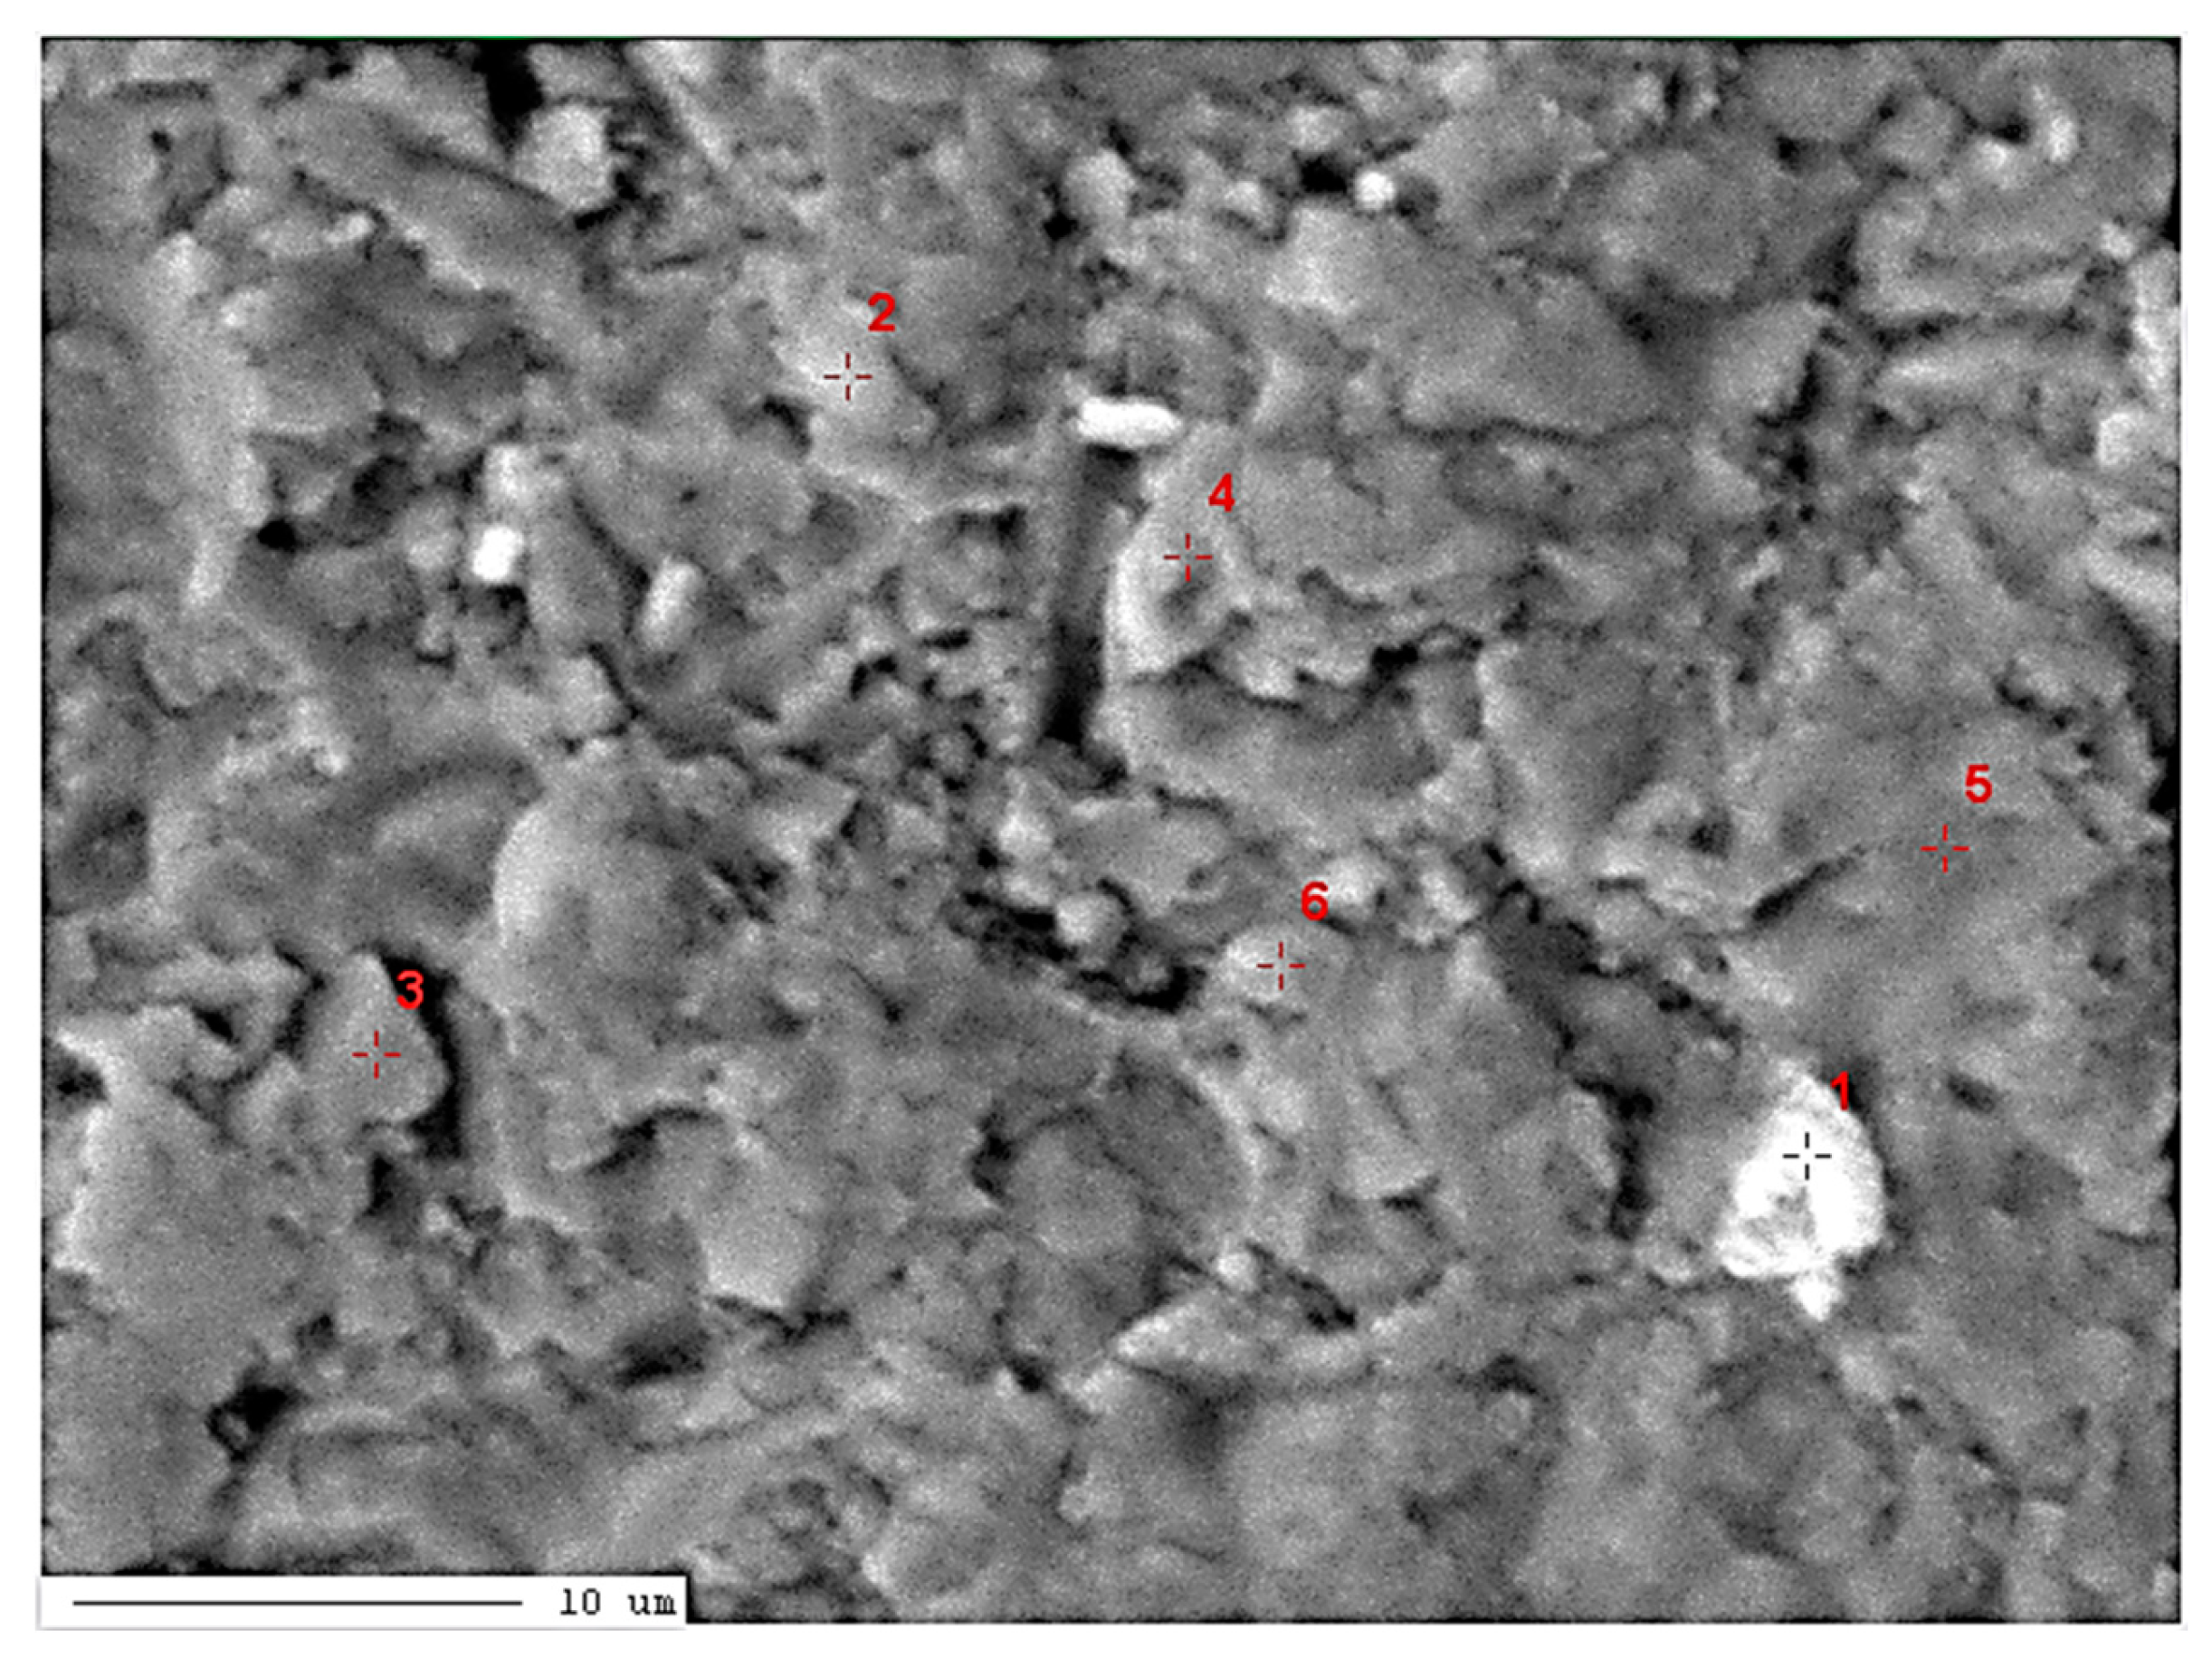
In the second micro-area of the LZ1 sample, measurements of the elemental content were done using the WDS method (Figure 6, Table 5).
The results of measurements in micro-area 2 of the LZ1 sample indicate the presence of three carbonate phases with different Mg content: low-magnesium calcite (point 1), high-magnesium calcite (points 2, 3 and 4) and proto-dolomite (points 5 and 6) (Figure 6, Table 5 ). Proto-dolomite of the sample LZ1 is characterized by a lower MgO content than the stoichiometric value for dolomite (MgO – 21.86 %, Mg – 13.18 %).
Sample PSK2 - rock from the area of Piekary Śląskie (Karłowicz Street)
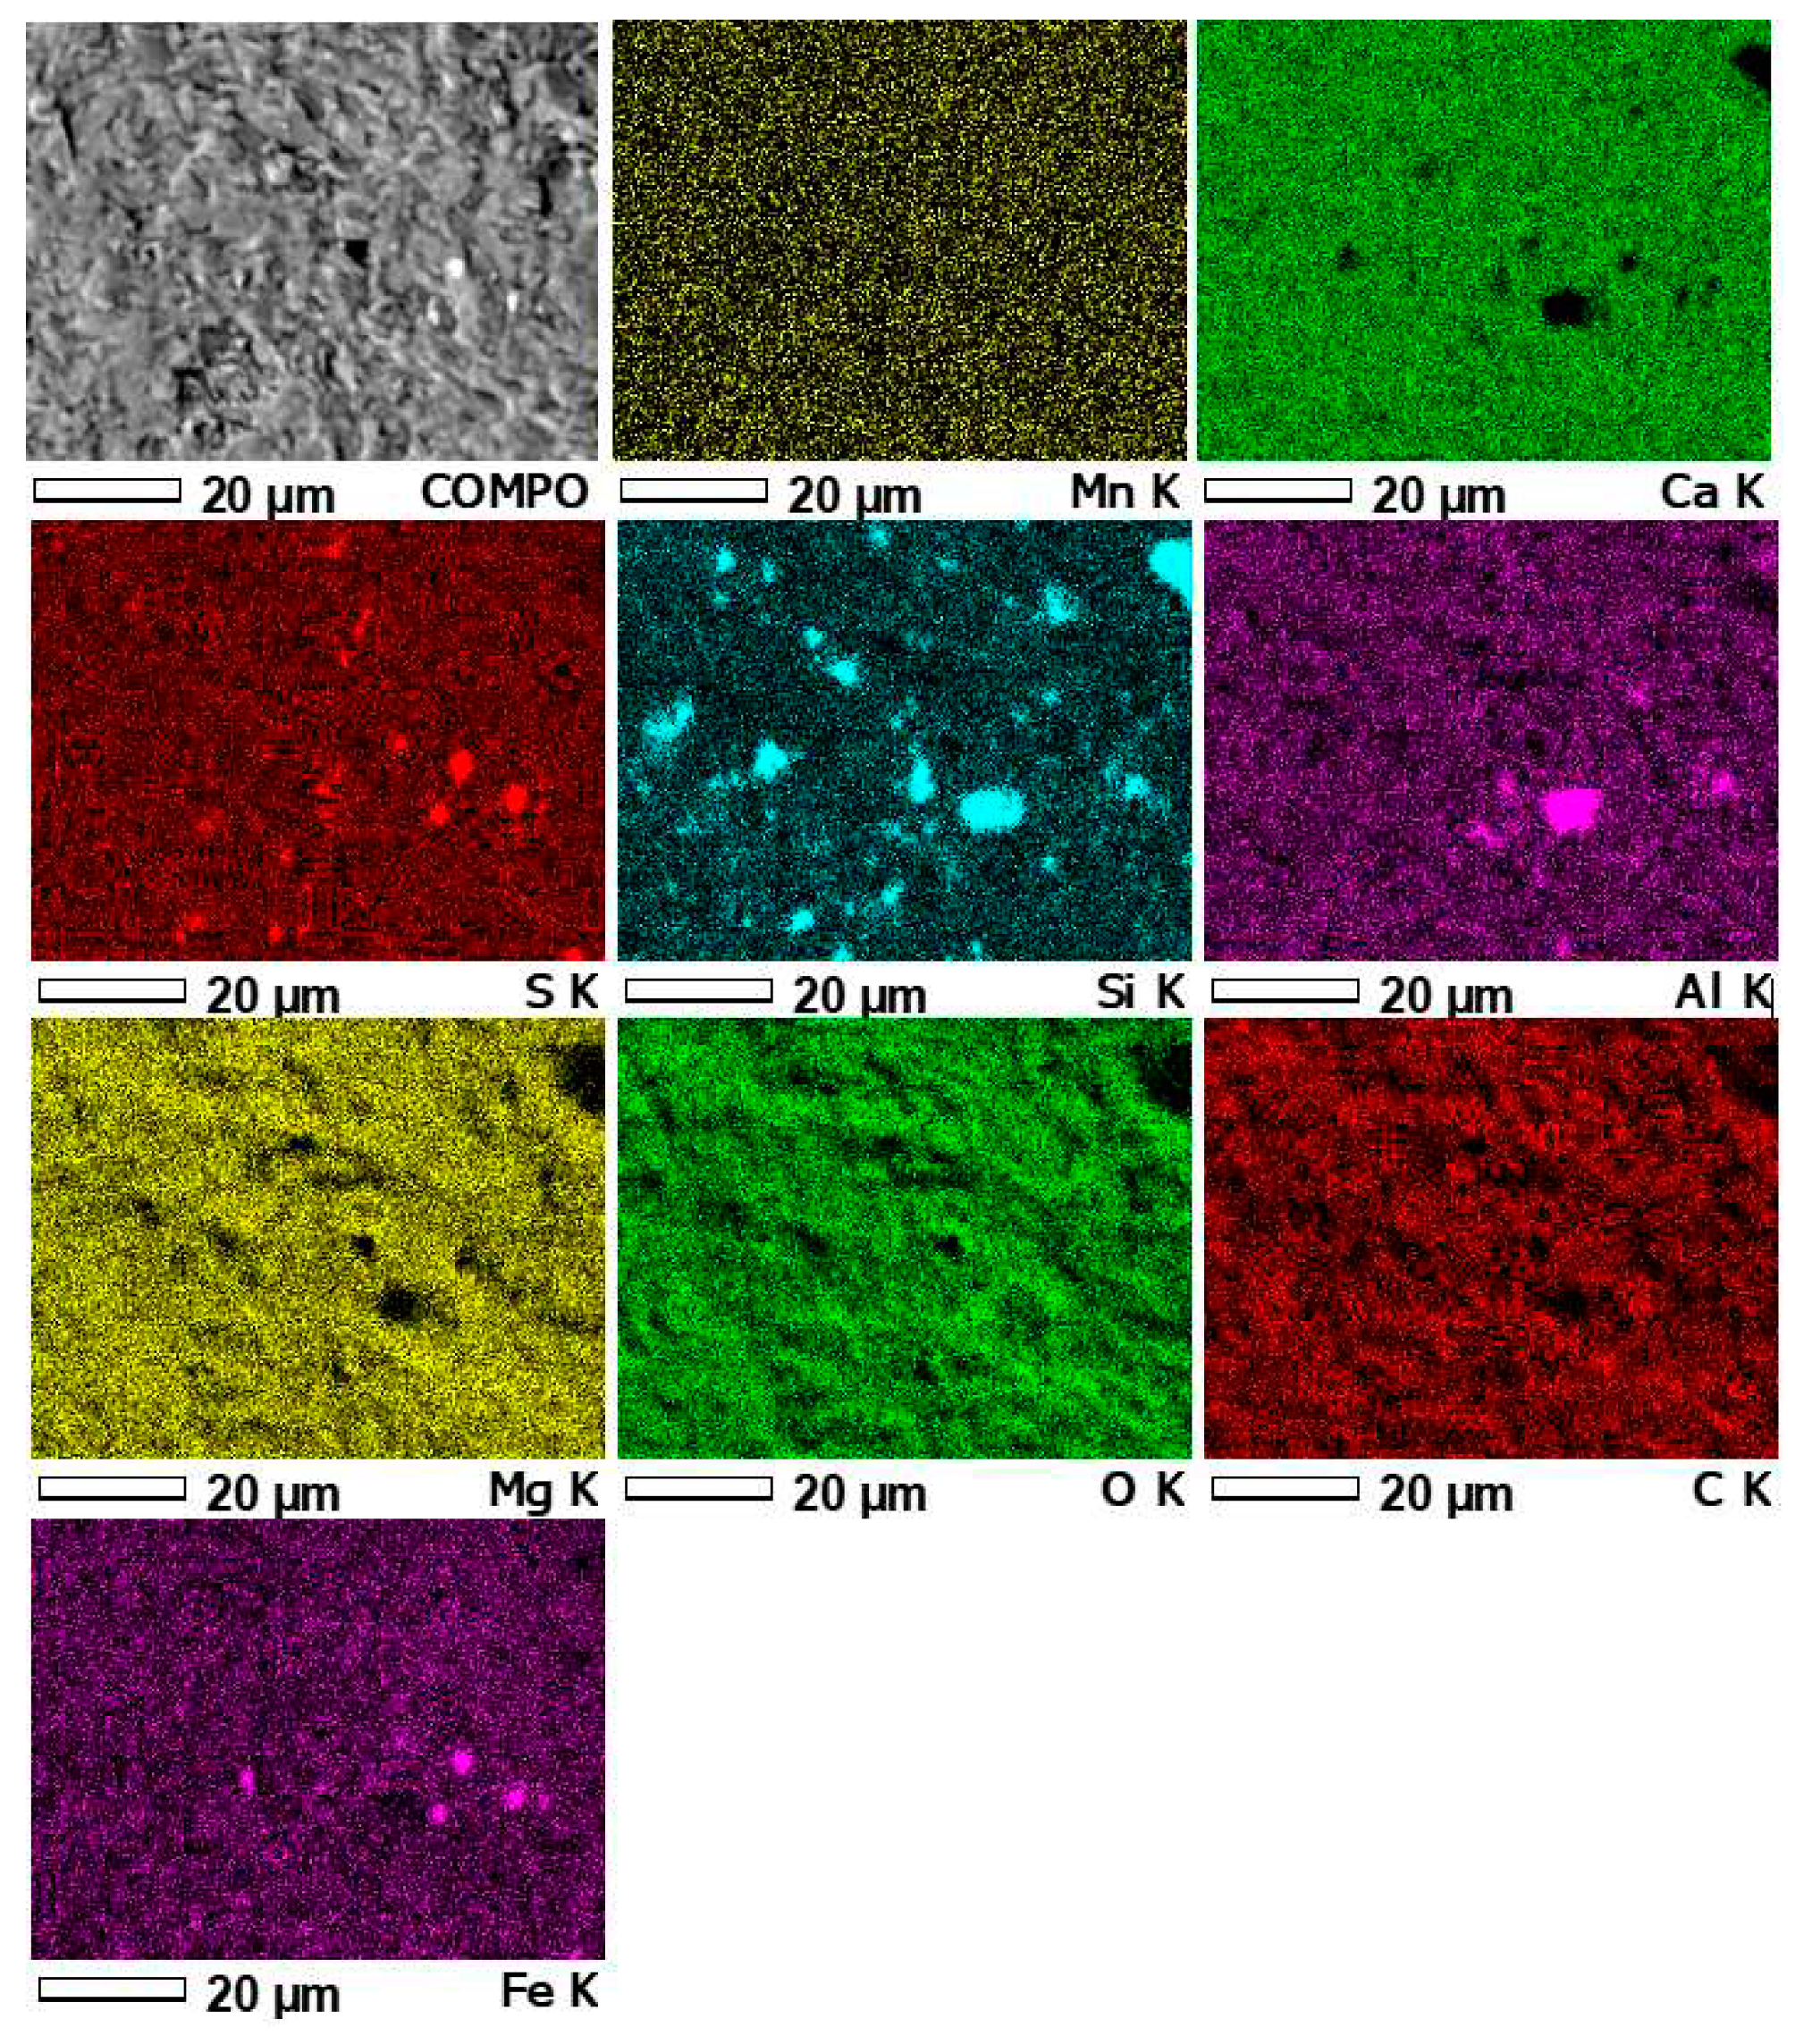
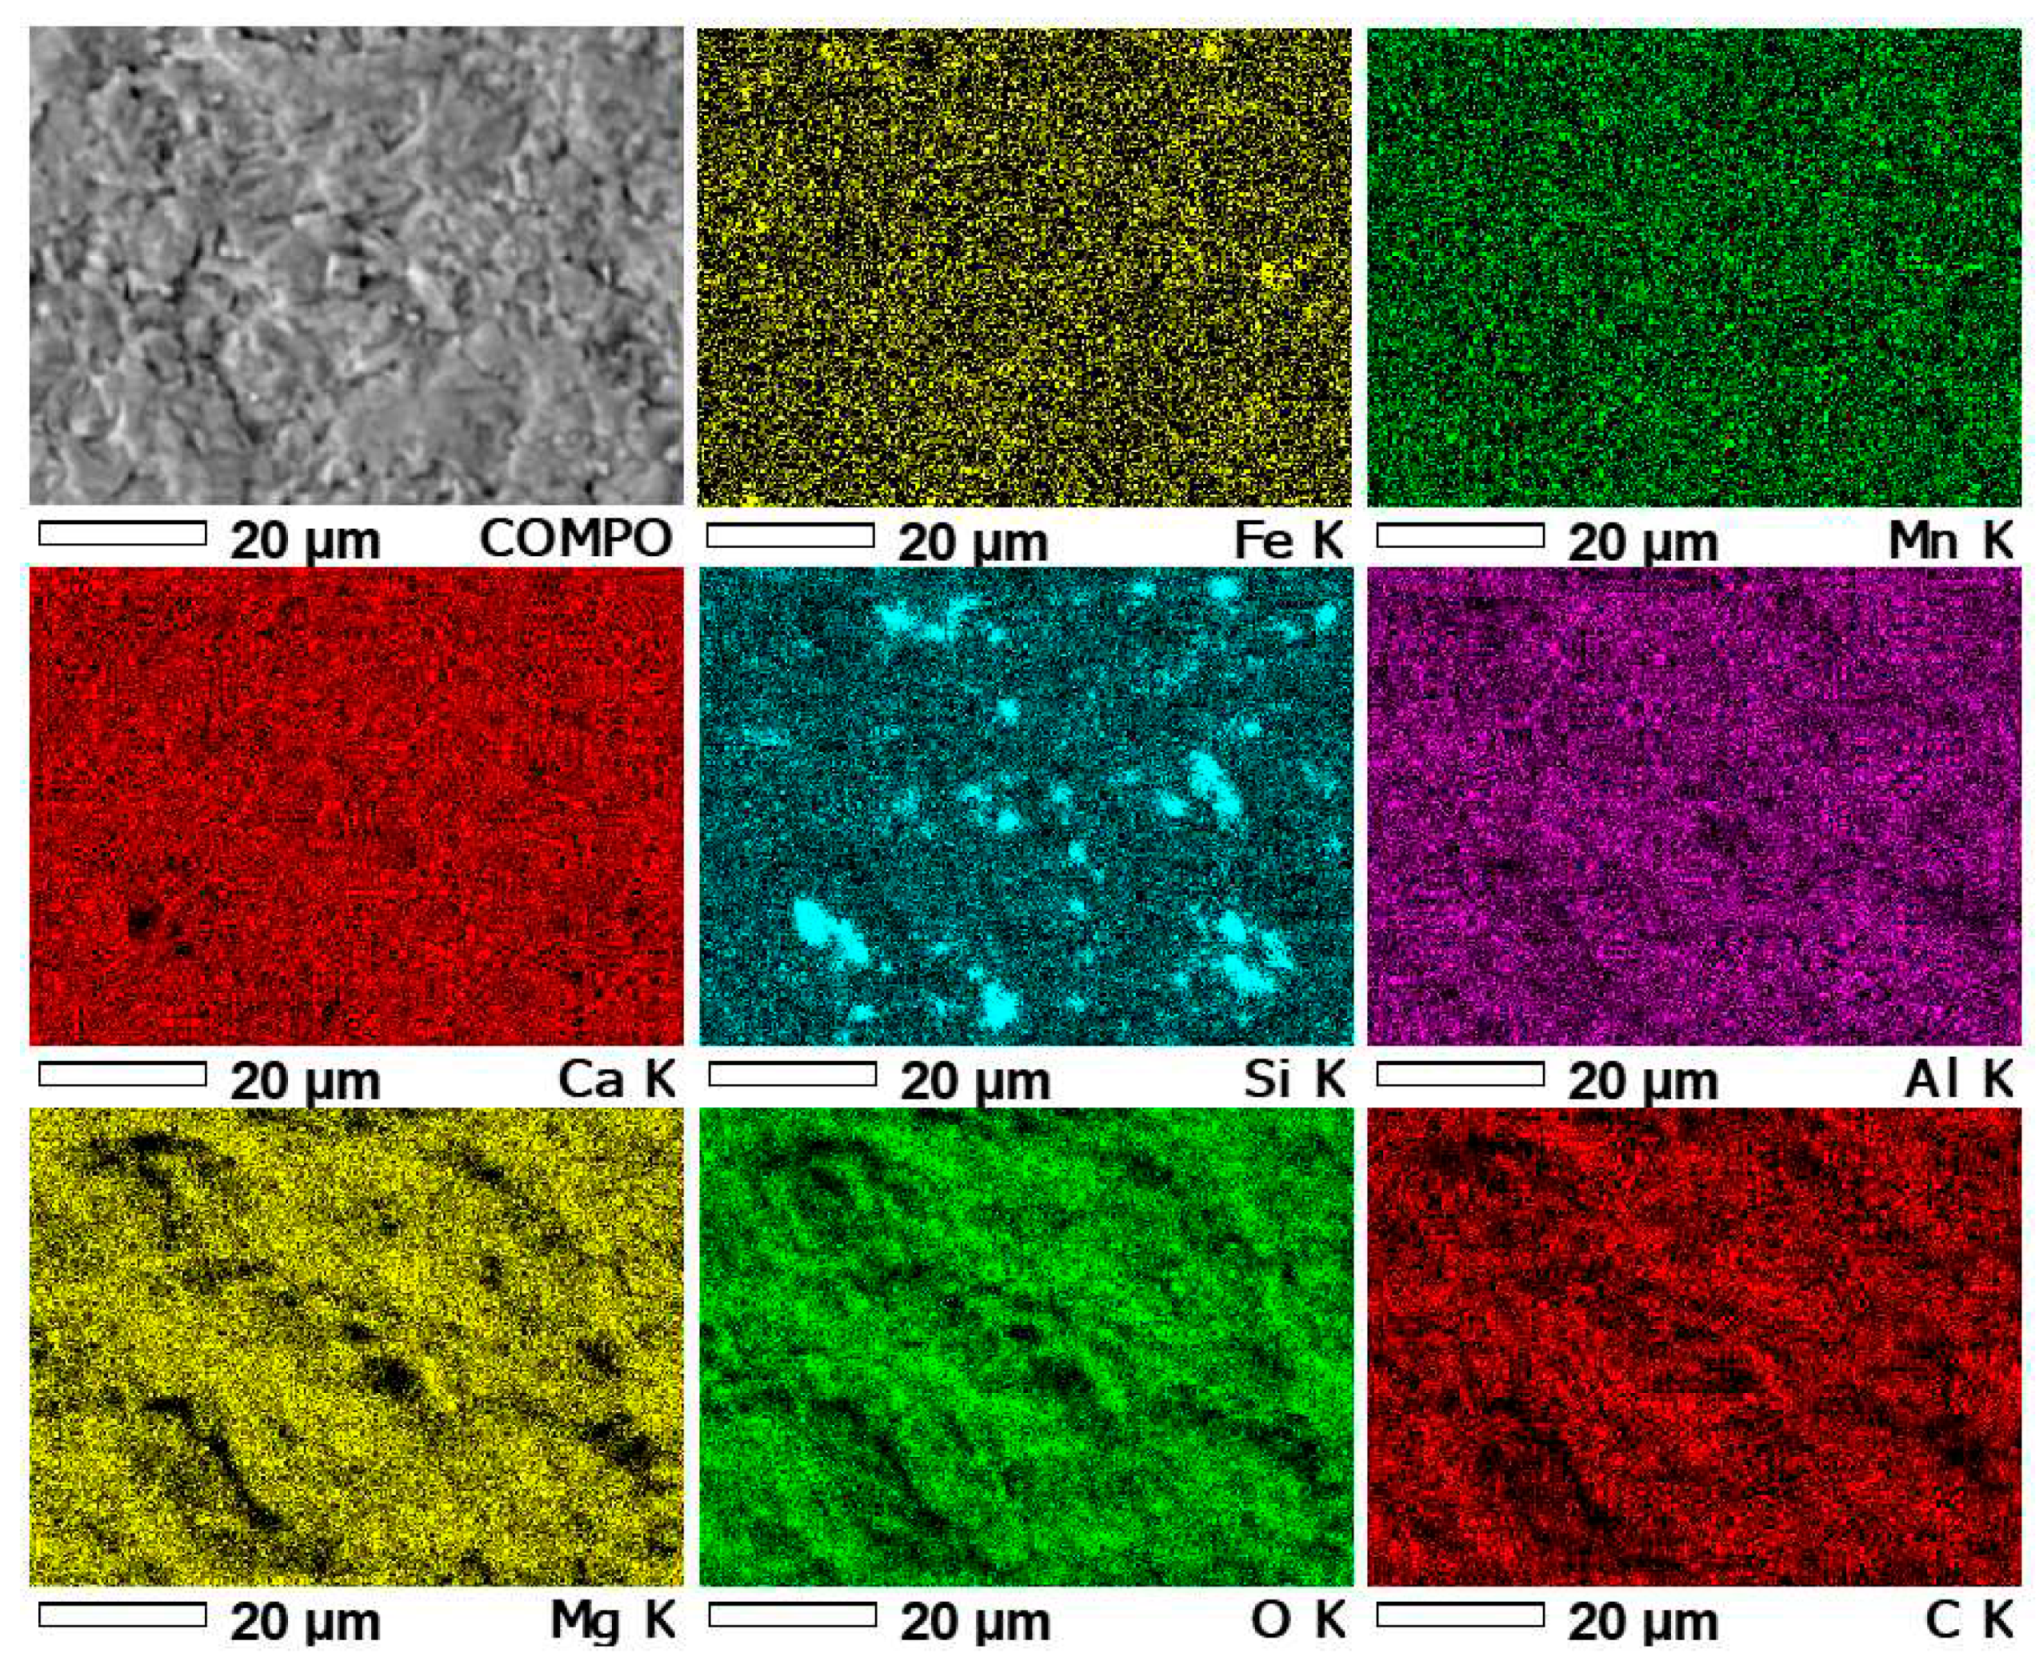
In the first stage of the study of the PSK2 sample, in micro-area 1 of this sample the distribution of the following elements was measured: Mn, Ca, Si, Al, Mg, O, C and Fe (Figure 7).
Superposition of Ca and Mg images distribution (Figure 7) allows to determine the presence of these elements in the same areas, which indicates the presence of calcium-magnesium carbonate phases. The superposition of Ca, Mg and Fe distribution images allows to determine the presence of carbonate phases rich in Mg with substitution of Fe (dolomite phases). And the occurrence of Si and Al in the same areas of Si and Al images indicate the presence of aluminosilicates. The rest of Si is like in the sample LZ1 probably connected with presence of quartz.
In micro-area 2 of the PSK2 sample, the content of basic elements was measured using the EDS method (Figure 8, Table 6).
The results of measurements using EDS method in micro-area 1 of the PSK2 sample indicate the presence of a carbonate phase with an increased magnesium content, higher than typical for dolomite, but lower than stoichiometric value for huntite (MgO – 34.25%, Mg – 20.65%). This may indicate the presence of huntite carbonate phase, transformed during the dehuntization process. During this process the part of the magnesium ions was removed from the huntite crystal. Because of it the content of MgO is definitely lower than the stoichiometric value for huntite. Therefore this mineral phase was named as de-huntite.
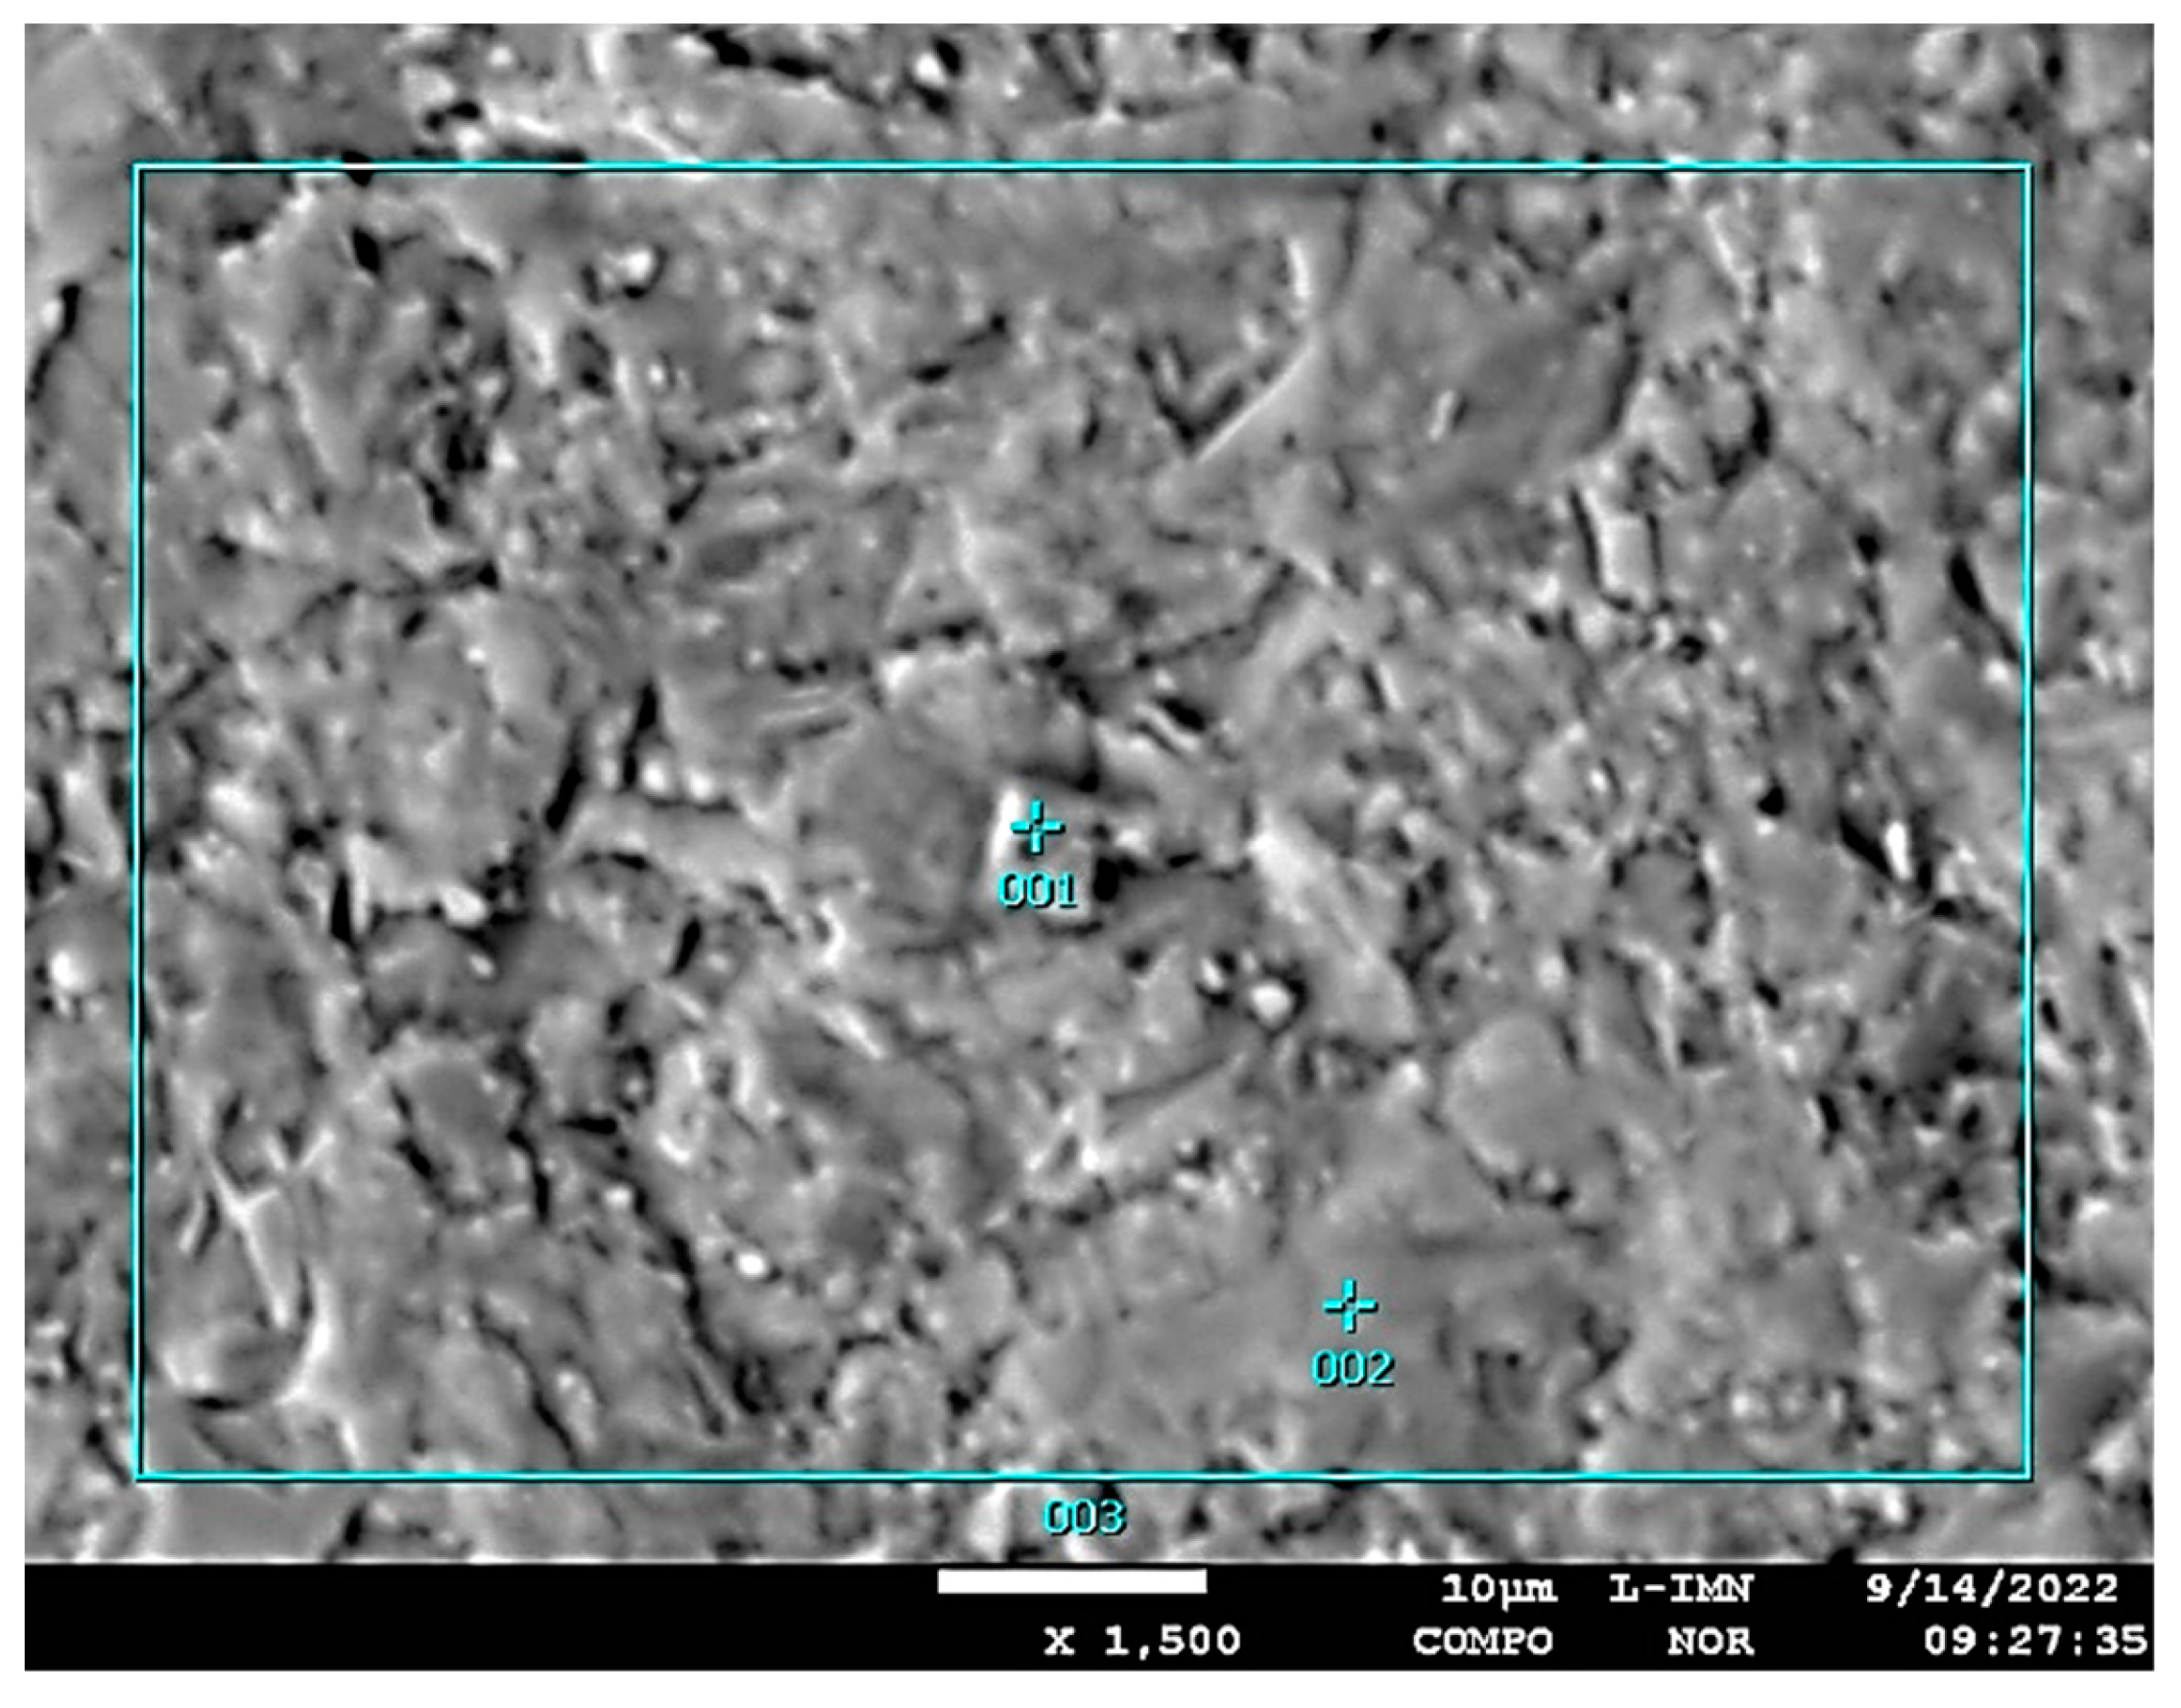
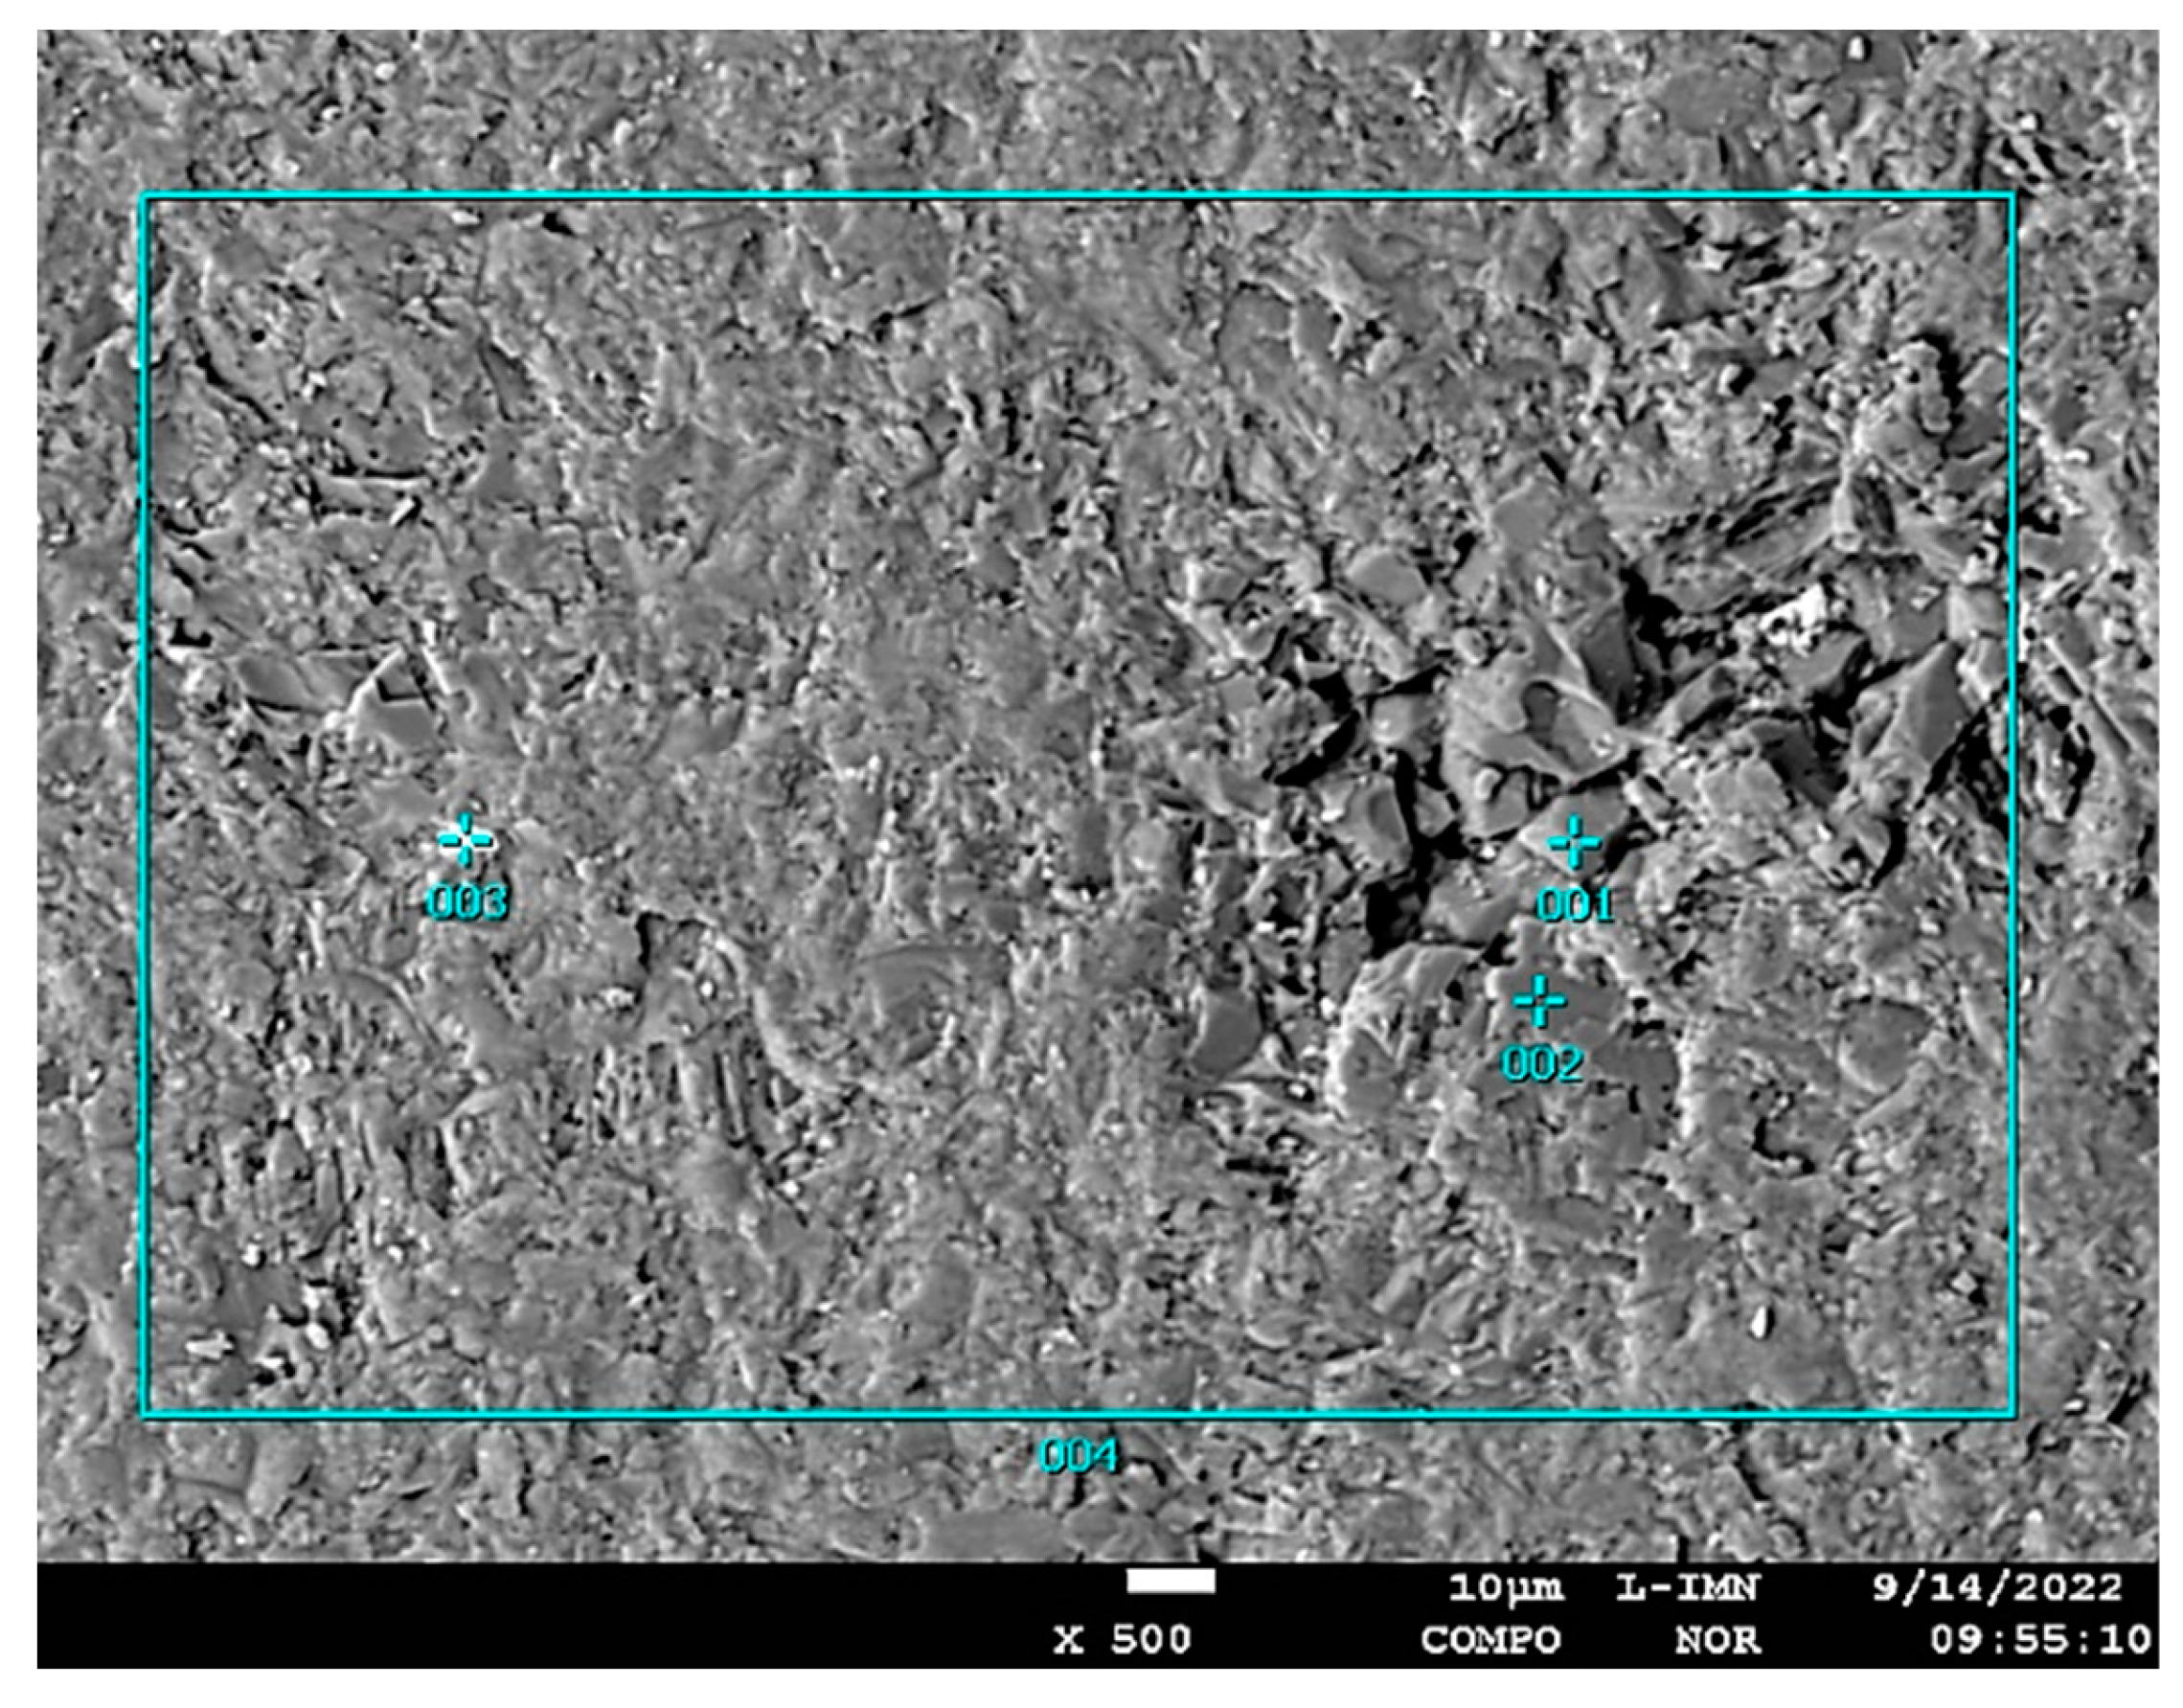
In the third micro-area of the PSK2 sample, measurements of the elemental content were done using the WDS method (Figure 9, Table 7).
The results of measurements in micro-area 2 of the PSK2 sample indicate the presence of two carbonate phases with different Mg content – high-magnesium calcite (points 3 and 4) and proto-dolomite (points 2, 4, 6) (Figure 9, Table 7 ). A little variability of Mg content was observed in high-Mg calcite. Proto-dolomite like in the sample LZ1 is characterized by a lower MgO content than the stoichiometric value for dolomite. In point 1 increased content of Si and Fe were measured. The mineral phase determined in point 1 could be Fe-Si oxyhydroxide with some minor contributions of carbonate to the beam: about 25% based on comparison of C concentration with pure carbonate spots. In point 3 the increased content of Al was measured. It is probably bound in illite. This mineral was determined by X-ray diffraction.
PSZ3 sample - rock from the area of Piekary Śląskie (Zawisza Czarny Street)
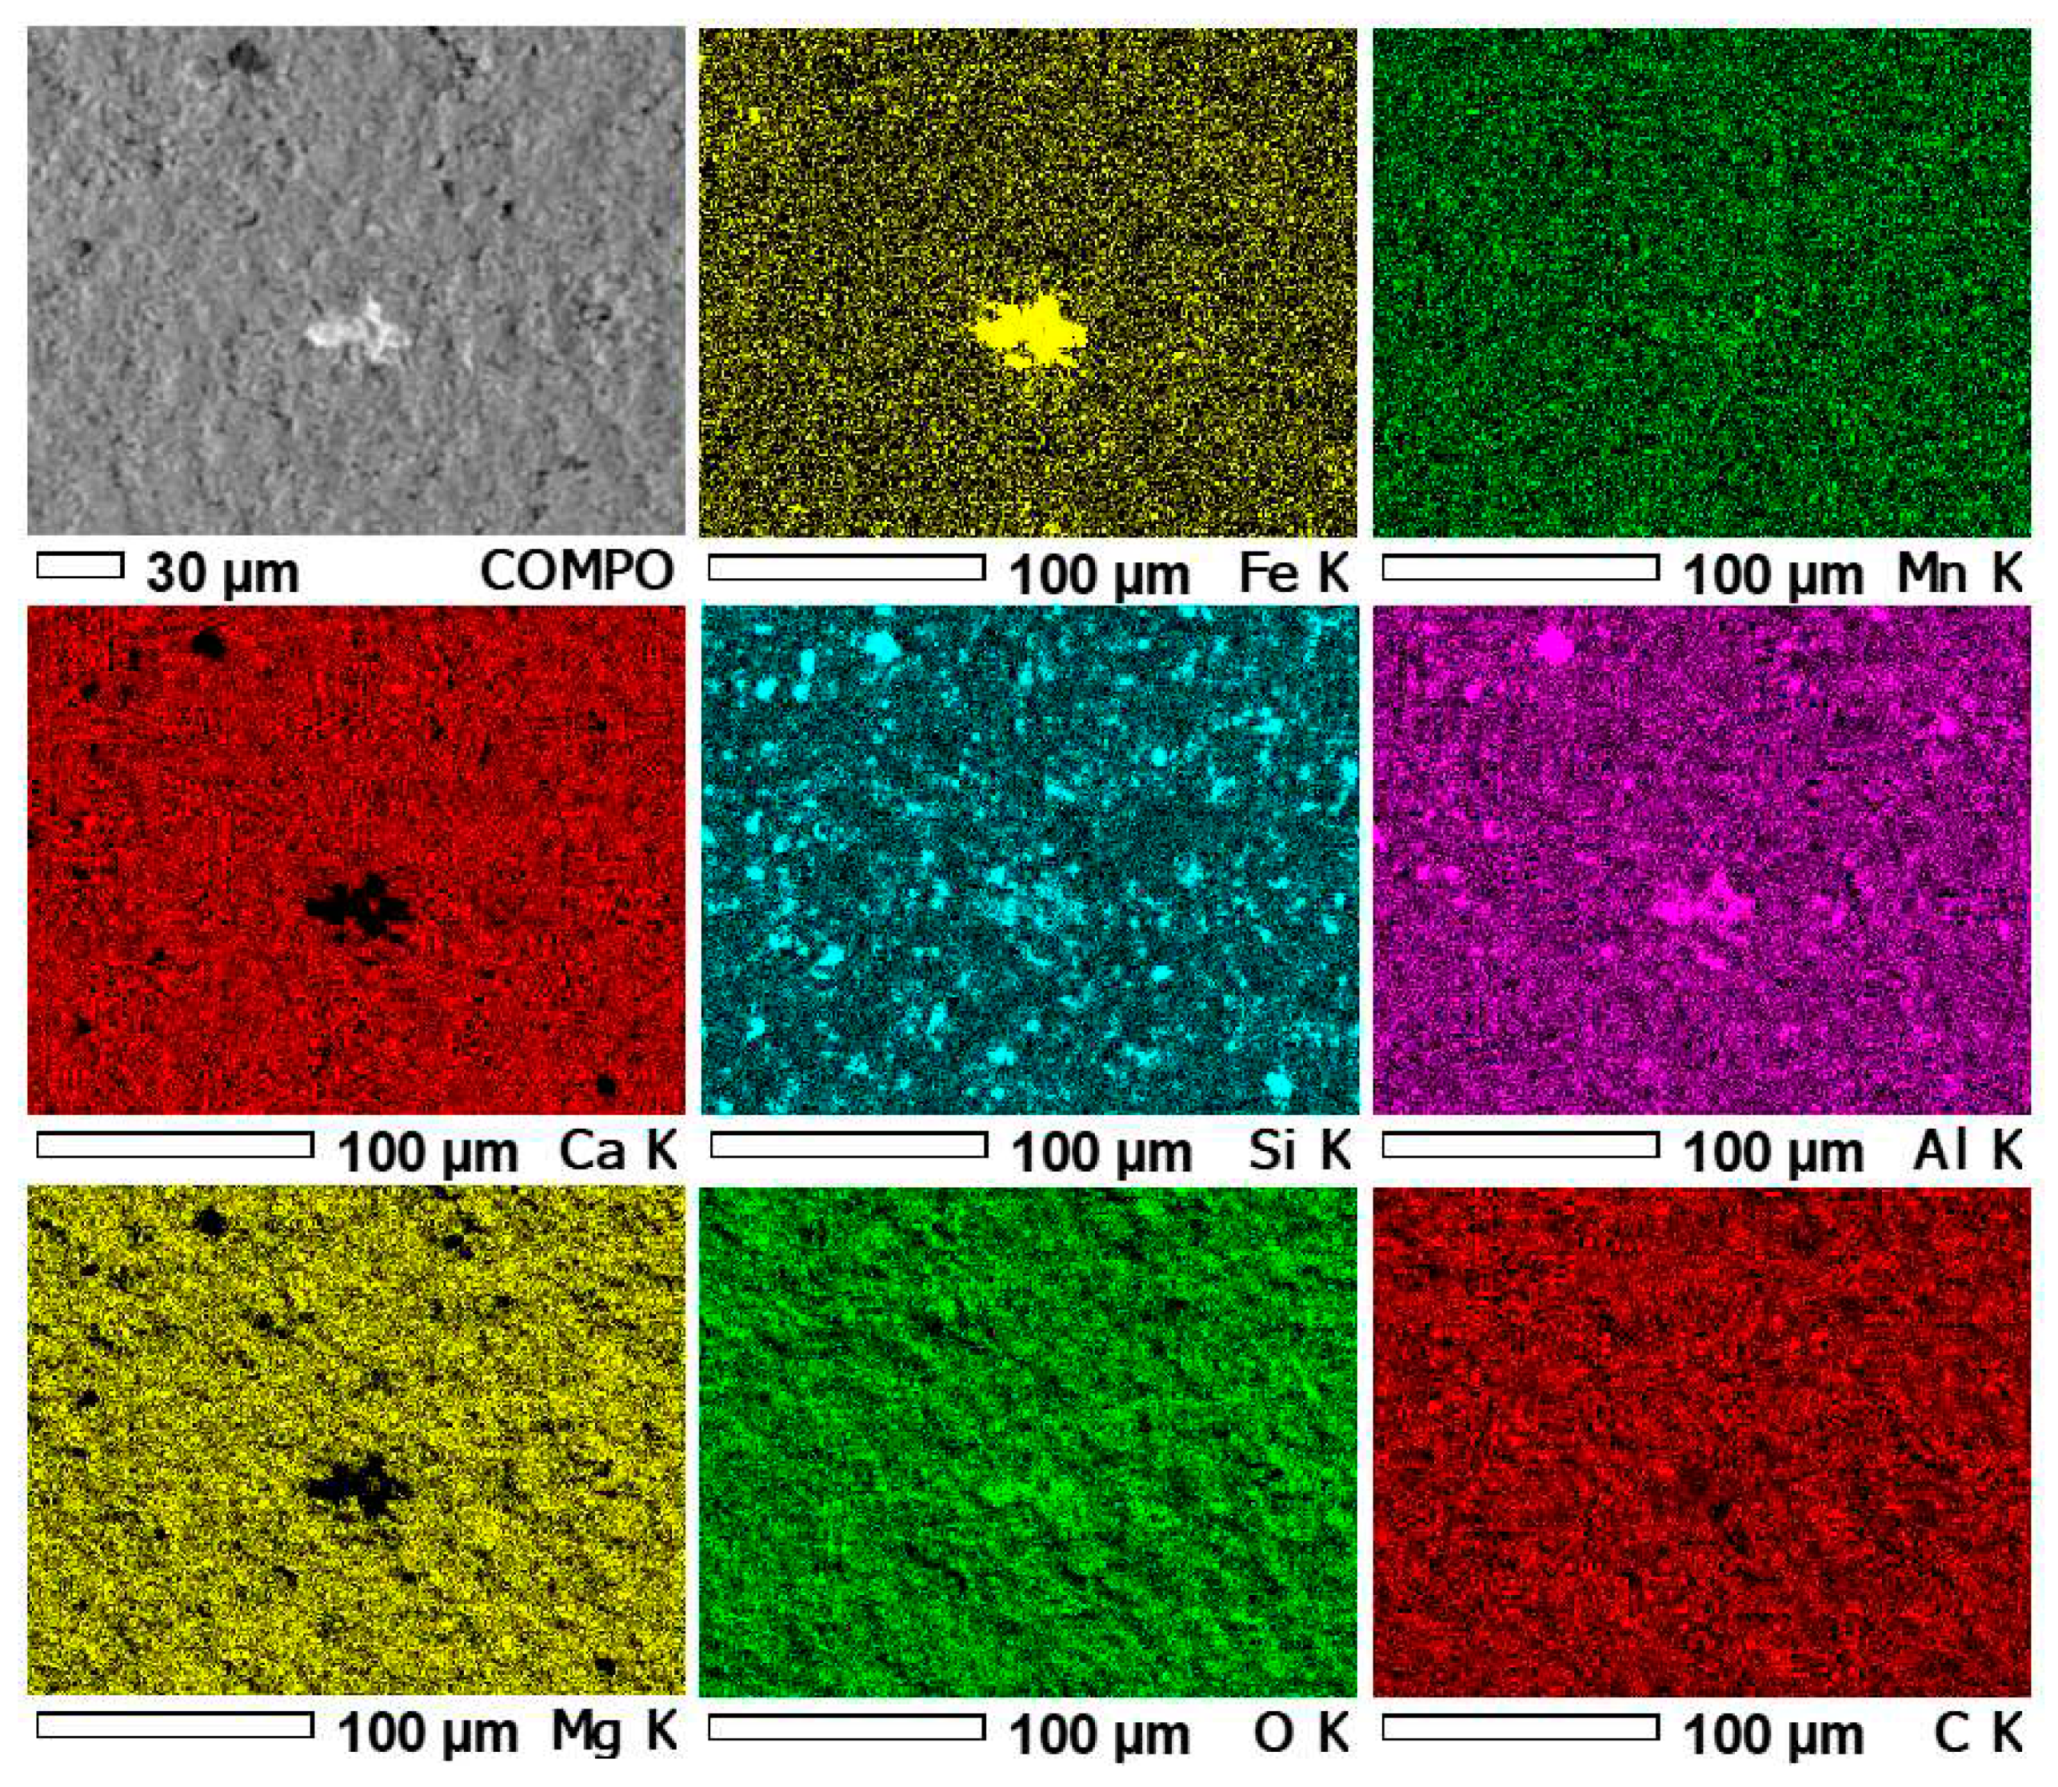
In the first stage of the study of the PSK2 sample like in the case of previous samples, the distribution of the following elements was measured: Mn, Ca, S, Si, Al, Mg, O, C and Fe in micro-area 1 of this sample (Figure 10).
Superposition of Ca and Mg images distribution (Figure 10) allows to determine the presence of these elements in the same areas, which indicates the presence of calcium-magnesium carbonate phases. The superposition of Ca, Mg and Fe distribution images allows to determine in some areas of the sample the presence of carbonate phases rich in Mg with substitution of Fe (dolomite phases). The ocurrence of Si and Al in the same areas of Si nad Al images indicate like in the previous samples the presence of aluminosilicates. The rest of Si is probably connected like in previous samples with quartz.
In micro-areas 1 and 2 of the PSZ3 sample, the content of elements: C, O, Mg, Al, Si, Ca, Mn and Fe was measured using EDS method (Figure 11 and Figure 12, Table 8).
The results of microprobe measurements made in micro-area 1 using EDS method indicate the dominance of carbonate phases with an increased magnesium content, higher than typical for dolomite, but slightly lower than the stoichiometric value of huntite. As in the case of the PSK2 sample also in this sample de-huntite is present. Thus the crystals of original huntite were probably transformed during dehuntization. As in the case of micro-area 1 of the PSZ3 sample, also in micro-area 2 de-huntite phase dominates.
In the third micro-area of the PSZ3 sample, measurements of the elemental content using the WDS method were done (Figure 13, Table 9).
The results of measurements carried out in micro-area 3 of the PSZ3 sample indicate the presence of three carbonate phases: low-magnesium calcite (point 1), high-magnesium calcite (point 3) and proto-dolomite (points 2, 4, 5 and 6) (Figure 13, Table 9). In the point 3 the increased content of Fe was determined. Fe substitute for Mg in a high-Mg calcite crystal. It is possible that Fe likely forms a solid solution with ankerite or siderite. However these minerals were not identified by X-ray diffraction.

4. Discussion

The subject of this project was to study carbonate rocks of the Tarnowice Unit of selected areas of the Upper Silesia (Silesian Voivodeship) in terms of determination their geochemical and mineralogical properties. This topic was undertaken due to the probability of the presence of carbonate phases with different magnesium content in these rocks, mainly the occurrence of high-magnesium calcite, which was identified in the rocks of the Lower Muschelkalk of the area of Opole Silesia. The Tarnowice Unit, which are the Middle Muschelkalk Formation, have not been studied in detail in this aspect so far. The research zone includes the areas of Piekary Śląskie and Bytom. Samples of carbonate rocks were collected in the Lazarówka Quarry (area of Bytom City) and in the area of Piekary Śląskie, at Mieczysław Karłowicz Street and at Zawisza Czarny Street.

4.1. Mineral phases and the trace elements of the Triassic dolomites

Macroscopically examined carbonate rocks differ slightly, mainly in terms of color. The rocks from the Lazarówka Quarry show a brownish color, while the rocks of the area of Piekary Śląskie have colors from light brown to gray, a sparite texture, and a chaotic, compact, in some areas of rock porous structure. Rocks from the Lazarówka Quarry are characterized by reduced compactness. A weak reaction with hydrochloric acid indicates dolomite dominance in rocks. Microscopic images often reveal a biomorphic texture. The rocks are made of oval or elongated bioclasts bonded with contact or pore cement. Sparite, euhedral, rhombohedral dolomite crystals have also been observed in microscopic images. Some crystals are filled with iron compounds. These crystals are probably pseudomorphs after dolomite.
Additionally, detailed data on the examined rocks were provided by the results of X-Ray diffraction. Five carbonate phases, differentiated in terms of magnesium content, were marked on the diffraction patterns of the samples: low-magnesium calcite (however, only in one sample), high-magnesium calcite, proto-dolomite, ordered dolomite and huntite. Amoung the non-carbonate minerals, quartz was identified and illite in one sample (PSK3). The results of X-Ray diffraction showed that dolomite phases and high-magnesium calcite dominate in the rocks.
Many interesting data were provided by the results of X-Ray Fluorescence (XRF). Based on the results of the analysis, the basic oxide composition of the rocks, the Ca to Mg ratio and the MgCO3 content were calculated. Based on the obtained data, the position of the studied carbonate rocks in the classifications of Chilingar [20] and Pettijohn [21] was presented. The results of study indicate that the carbonate rocks represent lime dolomites, in the Chilingar [20] classification. In Pettijohn [21] classification samples PSK1, PSK3 and PSZ2 reprezent lime dolomites and samples LZ2, LZ3 and PSZ1 – calcerous dolomites. Therefore, these rocks, apart from the mineral dolomite, also contain calcite phases, including high-magnesium calcite. This was confirmed by the X-Ray diffraction results.
Moreover, the results of the XRF analysis showed, apart from the high content of elements such as Ca, Mg, C and O, also the presence, in trace amounts, elements characteristic for minerals such as silicates, aluminosilicates, oxides and sulfides, which, apart from Sr and Ba, are not basic components of carbonate rocks. These are: Al, Si, Fe, K, Na, Ti, Cr, Mn, Zr, Co, Cd, Ni, Cu, Zn, Pb, As, Rb, Br and Cl. These elements are most often supplied from the outside to the sea basin where carbonate sedimentation takes place. Some of them may occur in minerals formed during diagenetic processes. Manganese and iron can be substitutions for Ca and Mg in carbonate minerals.
Strontium and barium are elements originally present in aragonite, an unstable phase of calcium carbonate, which, like high-magnesium calcite, is transformed into low-magnesium calcite during diagenesis. Sr and Ba often appear in the carbonate phases. According to literature data, Sr occurs in the skeletons of marine organisms [6,8,22,23,24,25,26,27,28,29,30,31,32,33,34,35]. Its presence in aragonite is associated with a larger ionic radius compared to the ionic radius of Ca, therefore it easily enters the structure of aragonite, more similar to the structure of strontianite than to the structure of calcite. Therefore, aragonite contains a higher amount of Sr than calcite [8,22]. However, aragonite is an unstable phase of calcium carbonate, similarly to high-magnesium calcite, and during diagenesis it is transformed into low-magnesium calcite. Thus, only the presence of strontium indicates that the primary phase of calcium carbonate was aragonite. Ba, like Sr, is found in the skeletons of marine organisms. Ba has a similar ionic radius to Sr [8,20,24,25,27], so it will be easier to enter the aragonite structure than calcite. Thus, only the presence of Sr and Ba indicates that the primary phase of calcium carbonate was aragonite.
Ni, K, Si, Al, as well as some Fe, are included in the aluminosilicates – mainly feldspars and clay minerals. S, Ti, Cr, some Fe, Ni, Cu, Zn Pb will probably be bound in sulfides and oxides. Some of the samples contain high Pb-Zn amounts. It supports the hypothesis that ore-forming and dolomitization fluids are related. Therefore probably there were taking place the similar to processes which caused the mineralization with zinc and lead ores during the diagenesis in the Śląsko-Krakowski Region.
During sedimentation processes, Ni is incorporated into the structures of clay minerals. Nor can it form sulfides and arsenides. Cd is usually found in zinc sulfides. It can also appear together with Fe, Mn and Co in smitsonite. Chlorine is bound in chlorides and phosphorus is present in organic matter.
Detailed data were provided by the results of microprobe measurements. Based on the content of elements, mainly Ca and Mg, determined during the measurements made in the micro-areas of the samples, the following carbonate phases with different Mg content were determined: low-magnesium calcite, high-magnesium calcite, proto-dolomite, ordered dolomite and huntite. On the basis of microprobe measurements results, the chemical formulas of the carbonate phases were calculated. The results of studies in samples’ micro-areas have shown that high-magnesium calcite has a Mg content higher than "pure" (low-magnesium) calcite, but lower than proto-dolomite. The proto-dolomite is characterized by a lowered content of magnesium in relation to the stoichiometric value for dolomite, but the higher than that of high-magnesium calcite. Ordered dolomite has a content of Mg close to the stoichiometric value. Huntite determined by microprobe measurements is charakterized by lower Mg content than the stoichiometric value for this carbonate phase. Therefore this mineral phase was named as de-huntite. Reduced magnesium content in de-huntite is probably the effect of the process of advance stage of diagenesis – dehuntization. It cannot exclude the theory which assumes that determined de-huntite phase may represent a huntite-dolomite solid solution or mixture.
The results of the microprobe measurements confirmed the data obtained by previous analytical methods.
The results of the executed tests show that dolomite phases (proto-dolomite and ordered dolomite – around 90%) dominate in studied rocks. Increased content of high-Mg calcite (circa 8%) occures in most of rocks. Low-Mg calcite (circa 5 to 8%) is present only in three rocks. Moreover, in three rocks also huntite (around 5%) phase was determined. The content of Mg allowed to name this phase as de-huntite. Quartz occurs in most of rocks (circa 1 to 2%). Illite was identified by X-ray diffraction only in one sample (PSK3). The estimate relative proportions of the mineral phases confirmed the classification of the studied rocks into the dolomite group.

4.2. Dolomites’ formation during sedimentary and diagenetic processes

On the basis of the research results, a theory about the rocks of the Tarnowice Beds formation and the diagenetic processes that influenced the final structure of these rocks was formed.
During the Upper Muschelkalk in Triassic Basin a development of fauna was observed, which was stopped during the Middle Muschelkalk. The development of the fauna was a result of wide connections with the Alpine Sea during the sea transgression. The East Carpathian Gate was probably active then, and further into the West, the Rhine and Burgundy Gates. At the beginning of the transgression, the sea bottom was inhabited by crinoids, which sceletons after crinoids’ dying formed trochite layers. These layers create the lower part of the Upper Muschelkalk. Layers with Myophoria Transversa Bornemann and Pecten discites (Schlotheim) are also characteristic here [30,31,32,34,35]. There are also limestones with glauconite. On the basis of the fauna which occurs here it is posibble to distinguish these deposits from the formations of the Middle Muschelkalk. In the upper part there are limestones with a greater content of marls, locally claystones, dolomites, and sometimes sandy limestones and calcareous sandstones. The Tarnowice Unit are deposited above the Diplopora dolomites. They are also called lamellar dolomites [8]. They were formed during the marine regressions of the Upper Muschelkalk, when another complex of limestone deposits was formed [18]. This was mainly due to uplift movements, which led to the shallowing of the sea and then emergence of the Silesian-Cracow area [6,36,37]. Accordingly, mixed carbonate-clastic deposits of the Upper Muschelkalk were formed at that time [36,37]. There was also erosion of older sediments, which lasted until the beginning of the Late Triassic, i.e. the Carnian [18].
Thus, the Tarnowice Unit are typical sediments of a drying, shallow sea [32,33]. Probably the sediments of the Tarnowice Unit were originally limestones, which were analogous to the deposits and Middle Muschelkalk dolomitized during diagenetic processes. The dolomites in the Śląsko-Krakowski Region, were mineralized with zinc and lead ores during the diagenesis. They were the subject of exploitation. The dolomites of the Tarnowice Unit could probably have been formed in the same way as the ore-bearing dolomites as a result of metasomatic processes. Because of this they may include the carbonate phases with different magnesium content.
On the basis of the research results it can be stated that the rocks of the Tarnowice Unit are built not only of the dolomite phases, but also of other carbonate phases with different Mg content. Among them high-magnesium calcite dominates, which has not been studied in detail in this formation before. It is an unstable phase of calcium carbonate, which is usually not preserved in older sediments such as Triassic but is usually transformed like aragonite into low magnesium calcite during diagenetic processes. Another novelty is the presence of huntite, a carbonate phase with magnesium content higher than that of dolomite. It can be defined as magnesium-calcium carbonate. This carbonate phase has not been identified in the rocks of the Tarnowice Unit before. This carbonate phase is characterized by lower Mg content than stoichiometric value for huntite. Because of it this phase was named as de-huntite.

5. Conclusions

Based on the obtained test results and their interpretation, the following conclusions were formulated:
  • The results of the research indicate that the studied carbonate rocks are lime dolomites according to the Chilingar classification. Three of them in Pettijohn classification reprezents calcareous dolomites.
  • The analyzed rocks apart from the dolomite phases, contain also calcite phases, including the dominant high-magnesium calcite.
  • The results of X-Ray diffraction showed that five carbonate phases with different magnesium content occur in the examined rocks: low-magnesium calcite, high-magnesium calcite, proto-dolomite, ordered dolomite and huntite.
  • X-Ray Fluorescence (XRF) results showed the presence of elements, not only those typical of carbonate minerals, but also elements such as: Al, Si, Fe, K, Na, Ti, Cr, Cd, Br, Cr, As, Mn, Zr, Co, Ni, Cu, Zn, Pb and Cl. Some of them may occur in minerals formed during diagenetic processes.
  • The results of the microprobe measurements showed that there are two types of dolomite in the studied rocks: proto-dolomite and ordered dolomite. Proto-dolomite is characterized by a reduced magnesium content compared to the stoichiometric value for dolomite, but higher than that of high-magnesium calcite, while ordered dolomite has a Mg content close to the stoichiometric value.
  • The results of microprobe measurements have shown that high-magnesium calcite has a Mg content higher than "pure" (low-magnesium) calcite, but lower than proto-dolomite.
  • During microprobe measurements the magnesium-calcium carbonate phase was determined. The Mg content of this phase is higher than in ordered dolomite, but lower than typical for huntite. That’s why this mineral was named as de-huntite. The reduced content of Mg in this phase is probably the effect of dehuntization – the proces of advance stage of diagenesis.
  • The achievement of the project is the identification of carbonate phases rich in magnesium, which have not been studied so far in the formation of the Tarnowice Unit, such as: high-magnesium calcite, proto-dolomite, ordered dolomite and de-huntite.
  • On the basis of the obtained data, a theory connected with the formation of the studied rocks was formed. According to the data the rocks of the Tarnowice Unit are the sediments of the drying, shallow, epicontinental sea. They were re-flooded by seawater during the regressions of the Upper Muschelkalk period.
  • The original sediments of the Tarnowice Unit were probably limestones which were dolomitized during metasomatic processes. This may be evidenced by the presence of carbonate phases that differ in terms of magnesium content.
The test results therefore provide new data on the mineral composition and geochemistry of the Tarnowice Unit. They will be used for further studies of Triassic carbonate rocks, in particular in terms of the possibility of their practical use.

Author Contributions

Conceptualization, K.S-P., R.J., methodology, K.S-P., R.J., investigations, K.S-P., analysis of the results, K.S-P., writing—original draft preparation K.S-P., R.J., writing— review and editing, R.J., visualization, K.S-P., supervision, R.J. authors have read and agreed to the published version of the manuscript.

Funding

This research received no external funding.

Institutional Review Board Statement

Not applicable.

Informed Consent Statement

Not applicable.

Data Availability Statement

The data presented in this manuscript can be found in the cited articles and in the Authors’ database.

Conflicts of Interest

The Authors declare no conflict of interest.

References

  1. Matysik, M. Reefal environments and sedimentary processes of the Anisian Karchowice Beds In Upper Silesia, Southern Poland. Annales Societatis Geologorum Poloniae 2010, 80, 123–145. [Google Scholar]
  2. Senkowiczowa, H. Possibilities of formalizing the lithostratigraphic division of the Middle and Upper Triassic of the Silesian-Cracow Upland. Geological Quarterly 1980, 24, 787–804. [Google Scholar]
  3. Niedźwiedzki, R. Lithostratigraphy of the Górażdże Formation of the Dziewkowice Information in Opole Silesia. Geological and Mineralogical Works of Wrocław University LXXI 2000, Wroclaw.
  4. Niedźwiedzki, R.; Szulc, J.; Zarankiewicz, M. Stone treasures of the Saint Anne Land. Geological Guide 2013. Available online: www.annaland.pl.
  5. Stanienda, K. Effects of dolomitization processes in the Triassic limestone of Tarnów Opolski Deposit; Silesian University of Technology Press: Gliwice, Poland, 2011; ISBN 978-83-7880-071-2. [Google Scholar]
  6. Stanienda, K. Diagenesis of the Triassic limestone from the Opole Silesia in the aspect of magnesian calcite presence; Silesian University of Technology Press: Gliwice, Poland, 2013; ISBN 978-83-7335-872-0. [Google Scholar]
  7. Stanienda, K. Huntite in the Triassic limestones of Opolski Silesia. Mineral Resources Management 2013, 9, 79–98. [Google Scholar]
  8. Stanienda, K. Mineral phases in carbonate rocks of the Gogolin Beds from the area of Opole Silesia. Mineral Resources Management 2014, 30, 17–42. [Google Scholar]
  9. Stanienda, K. Carbonate phases rich in magnesium in the Triassic limestones of the East part of Germanic Basin. Carbonates and Evaporites 2016, 31, 387–405. [Google Scholar] [CrossRef]
  10. Stanienda, K. Mineral phases in carbonate rocks of the Górażdże Beds from the area of Opole Silesia. Mineral Resources Management 2016, 32, 67–92. [Google Scholar] [CrossRef]
  11. Stanienda-Pilecki, K. Carbonate minerals with magnesium in Triassic Terebratula limestone in the term of limestone with magnesium application as a sorbent in desulfurization of flue gases. Archives of Mining Sciences 2017, 62, 459–482. [Google Scholar] [CrossRef]
  12. Stanienda-Pilecki, K. Magnesium calcite in Muschelkalk limestones of the Polish part of the Germanic Basin. Carbonates and Evaporites 2018, 33, 801–821. [Google Scholar] [CrossRef] [PubMed]
  13. Stanienda-Pilecki, K. The Use of Limestones Built of Carbonate Phases with Increased Mg Content in Processes of Flue Gas Desulfurization. Minerals 2021, 11, 1044. [Google Scholar] [CrossRef]
  14. Szulc, J. International Workshop – Field Seminar The Muschelkalk- Sedimentary Environments, Facies and Diagenesis- Excursion Guidebook and Abstracts; Kraków: Opole, Poland, 1990; pp. 1–32. [Google Scholar]
  15. Szulc, J. Early alpinie tectonics and lithofacies succesion in the Silesian part of the Muschelkalk Basin. In Muschelkalk; Hagdorn H., Seilacher A., Eds. Goldschneck: Stuttgart, Germany, 1993; pp. 19–28. [Google Scholar]
  16. Szulc, J. Middle triassic evolution of the Northern Peri-Tethys area is influenced by early opening of the Tethys Ocean. Annales Societatis Geologorum Poloniae 2000, 70, 1–48. [Google Scholar]
  17. Szulc, J. Stratigraphy and correlation with Tethys and other Germanic subbasins. In International Workshop on the Triassic of Southern Poland. In Proceedings of the Pan-European Correlation of Epicontinental Triassic 4th Meeting, Fieldtrip Guide, 3–8 September 2007; pp. 26–28. [Google Scholar]
  18. Szulc, J. Triassic of the Silesia-Cracow area. In Proceedings of the Materials of the 42nd Speleological Symposium, Kraków, Poland; 9–10 2008. [Google Scholar]
  19. Biernat, S. Reamble: Wilanowski S., Lewandowski J. (2016) Detailed geological map of Poland. Sheet 910 – Bytom (M-34-50-D); Polish Geological Institute, National Research Institute: Poland, 1954. [Google Scholar]
  20. Chilingar, G.V. Classification of limestones and dolomites on basis of Ca/Mg ratio. J. Sed. Petrol. 1957, 27, 187–189. [Google Scholar]
  21. Pettijohn, F.J. Sedimentary rocks. III ed.; New York, NY, USA, 1975. [Google Scholar]
  22. Boggs S., Jr. Petrology of sedimentary rocks. Second Edition.; Cambridge University Press: London, UK, 2010. [Google Scholar]
  23. Mackenzie, F.T. , Andersson, A.J. The Marine carbon system and ocean acidification during Phanerozoic Time. Geochemical Perspectives 2013, 2. [Google Scholar]
  24. Mavromatis, V. , Götschl, K.E., Grengg, C., Konrad, F., Purgstaller, B., Dietzel, M. Barium partitioning in calcite and aragonite as a function of growth rate. Geochimica et Cosmochimica Acta 2018, 237, 65–78. [Google Scholar] [CrossRef]
  25. Morse, J.W. , Mackenzie, F.T. Geochemistry of sedimentary carbonates. Elsevier 1990, 33, 707. [Google Scholar]
  26. Morse, J.W. , Andersson, A.J., Mackenzie, F.T. Initial responses of carbonate-rich shelf sediments to rising atmospheric pCO2 and ‘‘ocean acidification’’: Role of high Mg-calcites. Geochimica et Cosmochimica Acta 2006, 70, 5814–5830. [Google Scholar] [CrossRef]
  27. Polański, A. Basics of geochemistry; Geological Publishing House: Warsaw, Poland, 1988. [Google Scholar]
  28. Tucker, M. E. , Wright, V. P. Carbonate sedimentology; Blackwell Scientific Publications: Oxford London, Edinburgh Boston Melbourne, 1990; pp. 366–372. [Google Scholar]
  29. Zhang, S.; Zhou, R.; DePaolo, D.J. The Seawater Sr/Ca ratio in the past 50 Myr from Bulk Carbonate Sediments Corrected for Diagenesis; Elsevier.
  30. Zhang, S. , DePaolo, D.J. Equilibrium calcite-fluid Sr/Ca partition coefficient from marine sediment and pore fluids. Geochimica et Cosmochimica Acta 2020, 289, 33–46. [Google Scholar] [CrossRef]
  31. Zhong, S. , Mucci, A. Calcite and aragonite precipitation from seawater solutions of various salinities: Precipitation rates and overgrowth compositions. Chemical Geology 1989, 78, 283–299. [Google Scholar] [CrossRef]
  32. Makowski, H. Historical Geology; Geological Publishing House: Warsaw, Poland, 1977. [Google Scholar]
  33. Senkowiczowa, H. , Szyperko-Śliwczyńska, A. Stratigraphy and palaeography of the Triassic. Geological Institute 1972, 252. [Google Scholar]
  34. Czermiński, J. (Ed.) Geological Structure of Poland, Volume II, Catalog of Fossils, Part 2, Mesozoic; Geological Publishing House: Warsaw, Poland, 1970. [Google Scholar]
  35. Bujoczek, M.; Gładysz, K.; Stępień, A. Tarnowskie Góry Underground - a living organism on a selected fragment of the mine of the Fryderyk Mine (Blachówka – Western – Urban Glückhilfe). Project Report; Tarnowskie Góry Cave Mountain Club: Poland, 2013. [Google Scholar]
  36. Migaszewski, Z. Origin of the dolomites. Geological Quarterly 1990, 34, 202. [Google Scholar]
  37. Migaszewski, Z. Current views on the genesis of dolomites. Geological Quarterly 1990, 3, 111–117. [Google Scholar]
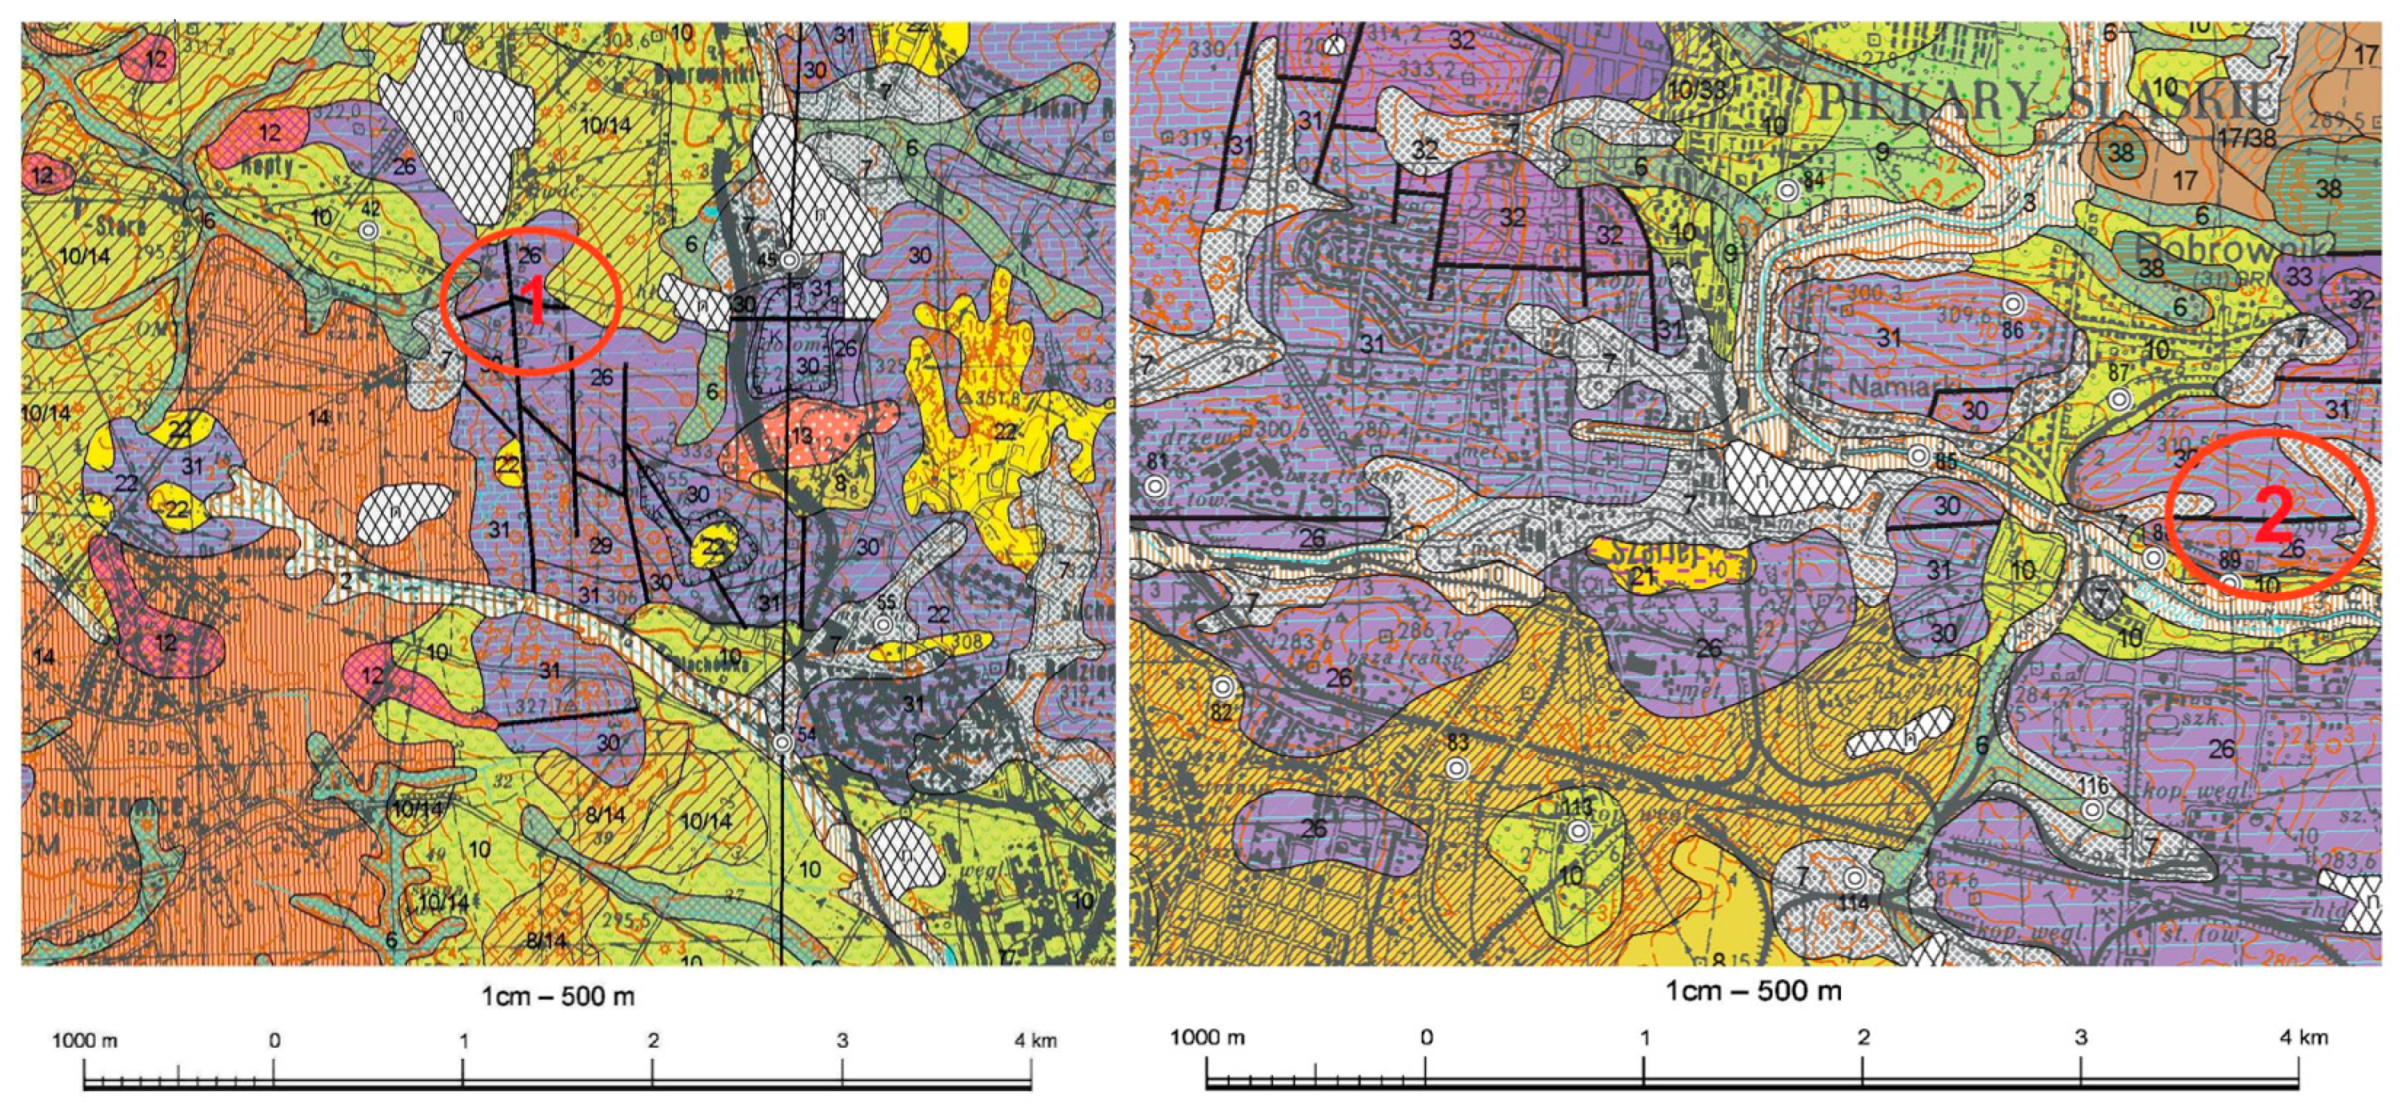
Figure 1. Location of the research area. Fragment of a detailed geological map of Poland [19]. Original scale 1: 50,000. Sheet - 910 - Bytom (M-34-50-D). 1 – Lazarówka Quarry (Lazarówka street - LZ), 2 – Piekary Śląskie area (Karłowicz - PSK and Zawisza Czarny - PSZ streets). Numbering on a geological map:26 - Middle Triassic - dolomites and limestones (Jemielnica and Tarnowice stratas).
Preprints 92213 g001
Figure 2. Photographs f the samples.
Preprints 92213 g002
Figure 3. Microscopic photographs of carbonate rock samples.
Preprints 92213 g003
Figure 4. X-ray diffraction patterns of the dolomite samples: (a) LZ2, (b) PSK1, (c) PSK3, (d) PSZ1.
Preprints 92213 g004aPreprints 92213 g004b
Figure 5. Maps of the distribution of EDS elements in micro-area 1 of the LZ1 sample, magnification x1500.
Preprints 92213 g005
Figure 6. Image of the composition of sample LZ1 micro-area 2, with marked points of quantitative analysis, magnification x2500.
Preprints 92213 g006
Figure 7. Maps of the distribution of EDS elements, in the micro-area 1 of PSK2 sample, magnification x500.
Preprints 92213 g007
Figure 8. The result of the quantitative analysis performed by the EDS method for micro-area 2 of the PSK2 sample.
Preprints 92213 g008
Figure 9. Image of the composition of micro-area 3 of the PSK2 sample with marked points of quantitative analysis, magnification x2500.
Preprints 92213 g009
Figure 10. Maps of the distribution of EDS elements in microarea 1 of the PSZ3 sample, magnification x1500.
Preprints 92213 g010
Figure 11. Image of the composition of micro-area 1 of the PSZ3 sample with marked places of EDS quantitative analysis.
Preprints 92213 g011
Figure 12. Image of the composition of the micro-area 2 of PSZ3 sample with marked places of EDS quantitative analysis.
Preprints 92213 g012
Figure 13. Image of the composition of the micro-area 4 of PSZ3 sample with marked points of quantitative analysis, magnification x2500.
Preprints 92213 g013
Table 1. Results of X-Ray diffraction.
Type of Sample Type of Mineral dhkl- index of the lattice intervals of exposed parallel lattice planes system
Ǻ intensity of diffraction lines
LZ2
(Figure4a)
High-Mg calcite 3.8254 (12), 3,0101 (100), 2,8213 (2), 2.4799 (14), 2.0820 (16), 1.9182 (7), 1.9018 (21), 1.8652 (23), 1.6197 (4), 1.5977 (11), 1.5193 (6), 1.5113 (3), 1.5003 (3), 1.4298 (8), 1.3344 (3), 1,2934 (4), 1.2384 (1), 1.2310 (1), 1.1761 (3), 1.1226 (3)
Proto-dolomite 3.6759 (4), 2.8818 (100), 2.1875 (30), 2.0105 (15), 1.8442 (5), 1.8039 (17), 1.5649 (4), 1.5434 (10), 1.4646 (7), 1.4422 (3), 1.2691 (3), 1.2020 (1), 1.0962 (2)
Ordered dolomite 4.0111 (1), 2.8818 (100), 2.6648 (4), 2.5767 (3), 2.5323 (2), 2.0595 (3), 1.8442 (5), 1.7827 (21), 1.4352 (3), 1.4158 (3), 1.3878 (9), 1.3344 (4), 1.2934 (2), 1.2384 (3), 1.1675 (2), 1.1226 (2), 1.1096 (8)
Huntite 2,8213 (100); 2,4473 (9); 2,3984 (10); 2,2715 (5); 1,9018 (1); 1,7165 (3); 1,5977 (10); 1,5193 (1); 1,5113 (1); 1,1675 (1);
Quartz 4,2345 (19); 3,3264 (100); 2,4473 (7); 2,2715 (7); 1,1510 (2)

LZ3

High-Mg calcite

3,8468 (8); 3,0284 (100); 2,7931 (2); 2,4860 (14); 2,2787 (21); 2,0886 (16); 1,9052 (21); 1,8685 (23); 1,3344 (3); 1,2975 (4); 1,2384 (1); 1,1236 (3)
Proto-dolomite 3.6957 (4), 2.8854 (100), 2.4041 (13), 2.1915 (30), 2.0161 (15), 1.8475 (5), 1.8039 (17), 1.5662 (3), 1.5465 (10), 1.4654 (7), 1.4440 (3), 1.2704 (3), 1.2020 (1), 1.1105 (8), 1.0962 (2)
Ordered dolomite 4.0276 (1), 2.8854 (100), 2.6686 (4), 2.5387 (2), 2.0636 (3), 1.8475 (5), 1.4305 (3), 1.,4131 (1), 1.3894 (8), 1.3344 (3), 1.2975 (2), 1.2384 (3), 1.1681 (2), 1.1236 (2), 1.1073 (8)
Quartz 4,2529 (19); 3,3425 (100); 2,4558 (7); 2,2787 (7); 1,5412 (10); 1,3844 (6)
PSK1
(Figure4b)

Low-Mg calcite

3.0337 (100), 1.5671 (1), 1.5382 (9), 1.4932 (5), 1.4654 (2), 1.4272 (5), 1.3351 (3), 1.2969 (5), 1.2384 (2)
Proto-dolomite 3.6897 (4), 2.8854 (100), 2.4009 (13), 2.1895 (30), 2.0161 (15), 1.8475 (5), 1.8021 (17), 1.5618 (3), 1.5455 (10), 1.4608 (7), 1.4422 (3), 1.2696 (3), 1.2032 (1), 1.1100 (8), 1.0962 (2)
Ordered dolomite 4.0347 (1), 2.8854 (100), 2.6686 (4), 2.5387 (2), 2.0636 (3), 1.8475 (5), 1.7857 (21), 1,4316 (3), 1.4114 (1), 1.3887 (8), 1.3351 (3), 1.2969 (2), 1.2384 (3), 1.1681 (2), 1.1230 (2), 1.1065 (8)
Quartz 3.3474 (100), 1.5455 (10), 1.3837 (6)

PSK3
(Figure4c)

High-Mg calcite

2.9881 (100), 2.4558 (14), 2.2816 (21), 1.5662 (1), 1.4933 (3), 1.4662 (3), 1.4597 (2), 1.3344 (3), 1.2975 (4), 1.2372 (1), 1.1429 (4)
Proto-dolomite 3.6897 (4), 2.8854 (100), 2.4009 (13), 2.1915 (30), 2.0144 (15), 1.8456 (5), 1.8052 (17), 1.5662 (3), 1.5443 (10), 1.4662 (7), 1.4414 (3), 1.2696 (3), 1.2015 (1), 1.1105 (8), 1.0956 (2)
Ordered dolomite 4.0276 (1), 3.5710 (4), 2.8854 (100), 2.6686 (4), 2.5387 (2), 2.0636 (3), 1.8456 (5), 1,.7857 (21), 1.4305 (3), 1.4124 (1), 1.3878 (8), 1.3344 (3), 1.2975 (2), 1.2372 (3). 1.1664 (2), 1.1226 (2), 1.1087 (8)
Quartz 4.2529 (19), 3.3474 (100), 2.4558 (7), 1.5443 (10)
Illite 4.4847 (100), 3.2392 (65), 2.1312 (31)

PSZ1
(Figure4d)

High-Mg calcite

2.9792 (100), 1.5640 (1), 1.4932 (3), 1.4646 (3), 1.4298 (8), 1.3329 (3), 1.2969 (4), 1.2365 (1), 1.1435 (4)
Proto-dolomite 3.6818 (4), 2.8818 (100), 2.1875 (30), 2.0122 (15), 1.8442 (5), 1.8021 (17), 1.5640 (3), 1.5443 (10); 1.4414 (3), 1.2683 (3), 1.2015 (1), 1.1100 (8); 1.0953 (2)
Ordered dolomite 4.0111 (1), 2,8818 (100), 2.6616 (4), 2.5323 (2), 2.0619 (3), 2.0028 (15); 1.8442 (5), 1.7844 (21), 1.4114 (1); 1.3887 (8), 1.3329 (3), 1.2969 (2), 1.2365 (3), 1.1664 (2), 1.1221 (2); 1.1056 (8)
Huntite 2.8362 (100), 2.4498 (9), 2.3984 (10), 2.0028 (7), 1.7785 (15), 1.4578 (2), 1.3821 (1)
Quartz 3.3361 (100), 1.5443 (10), 1.3821 (6)

PSZ3
High-Mg calcite 3.0101 (100), 1,5627 (1), 1.5382 (9), 1.4895 (3), 1.4578 (3), 1.4262 (8), 1.3269 (3), 1.2946 (4), 1.2352 (1), 1.1435 (4)
Proto-dolomite 3.6681 (4), 2.8688 (100), 2.3928 (13), 2.1829 (30), 2.0066 (15), 1.8410 (5), 1.7978 (17), 1.5627 (3), 1.5403 (10), 1.2670 (3), 1.2015 (1), 1.0944 (2)
Ordered dolomite 3.9947 (1), 2.8688 (100), 2.6545 (4), 2.5224 (2), 2.0578 (3), 1.8410 (5), 1.7797 (21), 1.4396 (3), 1.4089 (1), 1.3861 (8), 1.3320 (3), 1.2946 (2), 1.2352 (3), 1.1655 (2), 1.1211 (2), 1.1082 (8)
Quartz 3.3264 (100), 1.5403 (10), 1.3804 (6)
Table 2. Composition of the studied samples elements.
Element Unit Detection limit Sample number
LZ2 LZ3 PSK1 PSK3 PSZ1 PSZ2
Main elements
C mass% 0.02437 6.53 8.06 8.16 7.69 8.45 8.36
O mass% 0.15465 52.54 55.35 56.54 56.54 56.34 56.39
Na mass% 0.01456 0.62 0.24 0.13 0.10 0.14 0.13
Mg mass% 0.00861 7.23 9.48 10.95 10.50 10.78 10.98
Al mass% 0.00161 0.33 0.18 0.26 0.70 0.15 0.15
Si mass% 0.00276 3.42 1.22 1.31 2.78 0.83 0.72
K mass% 0.00139 0.05 0.02 0.08 0.19 0.03 0.03
Ca mass% 0.00454 18.95 22.66 21.80 20.66 21.75 21.80
Mn mass% 0.00142 0.78 0.45 0.06 0.04 0.09 0.06
Fe mass% 0.00148 8.39 2.18 0.33 0.51 1,12 0,84
Trace elements
F ppm 577,45 BDL BDL 776 475 BDL BDL
P ppm 4.03 222 55 64 87 94 69
S ppm 6.98 891 359 1491 544 719 869
Cl ppm 37.72 564 500 613 531 620 633
Ti ppm 24.43 113 68 100 292 70 56
Cr ppm 15,87 22 7 13 27 BDL BDL
Co ppm 15.25 31 BDL 19 23 BDL BDL
Ni ppm 8.08 26 26 17 15 20 18
Cu ppm 7.5 22 12 362 545 16 17
Zn ppm 6.6 6803 290 5 9 1248 3455
As ppm 16,8 BDL BDL BDL BDL 23 41
Rb ppm 3.8 BDL BDL 5 9 BDL BDL
Br ppm 5.07 BDL 13 BDL BDL 5 5
Ba ppm 66.5 BDL BDL 99 233 BDL BDL
Sr ppm 4.2 50 46 117 81 81 78
Cd ppm 15.05 BDL BDL BDL BDL 29 37
Pb ppm 13.27 2818 74 73 36 151 178
BDL – below detection limit.
Table 3. Contents of basic elements, oxides, MgCO3 and value of Ca/Mg ratio.
Sample number Content of basic elements [%]
Ca Mg Fe Mn Si Al Na K
LZ2 18.95 7.23 8.39 0.78 3.42 0.33 0.62 0.05
LZ3 22.66 9.48 2.18 0.45 1.22 0.33 0.24 0.02
PSK1 21.80 10.95 0.33 0.06 1.31 0.26 0.13 0.08
PSK3 20.66 10.50 0.51 0.04 2.78 0.70 0.10 0.19
PSZ1 21.75 10.78 1.12 0.09 0.83 0.15 0.14 0.03
PSZ2 21.80 10.98 0.84 0.06 0.72 0.15 0.13 0.03
Content of basic oxides [%]
CaO MgO Fe2O3 MnO SiO2 Al2O3 Na2O K2O
LZ2 26.51 11.99 11.99 1.01 7.32 0.62 0.84 0.06
LZ3 31.70 15.72 3.12 0.58 2.61 0.62 0.32 0.02
PSK1 30.50 18,16 0.47 0.08 2.80 0.49 0.17 0.09
PSK3 28.91 17.41 0.73 0.05 5.95 1.32 0.13 0.23
PSZ1 30.43 17.87 1.60 0.12 1.77 0.28 0,19 0.04
PSZ2 30.50 18.21 1.20 0.07 1.54 0.28 0.17 0.04
MgCO3 content and Ca/Mg ratio
Ca [%] CaO [%] Mg [%] MgO [%] MgCO3 [%] Ca/Mg
LZ2 18.95 26,51 7.23 11.99 25.78 2.62
LZ3 22.66 31.70 9.48 15.72 33.80 2.39
PSK1 21.80 30.50 10.95 18.16 39.04 1.99
PSK3 20.66 28.91 10.50 17.41 37.43 1.97
PSZ1 21.75 30.43 10.78 17.87 38.42 2.02
PSZ2 21.80 30.50 10.98 18.21 39.15 1.98
Table 4. Position of the analyzed rocks in classifications based on Ca/Mg ratios and MgO and MgCO3 contents [%].
Specimen name Sample number Ca/Mg MgO [%] MgCO3 [%] Rock name in the Chilingar G.V. (1957) classification Rock name in the Pettijohn F.J. (1975) classification
Rocks of the Lazarówka Quarry LZ2 2.62 11.99 25.31 Lime Dolomite Calcerous dolomite
LZ3 2.39 15.72 33.18 Lime Dolomite Calcerous dolomite
Rocks from the area of Piekary Śląskie City PSK1 1.99 18.16 38.33 Lime Dolomite Lime Dolomite
PSK3 1.97 17.41 36.75 Lime Dolomite Lime Dolomite
PSZ1 2.02 17.87 37.74 Lime Dolomite Calcerous dolomite
PSZ2 1.98 18.21 38.43 Lime Dolomite Lime Dolomite
Table 5. Results of the WDS analysis at the points of LZ1 sample micro-area.
Point Number Element Total [mass%] MgO
[%]
C O Mg Si Al Ca Fe Mn S
Content [mass%]
1 / low-Mg calcite
(Ca0.95,Mg0.05)CO3
10.58 52.10 1.20 0.74 0.05 25.44 1.47 1.05 7.37 100.00 2.00
2 / high-Mg calcite
(Ca0.57,Mg0.43)CO3
10.93 54.19 10.37 BDL 0.07 20.96 2.87 0.60 0.01 100.00 17.28
3 / high-Mg calcite
(Ca0.69,Mg0.31)CO3
12.07 55.99 7.47 0.01 0.06 21.29 2.65 0.46 BDL 100.00 12.45
4 / high-Mg calcite
(Ca0.57,Mg0.43)CO3
11.90 53.47 10.41 0.05 0.05 21.96 1.89 0.25 0.02 100.00 17.35
5 / proto-dolomite
(Ca0.53,Mg0.47)CO3
11.20 53.49 11.39 0.05 0.08 20.92 2.25 0.61 0.01 100.00 18.98
6 / proto-dolomite
(Ca0.51,Mg0.49)CO3
11.29 53.44 11.71 0.01 0.11 20.69 2.17 0.56 0.02 100.00 19.52
BDL – below detection limit.
Table 6. Results of the EDS analysis at the points of micro-area 1 of the PSK2 sample.
Point Number Element Total [mass%] MgO
[%]
C O Mg Si Al Ca Fe Mn
[mass%]
1 / huntite
(Ca0.41,Mg0.59)CO3
7.9 51.06 14.21 1.03 0.44 24.86 0.06 0.43 100.00 23.68
Table 7. The results of the WDS analysis in the micro-area 2 zone of the PSK2 sample.
Point Number Element Total [mass%] MgO
[%]
C O Mg Si Al Ca Fe Mn
[mass%]
1 / Fe-Si
oxyhydroxide
3.01 16.90 0.63 41.18 0.05 2.65 35.24 0.34 100.00 1.05
2 / proto-dolomite
(Ca0.41,Mg0.59)CO3
11.41 55.23 11.77 0.13 0.05 21.34 0.06 0.01 100.00 19.62
3 / high-Mg calcite
(Ca0.41,Mg0.59)CO3
11.33 52.39 9.53 0.38 6.00 20.21 0.15 0.01 100.00 15.88
4 / proto-dolomite
(Ca0.41,Mg0.59)CO3
11.00 54.63 11.16 1.29 0.61 21.15 0.14 0.02 100.00 18.60
5 / high-Mg calcite
(Ca0.41,Mg0.59)CO3
11.34 56.15 8.54 0.64 0.16 21.62 1.51 0.04 100.00 14.23
6 / proto-dolomite
(Ca0.41,Mg0.59)CO3
11.35 56.15 10.96 0.13 0.07 21.30 0.03 0.01 100.00 18.27
Table 8. EDS analysis results in micro-areas 1 and 2 of the PSZ3 sample.
Point Number Element Total [mass%] MgO
[%]
C O Mg Si Al Ca Fe Mn
[mass%]
Contents of elements in micro-area 1 (Figure11)
1 / huntite
(Ca0.41,Mg0.59)CO3
7.71 51.44 15.24 1.14 0.12 24.12 0.20 0.03 100.00 25.40
2 / huntite
(Ca0.41,Mg0.59)CO3
5.37 44.11 17.76 0.28 0.24 32.00 0.16 0.08 100.00 29.60
Total area / huntite
(Ca0.41,Mg0.59)CO3
7.43 52.12 14.24 0.60 0.11 25.11 0.28 0.11 100.00 23.73
Contents of elements in micro-area 2 (Figure12)
1 / huntite
(Ca0.42,Mg0.58)CO3
9.57 57.17 13.62 BDL 0.09 18.80 0.69 0.06 100.00 22.70
2 / huntite
(Ca0.31,Mg0.69)CO3
6.12 47.93 16.50 0.02 0.09 29.17 0.09 0.08 100.00 27.50
3 / huntite
(Ca0.49,Mg0.61)CO3
4,50 42.67 14.63 0.30 0.13 33.83 3.78 0.16 100.00 24.38
Total area / huntite
(Ca0.43,Mg0.57)CO3
7.60 52.00 13.76 0.53 0.16 25.00 0.83 0.12 100.00 22.93
BDL – below detection limit.
Table 9. Results of WDS analysis in micro-area 3 of the PSZ3 sample.
Point Number Element Total [mass%] MgO
[%]
C O Mg Si Al Ca Fe Mn
Content [mass%]
1 / low-Mg calcite
(Ca0.98,Mg0.02)CO3
10.09 55.47 0.60 0.02 0.02 33.72 0.07 0.01 100.00 1.00
2 / proto-dolomite
(Ca0.51,Mg0.49)CO3
12.65 55.20 11.78 BDL 0.02 20.32 BDL 0.03 100.00 19.63
3 / high-Mg calcite
(Ca0.68,Mg0.32)CO3
11.52 55.82 7.66 0.30 0.08 20.53 3.93 0.16 100.00 12.77
4 / proto-dolomite
(Ca0.52,Mg0.48)CO3
11.82 55.57 11.52 0.05 0.02 20.86 0.15 0.01 100.00 19.20
5 / proto-dolomite
(Ca0.51,Mg0.49)CO3
11.31 56.14 11.75 BDL 0.01 20.63 0.13 0.03 100.00 19.58
6 / proto-dolomite
(Ca0.51,Mg0.49)CO3
13.05 56.67 11.68 0.03 0.04 18.41 0.08 0.04 100.00 19.47
BDL – below detection limit.
Disclaimer/Publisher’s Note: The statements, opinions and data contained in all publications are solely those of the individual author(s) and contributor(s) and not of MDPI and/or the editor(s). MDPI and/or the editor(s) disclaim responsibility for any injury to people or property resulting from any ideas, methods, instructions or products referred to in the content.
Copyright: This open access article is published under a Creative Commons CC BY 4.0 license, which permit the free download, distribution, and reuse, provided that the author and preprint are cited in any reuse.
Prerpints.org logo

Preprints.org is a free preprint server supported by MDPI in Basel, Switzerland.

Subscribe

© 2024 MDPI (Basel, Switzerland) unless otherwise stated