Submitted:
04 December 2023
Posted:
05 December 2023
You are already at the latest version
Abstract
Keywords:
1. Introduction
2. Materials and Methods
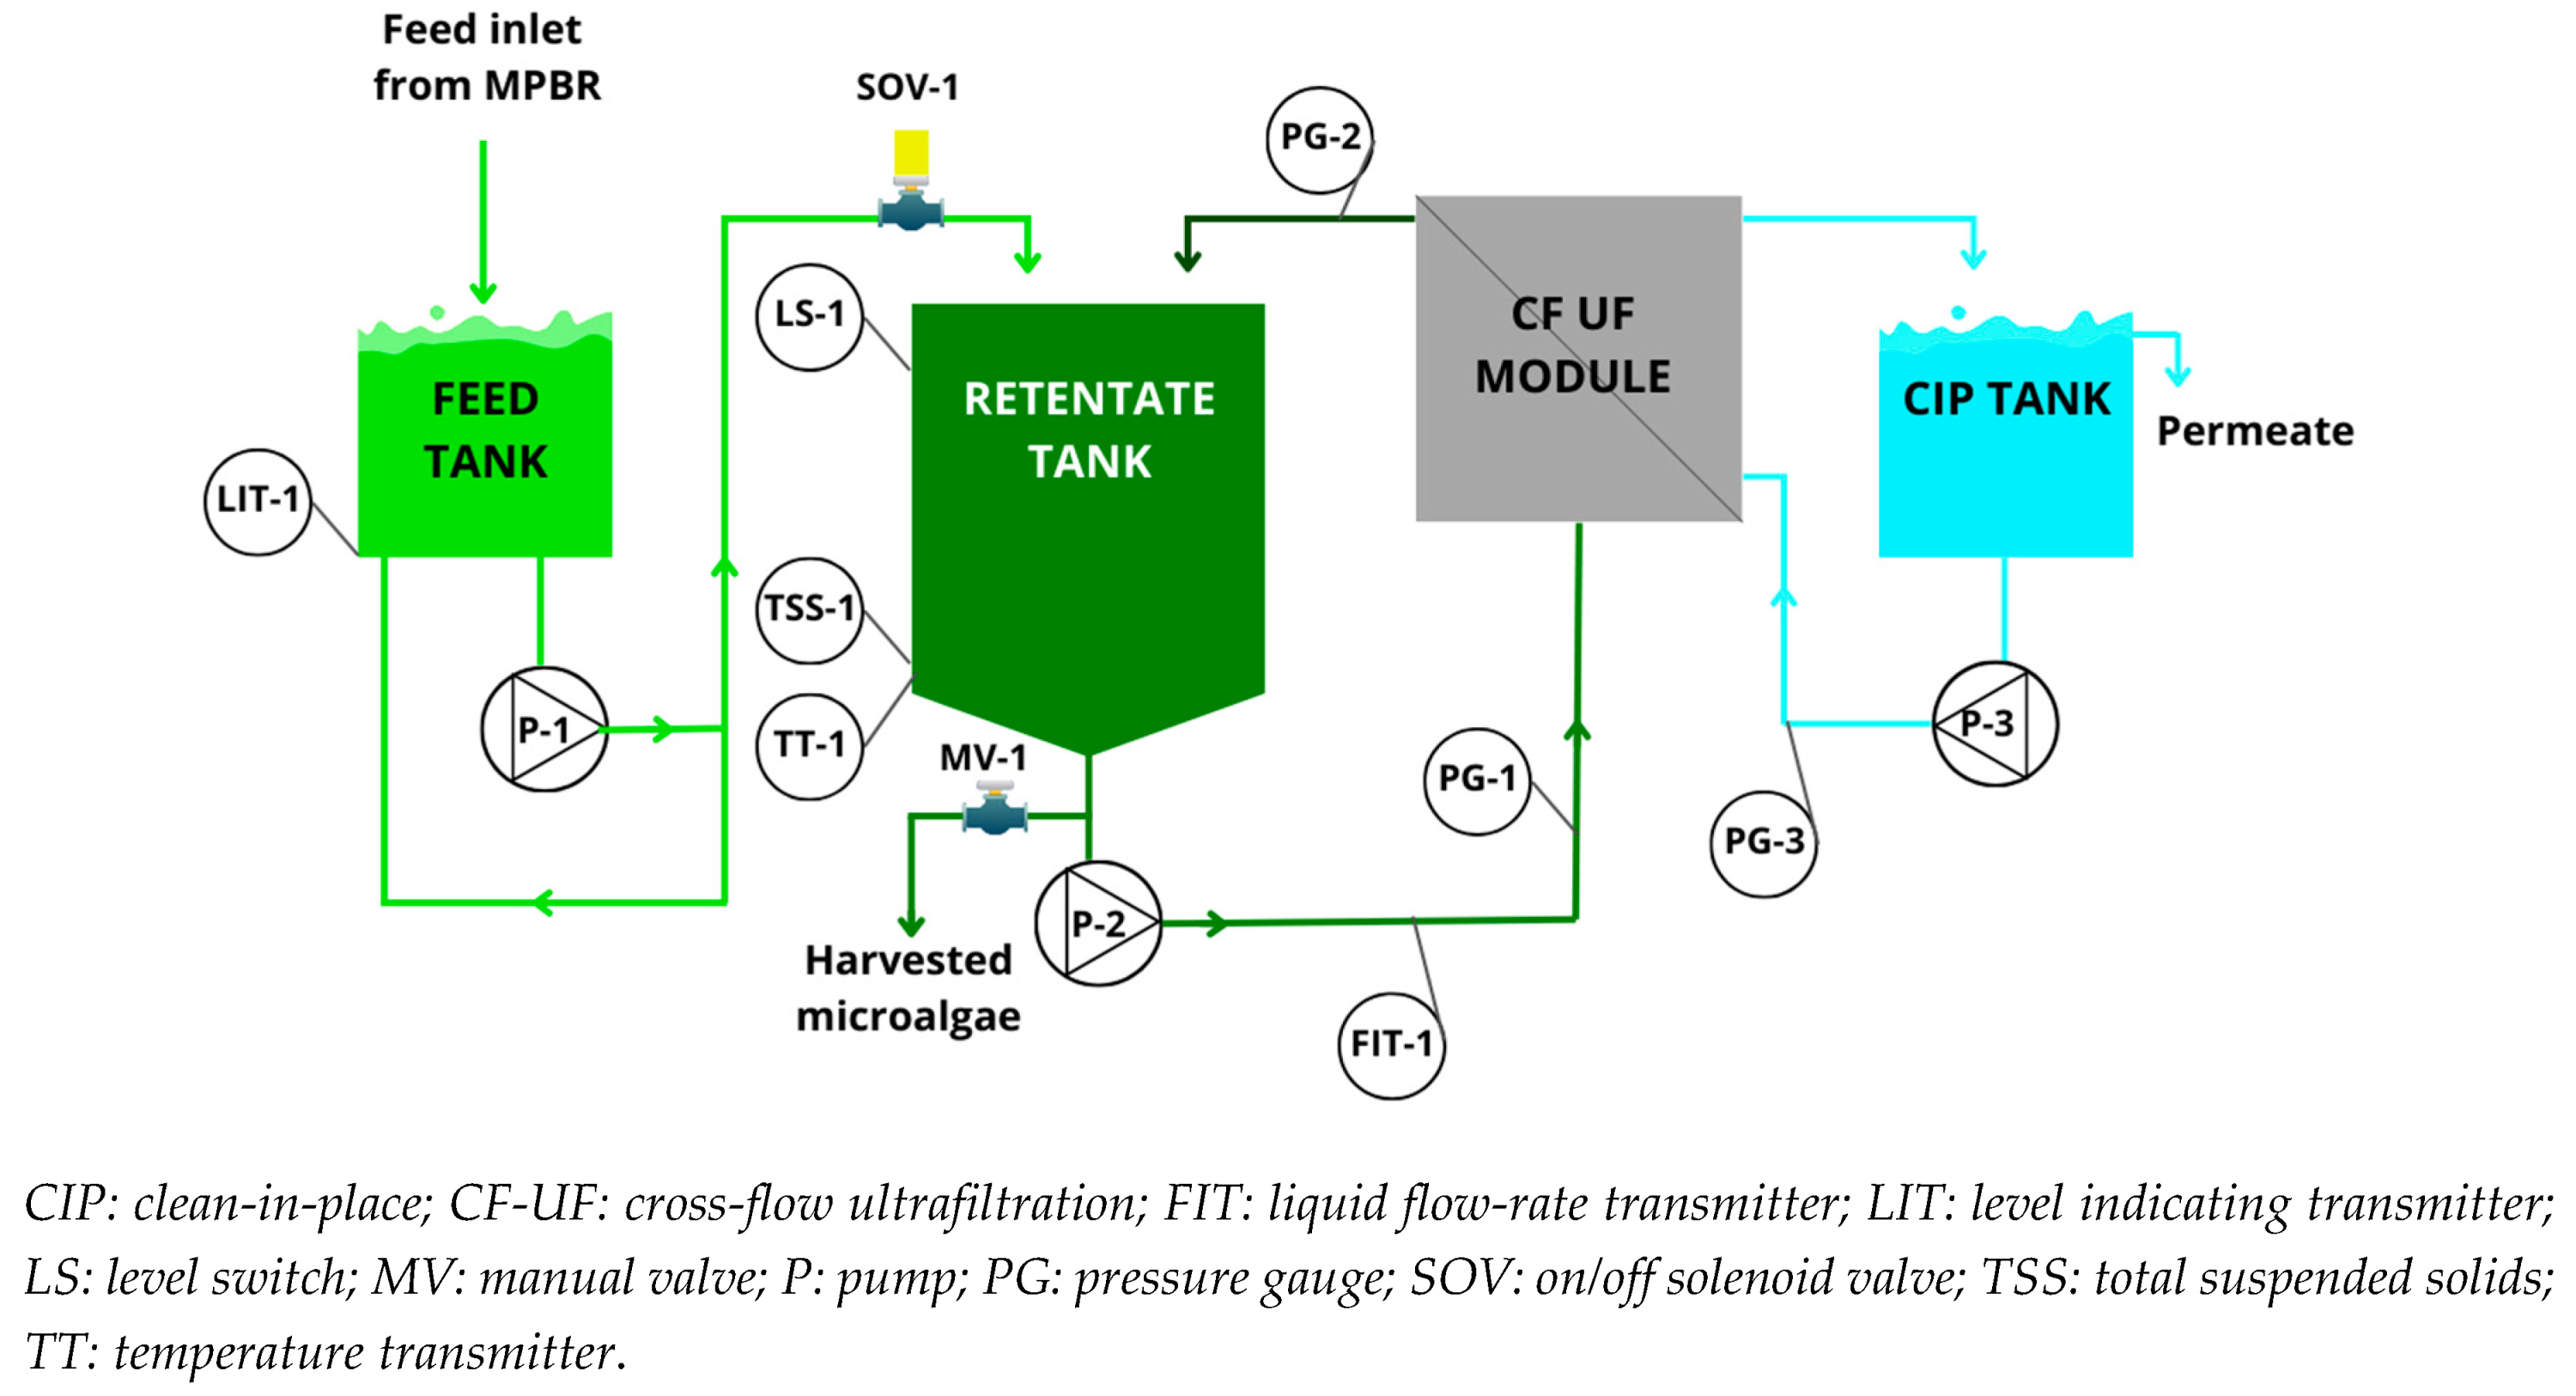
2.1. Description of harvesting pilot plant
2.2. Instrumentation and automation
2.3. Pilot plant operation and monitoring
- Cross flow velocity, CFV (m·s−1), calculated as follows:
- 2.
- Permeate flow rate, Qp (L·h−1), was calculated hydraulically using LFT data from LIT-1, i.e., feed tank level variation (which is equivalent to CIP tank level variation):
- 3.
- Transmembrane flux, J (LMH), was calculated as follows:
- 4.
- Standardised transmembrane flux at 20 °C, J20 (LMH), calculated as follows:
- 5.
- Normalised transmembrane flux at 20 ºC, J20:J20,0,
- 6.
- Membrane permeability standardised at 20 °C, K20 (LMH·bar−1) (Eq. 7):
- 7.
- Backflush flow rate, QBF (L·min−1), was calculated as follows:
- 8.
- Transmembrane pressure during backflushing (TMPBF) was calculated by Eq. 9:
- 9.
- Harvested microalgae culture biomass, M_TSSHV (g), calculated as follows:
- 10.
- Harvesting rate HV_r (g TSS·m−2·h−1), calculated as follows:
- 11.
- Concentration ratio r (Eq. 12):
2.4. Energy and chemical reagents consumption
- i.
- the energy consumption ratio of the harvesting system (ECm_TSS, in kWh·tTSS−1) per tonne of harvested microalgae biomass (M_TSSHV, in t) (Eq. 23);
- ii.
- the energy consumption ratio of the harvesting system (ECv_HV, in kWh·m−3) per treated volume of pre-concentrated microalgae culture, i.e., the initial volume of the feed tank (Vi, in m−3) (Eq. 24);
- iii.
- the energy consumption ratio of the harvesting system (ECv_WRRF, kWh·m−3) per treated volume of water in the WRRF pilot plant (V_WRRF treated to generate V_HV, in m−3) (Eq. 25):
2.5. GHG estimation.
3. Results
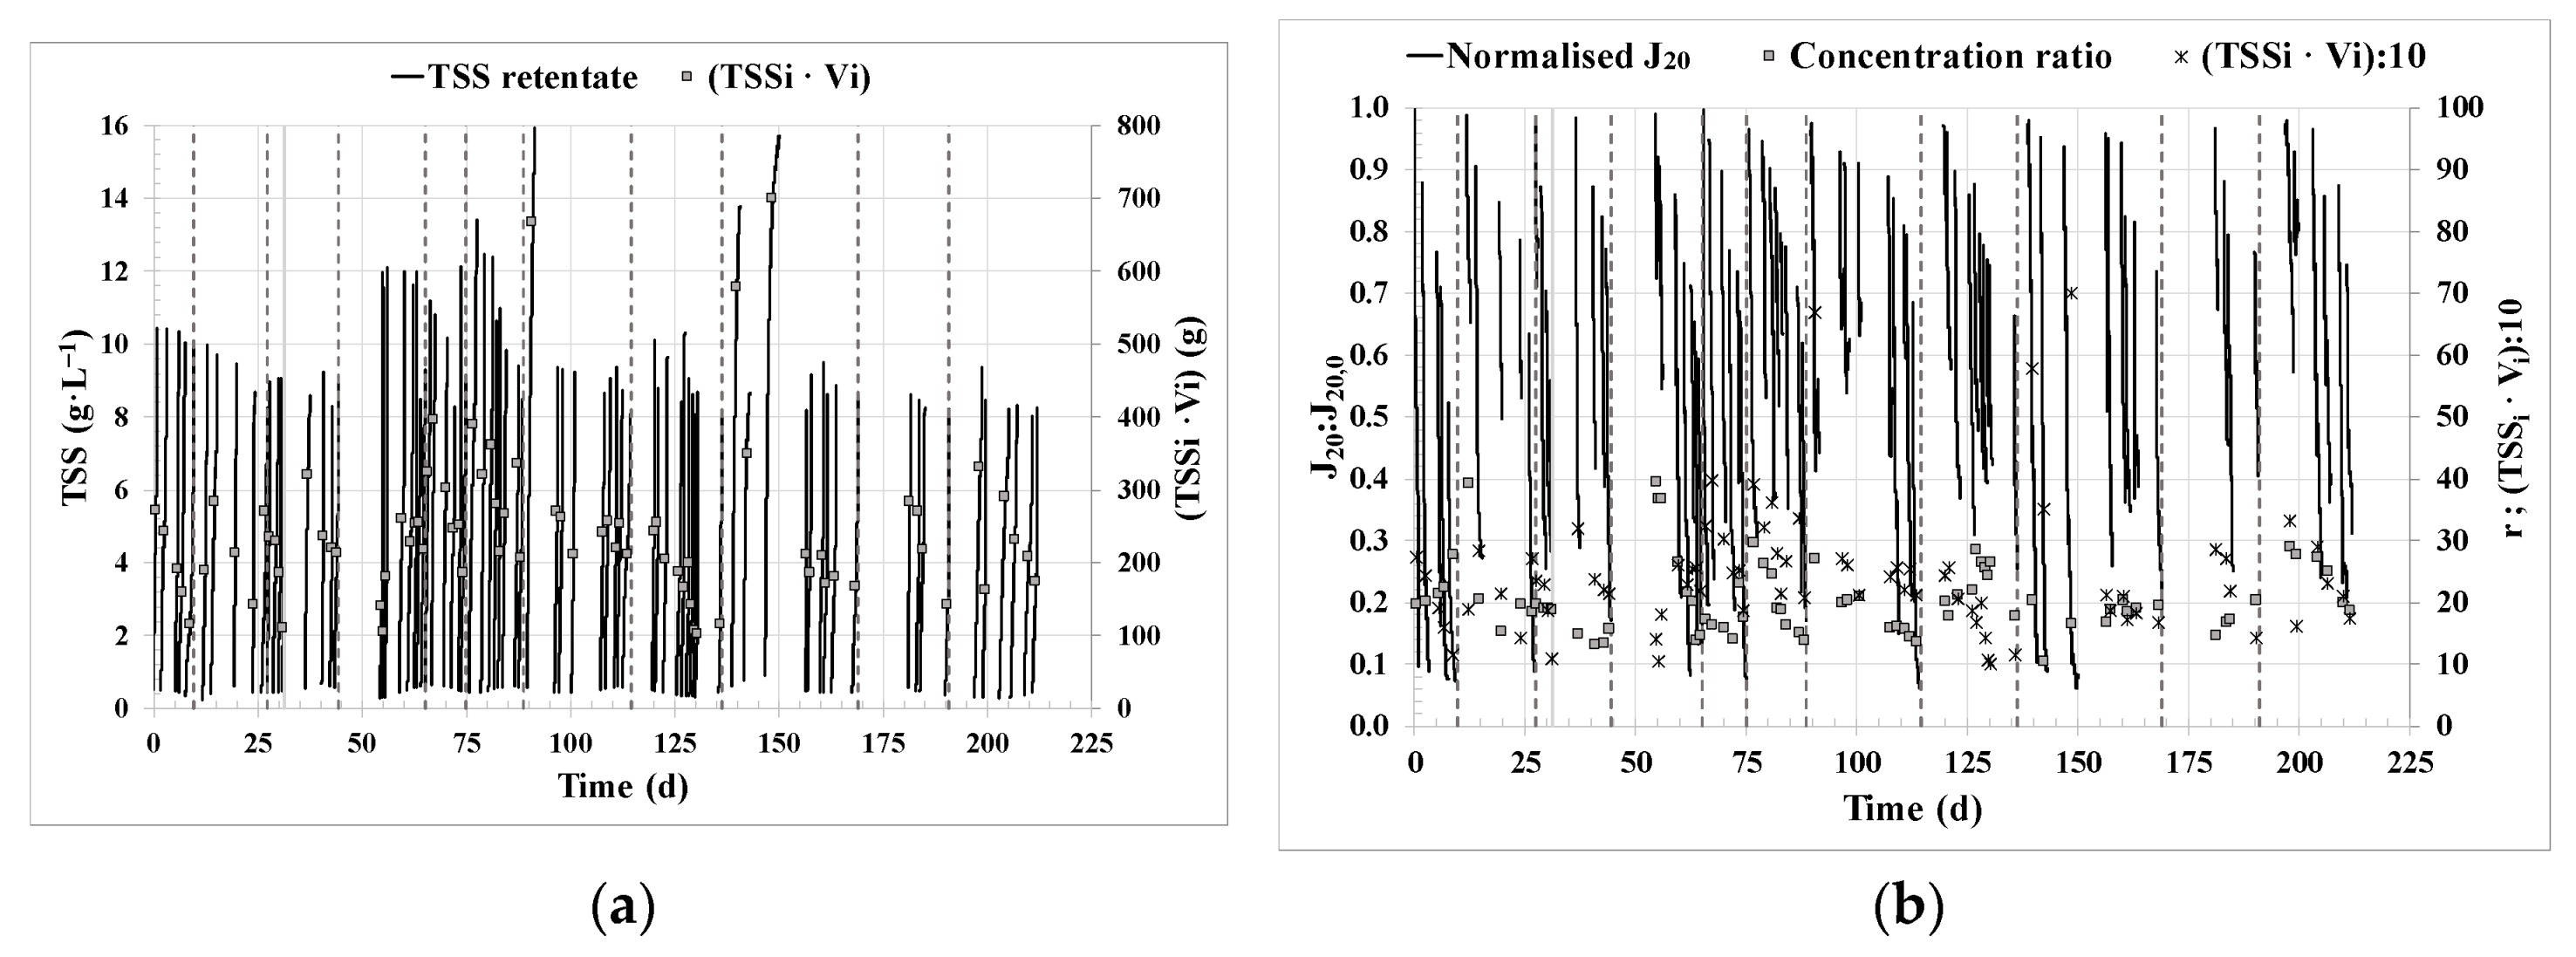
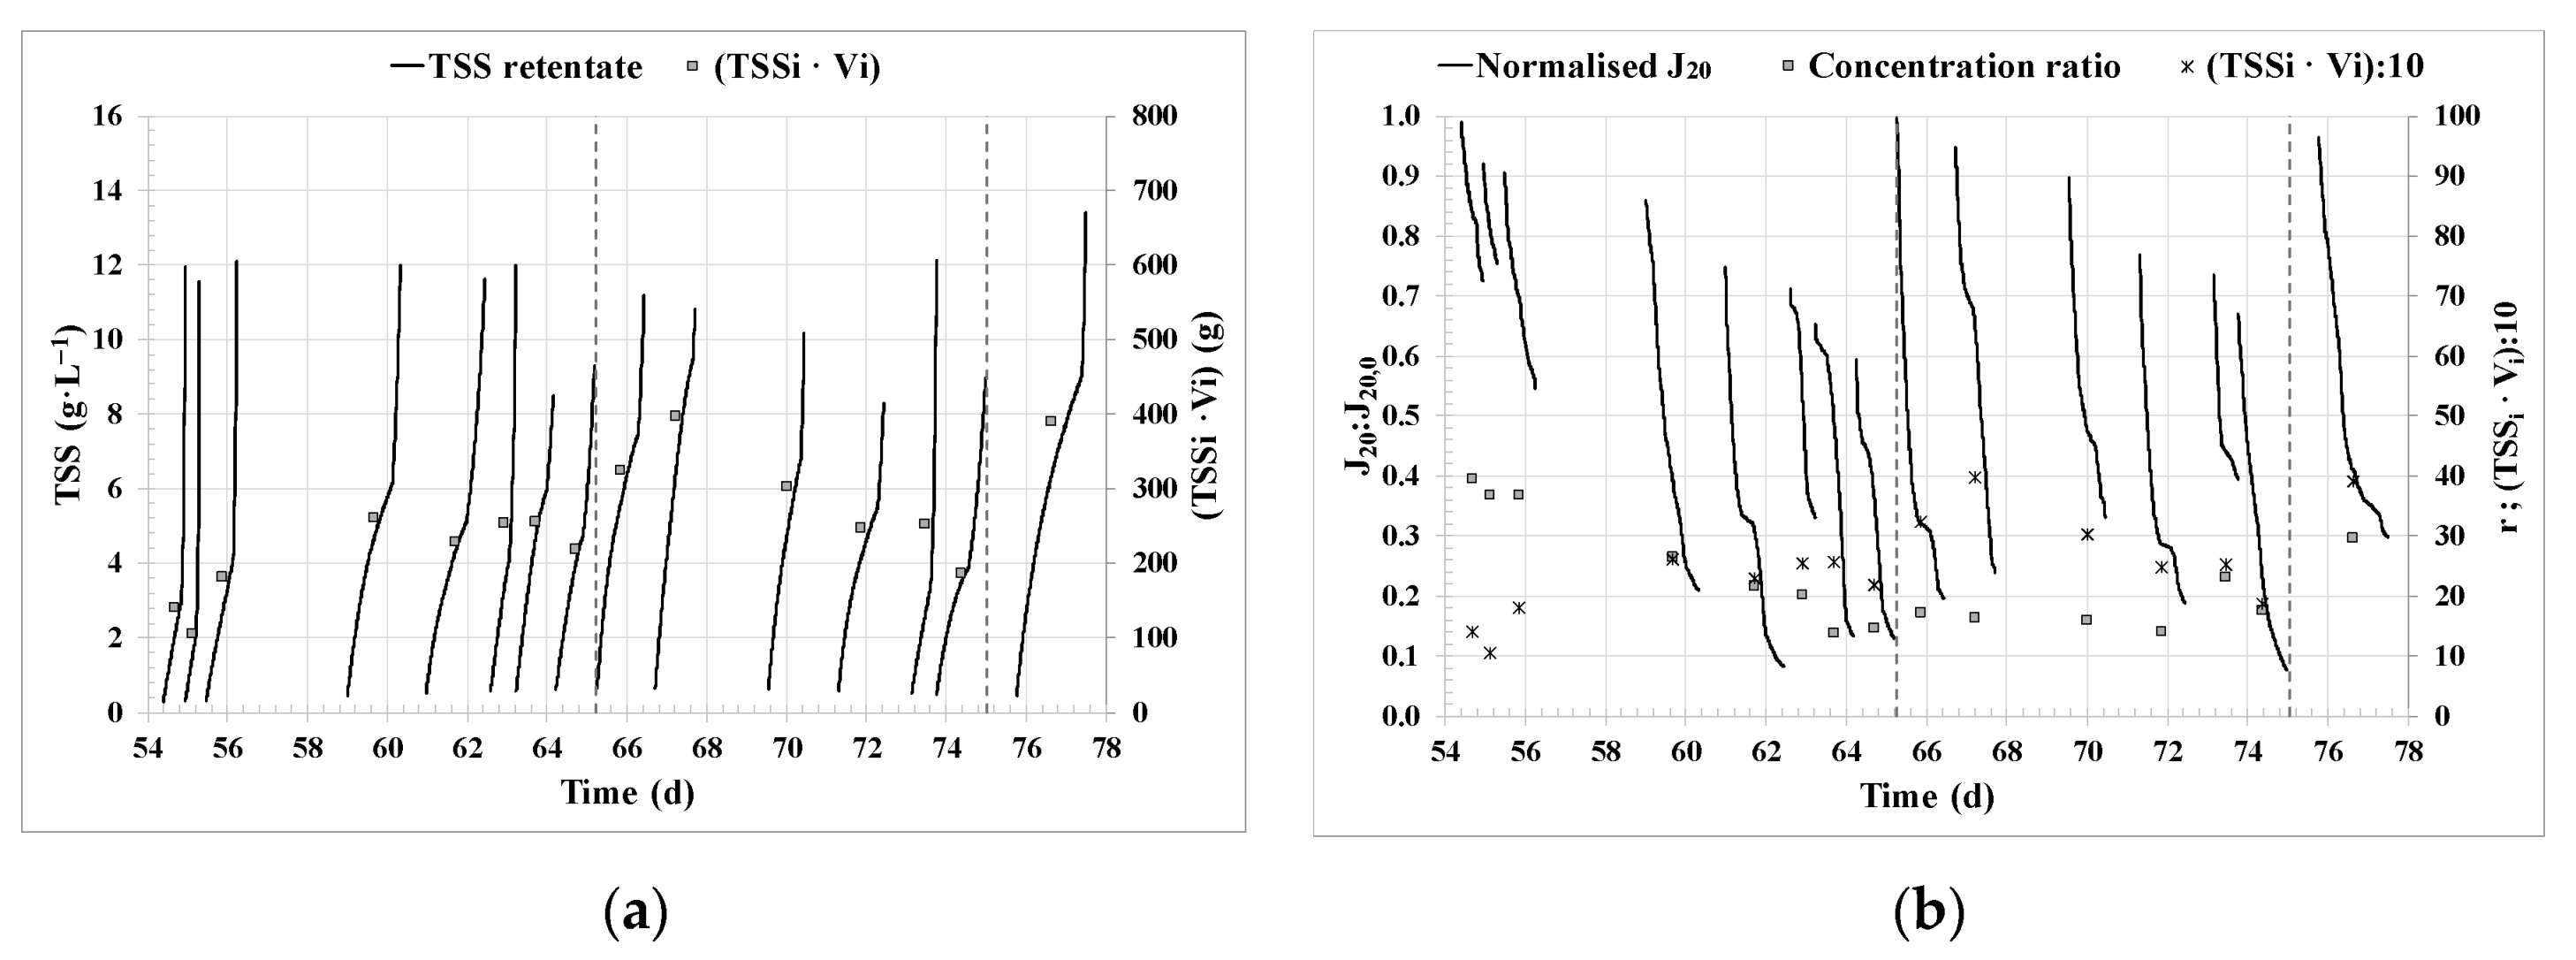
3.1. Filtration performance.
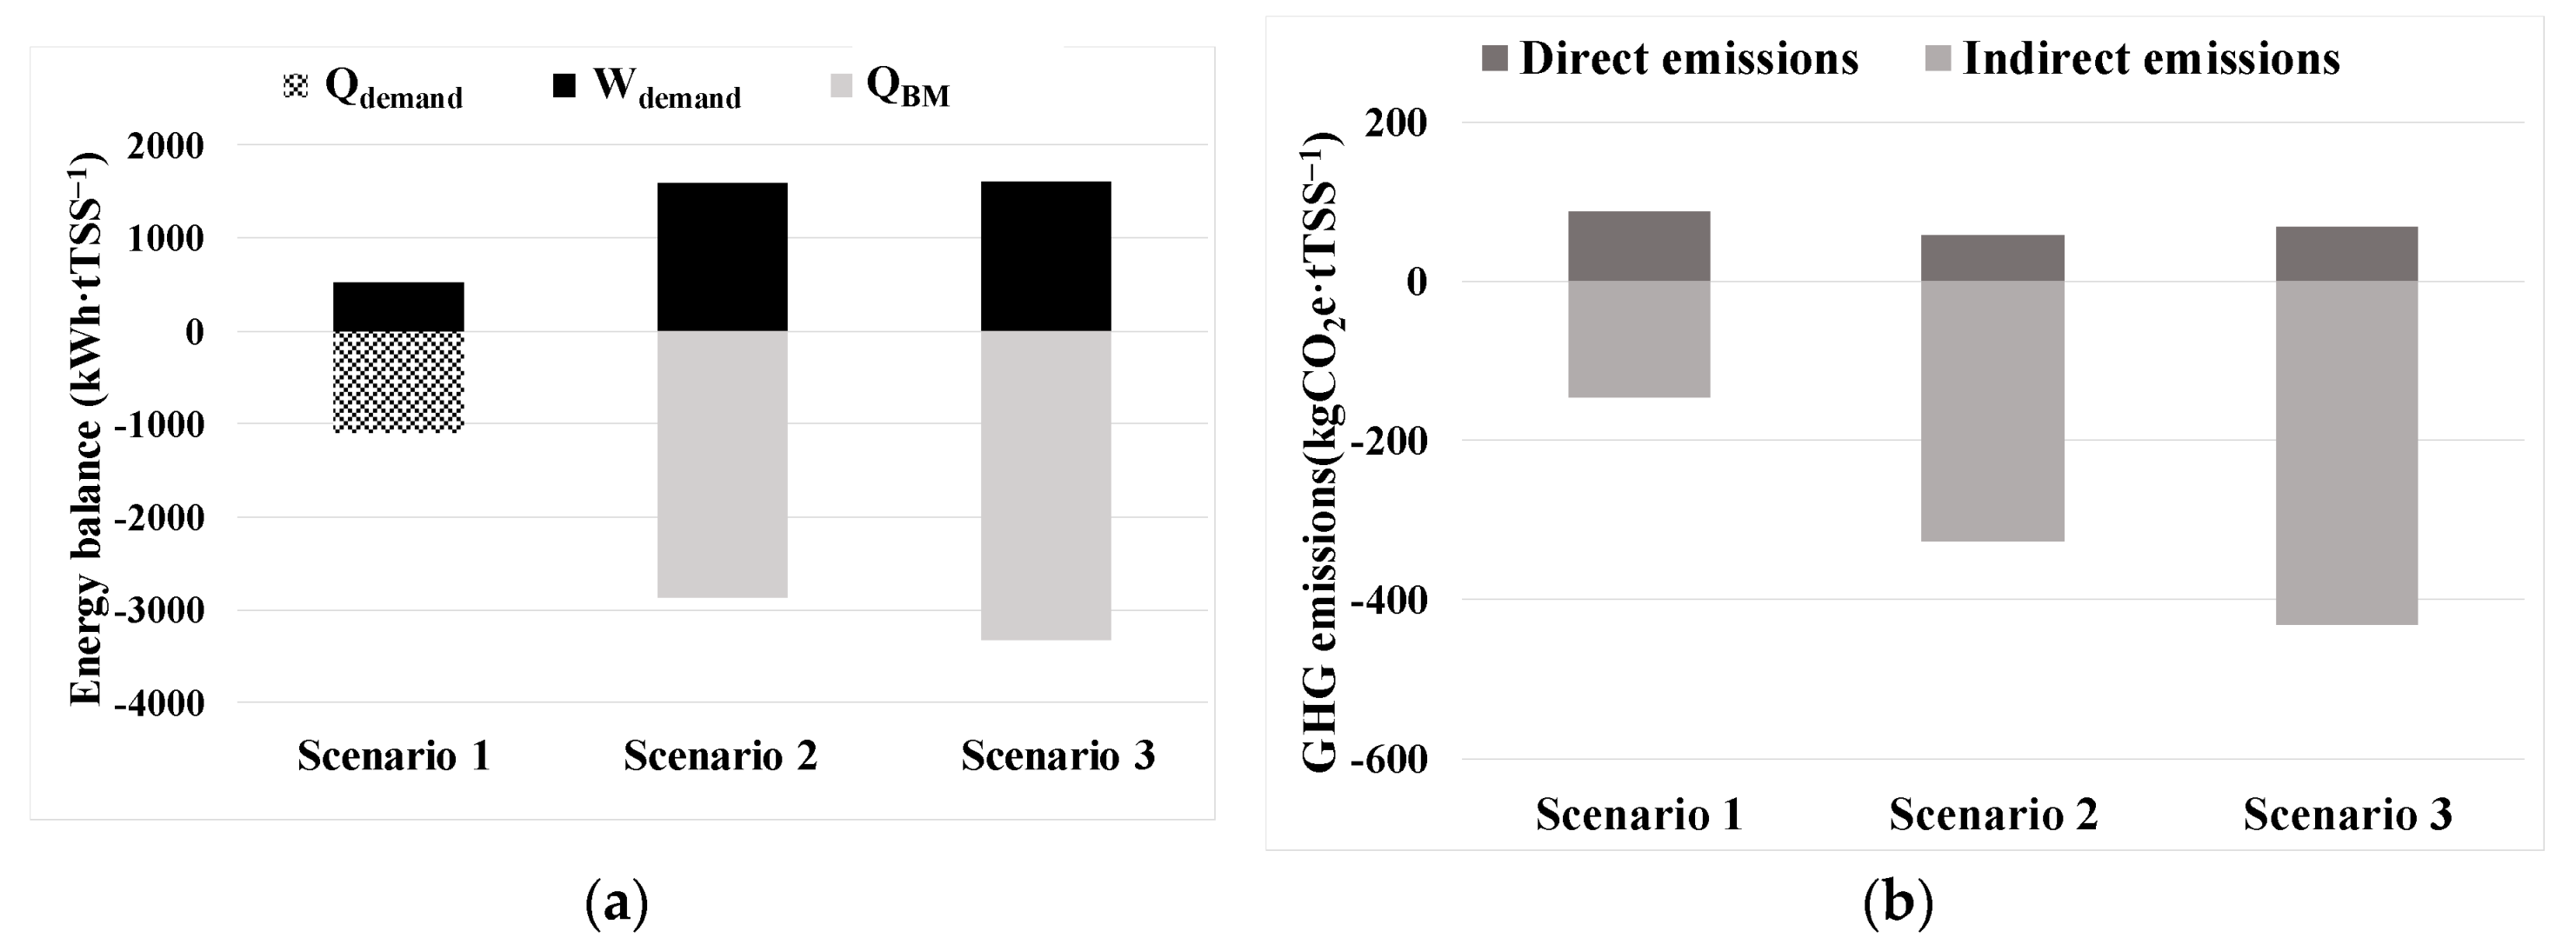
3.2. Techno-economic and carbon footprint assessment
4. Conclusions
Supplementary Materials
Author Contributions
Funding
Data Availability Statement
Acknowledgments
Conflicts of Interest
Glossary
| ACF | Membrane cross-sectional area |
| AD | Anaerobic digestion |
| AF | Filtration area of the membranes |
| AFT | Feed tank area |
| AnMBR | Anaerobic membrane bioreactor |
| CF | Cross-flow |
| CF-UF | Cross-flow ultrafiltration |
| CFV | Cross-flow velocity |
| CHP | Combined heat and power system |
| CIP | Clean-in-place |
| D | Cross-sectional diameter |
| E | Energy balance calculation |
| EC | Total energy consumption |
| ECm_TSS | Energy consumption ratio of the harvesting system per harvested microalgae biomass |
| ECv_HV | Energy consumption ratio of the harvesting system per treated volume of pre-concentrated microalgae culture |
| ECv_WRRF | Energy consumption ratio of the harvesting system per treated volume of water in the WRRF |
| EFCH4 | Methane losses emission factor |
| EFelectricity | Specific emission factor of european power companies |
| EFnatural_gas | Specific emission factor for fossil natural gas from the grid, in Europe |
| f | Friction factor |
| FIT | Liquid flow-rate transmitter |
| g | Acceleration of gravity |
| GHG | Greenhouse gas |
| GHGdirect | Direct greenhouse gases emissions |
| GHGindirect | Indirect greenhouse gases emissions |
| GHGtotal | Total greenhouse gases emissions |
| HRT | Hydraulic retention time |
| HV_r | Harvesting rate |
| ICA | Instrumentation, control and automation |
| J | Transmembrane flux |
| J20 | 20 ºC-standardised transmembrane flux |
| J20,0 | Initial 20ºC-standardised transmembrane flux at the inception of the entire experiment |
| J20:J20,0 | Normalised transmembrane flux at 20 ºC |
| k | Internal roughness of the pipe |
| K20 | 20 ºC-standardised permeability |
| l | Length of the pipeline |
| leq | Pressure drops due to accidents expressed as equivalent length |
| L | Level |
| LIT | Level indicating transmitter |
| LMH | Litter per square meter and hour |
| LS | Level switch |
| MBG | Gross production of raw biogas, expressed as methane mass |
| MBM | Biomethane production, expressed as methane mass |
| M_Cl | Sodium hypochlorite reagent mass used in chemical cleaning |
| M_TSSHV | Harvested microalgae culture biomass |
| MPBR | Membrane photobioreactor |
| MV | Valve |
| NaOClCv_WRRF | Sodium hypochlorite reagent consumption ratio per m3 treated in the WRRF |
| OPEXEC+Cl | Operating costs for energy consumption and sodium hypochlorite for the CF-UF pilot plant per m3 treated in the WRRF |
| p.e. | Population equivalent |
| PG | Pressure gauge |
| Pj | Pressure at point j |
| P-j | Pump number j |
| PLC | Programmable logic controller |
| QBG | Gross production of raw biogas, expressed as primary energy |
| QBM | Biomethane production, expressed as primary energy |
| Qdemand | Total thermal energy demand |
| Qj | Flow-rate for pump or stream j |
| Qrecovered | Heat recovered by the biogas valorisation system |
| QTOT | Heat required by the anaerobic co-digestion process |
| r | Concentration ratio |
| SCADA | Supervisory control and data acquisition software |
| SOV | On/off solenoid valve |
| SRT | Solids retention time |
| T | Temperature |
| TMP | Transmembrane pressure |
| TSS | Total suspended solids |
| TSSf | Final TSS concentration for an operation cycle |
| TSSi | Initial TSS concentration for an operation cycle |
| TT | Temperature transmitter |
| UF | Ultrafiltration |
| v | Velocity |
| V_HV | Final volume in the retentate tank for an operation cycle |
| V_WRRF | Volume of water treated in the WRRF to generate V_HV |
| V_WRRFCC | Volume of water treated in the WRRF since the last chemical cleaning |
| Vi | Initial volume in the feed tank for an operation cycle |
| wa,d | Mass fractional content in dry solids in green microalgae biomass |
| Wdemand | Total electrical energy demand |
| WP,j | Power required for pump j |
| Wrecovered | Electricity recovered by the biogas valorisation system |
| WRRF | Water resource recovery facility |
| xw | Water mass content of wet green microalgae biomass |
| Zj | Elevation of point j |
| ΔLj | Variation of level j |
| Δt | Variation of time |
| Maximum microalgae volume fraction in the culture | |
| Φω,α | Microalgae volume fraction in the culture |
| ηpump_j | Efficiency of pump j |
| φupgrading | Efficiency of the upgrading process |
| μ | Viscosity |
| ρ | Density |
References
- Walker, N.L. , Williams, A.P., Styles, D. Pitfalls in international benchmarking of energy intensity across wastewater treatment utilities. J. Environ. Manag. 2021, 300, 113613. [Google Scholar] [CrossRef] [PubMed]
- Foglia, A. , González-Camejo, J., Radini, S., Sgroi, M., Li, K., Eusebi, A.L., Fatone, F., 2023. Transforming wastewater treatment plants into reclaimed water facilities in water-unbalanced regions. An overview of possibilities and recommendations focusing on the Italian case. Journal of Cleaner Production, Volume 410, 137264. [CrossRef]
- European Comission. Proposal for a DIRECTIVE OF THE EUROPEAN PARLIAMENT AND OF THE COUNCIL concerning urban wastewater treatment, 2022. https://environment.ec.europa.eu/publications/proposal-revised-urban-wastewater-treatment-directive_en.
- Yuan, S. , Lei, W., Cen, Y., Liu, Q., Liu, J., Fu, J., Han, Y. Economic analysis of global microalgae biomass energy potential. Science of The Total Environment, 2023, Volume 899, 165596. [CrossRef]
- Khan, S.; Thaher, M.; Abdulquadir, M.; Faisal, M.; Mehariya, S.; Al-Najjar, M.A.A.; Al-Jabri, H.; Das, P. Utilization of Microalgae for Urban Wastewater Treatment and Valorization of Treated Wastewater and Biomass for Biofertilizer Applications. Sustainability 2023, 15, 16019. [Google Scholar] [CrossRef]
- Olabi, A.G. , Shehata, N., Sayed, E.T., Rodriguez, C., Anyanwu, R.C., Russell, C., Abdelkareem, M.A. Role of microalgae in achieving sustainable development goals and circular economy. Science of The Total Environment, 2023, Volume 854, 158689. [CrossRef]
- Shilton, A. Pond Treatment Technology. IWA Publishing, 2006. [CrossRef]
- Reynolds, C.S. The ecology of phytoplankton (ecology, biodiversity and conservation). Cambridge: Cambridge University Press; 2006. [Google Scholar] [CrossRef]
- Solovchenko, A. , Ismagulova, T. , Lukyanov, A., Vasilieva, S., Konyukhov, I., Pogosyan, S., Lobakova, E., Gorelova, O.A. Luxury phosphorus uptake in microalgae. J Appl Phycol, 2019, 31, 2755–2770. [Google Scholar] [CrossRef]
- Acién Fernández, F.G. , Gómez-Serrano, C., Fernández-Sevilla, J.M. Recovery of Nutrients From Wastewaters Using Microalgae. Frontiers in Sustainable Food Systems, 2018, 2:59. [CrossRef]
- Nagarajan, D. , Lee, D.-J., Chen, C.-Y., Chang, J.-S. Resource recovery from wastewaters using microalgae-based approaches: A circular bioeconomy perspective. Bioresource Technology, 2020, Volume 302,122817. [CrossRef]
- Arbib, Z. , de Godos, I. , Ruiz, J., Perales, J.A. Optimization of pilot high rate algal ponds for simultaneous nutrient removal and lipids production. Sci. Total Environ., 2017, 589, 66–72. [Google Scholar] [CrossRef] [PubMed]
- García-Galán, M.J. , Gutiérrez, R. , Uggetti, E., Matamoros, V., García, J., Ferrer, I. Use of full-scale hybrid horizontal tubular photobioreactors to process agricultural runoff. Biosyst. Eng., 2018, 166, 138–149. [Google Scholar] [CrossRef]
- Rossi, S. , Mantovani, M., Marazzi, F., Bellucci, M., Casagli, F., Mezzanotte, V., Ficara, E. Microalgae cultivation on digestate: Process efficiency and economics. Chemical Engineering Journal, 2023, Volume 460, 141753. [CrossRef]
- Xu, X. , Gu, X. , Wang, Z., Shatner, W., Wang, Z. Progress, challenges and solutions of research on photosynthetic carbon sequestration efficiency of microalgae. Renew. Sust. Energy Rev., 2019, 110, 65–82. [Google Scholar] [CrossRef]
- Oruganti, R.K. , Biji, A.P., Lanuyanger, T., Show, P.L., Sriariyanun, M., Upadhyayula, V.K.K., Gadhamshetty, V., Bhattacharyya, D. Artificial intelligence and machine learning tools for high-performance microalgae wastewater treatment and algal biorefinery: A critical review. Science of The Total Environment, 2023, Volume 876, 162797. [CrossRef]
- Clagnan, E. , Dell'Orto, M., Štěrbová, K., Grivalský, T., Manoel, J.A.C., Masojídek, J., D'Imporzano, G., Acién-Fernández, F.G., Adani, F. Impact of photobioreactor design on microalgae-bacteria communities grown on wastewater: Differences between thin-layer cascade and thin-layer raceway ponds. Bioresource Technology, 2023, Volume 374,128781. [CrossRef]
- De Vree, J.H. , Bosma, R., Janssen, M. et al. Comparison of four outdoor pilot-scale photobioreactors. Biotechnol Biofuels 8, 215 (2015). [CrossRef]
- Morales-Amaral, M.M. , Gómez-Serrano, C., Acién, F.G., Fernández-Sevilla, J.M., Molina-Grima, E. Outdoor production of Scenedesmus sp. in thin-layer and raceway reactors using centrate from anaerobic digestion as the sole nutrient source. Algal Research, 2015, Volume 12, Pages 99-108. [CrossRef]
- Luo, Y. , Le-Clech, P., Henderson, R.K. Assessment of membrane photobioreactor (MPBR) performance parameters and operating conditions. Water Research, 2018, Volume 138, Pages 169-180. [CrossRef]
- Zhao, Z. , Muylaert, K., Vankelecom, I.F.J. Applying membrane technology in microalgae industry: A comprehensive review. Renewable and Sustainable Energy Reviews, 2023, Volume 172, 113041. [CrossRef]
- Luo, Y. , Le-Clech, P., Henderson, R.K. Assessment of membrane photobioreactor (MPBR) performance parameters and operating conditions. Water Res., 2018 138, 169-180. [CrossRef]
- Gao, F. , Peng, Y.Y., Li, C., Cui, W., Yang, Z.-H., Zeng, G.-M., 2018. Coupled nutrient removal from secondary effluent and algal biomass production in membrane photobioreactor (MPBR): Effect of HRT and long-term operation. Chemical Engineering Journal, Volume 335, Pages 169-175. [CrossRef]
- Alkarawi, M.A.S. , Caldwell, G.S., Lee, J.G.M. Continuous harvesting of microalgae biomass using foam flotation. Algal Research, 2018, Volume 36, Pages 125-138. [CrossRef]
- Liu, Z. , Hao, N., Hou, Y., Wang, Q., Liu, Q., Yan, S., Chen, F., Zhao, L. Technologies for harvesting the microalgae for industrial applications: Current trends and perspectives. Bioresource Technology, Volume 387, 2023, 129631. [CrossRef]
- Giménez, J.B. , Bouzas, A., Carrere, H., Steyer, J.-P., Ferrer, J., Seco, A., 2018. Assessment of cross-flow filtration as microalgae harvesting technique prior to anaerobic digestion: Evaluation of biomass integrity and energy demand. Bioresource Technology, Volume 269, Pages 188-194. [CrossRef]
- Das, P. , Khan, S., Thaher, M., AbdulQuadir, M., Hoekman, S.K., Al-Jabri, H. Effect of harvesting methods on the energy requirement of Tetraselmis sp. biomass production and biocrude yield and quality. Bioresource Technology, 2019, Volume 284, Pages 9-15. [CrossRef]
- Liu, Q. , Zhang, M., Lv, T., Chen, H.J., Chika, A.O., Xiang, C.L., Guo, M.X., Wu, M.H., Li, J. J., Jia, L.S. Energy-producing electro-flocculation for harvest of Dunaliella salina. Bioresour. Technol. 2017, 241, 1022–1026. [Google Scholar] [CrossRef] [PubMed]
- Kim, K. , Shin, H., Moon, M., Ryu, B.G., Han, J.I., Yang, J.W., Chang, Y.K. Evaluation of various harvesting methods for high-density microalgae, Aurantiochytrium sp. KRS101. Bioresour. Technol. 2015, 198, 828–835. [Google Scholar] [CrossRef] [PubMed]
- Mahesh, R. , Naira, V.R., Maiti, S.K. Concomitant production of fatty acid methyl ester (biodiesel) and exopolysaccharides using efficient harvesting technology in flat panel photobioreactor with special sparging system via Scenedesmus abundans. Bioresour. Technol. 2019, 278, 231–241. [Google Scholar] [CrossRef] [PubMed]
- Lv, J.P. , Zhao, F., Feng, J., Liu, Q., Nan, F.R., Xie, S.L. Extraction of extracellular polymeric substances (EPS) from a newly isolated self-flocculating microalga Neocystis mucosa SX with different methods. Algal Res. 2019, 40, 101479. [Google Scholar] [CrossRef]
- Chen, Z.H. , Shao, S. S., He, Y.J., Luo, Q.Q., Zheng, M.M., Zheng, M.Q., Chen, B.L., Wang, M.Z. Nutrients removal from piggery wastewater coupled to lipid production by a newly isolated self-flocculating microalga Desmodesmus sp. PW1. Bioresour. Technol., 2020, 302, 122806. [Google Scholar] [CrossRef] [PubMed]
- Rajesh-Banu, J. , Preethi, Kavitha, S., Gunasekaran, M., Kumar, G. Microalgae based biorefinery promoting circular bioeconomy-techno economic and life-cycle analysis. Bioresource Technology, 2020, Volume 302, 122822. [CrossRef]
- Baroni, E.G. , Yap, K.Y., Webley, P.A., Scales, P.J., Martin, G.J.O.The effect of nitrogen depletion on the cell size, shape, density and gravitational settling of Nannochloropsis salina, Chlorella Sp. (marine) and Haematococcus pluvialis. Algal Research, 2019; 39, 101454. [Google Scholar] [CrossRef]
- Japar, A.S. , Azis, N.M., Takriff, M.s., Haiza, M.Y.N., Yasin, M.H.M. Application of Different Techniques to Harvest Microalgae. Trans Sci Technol, 2017; 4, 98–108. [Google Scholar]
- Razzak, S.A. , Ali, S.A.M., Hossain, M.M., deLasa, H. Biological CO2 fixation with production of microalgae in wastewater – A review. Renewable and Sustainable Energy Reviews, 2017, Volume 76, Pages 379-390. [CrossRef]
- Sun, J. , Jiang, S., Yang, L., Chu, H., Peng, B.-Y., Xiao, S., Wang, Y., Zhou, X., Zhang, Y., 2023. Microalgae wastewater recycling: Suitability of harvesting methods and influence on growth mechanisms. Science of The Total Environment, Volume 859, Part 2, 160237. [CrossRef]
- Dai, D., Qv, M., Liu, D., Tang, C., Wang, W., Wu, Q., Yin, Z., Zhu, L. Structural insights into mechanisms of rapid harvesting of microalgae with pH regulation by magnetic chitosan composites: A study based on E-DLVO model and component fluorescence analysis. Chemical Engineering Journal 2023, Volume 456, 141071. [CrossRef]
- De Morais, E.G. , Sampaio, I.C.F., Gonzalez-Flo, E., Ferrer, I., Uggetti, E., García, J. Microalgae harvesting for wastewater treatment and resources recovery: A review. New Biotechnology, 2023, Volume 78, Pages 84-94. [CrossRef]
- Rossi, S. , Visigalli, S., Cascino, F.C., Mantovani, M., Mezzanotte, V., Parati, K., Canziani, R., Turolla, A., Ficara, E. Metal-based flocculation to harvest microalgae: A look beyond separation efficiency. Science of The Total Environment, 2021, Volume 799, 149395. [CrossRef]
- Figueiredo, D. , Ferreira, A., Quelhas, P, Schulze, P.S.C., Gouveia, L. Nannochloropsis oceanica harvested using electrocoagulation with alternative electrodes – An innovative approach on potential biomass applications. Bioresource Technology, 2022, Volume 344, Part B, 126222. [CrossRef]
- Coward, T. , Lee, J.G.M., Caldwell, G.S. Harvesting microalgae by CTAB-aided foam flotation increases lipid recovery and improves fatty acid methyl ester characteristics. Biomass and Bioenergy, 2014, Volume 67, Pages 354-362. [CrossRef]
- Fasaei, F. , Bitter, J.H., Slegers, P.M., van Boxtel, A.J.B. Techno-economic evaluation of microalgae harvesting and dewatering systems. Algal Res. 31, 2018, 347-362. [CrossRef]
- Gerardo, M.L. , Oatley-Radcliffe, D.L, Lovitt, R.W. Minimizing the Energy Requirement of Dewatering Scenedesmus sp. by Microfiltration: Performance, Costs, and Feasibility. Environmental Science & Technology, 2014; 48, 845–853. [Google Scholar] [CrossRef]
- Zhang, M. , Yao, L., Maleki, E., Liao, B.Q., Lin, H. Membrane technologies for microalgae cultivation and dewatering: Recent progress and challenges. Algal Res., 2022 44, 101686. [CrossRef]
- Wang, L. , Pan, B., Gao, Y., Li, C., Ye, J., Yang, L., Chen, Y., Hu, Q., Zhang, X. Efficient membrane microalgae harvesting: Pilot-scale performance and techno-economic analysis. Journal of Cleaner Production, 2019, Volume 218, Pages 83-95. [CrossRef]
- Hwang, T. , Park, S-J., Oh, Y-K., Rashid, N., Han, J-I. Harvesting of Chlorella sp. KR-1 using a cross-flow membrane filtration system equipped with an anti-fouling membrane. Bioresource Technology, 2013, Volume 139, Pages 379-382. [CrossRef]
- Elcik, H. , Cakmakci, M., Ozkaya, B. The fouling effects of microalgae cells on crossflow membrane filtration. Journal of Membrane Science, 2016, Volume 499, Pages 116-125. [CrossRef]
- Monte, J. , Sá, M., Galinha, C.F., Costa, L., Hoekstra, H., Brazinha, C., Crespo, J.G. Harvesting of Dunaliella salina by membrane filtration at pilot scale. Separation and Purification Technology, 2018, Volume 190, 2018. Pages 252-260. [CrossRef]
- Mo, W. , Soh, L., Werber, J.R., Elimelech, M., Zimmerman, J.B. Application of membrane dewatering for algal biofuel. Algal Research, 2015, Volume 11, Pages 1-12. [CrossRef]
- Bilad, M.R. , Discart, V., Vandamme, D., Foubert, I., Muylaert, K., Vankelecom, I.F.J. Harvesting microalgae biomass using a magnetically induced membrane vibration (MMV) system: Filtration performance and energy consumption. Bioresource Technology, 2013, Volume 138, Pages 329-338. [CrossRef]
- De Baerdemaeker, T. , Lemmens, B., Dotremont, C., Fret, J., Roef, L., Goiris, K., Diels, L. Benchmark study on algae harvesting with backwashable submerged flat panel membranes. Bioresource Technology, 2013, Volume 129, Pages 582-591. [CrossRef]
- Bhave, R. , Kuritz, T., Powell, L., Adcock, D. Membrane-Based Energy Efficient Dewatering of Microalgae in Biofuels Production and Recovery of Value Added Co-Products. Environ. Sci. Technol. 2012, 46, 10–5599. [Google Scholar] [CrossRef] [PubMed]
- González-Camejo, J. , Andreola, C., Maceratesi, V., Toscano, G., Eusebi, A.L., Fatone, F., 2023. Biorefineries to improve water and resource recovery in the seafood-processing industry. Advanced Technologies in Wastewater Treatment: Food Processing Industry, pp. 127 - 154. [CrossRef]
- Segredo-Morales, E. , González-Martín, C., Vera, L., González, E., 2023. Performance of a novel rotating membrane photobioreactor based on indigenous microalgae-bacteria consortia for wastewater reclamation. Journal of Industrial and Engineering Chemistry, Volume 119, Pages 586-597. [CrossRef]
- Zhang, X. , Hu, Q., Sommerfeld, M., Puruhito, E., Chen, Y. Harvesting algal biomass for biofuels using ultrafiltration membranes. Bioresource Technology, 2010, Volume 101, Issue 14, Pages 5297-5304. [CrossRef]
- Seco, A.; Aparicio, S.; González-Camejo, J.; Jiménez-Benítez, A.; Mateo, O.; Mora-Sánchez, J.F.; Noriega-Hevia, G.; Sanchis-Perucho, P.; Serna-García, R.; Zamorano-López, N.; et al. Resource recovery from sulphate-rich sewage through an innovative anaerobic-based water resource recovery facility (WRRF). Water Sci. Technol. 2018, 78, 1925–1936. [Google Scholar] [CrossRef] [PubMed]
- González-Camejo, J. , Aparicio, S., Jiménez-Benítez, A., M. Pachés, M.V. Ruano, L. Borrás, R. Barat, A. Seco. Improving membrane photobioreactor performance by reducing light path: Operating conditions and key performance indicators. Water Research, 2020, Volume 172, 115518. [CrossRef]
- Aparicio, S. , González-Camejo, J., Seco, S., Borrás, L., Robles, A., Ferrer, J. Integrated microalgae-bacteria modelling: Application to an outdoor membrane photobioreactor (MPBR). Science of The Total Environment, 2023, Volume 884, 163669. [CrossRef]
- Mora-Sánchez, J.F.; Serna-García, R.; Bouzas, A.; Seco, A.; Ruano, M.V. Anaerobic Membrane Bioreactor for Microalgae and Primary Sludge Co-Digestion at Pilot Scale: Instrumentation, Control and Automation Implementation, and Performance Assessment. Water 2023, 15, 3225. [Google Scholar] [CrossRef]
- APHA. American Public Health Association, American Water Works Association, Water Environment Federation. Standard methods for the examination of water and wastewater, 2012, 22nd., Washington, USA.
- M Cheryan. Ultrafiltration and Microfiltration: Second edition. CRC Press LLC, 1998.
- González-Camejo, J. , Barat, R., Aguado, D., Ferrer, J., 2020. Continuous 3-year outdoor operation of a flat-panel membrane photobioreactor to treat effluent from an anaerobic membrane bioreactor. Water Research, Volume 169, 115238. [CrossRef]
- Rossi, S. , Sforza, E., Pastore, M., Bellucci, M., Casagli, F., Marazzi, F., Ficara, E. Photo-respirometry to shed light on microalgae-bacteria consortia—A review. Rev Environ Sci Biotechnol, 2020; 19, 43–72. [Google Scholar] [CrossRef]
- Judd, S. , Judd, C., 2006. The MBR Book. Chapter 3 - Design. Elsevier Science. Pages 123-162. ISBN 9781856174817. [CrossRef]
- Ortiz-Tena, F. , Ranglová, K., Kubač, D., Steinweg, C., Thomson, C., Masojidek, J., Posten, C., 2021. Characterization of an aerated submerged hollow fiber ultrafiltration device for efficient microalgae harvesting. Eng Life Sci.; 21: 607–622. [CrossRef]
- Soulies, A. , Pruvost, J., Legrand, J.M., Castelain, C., Burghelea, T. Rheological properties of suspensions of the green microalga Chlorella vulgaris at various volume fractions. Rheologica Acta, 2013, 52 (6), pp.589-605. [CrossRef]
- Kestin, J. , Sokolov, M., Wakeham, W.A. Viscosity of liquid water in the range −8 °C to 150 °C. J. Phys. Chem. Ref. Data, 1978; 7, 941–948. [Google Scholar] [CrossRef]
- Ministry of Industry and Tourism; Net price of electricity for domestic use and industrial use: Madrid, Spain, 2023. Available online (in Spanish): https://www.mincotur.gob.es/es-es/IndicadoresyEstadisticas/BoletinEstadistico/Energ%C3%ADa%20y%20emisiones/4_12.pdf. (accessed on 23 October 2023).
- Bunzl; Floquet Aqua: Sant Boi Llobregat, Spain, 2023. Available online (in Spanish): https://www.bunzlspain.com/hipoclorito-sodico-floquet-aqua-150g.html. (accessed on 23 October 2023).
- Parravicini, V.; Nielsen, P.H.; Thornberg, D.; Pistocchi, A. , 2022. Evaluation of greenhouse gas emissions from the European urban wastewater sector, and options for their reduction. Sci. Total Environ., 838, 156322. [CrossRef]
- Eriksson, O. Environmental Technology Assessment of Natural Gas Compared to Biogas. In Natural Gas; Potocnik, P., Ed.; InTechOpen: London, UK, 2010; pp. 127–146. [Google Scholar] [CrossRef]
- Greses, S. , Degradación anaerobia de microalgas procedentes del tratamiento del efluente de un reactor anaerobio de membranas sumergidas (Anaerobic degradation of microalgae from the effluent treatment of a submerged anaerobic membrane reactor), PhD Thesis, Universitat de València, Valencia (Spain), 2017. (In Spanish). [Google Scholar]
- Bremond, U. , Bertrandias, A., de Buyer, R., Latrille, E., Jimenez, J, Escudié, R., Steyer, J.-P., Bernet, N., Carrère, H., 2021. Recirculation of solid digestate to enhance energy efficiency of biogas plants: Strategies, conditions and impacts. Energy Conversion and Management, 231, pp.113759. [CrossRef]
- Muller, O.; Bricker, P.; Laurin, B.; Mouton, L. Climate Change and Electricity, European Carbon Factor, Benchmarking of CO2 Emissions by Europe’s Largest Electricity Utilities, 21st ed.; INIS-FR--22-0804; International Atomic Energy Agency: Vienna, Austria, 2022. [Google Scholar]
- Bright Biomethane, 2023. PUREPAC GRAND. Enschede, the Netherlands. Retrieved June 28th, 2023, from https://www.brightbiomethane.com/.
- Mendez, L. , Garcia D. , Perez E., Blanco S., Munoz R. Photosynthetic upgrading of biogas from anaerobic digestion of mixed sludge in an outdoors algal-bacterial photobioreactor at pilot scale. Journal of Water Process Engineering, 2022, 48, art no 102891. [Google Scholar] [CrossRef]
- Du, X.; Shi, Y.; Jegatheesan, V.; Haq, I.U. A Review on the Mechanism, Impacts and Control Methods of Membrane Fouling in MBR System. Membranes 2020, 10, 24. [Google Scholar] [CrossRef] [PubMed]
| Technology | Advantages | Disadvantages | References |
| Sedimentation | Simple. Low CAPEX and OPEX. |
Poor settling capacity. Low effluent quality. Low biomass concentration. Biomass losses. Time consuming. |
[24,34,37] |
| Coagulation- Flocculation | Proper settling rate. Proper effluent quality. Effective as pre-concentrating step. |
High doses of chemical reagents. Possible photosynthesis inhibition from metallic flocculants. Metal presence in harvested biomass. Poor effluent quality for reuse. |
[28,34,37−40] |
| Electroflocculation | Flocculants not required. | Metal presence in harvested biomass. Emerging technology (low TRL). |
[25,28,41] |
| Magnetic flocculation | Fast, scalable, and efficient. Natural polymers can be added to coat magnetic particles. |
Low efficiency for small particles. Low magnetic capacity lifetime. Emerging technology (low TRL). |
[25,38,39] |
| Bioflocculation | Toxic chemicals are not required. Prevention of microalgae contamination. Bioflocculants are produced from biomass. Genetic engineering can enhance bioflocculants production. |
Factors affecting bioflocculant release remain unclear. Emerging technology (low TRL). |
[25,39] |
| Flotation | Low CAPEX. Low HRT. High cost-effective method. Small footprint. Possible disruption of microalgae (pro for anaerobic valorisation). |
Use of reagents can imply extra cost. Possible disruption of microalgae (con if integrity of biomass is needed). |
[24,39,42] |
| Centrifugation | Quick and simple. Most algal cell types can be harvested. Can be used as second-step harvesting process. |
High energy demand. High CAPEX. Shear stress to microalgae. Low EPS removal. |
[25,35,36,39,43] |
| Filtration |
High effluent quality. Small footprint. Can be combined with pre-harvesting steps. Moderately to high biomass concentration. Depending on the technology and configuration employed, can ensure the integrity of the microalgae or promote the hydrolysis of microalgae. |
Membrane fouling and clogging. Membrane productivity in terms of CAPEX and OPEX. High energy requirements. |
[21,25,26,44−49] |
| Parameter | Unit | Mean ± SD |
|---|---|---|
| Temperature | ºC | 22 ± 6 |
| Inlet gauge pressure (P1) | bar | 2.11 ± 0.04 |
| Outlet gauge pressure (P2) | bar | 0.48 ± 0.02 |
| Transmembrane pressure (TMP) | bar | 1.25 ± 0.02 |
| Initial volume in the feed tank (Vi) | L | 450 ± 65 |
| Initial TSS in the feed tank (TSSi) | g·L−1 | 0.50 ± 0.12 |
| Parameter | Unit | Mean ± SD |
|---|---|---|
| TSSf | g·L−1 | 9.7 ±1.7 |
| CFV | m·s−1 | 1.2 ± 0.3 |
| J20 | LMH | 16 ± 8 |
| Normalised flux (J20:J20,0) | - | 0.49 ± 0.23 |
| K20 | LMH·bar−1 | 13 ± 6 |
| TMPBF | bar | 1.21 ± 0.08 |
| QBF | L·min−1 | 31 ± 8 |
| HV_r | g·m−2·h−1 | 9 ± 3 |
| r | - | 21 ± 6 |
| Cycle duration | h | 25 ± 9 |
| Parameter | Acronym | Unit | Mean ± SD |
|---|---|---|---|
| Energy consumption ratio per harvested algal biomass | ECm_TSS | kWh·kg−1 | 1.51 ±0.64 |
| Energy consumption ratio per treated volume of pre-concentrated microalgae culture | ECv_HV | kWh·m−3 | 0.76 ± 0.32 |
| Energy consumption ratio per total treated volume in the WRRF | ECv_WRRF | kWh·m−3 | 0.39 ± 0.16 |
| Sodium hypochlorite consumption per total treated volume in the WRRF | NaOClCV_WRRF | g Cl·m−3 | 0.97 ± 0.39 |
| Operating expenses of energy and sodium hypochlorite per total treated volume in the WRRF | OPEXEC+Cl | €·m−3 | 0.082 ± 0.034 |
Disclaimer/Publisher’s Note: The statements, opinions and data contained in all publications are solely those of the individual author(s) and contributor(s) and not of MDPI and/or the editor(s). MDPI and/or the editor(s) disclaim responsibility for any injury to people or property resulting from any ideas, methods, instructions or products referred to in the content. |
© 2023 by the authors. Licensee MDPI, Basel, Switzerland. This article is an open access article distributed under the terms and conditions of the Creative Commons Attribution (CC BY) license (http://creativecommons.org/licenses/by/4.0/).


