1. Introduction
Terrestrial vegetation is an important part of the earth’s ecosystem. It releases oxygen through photosynthesis, which is an important source of oxygen on earth. Moreover, terrestrial vegetation also has a positive impact and feedback on the carbon cycle, nitrogen cycle and water cycle (
DAVID 1995;
Hughes et al. 2001;
Tong et al. 2016). There are many factors affecting vegetation variations, among which climate changes and human activities are the two most important categories (
Jiang et al. 2018;
Sun et al. 2015;
Wang et al. 2015;
Zhao et al. 2018). For one thing, it is generally believed that climate is an important factor in vegetation change. Rainfall and temperature are the main climate variables as claimed in many previous studies (
PEI et al. 2012;
Wang et al. 2015;
Yu et al. 2020). For another thing, with the growth of the economy and population, more and more studies demonstrate that human activities are the key factors causing vegetation changes (
Feng et al. 2015;
Lü et al. 2015;
Wang et al. 2016). One of the most representative human activities is the rapid expansion of urbanization. The population in urban areas has increased rapidly from 14% in 1900 to 50% in 2000 of the total population, in particular, it has reached 70% in developed countries (
Kinsella 2001;
McIntyre 2000). From regional to global scales, the urbanization process and related suburban development not only have a significant impact on our living environment but also inevitably bring changes to the vegetation ecological environment.
As an effective method to replace time-consuming and laborious field experiments, remote sensing technology has the advantages of fast data acquisition and a wide detection range, which facilitates the use of a wide range of large-area vegetation monitoring (
Hunt et al. 2004). Many researchers use the Normalized Difference Vegetation Index (NDVI) calculated by the near-infrared and red bands to monitor the growth and coverage of vegetation (
Lamchin et al. 2018), which is helpful to analyze the problems in the ecological environment. Sun et al. (
Sun et al. 2013) and Huang et al. (
Huang et al. 2016) indicated that climate factors have an important impact on vegetation change with high spatial-temporal heterogeneity. Precipitation has a positive effect on vegetation, while temperature has a negative effect based on the NDVI in the Qinghai Tibet Plateau. Many scholars have used NDVI to conduct in-depth research on how climate (
Pettorelli et al. 2012;
Xu n.d.), topography (
Corenblit and Steiger 2009), land use and human activities (
Chen et al. 2019;
Xu et al. 2018) affect vegetation growth.
Beijing is located in the transition zone between the mountain and the plain. The plain area is surrounded by mountains on three sides, forming a natural arc barrier, resulting in two distinct climate in front of and behind the mountains. In the past decades, the population and economy have developed rapidly. And the process of urbanization has been accelerated. With the rapid urban expansion in Beijing plain area, the mountainous area of Beijing is ecological conservation, an important biodiversity center, a water source protection area, as well as the main natural vegetation distribution area. According to the ecological situation and the current needs of urban development, the government has formulated several development plans of "Five-Year" to ensure that the eco-environment is fully protected and improved while Beijing’s economy is developing rapidly. Therefore, it becomes more and more important to explore the relative role of climate variables and human activities in vegetation changes and the correlation between urbanization expansion and vegetation growth trends in Beijing.
Under the influence of global climate change, Beijing has also experienced rapid economic development and is facing complex ecological problems. In recent years, many works are studying the patterns and driving factors of vegetation variations in Beijing. Zhao Y et al. (
Zhao et al. 2019) found that the vegetation in Beijing had an overall increasing trend and the NDVI fluctuations in several particular years were greatly related to temperature or precipitation anomalies based on geographically weighted regression and ordinary least squares during 2000-2015. Jiang M et al. (
Jiang et al. 2017b) calculated the fractional vegetation coverage by the method of dimidiate pixel model based on NDVI, which suggests that human activities are very significant factors to influence and explain the changes in Beijing and they are highly spatially heterogeneous from 2000 to 2015. Chang Y et al. (
Chang et al. 2020b) considered that the response of vegetation to urbanization showed obvious differences and geographical heterogeneity in the urbanization gradient based on the nighttime light data. Nevertheless, these works do not continue into the latest year and quantify the role of human activities and climate factors in the process of vegetation restoration and degradation in Beijing. Moreover, there are few studies on integrating impervious surface data and NDVI data to explore how vegetation changes in rapid urbanization.
For a fast-developing city, quantitative and continuous research about the influence of climate variability and rapid urbanization on vegetation change is of great significance. Based on the NDVI dataset, meteorological data, and impervious surface data in recent 20 years, we aim to: (1) investigate the spatiotemporal patterns of vegetation change trends by using Theil Sen and Mann Kendall methods excluding the influence of water; (2) evaluate the dominant factors of affecting vegetation change in the mountains by using residual trend analysis approach; (3) explore the trend of vegetation growth in different stages of urban development. The results help to understand the current vegetation driving mechanism and provide a scientific basis for formulating reasonable vegetation construction, land use, and ecological environment protection strategies in Beijing.
2. Materials and Methods
2.1. Study Area
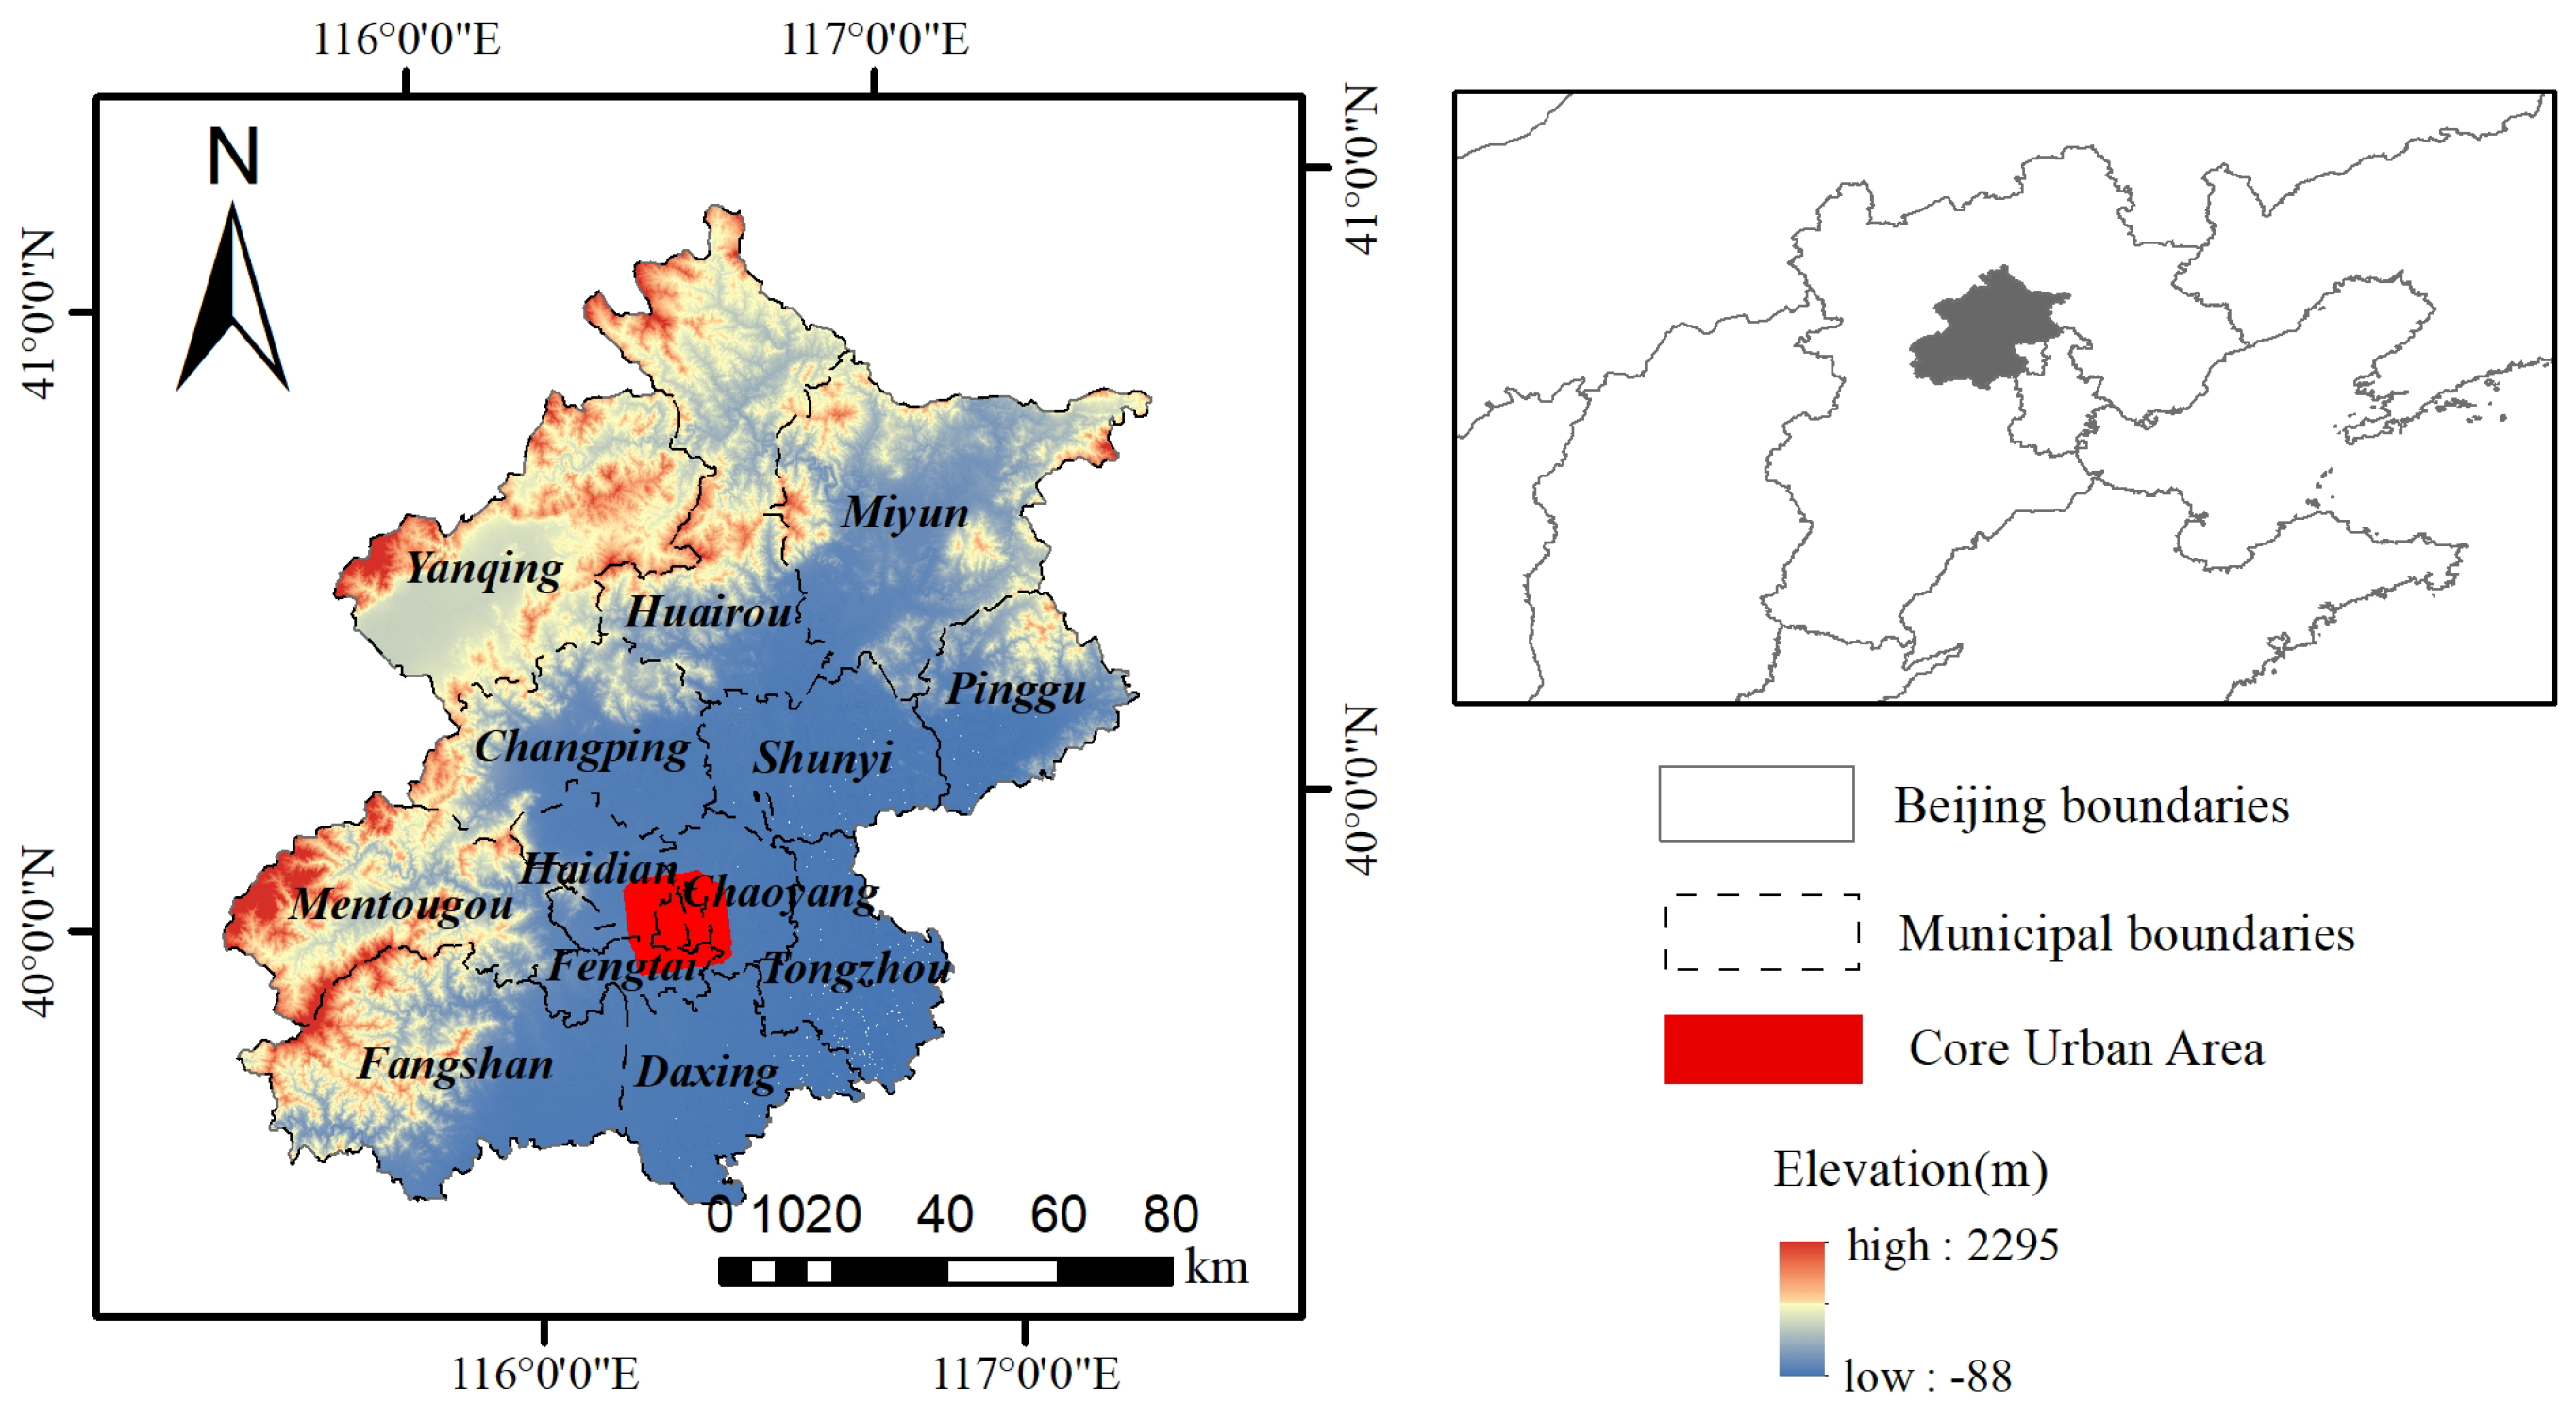
Surrounded by Taihang Mountains and Yanshan Mountains, Beijing (115.7°-117.4°E, 39.4°-41.6°N) lies on the north of North China Plain (
Figure 1). The total area of Beijing is 16410.54
, of which the plain area is 6200
, accounting for 38%, and the mountainous area is 10200
, accounting for 62%. The average altitude of the whole city is 43.5 meters with a plain elevation of 20-60m and a mountain elevation of 1000-1500m generally. The city has a typical North Temperate semi-humid continental monsoon climate which is hot and rainy in summer, cold and dry in winter, and short in spring and autumn. The annual average precipitation is about 450mm with 80% of the annual precipitation occurring in June, July, and August. The temperature in July is the highest, and that in January is the lowest. Although it is cold and dry in winter, there is more sunshine, with the average sunshine being more than 6 hours per day. Beijing is divided into 16 districts(counties), including high-intensive building area, low-intensive building area and mountain area. The area within Fourth-Ring Road is referred to as the high-intensive building area. The area with slope greater than 8 degrees is the mountain area. And the remaining area is the low-intensive building area.
2.2. Data
2.2.1. MODIS-NDVI Dataset and Preprocessing
We used Moderate-resolution Imaging Spectroradiometer (MODIS) Terra 16-day vegetation index product–250m NDVI (MOD13Q1) in the manuscript from Land Processes Distributed Active Archive Center. The product has minimized the effect of cloud, cloud shadows, and noise through 16 days of synthetic data. Three MODIS tiles (h26v04, h26v05, and h27v05), 240 images in total, are used in this study from 2000 to 2019.
The three tiles are spliced together, and the NDVI data of Beijing is cut out using the Beijing boundary map as a mask. According to the previous research (
Xueying 2010), the vegetation in Beijing reached the peak growth stage in July and August. The Maximum Value Composites (MVC) (
Wang and Zhu 2019) was utilized to process the data. The maximum value of the data was taken in July and August respectively. The mean value of July and August is calculated to represent the vegetation growth in that year and further used in the subsequent time series analysis.
2.2.2. Landsat Imagery and Preprocessing
Water body has a great influence on NDVI time series, even sub-pixel water body has a great influence on NDVI. In order to avoid the influence of water body as much as possible, the water body is extracted by the Landsat images in Beijing. Beijing is covered by two (123/032 and 123/033) WRS2 paths/rows of Landsat images. A total of 717 Landsat surface reflectance images from 2000 to 2019 are collected in this study (
http://earthexplorer.usgs.gov/). All the data details are listed in
Table 1. CFMask algorithm was used to detect and remove snow, cloud, and cloud shadow for Landsat Image (
Foga et al. 2017;
Zhu et al. 2015;
Zhu and Woodcock 2012). NDVI (
Tucker 1979) and Enhanced Vegetation Index (EVI) (
Huete et al. 2002,
1997) respond rapidly to canopy structure changes and are sensitive to high biomass areas (
Huete et al. 2002). Modified Normalized Differences Water Index (MNDWI) is widely used to evaluate surface water information (
Xu 2006).
According to (
Zou et al. 2017,
2018), if the conditions satisfied ((MNDWI > NDVI or MNDWI > EVI) and (EVI < 0.1)), the observation results could be determined as open surface water. The interannual frequency of open surface water was calculated for each pixel and classified the pixels as open surface water if the interannual frequency was greater than or equal to 0.75 (
Zou et al. 2017,
2018). Therefore, we generate 20 water body maps from 2000 to 2019 and select the map with the largest open surface water area as the water mask. The nearest neighbor method is implemented to resample to 250m in order to match MODIS vegetation index data.
2.2.3. Climate Data
The climate data from 2000 to 2019 come from the National Earth System Science Data Center, National Science & Technology Infrastructure of China (
http://www.geodata.cn). Based on the global 0.5 ° climate data released by Climatic Research Unit (CRU) and the global high-resolution climate data released by WorldClim, the dataset was downscaled in China through Delta spatial downscaling scheme (
Peng et al. 2019). The data of 496 independent meteorological observation points were used for verification, and the verification results are credible. To match MODIS data, these datasets were bilinear interpolated from 1km to 250m resolution.
2.2.4. Impervious Surface Data
The long-term impervious surface data is used to quantify city expansion and investigate the response of vegetation change trends to urbanization in this study. Impervious surface is an important part of the urban foundation surface, revealing the changes in the conurbation area better (
Shahtahmassebi et al. 2012). Based on Landsat images, Gong et al. (
Gong et al. 2020) developed impervious surface data of Chinese provinces with 30m resolution spatially, covering the period from 1985 to 2018 (Impervious surface data download website:
http://data.ess.tsinghua.edu.cn). The impervious surface data of Beijing from 2000 through 2018 were selected to keep consistent time with the MODIS-NDVI product in this study. We aggregated the impervious surface data into 250 m resolution to match MODIS data spatially and calculated the impervious surface ratio (ISR) in each pixel. The impervious surface ratio (ISR) of conurbation demonstrates the complicacy of the city eco-environment and the extent of urban development (
Arnold Jr and Gibbons 1996;
Ridd 1995).
2.2.5. SRTM DEM Data
InSAR technology was applied in the SRTM mission to obtain elevation information of surface features for its efficiency and economical characteristics. The SRTM data used the WGS84 coordinate system as the horizontal reference and the EGM96 geoid as the vertical reference. By far it’s the best global digital elevation data comprehensively evaluated in terms of coverage, elevation accuracy, and publicity. Since 2003, SRTM3 with a ground resolution of 90 meters has been released. We also resample it to 250m, calculate the slope, and select the slope threshold value as 8 to distinguish mountainous areas (
Niu et al. 2009).
2.3. Methods
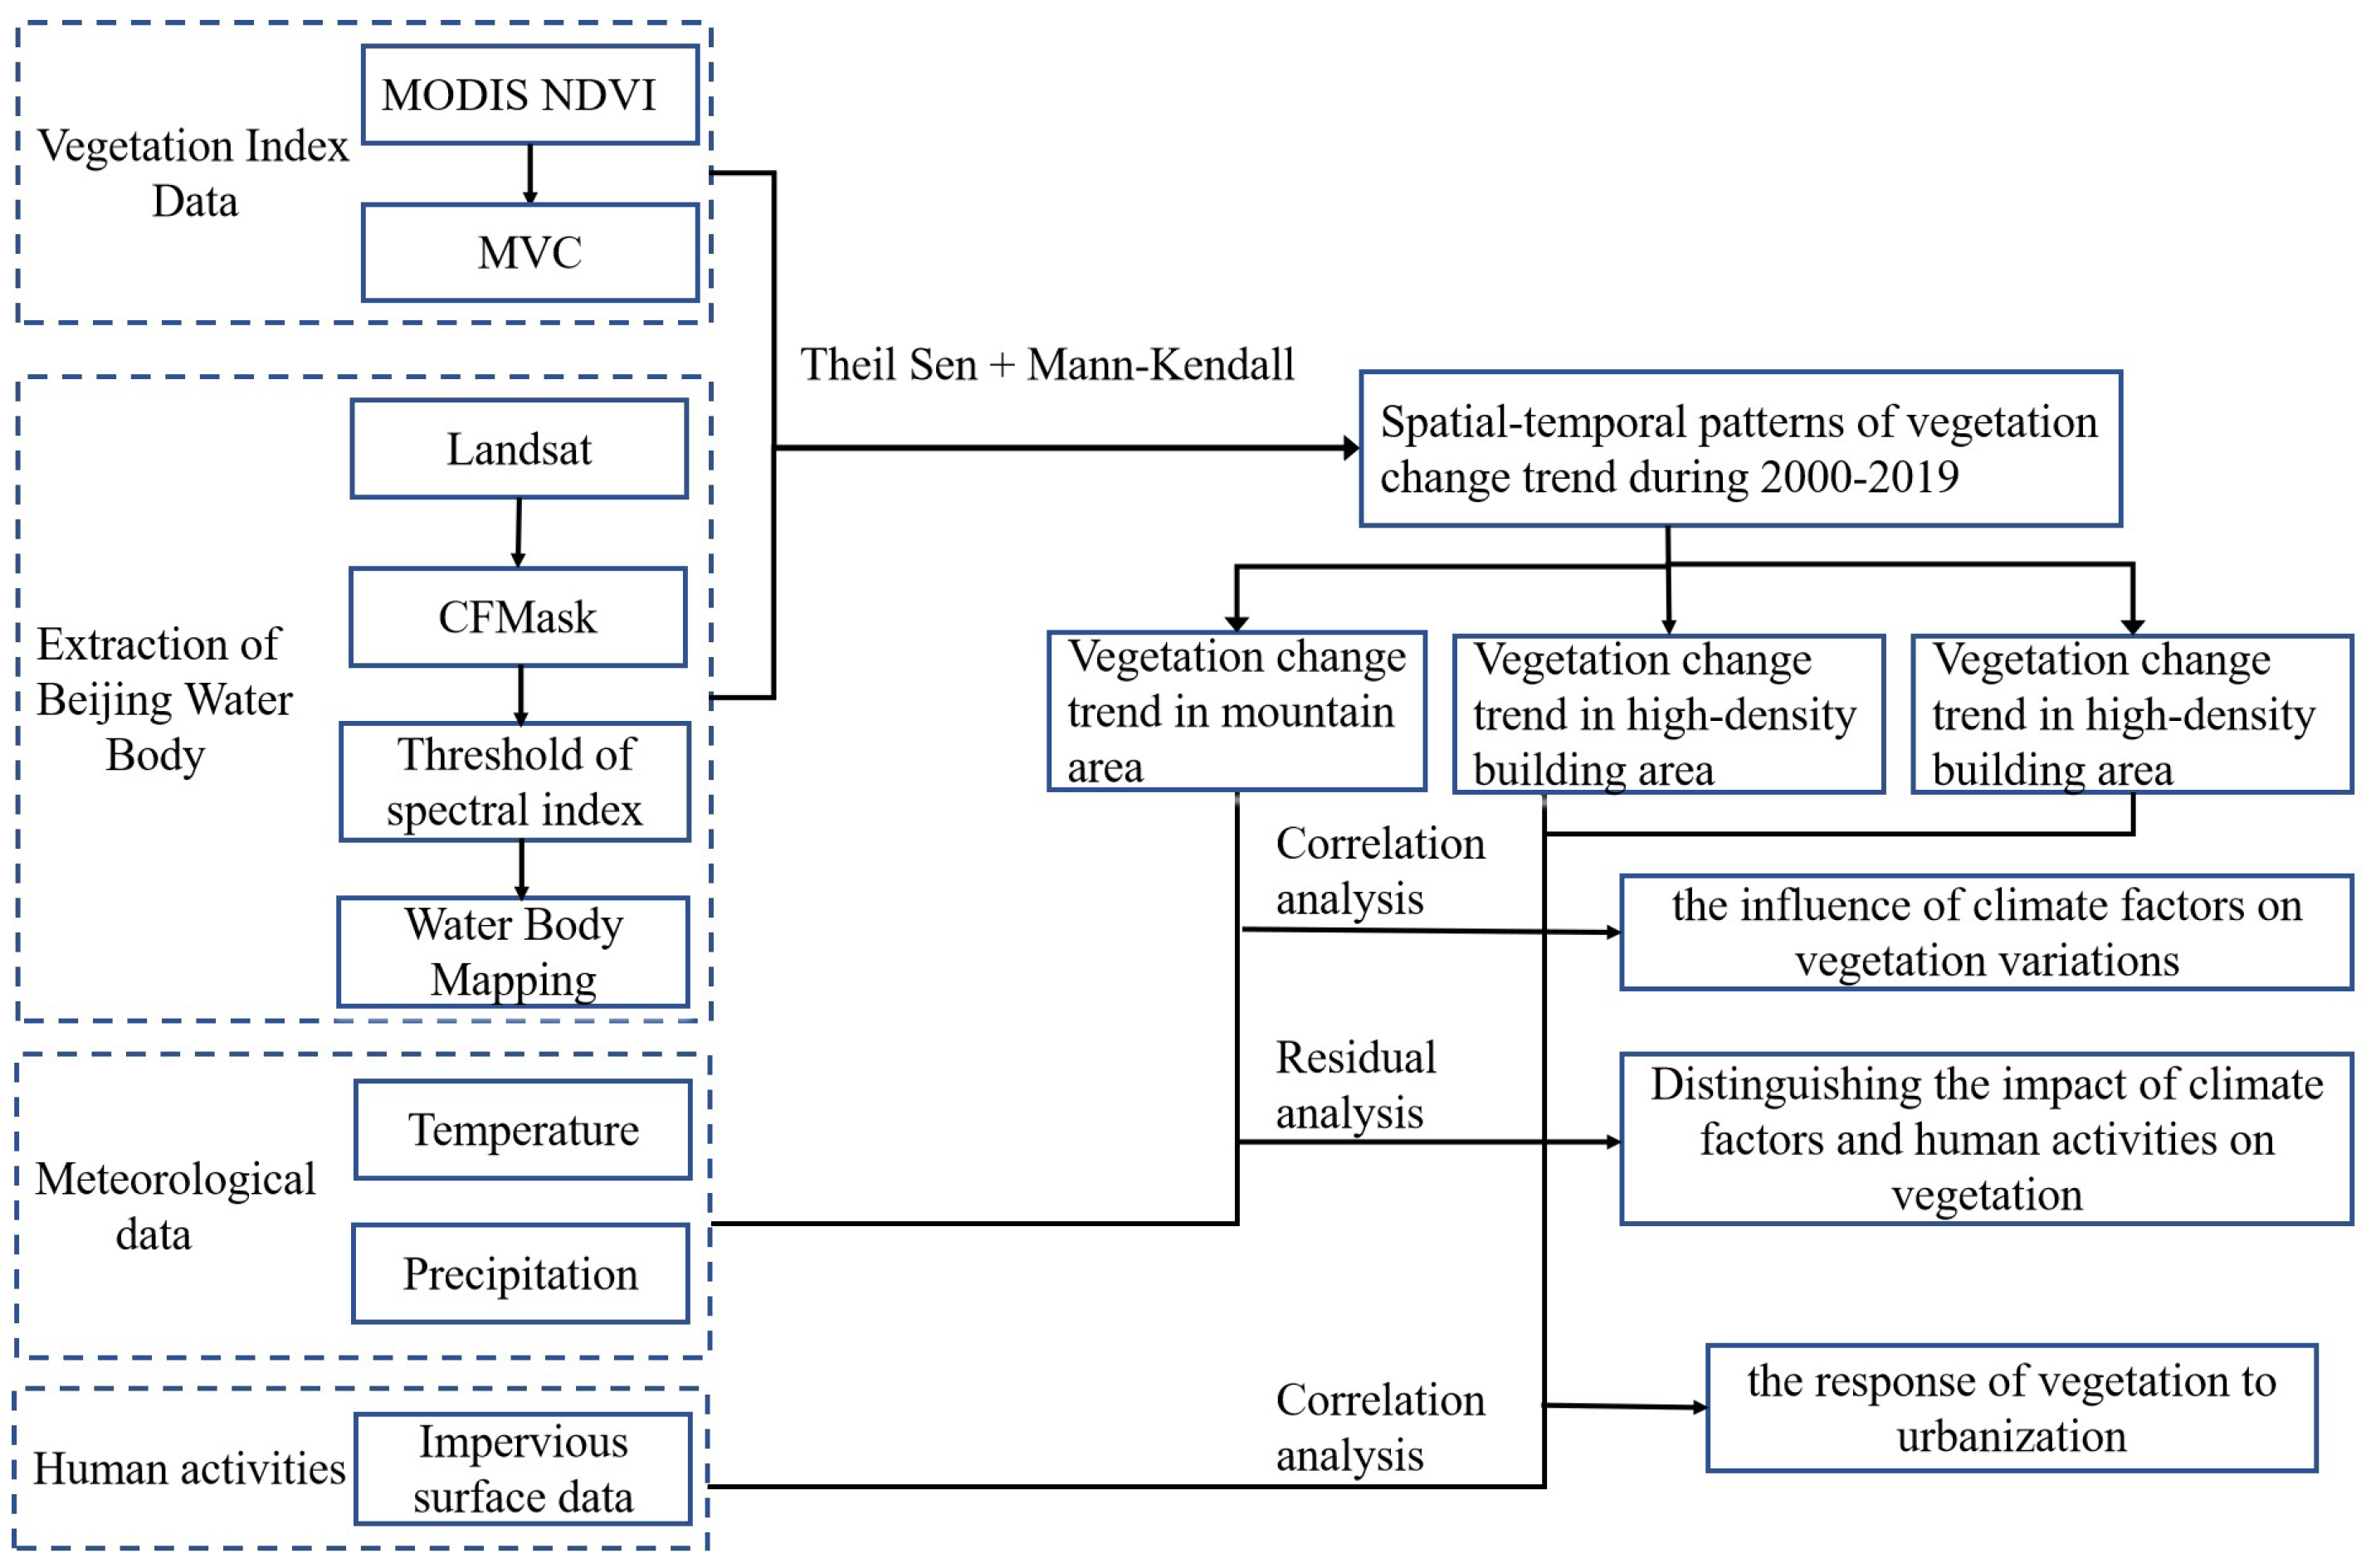
As shown in
Figure 2, the study first calculates the slope and Student’s
t test value of the NDVI variable for each pixel during 2000-2019 to obtain change trends of vegetation by Theil-Sen and Mann-Kendall method. In the mountain area, the meteorological data is utilized to analyze the influence of climate factors on vegetation variations by correlation analysis method. And residual analysis is used to distinguish the impact of climate factors and human activities on vegetation. In high and low-intensive building areas, the impervious surface data is leveraged to study the response of vegetation to urbanization by correlation analysis.
2.3.1. Variation Trend Judgement
In this study, the Theil-Sen slope is acquired to get the trend of greenness and meteorological variables (temperature and precipitation). Compared to the least square linear fitting method, TS trend analysis is not affected by noise and outliers in the data (
Fensholt et al. 2012;
Sen 1968;
Theil 1950), and it’s a widespread method in time series trend analysis of climate variables (
Martinez et al. 2012;
Tabari et al. 2011). The Theil-Sen slope is estimated based on the median value of the observations
and
at all pairwise time steps
j and
i. The formula is as follows:
where
and
represent the value of NDVI, annual accumulated precipitation or annual average temperature in the
i-th and
j-th year respectively. For NDVI variation,
>0 means greenness restoration and
<0 means greenness degradation. For meteorological variables,
>0 represents precipitation or temperature increase , and
<0 represents precipitation or temperature decrease.
As a common method, we calculate the value of the Mann-Kendall method to test significance because the method has no requirement on the distribution (
Kendall 1938). The inspection process is as follows:
For the sequence, the test statistic
S is:
where
n is the length of the sequence,
and
are the observations at
i and
j time respectively. When the data value has independent identically distribution ,
S is the normally distributed approximately, and the variance is given by the following formula (
Kendall 1948;
Mann 1945):
where
is the standard deviation.The significance of the test method is given by the statistical value
Z:
where
(equivalent to
) is considered as of significance.
According to the vegetation greenness changes and the significance analysis, vegetation change results are classified into four groups: significant restoration, restoration, degradation and significant degradation. Mann-Kendall tau () coefficient is adopted to investigate the correlations between two random variables as known as Kendall rank correlation coefficient.
2.3.2. Residual Analysis
Residual analysis is utilized to separate human-induced vegetation trends from the vegetation changes caused by climate through "NDVI-Climate" model. Considering the correlations between NDVI and meteorological variables, the "NDVI-Climate" model is established by multiple linear regression in every pixel (
Qu et al. 2018).
where
n is year;
C is a constant;
a and
b are correlation coefficients of annual average temperature (
T) and accumulated precipitation (
P) of that year respectively.
a,
b and
C are calculated by the least square method.
The NDVI of climate-driven vegetation change is predicted by the "NDVI-Climate" model. And the residual represents the NDVI of human-driven vegetation trend (
Evans and Geerken 2004;
Ibrahim et al. 2015;
Jiang et al. 2017a).
where
is the predicted value of the model in a specific year with temperature and precipitation impacts, and
is the value of anthropogenic NDVI variation during 2000-2019.
According to Theil-Sen method, we calculate the slopes of
and
as
and
, respectively. We also calculate the slope of actual NDVI as
. Therefore, the six types of impact factors on vegetation dynamics were determined (
Table 2). Specifically,
>0 indicates vegetation increases and
<0 indicates vegetation decreases.
>0 represents that climate factors have a positive impact on vegetation, while
<0 represents that climate factors have a negative impact on vegetation;
>0 represents that human activities have a positive impact on vegetation, and
<0 represents that human activities have a negative impact on vegetation (
Wang et al. 2019a).
2.3.3. Correlation Analysis
Considering the spatial distribution of vegetation change trend results, Mann-Kendall coefficient correlation analysis is adopted to study the correlation between NDVI and ISR in high and low-intensive building areas and the correlation between NDVI and climate variables in the mountain area. The coefficient of the Mann-Kendall method is also called the Kendall rank correlation coefficient, which is used to test the statistical correlation of the observation values of two random variables, especially for small sample size.
3. Results
3.1. Spatial-temporal Characteristics of Vegetation Change Trend
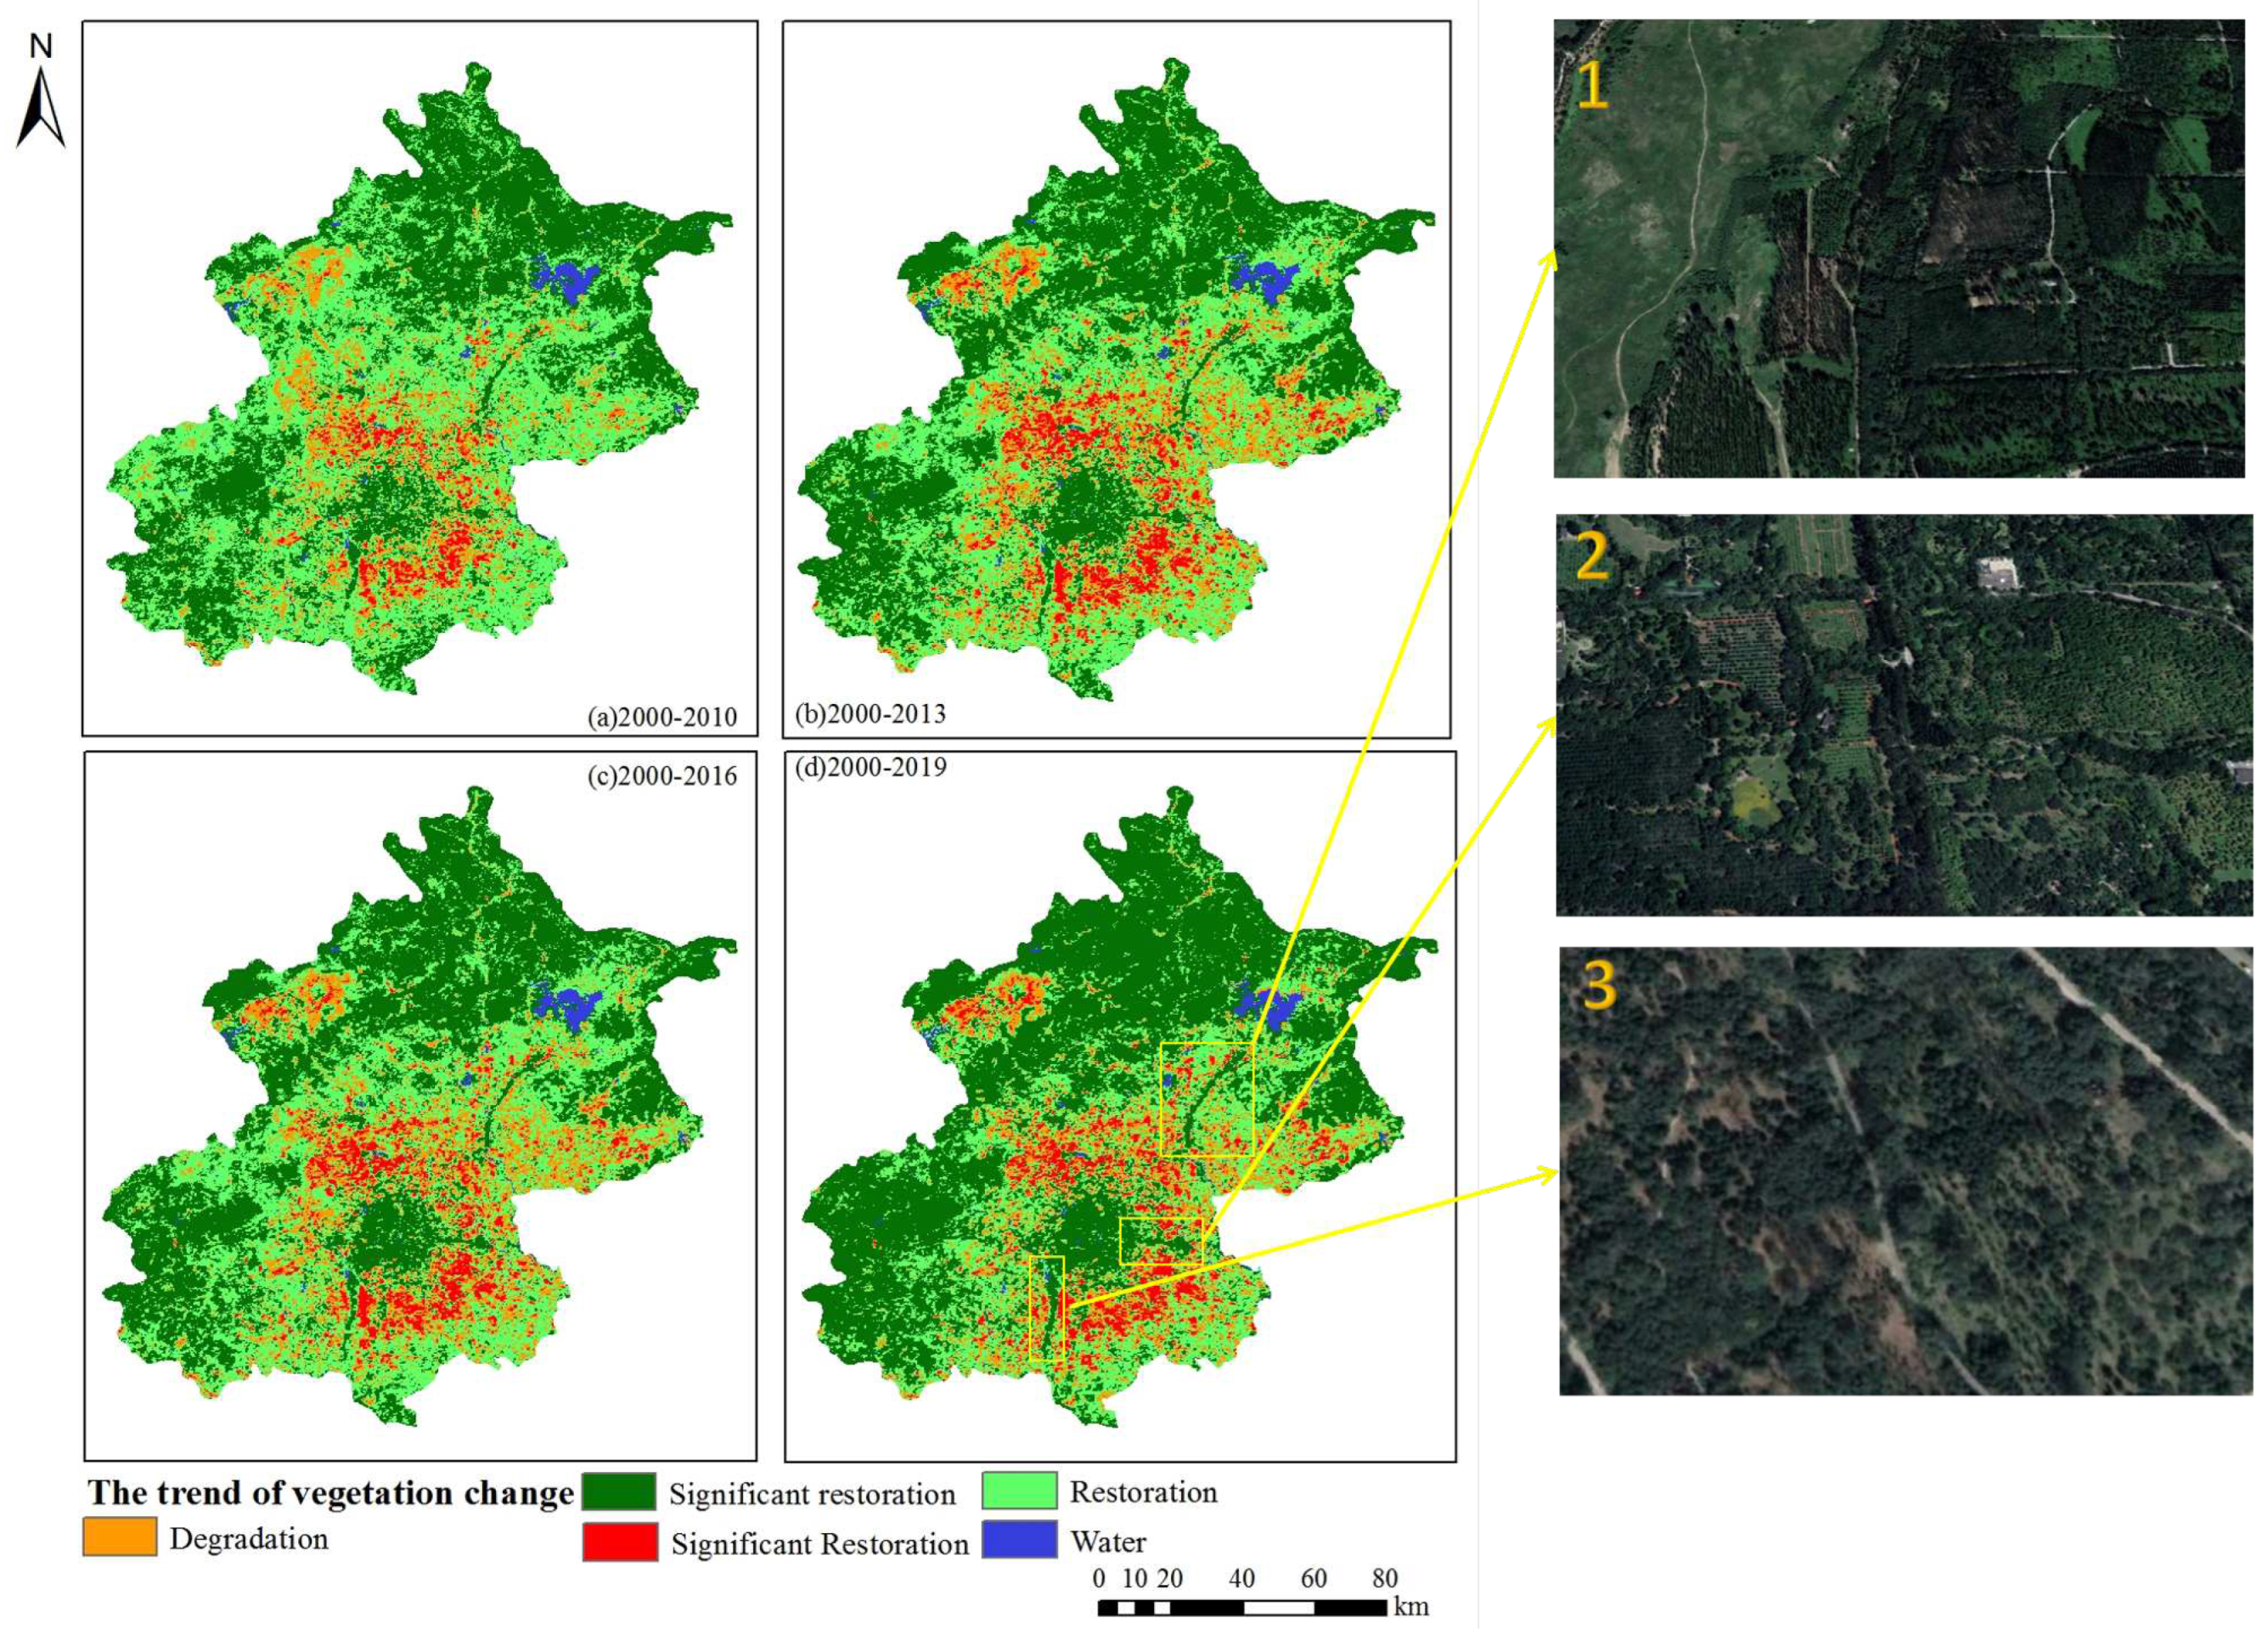
The change trends of vegetation in Beijing during four periods are shown in
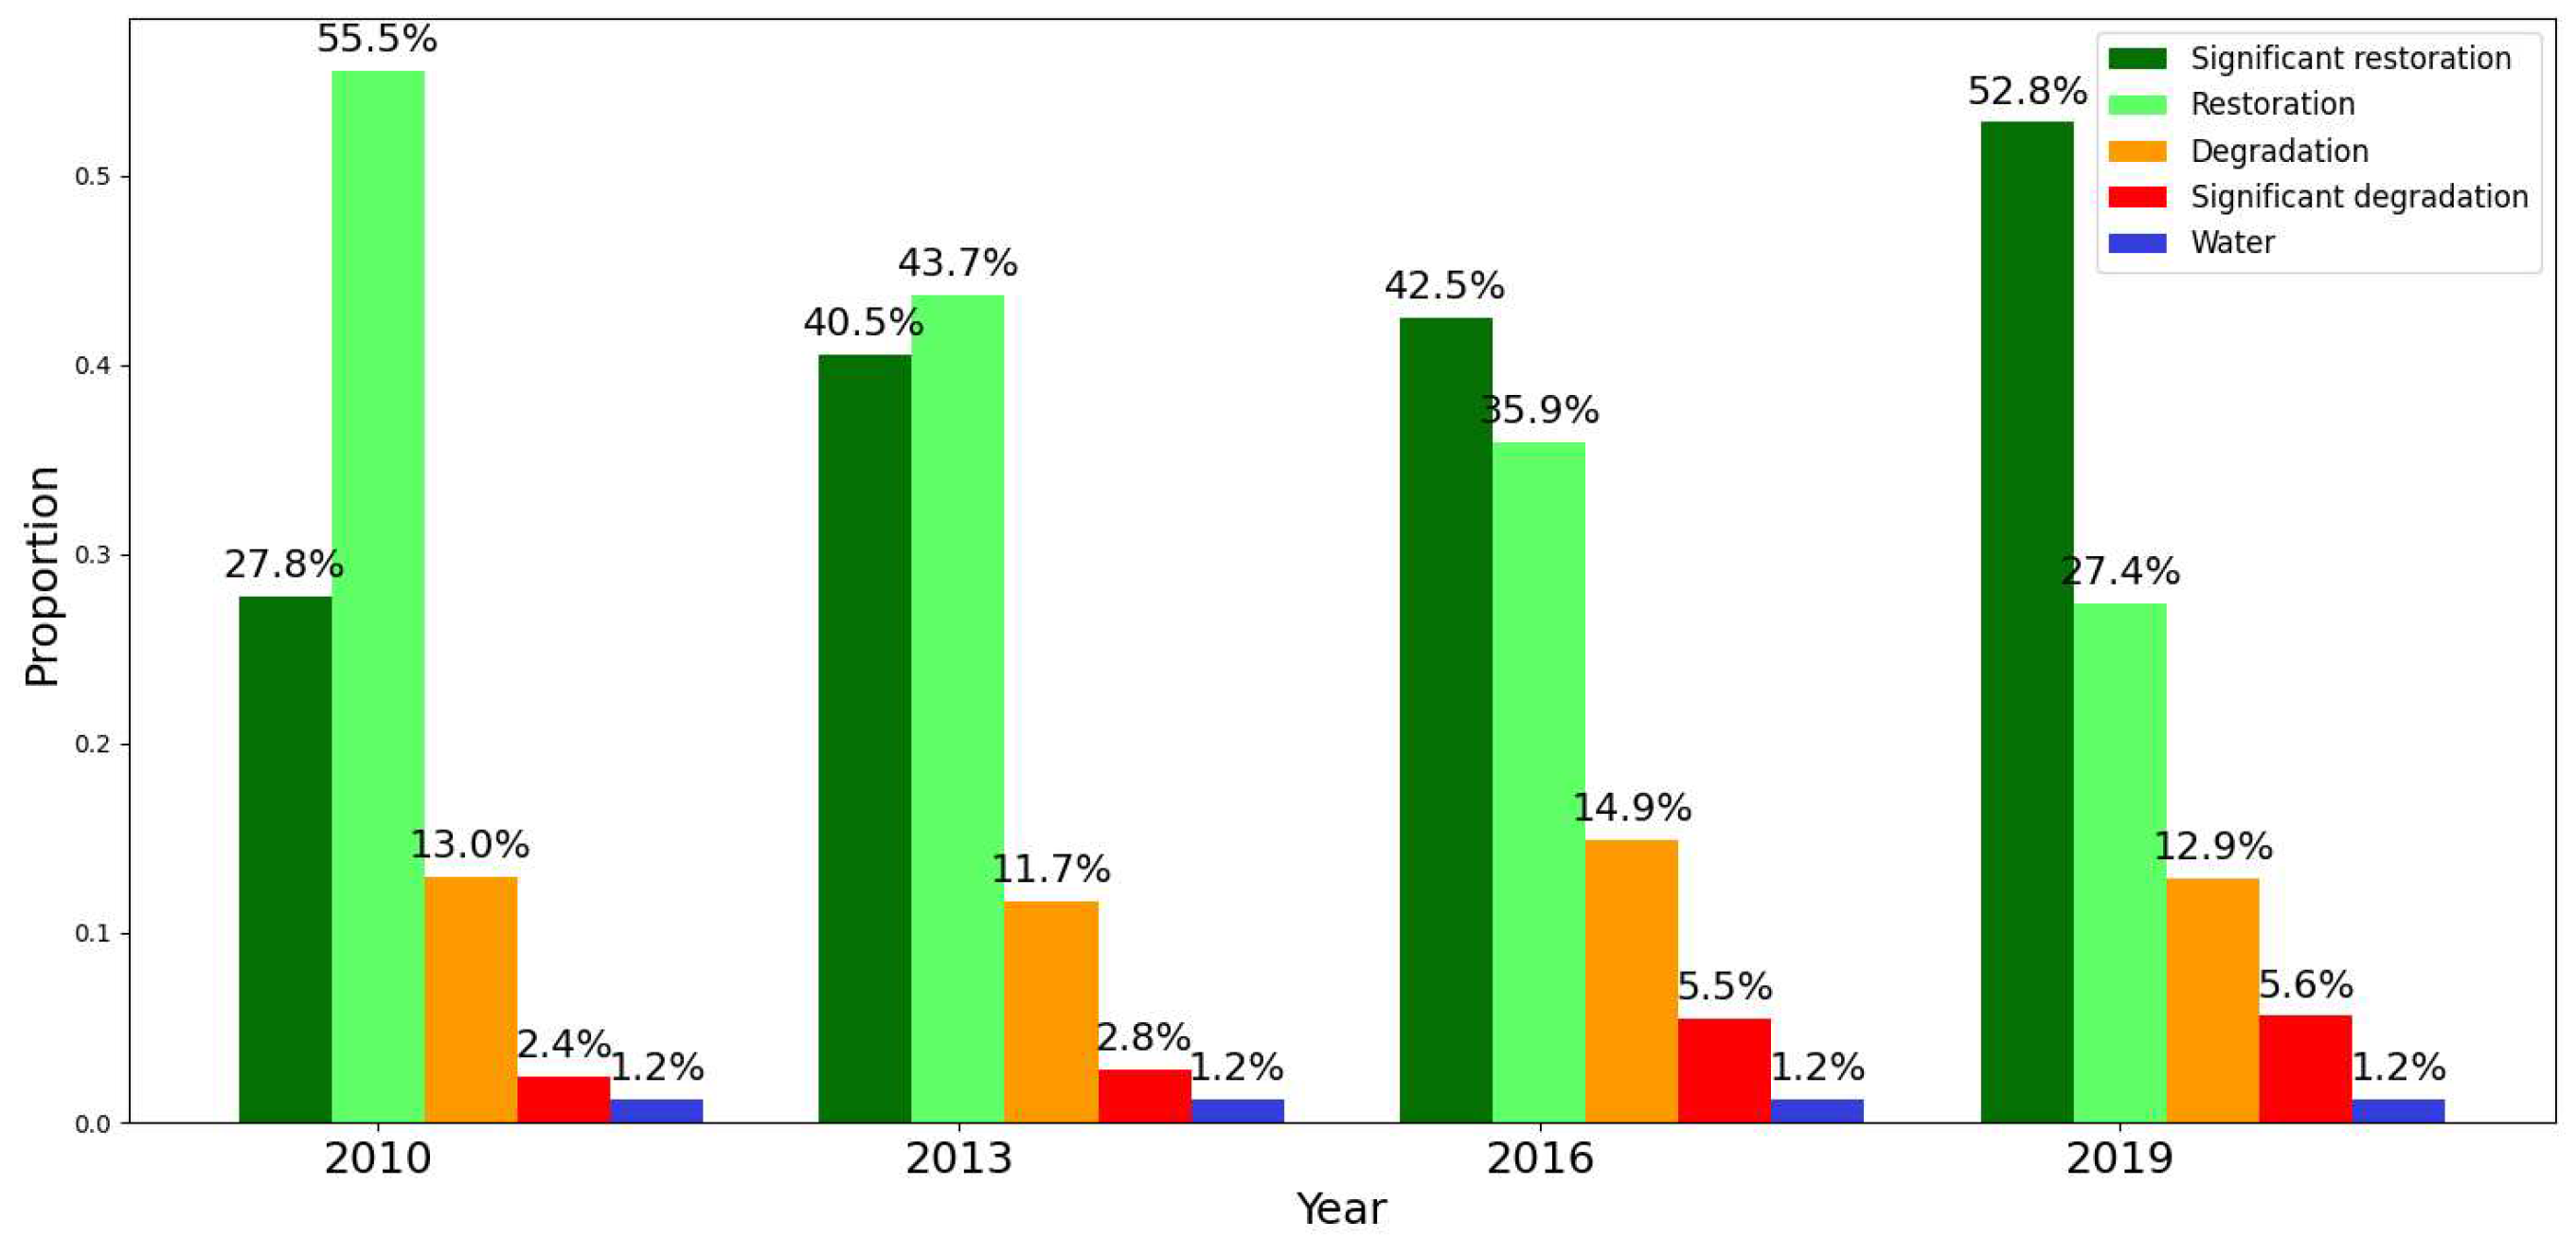
Figure 3 including 2000-2010,2000-2013,2000-2016,2000-2019. The corresponding statistical results of vegetation trends are shown in
Figure 4. It can be seen that the vegetation in Beijing is totally improved. The vegetation increase is mainly concentrated in mountainous areas and high-intensive building areas. Vegetation degradation, especially the significantly degraded vegetation, is mainly concentrated in low-intensive urban areas. The significant restoration area changes from 27.8% in 2010 to 52.8% in 2019, and the restoration area changes from 55.5% in 2010 to 27.4% in 2019, which indicate that a large area of vegetation restoration has changed into significant restoration in recent years. The increase of vegetation in some urban forest parks (
Figure 3 1 2 3) shows that the construction of urban parks plays a positive role in vegetation growth. At the same time,the significant degradation area changes from 2.4% in 2010 to 5.6% in 2019,and the degraded area changes from 13% in 2010 to 12.9% in 2019, which is because that the vegetation growth situation in low-intensive urban areas of Beijing is not optimistic.
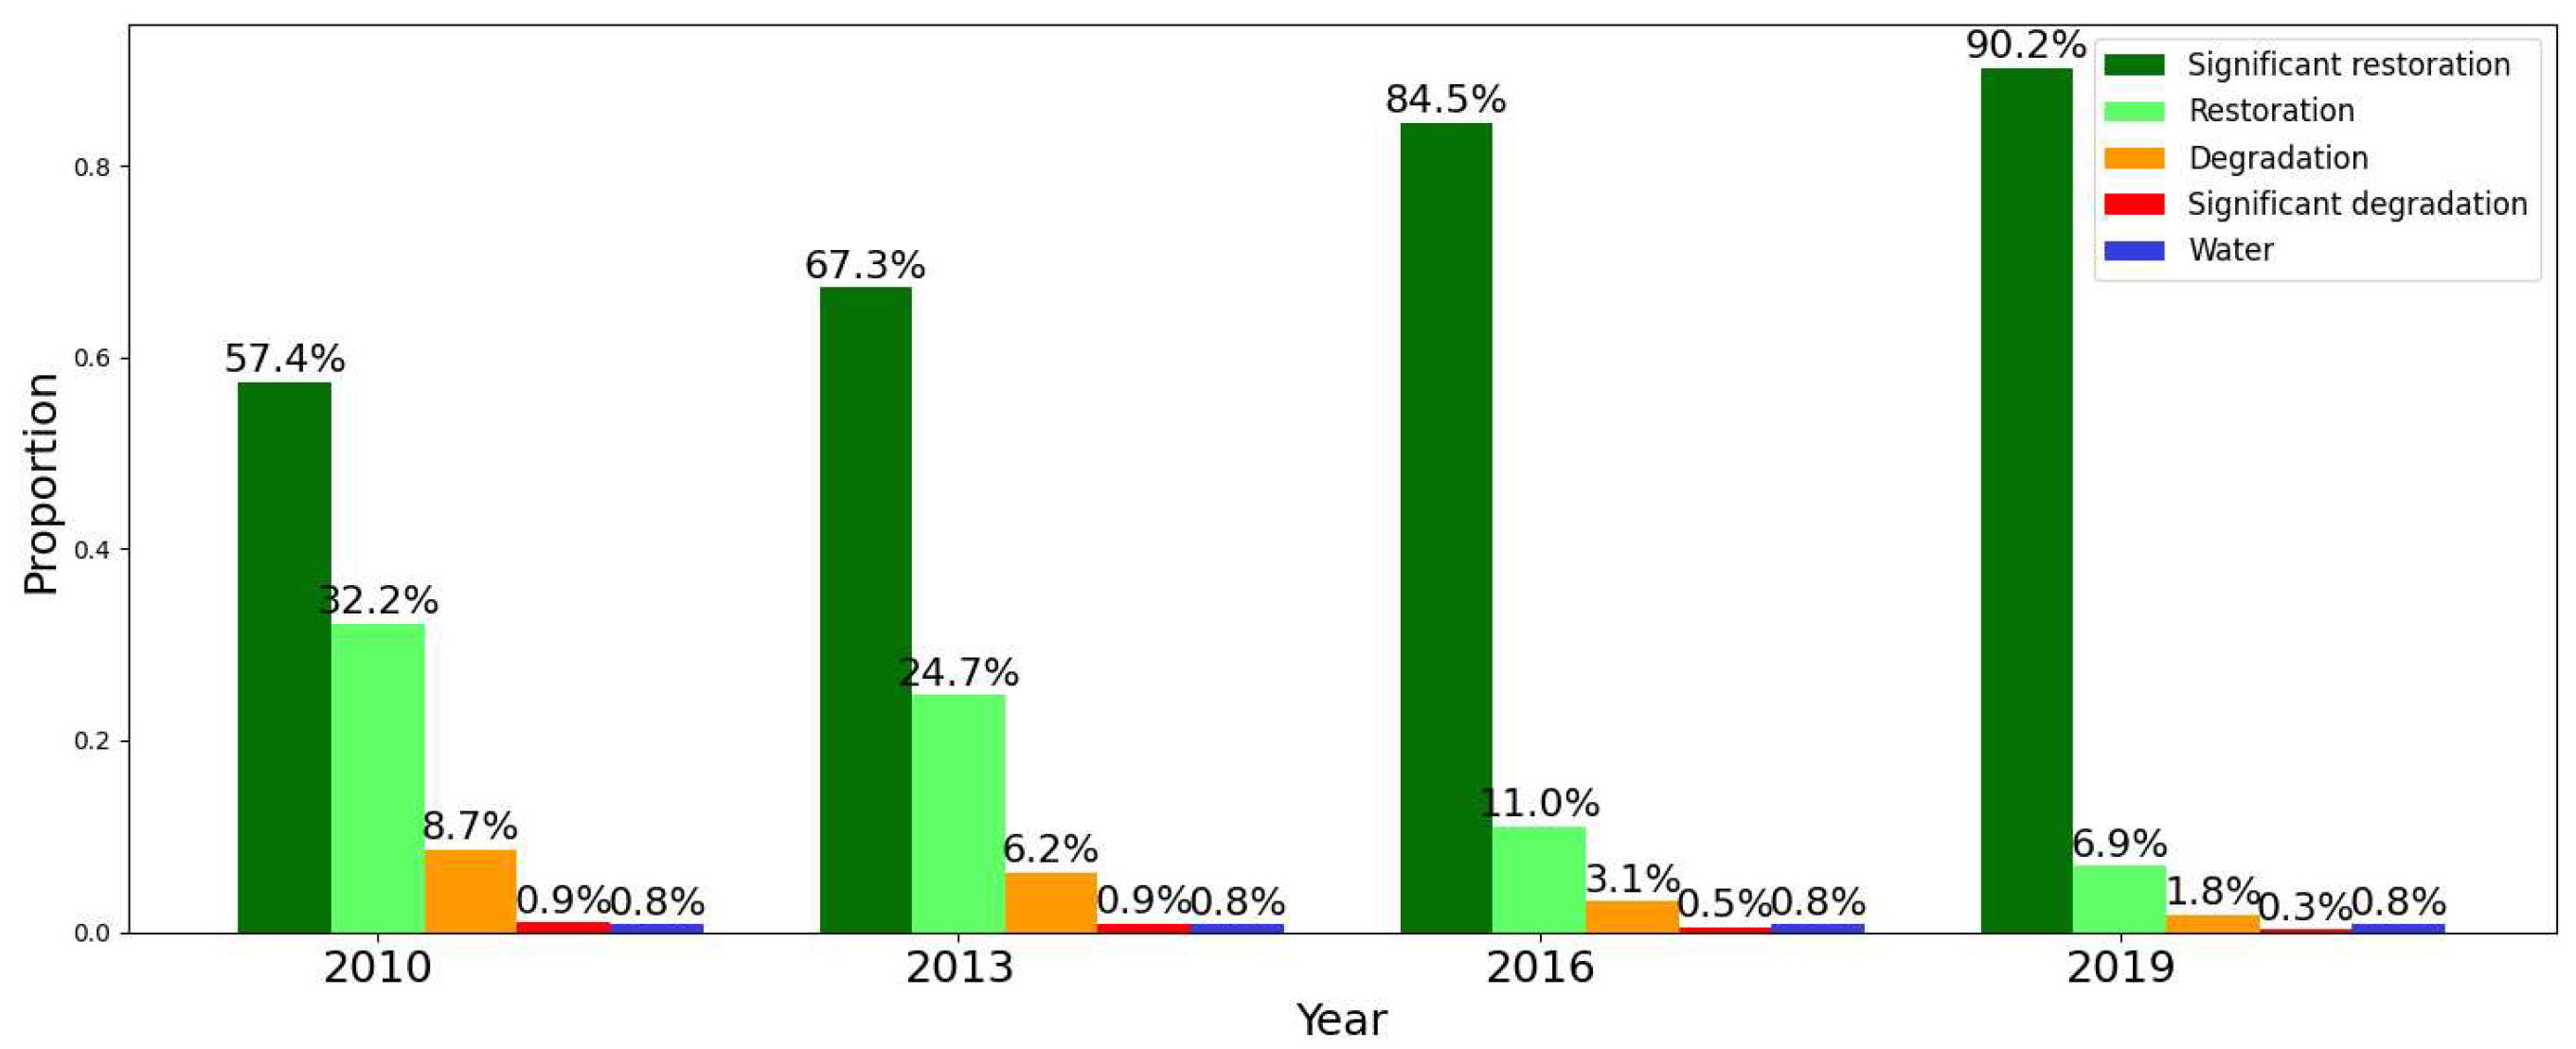
We counted the vegetation changes in high-intensive building areas, mountainous areas and low-intensive building areas respectively from 2000 to 2010, 2000 to 2013, 2000 to 2016 and 2000 to 2019. In the high-intensive building area, significant restoration is increasing continuously with 57.4% in 2010, 67.3% in 2013, 84.5% in 2016, and 90.2% in 2019 (
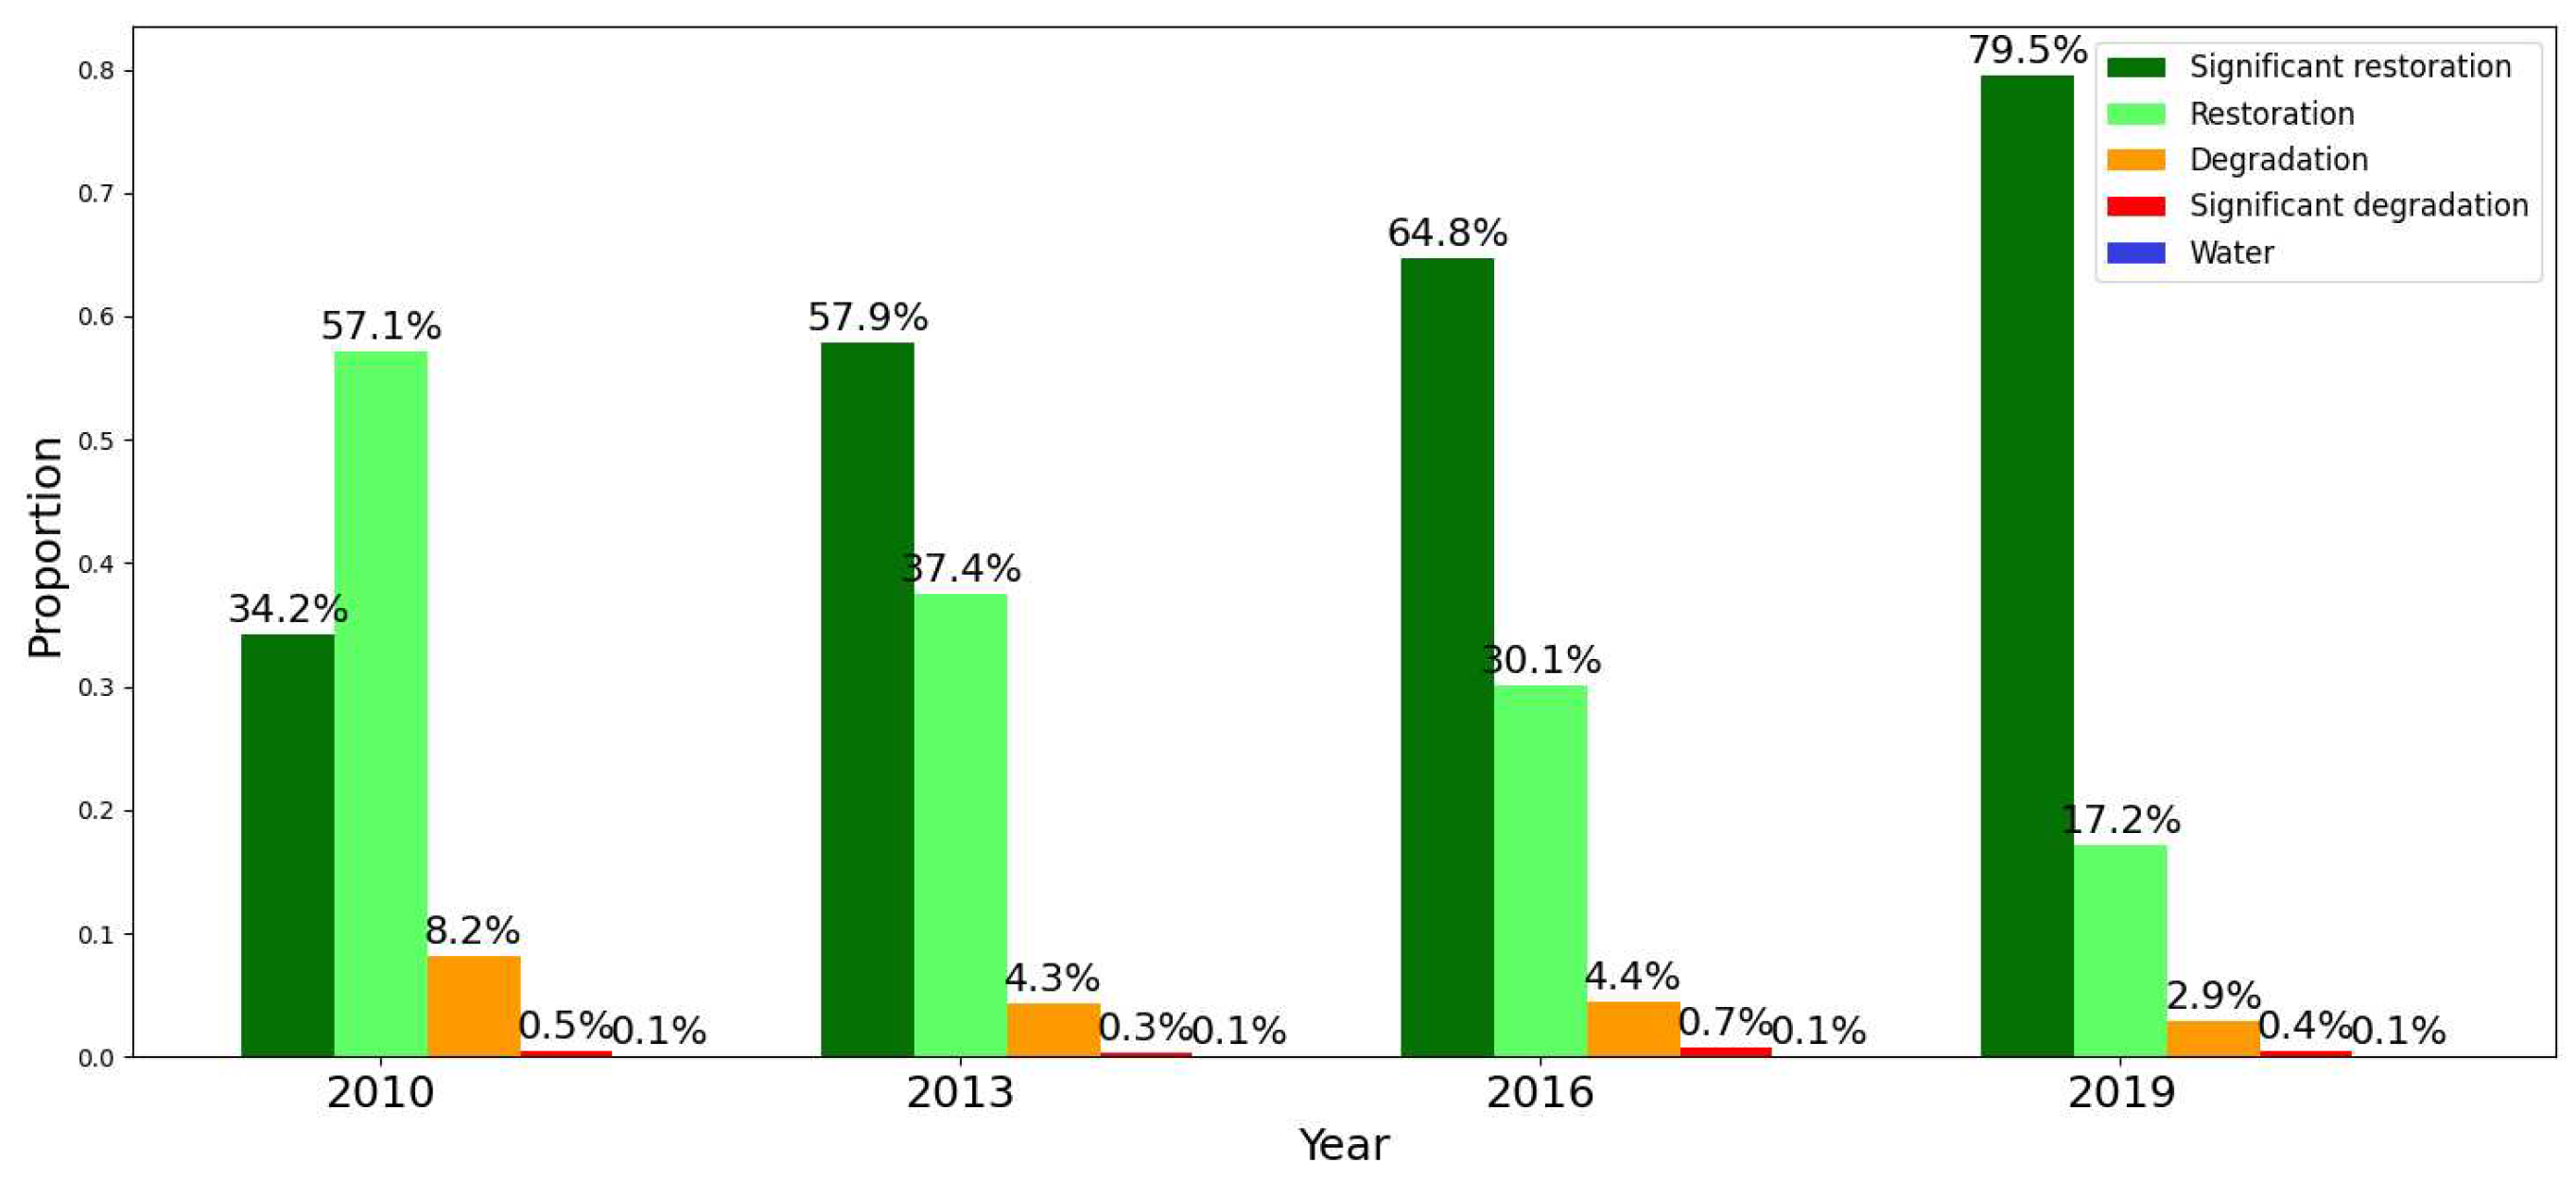
Figure 5). The mountainous area is similar to the high-intensive building area, where significant restoration is increasing continuously with 34.2% in 2010, 57.9% in 2013, 64.8% in 2016, and 79.5% in 2019 (
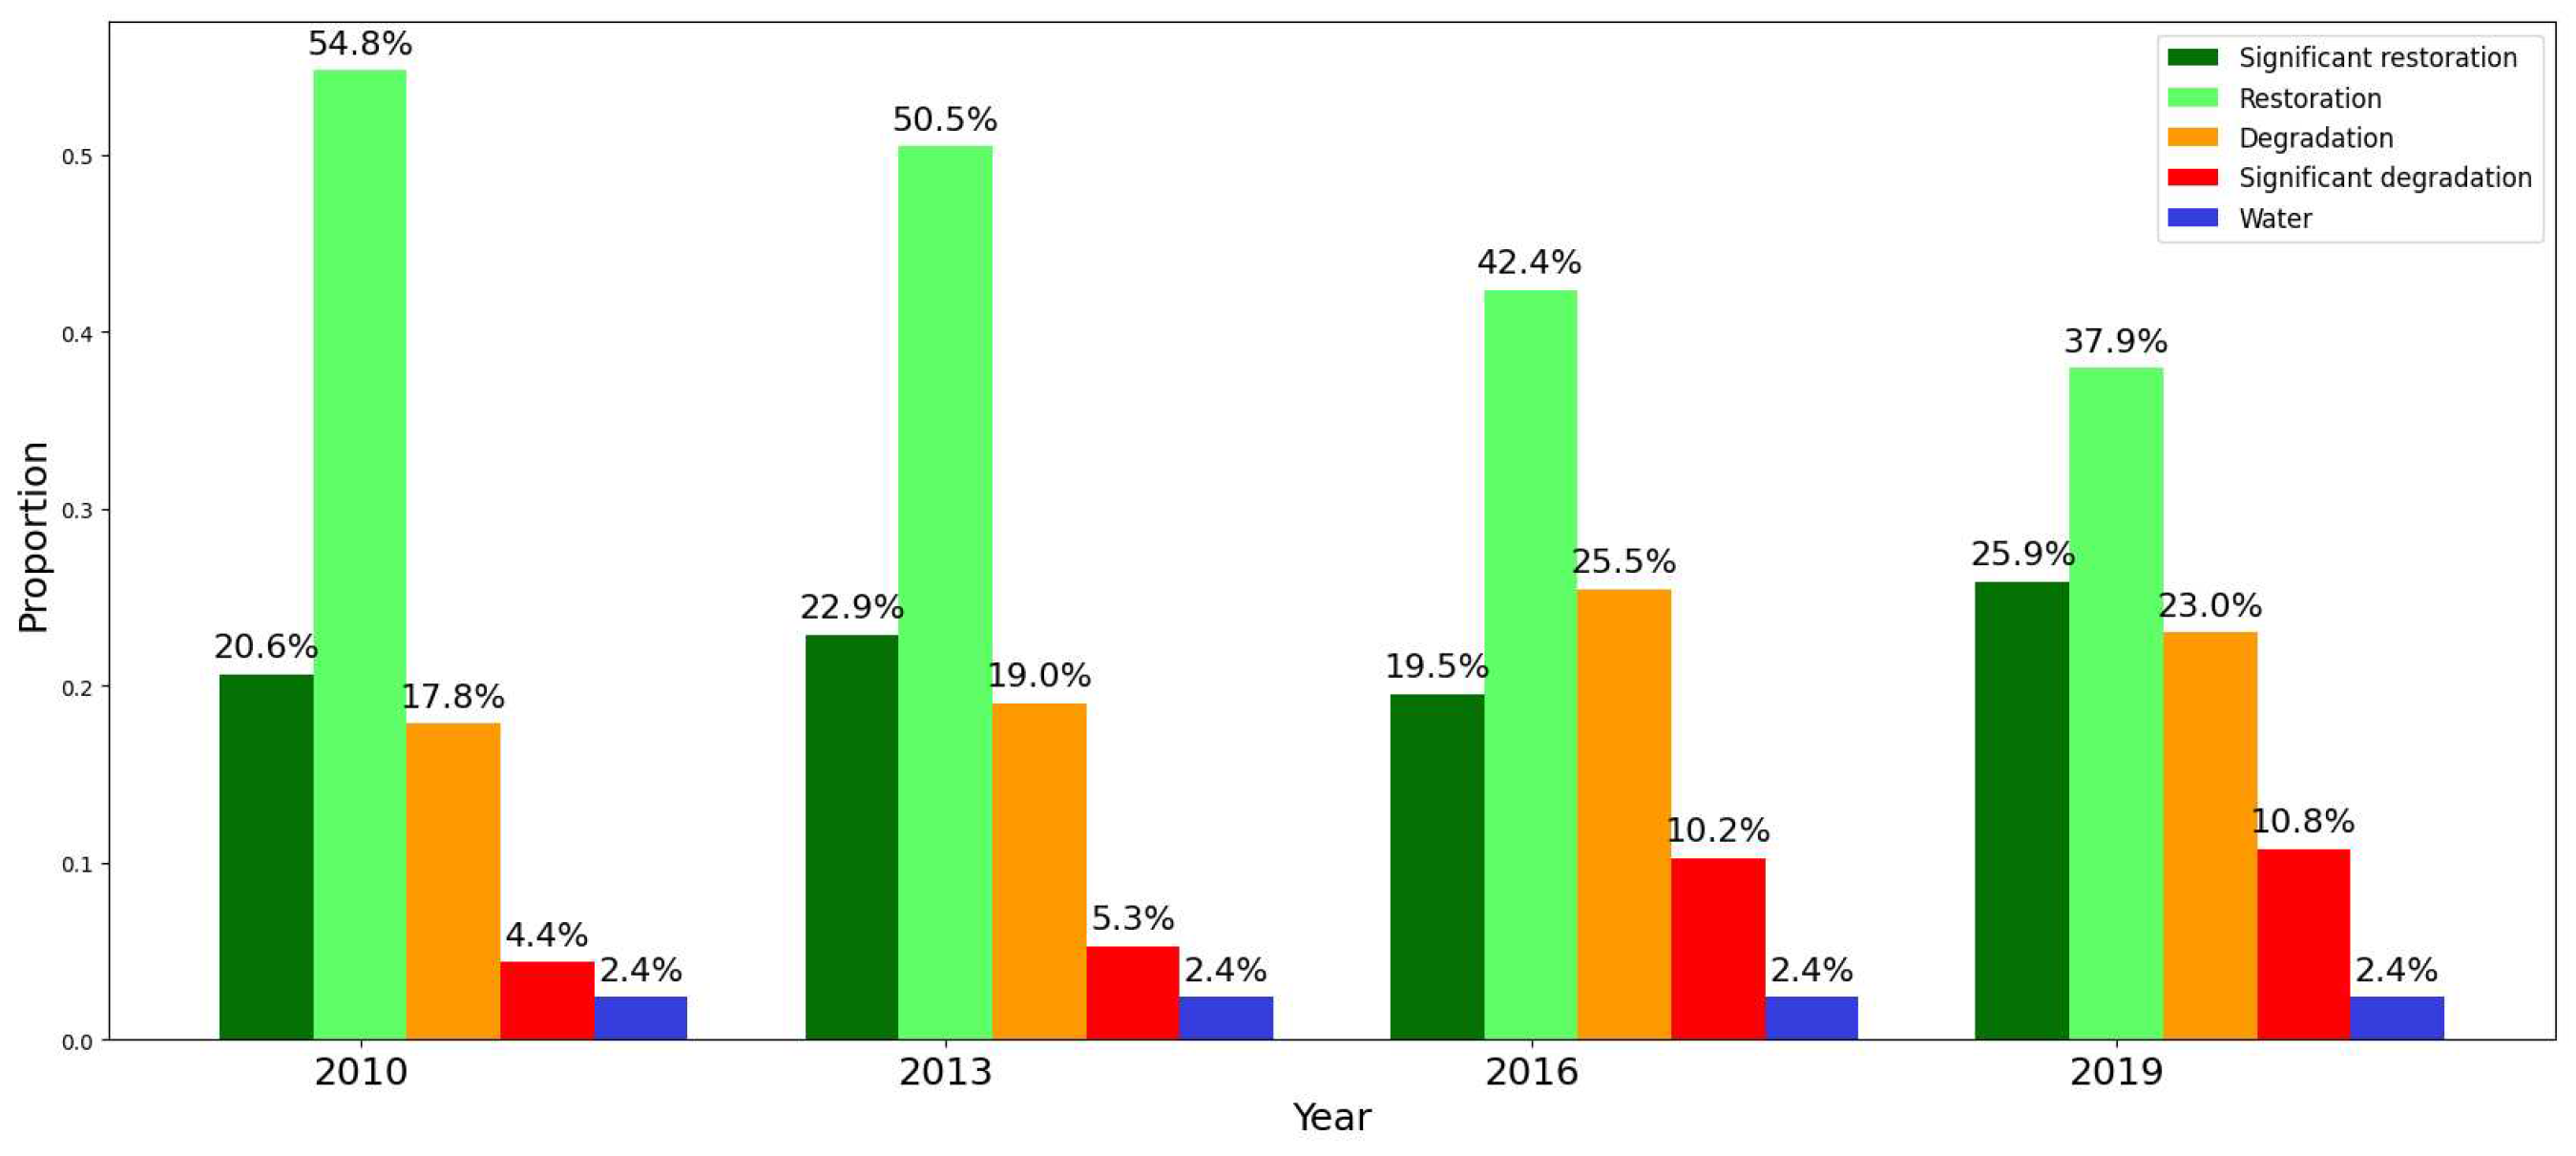
Figure 6). Unlike mountainous areas and high-intensive built-up areas, there has been a gradual increase in the degradation of vegetation in low-intensive built-up areas of Beijing (
Figure 7), especially significantly degraded vegetation.
3.2. Driving Factors of Vegetation Change in Mountainous Area
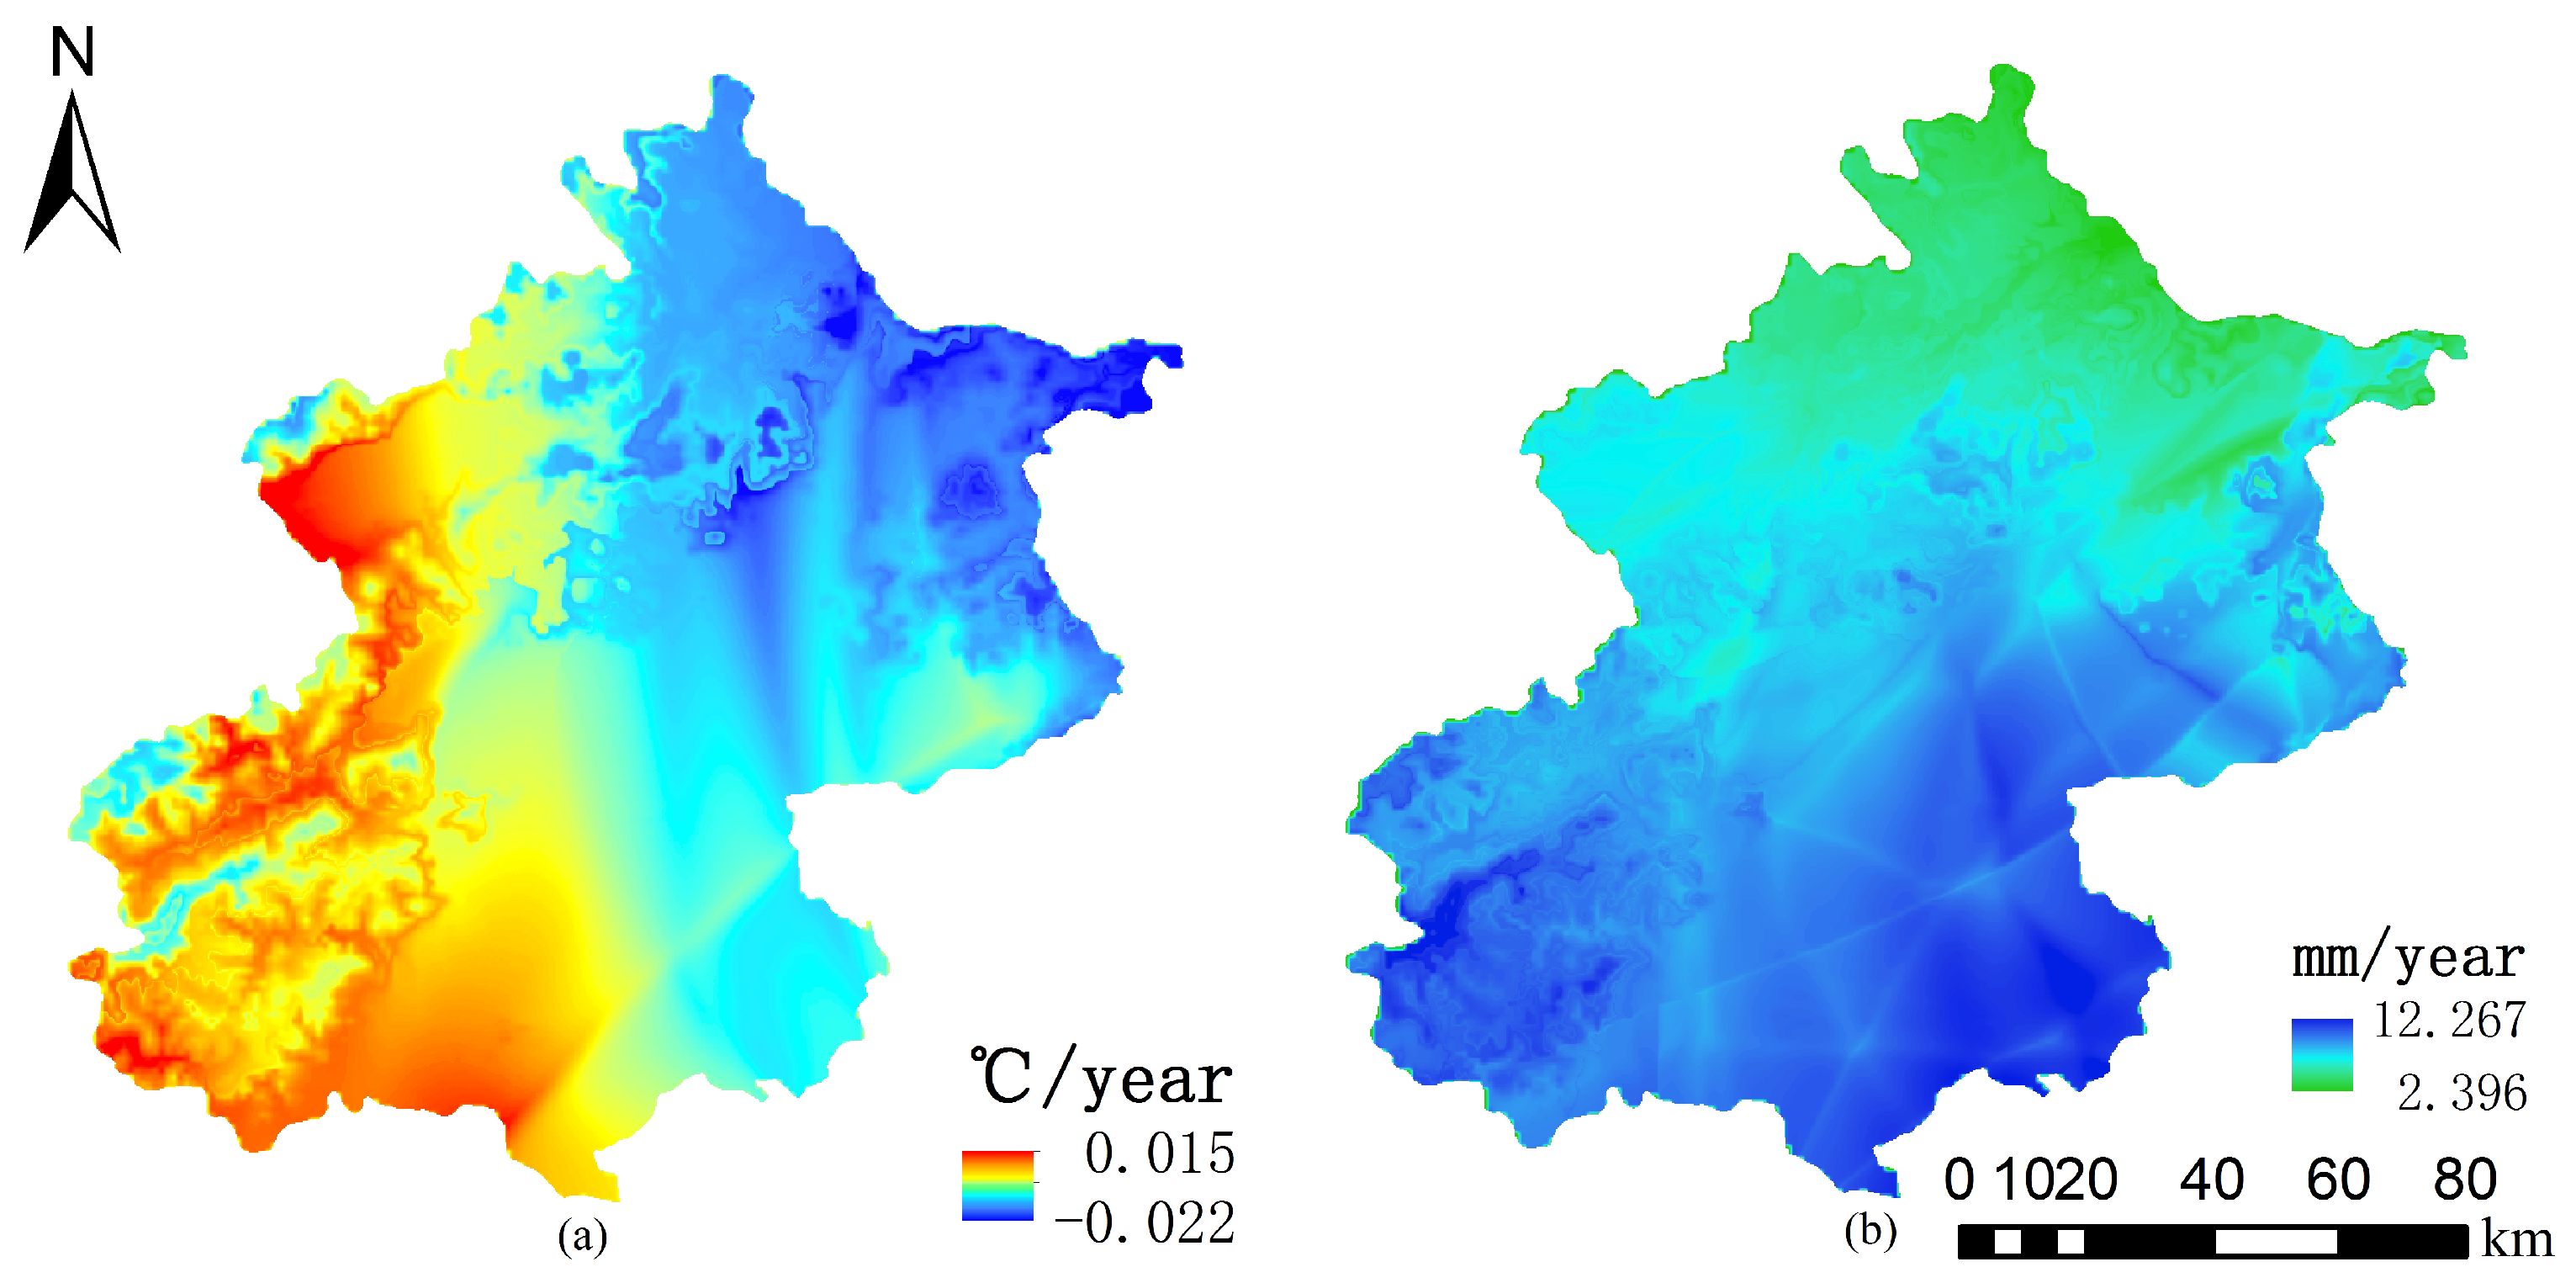
The precipitation and temperature data are used to obtain the driving factors of vegetation change in mountain area. The trend of precipitation and temperature change in Beijing is shown in
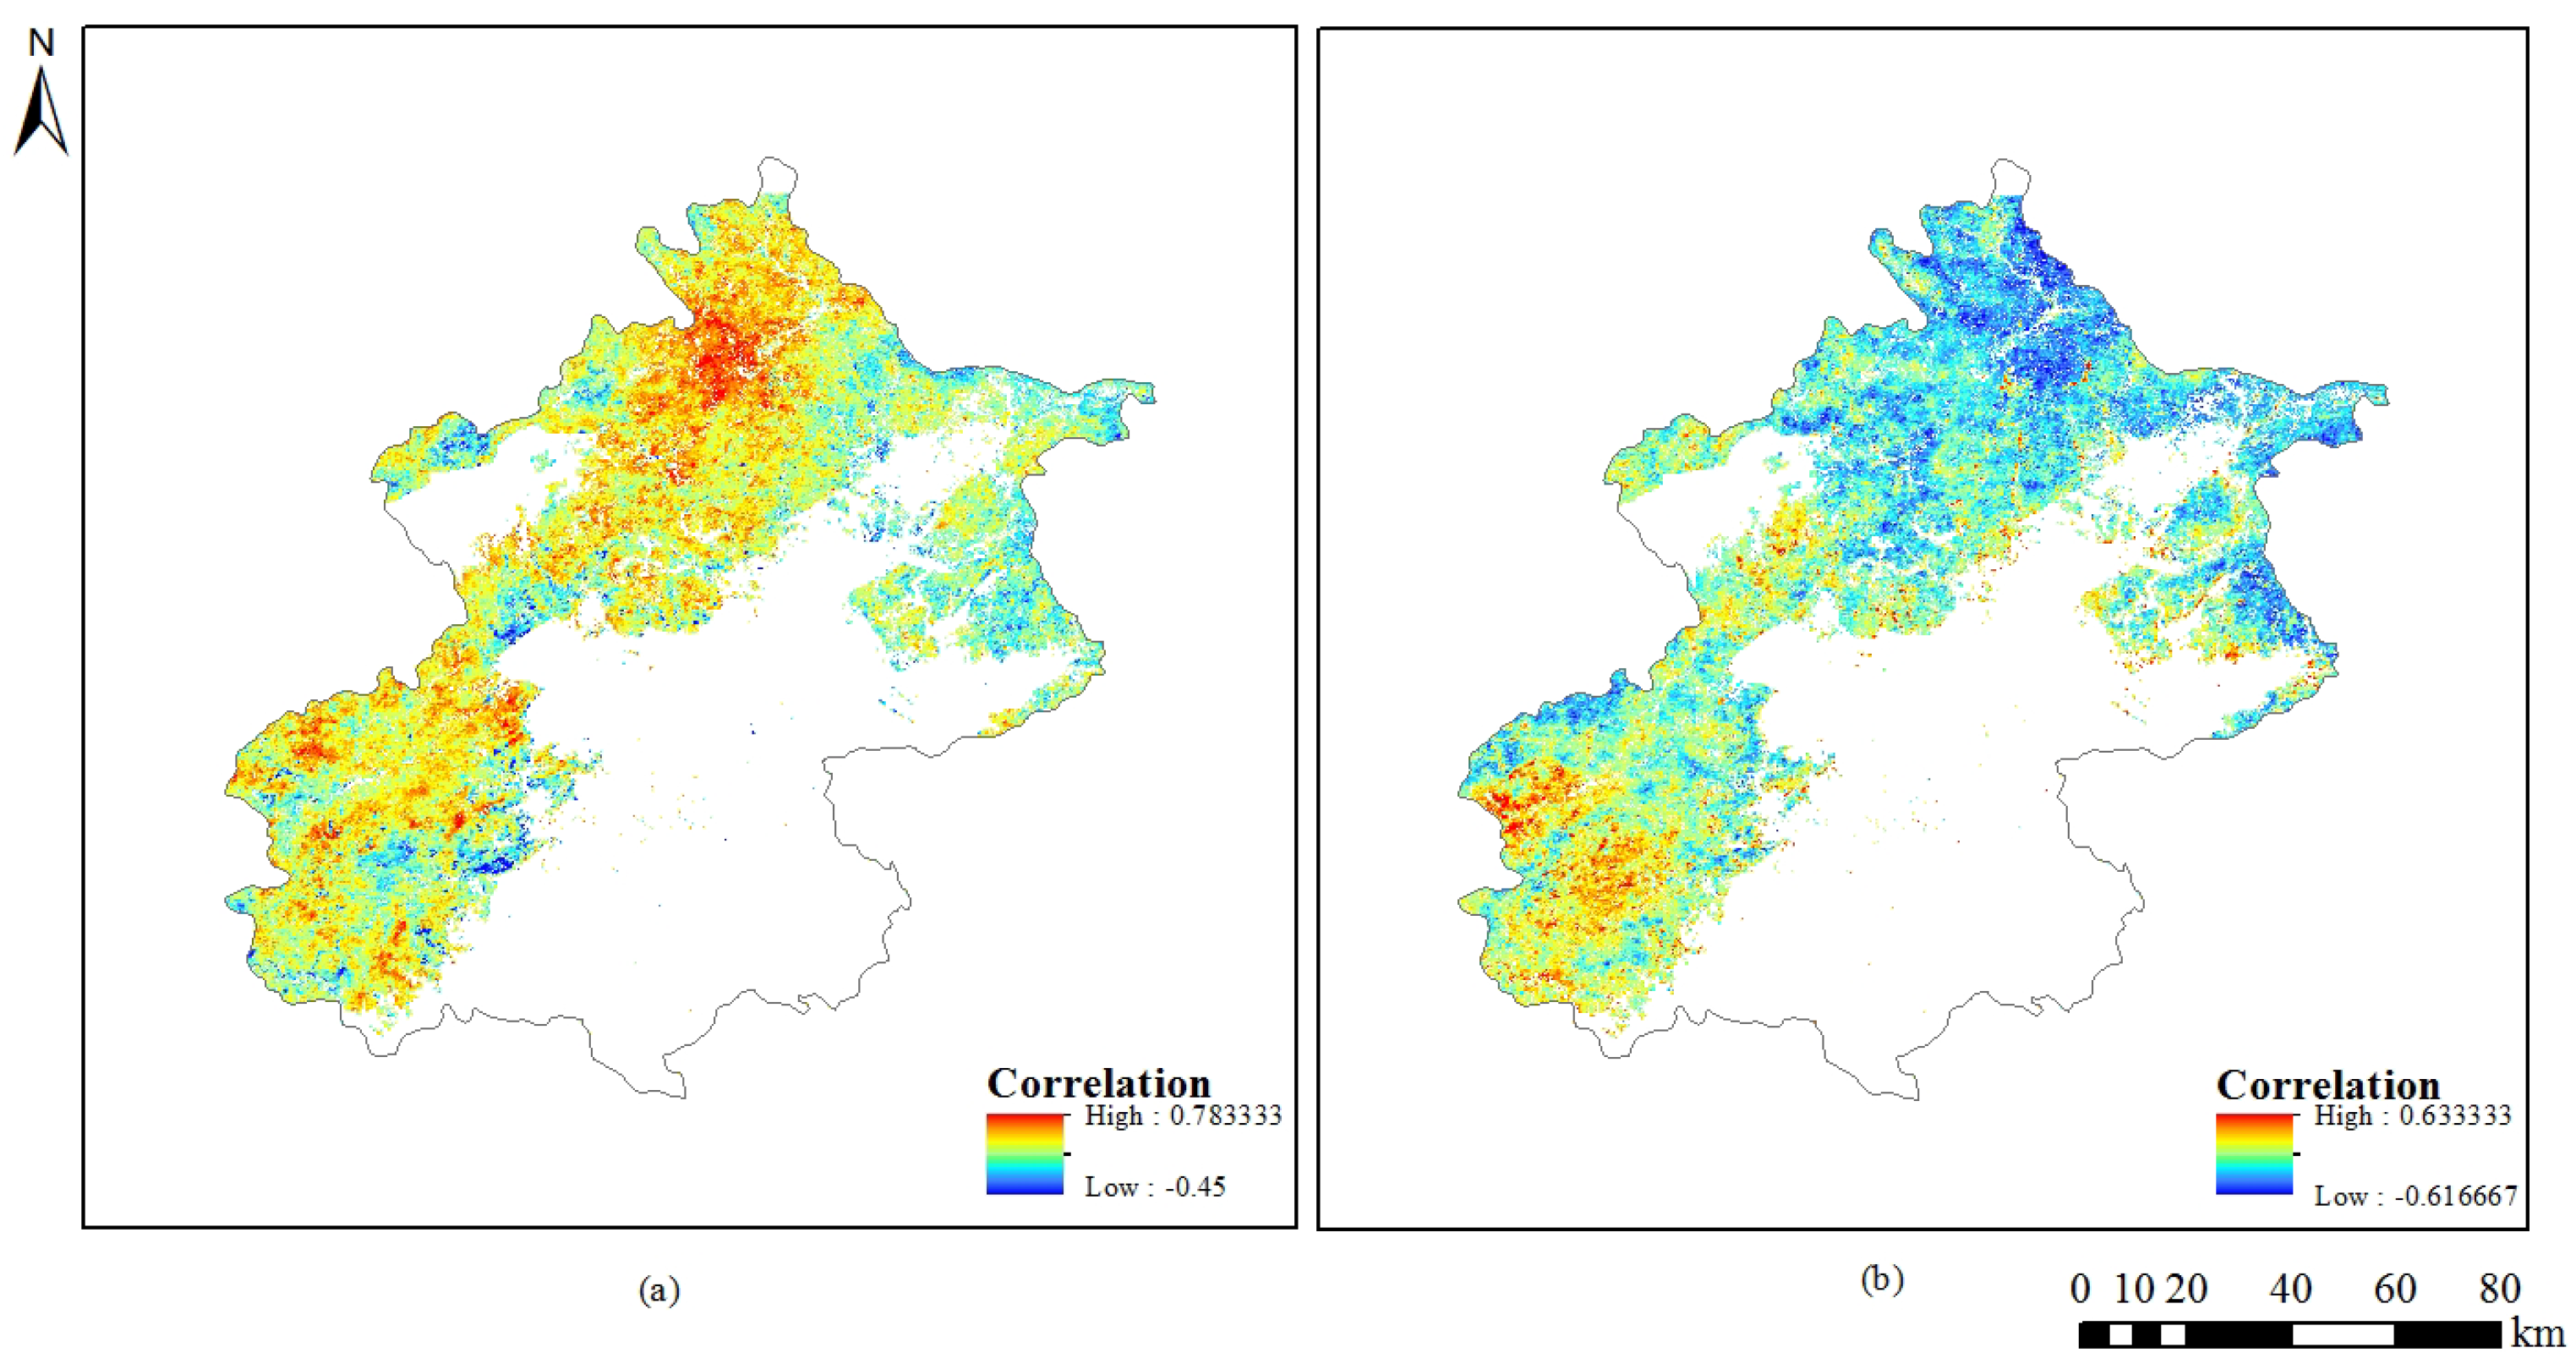
Figure 8. Temperature trends show a more pronounced east-west variation. Precipitation shows an upward trend, but with clear north-south variability. The regions with significant consistency between NDVI and temperature (p<0.05) accounted for 2.8%, while the regions with significant consistency between NDVI and precipitation (p<0.05) accounted for 23.6%, indicating that vegetation in Beijing responded more strongly to precipitation than to temperature. The correlation between NDVI and climate change in mountain area is shown in
Figure 9. Precipitation shows a positive correlation with vegetation in most of mountain area(97.7%), while temperature shows a negative correlation in most of mountain area, reaching 78.8%. Temperature and precipitation showed significant differences in response to vegetation, especially in the northern mountainous areas.
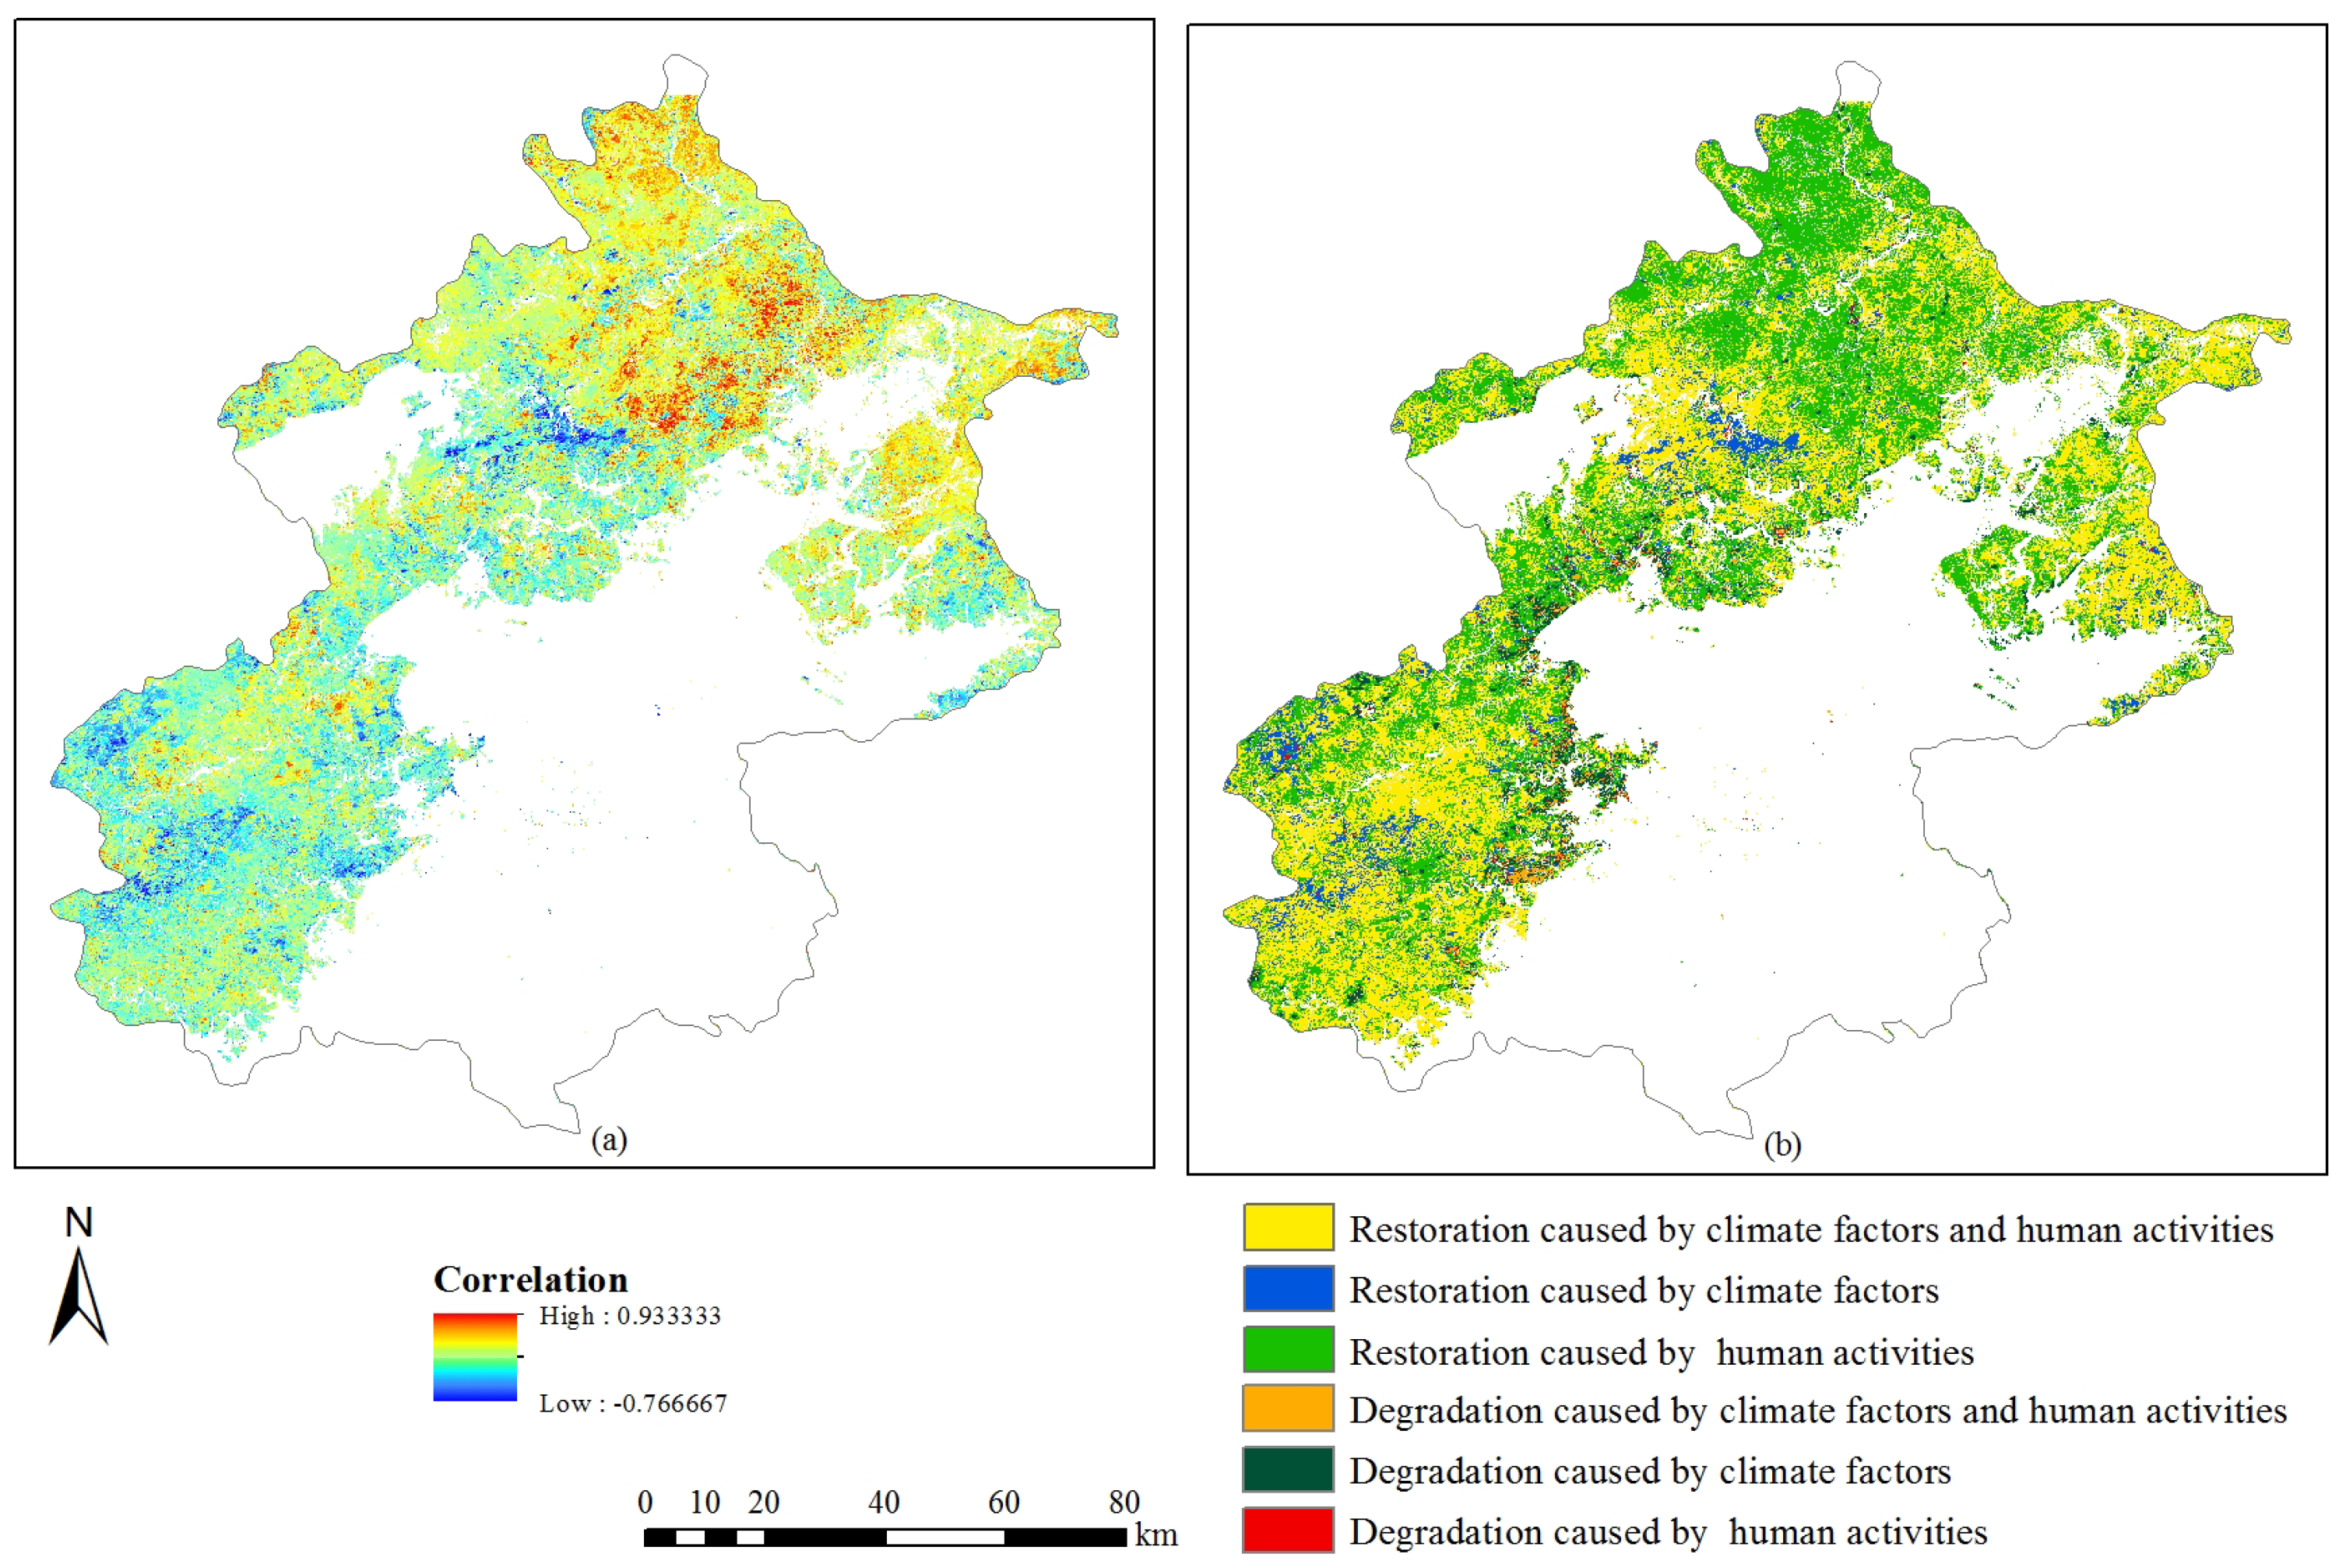
The trend analysis of NDVI residuals is shown in
Figure 10(a). The NDVI residuals in the northern mountainous areas of Beijing show an obvious upward trend, while those in the southern mountainous areas and areas closer to human activities show a downward trend, which indicates that the trend of NDVI residuals has obvious regional characteristics. The TS slope results of NDVI,
and NDVI residuals are superimposed to obtain the NDVI dominant factor results, as shown in
Figure 10(b), and the NDVI driving factor statistical results are shown in
Table 3. The results show that vegetation restoration accounts for the majority of the areas in the non-impervious surface area, reaching 92.9%, of which 41.5% is caused by human factors, 45.3% is caused by a combination of climatic and human activity factors, and rest is caused by climatic factors. The areas with significant increases of NDVI residuals and vegetation are mainly located in the northern mountainous areas, where human activities dominate the vegetation growth. The increasing trend of residuals in the southern mountainous area is not significant, but the increasing trend of vegetation is significant. Human activities and climate factors jointly dominate the vegetation change in this area.
3.3. Driving Factors of Vegetation Change in High and Low-Intensive Building Area
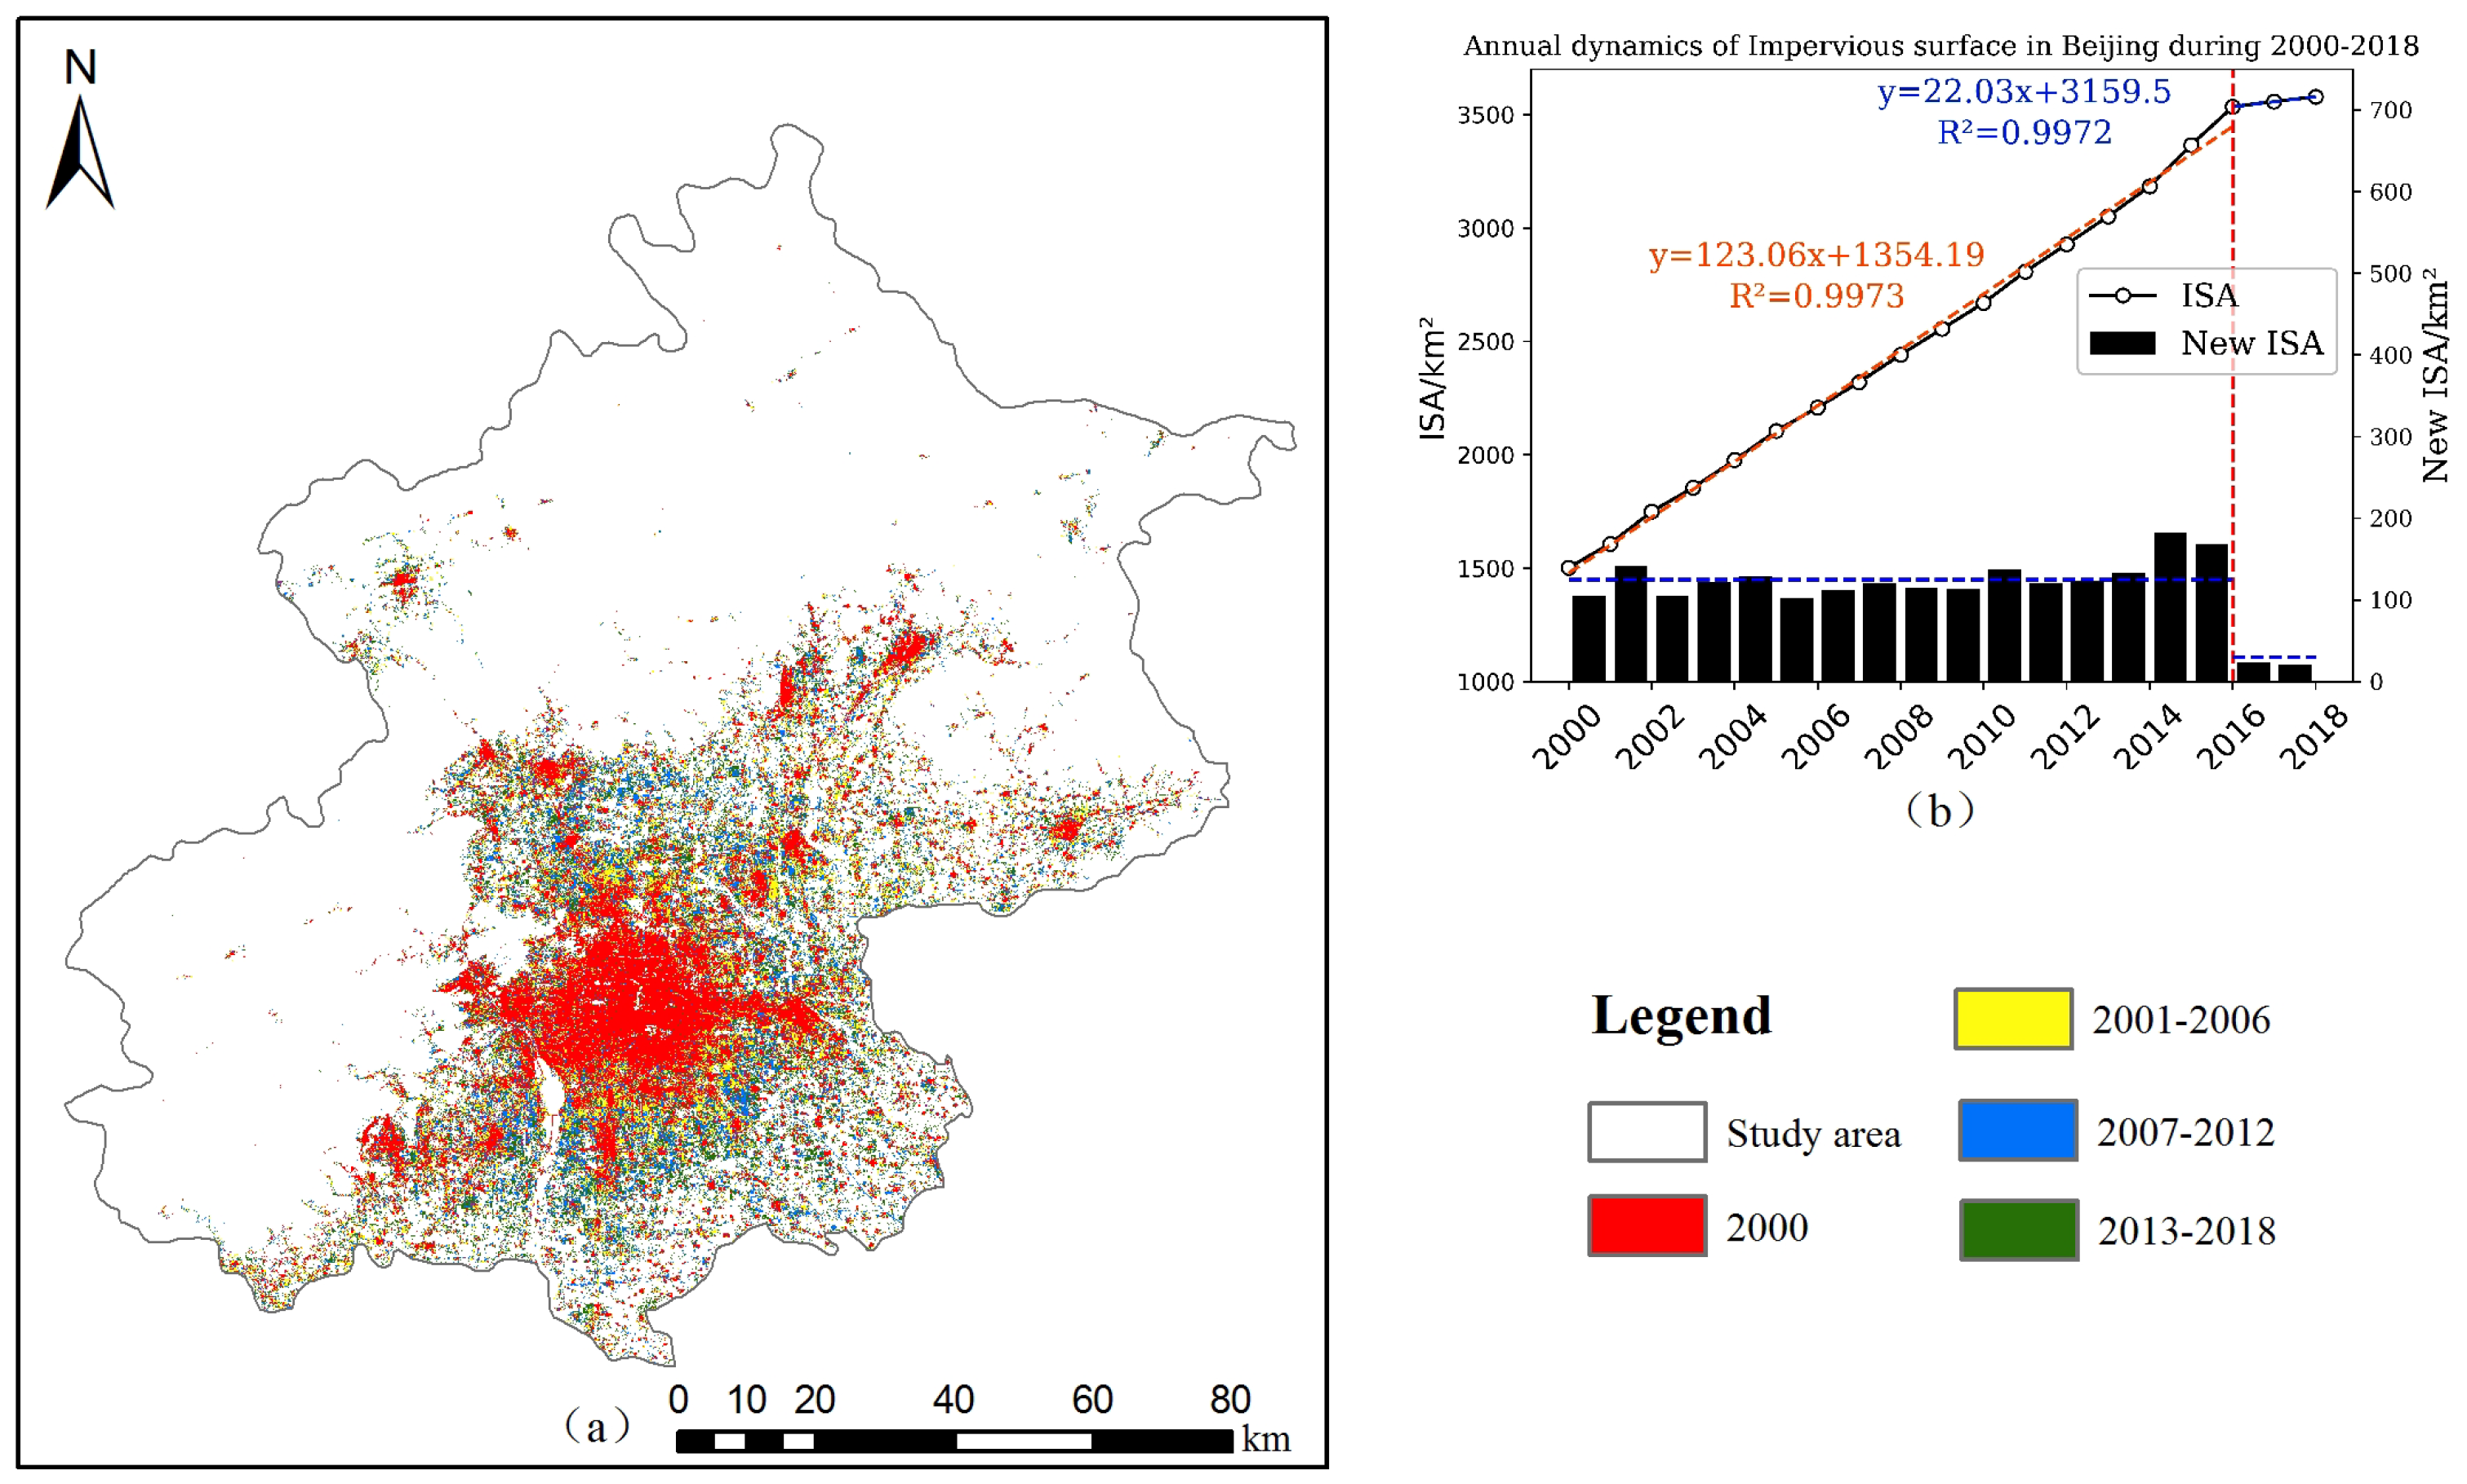
Impervious surface data from 2000 to 2018 is utilized to illustrate the spatial-temporal characteristics of urbanization expansion in Beijing over this period (
Figure 11(a)). The ISA in Beijing has increased by 138.2% from 1501.6km
2 in 2000 to 3577.4km
2 in 2018 (
Figure 11(b)). In light of interannual dynamic changes of the newly increased ISA shown in
Figure 11(a) and
Figure 11(b), the ISA increases rapidly during 2000-2016. In the early period of 2000-2016, the expansion of impervious surface was mainly distributed in peri-urban areas centered on high-intensive urban areas. And in the later period, it was mainly distributed in the distant suburban areas of Beijing, covering more rural areas. After 2016, the expansion of impervious surfaces tended to be almost stable.
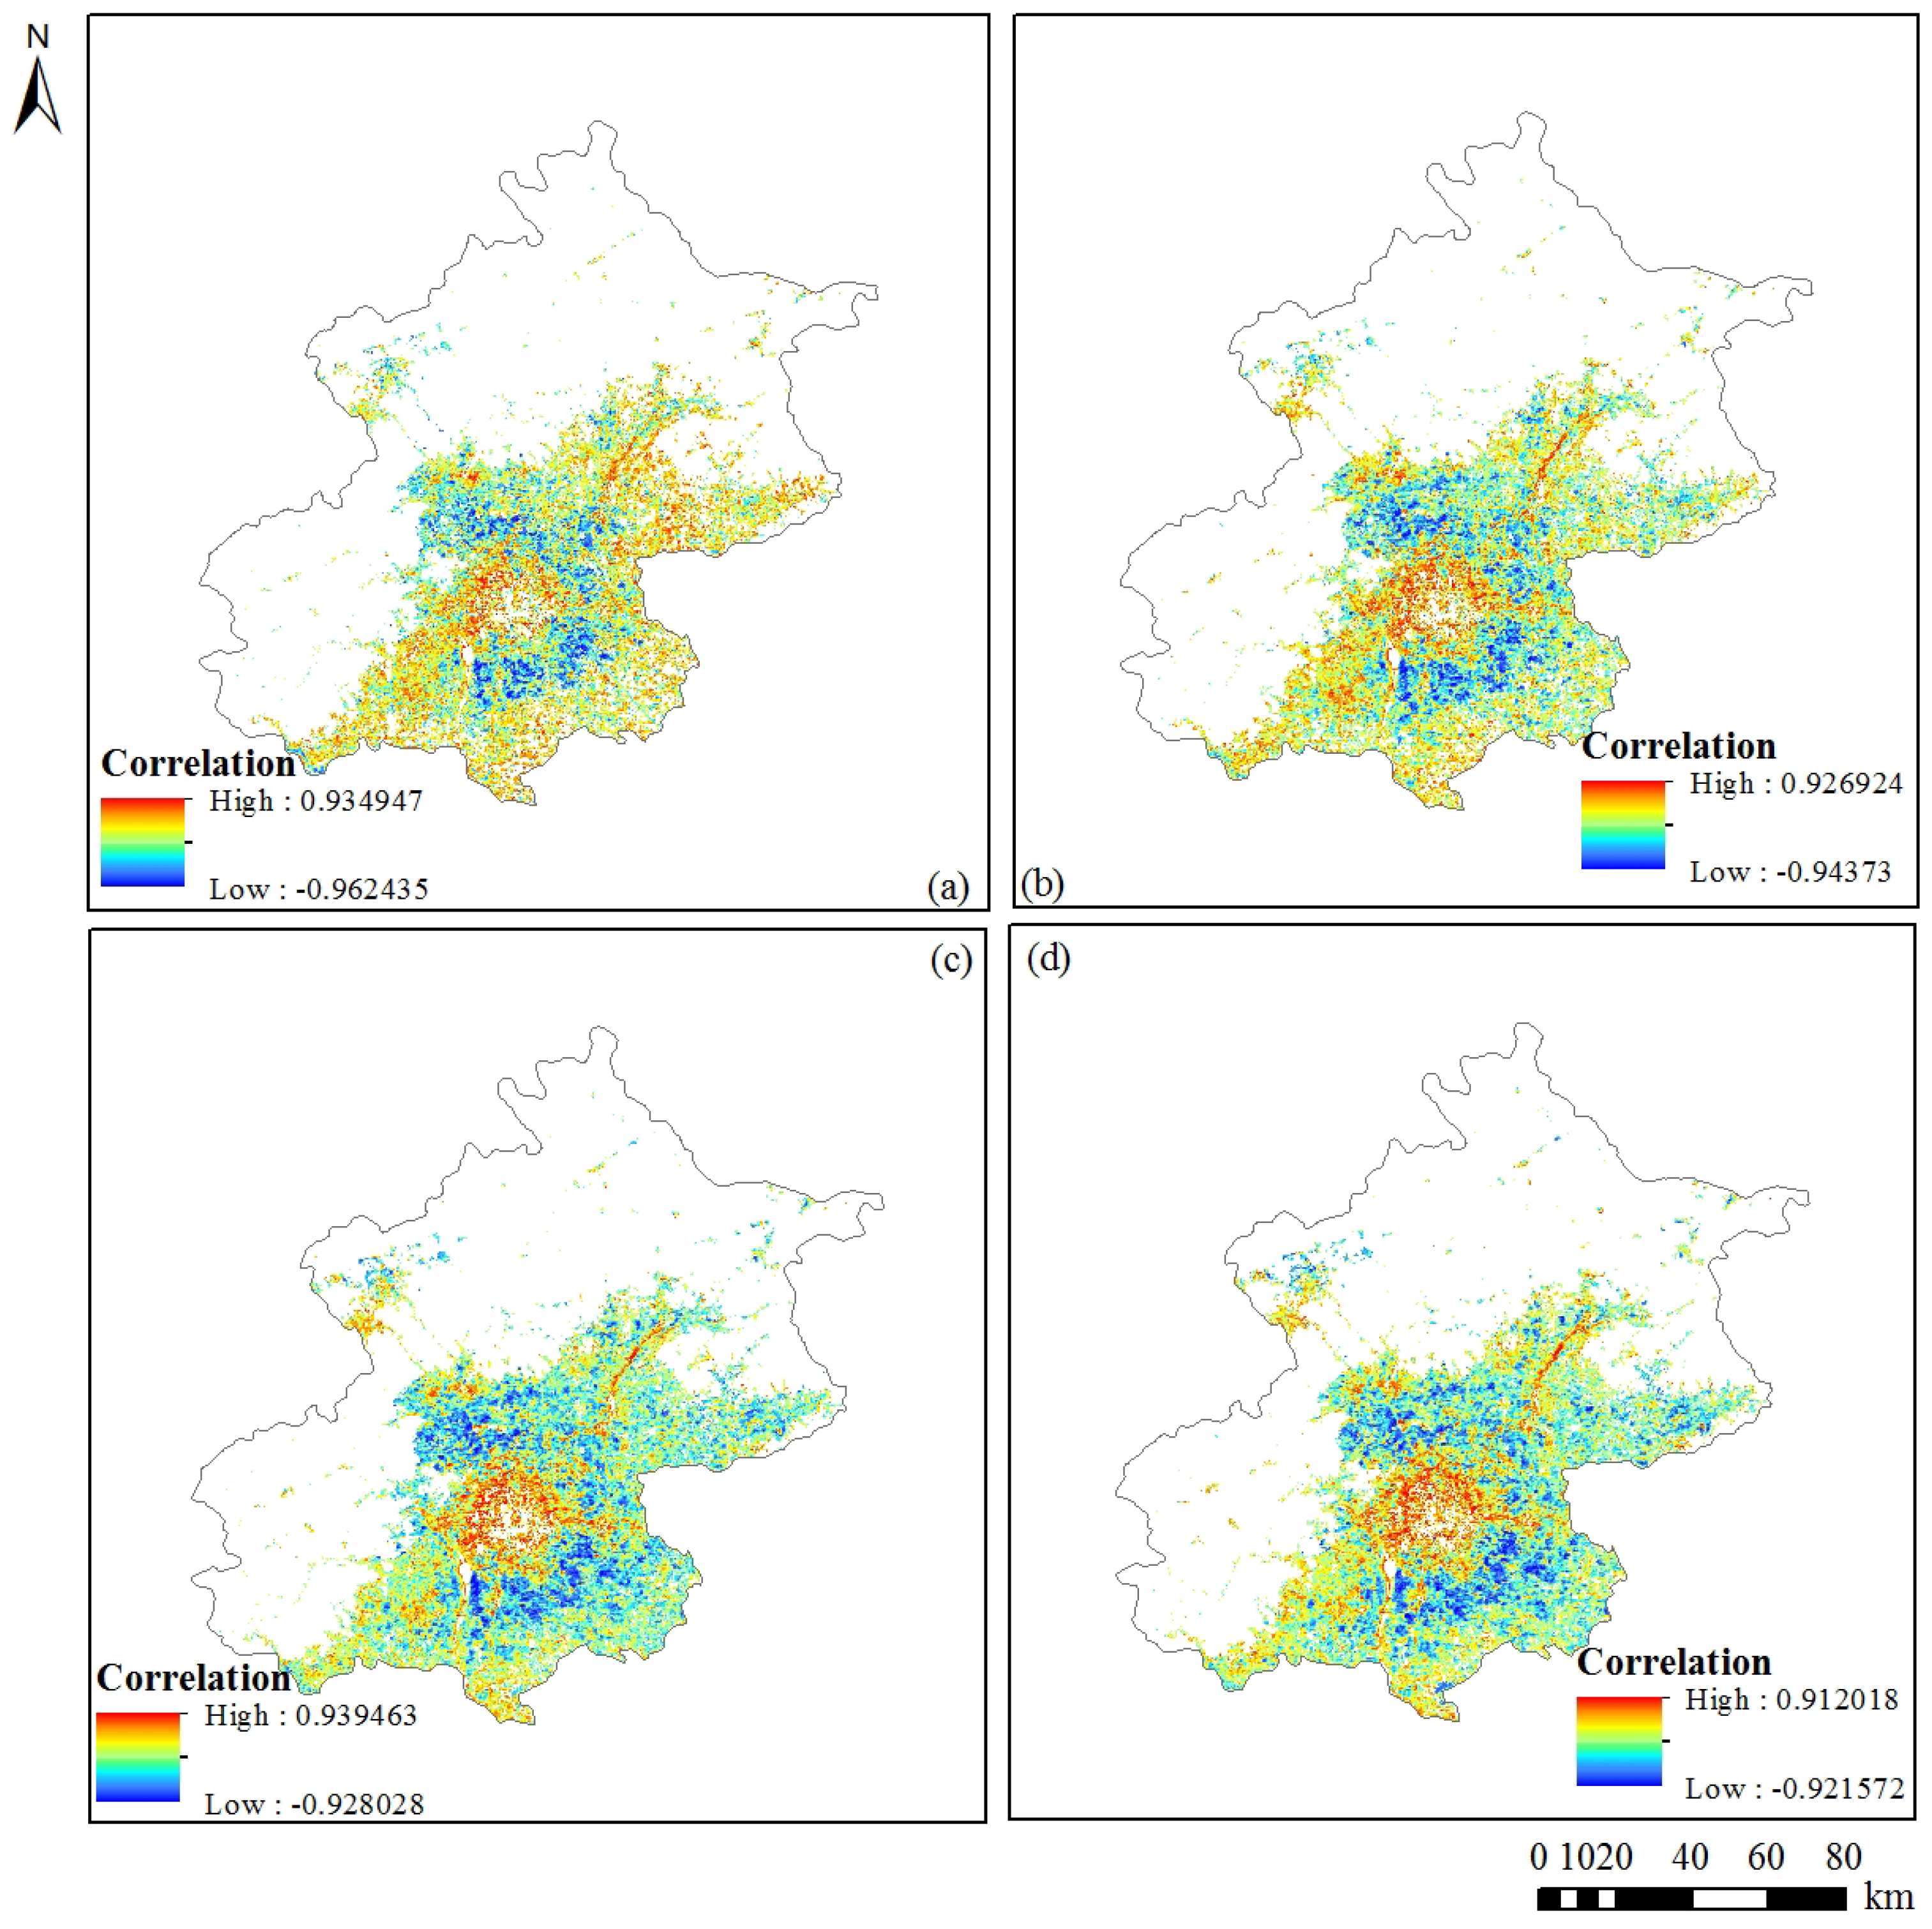
In the impervious surface area, the correlation results between vegetation and impervious surface are shown in
Figure 12. The positive correlation indicates the growth of vegetation restoration in the process of urban expansion, while the negative correlation indicates the growth of vegetation degradation. The proportion of negative correlation increased each year from 37.5% during 2000-2010 to 53.7% during 2000-2016 (
Table 4) due to the continuous urban expansion of Beijing, while the positive correlation continued to decrease, indicating a gradual increase in vegetation degradation area caused by urban expansion during this period. After 2016, the urban expansion tends to be stable, the negative correlation decreases, and the vegetation restores. The spatial distribution of correlation results shows an obvious spatial heterogeneity in vegetation growth in different regions. The negative correlation is mainly concentrated in low-intensive building areas and tends to gradually expand outwards. The positive correlation is concentrated in high-intensive building areas of the city, where the region remains stable, but the positive correlation is gradually enhanced.
4. Discussion
4.1. The Relative Role of Driving Forces in the Process of Vegetation Restoration
Above data analysis indicates a trend of vegetation increasing in Beijing. And the restoration area accounts for 80.2%. The driving factors show spatial variability. In mountainous areas, rainfall is the main climatic variable affecting vegetation growth and change. The northernmost mountainous area of Beijing is the Beijing-Tianjin Sandstorm Source Control Project (BTSSCP), where vegetation restoration is predominantly caused by human activities. This shows that the effect of the BTSSCP project is remarkable. Under adverse climate conditions, human activities play a positive role and significantly improve the vegetation growth situation here, which is also consistent with previous research (
Xu et al. 2011;
Zhang et al. 2016). The NDVI is positively correlated with precipitation in the south of the mountain area, and the joint determinations of precipitation and human activities dominate the vegetation increases in the south of Beijing. The policy of closing hillsides for afforestation and returning farmland to forest has been implemented in the southern mountainous area. Meanwhile, some protected areas have been established. The construction of these protected areas and the implementation of the policy, together with the positive effect of precipitation, are conducive to vegetation restoration and ecological construction.
In addition to the mountainous areas, vegetation restoration is also concentrated in the high-intensive impervious surface area in Beijing. In the advanced stage of urbanization, the speed of urban expansion slows down. Due to the demand for greening, the vegetation growth trend presents a phenomenon of recovery (
Liu et al. 2014;
Luck et al. 2009). This phenomenon can also be observed in developed countries such as Japan, the United Kingdom, and America (
Liu et al. 2015). The greening work in the area is getting better and better in the regions, which benefited from the urban park construction policy that Beijing has long persisted in (
Chang et al. 2020b;
Sun et al. 2012). In a word, active human activities play an important role in vegetation restoration (
Huang et al. 2016;
Li et al. 2015).
4.2. The Relative Role of Driving Forces in the Process of Vegetation Degradation
Vegetation degradation in Beijing is mainly distributed in the low-intensive buildings of Beijing. The area is in the early stage of urbanization, where urban expansion has a negative role in vegetation growth. The ISA has expanded rapidly in the low-intensive building area, where the rapid transformation of cities from non-urban areas to urban areas leads to vegetation degradation (
Chang et al. 2020a). In developing countries such as Bangladesh (
DewanY 2009), and South Africa (
Burgoyne et al. 2016), this feature of urbanization to vegetation dynamics is common. Under the large-scale urban expansion, the ecological environment of vegetation is very fragile (
Shan et al. 2015;
Wang et al. 2019b) with significant degradation. Therefore, vegetation degradation in Beijing is mainly caused by human activities (
Anzhou et al. 2017;
Tian et al. 2015).
The negative correlation between vegetation and the impervious surface has been spreading outwards, which is consistent with the trend of urbanization expansion, indicating that human factors are more important in explaining the trend of vegetation change (
Li et al. 2016;
Lü et al. 2015;
Tian et al. 2014). The development of economic and social production may be conducive to ecological restoration and vegetation growth (
Lü et al. 2015;
Madu 2009;
Salvati and Zitti 2008). However, these areas lack ecological protection, restoration projects and policies related to vegetation protection. Under the effects of adversely climatic conditions and unreasonable human activities, vegetation degeneration has occurred in the region, which is opposite to the situation in the core urban areas. Beijing’s urban expansion tends to be stable after 2016 and gradually attaches importance to the protection of suburban vegetation, such as the implementation of a large-scale plain afforestation project (2012-2015). Moreover, given the fragile ecological environment of vegetation in these areas, the government should comprehensively consider the socio-economic development and ecological protection, and formulate more scientific and reasonable policies.
5. Conclusions
In this manuscript, we utilize MODIS NDVI data to analyze the pattern of vegetation growth trend temporally and spatially in Beijing. By leveraging climate data, Landsat images, DEM data, and impervious surface data, we evaluate the relative effects of human activities and climate changes on vegetation restoration and degradation in Beijing. Since 2000, vegetation increase has accounted for 80.2% of the total area in Beijing, mainly located in the high-intensive building and mountainous areas of Beijing. Human activities play a positive role in vegetation growth. Moreover, some large-scale ecological restoration projects have achieved good results. Beijing’s core area is located in the advanced stage of urbanization, and vegetation growth is promoted by urban greening projects in this area. The vegetation degradation area in Beijing accounts for 18.5%, mainly distributed in the low-intensive building areas of Beijing. The combined effects of these two factors and climate change dominate the degradation of vegetation. The current vegetation ecological environment is very fragile. Beijing suburbs are still in the early stage of urbanization, and a large number of land converted into impervious surface which led to the reduction of vegetation. Therefore, we suggest that policymakers should formulate different ecological restoration policies for different ecologically vulnerable areas and areas with different urbanization gradients, and establish sustainable development strategies to ensure coordinated economic and ecological development.
Our research has a few limitations. MODIS13Q1 vegetation index product is mainly used in this study. Although the product is a 16-day synthetic data, it is also found that the observed value is high or low due to cloud interference. Meanwhile, we focus on the impact of urbanization on vegetation growth, which is a representative factor of human activities. In future research, we can combine the vegetation index data obtained by other types of sensors and field observation methods to further optimize NDVI. Human activity factors can examine more data, such as human footprint data, night light data, and so on, to evaluate the extent of man-made vegetation change more scientifically and comprehensively.
Funding
This research received no external funding.
Acknowledgments
The authors would like to thank Peng Gong et al. for the public impervious surface data of Beijing on their website. We also thank Zhihong Chen and Shuli Wang for meaningful suggestions on review and editing.
Disclosure Statement
No potential conflict of interest was reported by the author(s).
References
- Anzhou, Zhao, Zhang Anbing, Lu Chunyan, Wang Dongli, and L Haixin. 2017. Spatiotemporal variation of vegetation coverage before and after implementation of grain for green project in the loess plateau. Ecol. Eng 104, 13–22. [CrossRef]
- Arnold Jr, Chester L and C James Gibbons. 1996. Impervious surface coverage: the emergence of a key environmental indicator. Journal of the American planning Association 62(2), 243–258. [CrossRef]
- Burgoyne, Christopher, Clare Kelso, and Fethi Ahmed. 2016. Human activity and vegetation change around mkuze game reserve, south africa. South African Geographical Journal= Suid-Afrikaanse Geografiese Tydskrif 98(2), 217–234. [CrossRef]
- Chang, Shuping, Jia Wang, Fangfei Zhang, Liwei Niu, and Yutang Wang. 2020. A study of the impacts of urban expansion on vegetation primary productivity levels in the jing-jin-ji region, based on nighttime light data. Journal of Cleaner Production 263, 121490. [CrossRef]
- Chang, Yuyang, Geli Zhang, Tianzhu Zhang, Zhen Xie, and Jingxia Wang. 2020. Vegetation dynamics and their response to the urbanization of the beijing–tianjin–hebei region, china. Sustainability 12(20), 8550. [CrossRef]
- Chen, Chi, Taejin Park, Xuhui Wang, Shilong Piao, Baodong Xu, Rajiv K Chaturvedi, Richard Fuchs, Victor Brovkin, Philippe Ciais, Rasmus Fensholt, et al. 2019. China and india lead in greening of the world through land-use management. Nature sustainability 2(2), 122–129. [CrossRef]
- Corenblit, Dov and Johannes Steiger. 2009. Vegetation as a major conductor of geomorphic changes on the earth surface: toward evolutionary geomorphology. Earth Surface Processes and Landforms 34(6), 891–896. [CrossRef]
- DAVID, S SCHIMEL. 1995. Terrestrial ecosystems and the carbon cycle. Global Change Biology 1(1), 77–91. [CrossRef]
- DewanY, AM. 2009. Yamaguchi,“land use and land cover change in greater dhaka, bangladesh: using remote sensing to promote sustainable urbanization,”. Appl. Geogr 29(3), 390–401. [CrossRef]
- Evans, Jason and Roland Geerken. 2004. Discrimination between climate and human-induced dryland degradation. Journal of arid environments 57(4), 535–554. [CrossRef]
- Feng, Qi, Hua Ma, Xuemei Jiang, Xin Wang, and Shixiong Cao. 2015. What has caused desertification in china? Scientific reports 5(1), 1–8. [CrossRef]
- Fensholt, Rasmus, Tobias Langanke, Kjeld Rasmussen, Anette Reenberg, Stephen D Prince, Compton Tucker, Robert J Scholes, Quang Bao Le, Alberte Bondeau, Ron Eastman, et al. 2012. Greenness in semi-arid areas across the globe 1981–2007—an earth observing satellite based analysis of trends and drivers. Remote sensing of environment 121, 144–158. [CrossRef]
- Foga, Steve, Pat L Scaramuzza, Song Guo, Zhe Zhu, Ronald D Dilley Jr, Tim Beckmann, Gail L Schmidt, John L Dwyer, M Joseph Hughes, and Brady Laue. 2017. Cloud detection algorithm comparison and validation for operational landsat data products. Remote sensing of environment 194, 379–390. [CrossRef]
- Gong, Peng, Xuecao Li, Jie Wang, Yuqi Bai, Bin Chen, Tengyun Hu, Xiaoping Liu, Bing Xu, Jun Yang, Wei Zhang, et al. 2020. Annual maps of global artificial impervious area (gaia) between 1985 and 2018. Remote Sensing of Environment 236, 111510. [CrossRef]
- Huang, Ke, Yangjian Zhang, Juntao Zhu, Yaojie Liu, Jiaxing Zu, and Jing Zhang. 2016. The influences of climate change and human activities on vegetation dynamics in the qinghai-tibet plateau. Remote Sensing 8(10), 876. [CrossRef]
- Huete, Alfredo, Kamel Didan, Tomoaki Miura, E Patricia Rodriguez, Xiang Gao, and Laerte G Ferreira. 2002. Overview of the radiometric and biophysical performance of the modis vegetation indices. Remote sensing of environment 83(1-2), 195–213. [CrossRef]
- Huete, AR, HQ Liu, KV Batchily, and WJDA Van Leeuwen. 1997. A comparison of vegetation indices over a global set of tm images for eos-modis. Remote sensing of environment 59(3), 440–451. [CrossRef]
- Hughes, MK, RB Myneni, J Dong, CJ Tucker, RK Kaufmann, PE Kauppi, J Liski, L Zhou, and V Alexeyev. 2001. A large carbon sink in the woody biomass of northern forests. In Proceedings of. [CrossRef]
- Hunt, E Raymond, Robert D Kelly, William K Smith, Jace T Fahnestock, Jeffrey M Welker, and William A Reiners. 2004. Estimation of carbon sequestration by combining remote sensing and net ecosystem exchange data for northern mixed-grass prairie and sagebrush–steppe ecosystems. Environmental Management 33(1), S432–S441. [CrossRef]
- Ibrahim, Yahaya Z, Heiko Balzter, Jörg Kaduk, and Compton J Tucker. 2015. Land degradation assessment using residual trend analysis of gimms ndvi3g, soil moisture and rainfall in sub-saharan west africa from 1982 to 2012. Remote Sensing 7(5), 5471–5494. [CrossRef]
- Jiang, Chong, Reshmita Nath, Lev Labzovskii, and Dewang Wang. 2018. Integrating ecosystem services into effectiveness assessment of ecological restoration program in northern china’s arid areas: Insights from the beijing-tianjin sandstorm source region. Land Use Policy 75, 201–214. [CrossRef]
- Jiang, Liangliang, Anming Bao, Hao Guo, Felix Ndayisaba, et al. 2017. Vegetation dynamics and responses to climate change and human activities in central asia. Science of the Total Environment 599, 967–980. [CrossRef]
- Jiang, Meichen, Shufang Tian, Zhaoju Zheng, Qian Zhan, and Yuexin He. 2017. Human activity influences on vegetation cover changes in beijing, china, from 2000 to 2015. Remote Sensing 9(3), 271. [CrossRef]
- Kendall, Maurice G. 1938. A new measure of rank correlation. Biometrika 30(1/2), 81–93. [CrossRef]
- Kendall, Maurice George. 1948. Rank correlation methods.
- Kinsella, Kevin. 2001. Urban and rural dimensions of global population aging: an overview. The Journal of Rural Health 17(4), 314–322. [CrossRef]
- Lamchin, Munkhnasan, Woo-Kyun Lee, Seong Woo Jeon, Sonam Wangyel Wang, Chul Hee Lim, Cholho Song, and Minjun Sung. 2018. Long-term trend and correlation between vegetation greenness and climate variables in asia based on satellite data. Science of the Total Environment 618, 1089–1095. [CrossRef]
- Li, Juan, Lian Feng, Xiaoping Pang, Weishu Gong, and Xi Zhao. 2016. Radiometric cross calibration of gaofen-1 wfv cameras using landsat-8 oli images: A simple image-based method. Remote Sensing 8(5), 411. [CrossRef]
- Li, Shuangshuang, Saini Yang, Xianfeng Liu, Yanxu Liu, and Mimi Shi. 2015. Ndvi-based analysis on the influence of climate change and human activities on vegetation restoration in the shaanxi-gansu-ningxia region, central china. Remote Sensing 7(9), 11163–11182. [CrossRef]
- Liu, Qinping, Yongchun Yang, Hongzhen Tian, Bo Zhang, and Lei Gu. 2014. Assessment of human impacts on vegetation in built-up areas in china based on avhrr, modis and dmsp_ols nighttime light data, 1992–2010. Chinese Geographical Science 24(2), 231–244. [CrossRef]
- Liu, Yanxu, Yanglin Wang, Jian Peng, Yueyue Du, Xianfeng Liu, Shuangshuang Li, and Donghai Zhang. 2015. Correlations between urbanization and vegetation degradation across the world’s metropolises using dmsp/ols nighttime light data. Remote Sensing 7(2), 2067–2088. [CrossRef]
- Lü, Yihe, Liwei Zhang, Xiaoming Feng, Yuan Zeng, Bojie Fu, Xueling Yao, Junran Li, and Bingfang Wu. 2015. Recent ecological transitions in china: Greening, browning and influential factors. Scientific reports 5(1), 1–8. [CrossRef]
- Luck, Gary W, Lisa T Smallbone, and Rachel O’Brien. 2009. Socio-economics and vegetation change in urban ecosystems: patterns in space and time. Ecosystems 12(4), 604–620. [CrossRef]
- Madu, Ignatius A. 2009. The impacts of anthropogenic factors on the environment in nigeria. Journal of Environmental Management 90(3), 1422–1426. [CrossRef]
- Mann, HB. 1945. Spatial-temporal variation and protection of wetland resources in xinjiang. Econometrica 13, 245–259.
- Martinez, Christopher J, Jerome J Maleski, and Martin F Miller. 2012. Trends in precipitation and temperature in florida, usa. Journal of Hydrology 452, 259–281. [CrossRef]
- McIntyre, Nancy E. 2000. Ecology of urban arthropods: a review and a call to action. Annals of the entomological society of America 93(4), 825–835. [CrossRef]
- Niu, ZhenGuo, Peng Gong, Xiao Cheng, JianHong Guo, Lin Wang, HuaBing Huang, ShaoQing Shen, YunZhao Wu, XiaoFeng Wang, XianWei Wang, et al. 2009. Geographical characteristics of china’s wetlands derived from remotely sensed data. Science in China Series D: Earth Sciences 52(6), 723–738. [CrossRef]
- PEI, Liang, Sen-wang HUANG, and Li-ping CHEN. 2012. Vegetation spatio-temporal changes and the relationship with climate factors in beijing-tianjin sand source region. Journal of desert research 33(5), 1593–1597.
- Peng, Shouzhang, Yongxia Ding, Wenzhao Liu, and Zhi Li. 2019. 1 km monthly temperature and precipitation dataset for china from 1901 to 2017. Earth System Science Data 11(4), 1931–1946. [CrossRef]
- Pettorelli, Nathalie, Aliénor LM Chauvenet, James P Duffy, William A Cornforth, Alizée Meillere, and Jonathan EM Baillie. 2012. Tracking the effect of climate change on ecosystem functioning using protected areas: Africa as a case study. Ecological Indicators 20, 269–276. [CrossRef]
- Qu, Sai, Lunche Wang, Aiwen Lin, Hongji Zhu, and Moxi Yuan. 2018. What drives the vegetation restoration in yangtze river basin, china: climate change or anthropogenic factors? Ecological Indicators 90, 438–450. [CrossRef]
- Ridd, Merrill K. 1995. Exploring a vis (vegetation-impervious surface-soil) model for urban ecosystem analysis through remote sensing: comparative anatomy for cities. International journal of remote sensing 16(12), 2165–2185. [CrossRef]
- Salvati, Luca and Marco Zitti. 2008. Natural resource depletion and the economic performance of local districts: suggestions from a within-country analysis. The International Journal of Sustainable Development & World Ecology 15(6), 518–523. [CrossRef]
- Sen, Pranab Kumar. 1968. Estimates of the regression coefficient based on kendall’s tau. Journal of the American statistical association 63(324), 1379–1389.
- Shahtahmassebi, Amirreza, Zhou-lu Yu, Ke Wang, Hong-wei Xu, Jin-song Deng, Jia-dan Li, Rui-sen Luo, Jing Wu, and Nathan Moore. 2012. Monitoring rapid urban expansion using a multi-temporal rgb-impervious surface model. Journal of Zhejiang University SCIENCE A 13(2), 146–158. [CrossRef]
- Shan, Nan, Zhongjie Shi, Xiaohui Yang, Jixi Gao, and Dawei Cai. 2015. Spatiotemporal trends of reference evapotranspiration and its driving factors in the beijing–tianjin sand source control project region, china. Agricultural and Forest Meteorology 200, 322–333. [CrossRef]
- Sun, Jian, Genwei Cheng, Weipeng Li, Yukun Sha, and Yunchuan Yang. 2013. On the variation of ndvi with the principal climatic elements in the tibetan plateau. Remote Sensing 5(4), 1894–1911. [CrossRef]
- Sun, Wenyi, Xiaoyan Song, Xingmin Mu, Peng Gao, Fei Wang, and Guangju Zhao. 2015. Spatiotemporal vegetation cover variations associated with climate change and ecological restoration in the loess plateau. Agricultural and Forest Meteorology 209, 87–99. [CrossRef]
- Sun, Xiao Peng, Tian Ming Wang, Jian-Guo Wu, and Jian Ping Ge. 2012. Change trend of vegetation cover in beijing metropolitan region before and after the 2008 olympics. Ying Yong Sheng tai xue bao= The Journal of Applied Ecology 23(11), 3133–3140.
- Tabari, Hossein, Behzad Shifteh Somee, and Mehdi Rezaeian Zadeh. 2011. Testing for long-term trends in climatic variables in iran. Atmospheric research 100(1), 132–140. [CrossRef]
- Theil, Henri. 1950. A rank-invariant method of linear and polynominal regression analysis (parts 1-3). In Ned. Akad. Wetensch. Proc. Ser. A, Volume 53, pp. 1397–1412.
- Tian, Haijing, Chunxiang Cao, Wei Chen, Shanning Bao, Bin Yang, and Ranga B Myneni. 2015. Response of vegetation activity dynamic to climatic change and ecological restoration programs in inner mongolia from 2000 to 2012. Ecological Engineering 82, 276–289. [CrossRef]
- Tian, Haijing, Chunxiang Cao, Chengmao Dai, Sheng Zheng, Shilei Lu, Min Xu, Wei Chen, Jian Zhao, Di Liu, and Hongyuan Zhu. 2014. Analysis of vegetation fractional cover in jungar banner based on time-series remote sensing data. Geo-Information Science 16(1), 126–133.
- Tong, Siqin, Jiquan Zhang, Si Ha, Quan Lai, and Qiyun Ma. 2016. Dynamics of fractional vegetation coverage and its relationship with climate and human activities in inner mongolia, china. Remote Sensing 8(9), 776. [CrossRef]
- Tucker, Compton J. 1979. Red and photographic infrared linear combinations for monitoring vegetation. Remote sensing of Environment 8(2), 127–150.
- Wang, Chao, Qiong Gao, Xian Wang, and Mei Yu. 2016. Spatially differentiated trends in urbanization, agricultural land abandonment and reclamation, and woodland recovery in northern china. Scientific Reports 6(1), 1–12. [CrossRef]
- Wang, Cong and Kai Zhu. 2019. Misestimation of growing season length due to inaccurate construction of satellite vegetation index time series. IEEE Geoscience and Remote Sensing Letters 16(8), 1185–1189. [CrossRef]
- Wang, Hao, Guohua Liu, Zongshan Li, Pengtao Wang, and Zhuangzhuang Wang. 2019. Comparative assessment of vegetation dynamics under the influence of climate change and human activities in five ecologically vulnerable regions of china from 2000 to 2015. Forests 10(4), 317. [CrossRef]
- Wang, Jing, Kelin Wang, Mingyang Zhang, and Chunhua Zhang. 2015. Impacts of climate change and human activities on vegetation cover in hilly southern china. Ecological engineering 81, 451–461. [CrossRef]
- Wang, Jiali, Weiqi Zhou, Steward TA Pickett, Wenjuan Yu, and Weifeng Li. 2019. A multiscale analysis of urbanization effects on ecosystem services supply in an urban megaregion. Science of the total environment 662, 824–833. [CrossRef]
- Xu, Hanqiu. 2006. Modification of normalised difference water index (ndwi) to enhance open water features in remotely sensed imagery. International journal of remote sensing 27(14), 3025–3033. [CrossRef]
- Xu, Lili, Zhenfa Tu, Yuke Zhou, and Guangming Yu. 2018. Profiling human-induced vegetation change in the horqin sandy land of china using time series datasets. Sustainability 10(4), 1068. [CrossRef]
- Xu, Temperature. vegetation seasonality diminishment over northern lands, nat. Clim. Change (3), 581.
- Xu, Weixin, Song Gu, XinQuan Zhao, Jianshe Xiao, Yanhong Tang, Jingyun Fang, Juan Zhang, and Sha Jiang. 2011. High positive correlation between soil temperature and ndvi from 1982 to 2006 in alpine meadow of the three-river source region on the qinghai-tibetan plateau. International Journal of Applied Earth Observation and Geoinformation 13(4), 528–535. [CrossRef]
- Xueying, Zhang. 2010. Study on the temporal and spatial distribution of vegetation and its impact factors based on rs in beijing. MA thesis.
- Yu, Lu, Zhi-Tao Wu, DU ZQ, Hong Zhang, and Yong Liu. 2020. Quantitative analysis of the effects of human activities on vegetation in the beijing-tianjin sandstorm source region under the climate change. Ying Yong Sheng tai xue bao= The Journal of Applied Ecology 31(6), 2007–2014. [CrossRef]
- Zhang, Ying, Chaobin Zhang, Zhaoqi Wang, Yizhao Chen, Chengcheng Gang, Ru An, and Jianlong Li. 2016. Vegetation dynamics and its driving forces from climate change and human activities in the three-river source region, china from 1982 to 2012. Science of the Total Environment 563, 210–220. [CrossRef]
- Zhao, Lin, Aiguo Dai, and Bo Dong. 2018. Changes in global vegetation activity and its driving factors during 1982–2013. Agricultural and Forest Meteorology 249, 198–209. [CrossRef]
- Zhao, Yinbing, Ranhao Sun, and Zhongyun Ni. 2019. Identification of natural and anthropogenic drivers of vegetation change in the beijing-tianjin-hebei megacity region. Remote Sensing 11(10), 1224. [CrossRef]
- Zhu, Zhe, Shixiong Wang, and Curtis E Woodcock. 2015. Improvement and expansion of the fmask algorithm: Cloud, cloud shadow, and snow detection for landsats 4–7, 8, and sentinel 2 images. Remote sensing of Environment 159, 269–277. [CrossRef]
- Zhu, Zhe and Curtis E Woodcock. 2012. Object-based cloud and cloud shadow detection in landsat imagery. Remote sensing of environment 118, 83–94. [CrossRef]
- Zou, Zhenhua, Jinwei Dong, Michael A Menarguez, Xiangming Xiao, Yuanwei Qin, Russell B Doughty, Katherine V Hooker, and K David Hambright. 2017. Continued decrease of open surface water body area in oklahoma during 1984–2015. Science of the Total Environment 595, 451–460. [CrossRef]
- Zou, Zhenhua, Xiangming Xiao, Jinwei Dong, Yuanwei Qin, Russell B Doughty, Michael A Menarguez, Geli Zhang, and Jie Wang. 2018. Divergent trends of open-surface water body area in the contiguous united states from 1984 to 2016. Proceedings of the National Academy of Sciences 115(15), 3810–3815. [CrossRef]
|
Disclaimer/Publisher’s Note: The statements, opinions and data contained in all publications are solely those of the individual author(s) and contributor(s) and not of MDPI and/or the editor(s). MDPI and/or the editor(s) disclaim responsibility for any injury to people or property resulting from any ideas, methods, instructions or products referred to in the content. |
© 2023 by the authors. Licensee MDPI, Basel, Switzerland. This article is an open access article distributed under the terms and conditions of the Creative Commons Attribution (CC BY) license (http://creativecommons.org/licenses/by/4.0/).
