Submitted:
05 December 2023
Posted:
06 December 2023
Read the latest preprint version here
Abstract
Keywords:
1. Introduction
- −
- the use of a similarity transformation that would show that a process on a smaller scale (on a model) is equivalent to a process on a larger scale (in reality);
- −
- finding modeling criteria based on it;
- −
- establishing areas of self-similarity according to various criteria if they actually exist.
- −
- U,V is the components of the depth-average water velocity vector along the x and y axes, respectively,
- −
- h (x,y,t) is the flow depth
- −
- S (x,y,t)* is the saturation turbidity, denoting the vertical average volume concentration of sediment in an equivalent uniform flow.
- -
- selection of the basic flow equation;
- -
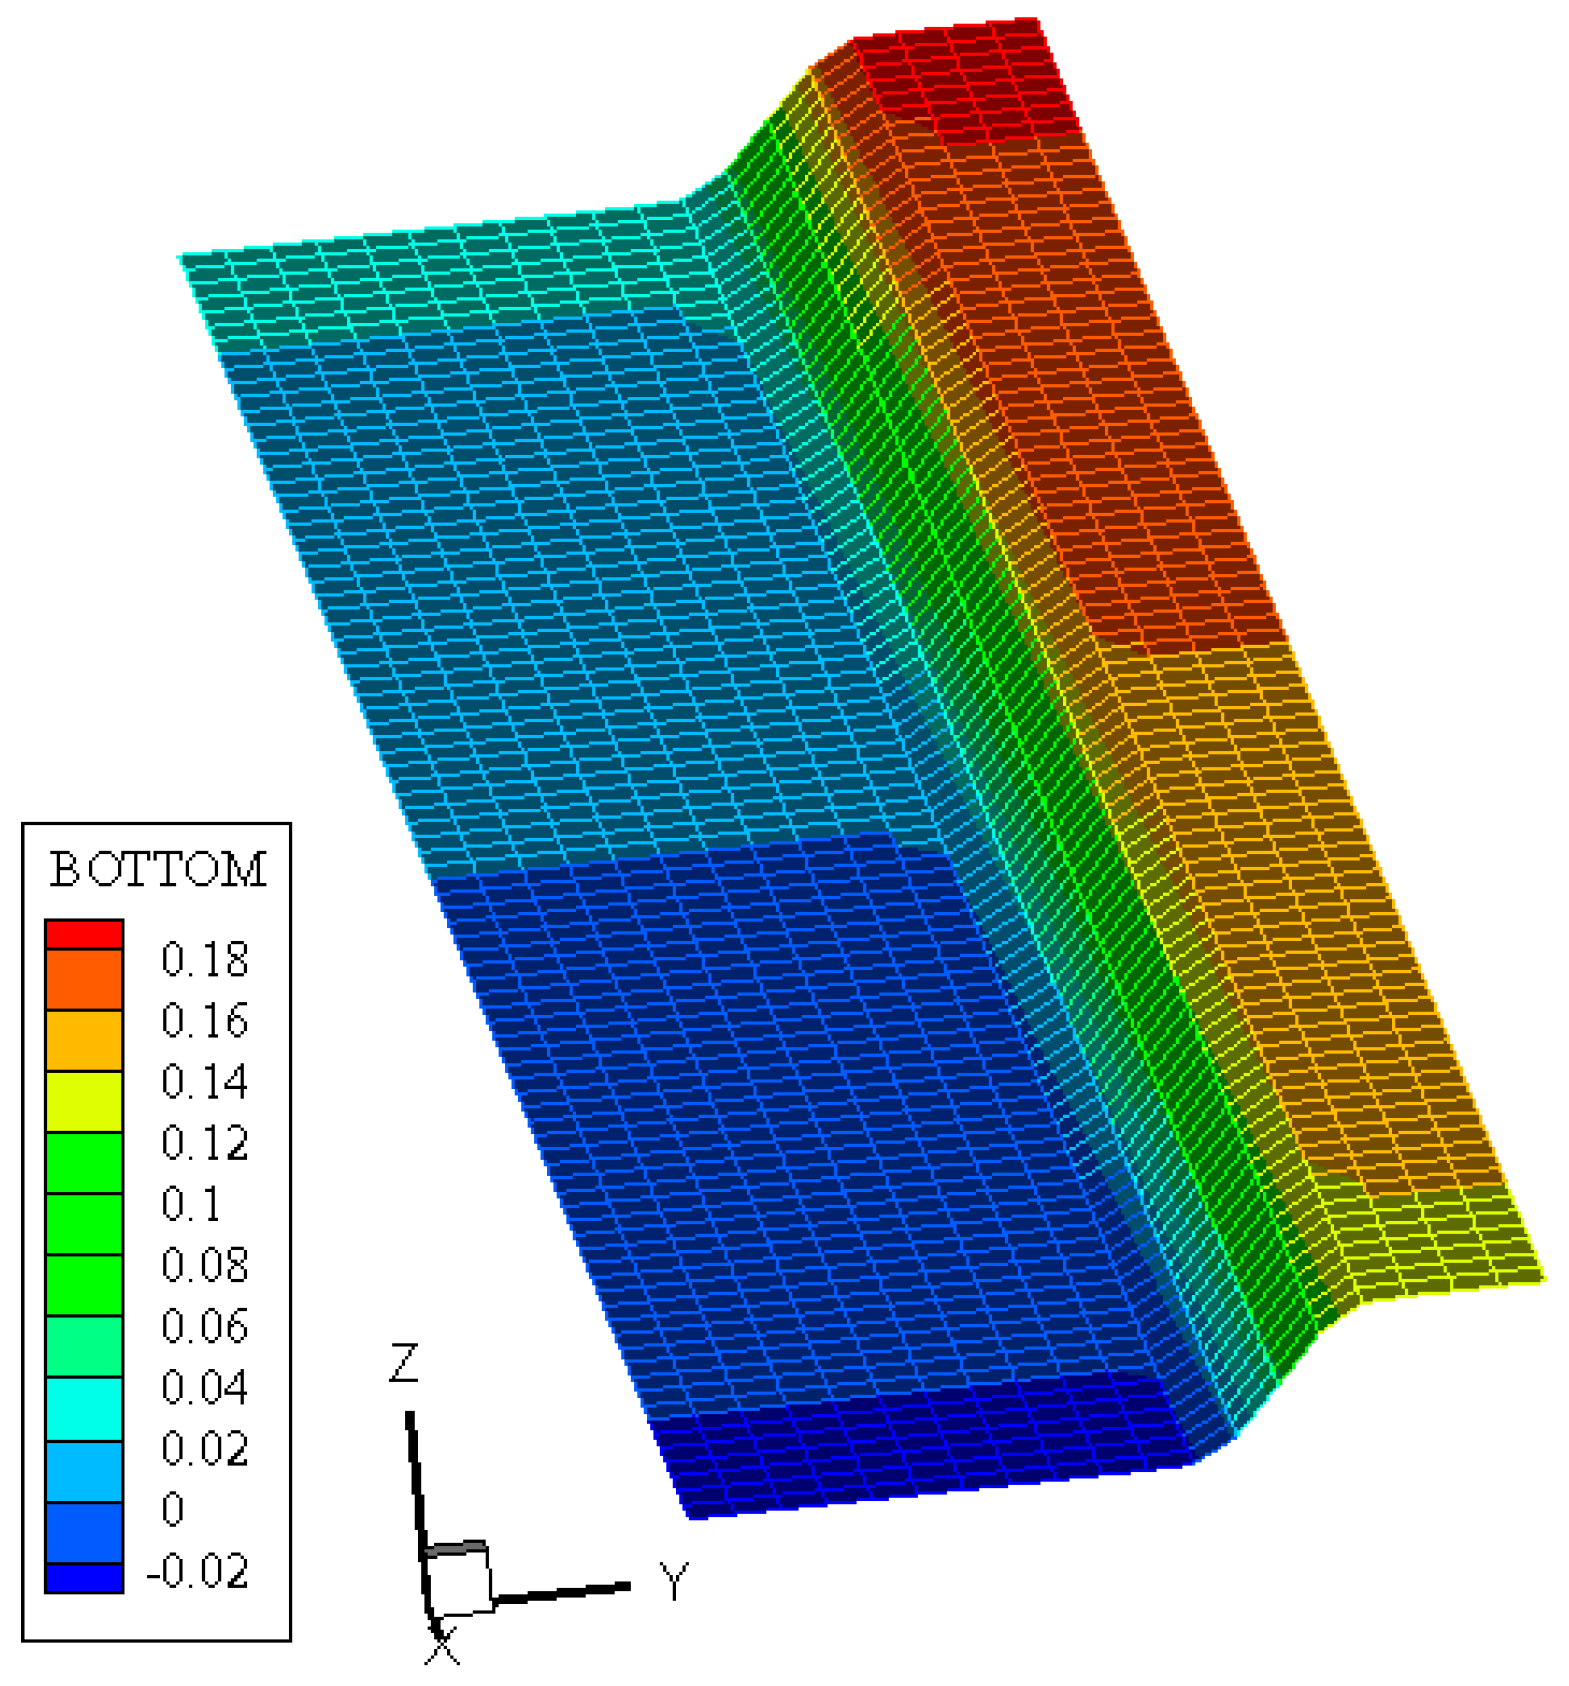
- conducting numerical studies of the reformation of inclined walls of a channel wall with a moving bottom;
- -
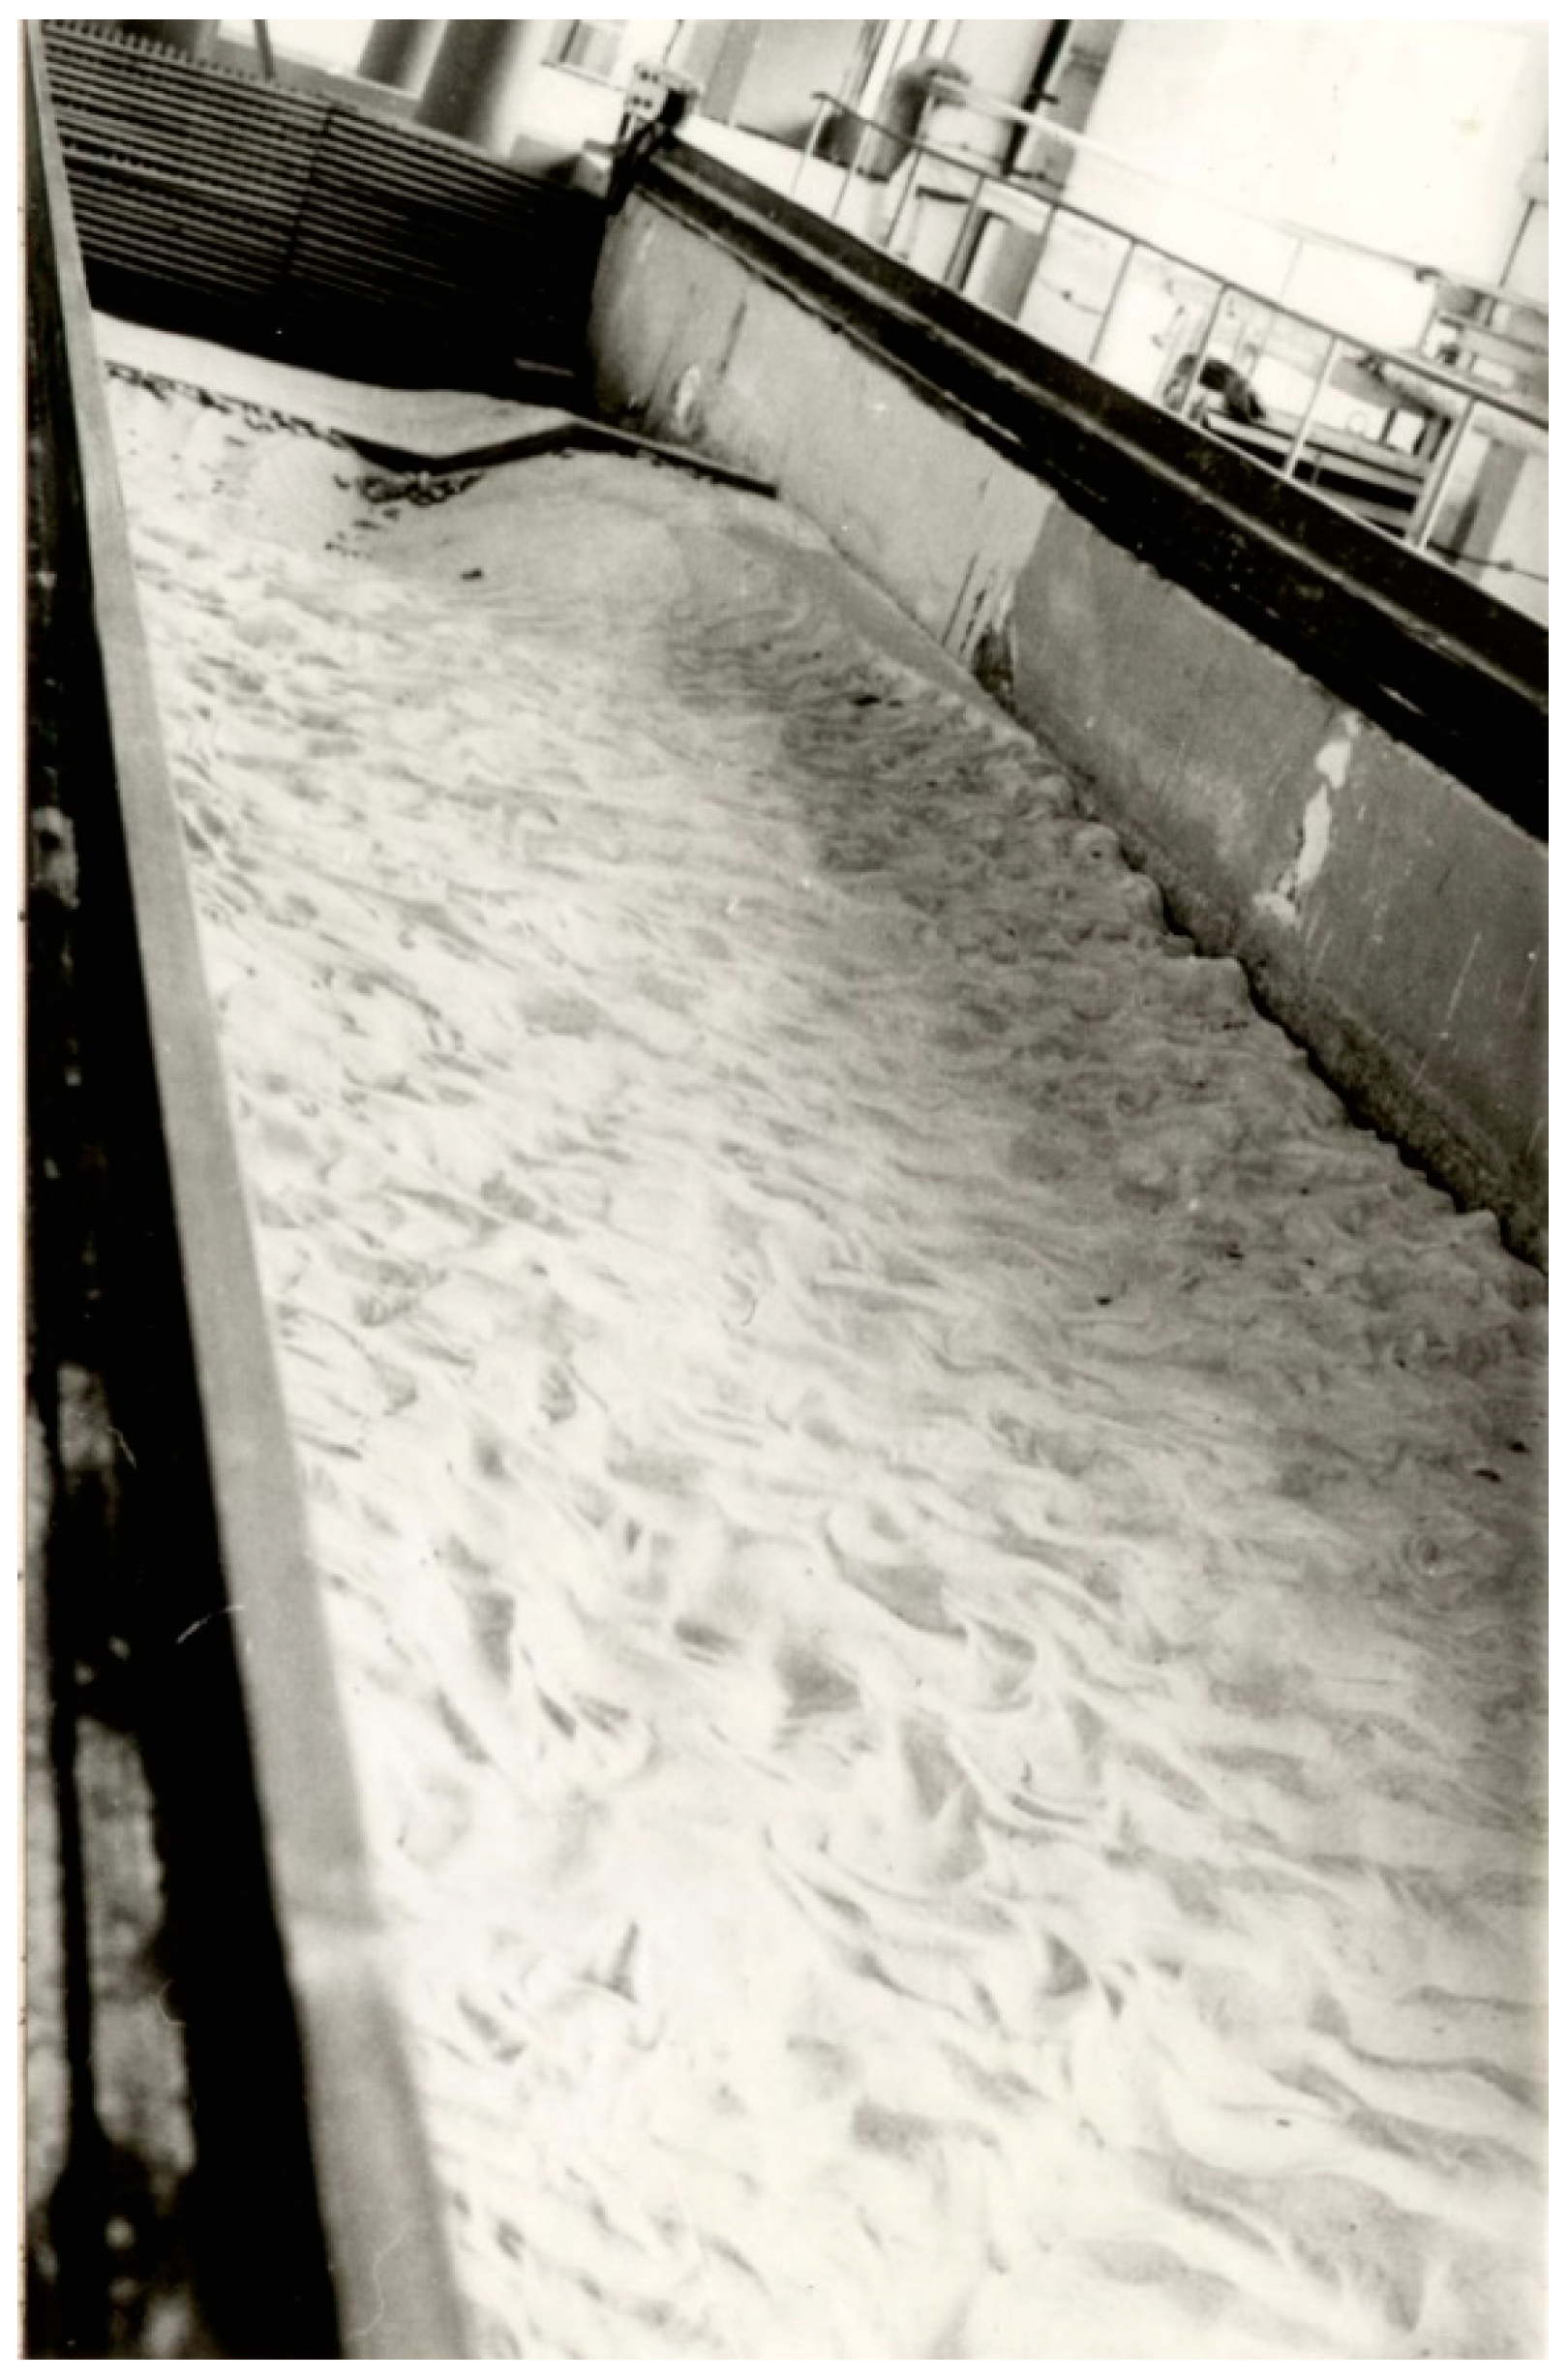
- conducting experimental studies
- -
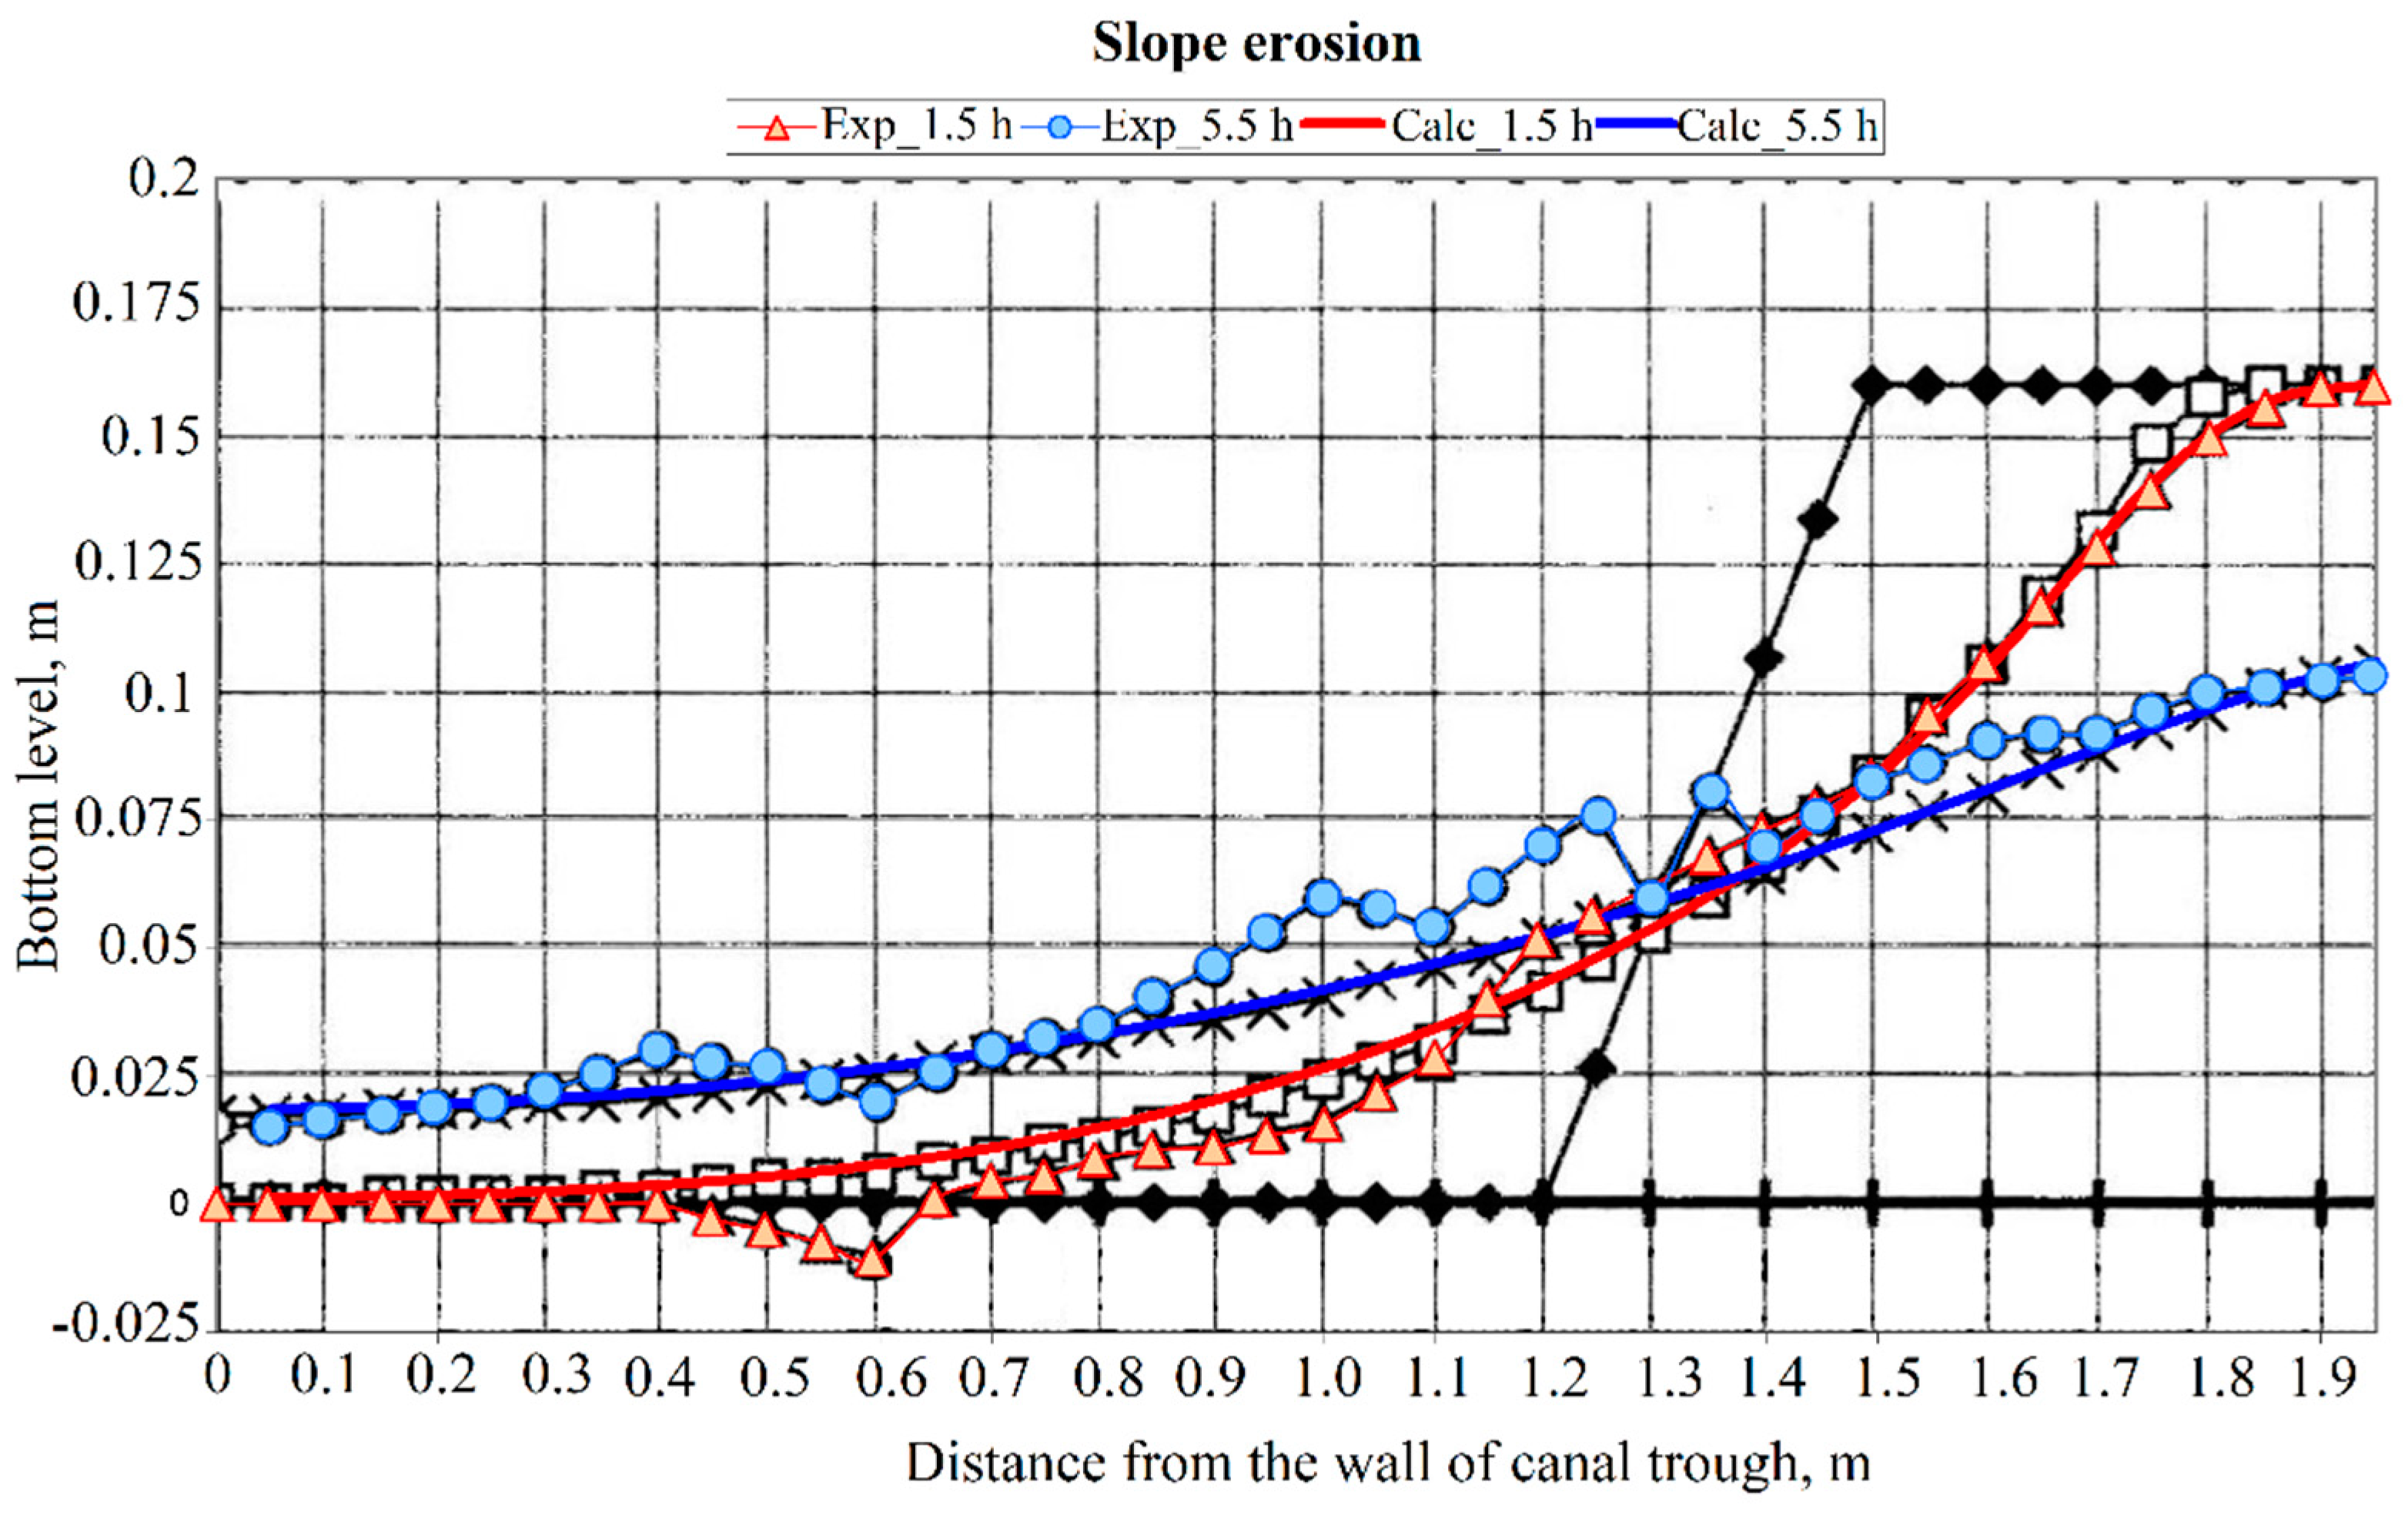
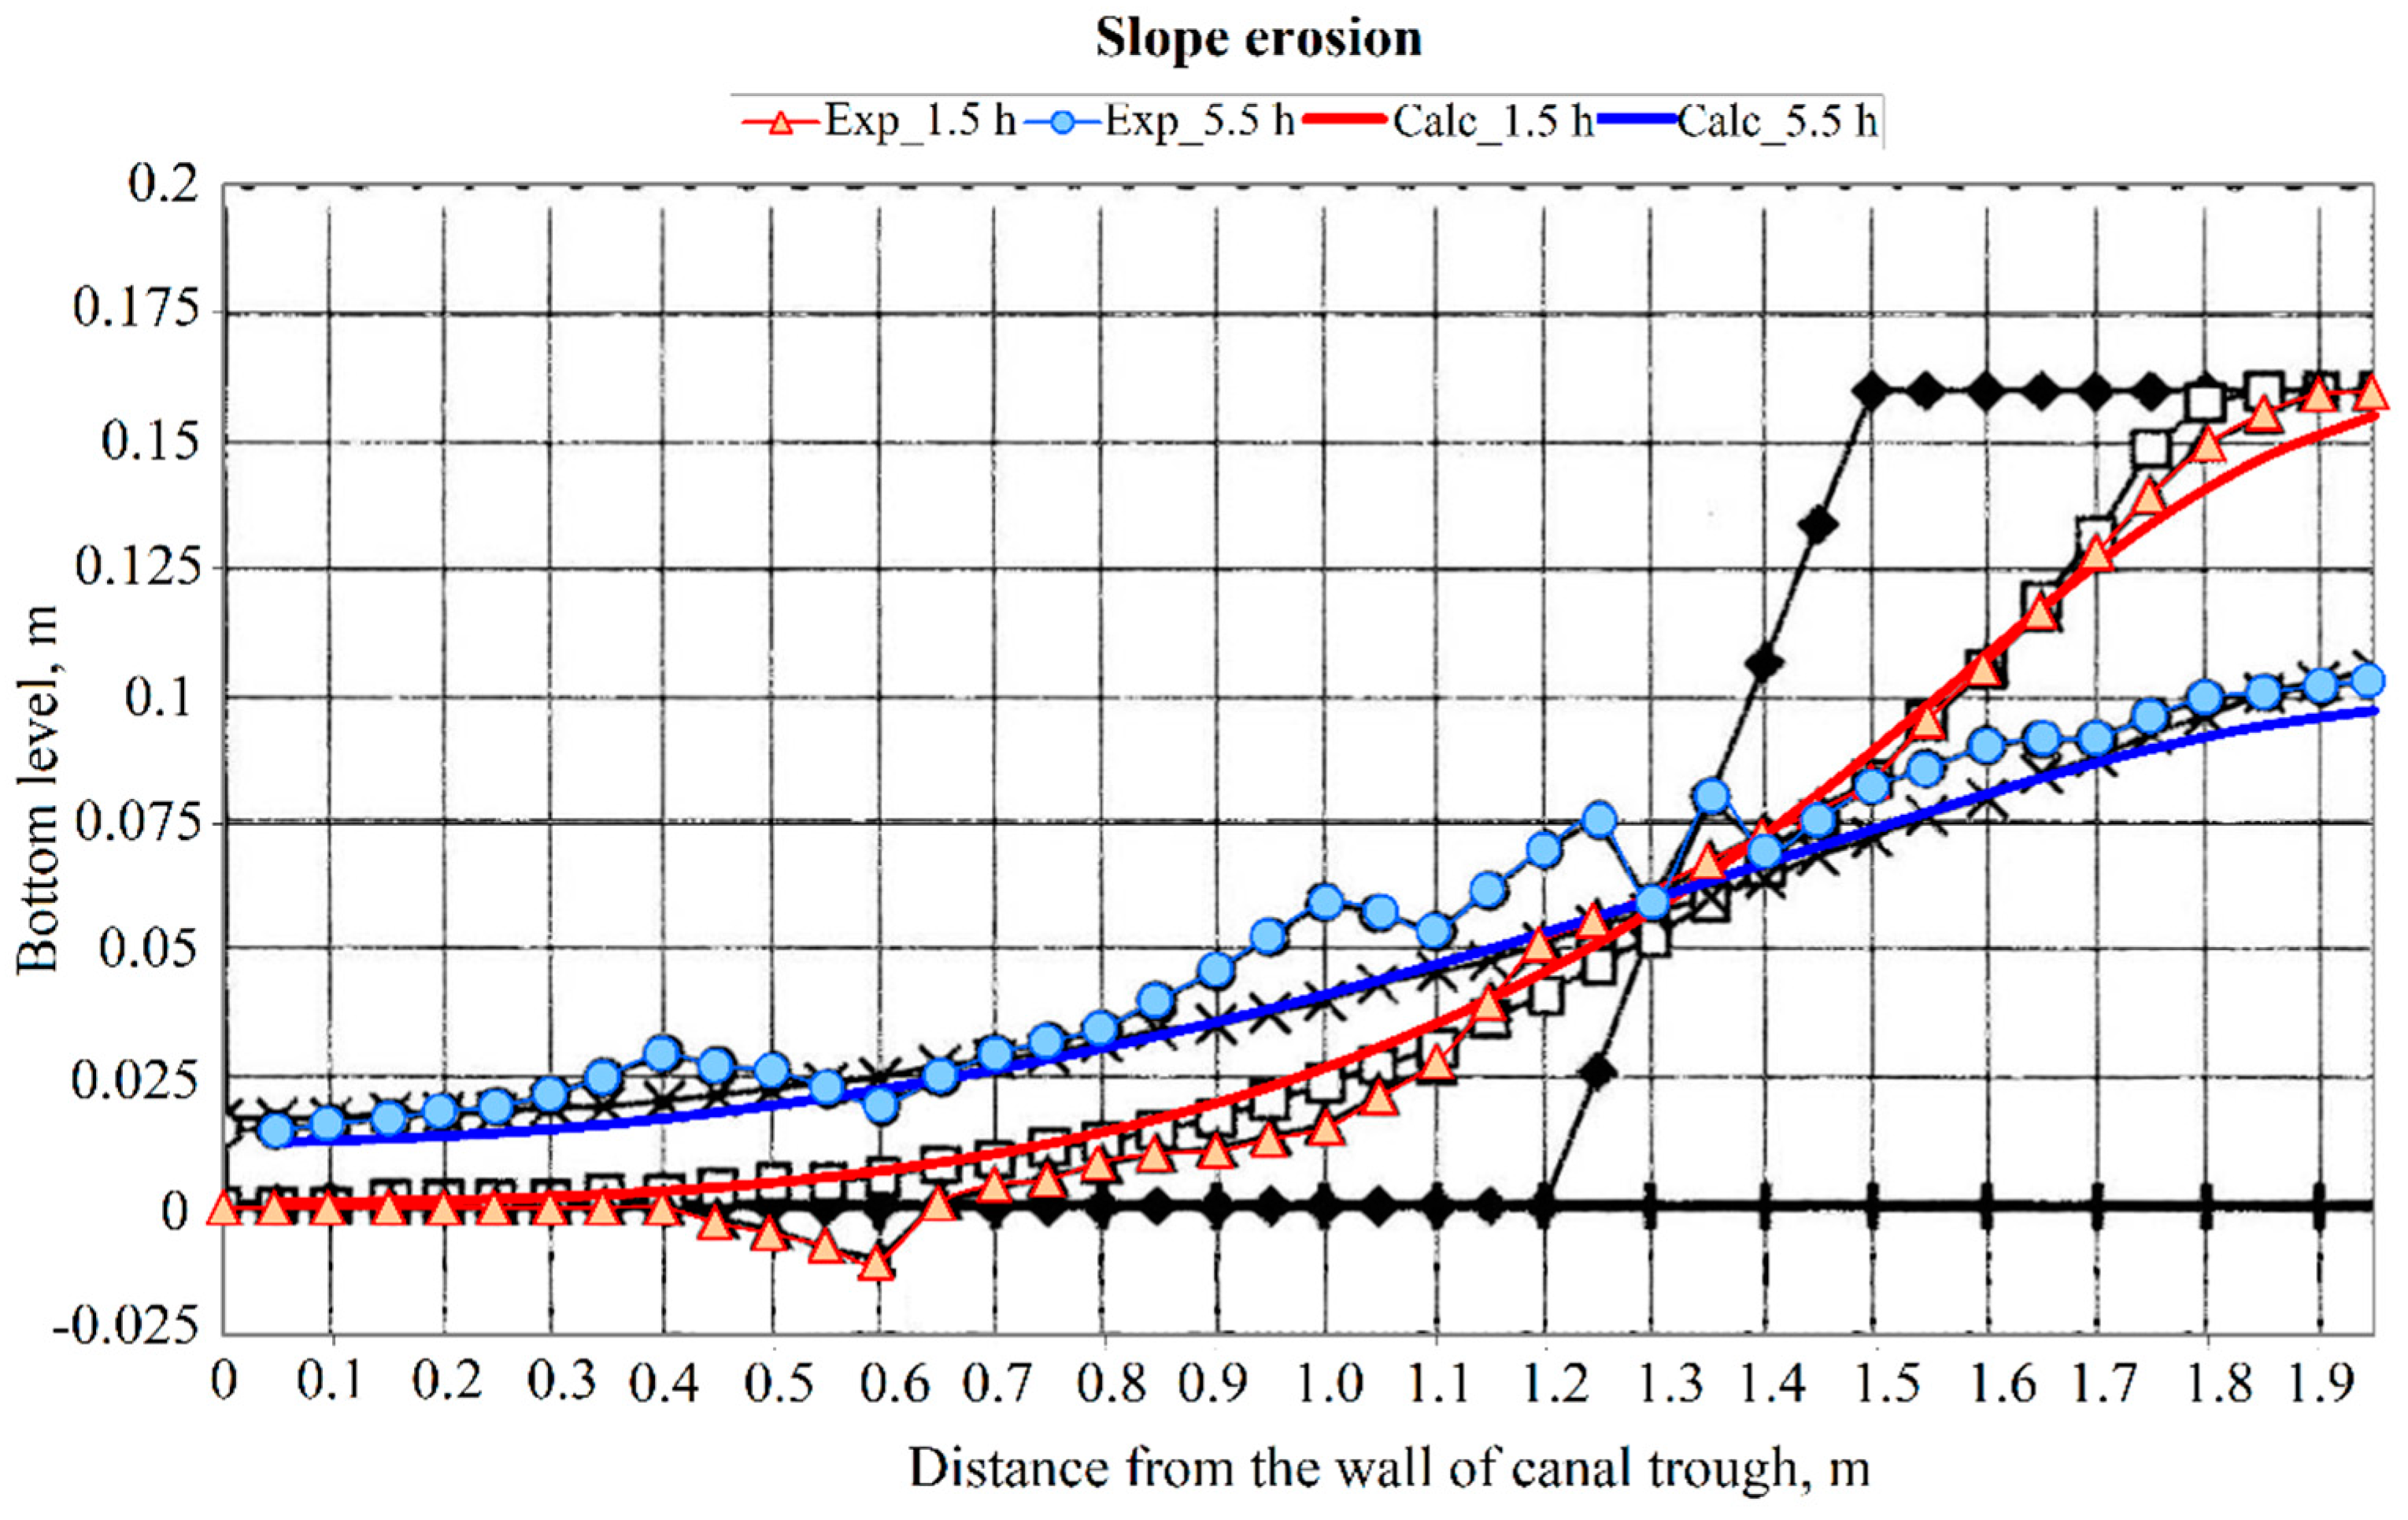
- comparison of the obtained results with the results of experimental studies.
2. Methods
2.1. Analytical studies
- −
- Choice of Flow Equation: The selection of the equation governing flow movement in the river bed is represented by a system of two-phase hydrodynamic equations of Saint-Venant. These equations are complemented by including equations related to sediment balance, transport, and the Bagnold equation.
- −
- Numerical and Experimental Studies: Numerical and experimental studies are conducted under conditions of a moving bottom by utilizing the chosen equations.
- −
- Comparison of Results: The obtained results from both numerical and experimental studies are thoroughly compared and analyzed.
2.1. Experimental studies
3. Results
3.1. Mathematical model
- −
- On solid boundaries, the condition of no flow is specified.
- −
- For liquid boundaries, flow rates or water levels are typically specified.
- −
- Water flows into the computational domain through the boundaries of the computational domain, and the precipitation concentration is set at these boundaries.
- −
- Complex boundary conditions were also sometimes used. The complex boundary conditions could link costs with levels and non-reflective boundary conditions.
3.2. Numerical model
4. Conclusions
- The proposed mathematical model (Section 3.1) and numerical model (Section 3.2) for bottom deformations in uneven and unsteady river flows are suitable for calculating deformable channels, making it applicable to scenarios such as the easily eroded bed of the Amu Darya River. The models are characterized by their simplicity, with a minimum number of equations and empirical constants.
- A two-dimensional mathematical and numerical models of a deformable channel were developed and successfully verified.
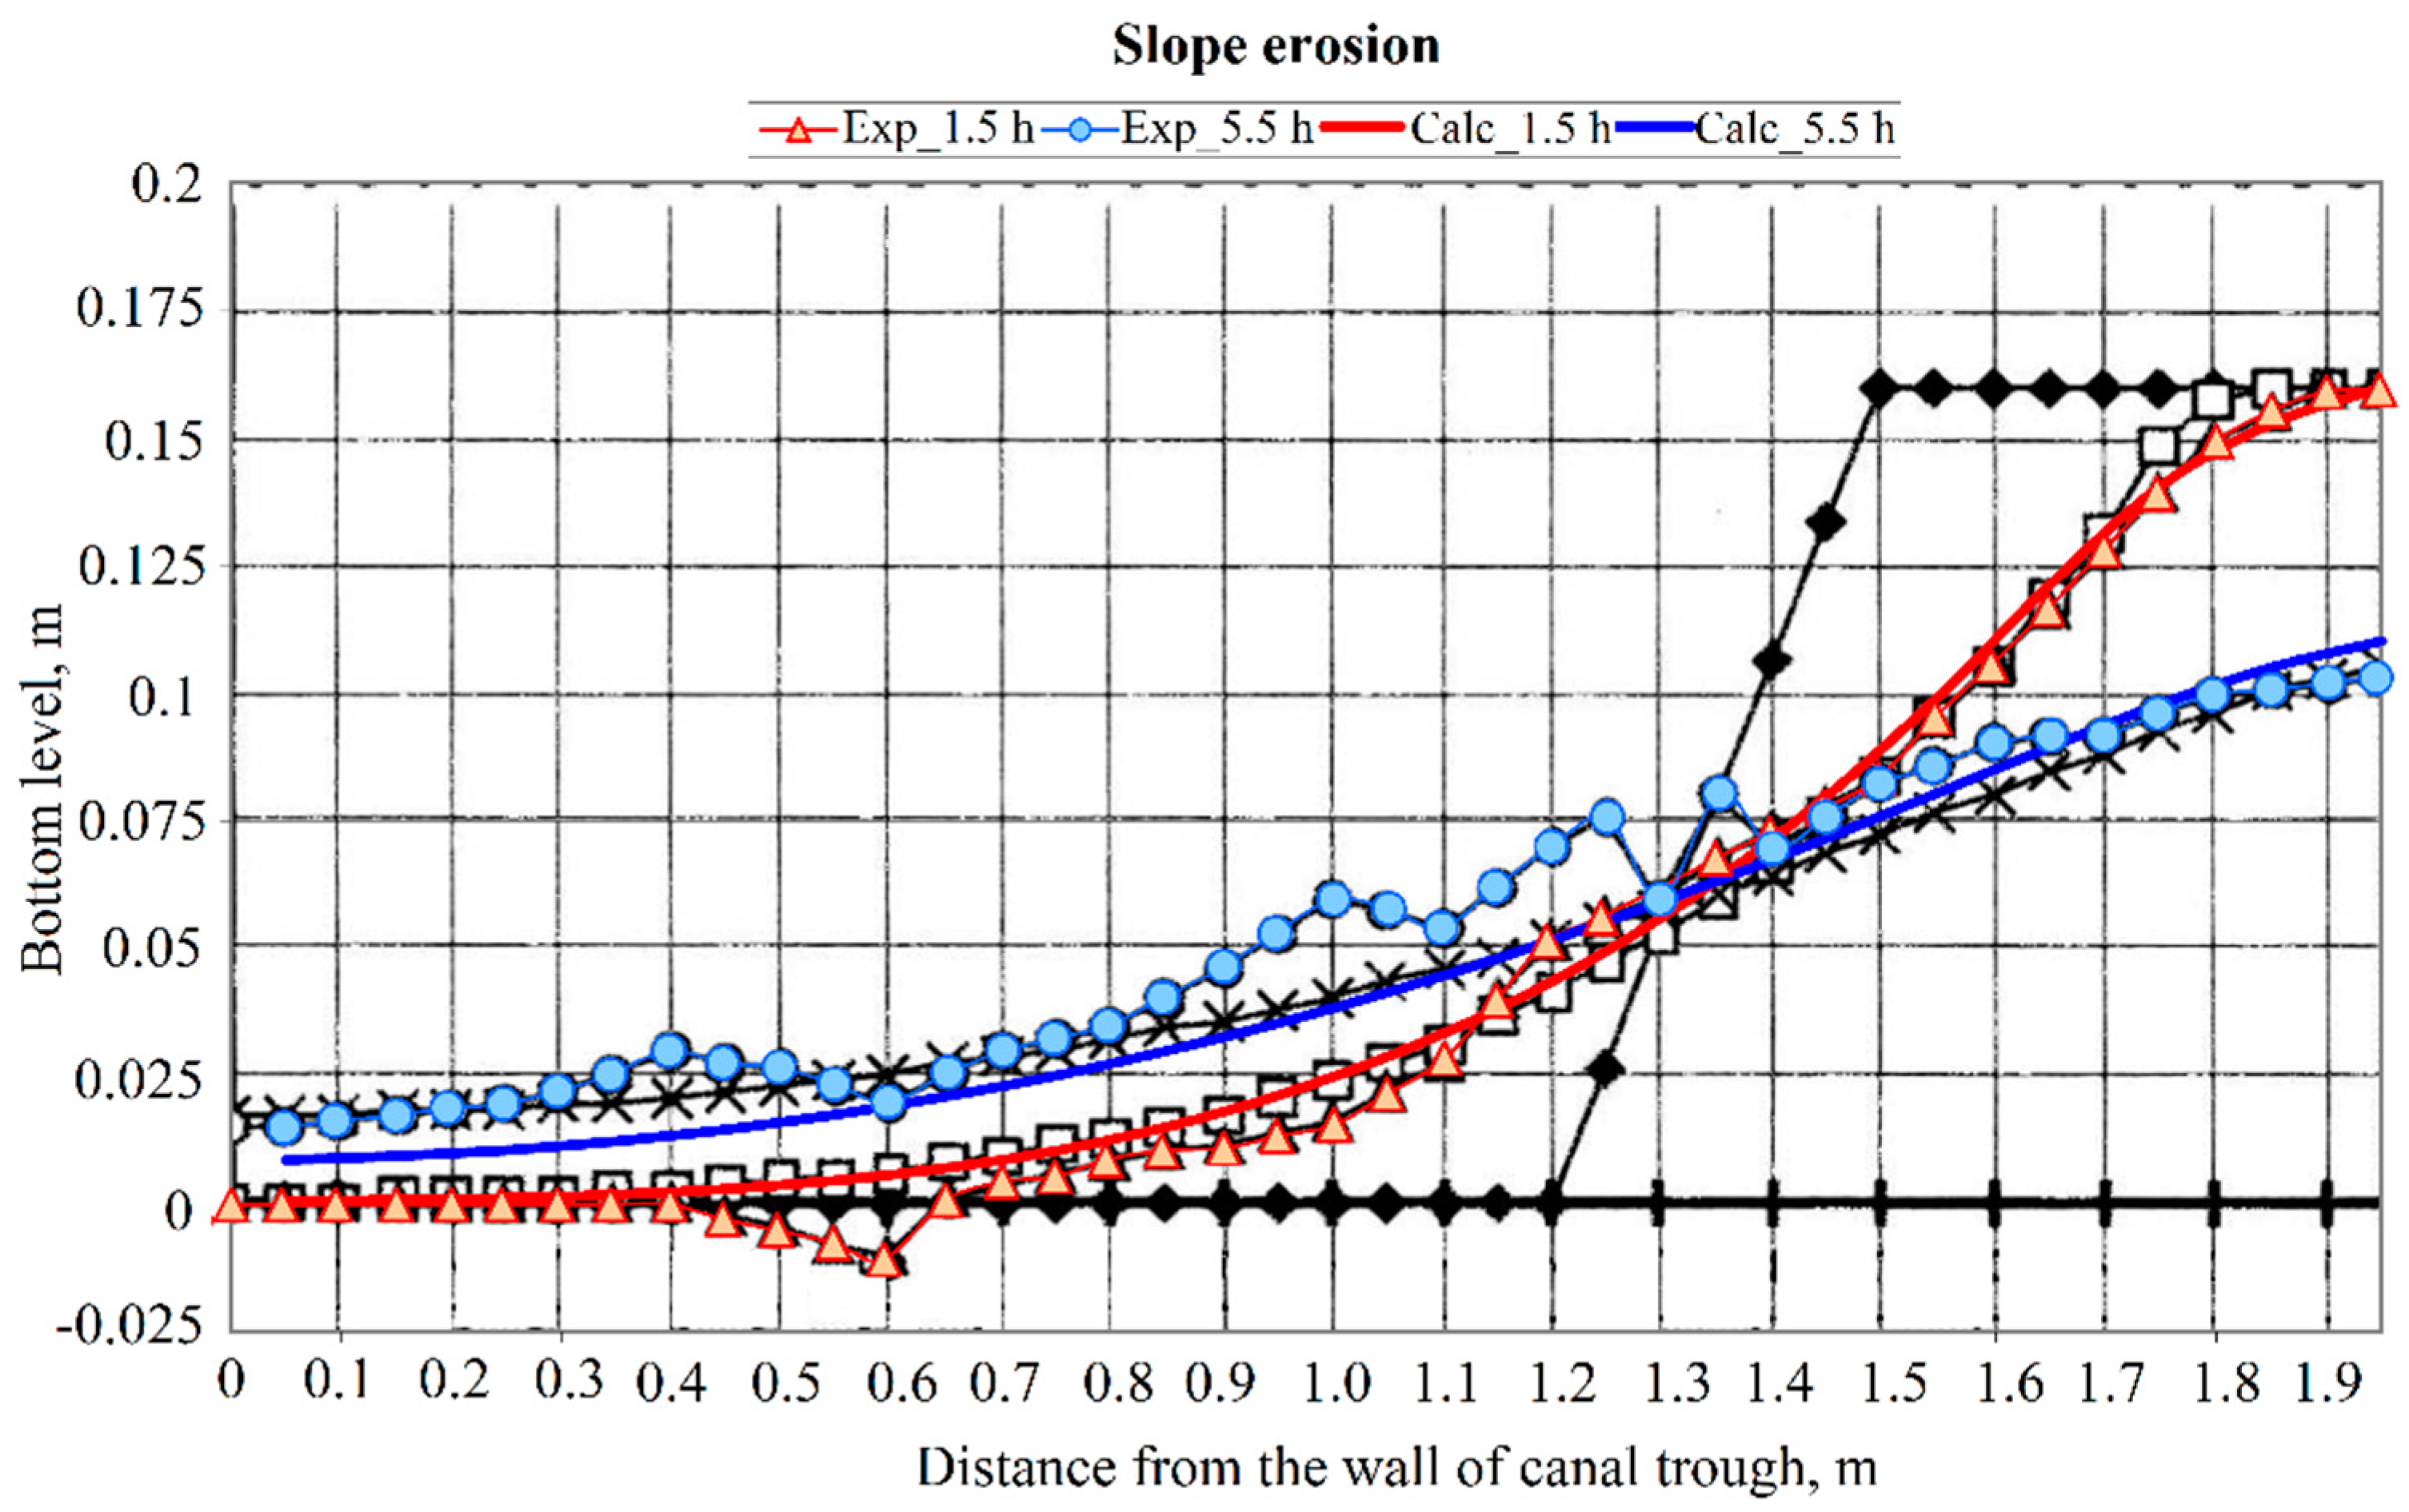
- Numerical studies were conducted to investigate channel deformation, providing insights into the nature and intensity of these deformations. Comparison with experimental data demonstrated good agreement in the experimental results. However, it's worth noting that the optimal values of empirical coefficients varied between different experiments, highlighting the need for further work to establish more universal closing relations for the model.
- Verifying the model using field data is crucial to enhance the model's applicability and reliability. Additionally, the extension of the model to account for hydraulically heterogeneous soils is a promising avenue, as the concentration transfer equation (equation 4) allows for independent calculations of different particle fractions, assuming the total concentration of particles in the flow is not excessively high.
Author Contributions
Funding
Conflicts of Interest
References
- Belikov, V. V., Zaitsev, A. A., Militeev, A. N. Mathematical modeling of complex reaches of large river channels. Water Resources. 2002, 29, 643-650. [CrossRef]
- Ivanenko, S. A., Koryavov, P. P., Militeev, A. N. Modern Computational technologies for calculating open flow dynamics. Water Resources. 2002, 29, 518-530. [CrossRef]
- Strelkoff, T. Numerical solution of Saint-Venant equations. Journal of the Hydraulics division, 1970, 96(1), 223-252. [CrossRef]
- Cooley, R. L., Moin, S. A. Finite element solution of Saint-Venant equations. Journal of the Hydraulics Division. 1976, 102(6), 759-775. [CrossRef]
- Bastin, G., Coron, J. M., d'Andréa-Novel, B. On Lyapunov stability of linearised Saint-Venant equations for a sloping channel. Networks Heterog. Media, 2009, 4(2), 177-187. [CrossRef]
- Ying, X., Khan, A. A., Wang, S. S. Upwind conservative scheme for the Saint Venant equations. Journal of hydraulic engineering. 2004, 130(10), 977-987. [CrossRef]
- Liu, H., Wang, H., Liu, S., Hu, C., Ding, Y., Zhang, J. Lattice Boltzmann method for the Saint–Venant equations. Journal of Hydrology. 2015, 524, 411-416. [CrossRef]
- Litrico, X., Fromion, V., Baume, J. P., Arranja, C., Rijo, M. Experimental validation of a methodology to control irrigation canals based on Saint-Venant equations. Control engineering practice. 2005, 13(11), 1425-1437. [CrossRef]
- Belikov, V.V., Zaitsev, A.A. Militeev, A.N. Numerical Modeling of Flow Kinematics in a Segment of Inerodable Channel. Water Resources. 2001, 28, 640–648. [CrossRef]
- Camporeale, C., Canuto, C. Ridolfi, L. A spectral approach for the stability analysis of turbulent open-channel flows over granular beds. Theor. Comput. Fluid Dyn. 2012, 26, 51–80. [CrossRef]
- Bai, Y., Xu, H. A study on the stability of laminar open-channel flow over a sandy rippled bed. Sci. China Ser. E-Technol. Sci. 2005, 48, 83–103. [CrossRef]
- Dalla Barba, F., Picano, F. Direct numerical simulation of the scouring of a brittle streambed in a turbulent channel flow. Acta Mech. 232, 2021, 4705–4728. [CrossRef]
- Bol'shakov, V.A., Kleshchevnikova, T.P. Use of the finite-element method in solving problems of hydraulics of open channels and structures. Hydrotechnical Construction. 1980, 14, 1182–1186. [CrossRef]
- Becchi, I. Considerations on the limits of integration field of de Saint Venant's equation for free surface flows. Meccanica. 1972, 7, 147–150. [CrossRef]
- Militeev, A. N., Bazarov, D. R. A two-dimensional mathematical model of the horizontal deformations of river channels. Water Resources. 1999, 26(1), 17-21.
- Bazarov, D., Markova, I., Raimova, I., Sultanov, S. Water flow motion in the vehicle of main channels. IOP Conf. Ser. Mater. Sci. Eng. 2020, 883, 012001. [CrossRef]
- Belikov, V. V., Zaitsev, A. A., Militeev, A. N. Numerical modeling of flow kinematics in a segment of inerodable channel. Water Resources. 2001, 28, 640-648. [CrossRef]
- Lyatkher, V. M., Militeev, A. N., Togunova, N. P. Investigation of the distribution of currents in the lower pools of hydraulic structures by numerical methods. Hydrotechnical Construction. 1978, 12(6), 585-593. [CrossRef]
- Bazarov, D., Vatin, N., Norkulov, B., Vokhidov, O., Raimova, I. Mathematical Model of Deformation of the River Channel in the Area of the Damless Water Intake. Cham: Springer International Publishing. 2022, pp. 1-15.
- Duc, B. M., Wenka, T., Rodi, W. Numerical modeling of bed deformation in laboratory channels. Journal of Hydraulic Engineering. 2004, 130(9), 894-904. [CrossRef]
- Duan, J. G., Julien, P. Y. Numerical simulation of meandering evolution. Journal of Hydrology. 2010, 391(1-2), 34-46. [CrossRef]
- Darby, S. E., Alabyan, A. M., Van de Wiel, M. J. Numerical simulation of bank erosion and channel migration in meandering rivers. Water Resources Research. 2002, 38(9). [CrossRef]
- Rinaldi, M., Mengoni, B., Luppi, L., Darby, S. E., Mosselman, E. Numerical simulation of hydrodynamics and bank erosion in a river bend. Water Resources Research. 2008, 44(9). [CrossRef]
- Nicholas, A. P., Sambrook Smith, G. H. Numerical simulation of three-dimensional flow hydraulics in a braided channel. Hydrological processes. 1999, 13(6), 913-929.
- Li, Z., Yang, R. and Zhao, Y. xin. (2023) Theoretical Profiles of Two-Phase Transcritical Laminar Boundary Layer near the Widom Line. International Journal of Multiphase Flow, Elsevier Ltd, 165. [CrossRef]
- Munir, B. and Du, D. (2023) Two-Dimensional Numerical Modelling of Viscous Emulsion Drops Coalescence in a Constricted Capillary Channel. International Journal of Multiphase Flow, Elsevier Ltd, 165. [CrossRef]
- Perrone, D., Kuerten, J.G.M., Ridolfi, L. and Scarsoglio, S. (2023) Investigating the Magnitude and Temporal Localization of Inertial Particle Mixing in Turbulent Channel Flows. International Journal of Multiphase Flow, Pergamon, 165, 104489. [CrossRef]
- Nguyen, H.M.K. and Oh, D.W. (2023) Alignment of Carbon Fiber and PDMS Mixture Flowing in 90° Elbow Channel. International Journal of Multiphase Flow, Elsevier Ltd, 165. [CrossRef]
- Zhang, X., Zeng, X., He, C. and Liu, Y. (2023) Large-Eddy Simulation of Turbulent Channel Flows with Antifouling-Featured Bionic Microstructures. International Journal of Heat and Fluid Flow, Elsevier, 104, 109228. [CrossRef]
- O'Connor, J., Laizet, S., Wynn, A., Edeling, W. and Coveney, P. V. (2024) Quantifying Uncertainties in Direct Numerical Simulations of a Turbulent Channel Flow. Computers & Fluids, Pergamon, 268, 106108. [CrossRef]
- Hirata, D., Morita, J., Mamori, H. and Miyazaki, T. (2023) Drag-Reduction Effect of Staggered Superhydrophobic Surfaces in a Turbulent Channel Flow. International Journal of Heat and Fluid Flow, Elsevier, 103, 109185. [CrossRef]
- Yu, Z., Lin, Z., Shao, X. and Wang, L.P. (2017) Effects of Particle-Fluid Density Ratio on the Interactions between the Turbulent Channel Flow and Finite-Size Particles. Physical Review E, American Physical Society, 96, 104659. [CrossRef]
- Xia, Y., Lin, Z., Guo, Y. and Yu, Z. (2023) Models of Interphase Drag Force from Direct Numerical Simulations of Upward Turbulent Particle-Laden Channel Flows. Powder Technology, Elsevier, 428, 118794. [CrossRef]
- Fusi, L., Calusi, B., Farina, A. and Rosso, F. (2022) Stability of Laminar Viscoplastic Flows down an Inclined Open Channel. European Journal of Mechanics - B/Fluids, Elsevier Masson, 95, 137–147. [CrossRef]
- Talukdar, D., Li, C.G. and Tsubokura, M. (2019) Investigation on Optimization of the Thermal Performance for Compressible Laminar Natural Convection Flow in Open-Ended Vertical Channel. International Journal of Heat and Mass Transfer, Pergamon, 128, 794–806. [CrossRef]
- Burger, J., Haldenwang, R. and Alderman, N. (2010) Friction Factor-Reynolds Number Relationship for Laminar Flow of Non-Newtonian Fluids in Open Channels of Different Cross-Sectional Shapes. Chemical Engineering Science, Pergamon, 65, 3549–3556. [CrossRef]
- Yang, Y., Jiang, W.Q., Wu, Y.H., Wang, P., Wu, Z., Zhang, B. and Zeng, L. (2021) Migration of Buoyancy-Controlled Active Particles in a Laminar Open-Channel Flow. Advances in Water Resources, Elsevier, 156, 104023. [CrossRef]
- Ahmed, E.N. and Bottaro, A. (2024) Laminar Flow in a Channel Bounded by Porous/Rough Walls: Revisiting Beavers-Joseph-Saffman. European Journal of Mechanics - B/Fluids, Elsevier Masson, 103, 269–283. [CrossRef]
- Alomari, N.K., Altalib, A.N. and Al-Janabi, A.M.S. (2023) Discharge Estimation Using Brink Depth over a Trapezoidal-Shaped Weir. Flow Measurement and Instrumentation, Elsevier Ltd, 94. [CrossRef]
- Wulandana, R. (2021) Open Water Flume for Fluid Mechanics Lab. Fluids, MDPI AG, 6. [CrossRef]
- Vatankhah, A.R. (2023) Uniform Flow Depth in Trapezoidal Open Channels. Flow Measurement and Instrumentation, Elsevier Ltd, 94. [CrossRef]
- Folkard, A.M. and Gascoigne, J.C. (2009) Hydrodynamics of Discontinuous Mussel Beds: Laboratory Flume Simulations. Journal of Sea Research, 62, 250–257. [CrossRef]
- Isidoro, J.M.G.P., Martins, R., Pereira, L.G. and de Lima, J.L.M.P. (2023) Design and Characterisation of Customised-Roughness Beds for Open-Channel Flow Experiments. Flow Measurement and Instrumentation, Elsevier, 94, 102472. [CrossRef]
- Wang, B., Xu, Y.J., Xu, W., Cheng, H., Chen, Z. and Zhang, W. (2020) Riverbed Changes of the Uppermost Atchafalaya River, USA—A Case Study of Channel Dynamics in Large Man-Controlled Alluvial River Confluences. Water 2020, Vol. 12, Page 2139, Multidisciplinary Digital Publishing Institute, 12, 2139. [CrossRef]
- Kaveh, K., Reisenbüchler, M., Lamichhane, S., Liepert, T., Nguyen, N.D., Bui, M.D. and Rutschmann, P. (2019) A Comparative Study of Comprehensive Modeling Systems for Sediment Transport in a Curved Open Channel. Water 2019, Vol. 11, Page 1779, Multidisciplinary Digital Publishing Institute, 11, 1779. [CrossRef]
- Kim, Y., Choi, G., Park, H. and Byeon, S. (2015) Hydraulic Jump and Energy Dissipation with Sluice Gate. Water 2015, Vol. 7, Pages 5115-5133, Multidisciplinary Digital Publishing Institute, 7, 5115–5133. [CrossRef]
- Gladkov, G., Habel, M., Babiński, Z. and Belyakov, P. (2021) Sediment Transport and Water Flow Resistance in Alluvial River Channels: Modified Model of Transport of Non-Uniform Grain-Size Sediments. Water 2021, Vol. 13, Page 2038, Multidisciplinary Digital Publishing Institute, 13, 2038. [CrossRef]
- Wang, S., Yang, B., Chen, H., Fang, W. and Yu, T. (2022) LSTM-Based Deformation Prediction Model of the Embankment Dam of the Danjiangkou Hydropower Station. Water 2022, Vol. 14, Page 2464, Multidisciplinary Digital Publishing Institute, 14, 2464. [CrossRef]
- Qi, H., Yuan, T., Zhao, F., Chen, G., Tian, W. and Li, J. (2023) Local Scour Reduction around Cylindrical Piers Using Permeable Collars in Clear Water. Water 2023, Vol. 15, Page 897, Multidisciplinary Digital Publishing Institute, 15, 897. [CrossRef]
- Jiang, H., Zhao, B., Dapeng, Z. and Zhu, K. (2023) Numerical Simulation of Two-Dimensional Dam Failure and Free-Side Deformation Flow Studies. Water 2023, Vol. 15, Page 1515, Multidisciplinary Digital Publishing Institute, 15, 1515. [CrossRef]
| Fraction diameter (mm) | 1-0.5 | 0.5-0.25 | 0.25-0.1 | <0.1 |
| Content (%) | 0.2 | 31.9 | 67.7 | 0.2 |
Disclaimer/Publisher’s Note: The statements, opinions and data contained in all publications are solely those of the individual author(s) and contributor(s) and not of MDPI and/or the editor(s). MDPI and/or the editor(s) disclaim responsibility for any injury to people or property resulting from any ideas, methods, instructions or products referred to in the content. |
© 2023 by the authors. Licensee MDPI, Basel, Switzerland. This article is an open access article distributed under the terms and conditions of the Creative Commons Attribution (CC BY) license (http://creativecommons.org/licenses/by/4.0/).


