Submitted:
05 December 2023
Posted:
06 December 2023
You are already at the latest version
Abstract
Keywords:
1. Introduction
2. Materials and Methods
2.1. Data
2.1.1. Observed gridded precipitation products
2.1.2. NARR reanalysis
2.1.3. CFS
2.2. Methodology
2.2.1. The GP-LLJ index
2.2.2. The CGT index
- Band-pass filter and power spectra
2.2.3. The thirty-day forecast of the CFS
2.2.4. Spatial and temporal attributions
- Correlation threshold selection
3. Results
3.1. Diagnostics of NGP precipitation, GP-LLJ, and CGT
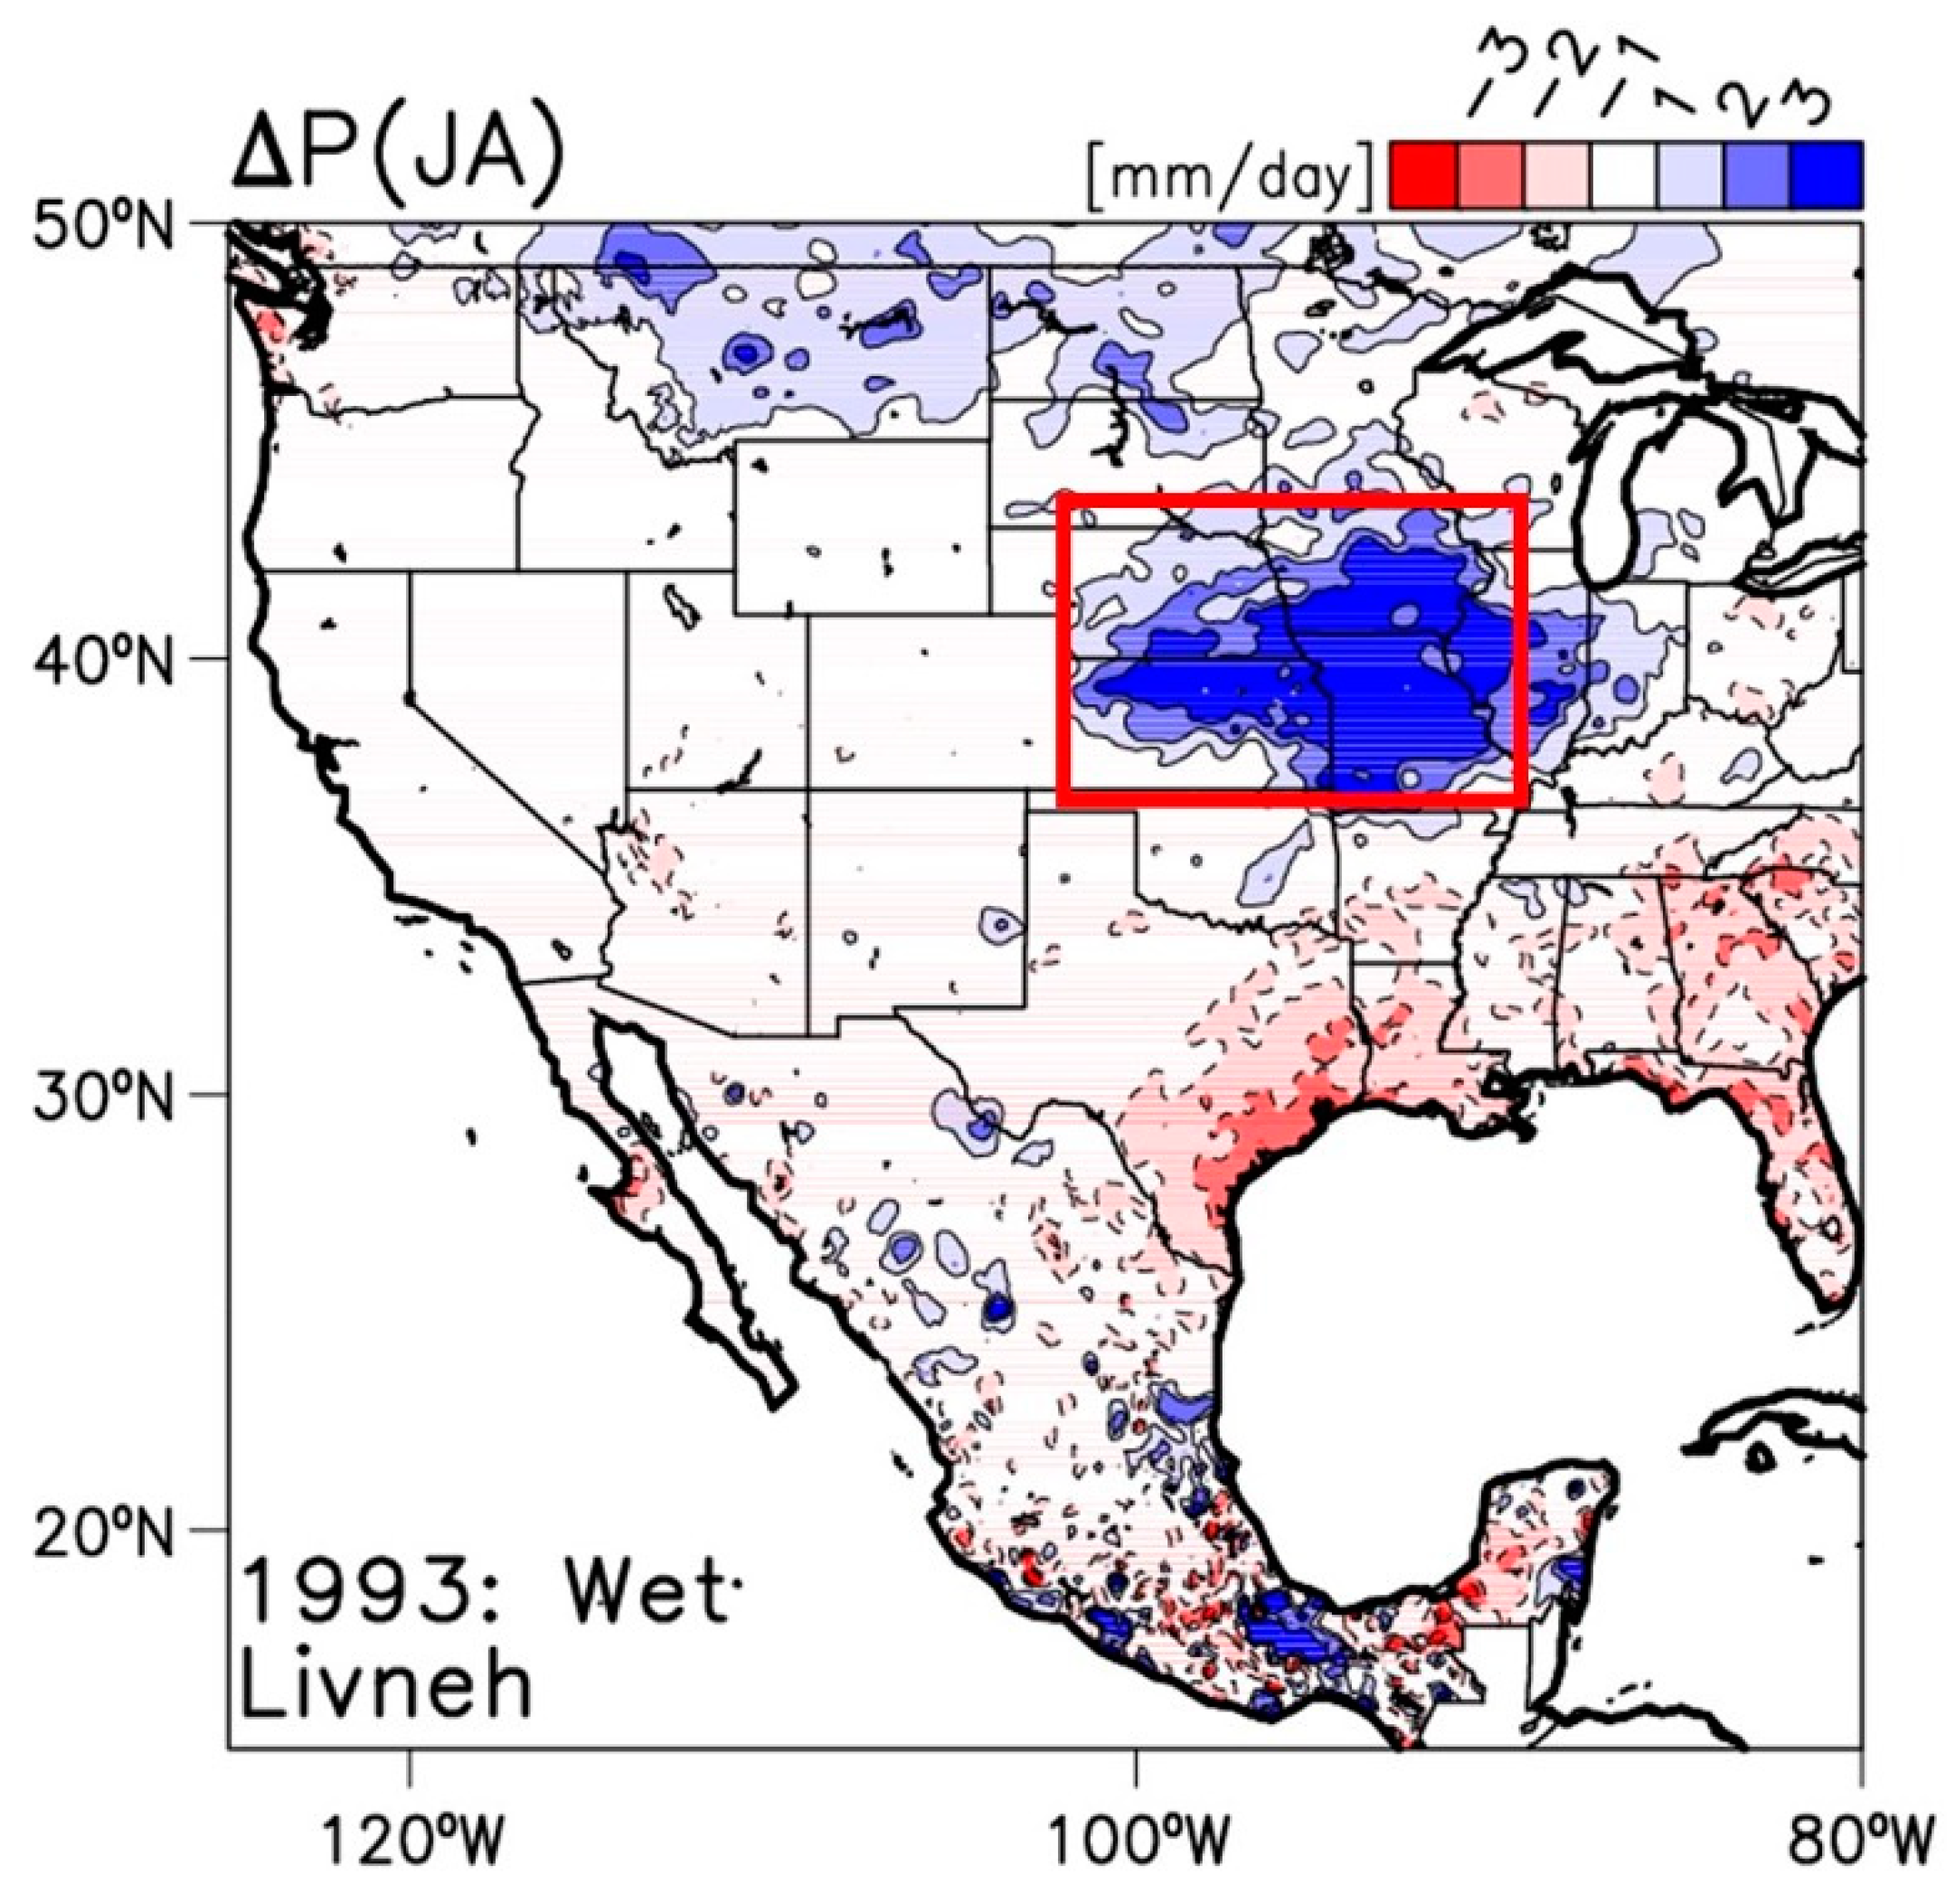
3.1.1. Geospatial precipitation pattern attributions
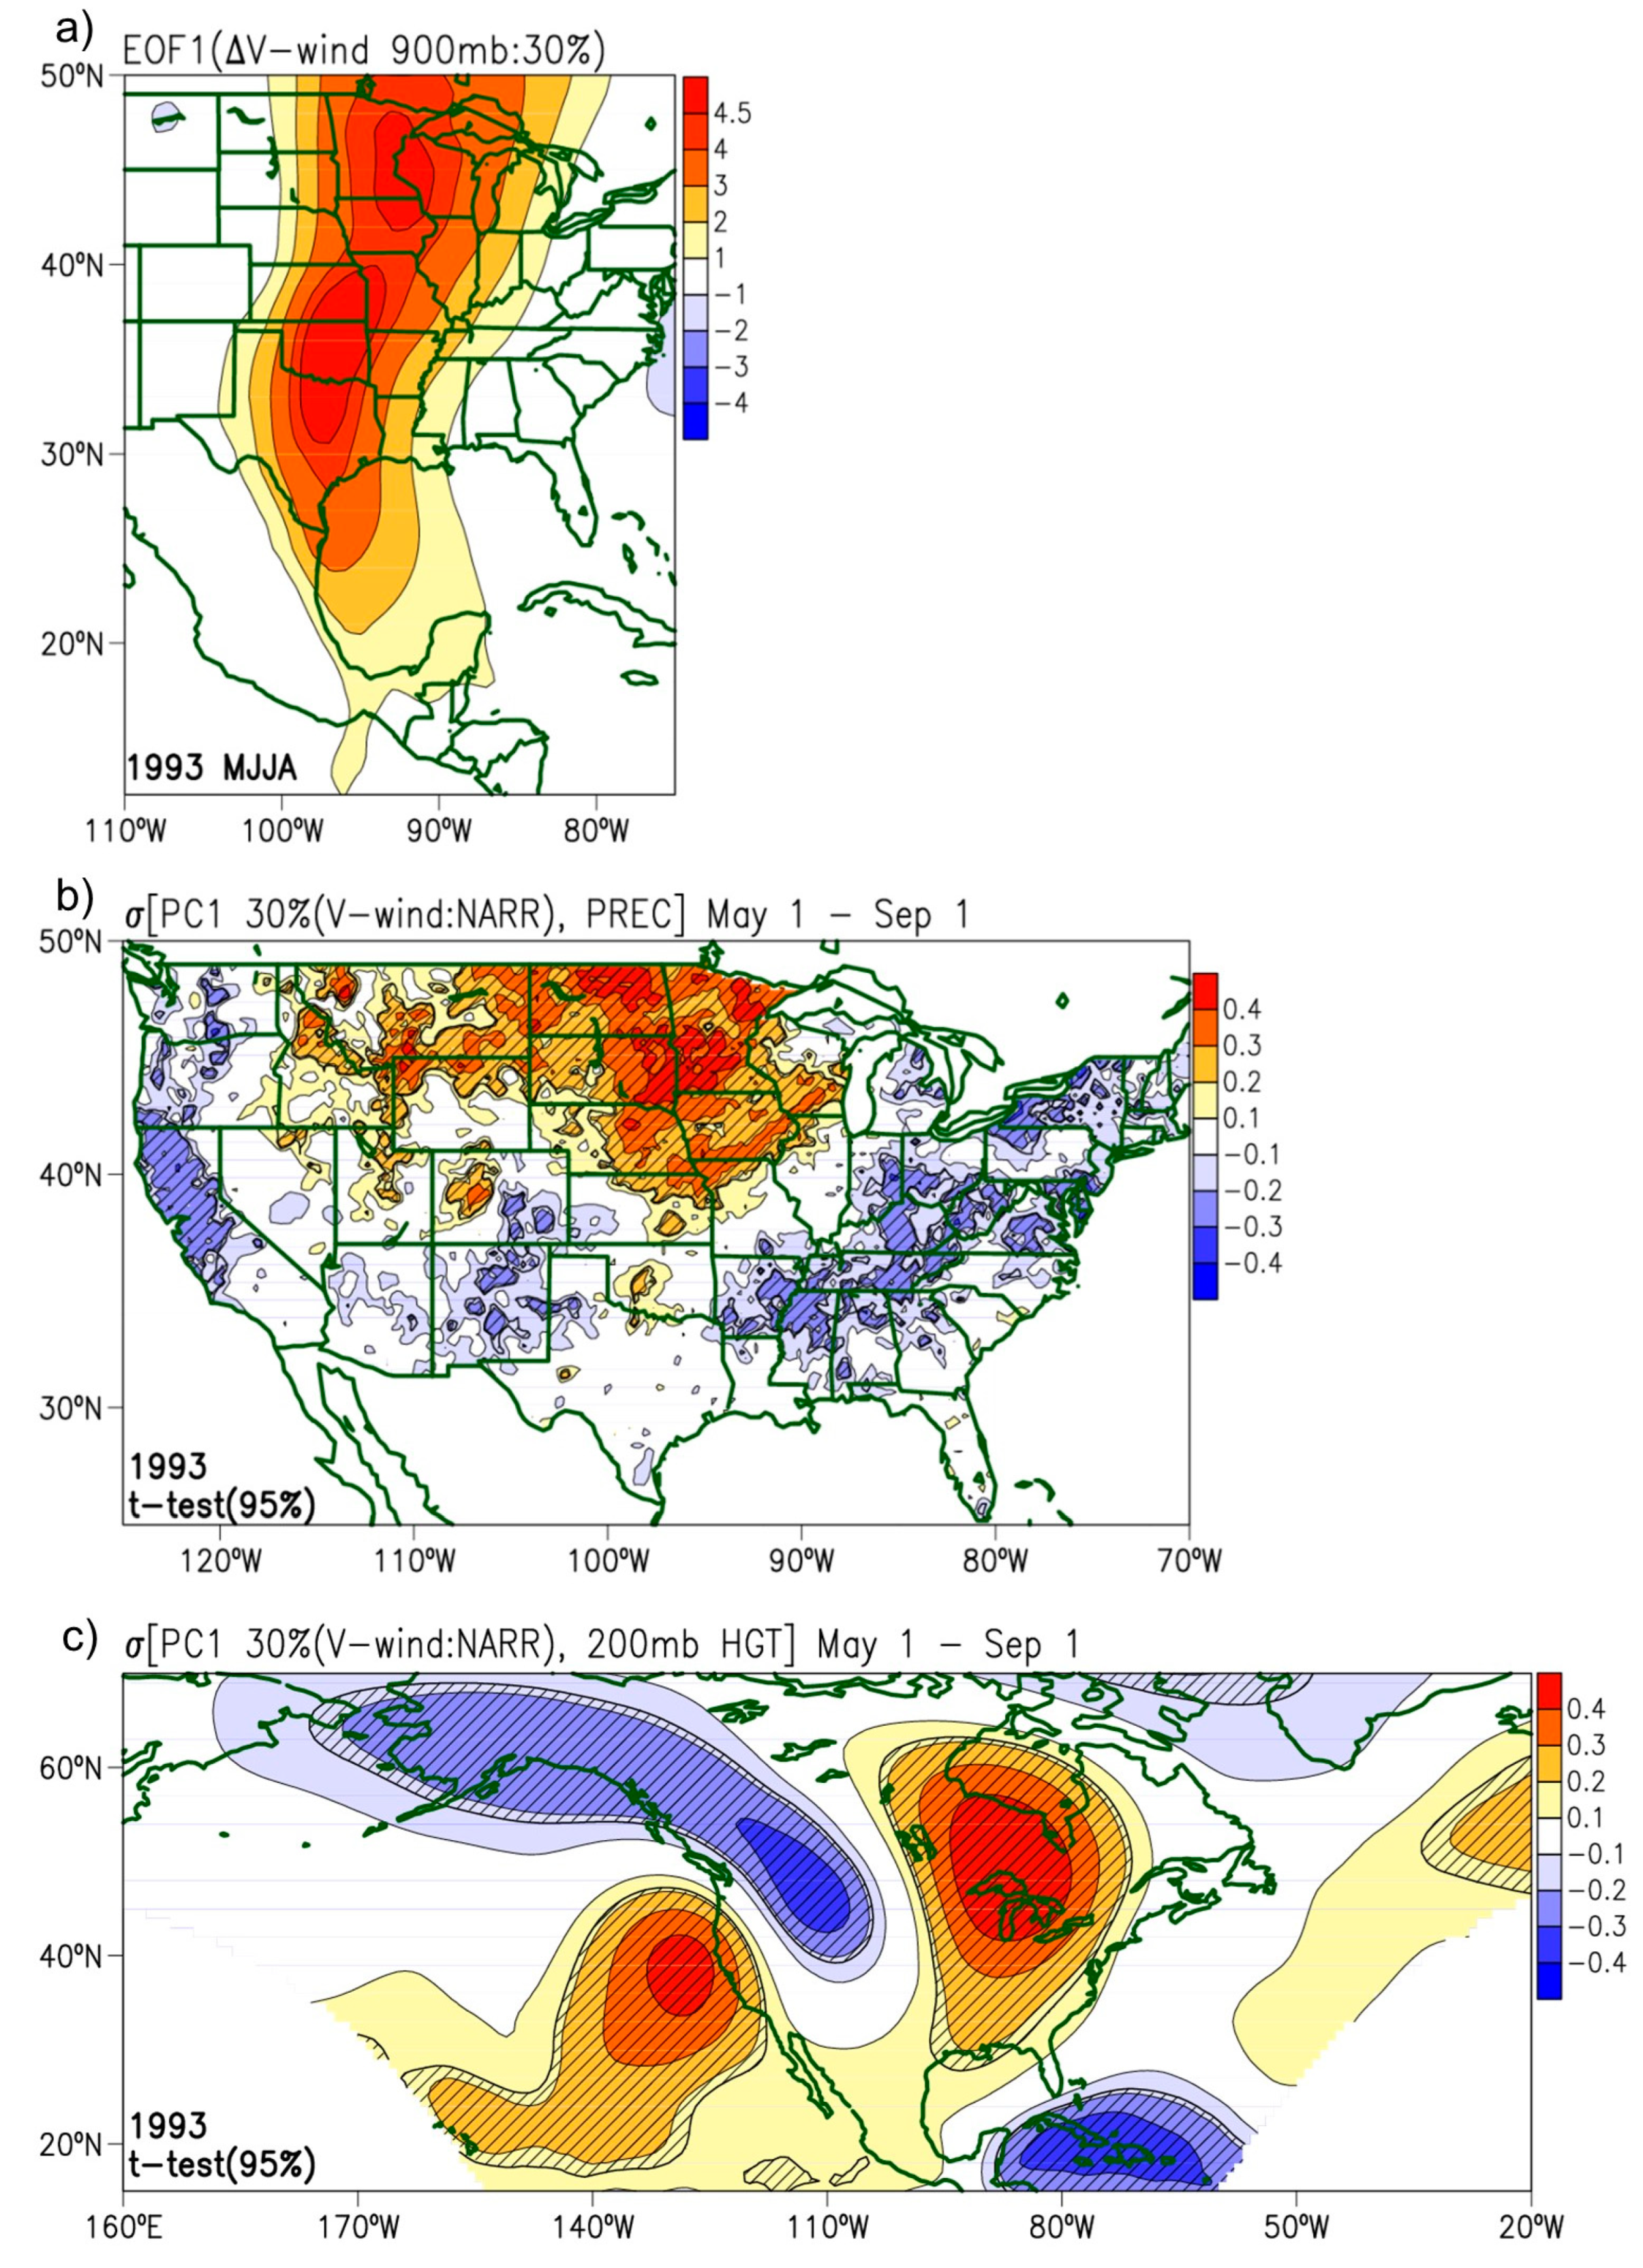
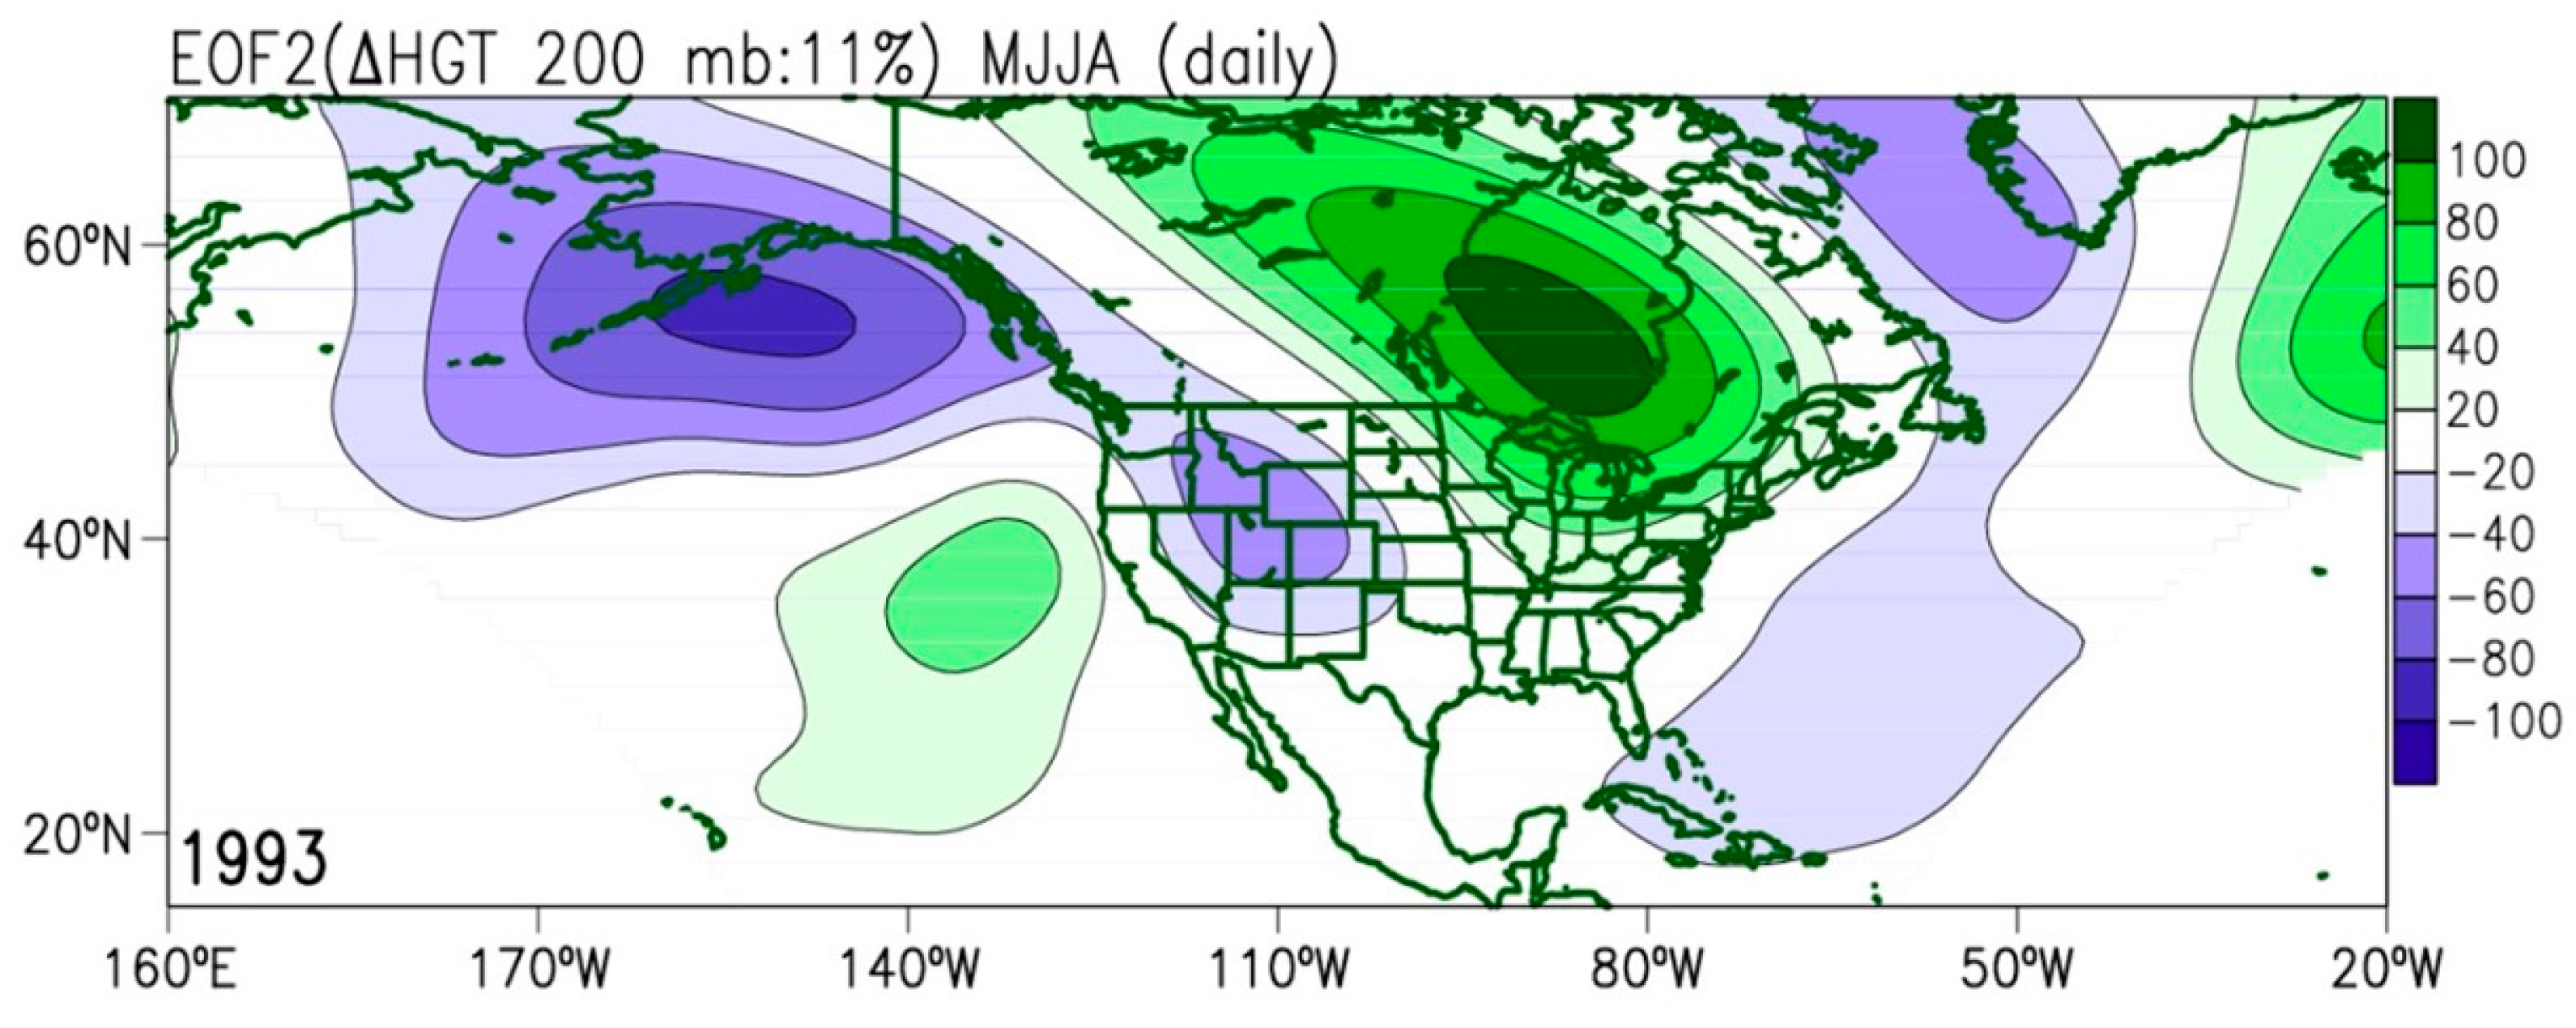
3.1.2. Sub-seasonal modes of variability
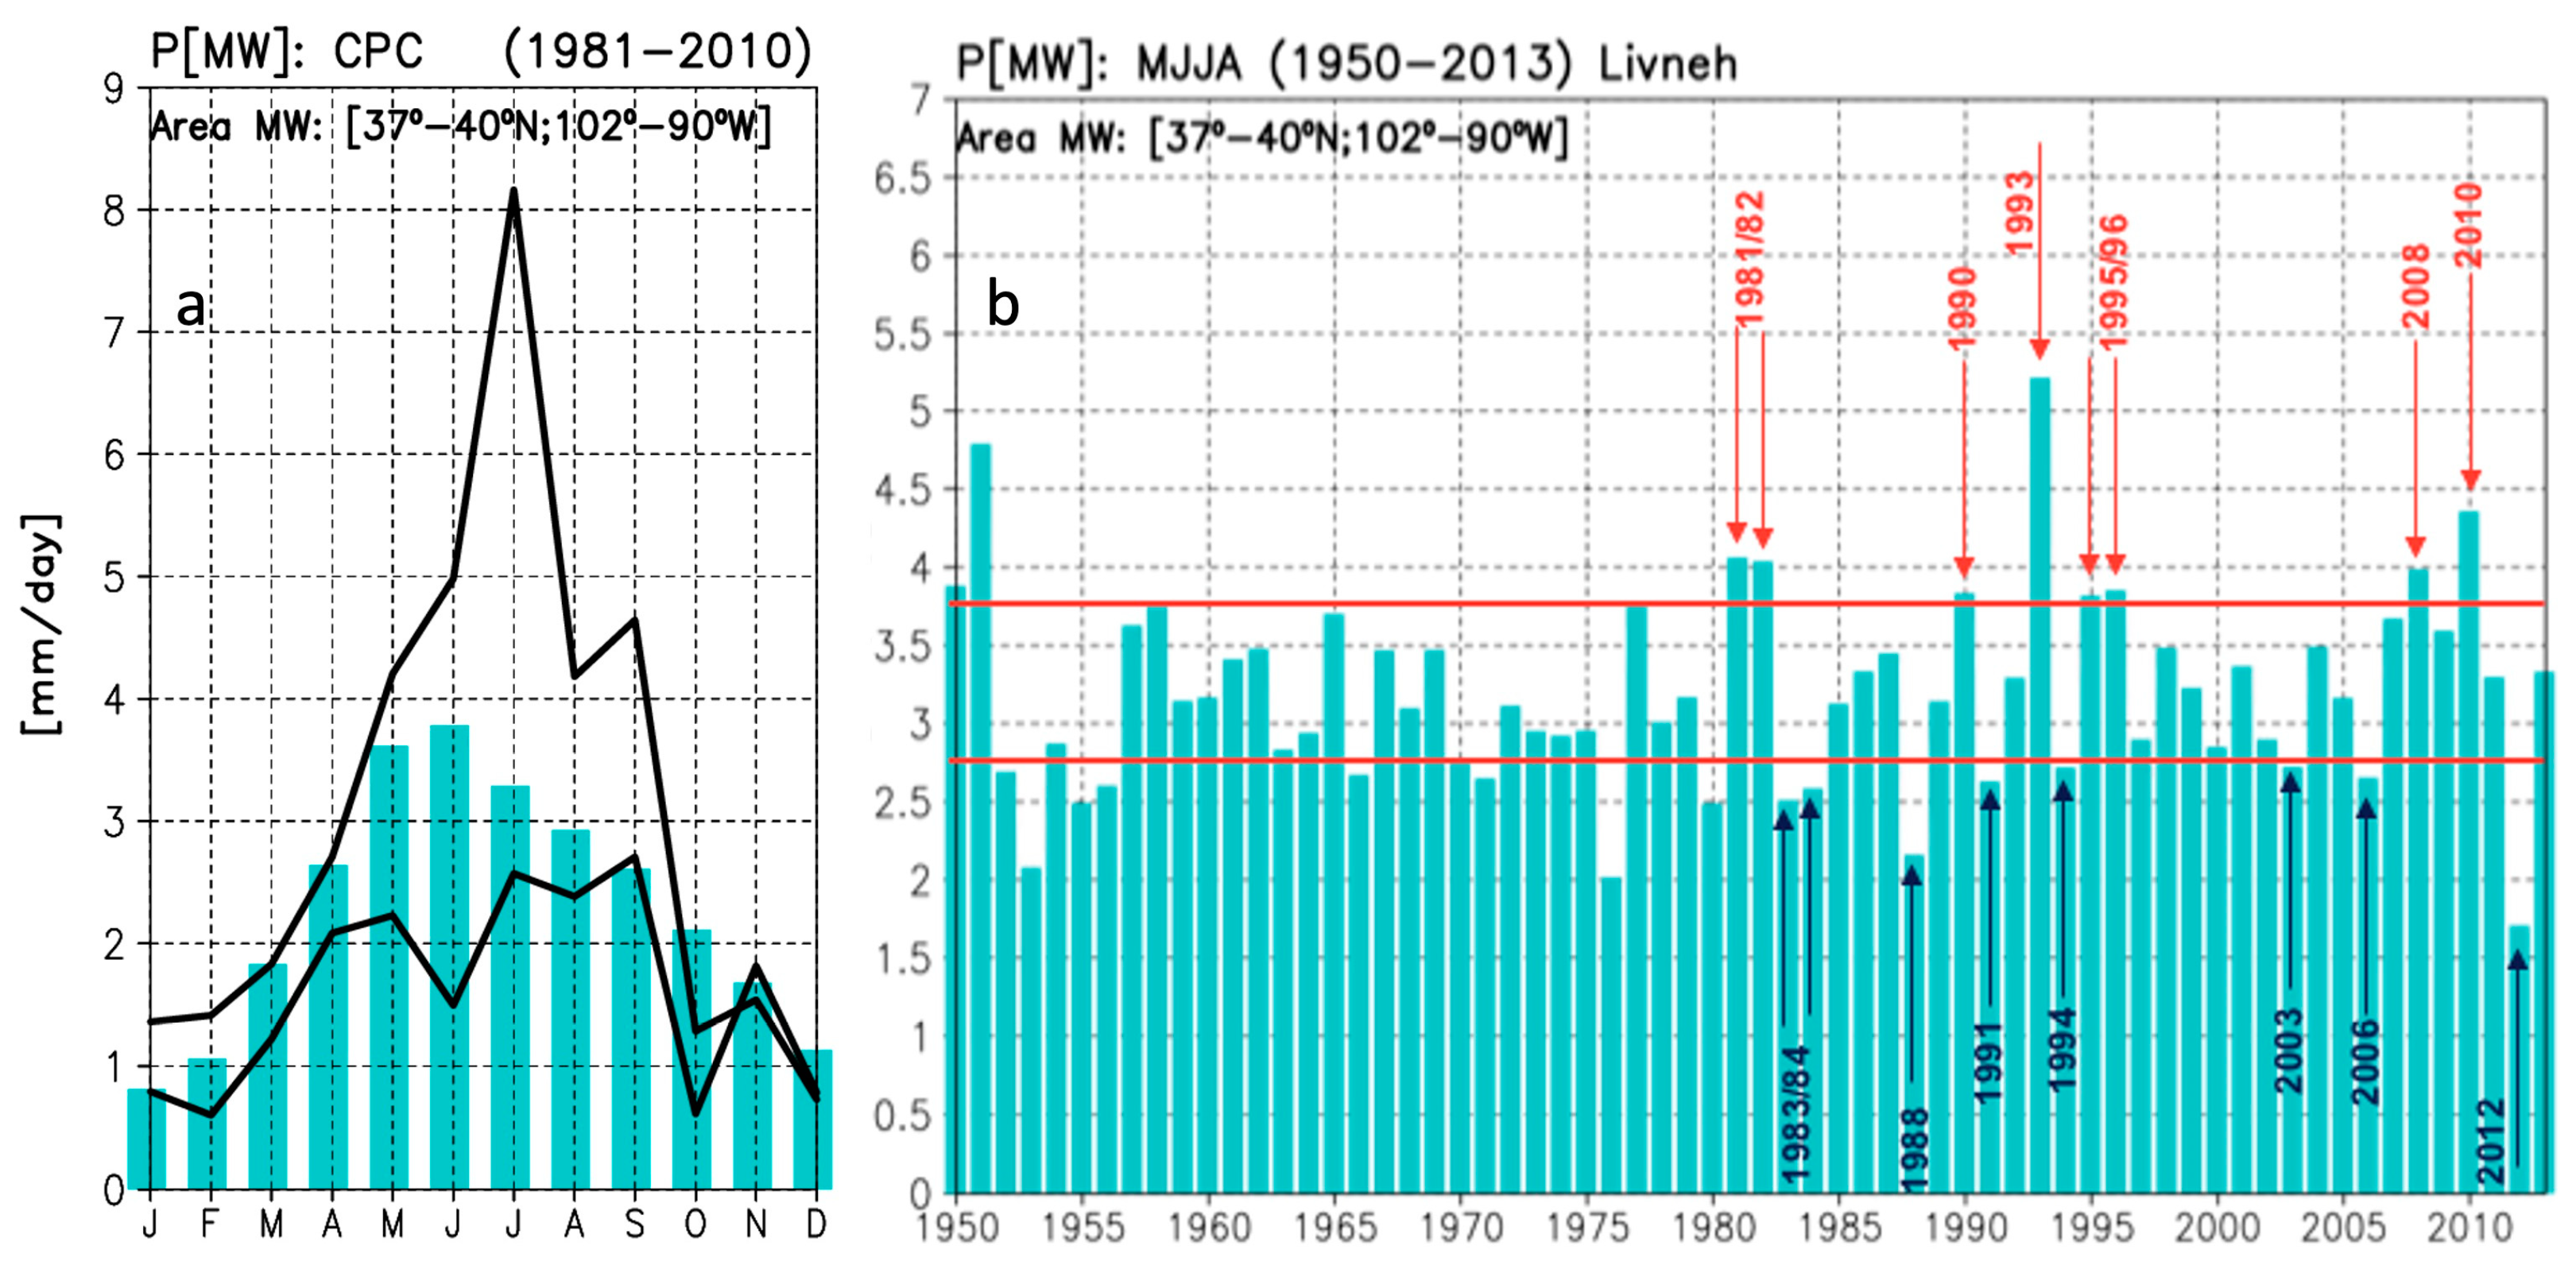
3.1.3. Interannual modes of extended precipitation and drought
3.2. Sources of NGP precipitation predictability
4. Discussion
5. Conclusions
Supplementary Materials
Author Contributions
Funding
Informed Consent Statement
Data Availability Statement
Acknowledgments
Conflicts of Interest
References
- USGCRP, U.S. Climate Modeling Summit (USCMS), 2015: Report of the first USCMS. NOAA Center for Weather and Climate Prediction, College Park, MD. Available online: https://www.globalchange.gov/sites/default/files/documents/igim/USCMS_2015_Report_Final-v3-clean_df.pdf (accessed on 1 December 2023).
- USGCRP, U.S. Climate Modeling Summit (USCMS), 2023: The Nineth U.S. Climate Modeling Report. NOAA Center for Weather and Climate Prediction, College Park, MD. Available online: https://www.globalchange.gov/sites/default/files/documents/igim/USCMS_2023_Summit_Report.pdf (accessed on 1 December 2023).
- Kirtman, B. P., and Coauthors, 2014: The North American Multimodel Ensemble: Phase-1 Seasonal-to-interannual prediction; Phase-2 Toward developing intraseasonal prediction. Bull. Amer. Meteor. Soc., 95, 585–601. [CrossRef]
- Vitart, F., and Coauthors, 2016: The sub-seasonal to seasonal prediction (S2S) project database. Bull. Amer. Meteor. Soc., 98, 163–173. [CrossRef]
- Chikamoto, Y., A. Timmermann, M. J. Widlansky, M. A. Balmaseda, and L. Stott, 2017. Multi-year predictability of climate, drought, and wildfire in southwestern North America. Sci. Rep., 7, 1–12. [CrossRef]
- L’Heureux M.L., M. K. Tippett, and E. J. Becker, 2021: Sources of Sub-seasonal Skill and Predictability in Wintertime California Precipitation Forecasts. Wea. Forecasting, 36, 1815–1826. [CrossRef]
- Huang H., C. M. Patricola, E. Bercos-Hickey, Y. Zhou, A. Rhoades, M. D. Risser, and W. D. Collins, 2021: Sources of Sub-seasonal-To-Seasonal Predictability of Atmospheric Rivers and Precipitation in the Western United States. J. Geophys. Res.: Atmos., 126, 1–24. [CrossRef]
- Hoerling M., J. Eischeid, A. Kumar, R. Leung, A. Mariotti, K. Mo, S. Schubert, and, R. Seager, 2014: Causes and predictability of the 2012 Great Plains drought. Bull. Amer. Meteor. Soc. 95, 269–282. [CrossRef]
- Johnson G. P., R. R. Holmes, Jr., and L. A. Waite, 2003: The Great Flood of 1993 on the upper Mississippi River—10 years later. U.S. Geological Survey Information Sheet, 6 pp. Available online: https://pubs.usgs.gov/fs/2004/3024/report.pdf.
- Smith, A., and R. Katz, 2013: U.S. Billion-dollar Weather and Climate Disasters: Data Sources, Trends, Accuracy and Biases. Natural Hazards. [CrossRef]
- United States Department of Agriculture-National Agriculture Statistics Service (NASS). Available online: https://www.nass.usda.gov (accessed on 2 December 2023).
- Garber, K., 2008: Midwest floods ruin crops. U.S. News. Available online: https://www.usnews.com/news/national/articles/2008/06/18/midwest-floods-ruin-crops (accessed on 2 December 2023).
- National Corn Growers Associations (NCGA). Available online: www.worldofcorn.com (accessed on 3 December 2023).
- United States Department of Agriculture-National Agriculture Statistics Service (NASS-Census). Available online: https://www.nass.usda.gov/Publications/AgCensus/2017/Online_Resources/Ag_Census_Web_Maps/index.php (accessed on 3 December 2023).
- Ou, G., F. Munoz-Arriola, D. Uden, D. Martin and C. Allen (2018). Climate change implications for irrigation and groundwater in the Republican River Basin, USA. Climatic Change. [CrossRef]
- Uden, D.R., C.R. Allen, F. Munoz-Arriola, G. Ou, and N. Shank (2018). A Framework for Tracing Social–Ecological Trajectories and Traps in Intensive Agricultural Landscapes. Sustainability. [CrossRef]
- Amaranto, A., F. Pianosi, D. Solomatine, G. Corzo-Perez, and F. Munoz-Arriola (2020). Sensitivity Analysis of Hydroclimatic Controls of Data-driven Groundwater Forecast in Irrigated Croplands. Journal of Hydrology. [CrossRef]
- Sarzaeim, P., D. Jarquin, and F. Muñoz-Arriola (2020). Analytics for climate-uncertainty estimation and propagation in maize-phenotype predictions. 2020 ASABE Annual International Meeting, Paper No. 1165. [CrossRef]
- Munoz-Arriola, F., T. Abdel-Monem, and A. Amaranto (2021). Common pool resource management: assessing water resources planning processes for hydrologically connected surface and groundwater systems. Hydrology. [CrossRef]
- Sarzaeim, P, W. Ou, L. Alves de Oliveira, and Francisco Munoz-Arriola (2021). Flood-Risk Analytics for Climate-Resilient Agriculture Using Remote Sensing in the Northern High Plains. In Geo-Extreme 2021, pp. 234-244. [CrossRef]
- Sarzaeim1, P., F. Muñoz-Arriola, and D. Jarquin (2022). Climate and genetic data enhancement using deep learning analytics to improve maize yield predictability. Journal of Experimental Botany. [CrossRef]
- Sarzaeim, P., F. Munoz-Arriola, D. Jarquin, H. Aslam, and N. De Leon Gatti, 2023: CLIM4OMICS: a geospatially comprehensive climate and multi-OMICS database for maize phenotype predictability in the United States and Canada. Earth Syst. Sci. Data, 15, 3963–3990.
- Livneh B., E. A. Rosenberg, C. Lin, B. Nijssen, V. Mishra, K. M. Andreadis, E. P. Maurer, and D. P. Lettenmaier, 2013: A long-term hydrologically based dataset of land surface fluxes and states for the conterminous United States: Update and extensions. J. Climate, 26, 9384–9392. [CrossRef]
- Bonner, W. D., 1968: Climatology of the low level jet. Mon. Wea. Rev., 96, 833–850. [CrossRef]
- Bell, G. D., and J. E. Janowiak, 1995: Atmospheric circulation associated with the Midwest floods of 1993. Bull. Amer. Meteor. Soc. 76, 681–696. [CrossRef]
- Arritt, R.W., T. D. Rink, M. Segal, D. P. Todey, C. A. Clark, M. J. Mitchell, and K. M. Labas, 1997: The Great Plains low-level jet during the warm season of 1993. Mon. Wea. Rev., 125, 2176–2192. [CrossRef]
- Weaver, S. J., and S. Nigam, 2011: Recurrent supersynoptic evolution of the Great Plains low-level jet. J. Climate, 24, 575–582. [CrossRef]
- Kalnay, E., and Coauthors, 1996: The NCEP/NCAR 40-year Reanalysis Project. Bull. Amer. Meteor. Soc., 77, 437–471. [CrossRef]
- Mesinger, F., and Coauthors, 2006: North American Regional Reanalysis. Bull. Amer. Meteor. Soc., 87, 343–360. [CrossRef]
- Ding, Q., and B. Wang, 2005: Circumglobal teleconnection in the Northern Hemisphere summer. J. Climate, 18, 3483–3505. [CrossRef]
- Ciancarelli, B., C. L. Castro, C. Woodhouse, F. Dominguez, H. Chang, C. Carrillo, and D. Griffin, 2013: Dominant patterns of U.S. warm season precipitation variability in a fine resolution observational record, with focus on the southwest. Int. J. Climatol., 34, 687–707. [CrossRef]
- Weaver, S. J., and S. Nigam, 2008: Variability of the Great Plains low-level jet: large-scale circulation context and hydroclimate impacts. J. Climate, 21, 1532–1551. [CrossRef]
- Branstator, G., 2002: Circumglobal teleconnections, the jet stream waveguide, and the North Atlantic Oscillation. J. Climate, 15, 1893–1910. [CrossRef]
- PaiMazumder, D., and J. M. Done, 2016: Potential predictability sources of the 2012 U.S. drought in observations and a regional model ensemble. J. Geophys. Res.: Atmos., 121, 12,581–12,592. [CrossRef]
- Malloy, K.M., and B.P. Kirtman, 2020: Predictability of Midsummer Great Plains Low-Level Jet and Associated Precipitation. Wea. Forecasting, 35, 215–235. [CrossRef]
- Saha, S., and Coauthors, 2014: The NCEP Climate Forecast System Version 2. J. Climate, 27, 2185–2208. [CrossRef]
- Wilks, D. S., 2017: Enforcing calibration in ensemble postprocessing. Q. J. R. Meteorol. Soc., 144, 76–84. [CrossRef]
- Shepard, D. S., 1984: Computer mapping: the SYMAP interpolation algorithm. Spatial Statistics and Models, G. L. Gaile and C. J. Wilmott, Eds., Springer-Science +Business Media, 133–145.
- Daly, C., R. P. Neilson, and D. L. Phillips, 1994: A statistical-topographic model for mapping climatological precipitation over mountainous terrain. J. Appl. Meteor. Climatol. 33, 140–158. [CrossRef]
- Chen, M., W. Shi, P. Xie, V. B. S. Silva, V. E. Kousky, R.W. Higgins, and J. E. Janowiak, 2008: Assessing objective techniques for gauge-based analyses of global daily precipitation. J. Geophys. Res.: Atmos., 113, 1–13. [CrossRef]
- Saha, S., and Coauthors, 2010: The NCEP Climate Forecast System Reanalysis. Bull. Amer. Meteor. Soc., 91, 1015–1057. [CrossRef]
- NOAA National Operational Model Archive and Distribution System (NOMADS). Available online: https://nomads.ncep.noaa.gov (accessed on 3 December 2023).
- Weaver, S.J.; Ruiz-Barradas, A. Pentad evolution of the 1988 drought and 1993 flood over the Great Plains: An NARR perspective on the atmospheric and terrestrial water balance. J. Climate 2009, 22, 5366–5384. [Google Scholar] [CrossRef]
- Wilks, D. S., 2011: Statistical Methods in the Atmospheric Sciences. Elsevier, 676 pp.
- Murakami, M., 1979: Large-scale aspects of deep convective activity over the GATE area. Mon. Wea. Rev. 107, 994–1013. [CrossRef]
- Lees, J. M., and J. Park, 1995: Multi-taper spectral analysis: A stand-alone C-subroutine. Comput. Geosci. 21, 199–236. [CrossRef]
- Livezey, R. E., and W. Y. Chen, 1983: Statistical field significance and its determination by Monte Carlo techniques. Mon. Wea. Rev., 111, 46–59. [CrossRef]
- Jiang, X., N-C. Lau, I.M. Held, and J.J. Ploshay, 2007: Mechahisms of the Great Plains low-level jet as simulated in an AGCM. J. Atmos. Sci., 64, 532–547. [CrossRef]
- Li, S., and A. W. Robertson, 2015: Evaluation of submonthly precipitation forecast skill from global ensemble prediction systems. Mon. Wea. Rev., 143, 2871–2889. [CrossRef]
- Jaimes-Correa, J.C., F. Muñoz-Arriola, and S. Bartelt-Hunt (2022). Modeling water quantity and quality nonlinearities for watershed adaptability to hydroclimate extremes in agricultural landscapes. Hydrology. [CrossRef]
- Amaranto, A., F. Munoz-Arriola, G. Meyer, D. Solomatine, and G. Corzo (2018). Semi-seasonal Predictability of Water-table Changes Using Machine Learning Methods in Response to Integrated Hydroclimatic and Management Controls. Journal of Hydroinformatics. [CrossRef]
- Amaranto, A., F. Munoz-Arriola, G. Corzo-Perez, and D. Solomatine (2019). A Spatially enhanced data-driven multi-model to improve semi-seasonal groundwater forecasts in the High Plains aquifer, USA. Water Resources Research. [CrossRef]
- Nielsen, R. L., 2012: Corn management for extreme conditions. Corny News Network (Purdue University). Available online: https://www.agry.purdue.edu/ext/corn/news/timeless/extremecornmgmt.html (accessed on 10 February 2018).
- Wilson, A., R. Cifelli, F. Munoz-Arriola, J. Giovannettone, J. Vano, T. Parzybok, A. Dufour, J. Jasperse, K. Mahoney, and B. McCormick (2021). Efforts to Build Infrastructure Resiliency to Future Hydroclimate Extremes. In Geo-Extreme 2021, pp. 222-233. [CrossRef]
- Perez-Morga, N., T. Kretzshmar, T. Cavazos, S. Smith, and F. Munoz-Arriola (2013). Variability of Extreme Precipitation in coastal River Basins of the Southern Mexican Pacific Region. Geofisica Internacional. 52(3): 277-291.
- Dagon, K., Truesdale, J., Biard, J.C., Kunkel, K.E., Meehl, G.A. and Molina, M.J., 2022. Machine Learning‐Based Detection of Weather Fronts and Associated Extreme Precipitation in Historical and Future Climates. Journal of Geophysical Research: Atmospheres, 127, e2022JD037038.
- Kumar, A., RAAJ Ramsankaran, Luca Brocca, and Francisco Munoz-Arriola (2021). Expanding Machine learning modeling for improving near-real-time satellite-based rainfall-runoff forecasts in India. Journal of Hydrology.
- Kumar, A., RAAJ Ramsankaran, Luca Brocca, Francisco Munoz-Arriola (2019). A Machine learning approach for improving near-real-time satellite-based rainfall estimates by integrating soil moisture. Remote Sensing. [CrossRef]
- Pandey, V., P. K. Srivastava, R. K. Mall, F. Munoz-Arriola, and D. Han (2020). Multi-Satellite Precipitation Products for Meteorological Drought Assessment and Forecasting in Bundelkhand region of Central India. Geocarto Internacional. [CrossRef]
- Rehana3, S., Y. Pranathi, G. Basha, and F. Munoz-Arriola (2022). Precipitation and Temperature Extremes and Association with Large-scale Climate Indices: An Observational Evidence over India. Journal of Earth System Science. [CrossRef]
- Carlos M Carrillo, & Muñoz-Arriola. (2021). Precipitation, low-level jet, and geopotential height data for analyzing sources of predictability in the US northern Great Plains [Data set]. Zenodo. [CrossRef]
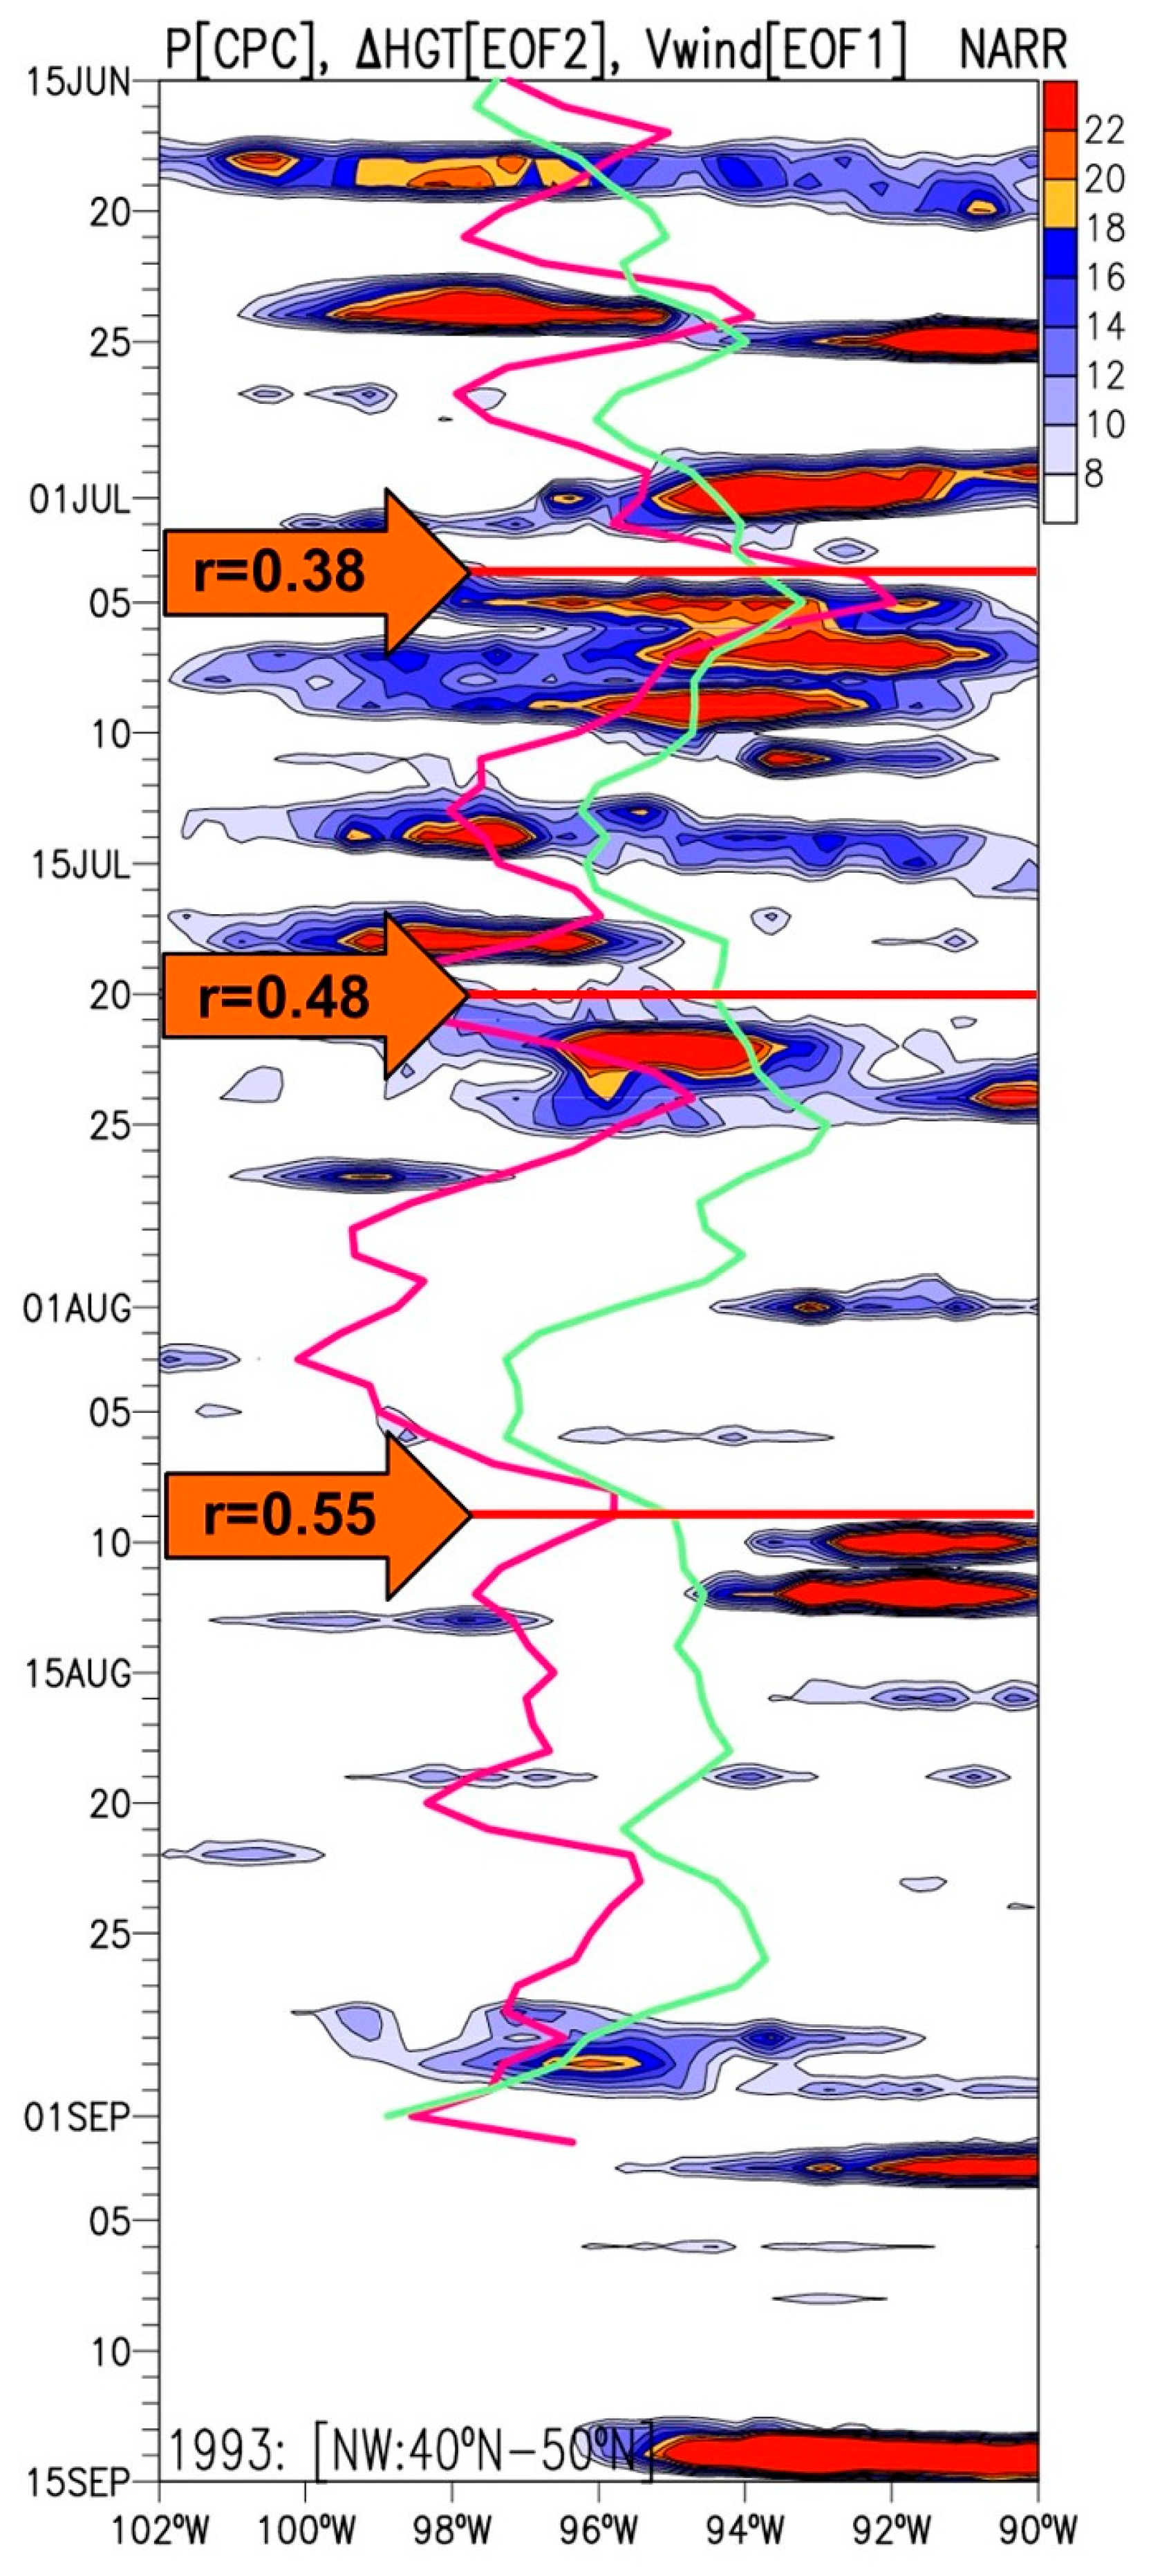
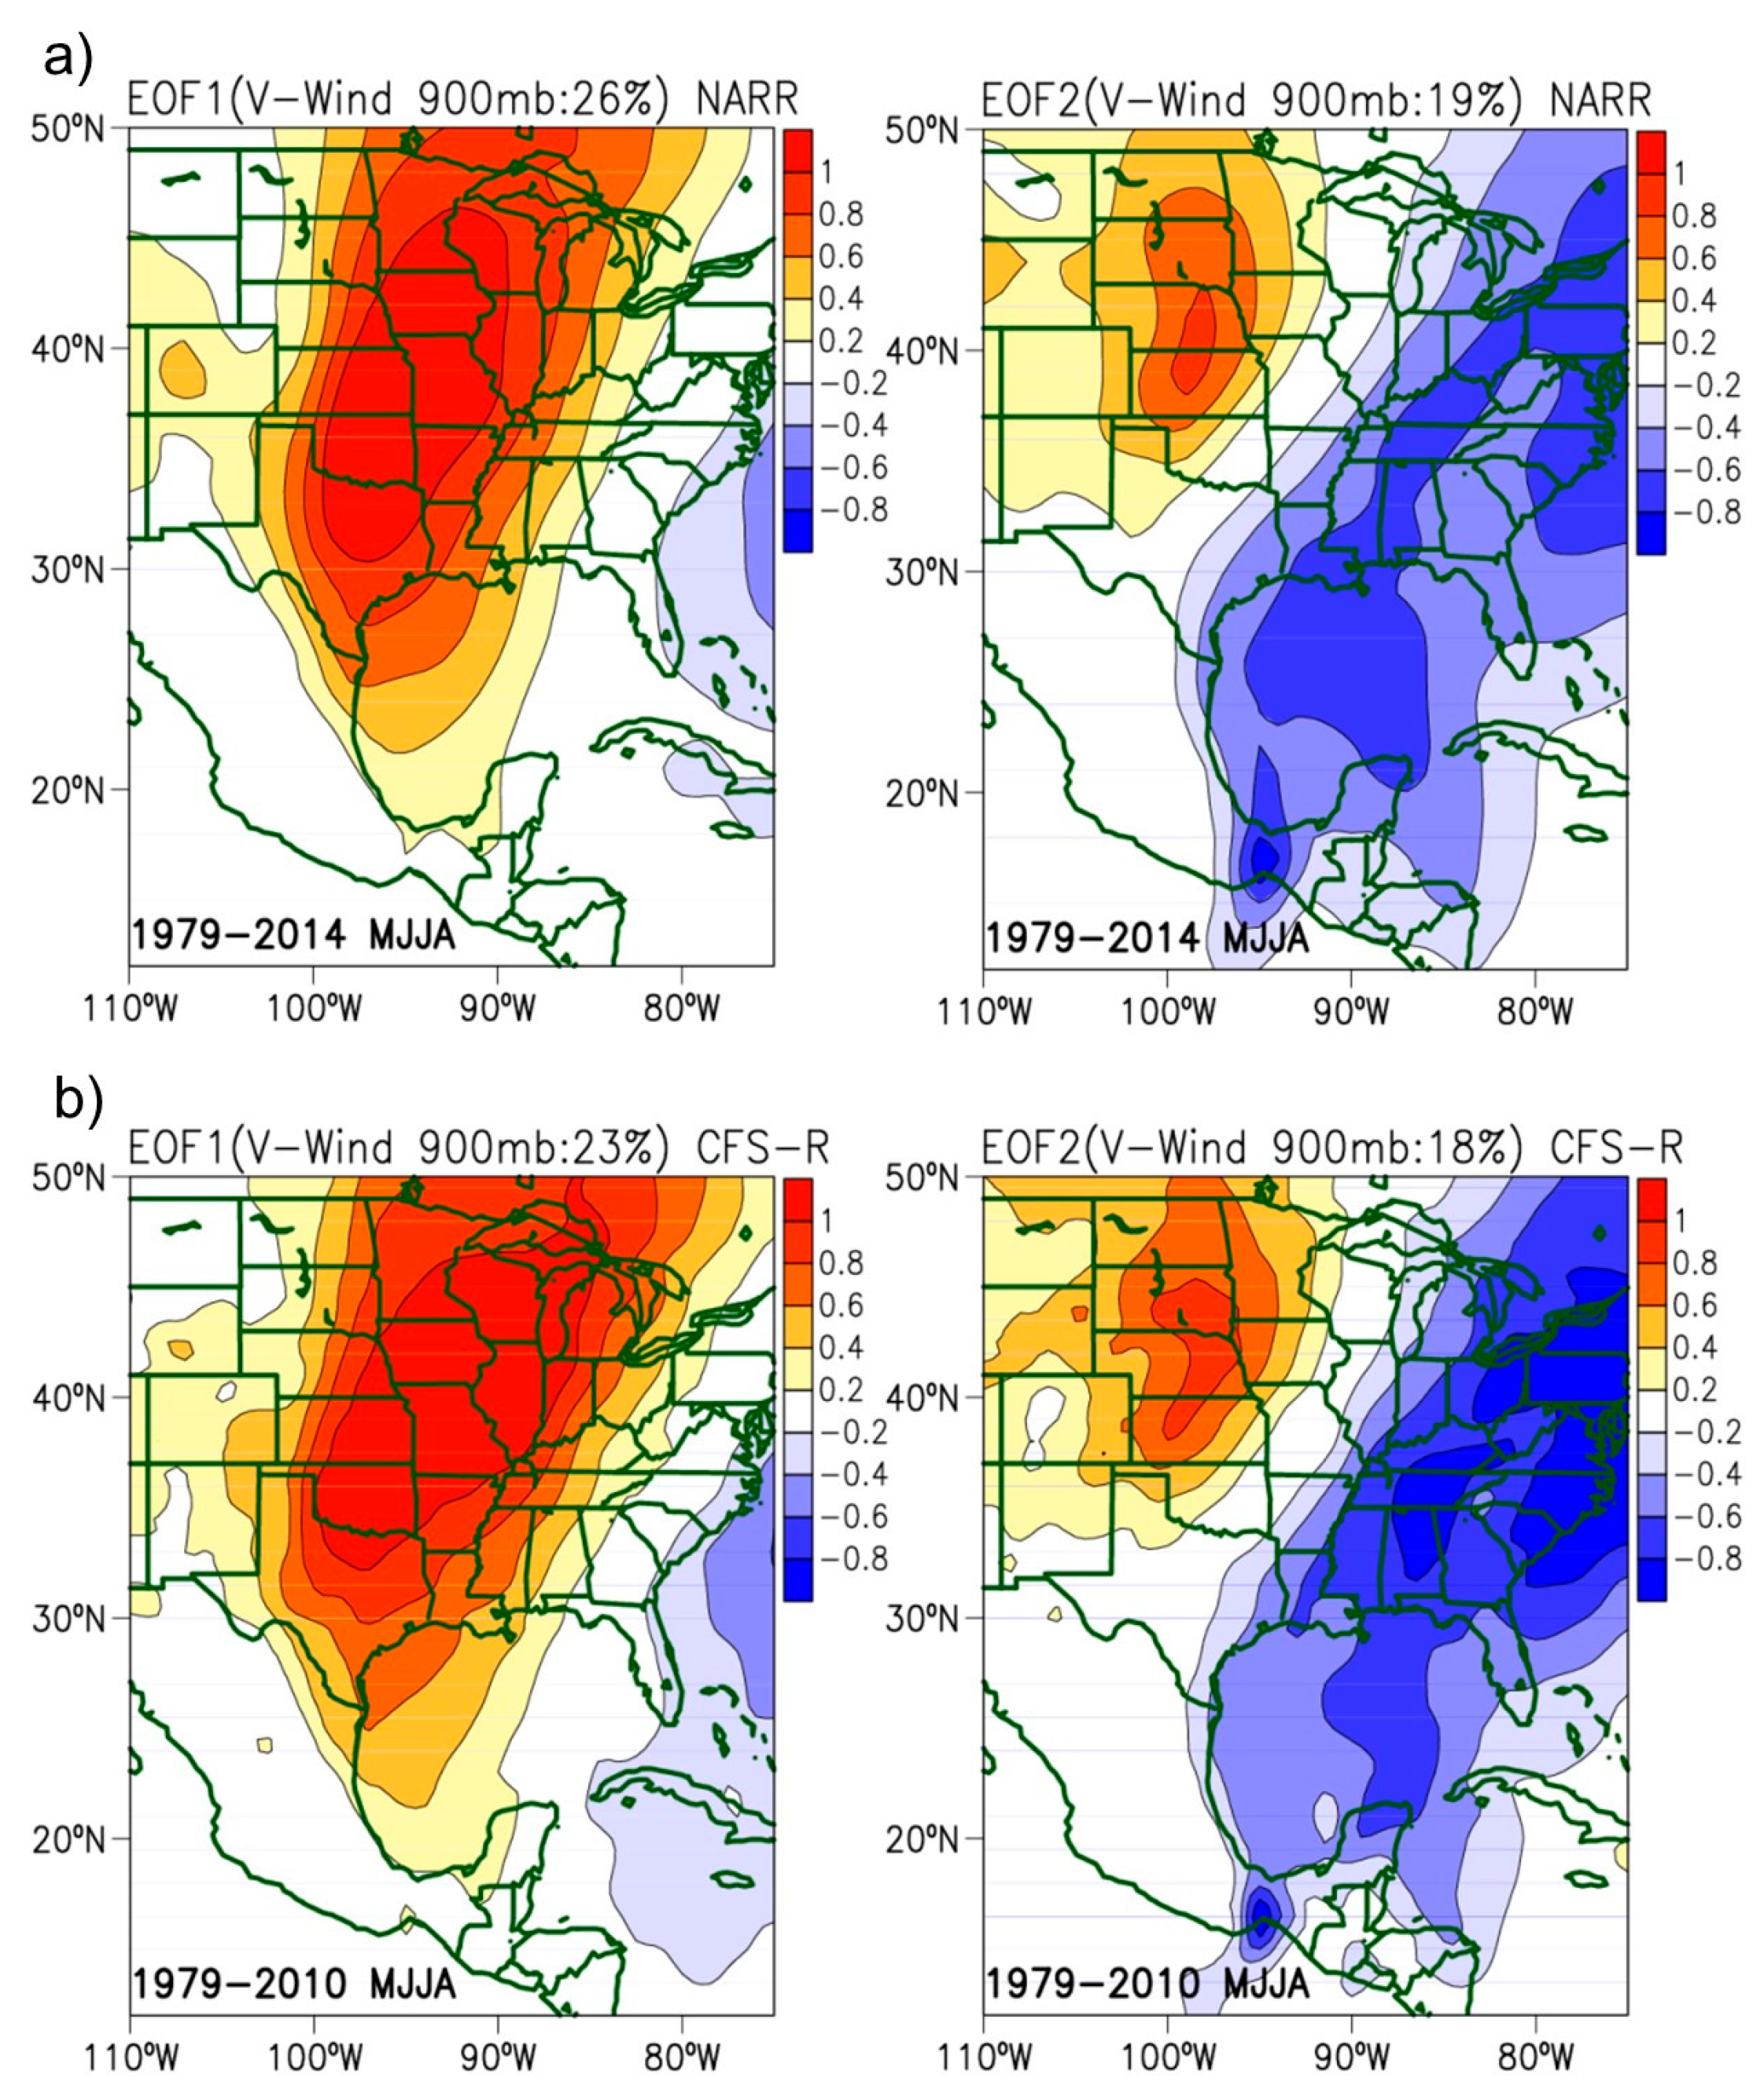
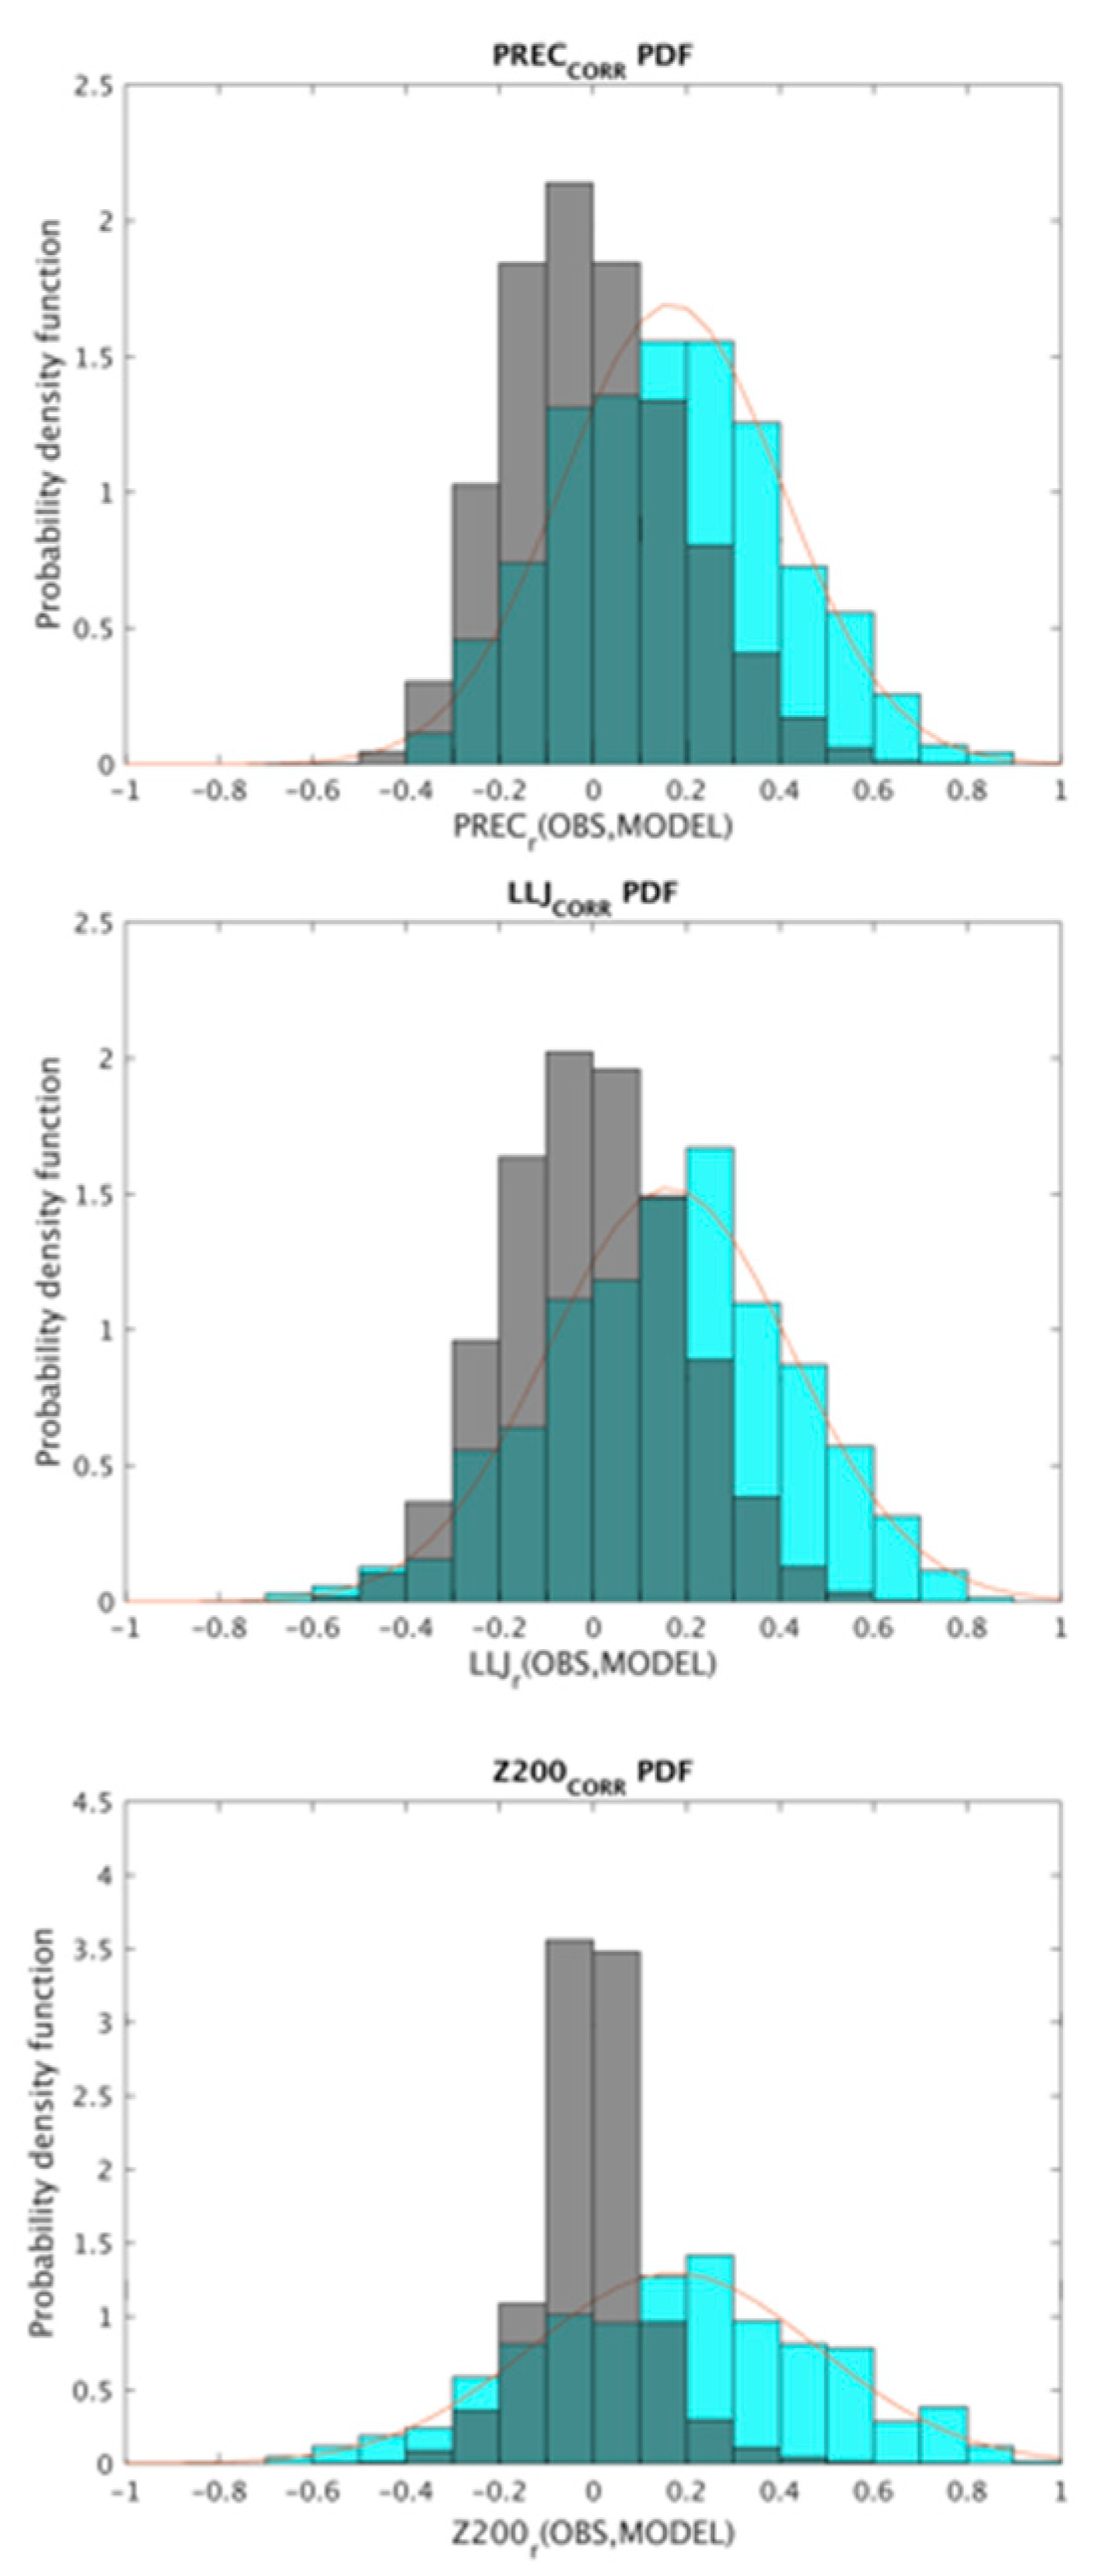
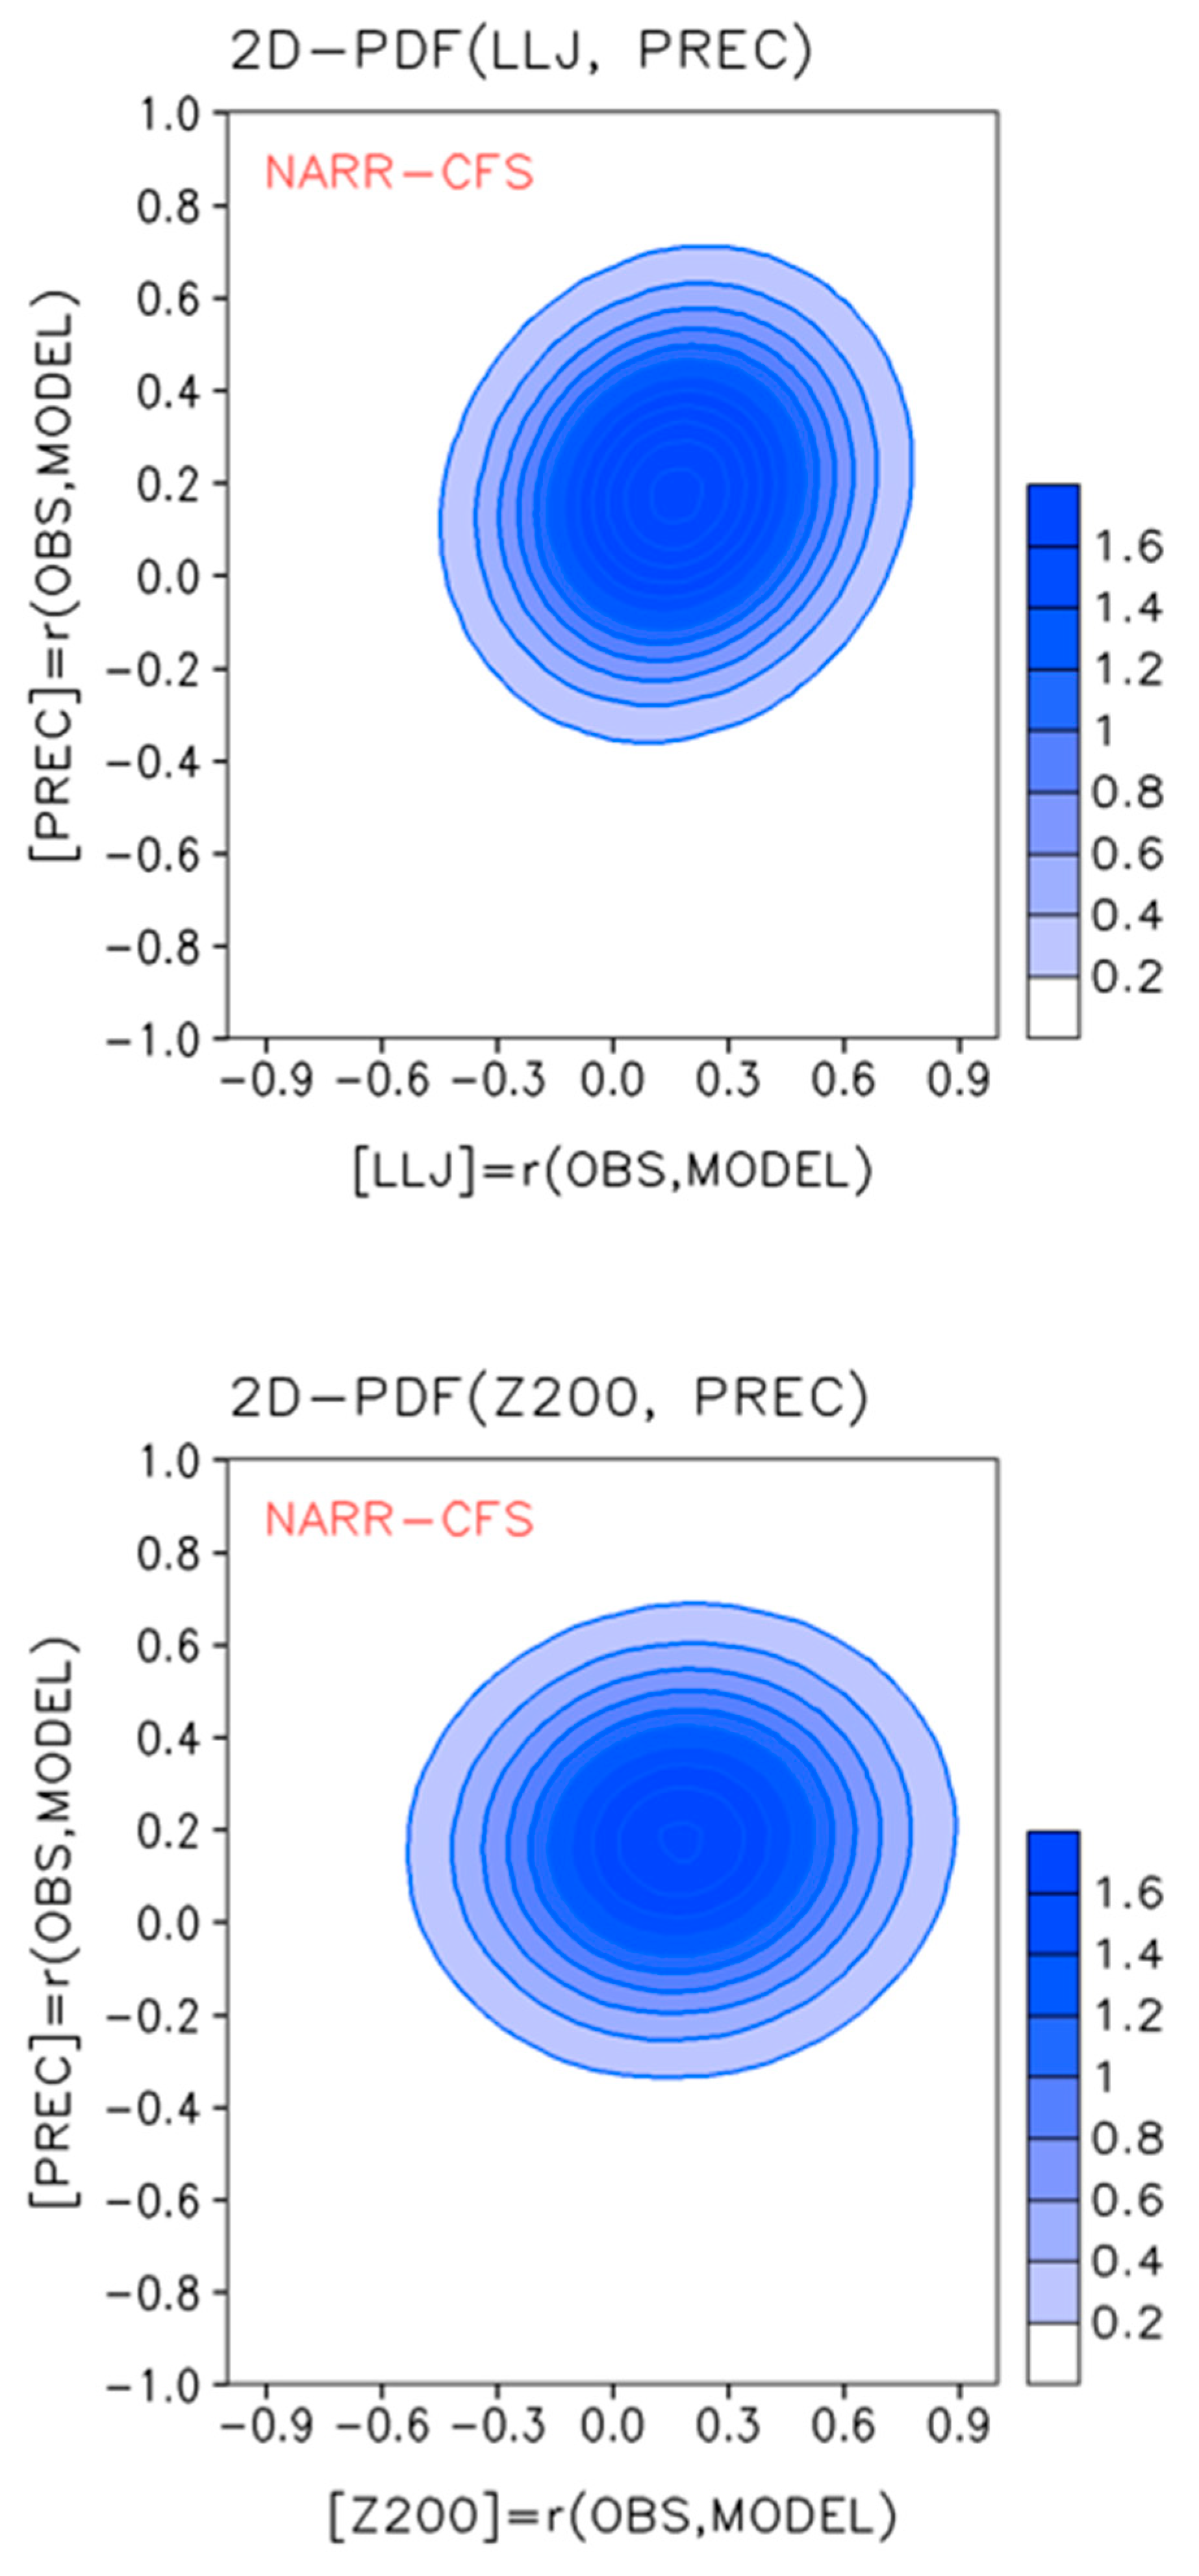
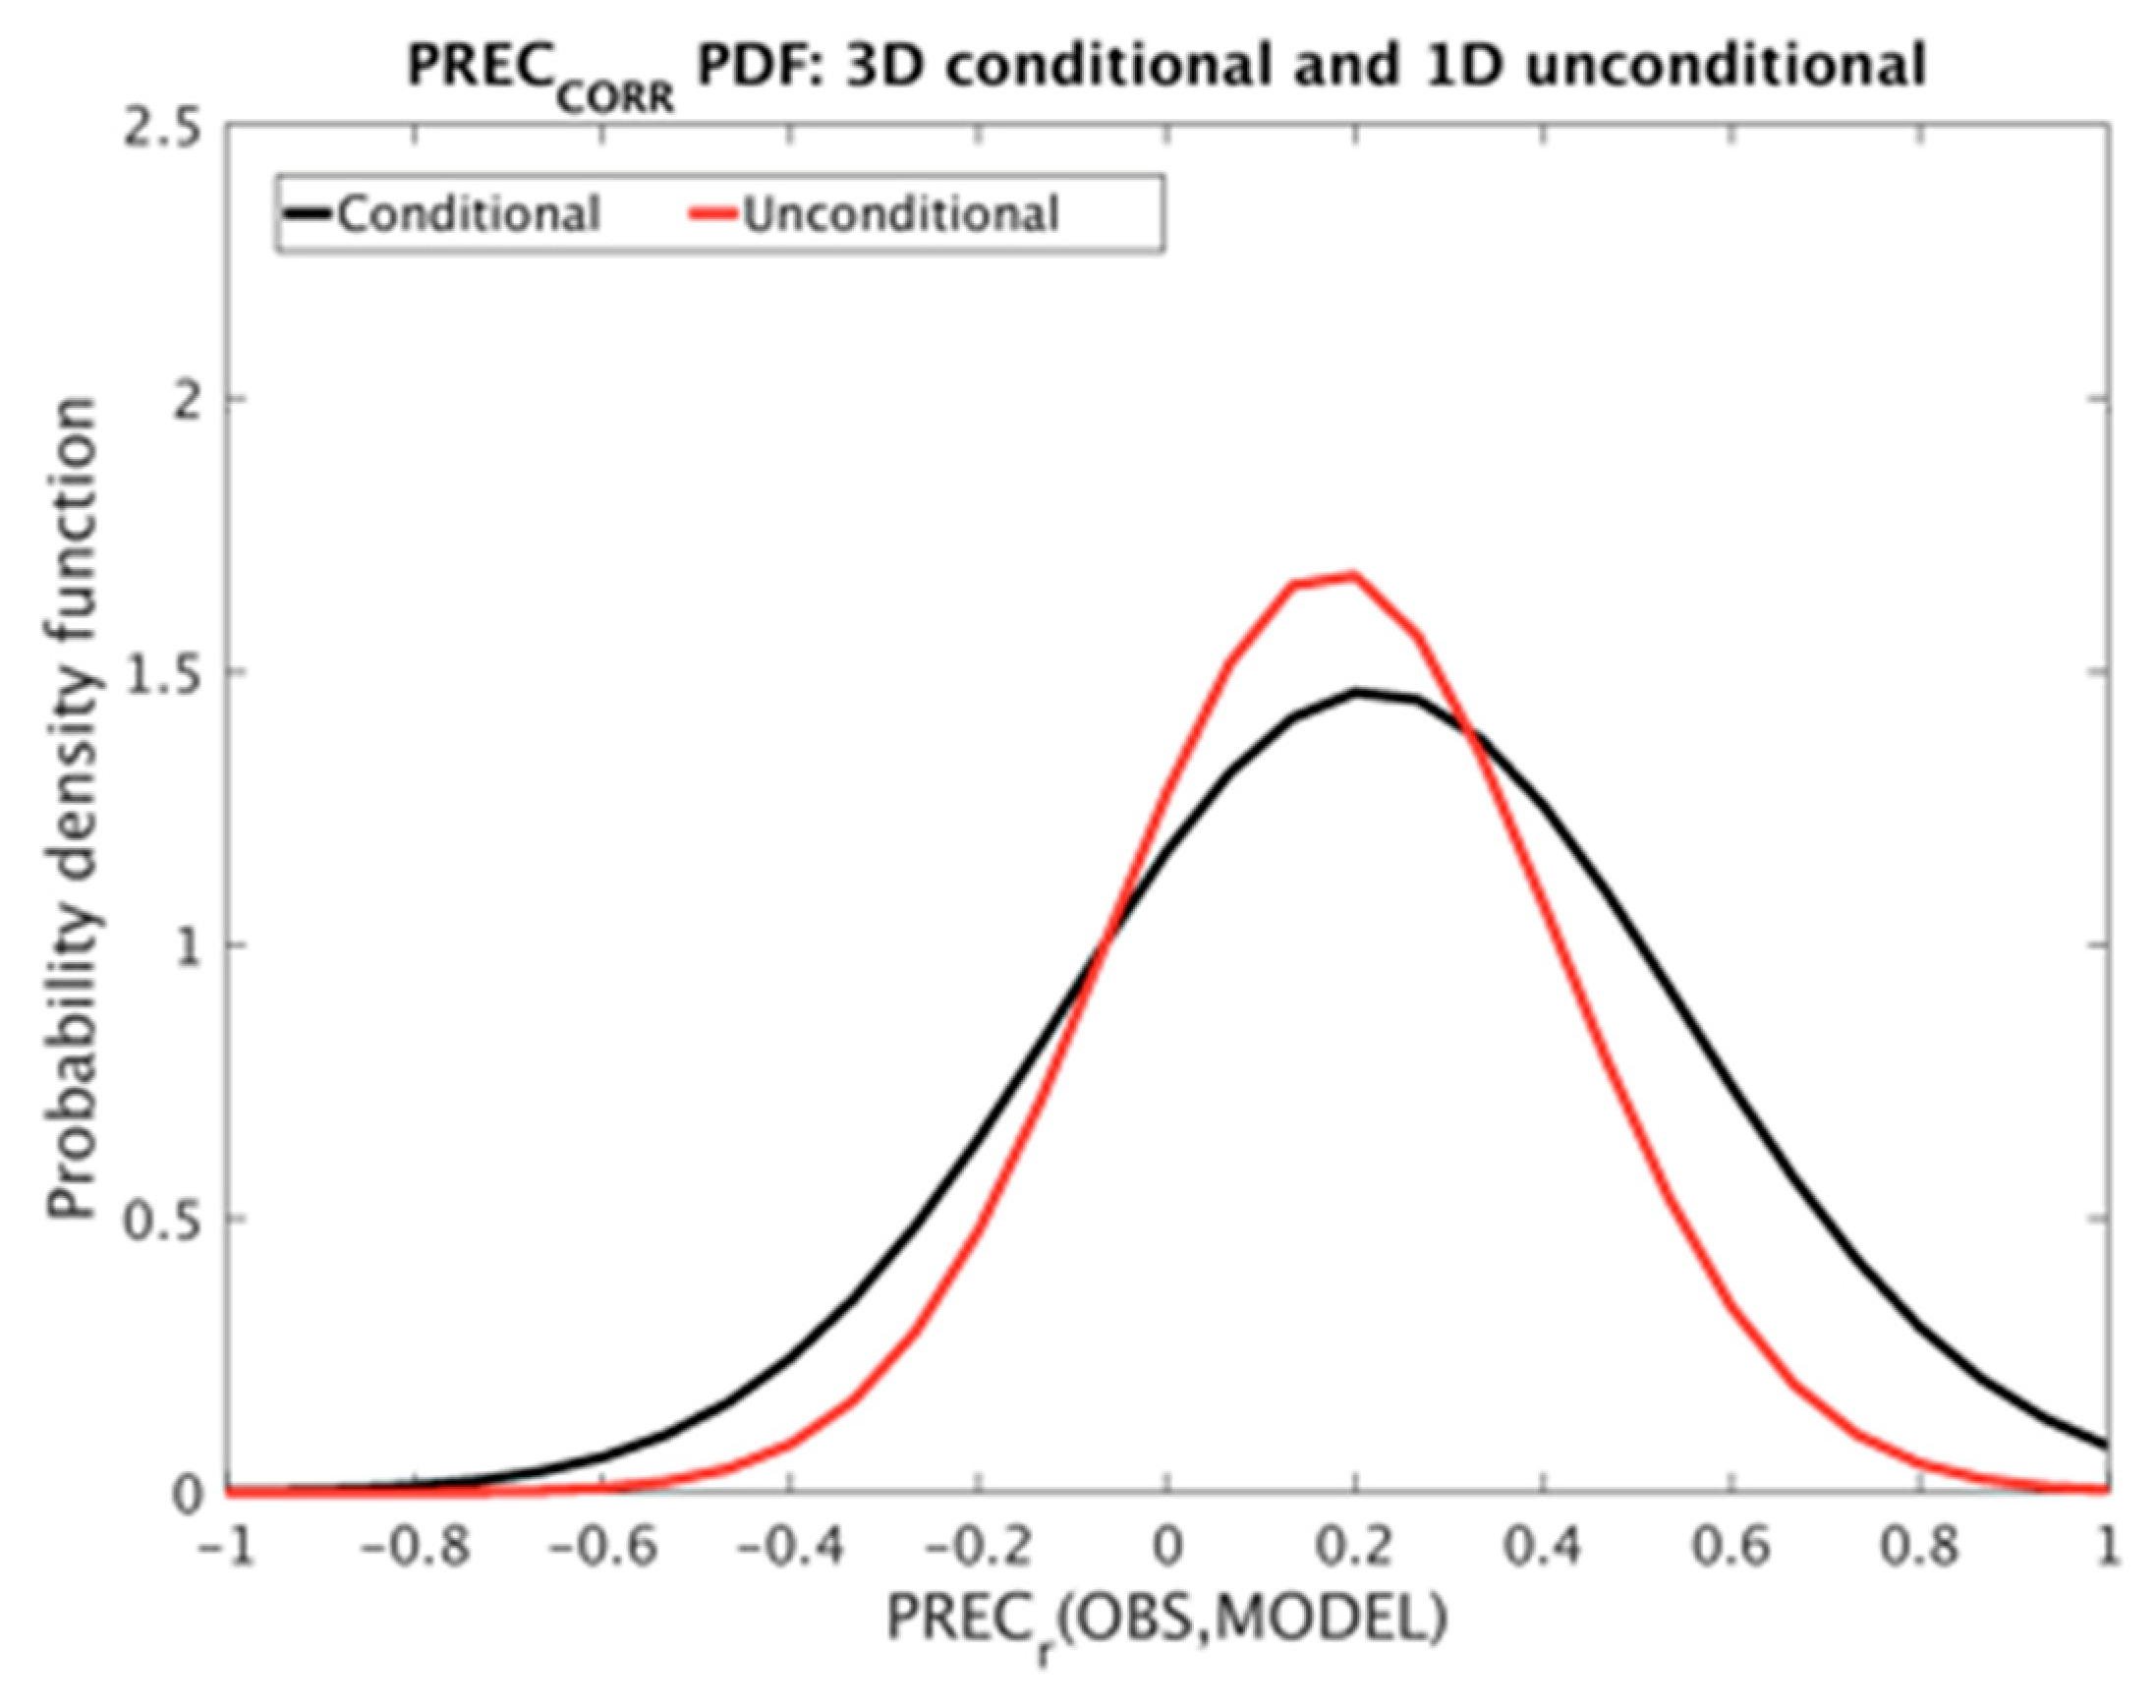
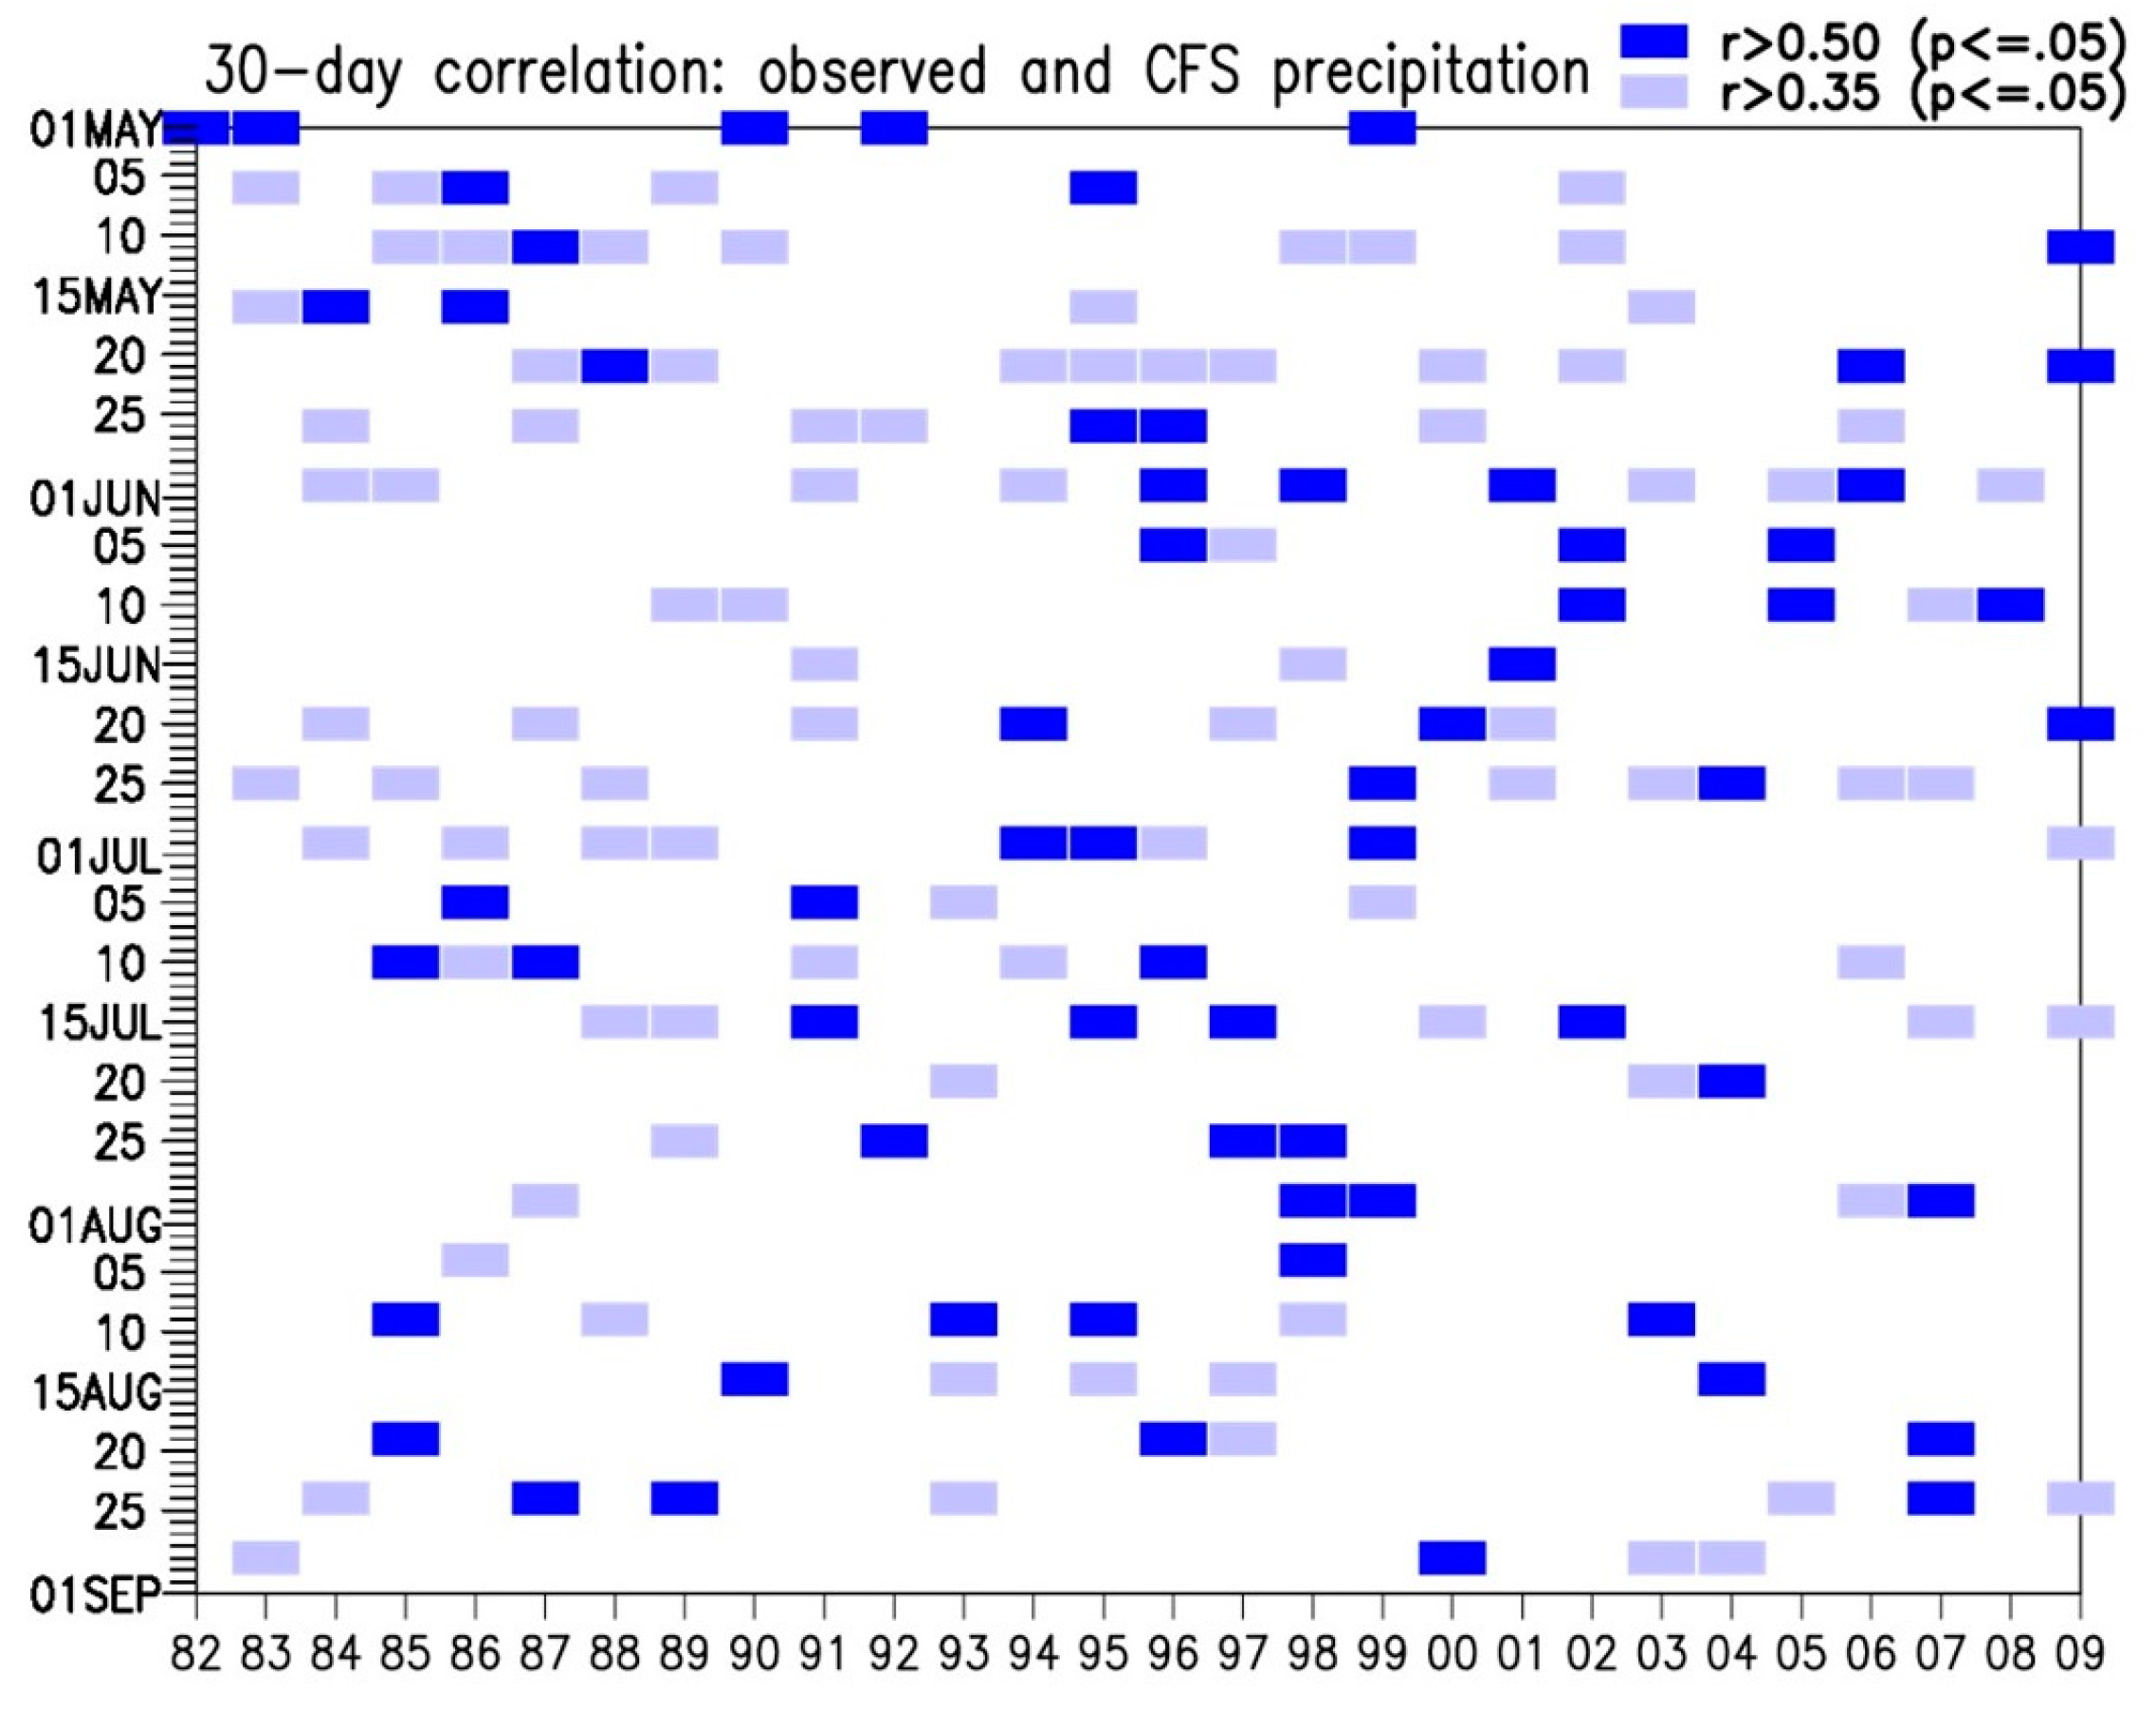
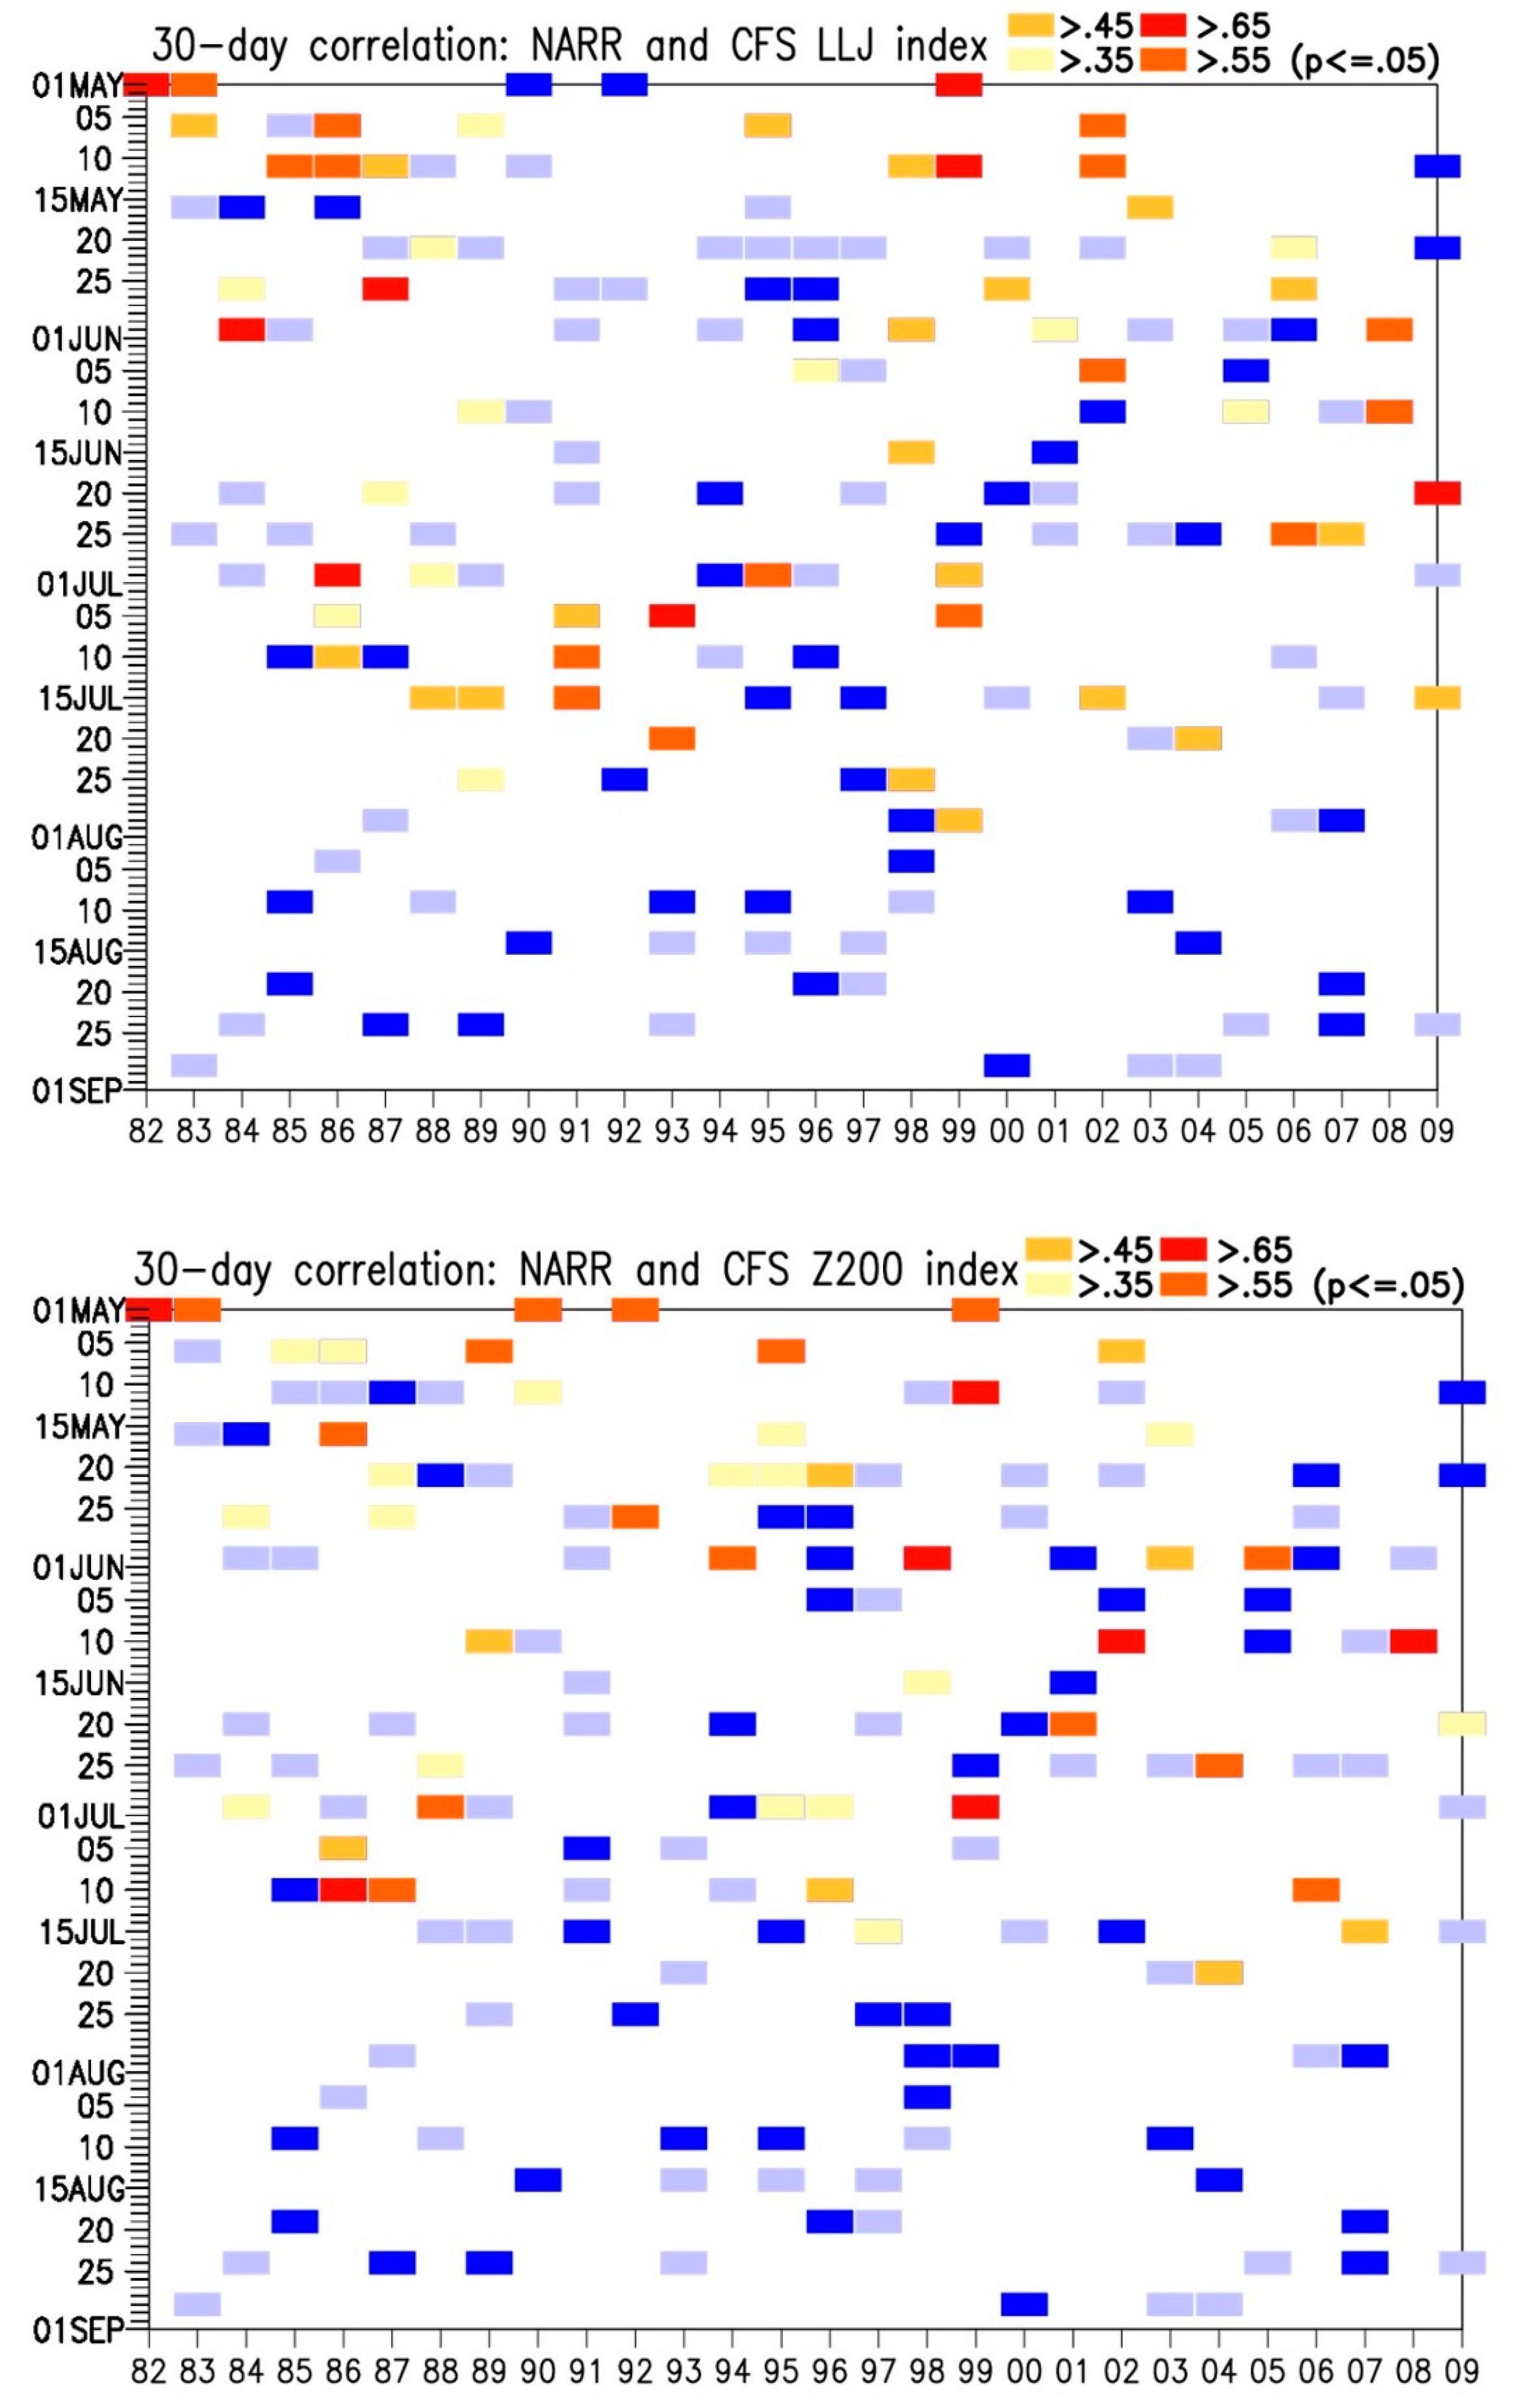
| Model Initialization | NGP precipitation | GP-LLJ index | CGT index |
| 1988.05.11 | 0.44 | 0.14 | 0.12 |
| 1988.05.21 | 0.77 | 0.36 | 0.13 |
| 1988.06.25 | 0.46 | 0.21 | 0.31 |
| 1988.06.30 | 0.37 | 0.39 | 0.57 |
| 1988.07.15 | 0.36 | 0.38 | -0.33 |
| 1988.08.09 | 0.42 | 0.36 | -0.39 |
| 1993.07.05 | 0.38 | 0.71 | 0.12 |
| 1993.07.20 | 0.48 | 0.60 | 0.3 |
| 1993.08.09 | 0.55 | 0.56 | -0.22 |
| 1993.08.14 | 0.38 | 0.57 | 0.29 |
| 1993.08.24 | 0.45 | 0.01 | 0.12 |
Disclaimer/Publisher’s Note: The statements, opinions and data contained in all publications are solely those of the individual author(s) and contributor(s) and not of MDPI and/or the editor(s). MDPI and/or the editor(s) disclaim responsibility for any injury to people or property resulting from any ideas, methods, instructions or products referred to in the content. |
© 2023 by the authors. Licensee MDPI, Basel, Switzerland. This article is an open access article distributed under the terms and conditions of the Creative Commons Attribution (CC BY) license (http://creativecommons.org/licenses/by/4.0/).


