Submitted:
06 December 2023
Posted:
06 December 2023
You are already at the latest version
Abstract
Keywords:
1. Introduction
2. Materials and Methods
2.1. Antibodies
2.2. Plasmid construction and transfection
2.3. Flow cytometry
3. Results
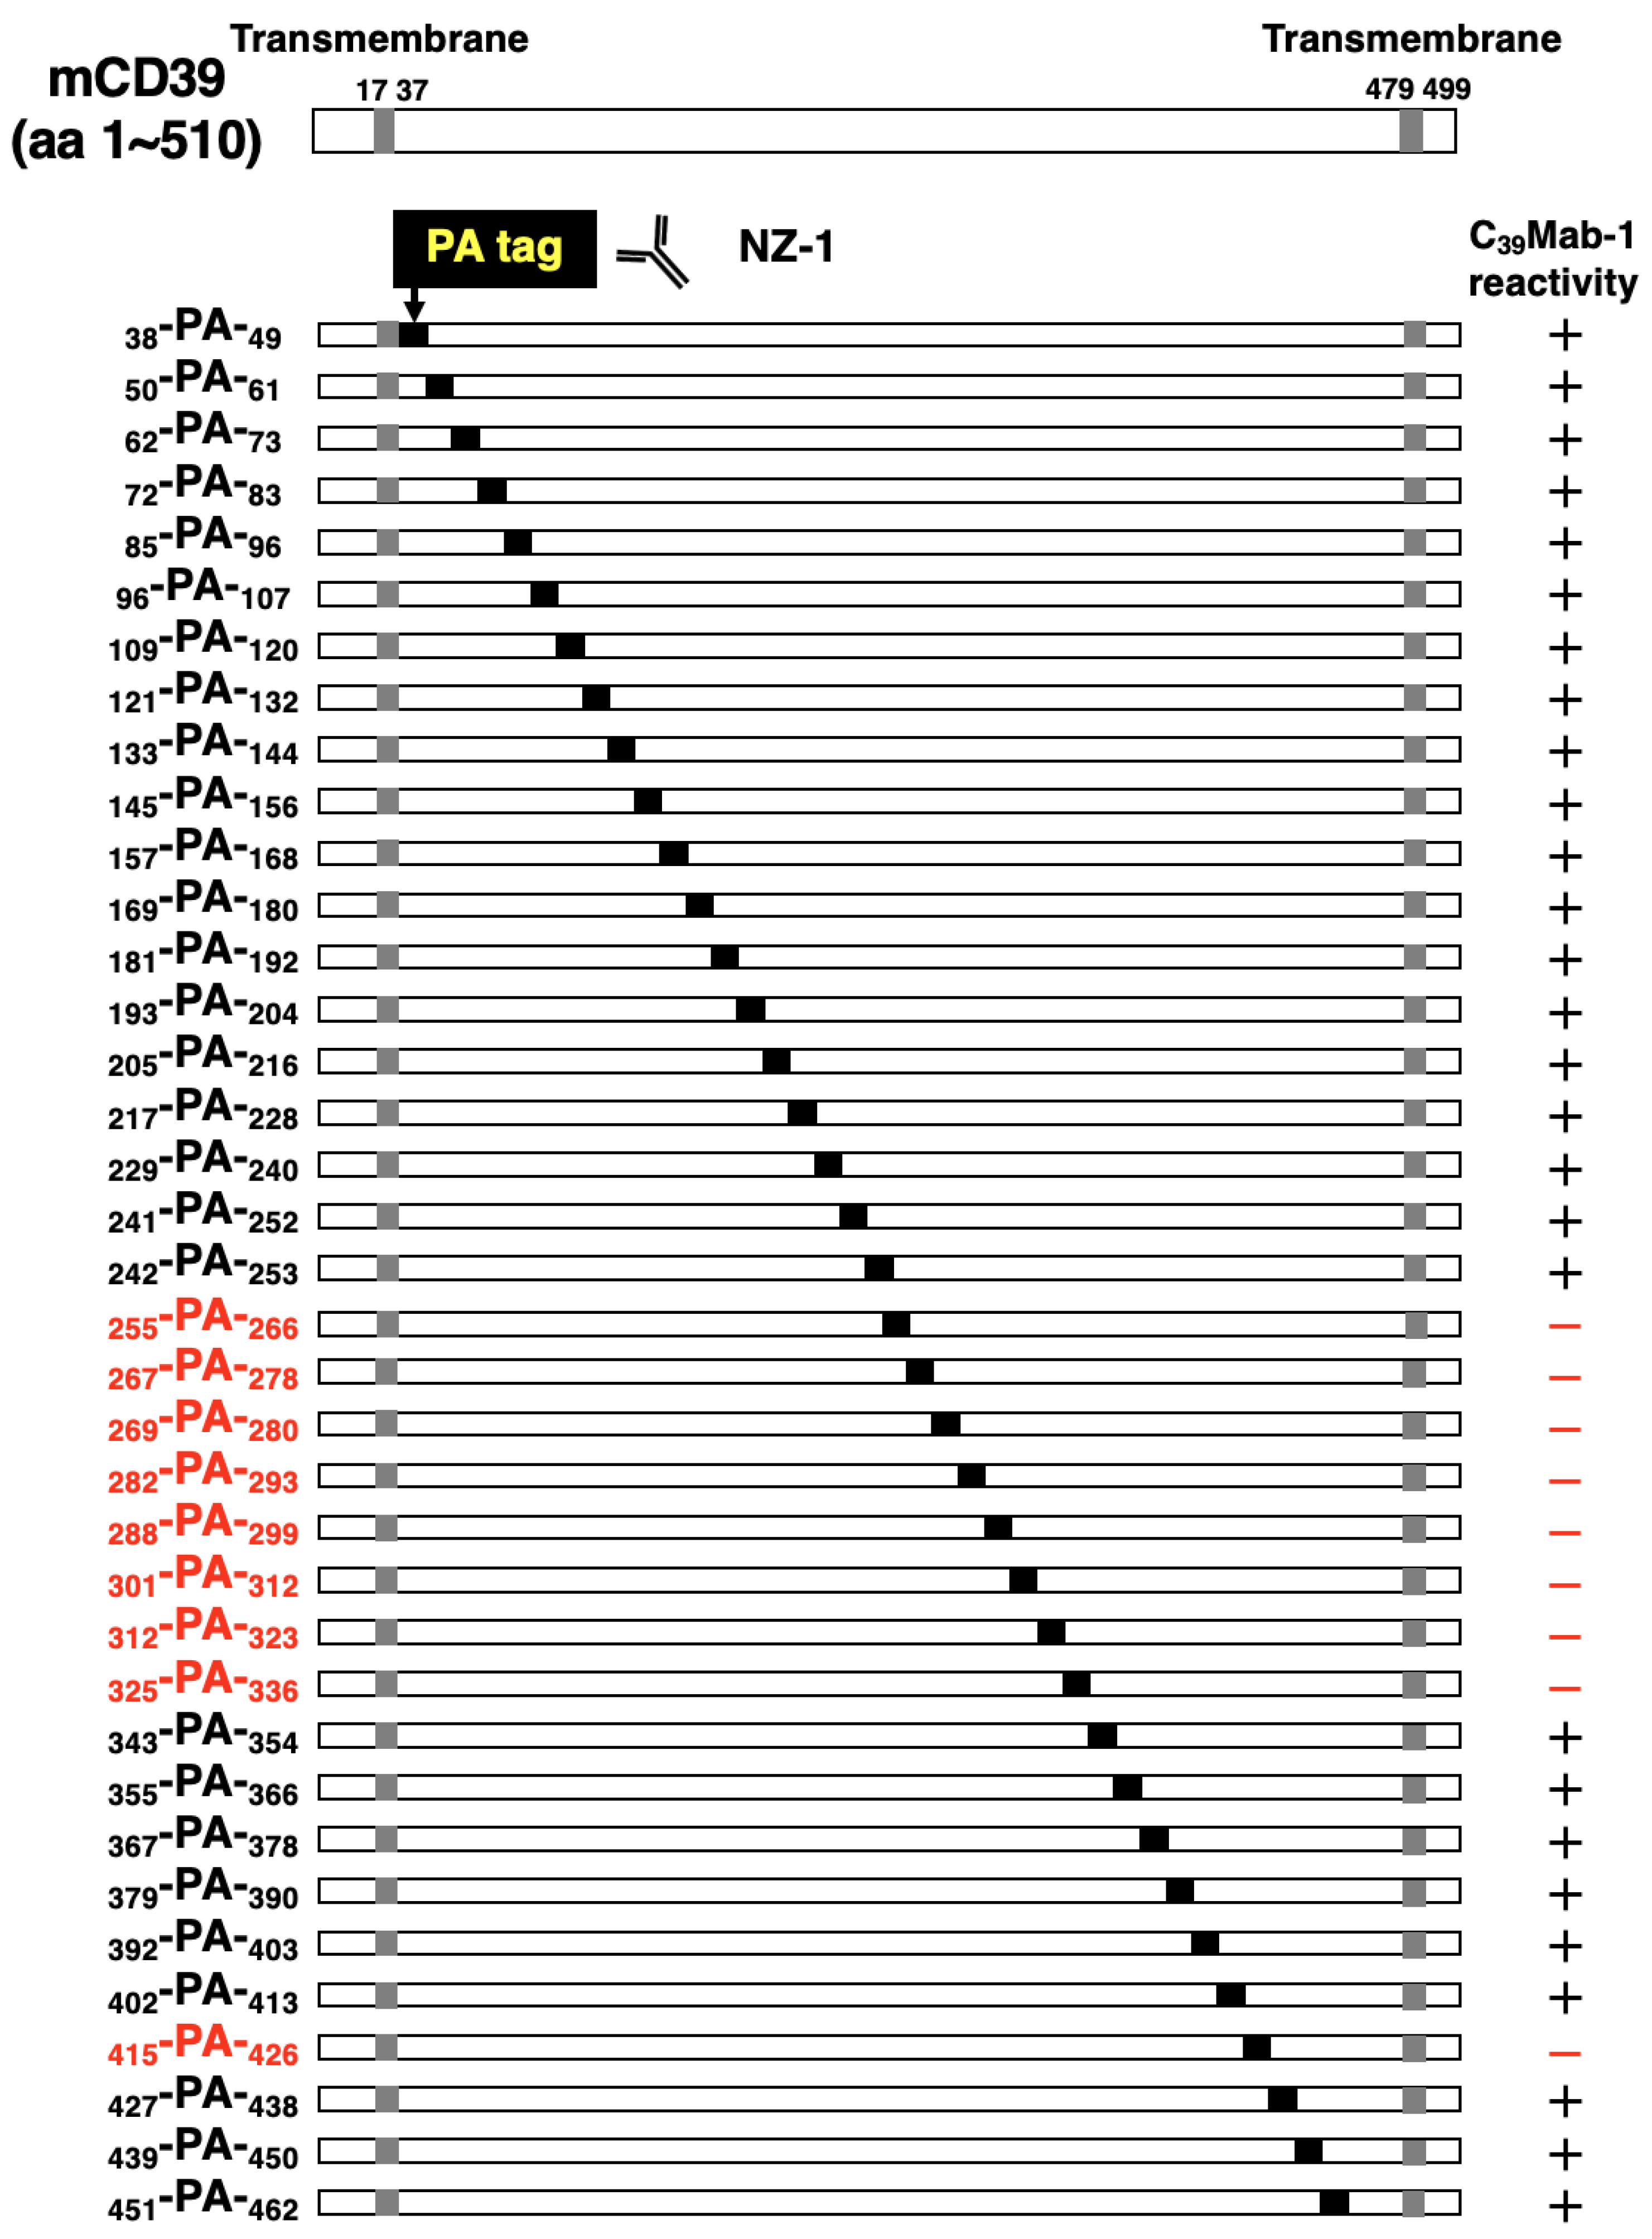
3.1. Epitope mapping of C39Mab-1 using flow cytometry with PA tag-substituted mCD39
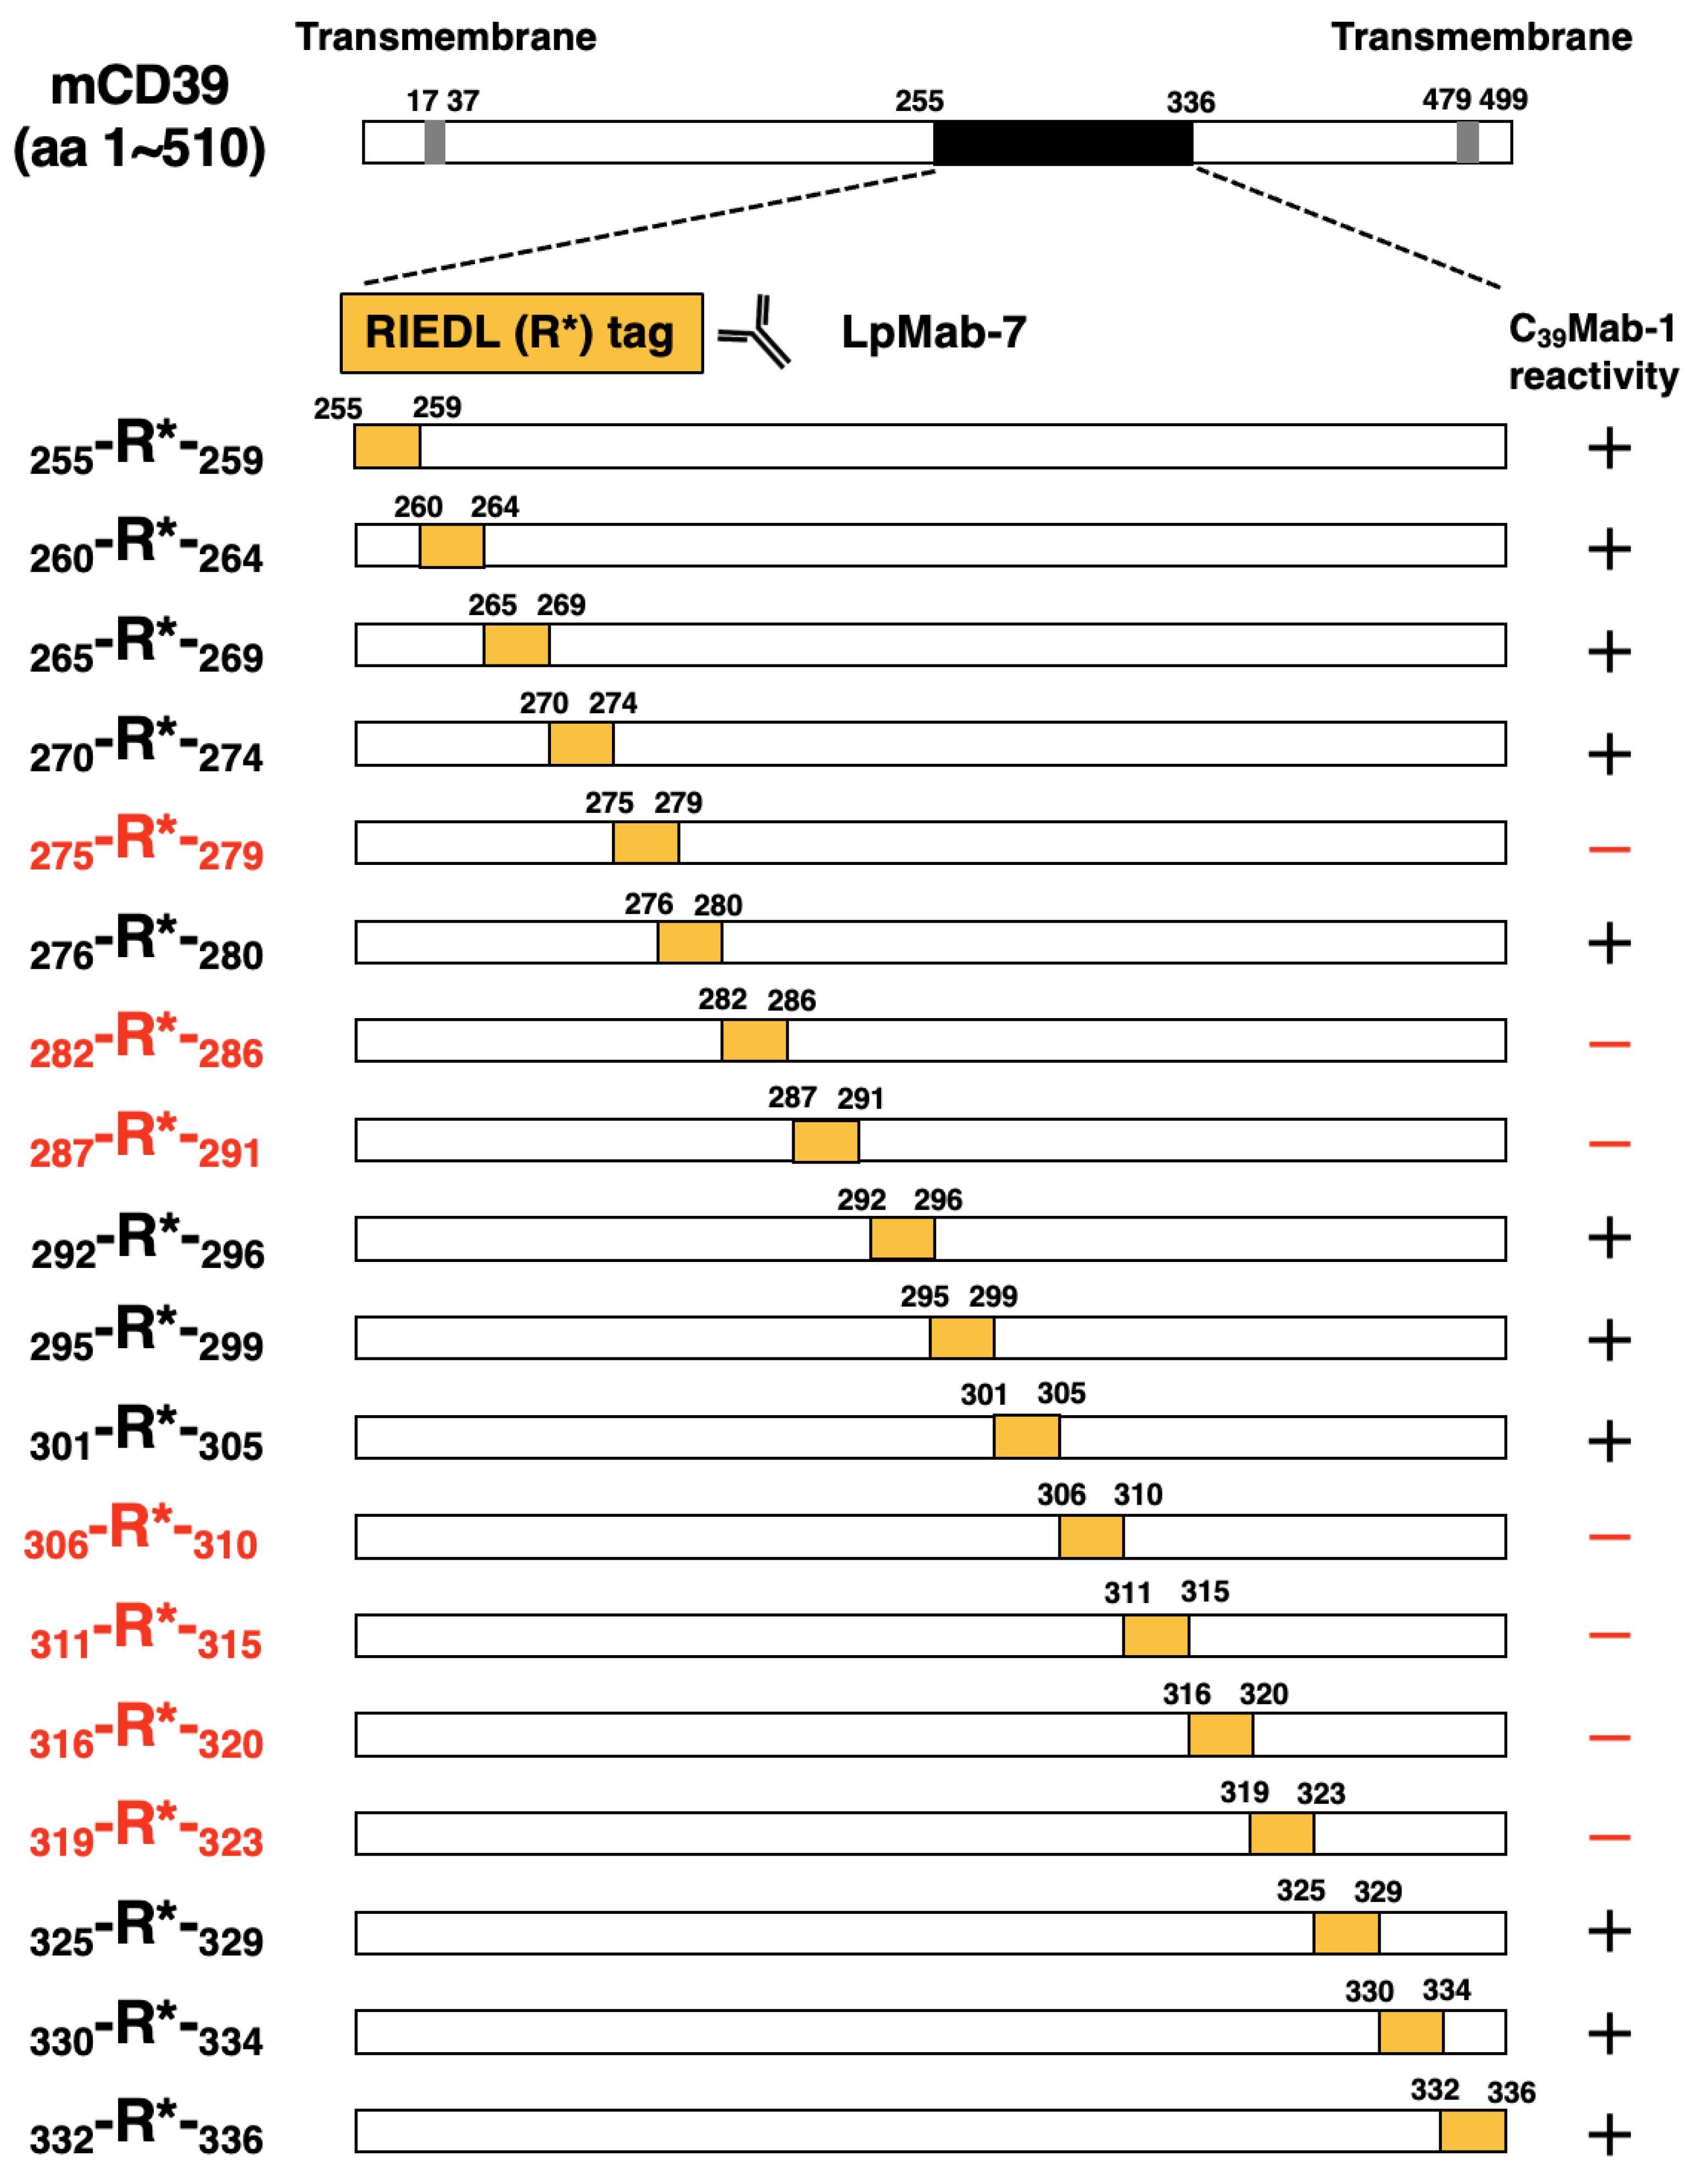
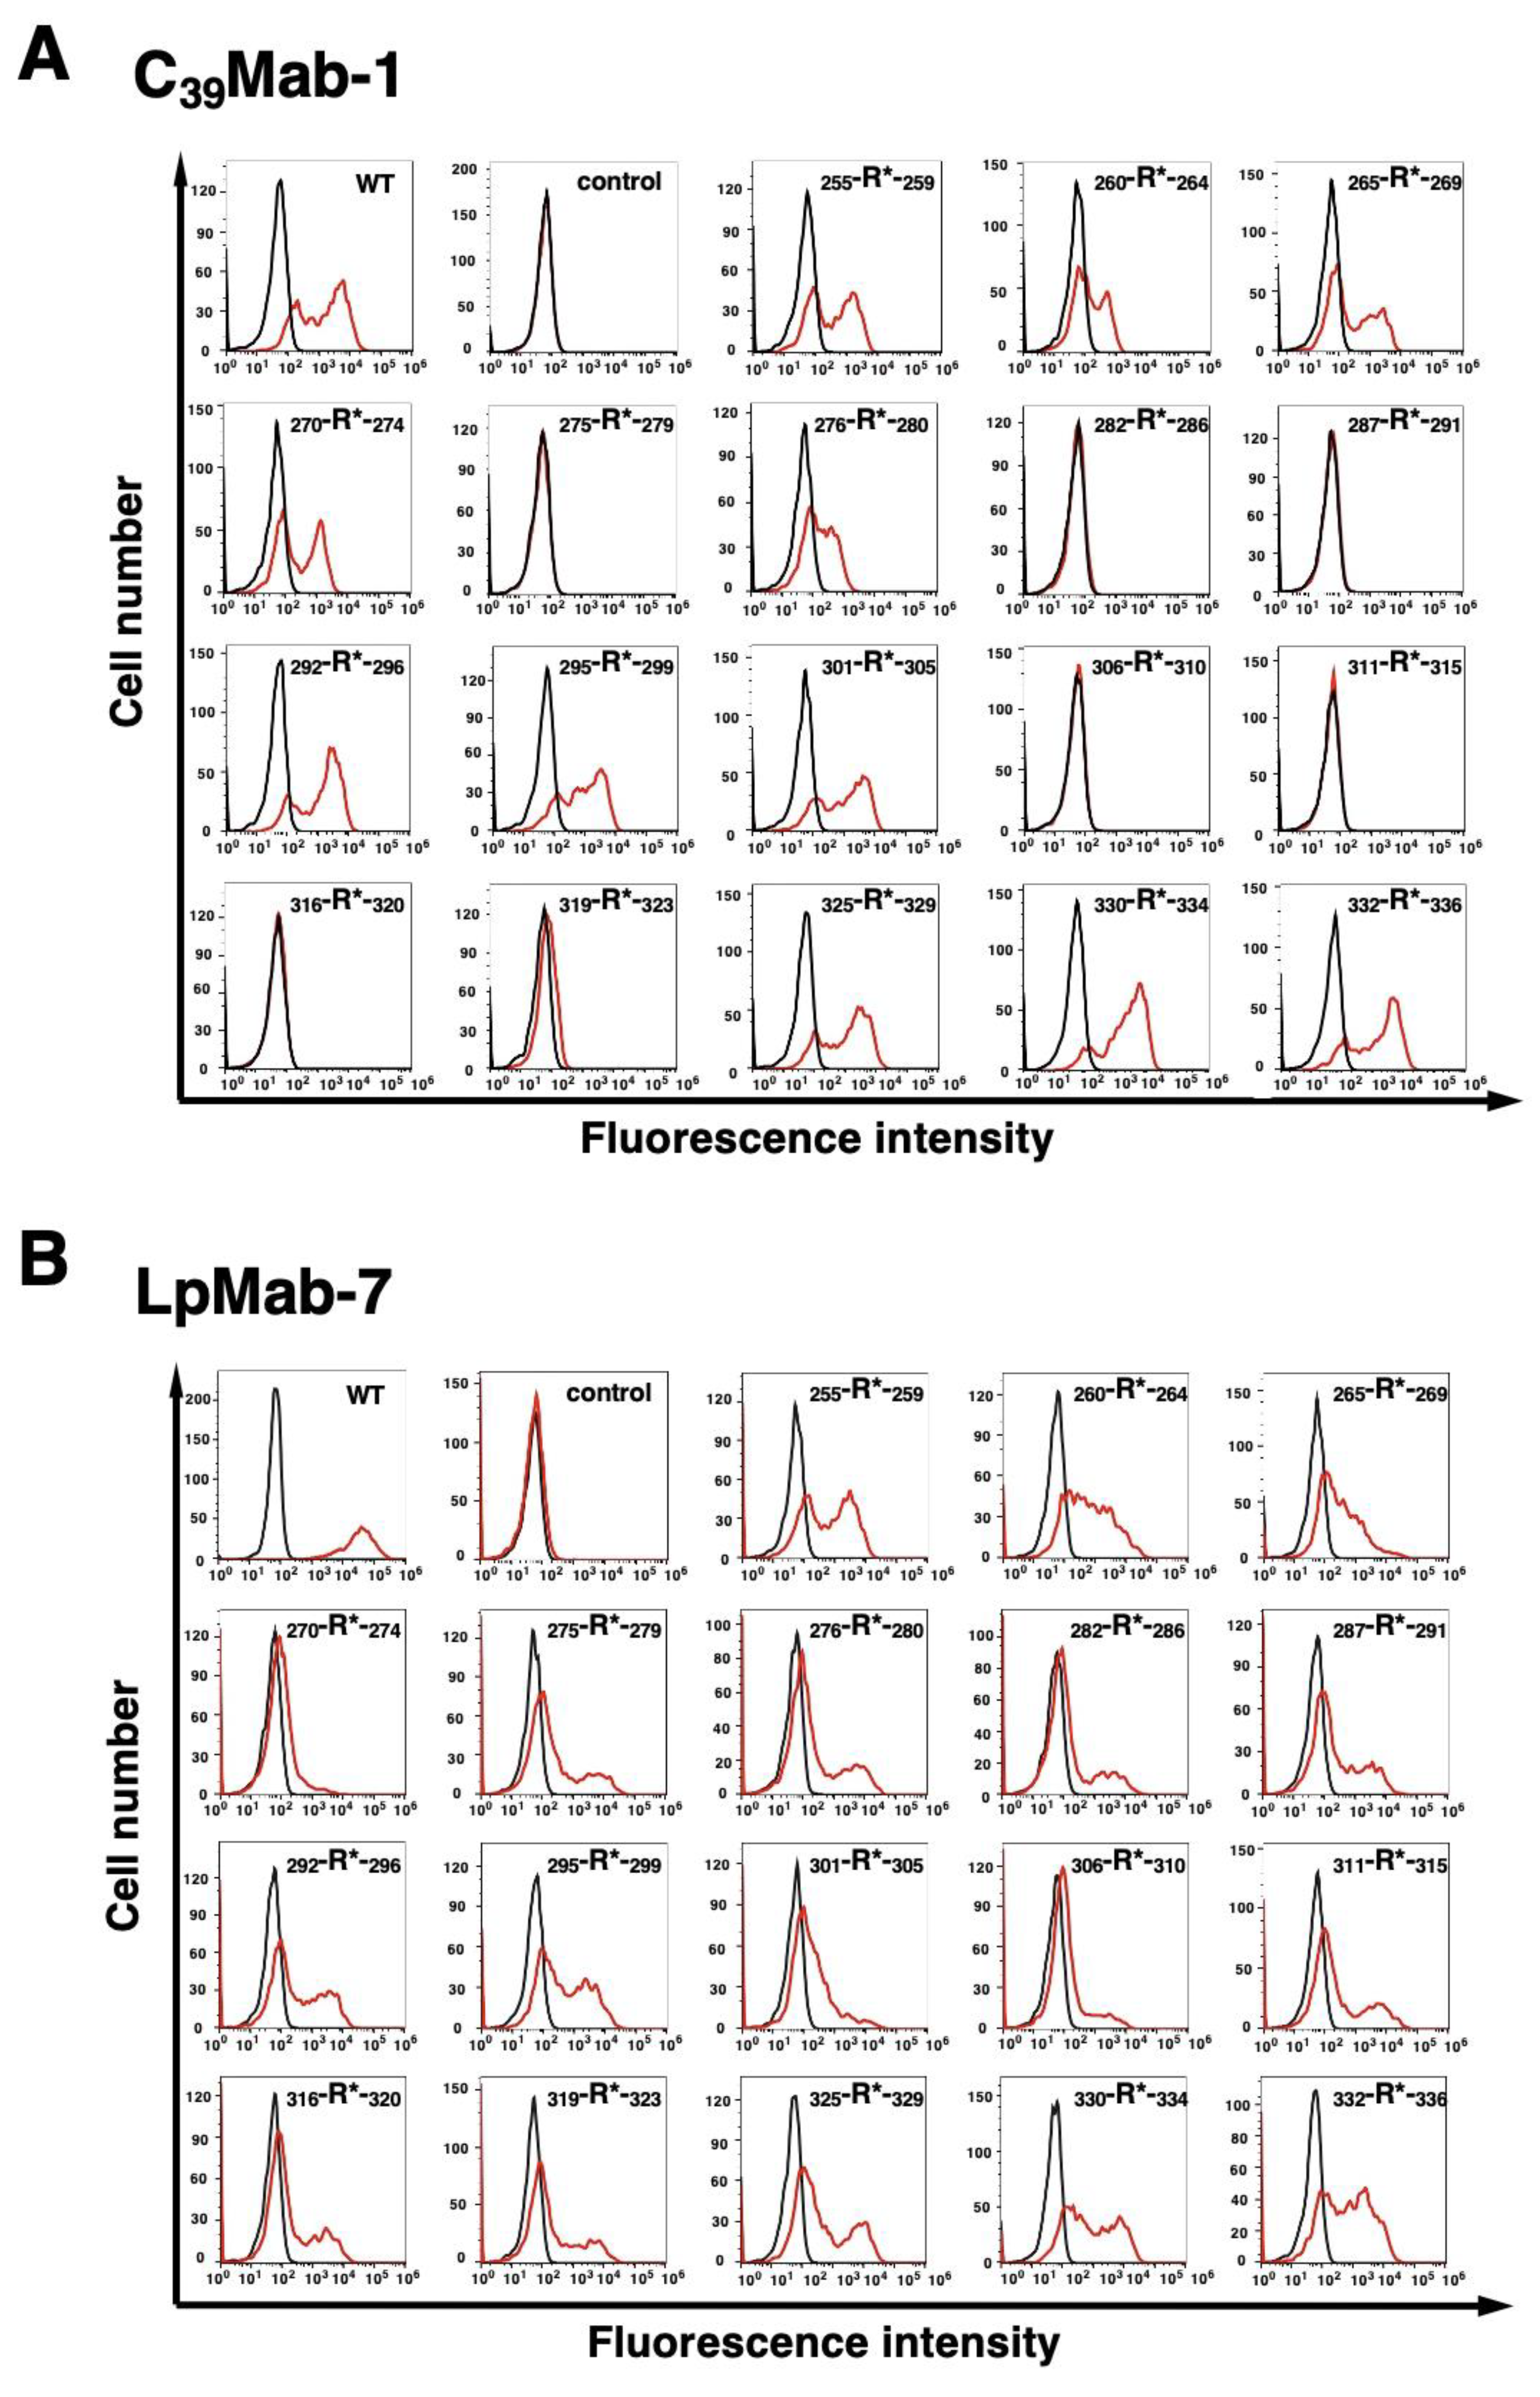
3.2. Epitope mapping of C39Mab-1 using flow cytometry with RIEDL tag-substituted mCD39
3.3. Epitope mapping of C39Mab-1 using flow cytometry with 1×alanine- or 2×alanine-substituted mCD39
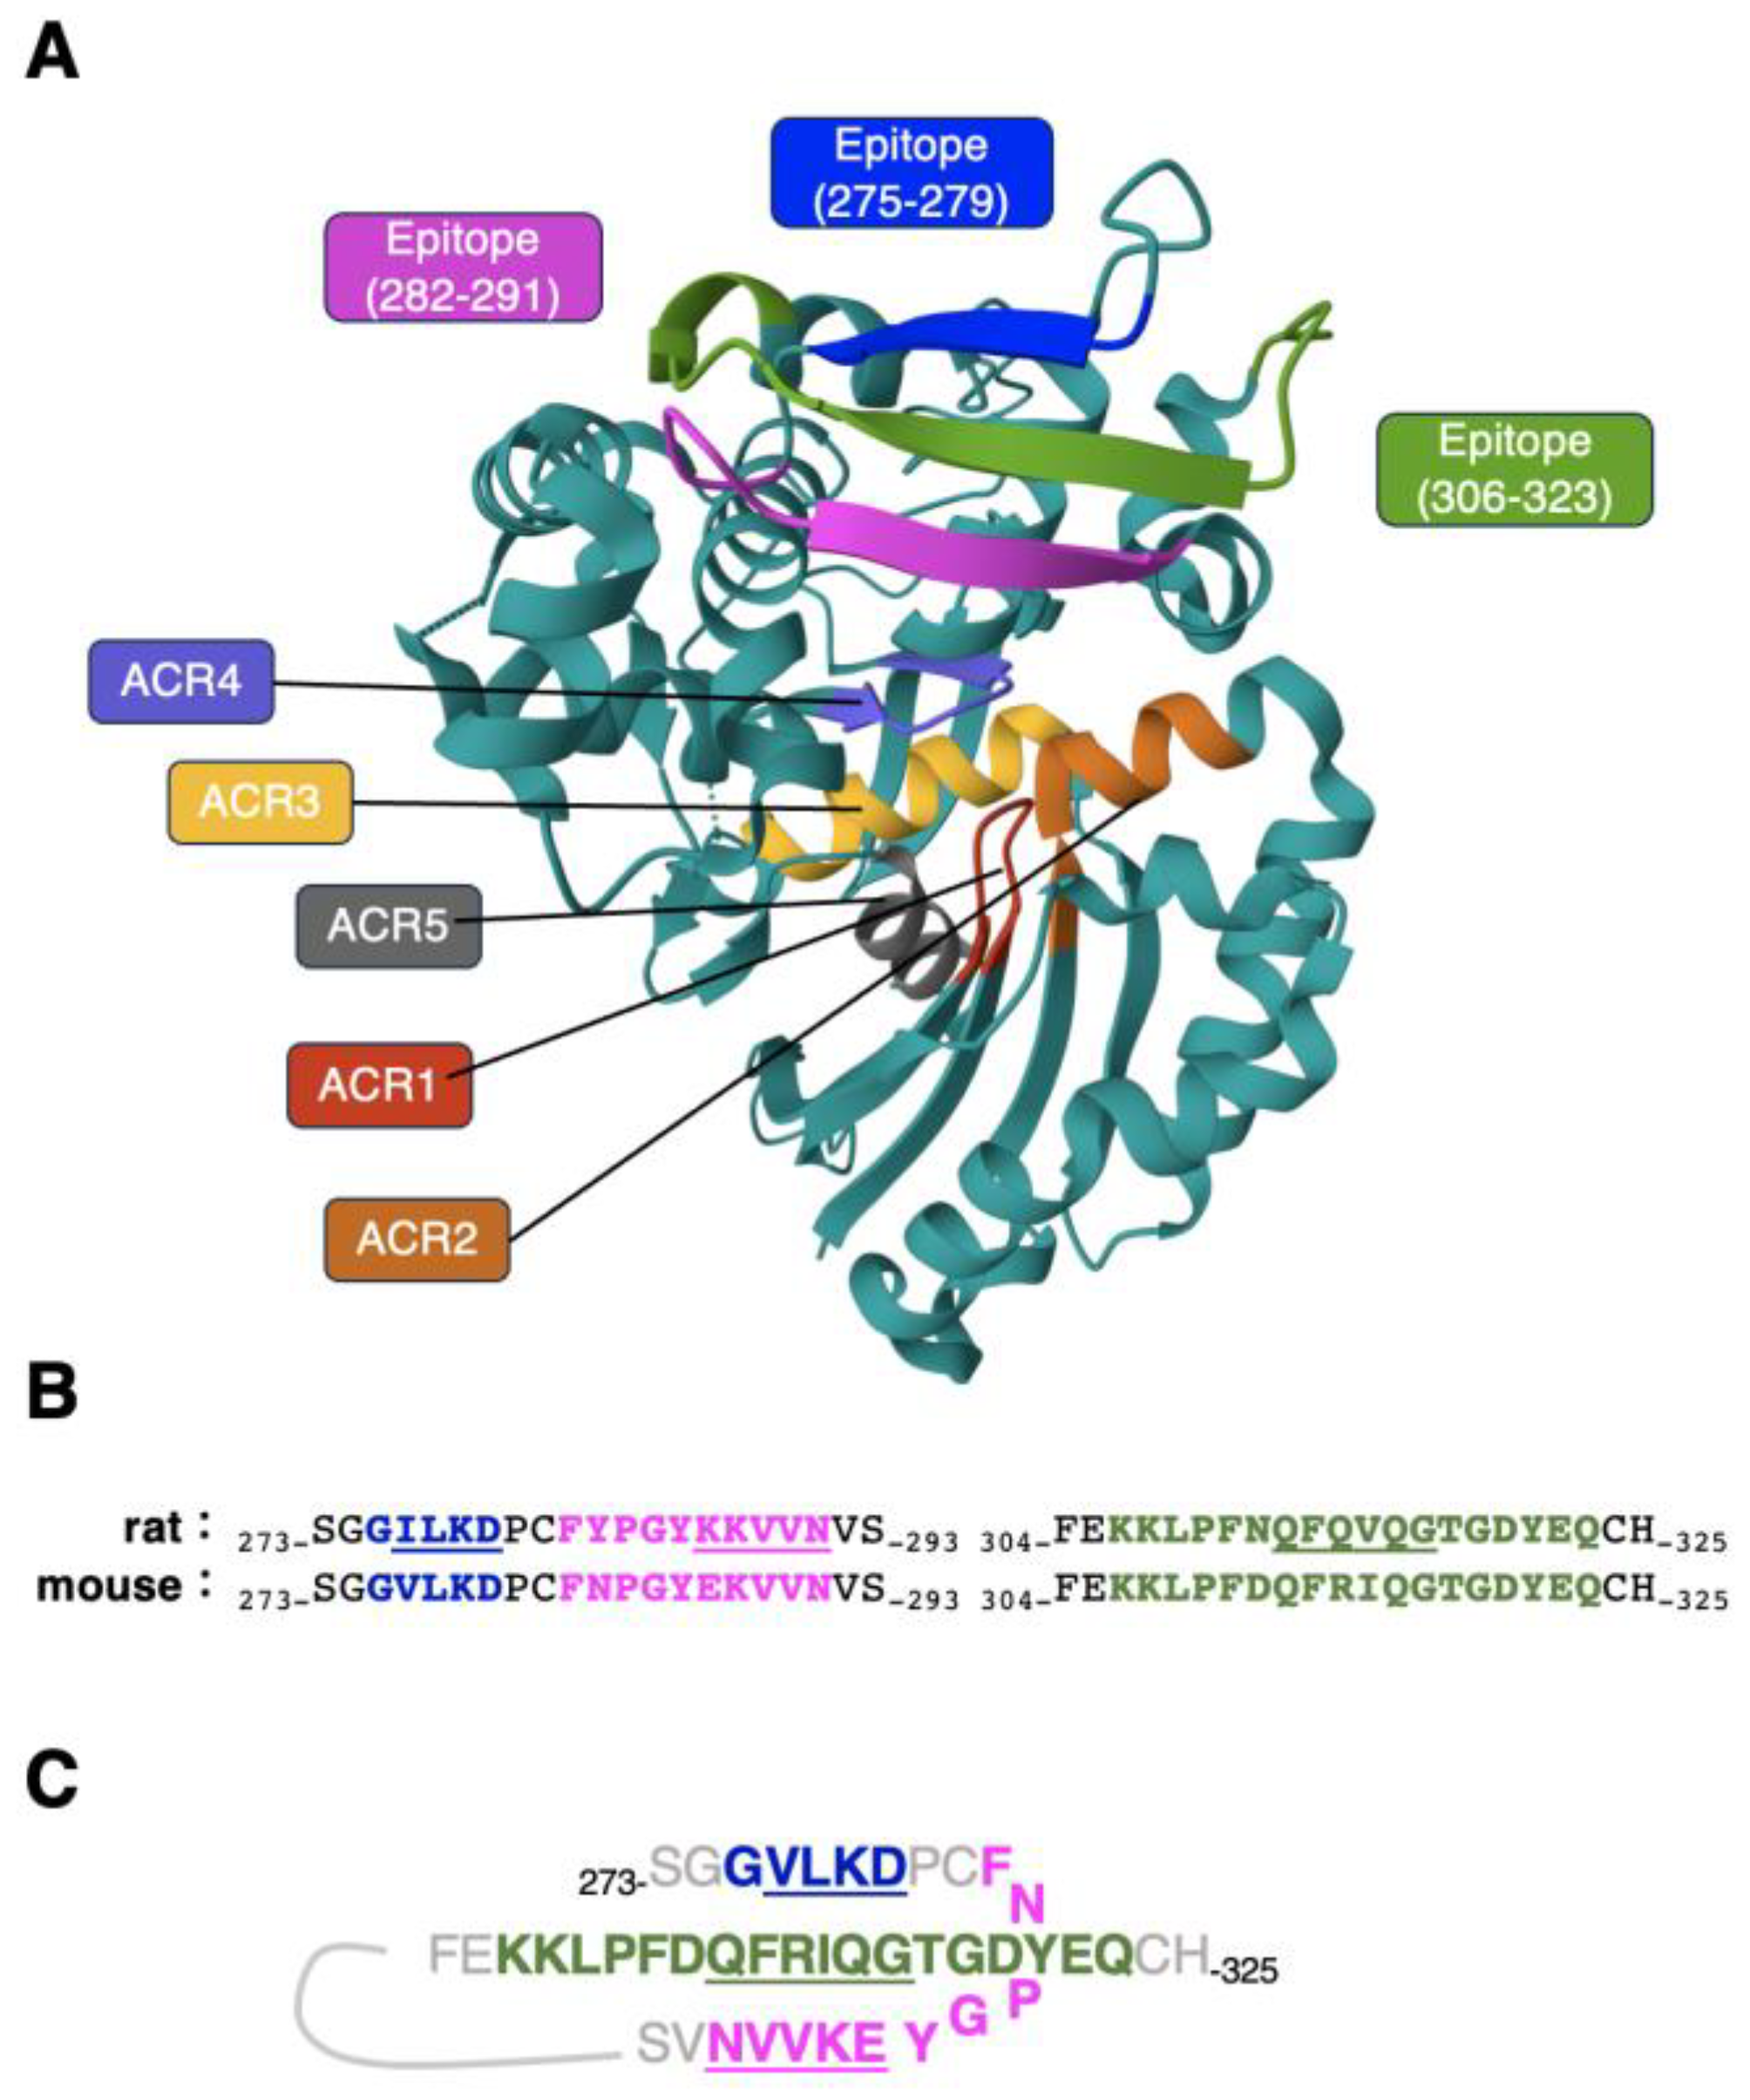
4. Discussion
References
- Di Virgilio, F.; Adinolfi, E. Extracellular purines, purinergic receptors and tumor growth. Oncogene 2017, 36, 293–303. [Google Scholar] [CrossRef]
- Grygorczyk, R.; Boudreault, F.; Ponomarchuk, O.; Tan, J.J.; Furuya, K.; Goldgewicht, J.; Kenfack, F.D.; Yu, F. Lytic Release of Cellular ATP: Physiological Relevance and Therapeutic Applications. Life (Basel) 2021, 11. [Google Scholar] [CrossRef] [PubMed]
- Di Virgilio, F.; Sarti, A.C.; Falzoni, S.; De Marchi, E.; Adinolfi, E. Extracellular ATP and P2 purinergic signalling in the tumour microenvironment. Nat Rev Cancer 2018, 18, 601–618. [Google Scholar] [CrossRef]
- Vijayan, D.; Young, A.; Teng, M.W.L.; Smyth, M.J. Targeting immunosuppressive adenosine in cancer. Nat Rev Cancer 2017, 17, 709–724. [Google Scholar] [CrossRef] [PubMed]
- Guo, S.; Han, F.; Zhu, W. CD39 - A bright target for cancer immunotherapy. Biomed Pharmacother 2022, 151, 113066. [Google Scholar] [CrossRef] [PubMed]
- Xia, C.; Yin, S.; To, K.K.W.; Fu, L. CD39/CD73/A2AR pathway and cancer immunotherapy. Mol Cancer 2023, 22, 44. [Google Scholar] [CrossRef]
- Perrot, I.; Michaud, H.A.; Giraudon-Paoli, M.; Augier, S.; Docquier, A.; Gros, L.; Courtois, R.; Déjou, C.; Jecko, D.; Becquart, O.; et al. Blocking Antibodies Targeting the CD39/CD73 Immunosuppressive Pathway Unleash Immune Responses in Combination Cancer Therapies. Cell Rep 2019, 27, 2411–2425. [Google Scholar] [CrossRef] [PubMed]
- Moesta, A.K.; Li, X.Y.; Smyth, M.J. Targeting CD39 in cancer. Nat Rev Immunol 2020, 20, 739–755. [Google Scholar] [CrossRef]
- Liu, Y.; Li, Z.; Zhao, X.; Xiao, J.; Bi, J.; Li, X.Y.; Chen, G.; Lu, L. Review immune response of targeting CD39 in cancer. Biomark Res 2023, 11, 63. [Google Scholar] [CrossRef]
- Li, X.Y.; Moesta, A.K.; Xiao, C.; Nakamura, K.; Casey, M.; Zhang, H.; Madore, J.; Lepletier, A.; Aguilera, A.R.; Sundarrajan, A.; et al. Targeting CD39 in Cancer Reveals an Extracellular ATP- and Inflammasome-Driven Tumor Immunity. Cancer Discov 2019, 9, 1754–1773. [Google Scholar] [CrossRef]
- Tawara, M.; Suzuki, H.; Goto, N.; Tanaka, T.; Kaneko, M.K.; Kato, Y. A Novel Anti-CD44 Variant 9 Monoclonal Antibody C(44)Mab-1 Was Developed for Immunohistochemical Analyses against Colorectal Cancers. Curr Issues Mol Biol 2023, 45, 3658–3673. [Google Scholar] [CrossRef]
- Suzuki, H.; Kitamura, K.; Goto, N.; Ishikawa, K.; Ouchida, T.; Tanaka, T.; Kaneko, M.K.; Kato, Y. A Novel Anti-CD44 Variant 3 Monoclonal Antibody C(44)Mab-6 Was Established for Multiple Applications. Int J Mol Sci 2023, 24. [Google Scholar] [CrossRef] [PubMed]
- Suzuki, H.; Goto, N.; Tanaka, T.; Ouchida, T.; Kaneko, M.K.; Kato, Y. Development of a Novel Anti-CD44 Variant 8 Monoclonal Antibody C(44)Mab-94 against Gastric Carcinomas. Antibodies (Basel) 2023, 12. [Google Scholar] [CrossRef]
- Kudo, Y.; Suzuki, H.; Tanaka, T.; Kaneko, M.K.; Kato, Y. Development of a Novel Anti-CD44 Variant 5 Monoclonal Antibody C(44)Mab-3 for Multiple Applications against Pancreatic Carcinomas. Antibodies (Basel) 2023, 12. [Google Scholar] [CrossRef]
- Ishikawa, K.; Suzuki, H.; Kaneko, M.K.; Kato, Y. Establishment of a Novel Anti-CD44 Variant 10 Monoclonal Antibody C(44)Mab-18 for Immunohistochemical Analysis against Oral Squamous Cell Carcinomas. Curr Issues Mol Biol 2023, 45, 5248–5262. [Google Scholar] [CrossRef]
- Goto, N.; Suzuki, H.; Tanaka, T.; Ishikawa, K.; Ouchida, T.; Kaneko, M.K.; Kato, Y. EMab-300 Detects Mouse Epidermal Growth Factor Receptor-Expressing Cancer Cell Lines in Flow Cytometry. Antibodies (Basel) 2023, 12. [Google Scholar] [CrossRef]
- Ejima, R.; Suzuki, H.; Tanaka, T.; Asano, T.; Kaneko, M.K.; Kato, Y. Development of a Novel Anti-CD44 Variant 6 Monoclonal Antibody C(44)Mab-9 for Multiple Applications against Colorectal Carcinomas. Int J Mol Sci 2023, 24. [Google Scholar] [CrossRef]
- Nanamiya, R.; Suzuki, H.; Takei, J.; Li, G.; Goto, N.; Harada, H.; Saito, M.; Tanaka, T.; Asano, T.; Kaneko, M.K.; et al. Development of Monoclonal Antibody 281-mG(2a)-f Against Golden Hamster Podoplanin. Monoclon Antib Immunodiagn Immunother 2022, 41, 311–319. [Google Scholar] [CrossRef] [PubMed]
- Li, G.; Suzuki, H.; Asano, T.; Tanaka, T.; Suzuki, H.; Kaneko, M.K.; Kato, Y. Development of a Novel Anti-EpCAM Monoclonal Antibody for Various Applications. Antibodies (Basel) 2022, 11. [Google Scholar] [CrossRef]
- Goto, N.; Suzuki, H.; Tanaka, T.; Asano, T.; Kaneko, M.K.; Kato, Y. Development of a Monoclonal Antibody PMab-292 Against Ferret Podoplanin. Monoclon Antib Immunodiagn Immunother 2022, 41, 101–109. [Google Scholar] [CrossRef]
- Asano, T.; Suzuki, H.; Tanaka, T.; Saito, M.; Li, G.; Goto, N.; Nanamiya, R.; Kaneko, M.K.; Kato, Y. C(3)Mab-3: A Monoclonal Antibody for Mouse CC Chemokine Receptor 3 for Flow Cytometry. Monoclon Antib Immunodiagn Immunother 2022, 41, 74–79. [Google Scholar] [CrossRef] [PubMed]
- Tanaka, T.; Ohishi, T.; Asano, T.; Takei, J.; Nanamiya, R.; Hosono, H.; Sano, M.; Harada, H.; Kawada, M.; Kaneko, M.K.; et al. An anti-TROP2 monoclonal antibody TrMab-6 exerts antitumor activity in breast cancer mouse xenograft models. Oncol Rep 2021, 46. [Google Scholar] [CrossRef] [PubMed]
- Tanaka, T.; Nanamiya, R.; Takei, J.; Nakamura, T.; Yanaka, M.; Hosono, H.; Sano, M.; Asano, T.; Kaneko, M.K.; Kato, Y. Development of Anti-Mouse CC Chemokine Receptor 8 Monoclonal Antibodies for Flow Cytometry. Monoclon Antib Immunodiagn Immunother 2021, 40, 65–70. [Google Scholar] [CrossRef] [PubMed]
- Tanaka, T.; Asano, T.; Sano, M.; Takei, J.; Hosono, H.; Nanamiya, R.; Nakamura, T.; Yanaka, M.; Harada, H.; Fukui, M.; et al. Development of Monoclonal Antibody PMab-269 Against California Sea Lion Podoplanin. Monoclon Antib Immunodiagn Immunother 2021, 40, 124–133. [Google Scholar] [CrossRef] [PubMed]
- Takei, J.; Asano, T.; Nanamiya, R.; Nakamura, T.; Yanaka, M.; Hosono, H.; Tanaka, T.; Sano, M.; Kaneko, M.K.; Harada, H.; et al. Development of Anti-human T Cell Immunoreceptor with Ig and ITIM Domains (TIGIT) Monoclonal Antibodies for Flow Cytometry. Monoclon Antib Immunodiagn Immunother 2021, 40, 71–75. [Google Scholar] [CrossRef] [PubMed]
- Sayama, Y.; Kaneko, M.K.; Kato, Y. Development and characterization of TrMab-6, a novel anti-TROP2 monoclonal antibody for antigen detection in breast cancer. Mol Med Rep 2021, 23. [Google Scholar] [CrossRef] [PubMed]
- Nanamiya, R.; Takei, J.; Asano, T.; Tanaka, T.; Sano, M.; Nakamura, T.; Yanaka, M.; Hosono, H.; Kaneko, M.K.; Kato, Y. Development of Anti-Human CC Chemokine Receptor 9 Monoclonal Antibodies for Flow Cytometry. Monoclon Antib Immunodiagn Immunother 2021, 40, 101–106. [Google Scholar] [CrossRef] [PubMed]
- Hosono, H.; Asano, T.; Takei, J.; Sano, M.; Tanaka, T.; Kaneko, M.K.; Kato, Y. Development of an Anti-Elephant Podoplanin Monoclonal Antibody PMab-265 for Flow Cytometry. Monoclon Antib Immunodiagn Immunother 2021, 40, 141–145. [Google Scholar] [CrossRef]
- Yamada, S.; Kaneko, M.K.; Sayama, Y.; Asano, T.; Sano, M.; Yanaka, M.; Nakamura, T.; Okamoto, S.; Handa, S.; Komatsu, Y.; et al. Development of Novel Mouse Monoclonal Antibodies Against Human CD19. Monoclon Antib Immunodiagn Immunother 2020, 39, 45–50. [Google Scholar] [CrossRef]
- Kaneko, M.K.; Sano, M.; Takei, J.; Asano, T.; Sayama, Y.; Hosono, H.; Kobayashi, A.; Konnai, S.; Kato, Y. Development and Characterization of Anti-Sheep Podoplanin Monoclonal Antibodies PMab-253 and PMab-260. Monoclon Antib Immunodiagn Immunother 2020, 39, 144–155. [Google Scholar] [CrossRef]
- Kaneko, M.K.; Ohishi, T.; Kawada, M.; Kato, Y. A cancer-specific anti-podocalyxin monoclonal antibody (60-mG(2a)-f) exerts antitumor effects in mouse xenograft models of pancreatic carcinoma. Biochem Biophys Rep 2020, 24, 100826. [Google Scholar] [CrossRef]
- Furusawa, Y.; Kaneko, M.K.; Kato, Y. Establishment of C(20)Mab-11, a novel anti-CD20 monoclonal antibody, for the detection of B cells. Oncol Lett 2020, 20, 1961–1967. [Google Scholar] [CrossRef] [PubMed]
- Kato, Y.; Ohishi, T.; Yamada, S.; Itai, S.; Furusawa, Y.; Sano, M.; Nakamura, T.; Kawada, M.; Kaneko, M.K. Anti-CD133 Monoclonal Antibody CMab-43 Exerts Antitumor Activity in a Mouse Xenograft Model of Colon Cancer. Monoclon Antib Immunodiagn Immunother 2019, 38, 75–78. [Google Scholar] [CrossRef]
- Kato, Y.; Furusawa, Y.; Yamada, S.; Itai, S.; Takei, J.; Sano, M.; Kaneko, M.K. Establishment of a monoclonal antibody PMab-225 against alpaca podoplanin for immunohistochemical analyses. Biochem Biophys Rep 2019, 18, 100633. [Google Scholar] [CrossRef]
- Yamada, S.; Itai, S.; Nakamura, T.; Yanaka, M.; Kaneko, M.K.; Kato, Y. Detection of high CD44 expression in oral cancers using the novel monoclonal antibody, C(44)Mab-5. Biochem Biophys Rep 2018, 14, 64–68. [Google Scholar] [CrossRef] [PubMed]
- Yamada, S.; Itai, S.; Nakamura, T.; Yanaka, M.; Chang, Y.W.; Suzuki, H.; Kaneko, M.K.; Kato, Y. Monoclonal Antibody L(1)Mab-13 Detected Human PD-L1 in Lung Cancers. Monoclon Antib Immunodiagn Immunother 2018, 37, 110–115. [Google Scholar] [CrossRef] [PubMed]
- Okada, Y.; Suzuki, H.; Kaneko, M.K.; Kato, Y. Development of a Sensitive Anti-Mouse CD39 Monoclonal Antibody (C39Mab-1) for Flow Cytometry and Western Blot Analyses. Monoclon Antib Immunodiagn Immunother 2023, in press. [Google Scholar] [CrossRef]
- Kaneko, M.K.; Oki, H.; Ogasawara, S.; Takagi, M.; Kato, Y. Anti-podoplanin Monoclonal Antibody LpMab-7 Detects Metastatic Lesions of Osteosarcoma. Monoclon Antib Immunodiagn Immunother 2015, 34, 154–161. [Google Scholar] [CrossRef] [PubMed]
- Kato, Y.; Kunita, A.; Abe, S.; Ogasawara, S.; Fujii, Y.; Oki, H.; Fukayama, M.; Nishioka, Y.; Kaneko, M.K. The chimeric antibody chLpMab-7 targeting human podoplanin suppresses pulmonary metastasis via ADCC and CDC rather than via its neutralizing activity. Oncotarget 2015, 6, 36003–36018. [Google Scholar] [CrossRef]
- Oki, H.; Kaneko, M.K.; Ogasawara, S.; Tsujimoto, Y.; Liu, X.; Sugawara, M.; Takakubo, Y.; Takagi, M.; Kato, Y. Characterization of Monoclonal Antibody LpMab-7 Recognizing Non-PLAG Domain of Podoplanin. Monoclon Antib Immunodiagn Immunother 2015, 34, 174–180. [Google Scholar] [CrossRef]
- Asano, T.; Kaneko, M.K.; Kato, Y. Development of a Novel Epitope Mapping System: RIEDL Insertion for Epitope Mapping Method. Monoclon Antib Immunodiagn Immunother 2021, 40, 162–167. [Google Scholar] [CrossRef] [PubMed]
- Asano, T.; Kaneko, M.K.; Kato, Y. RIEDL tag: A novel pentapeptide tagging system for transmembrane protein purification. Biochem Biophys Rep 2020, 23, 100780. [Google Scholar] [CrossRef] [PubMed]
- Asano, T.; Kaneko, M.K.; Takei, J.; Tateyama, N.; Kato, Y. Epitope Mapping of the Anti-CD44 Monoclonal Antibody (C(44)Mab-46) Using the REMAP Method. Monoclon Antib Immunodiagn Immunother 2021, 40, 156–161. [Google Scholar] [CrossRef] [PubMed]
- Nanamiya, R.; Sano, M.; Asano, T.; Yanaka, M.; Nakamura, T.; Saito, M.; Tanaka, T.; Hosono, H.; Tateyama, N.; Kaneko, M.K.; et al. Epitope Mapping of an Anti-Human Epidermal Growth Factor Receptor Monoclonal Antibody (EMab-51) Using the RIEDL Insertion for Epitope Mapping Method. Monoclon Antib Immunodiagn Immunother 2021, 40, 149–155. [Google Scholar] [CrossRef] [PubMed]
- Sano, M.; Kaneko, M.K.; Aasano, T.; Kato, Y. Epitope Mapping of an Antihuman EGFR Monoclonal Antibody (EMab-134) Using the REMAP Method. Monoclon Antib Immunodiagn Immunother 2021, 40, 191–195. [Google Scholar] [CrossRef]
- Sayama, Y.; Sano, M.; Kaneko, M.K.; Kato, Y. Epitope Analysis of an Anti-Whale Podoplanin Monoclonal Antibody, PMab-237, Using Flow Cytometry. Monoclon Antib Immunodiagn Immunother 2020, 39, 17–22. [Google Scholar] [CrossRef]
- Tsuboyama, K.; Dauparas, J.; Chen, J.; Laine, E.; Mohseni Behbahani, Y.; Weinstein, J.J.; Mangan, N.M.; Ovchinnikov, S.; Rocklin, G.J. Mega-scale experimental analysis of protein folding stability in biology and design. Nature 2023, 620, 434–444. [Google Scholar] [CrossRef]
- Fujii, Y.; Kaneko, M.; Neyazaki, M.; Nogi, T.; Kato, Y.; Takagi, J. PA tag: a versatile protein tagging system using a super high affinity antibody against a dodecapeptide derived from human podoplanin. Protein Expr Purif 2014, 95, 240–247. [Google Scholar] [CrossRef]
- Kato, Y.; Kaneko, M.K.; Kuno, A.; Uchiyama, N.; Amano, K.; Chiba, Y.; Hasegawa, Y.; Hirabayashi, J.; Narimatsu, H.; Mishima, K.; et al. Inhibition of tumor cell-induced platelet aggregation using a novel anti-podoplanin antibody reacting with its platelet-aggregation-stimulating domain. Biochem Biophys Res Commun 2006, 349, 1301–1307. [Google Scholar] [CrossRef]
- Tamura, R.; Oi, R.; Akashi, S.; Kaneko, M.K.; Kato, Y.; Nogi, T. Application of the NZ-1 Fab as a crystallization chaperone for PA tag-inserted target proteins. Protein Sci 2019, 28, 823–836. [Google Scholar] [CrossRef]
- Fujii, Y.; Matsunaga, Y.; Arimori, T.; Kitago, Y.; Ogasawara, S.; Kaneko, M.K.; Kato, Y.; Takagi, J. Tailored placement of a turn-forming PA tag into the structured domain of a protein to probe its conformational state. J Cell Sci 2016, 129, 1512–1522. [Google Scholar] [CrossRef] [PubMed]
- Imaizumi, Y.; Takanuki, K.; Miyake, T.; Takemoto, M.; Hirata, K.; Hirose, M.; Oi, R.; Kobayashi, T.; Miyoshi, K.; Aruga, R.; et al. Mechanistic insights into intramembrane proteolysis by E. coli site-2 protease homolog RseP. Sci Adv 2022, 8, eabp9011. [Google Scholar] [CrossRef] [PubMed]
- Tamura-Sakaguchi, R.; Aruga, R.; Hirose, M.; Ekimoto, T.; Miyake, T.; Hizukuri, Y.; Oi, R.; Kaneko, M.K.; Kato, Y.; Akiyama, Y.; et al. Moving toward generalizable NZ-1 labeling for 3D structure determination with optimized epitope-tag insertion. Acta Crystallogr D Struct Biol 2021, 77, 645–662. [Google Scholar] [CrossRef] [PubMed]
- Isoda, Y.; Tanaka, T.; Suzuki, H.; Asano, T.; Yoshikawa, T.; Kitamura, K.; Kudo, Y.; Ejima, R.; Ozawa, K.; Kaneko, M.K.; et al. Epitope Mapping Using the Cell-Based 2 × Alanine Substitution Method About the Anti-mouse CXCR6 Monoclonal Antibody, Cx(6)Mab-1. Monoclon Antib Immunodiagn Immunother 2023, 42, 22–26. [Google Scholar] [CrossRef] [PubMed]
- Isoda, Y.; Tanaka, T.; Suzuki, H.; Asano, T.; Kitamura, K.; Kudo, Y.; Ejima, R.; Ozawa, K.; Yoshikawa, T.; Kaneko, M.K.; et al. Epitope Mapping of the Novel Anti-Human CCR9 Monoclonal Antibody (C(9)Mab-11) by 2 × Alanine Scanning. Monoclon Antib Immunodiagn Immunother 2023, 42, 73–76. [Google Scholar] [CrossRef] [PubMed]
- Isoda, Y.; Tanaka, T.; Suzuki, H.; Asano, T.; Nakamura, T.; Yanaka, M.; Handa, S.; Komatsu, Y.; Okuno, S.; Takahashi, N.; et al. Epitope Mapping of an Anti-Mouse CXCR6 Monoclonal Antibody (Cx(6)Mab-1) Using the 2 × Alanine Scanning Method. Monoclon Antib Immunodiagn Immunother 2022, 41, 275–278. [Google Scholar] [CrossRef]
- Zebisch, M.; Krauss, M.; Schäfer, P.; Sträter, N. Crystallographic evidence for a domain motion in rat nucleoside triphosphate diphosphohydrolase (NTPDase) 1. J Mol Biol 2012, 415, 288–306. [Google Scholar] [CrossRef]
- Schulte am Esch, J., 2nd; Sévigny, J.; Kaczmarek, E.; Siegel, J.B.; Imai, M.; Koziak, K.; Beaudoin, A.R.; Robson, S.C. Structural elements and limited proteolysis of CD39 influence ATP diphosphohydrolase activity. Biochemistry 1999, 38, 2248–2258. [Google Scholar] [CrossRef]
- Spatola, B.N.; Lerner, A.G.; Wong, C.; Dela Cruz, T.; Welch, M.; Fung, W.; Kovalenko, M.; Losenkova, K.; Yegutkin, G.G.; Beers, C.; et al. Fully human anti-CD39 antibody potently inhibits ATPase activity in cancer cells via uncompetitive allosteric mechanism. MAbs 2020, 12, 1838036. [Google Scholar] [CrossRef]


Disclaimer/Publisher’s Note: The statements, opinions and data contained in all publications are solely those of the individual author(s) and contributor(s) and not of MDPI and/or the editor(s). MDPI and/or the editor(s) disclaim responsibility for any injury to people or property resulting from any ideas, methods, instructions or products referred to in the content. |
© 2023 by the authors. Licensee MDPI, Basel, Switzerland. This article is an open access article distributed under the terms and conditions of the Creative Commons Attribution (CC BY) license (http://creativecommons.org/licenses/by/4.0/).


