1. Introduction
Lithium-ion (Li-ion) batteries are the cornerstone in the development of electrical energy storage solutions. Today, Li-ion batteries offer high specific energy, high efficiency (> 95%), long cycle life, up to thousands of charge/discharge cycles [
1], and low self-discharge rate [
2,
3]. Several cathode chemistries coexist, including lithium manganese oxide (LMO) batteries (up to 1500 cycles and 140 Wh/kg), lithium iron phosphate (LFP) batteries (up to 2000 cycles and 140 Wh/kg), nickel manganese cobalt oxide (NMC) batteries (up to 2000 cycles and 240 W/kg) and lithium nickel cobalt aluminum oxide (NCA) batteries (up to 1500 cycles and 250 Wh/kg). Recently, NMC cells have reported energy densities exceeding 300 Wh/kg [
4].
As a result, Li-ion batteries are widely used in a variety of applications, including transportation systems, electronics and grid storage, among others [
5]. Battery degradation is complex phenomenon that depends on thermal, mechanical and electrochemical processes, whose behaviors depend on battery chemistry, cell design, operating conditions and use patterns [
6,
7]. As a result, extending battery life is a complex and challenging research topic that has a significant potential impact on the reliability and performance of battery-powered systems. Battery life extension strategies are receiving increased attention [
8], as extended battery life can reduce operating costs and environmental impact, while enabling more sustainable operation of battery systems [
9,
10].
To ensure their optimal use, extend their life, improve the maintenance schedules of the battery-powered equipment [
11], and minimize the environmental impact associated with battery disposal, accurate state of health (SOH) estimation and prediction is critical. SOH is a key indicator for awareness of battery condition and for battery derating control [
7]. In [
12] the SOH is defined as the ratio between
Qmax/Qrated, where
Qmax is the maximum charge the battery can hold at the present time and
Qrated is the nominal or rated charge.
New cells can typically withstand higher load currents, but as they age, the same current can cause accelerated degradation. At the beginning of its life, a battery can be charged at a certain current rate without problems, but as it ages, an increase in internal resistance, loss of active material, or other phenomena can lead to undesirable effects such as lithium plating at the same charge current [
13]. As a result, it is necessary to determine the SOH and RUL of the battery as it ages. This allows preventive and operational actions to be planned.
The rated capacity of a battery, usually specified by the manufacturer, is defined as the amount of charge that a fully charged battery can deliver under specified load and temperature conditions [
14]. However, due to cycling, operating and environmental conditions, the capacity of the battery will differ from the rated capacity due to battery fade resulting from battery use. For example, high discharge rates tend to increase the energy loss and internal resistance of a battery, resulting in reduced cycle capacity. Therefore, the cycle capacity is an indicator of the amount of charge the battery can hold, similar to the fuel gauge in internal combustion vehicles [
2], so it is an accepted indicator of the SOH of a battery. Since it cannot be directly measured, real-time methods to estimate the cycle capacity of a battery are a must. With the widespread application of renewable energy sources and electric vehicles, researchers have paid much attention to the development of accurate battery capacity and remaining useful life (RUL) models [
15].
Several methods that have been proposed to estimate battery capacity, which can be roughly classified as direct and indirect methods, while the latter ones can be subclassified as analysis-based methods, state of charge (SOC)-based methods and data-driven methods [
15].
The simplest method, known as Coulomb counting, is based on the accumulation of the charge over its cycling period [
16]. This direct method requires a full charge or discharge of the battery under specific conditions described in various IEC [
17], ISO [
18] and IEEE [
19] standards, since a direct measurement cannot predict the battery capacity in real applications when the battery is partially charged or discharged [
15]. Another direct method is based on measuring the internal resistance of the battery, which can be measured by applying a current pulse to the battery, as this allows the capacity of the battery to be estimated [
20].
Indirect methods require sensors to measure current, voltage, and temperature and use these variables to estimate capacitance. Analysis-based methods include electrochemical impedance spectroscopy, differential voltage, incremental curve, differential thermal curve, and mechanical stress, among others. SOC-based methods can be divided into indirect estimation and observer-based methods. While indirect SOC-based methods often estimate battery capacity using the change in SOC determined by applying the Coulomb counting method over a period, observer-based SOC methods estimate battery capacity directly using an observer based on an equivalent circuit of the battery. Finally, data-driven methods use mathematical tools such as neural networks, support vector machines, Bayesian learning, or deep learning, among others, to analyze large amounts of data to estimate battery capacity without the need to pre-specify a particular battery model [
15].
This paper proposes a real-time, simple and fast method to determine the cycle capacity or maximum charge that the battery can currently hold for any SOH during the battery charge cycle using voltage and current measurements during a short interval of the charge cycle. This approach is attractive because the charge cycle is controlled by the battery management system (BMS) according to a known strategy (constant current followed by a constant voltage stage), and the proposed approach does not require data from the entire charge period, as batteries are rarely charged from zero to full charge. The proposed approach requires only a small amount of data from each charge cycle, balancing accuracy, efficiency, and low computational burden, while allowing the current battery SOH to be known without the need for extensive and resource-intensive measurements.
Furthermore, the proposed approach is used to predict the RUL of the battery in conjunction with other state-of-the-art predictive techniques, such as recurrent neural networks (RNNs) [
21,
22]. RNNs are a deep learning approach for modelling sequential data, which are particularly well-suited for capturing the temporal dependencies of data sets, and making them effective for modeling the dynamic evolution of battery SOH over time.
The proposed strategy allows simultaneous and real-time accurate prediction of SOH and RUL over battery lifetime. This approach not only provides a real-time assessment of battery health, but also offers a forward-looking perspective that aids in the predictive maintenance and management of battery systems, which can be particularly useful in applications where reliability and longevity are critical factors.
The remainder of the paper is organized as follows.
Section 2 describes the methodology proposed in this paper to determine the SOH and RUL of the analyzed batteries.
Section 3 describes the battery data set used in this paper.
Section 4 presents and discusses the experimental results, and finally,
Section 5 concludes this paper.
2. Methodology
Capacity, in the context of batteries, refers to the maximum amount of electric charge a battery can store. Capacity is a critical parameter that evolves over time and directly affects a battery's energy storage capability and service life, making it an indicator to quantify battery degradation.
The capacity is typically measured in ampere-hours [Ah] and represents the total charge a battery can deliver under specific load and temperature conditions. It can be defined as [
23],
The capacity fade after
n charge/discharge cycles Δ
Cn is a key indicator of battery degradation. It is defined as the reduction in available battery capacity (cycle capacity) over time and is expressed as the difference between the initial or reference capacity of a fresh battery
Cref (reference capacity) and the remaining capacity at cycle
n,
as,
Monitoring capacity changes provides valuable insight of the mechanisms affecting the electrodes and electrolyte and the RUL of the cell. The evolution of the capacity can then be used as input to forecasting techniques such as LR and RNN.
In this paper, the state of charge of a battery at a given time SOC(
t), is defined as the ratio between the remaining charge in the battery at a given time,
Qremaining (t), expressed in Coulombs[C], and the reference charge of a fresh battery (usually given by the cell manufacturer),
Qref [
24], as follows,
The current state of charge, SOC(
t), is determined by using the Coulomb counting method. It integrates the instantaneous value of the cell current
i(
t) over time during the period being analyzed. SOC(
t) can be determined if the initial state of charge
S0 at the initial time
t0 is known such that,
Note that during the charge period
i(
t) is a positive value, while during the discharge period
i(
t) is a negative value, and (4) requires the initial value
SOC0. There are many methods to estimate this value, but in this paper we use the ModelGauge m5 EZ algorithm from Maxim Integrated [
25].
This paper uses the following nomenclature for the capacity.
Rated capacity is the capacity specified by the manufacturer.
Reference capacity is the capacity of the battery at the initial or reference cycle.
Cycle capacity is the capacity of the battery at each cycle, which differs from the reference capacity due to battery aging. The
estimated cycle capacity is the capacity calculated using the GLR-Nernst approach explained in
Section 2.2. Since the estimated capacity contains noise, the denoised version is called
denoised estimated cycle capacity. Finally, the
forecasted cycle capacity corresponds to the future values of the cycle capacity predicted by the forecasting methods described in
Section 2.5.
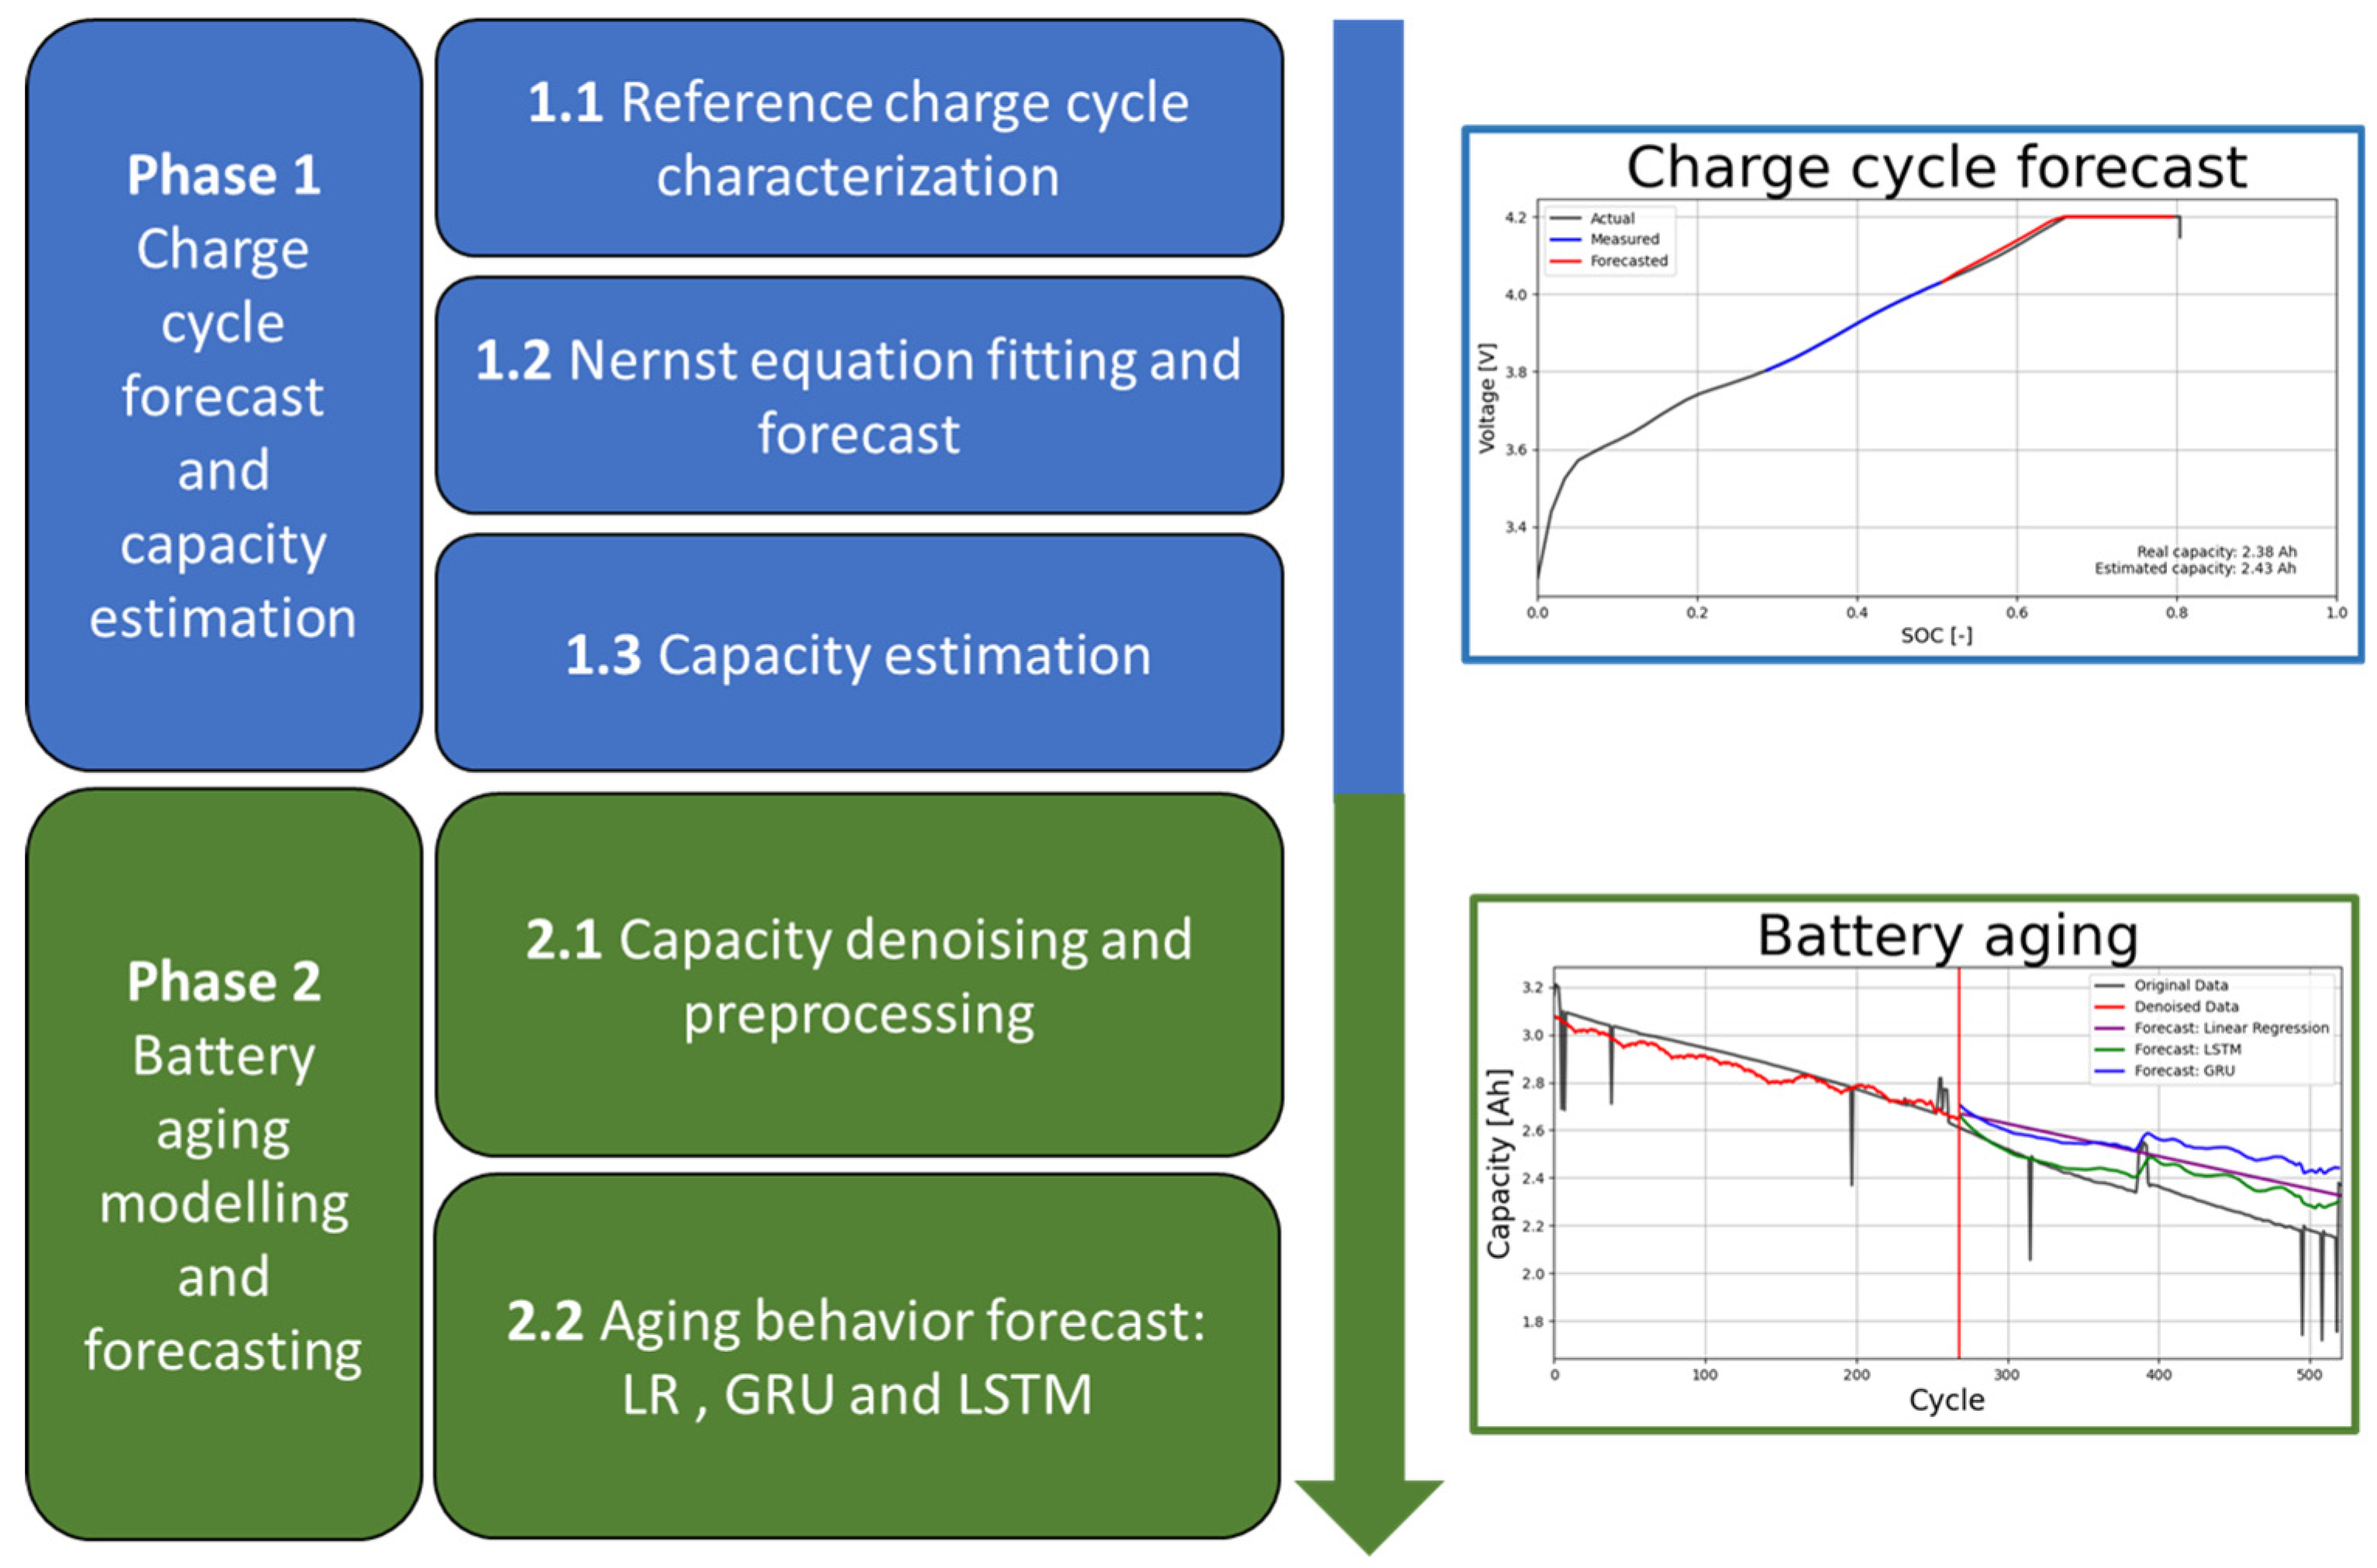
The proposed methodology to determine the SOH and RUL of the battery is divided into two phases. In the first phase, a portion of the charge cycle, typically 20%, is used to estimate the current cycle capacity of the battery. In the second phase, state-of-the-art regression techniques are applied to predict the RUL, i.e., the progression of battery aging over time.
Phase 1, forecasts the voltage-SOC curve of a generic charge cycle using measured data and estimates the cycle capacity of the battery through three sequential steps as follows,
- 1.1
Reference charge cycle characterization. Several (SOC(t), v(t)) data points of the voltage ̶ SOC curve of the battery are acquired together with the input charge in the constant voltage (CV) stage of the reference charge cycle, i.e., when the battery is brand new. The initial or reference cycle determines the reference capacity of the battery.
- 1.2
Nernst equation fitting and forecast. During the constant current (CC) stage of a generic charge cycle over the lifetime of the battery, a few data points (SOC(t), v(t)) corresponding to a portion of the generic charge cycle are used to fit the Nernst equation and forecast the behavior of the voltage ̶ SOC curve during the remaining charge period.
- 1.3
Capacity estimation. The total charge that the battery can hold in a given cycle (cycle capacity) is estimated based on the forecasted charge cycle and the reference cycle data.
Phase 2 models and forecasts the battery aging behavior by estimating the capacity fade of future cycles. It includes the following steps,
- 2.1
Capacity denoising and preprocessing. To improve the accuracy of the forecasting techniques in future steps, the time-series data of the calculated cycle capacity are denoised using a discrete wavelet filter. In this step, various algorithms are applied to preprocess the input data of the forecast models.
- 2.2
Aging behavior forecast. Using the processed data from the previous steps as input, a linear regression (LR), a long short-term memory neural network (LSTM-RNN), and a gated recurrent unit neural network (GRU-RNN) are used to predict the aging behavior and RUL of the battery.
The steps described above are summarized in
Figure 1.
2.1. Phase 1.1. Reference charge cycle characterization
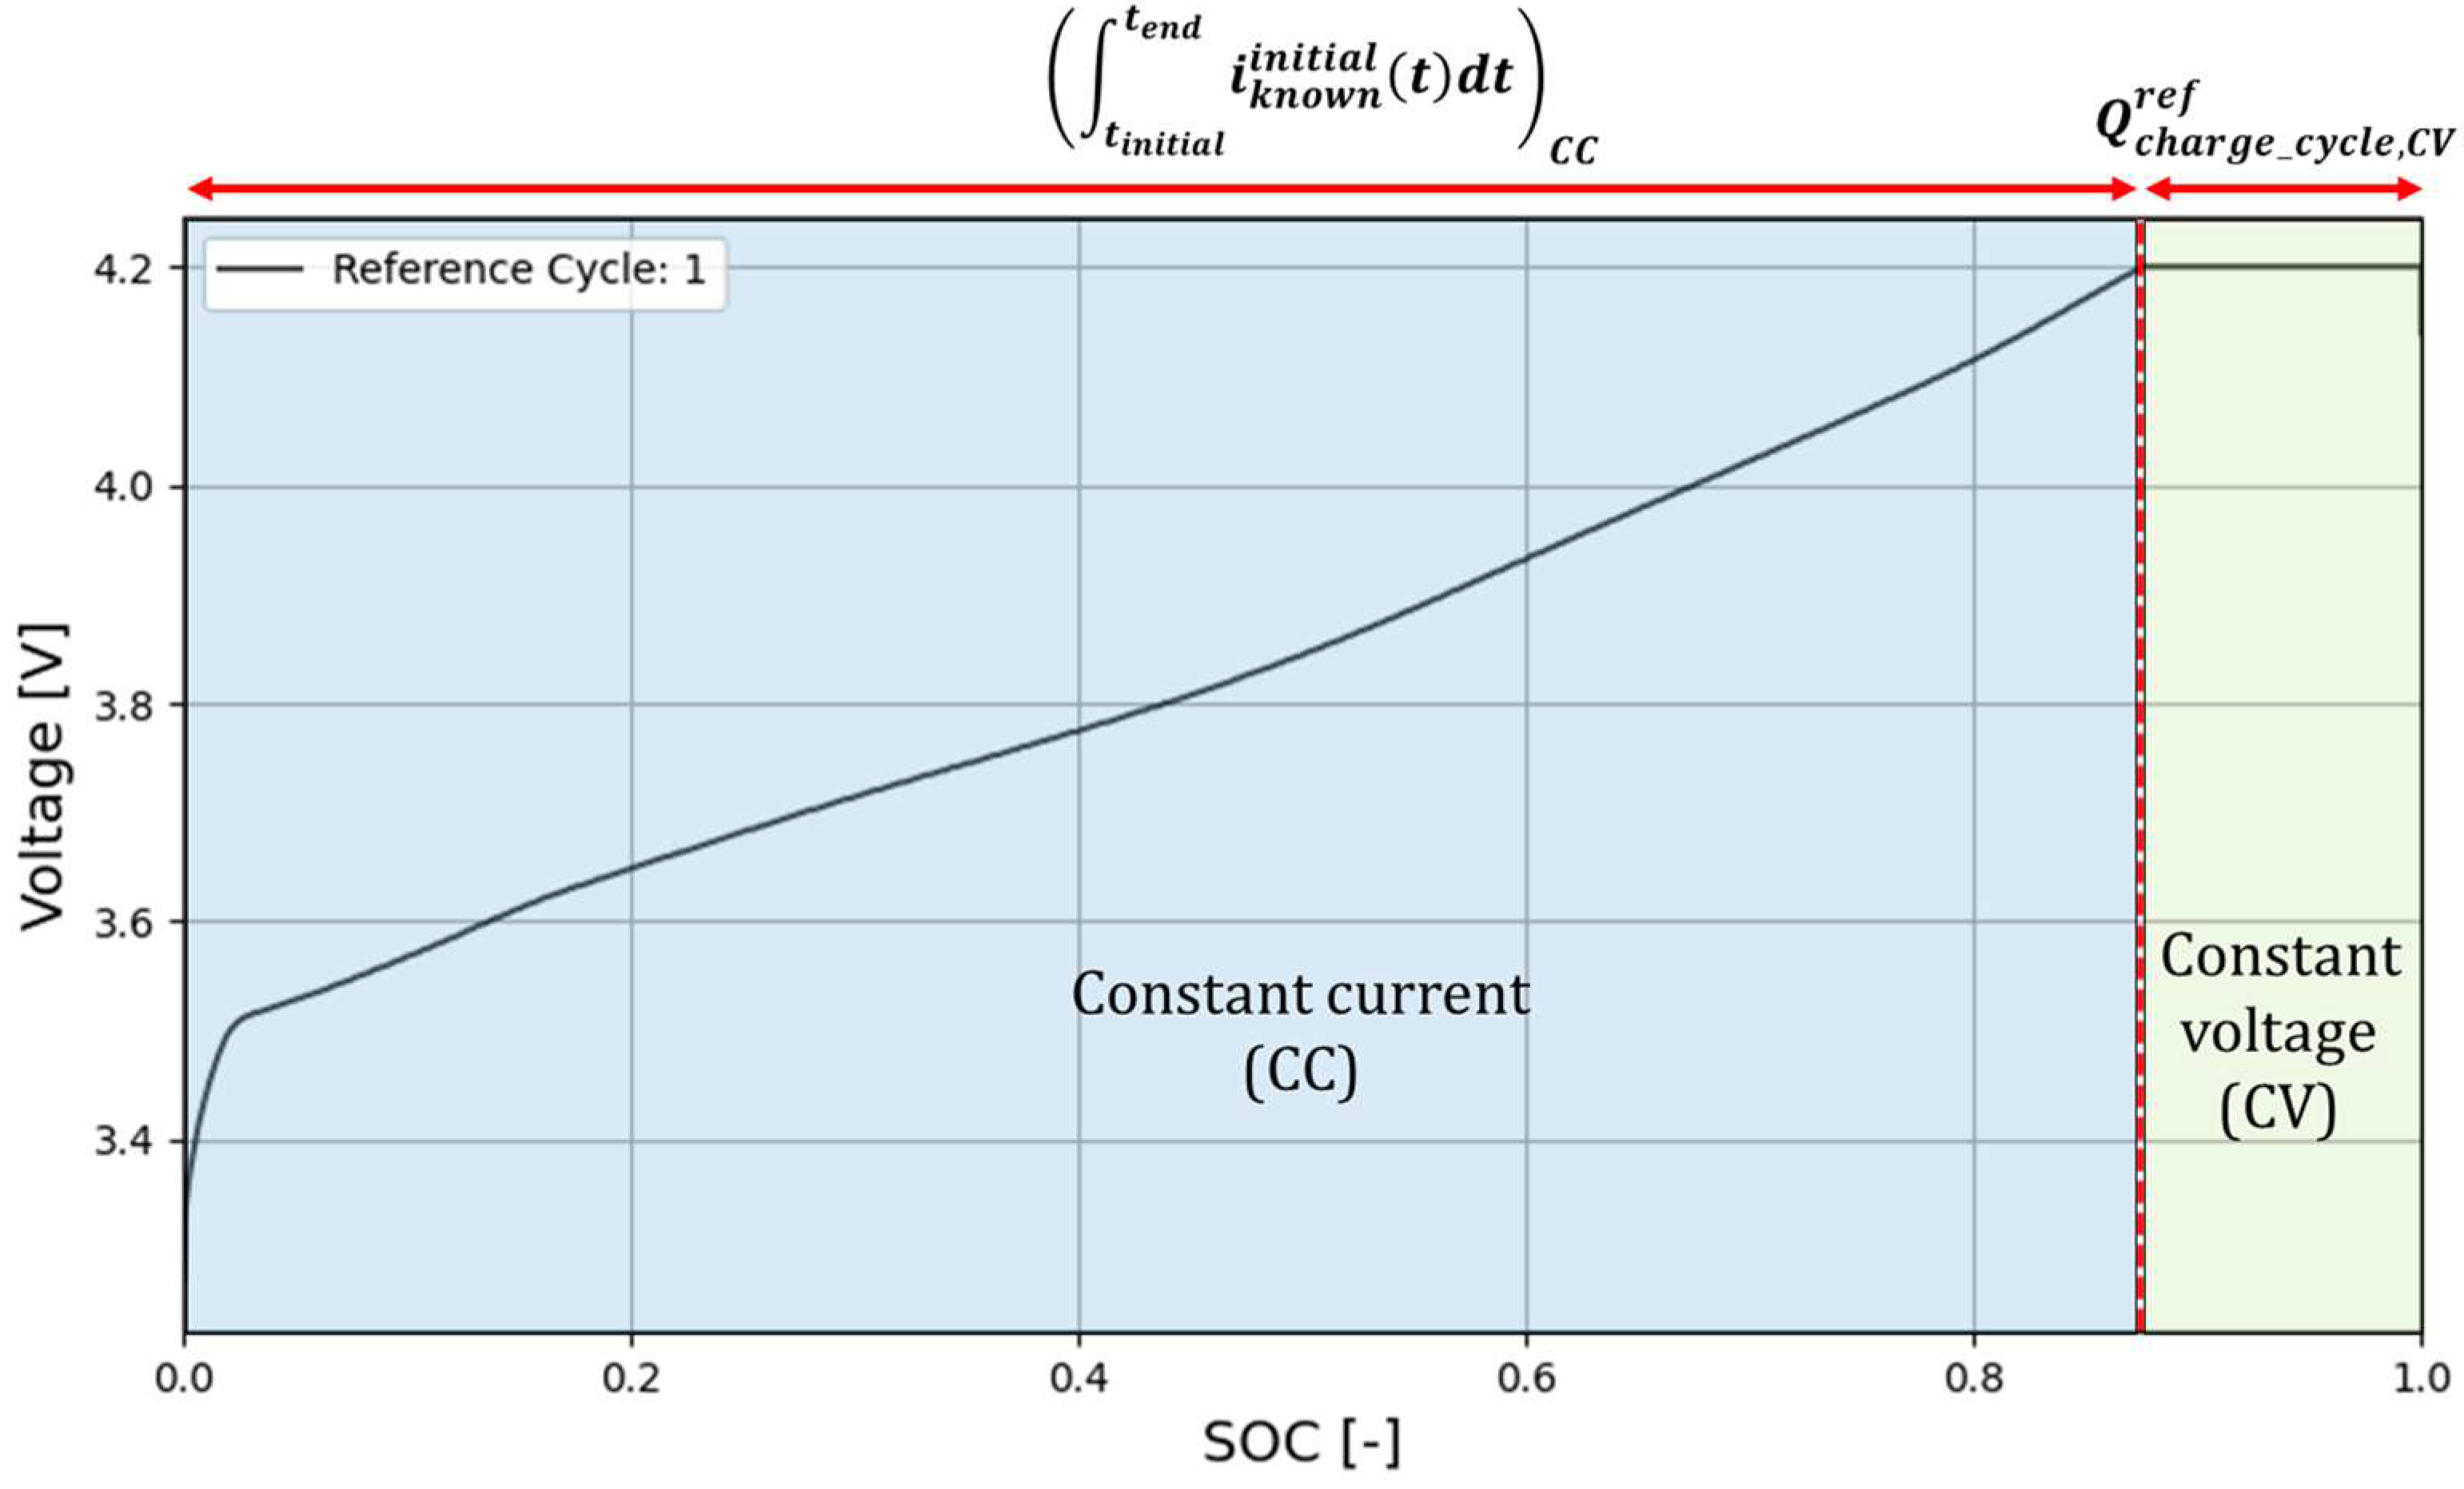
The reference cycle (Cycle 1) provides relevant information for future calculations, as the reference capacity of the battery
Cref and the charge accumulated by the battery during the CV stage of the charge cycle,
. Note that the value of
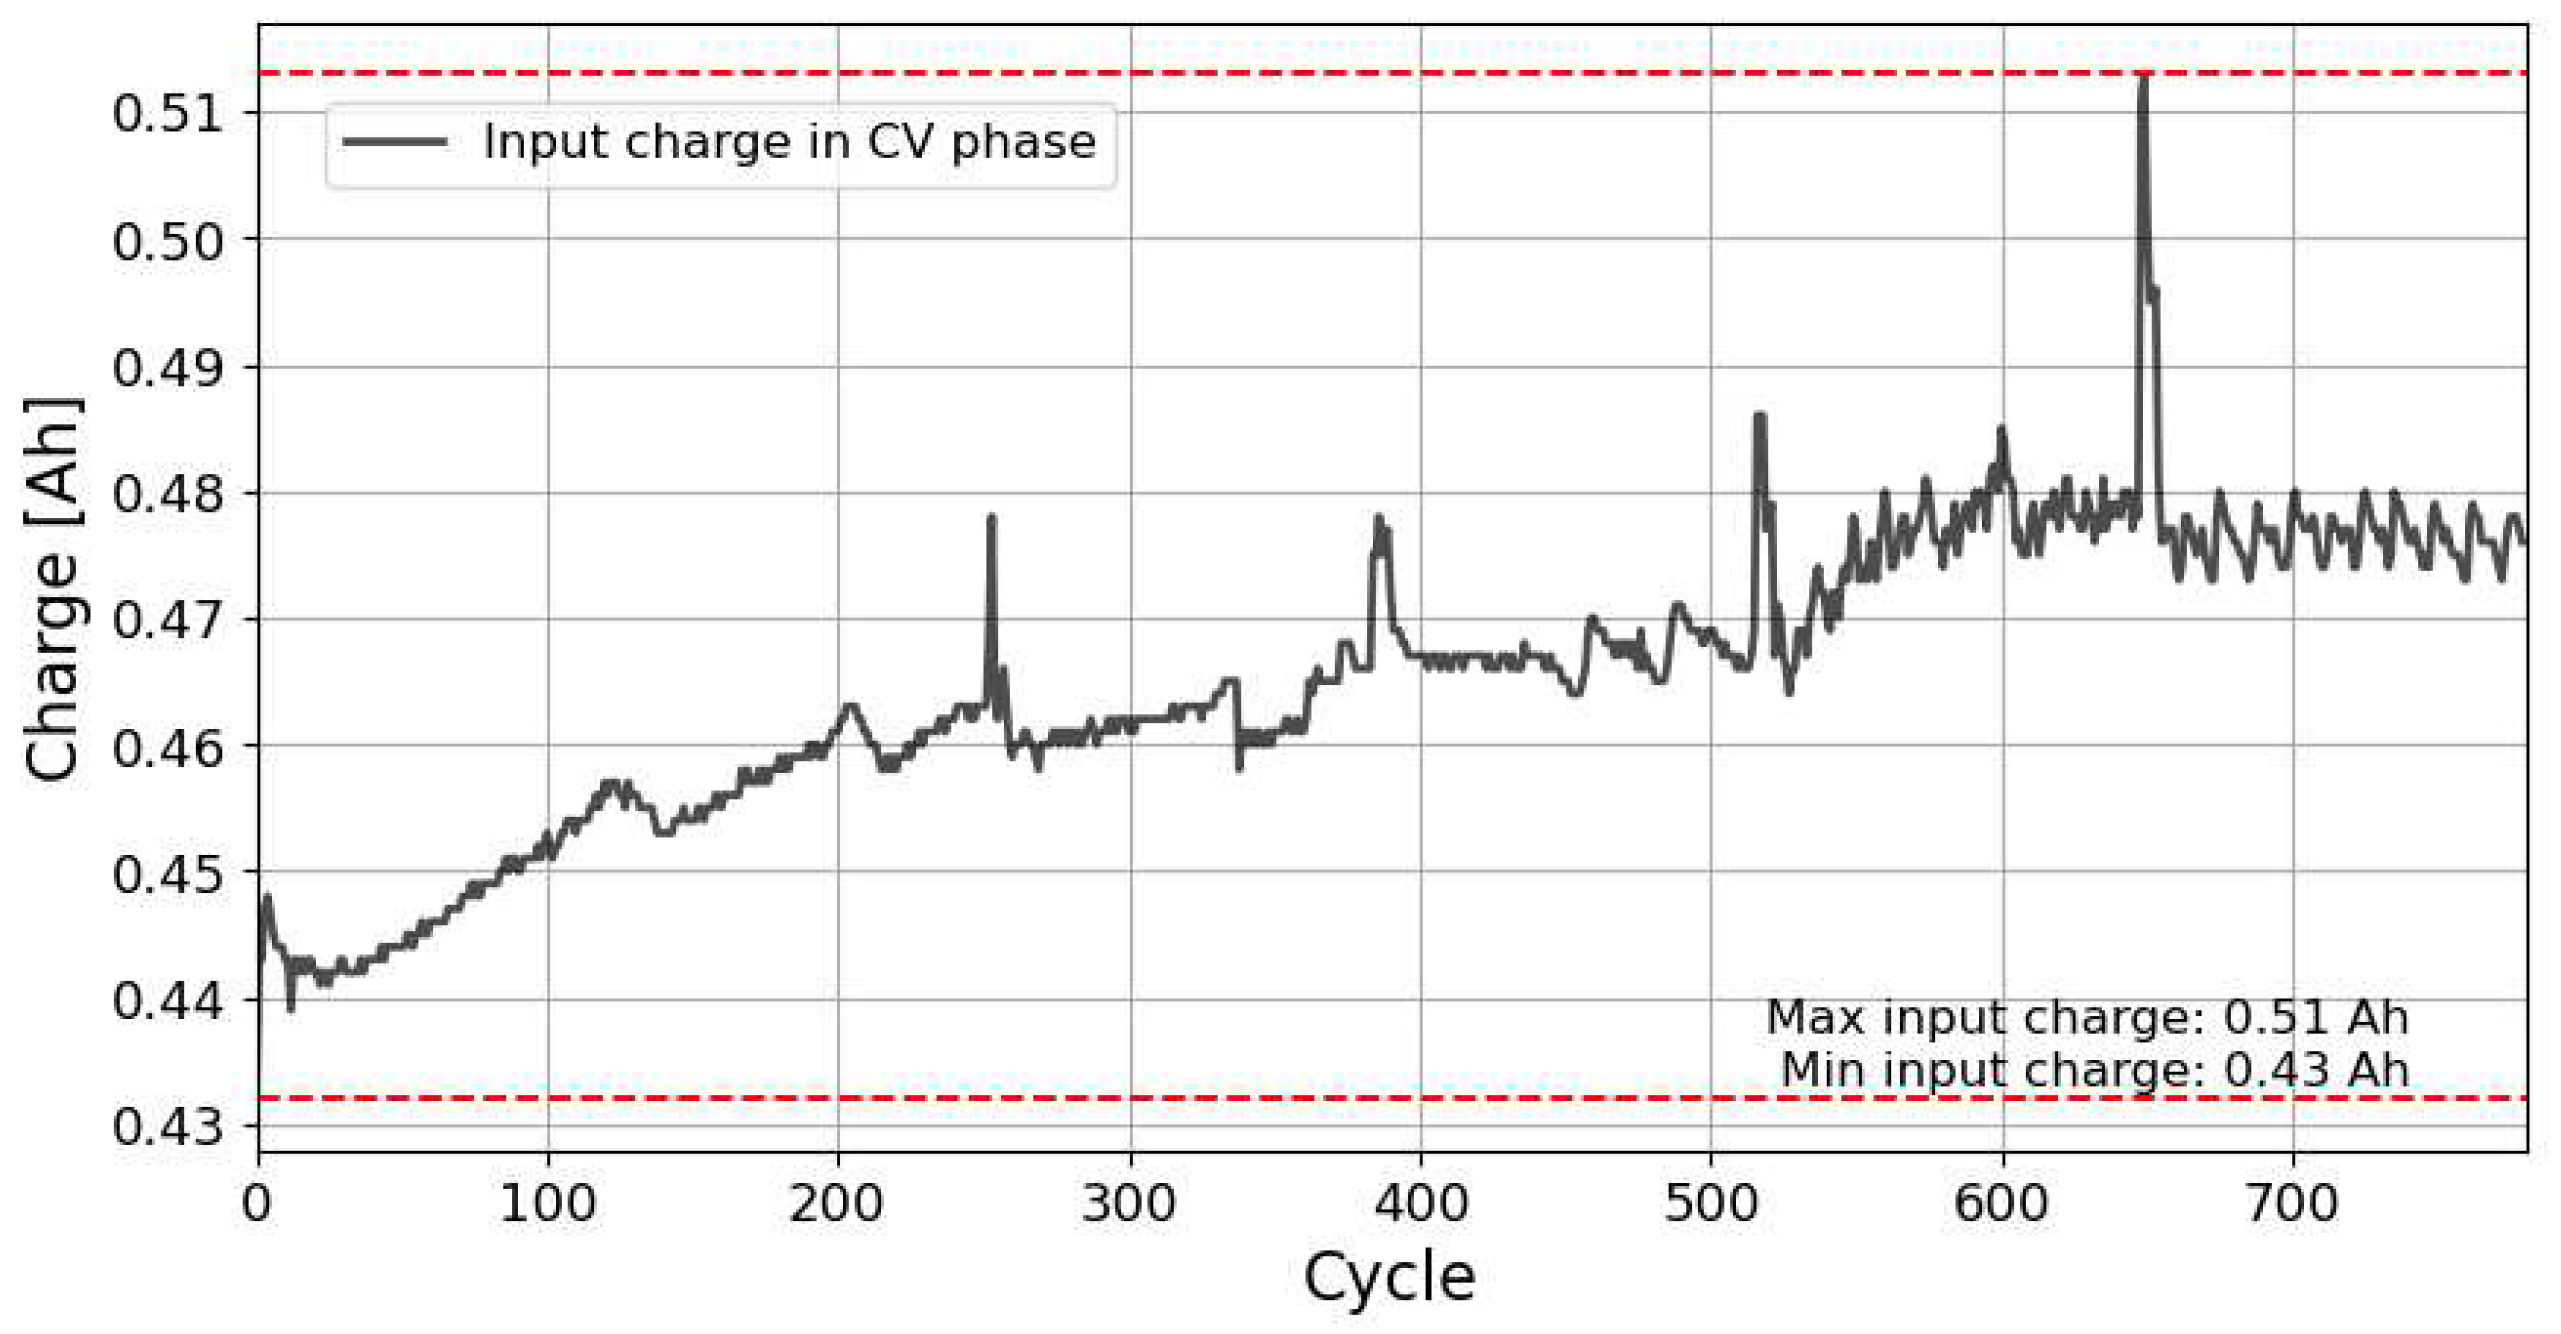
remains almost constant throughout all charge cycles, regardless of the state of the battery, as shown in
Section 4 (see
Figure 5 and
Table 2). A full discharge and a full charge are suggested to properly measure and characterize the initial or reference voltage ̶ SOC profile of the battery.
The reference capacity
Cref of the fresh battery is calculated from the data of the initial or reference cycle as,
where CC and CV refer to the constant current and constant voltage stages of the charge cycle, respectively.
Figure 2 shows the reference cycle and the different parameters in (5).
2.2. Phase 1.2. Nernst equation fitting and forecast.
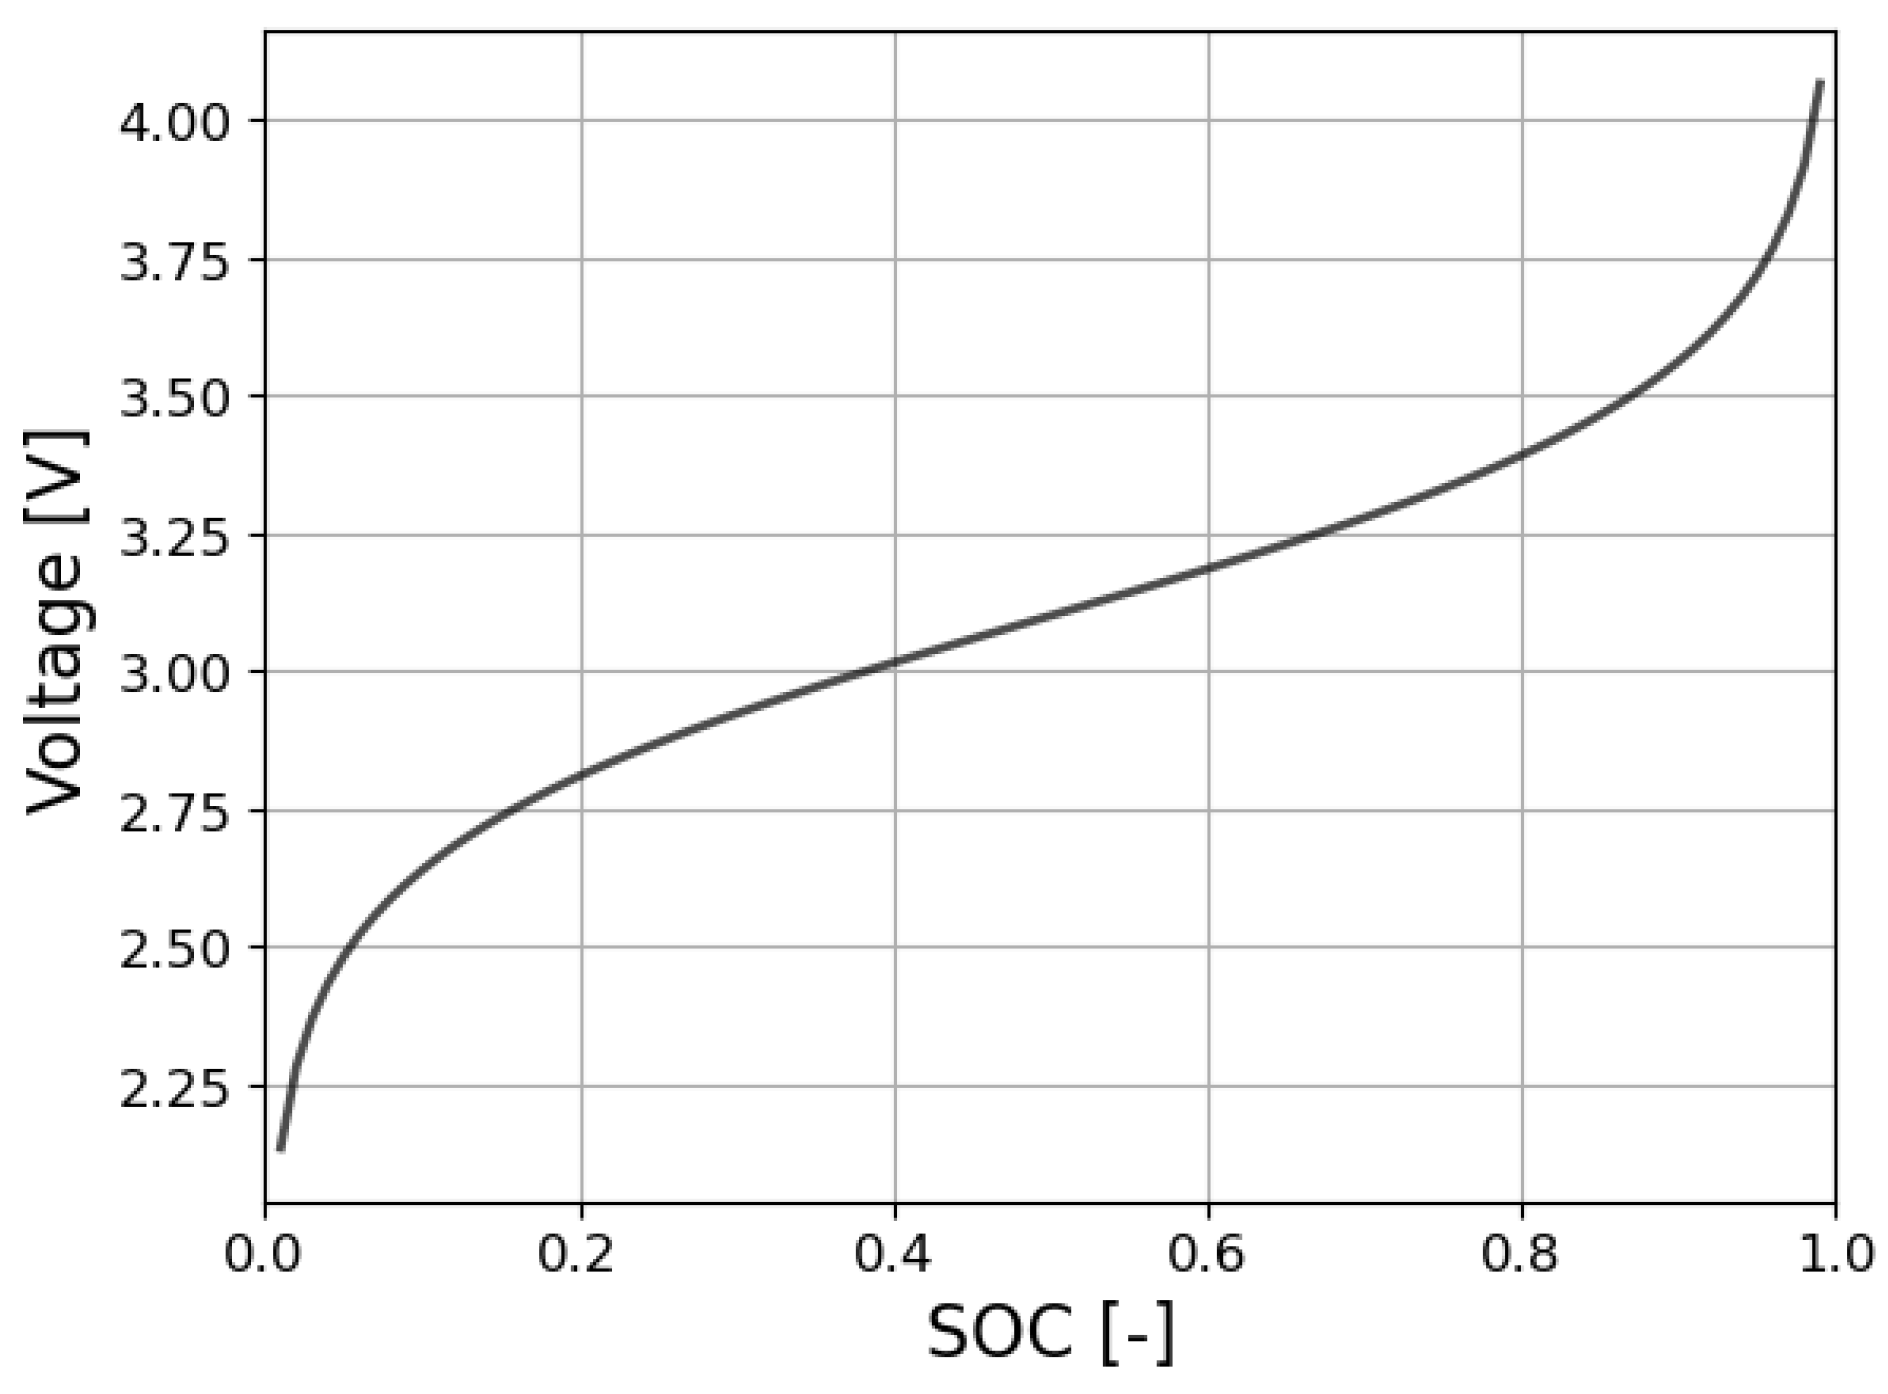
In this work the Nernst equation is used as a fitting tool to approximate the charge cycle using partial data from a given cycle. Assuming that the SOC is known, the cell voltage can be determined from the Nernst equation [
26,
27] as,
where
vn(
t) and
in(
t) are the instantaneous values of the cell voltage and current at cycle
n,
E0 is the standard cell potential,
Rn is the internal resistance of the cell calculated at each cycle, and
μ1 and
μ2 are constant parameters.
Figure 3 shows the profile of the Nernst equation.
Since the current is a constant value during the CC stage of the charge cycle, (6) can be rewritten for fitting purposes as (7), which depends only on three unknowns
a, b, and
c as,
where
x(
t) corresponds to SOC(
t) and
y(
t) to
vn(
t).The generalized least squares (GLS) method [
28] is used to determine the values of unknowns
a, b, and
c from experimental data using equation (6).
2.3. Phase 1.3. Capacity estimation
This paper assumes that the charge cycle consists of a constant current (CC) stage followed by a constant voltage (CV) stage because this is probably the most applied charge strategy [
29]. The input charge during the CV stage in any charge cycle is assumed to be the same as that measured in the reference cycle because, as discussed with more detail in
Section 4 (see
Figure 5 and
Table 2), this value remains relatively constant over the life of the battery.
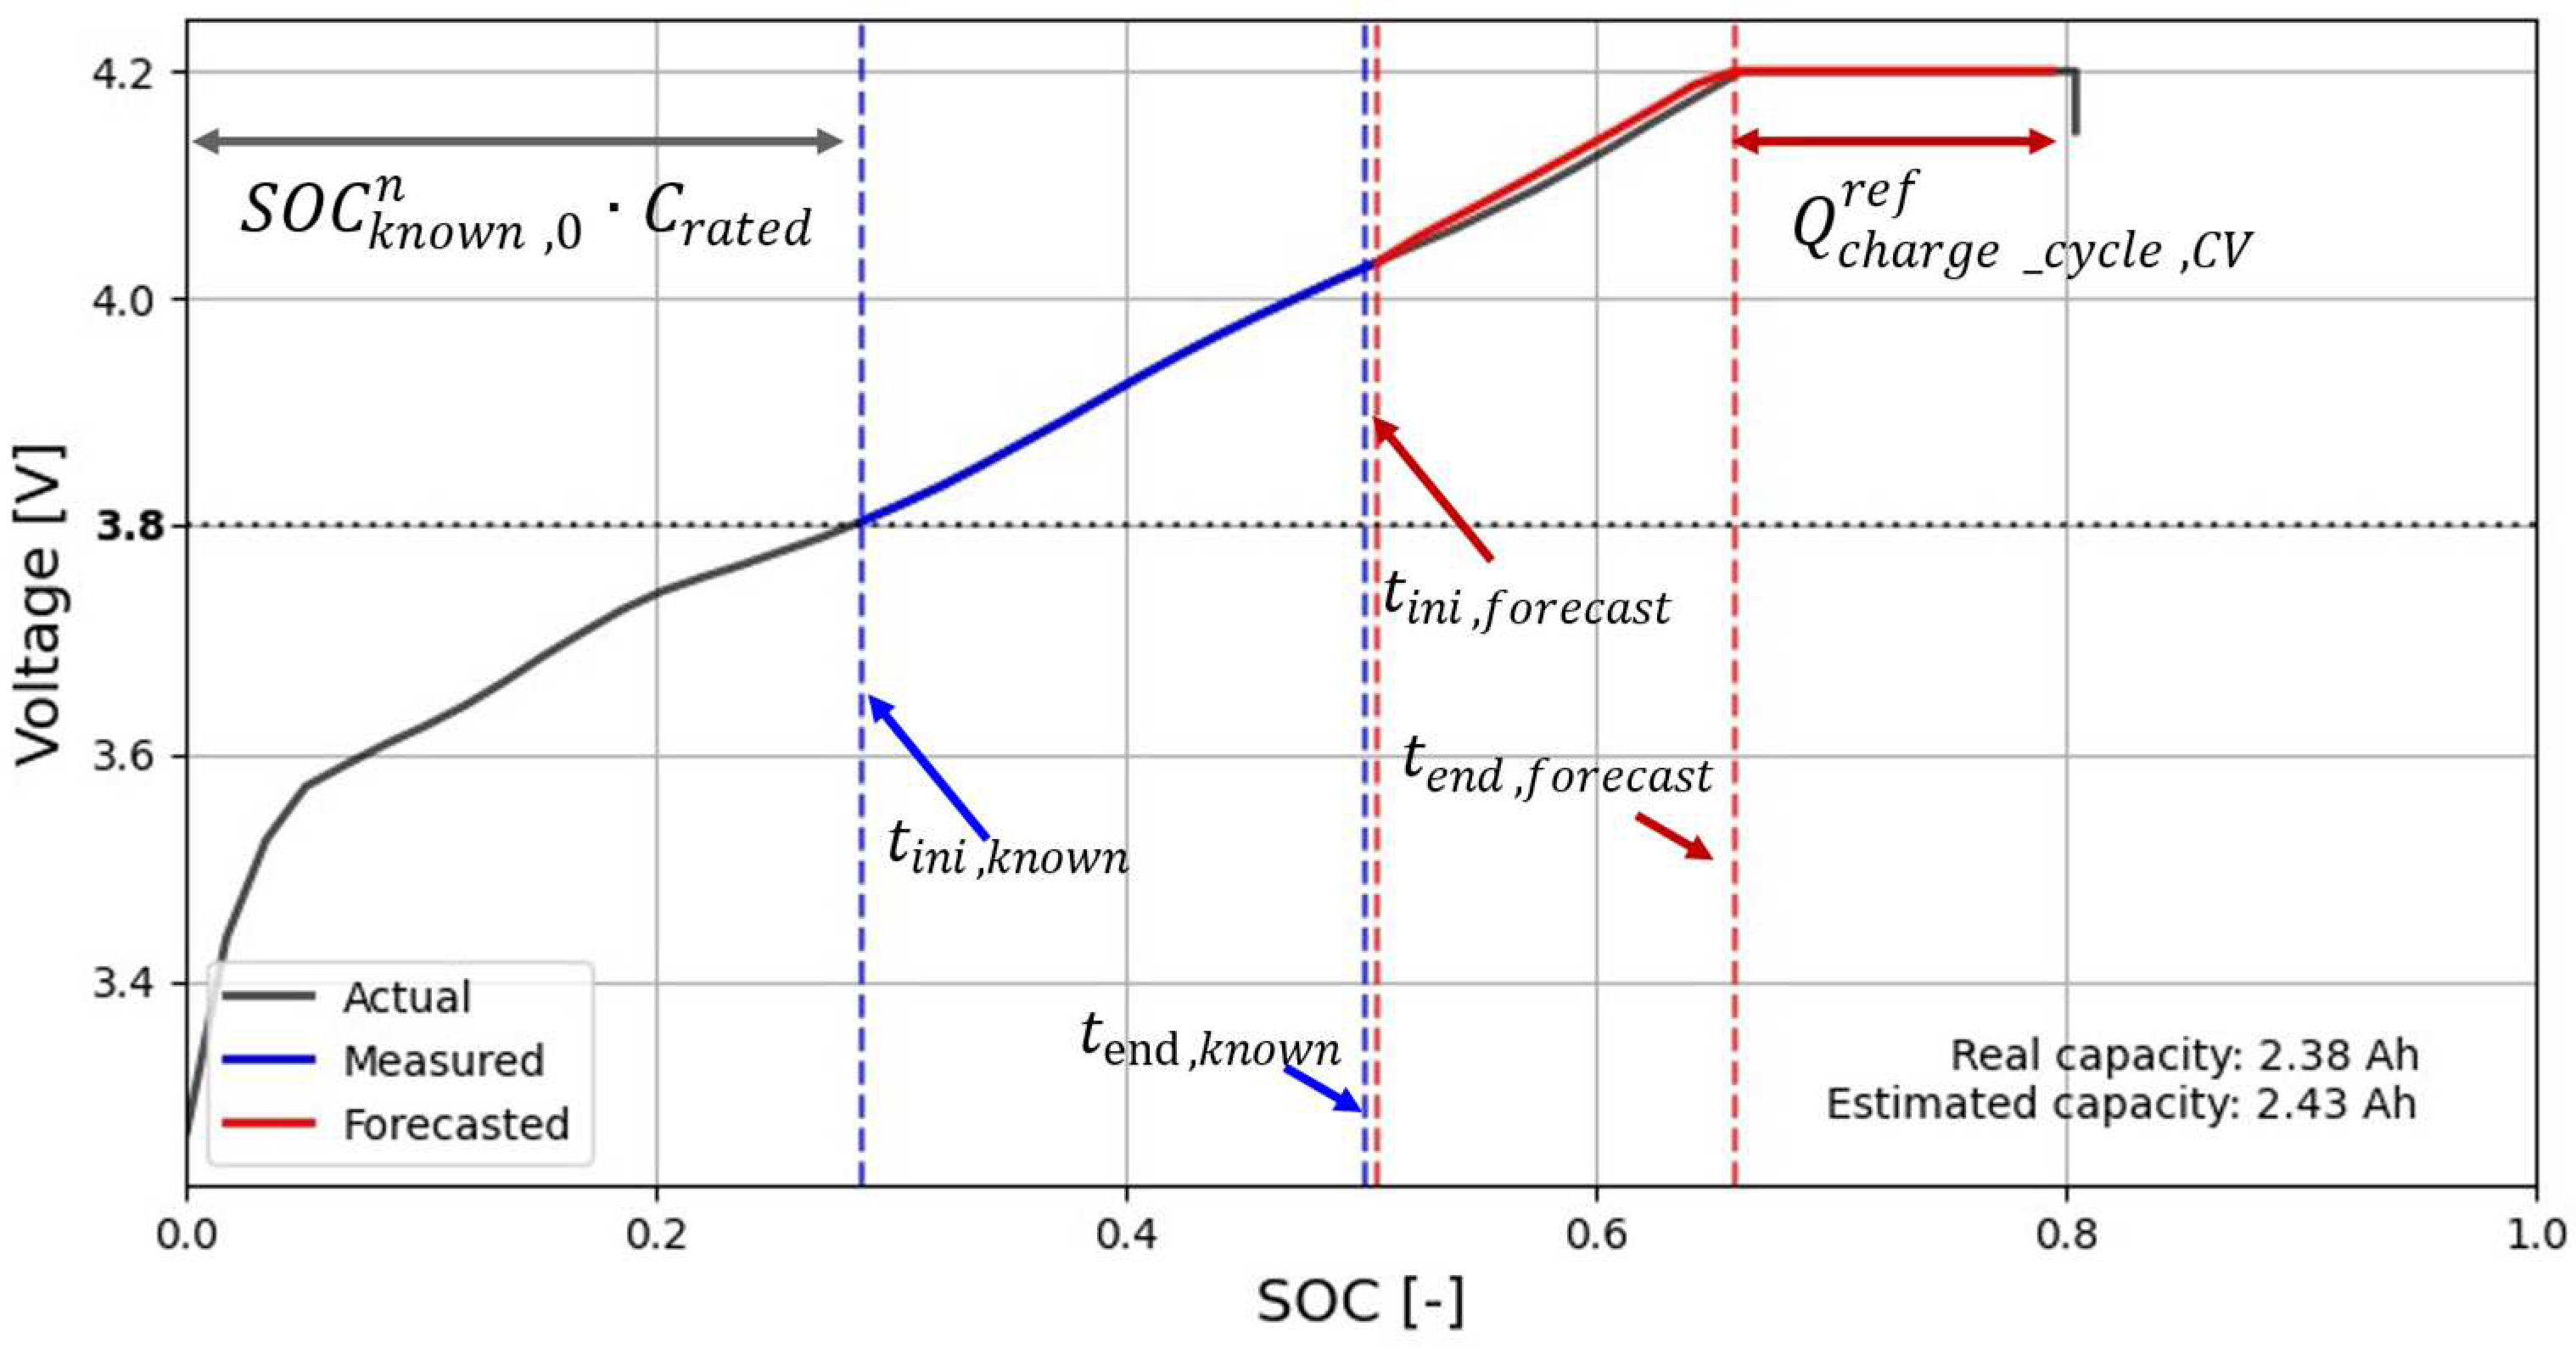
According to the proposed method, the cycle capacity at any time of the battery life can be estimated with only a few points (about 20% of the entire charge cycle) taken during the interval (
tini,known,
tend,known) of the voltage – SOC curve of the charge cycle, as shown in
Figure 4. In this interval, the GLS method uses the Nernst equation to estimate the three unknowns
a, b, and
c. Once the fitted curve is obtained, it is used to forecast the remaining data points to the ending point of the CC stage of the charge cycle, as shown in
Figure 4.
The estimated cycle capacity at cycle
n can be calculated as,
where
n stands for the
n-th charge cycle,
Cn is the estimated cycle capacity at cycle
n (it is an indicator of the SOH of the battery),
is the SOC value at the first point of measure in cycle
n,
tini,known and
tend,known establish the time interval where the measured values of the voltage – SOC curve are taken during the CC stage,
tini,forecast and
tend,forecast define the time forecast interval of the voltage – SOC curve, and
is the total input charge during the CV stage of the reference cycle.
Note that as shown in
Figure 4, this paper has arbitrarily chosen 3.8 V as the starting point
tini,known, while
tend,known corresponds to the time at which the SOC has increased by 0.2 from
tini,known, and thus,
Note that during the CC phase, there is a proportional relationship between the time and the SOC.
From (9) it can be deduced that only about 20% of the points of the charge cycle are necessary for the prediction of the estimated cycle capacity Cn at cycle n. It is also noted that tini,forecast = tend,known + Δt, where Δt is the time step considered and tend,forecast corresponds to the time when the battery voltage reaches 4.2 V, i.e. the starting point of the CV stage.
2.4. Phase 2.1. Capacity denoising and preprocessing
The evolution over lifetime of the estimated cycle capacity
Cn at each cycle
n contains high frequency noise components due to the test conditions, the experimental measurements, the nonlinear behavior of the battery, and even the GLS fitting procedure, so a noise reduction stage is required. Although other filtering approaches are possible [
30], a four-stage discrete wavelet transform (DWT) using a discrete Meyer mother wavelet is applied in this paper because it is well suited for signal denoising in forecasting applications [
31]. This method decomposes the signals into different frequency components, allowing the noise they contain to be selectively eliminated, thereby improving the accuracy and reliability of predictive models.
This step also includes several sequential steps applied to the data of the denoised estimated cycle capacity, such as detrending, normalization and formatting [
32] in order to improve the performance of the RUL forecasting methods.
2.5. Phase 2.2. Aging behavior forecast
In this paper the capacity of future cycles is estimated using three methods, namely a linear regression (LR), a long short-term memory recurrent neural network (LSTM-RNN) and a gated recurrent unit recurrent neural network (GRU-RNN) are used to predict the aging behavior and RUL of the battery.
Linear regression, one of the most basic techniques in statistical modeling and machine learning [
33], serves as a fundamental tool for modeling the relationship between a dependent variable and one or more independent variables by identifying the linear relationship that best represents the underlying pattern in the data. Its simplicity, interpretability, and computational efficiency make it particularly suitable for tasks where the underlying relationship between variables can be approximated by a linear model
LSTM neural network, proposed by Hochreiter and Schmidhuber in 1997 [
34], is structured with three gating mechanisms, i.e. input, forget, and output gates. These gates allow LSTMs to retain or discard information over time, facilitating the learning of long-term dependencies in sequential data. The inherent ability of LSTMs to capture and store information over extended sequences has been particularly effective in time series prediction.
Gated recurrent units (GRUs), introduced by Cho et al. in 2014 [
35], represent a simplified variant of LSTMs with a reduced number of gates. The absence of a separate memory cell in GRUs results in computational efficiency and faster convergence during training. Despite their structural simplicity, GRUs show commendable effectiveness in modeling temporal dependencies, making them an attractive choice for scenarios with limited computational resources or data sets.
It should be noted that all models, data processing and forecasting performed in this article are done using Python 3.10.9, a high-level general-purpose open-source programming language. All the modules used, such as NumPy, Pandas, SciPy, and Scikit-learn, which are required for the computation of the results, are also open-source and public.
3. Data description
The data of the cells studied in this paper was acquired and published by Sandia National Laboratories (SNL) [
36] through the open-access web platform BatteryArchive.org [
37]. The data set includes data from several commercially available 18650 cells of different chemistries under different test conditions.
Table 1 summarizes the analyzed cell characteristics and cycling conditions.
As shown in
Table 1, this study focuses on two cathode chemistries (NCA and NMC) cycled at different C-rates (0.5C during the charge cycle and different C-rates during the discharge cycle, i.e. 0.5C/1C/2C) and operated at different constant temperatures (15°C, 25°C and 35°C). The behavior of a total of 39 cells is studied in this paper.
The tests were performed using Arbin Instruments SCTS & Arbin high-precision battery tester (LBT21084, Arbin Instruments, College Station, TX, USA) for cycling and a thermal test chamber (T10C-1.5 SPX, Tenney, New Columbia, PA, USA) for temperature control.
4. Experimental results
This section describes the results obtained with two cathode chemistries (NCA and NMC) of Li-ion batteries by the method described in
Section 2. Note that all experimental results related to battery cycling were obtained from the Sandia National Laboratories (SNL) battery database [
36] through the open-access web platform BatteryArchive.org [
37].
As explained in
Section 2.1, the value of
, calculated along the CV stage of the reference charge cycle, remains almost constant throughout all the charge cycles, regardless of the battery cycle analyzed.
Figure 5 and
Table 2 confirm this statement.
Figure 5.
Amount of charge accumulated in the battery during the CV stage of the charge cycle,. This data corresponds to an NCA type battery cycled at 15°C and 0.5C /2C.
Figure 5.
Amount of charge accumulated in the battery during the CV stage of the charge cycle,. This data corresponds to an NCA type battery cycled at 15°C and 0.5C /2C.
The results presented in
Figure 5 clearly show that despite some small fluctuations, the amount of charge accumulated in the battery during the CV stage of the
n-th charge cycle,
, corresponding to the plateau region of
Figure 2 and
Figure 4, remains almost constant throughout all the charge cycles, regardless of the battery cycle analyzed.
Table 2 summarizes the average maximum differences between the reference cycle and all cycles over the life of the batteries for the different cathode chemistries of parameter
.
Table 2.
Accumulated charge during the CV stage of the charge cycle over the life of the batteries. Average maximum differences for the 39 analyzed batteries of NCA and NMC cathode chemistries between the reference cycle and all cycles over the life of the batteries.
Table 2.
Accumulated charge during the CV stage of the charge cycle over the life of the batteries. Average maximum differences for the 39 analyzed batteries of NCA and NMC cathode chemistries between the reference cycle and all cycles over the life of the batteries.
| Tambient |
15 °C |
25 °C |
35 °C |
| Cathode |
NCA |
NMC |
NCA |
NMC |
NCA |
NMC |
| C-rate |
1 |
2 |
1 |
2 |
0.5 |
1 |
2 |
0.5 |
1 |
2 |
1 |
2 |
1 |
2 |
| Average max. difference [Ah] |
0.08 |
0.10 |
0.04 |
0.03 |
0.05 |
0.06 |
0.08 |
0.21 |
0.14 |
0.09 |
0.09 |
0.09 |
0.07 |
0.07 |
| Average max. difference [%]* |
2.73 |
3.41 |
1.46 |
1.08 |
0.44 |
2.03 |
2.62 |
7.14 |
4.63 |
3.06 |
2.50 |
2.80 |
2.38 |
2.38 |
| * Percentage of the average maximum difference referred to the reference capacity |
The results summarized in
Table 2 show the small percentage differences between
corresponding to the
n-the generic cycle and that of the reference cycle
.
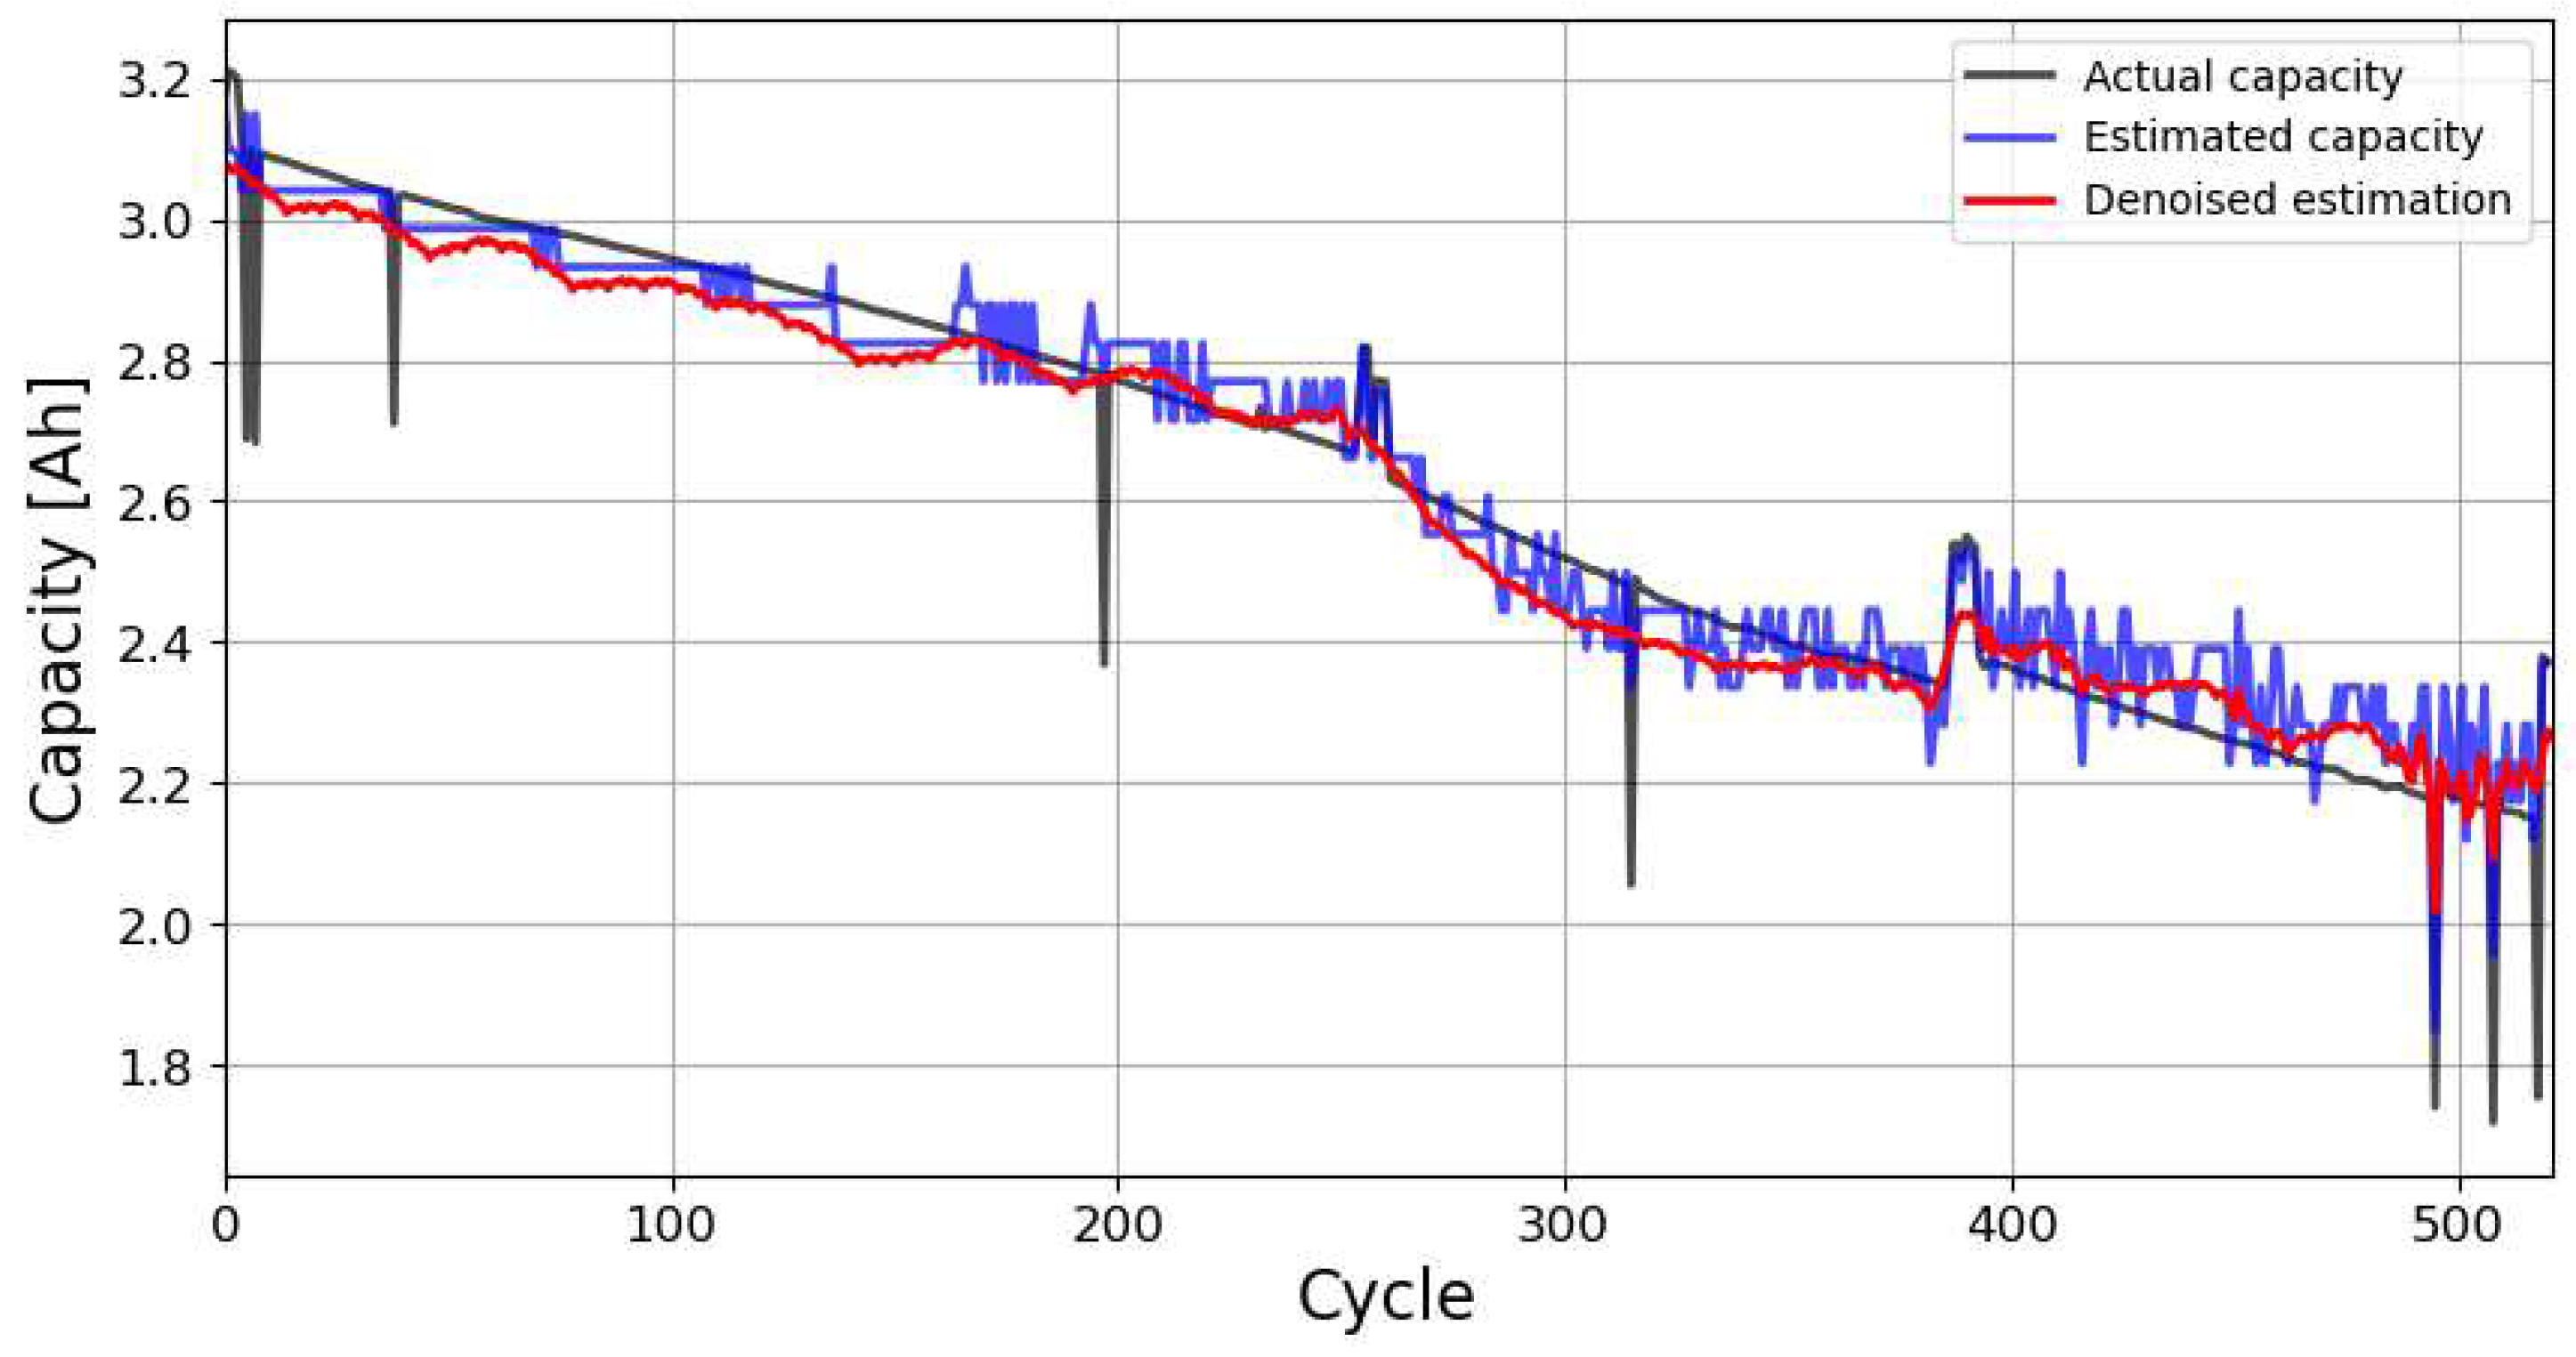
Figure 6 shows the evolution of the cycle capacity calculated from the Coulomb count (reference method) using all available experimental data over the life of the battery, the cycle capacity estimated by the GLS-Nernst approach over the life of the battery, and the denoised estimated cycle capacity.
The results presented in
Figure 6 show a great similarity between the values obtained for the cycle capacity using the Coulomb counting method and those obtained with the GLS-Nernst estimation method, which is a confirmation of the usefulness and accuracy of the proposed approach.
The mean absolute percentage error between two time series is defined as,
where
Ccycle_CC,i is the cycle capacity at cycle
i obtained by Coulomb counting,
Cestimated,i is the value obtained by denoising the GLS-Nernst estimate at the same cycle, and
m is the number of samples. The root mean square error is defined as,
Table 3 summarizes the average error values (RMSE and MAPE) for the 39 batteries analyzed with NCA and NMC cathode chemistries, calculated between the cycle capacity of the batteries over the full life cycle and the denoised GLS-Nernst estimation of the capacity.
Results summarized in
Table 3 show that the mean absolute percentage error of the estimated capacity of the analyzed batteries using the proposed GLS-Nernst approach is between 1.34% and 9.05%, being an acceptable value that validates the method proposed in this work.
Regarding RUL prediction results,
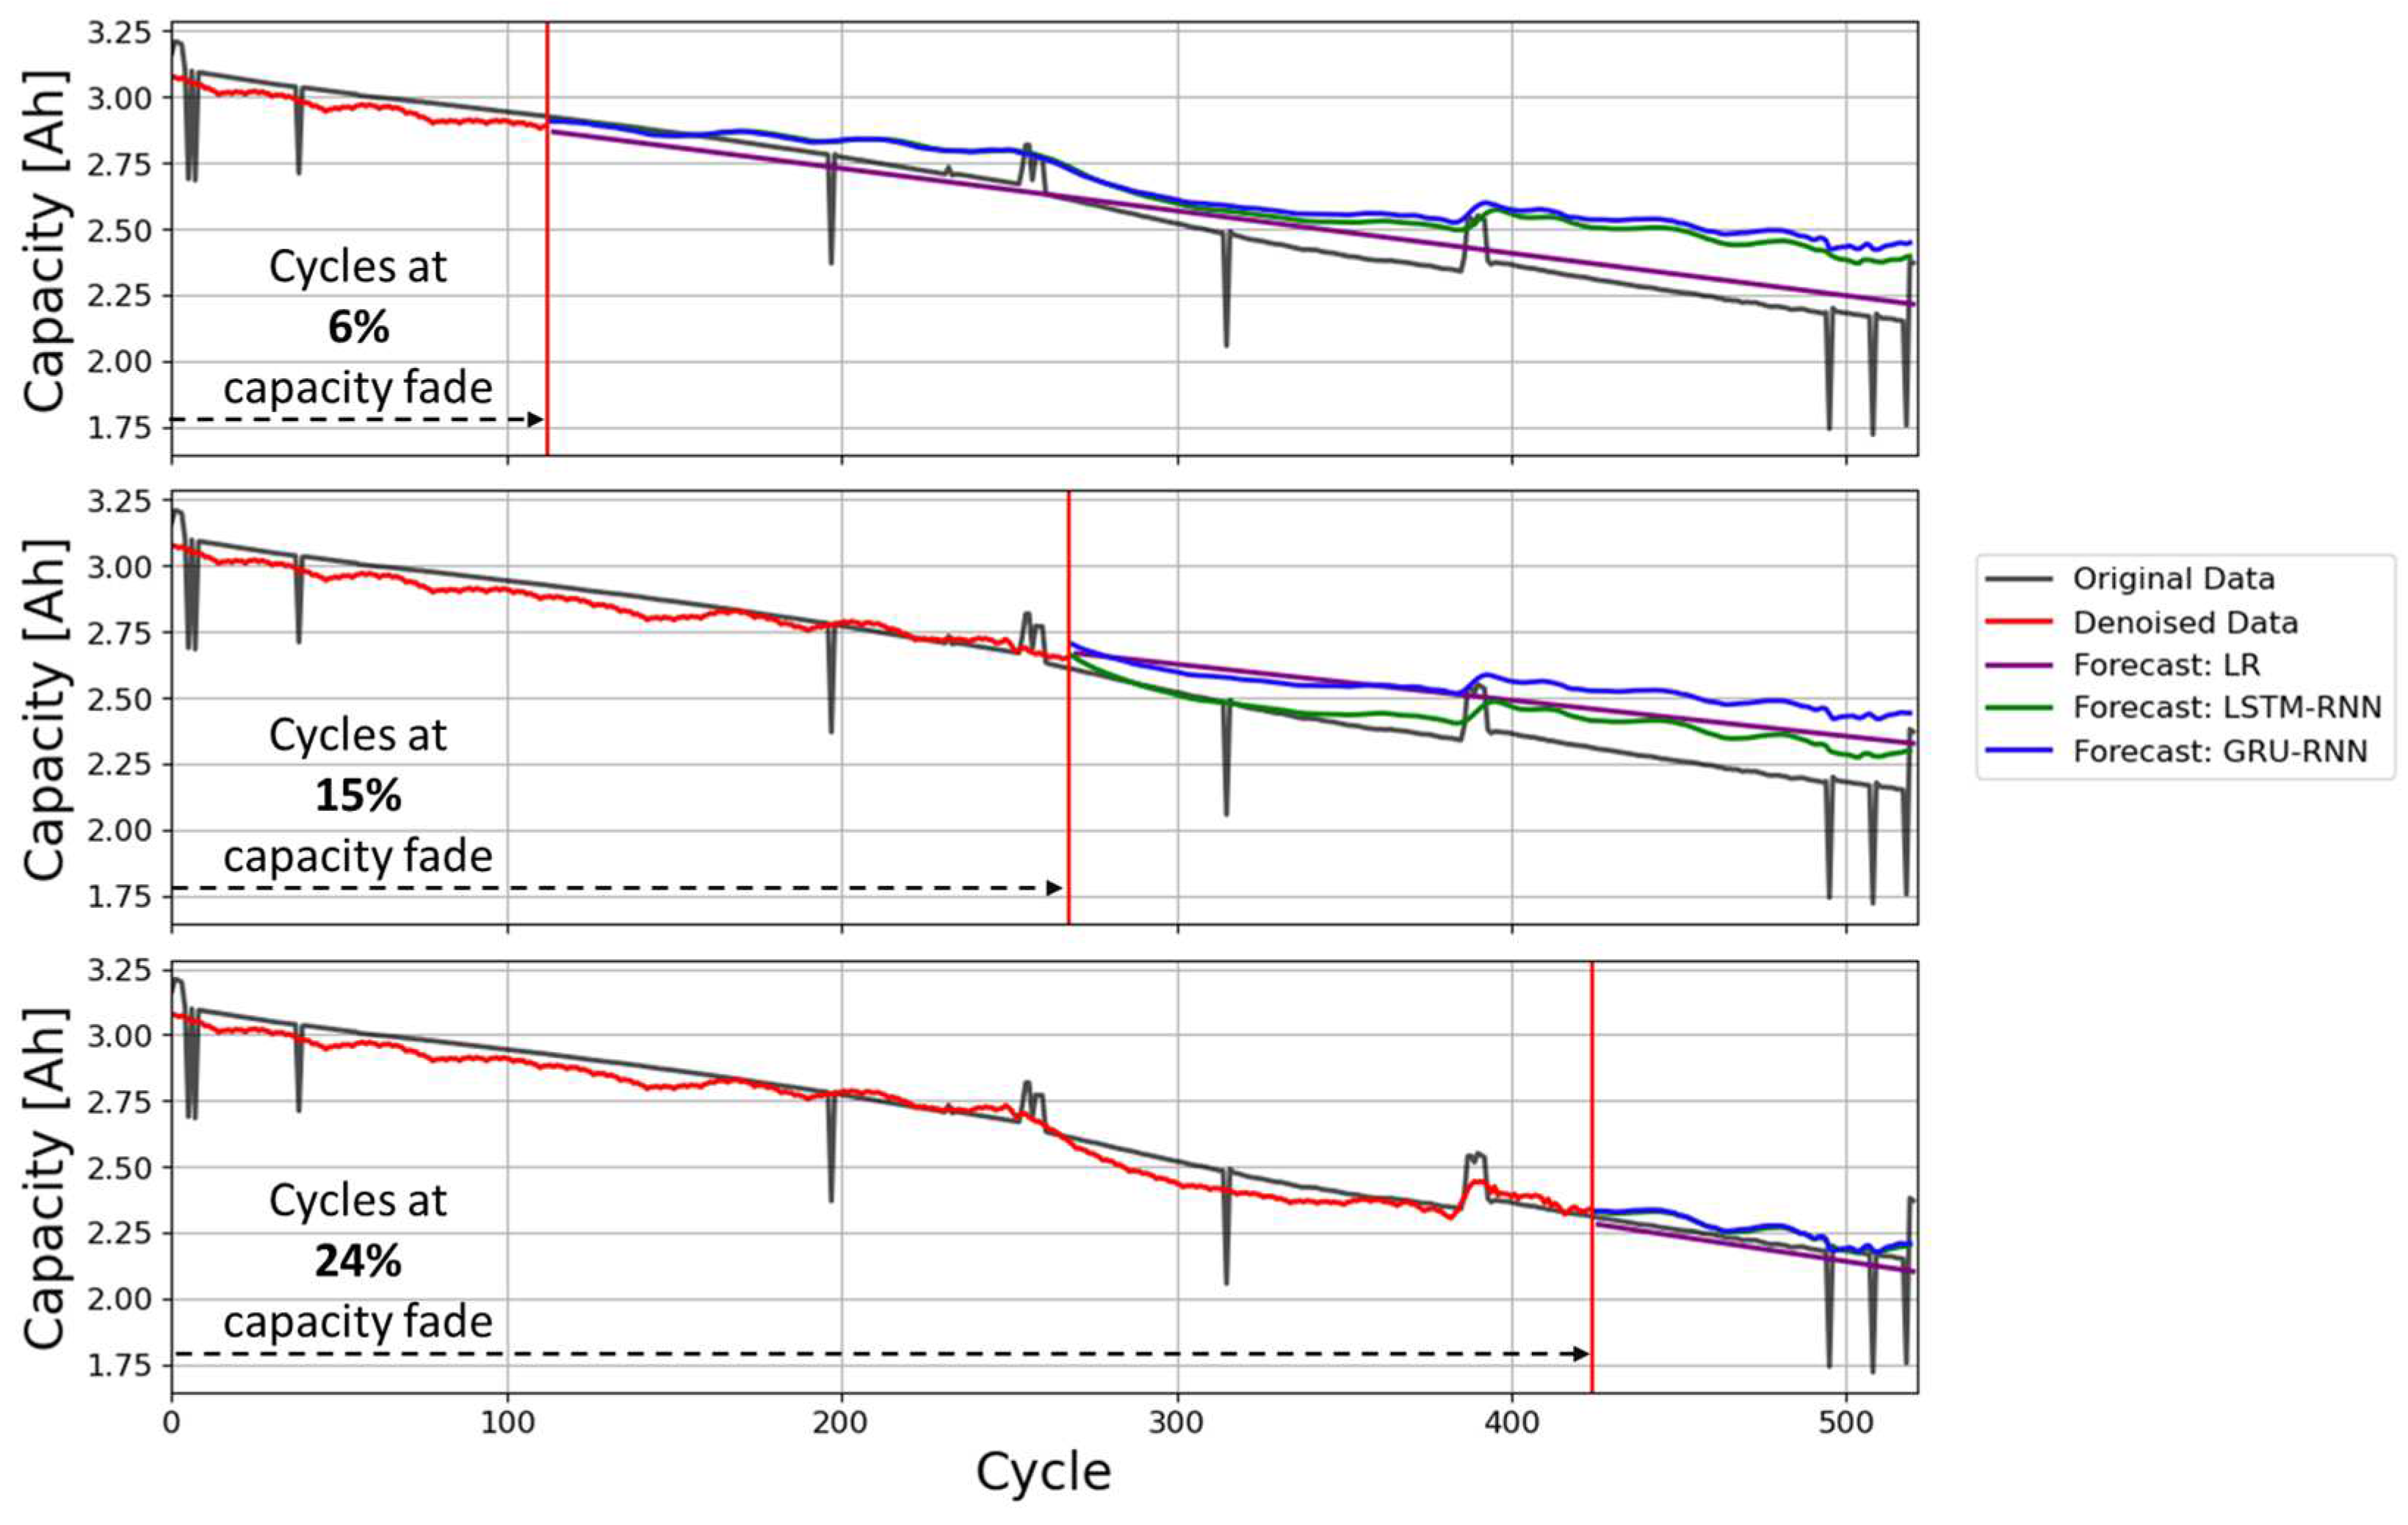
Figure 7 shows the forecasted cycle capacities using the LR, LSTM-RNN and GRU-RNN methods at cycles corresponding to 6%, 15% and 24% of capacity fade with respect to the initial or reference capacity.
Table 4 summarizes the average error values (RMSE and MAPE) for the 39 batteries analyzed with NCA and NMC cathode chemistries, calculated between the Coulomb counting cycle capacity of the batteries and the denoised CNC-LR forecasted cycle capacity over the remaining life cycle calculated at cycles corresponding to 6%, 15% and 24% of capacity fade with respect to the reference capacity (see
Figure 7).
The results presented in
Table 4 show that, as expected, the forecast errors for the three forecasting methods tend to decrease as more historical data (number of cycles) is available. However, there are some differences between the three forecasting methods. While LSTM clearly outperforms the other methods when there is little data available, this difference tends to decrease as the amount of data available increases.
5. Conclusions
Today, lithium-ion batteries are key elements in energy storage systems deployed around the world. However, due to their continuous use, cycling, load and environmental conditions, the battery capacity, an indicator of the battery SOH, degrades over time. This paper has addressed this issue by proposing a method to estimate the cycle capacity of the battery and its remaining lifetime. Since the battery capacity cannot be measured directly, this paper has developed a real-time method to estimate the battery cycle capacity using data from a short period of each charge cycle using a GLS-Nernst approach. By analyzing the historical capacity data of a battery, this paper has also developed a method to predict its RUL in real time based on three prediction methods such as LR, LSTM-RNN and GRU-RNN. Both approaches for estimating the cycle capacity of the battery and predicting the RUL have been tested using experimental data of 39 Li-ion batteries of two cathode chemistries operating under different test conditions. The results presented in this paper show the accuracy of both approaches and quantify the average errors, which are in all cases low enough to validate this proposal.
The proposed approach allows to assess the battery state of health in real time and also offers a forward-looking perspective to determine the RUL of the battery without the need of data of a full charge cycle (from 0% SOC to 100% SOC), but using only 20% of the full charge cycle starting from any voltage above 3.8 V. These developments have potential implications for the application of predictive maintenance and management strategies of battery systems, allowing to extend the battery lifetime, which is particularly important in applications where high reliability and longevity are critical factors.
Author Contributions
Conceptualization, J.V., J.-R.R. and J.A.O.; methodology, J.V. and J.A.O.; software, J.V. and J.-R.R.; validation, J.V., J.-R.R. and J.A.O.; formal analysis, J.-R.R. and J.A.O.; investigation, J.V., J.-R.R. and J.A.O.; resources, J.-R.R. and J.A.O.; data curation, J.V.; writing—original draft preparation, J.V. and J.-R.R.; writing—review and editing, J.V., J.-R.R. and J.A.O.; supervision, J.-R.R. and J.A.O..
Funding
This research was funded by Ministerio de Ciencia e Innovación de España, grant number TED2021-130007B-I00, and by the Generalitat de Catalunya, grant number 2021 SGR 00392.
Institutional Review Board Statement
Not applicable.
Informed Consent Statement
Not applicable.
Data Availability Statement
Acknowledgments
The authors are grateful to Sandia National Labs (SNL) for making their battery data publicly available, and to BatteryArchive.org for providing the means to access the data sets.
Conflicts of Interest
The authors declare no conflict of interest.
References
- Spitthoff, L.; Øyre, E. S.; Muri, H. I.; Wahl, M.; Gunnarshaug, A. F.; Pollet, B. G.; Lamb, J. J.; Burheim, O. S. Thermal management of lithium-ion batteries. Micro-Optics and Energy: Sensors for Energy Devices 2020, 183–194. [Google Scholar]
- Meng, J.; Ricco, M.; Luo, G.; Swierczynski, M.; Stroe, D. I.; Stroe, A. I.; Teodorescu, R. An Overview and Comparison of Online Implementable SOC Estimation Methods for Lithium-Ion Battery. IEEE Trans. Ind. Appl. 2018, 54, 1583–1591. [Google Scholar] [CrossRef]
- Meng, J.; Luo, G.; Gao, F. Lithium polymer battery state-of-charge estimation based on adaptive unscented kalman filter and support vector machine. IEEE Trans. Power Electron. 2016, 31, 2226–2238. [Google Scholar] [CrossRef]
- Tao, R.; Gu, Y.; Sharma, J.; Hong, K.; Li, J. A conformal heat-drying direct ink writing 3D printing for high-performance lithium-ion batteries. Mater. Today Chem. 2023, 32, 101672. [Google Scholar] [CrossRef]
- Teodorescu, R.; Sui, X.; Vilsen, S. B.; Bharadwaj, P.; Kulkarni, A.; Stroe, D. I. Smart Battery Technology for Lifetime Improvement. Batter. 2022, Vol. 8, Page 169 2022, 8, 169. [Google Scholar] [CrossRef]
- Zhu, J.; Xu, W.; Knapp, M.; Dewi Darma, M. S.; Mereacre, L.; Su, P.; Hua, W.; Liu-Théato, X.; Dai, H.; Wei, X.; Ehrenberg, H. A method to prolong lithium-ion battery life during the full life cycle. Cell Reports Phys. Sci. 2023, 4, 101464. [Google Scholar] [CrossRef]
- Ruan, H.; Barreras, J. V.; Engstrom, T.; Merla, Y.; Millar, R.; Wu, B. Lithium-ion battery lifetime extension: A review of derating methods. J. Power Sources 2023, 563, 232805. [Google Scholar] [CrossRef]
- Jin, S.; Huang, X.; Sui, X.; Wang, S.; Teodorescu, R.; Stroe, D. I. Overview of Methods for Battery Lifetime Extension. 2021 23rd Eur. Conf. Power Electron. Appl. EPE 2021 ECCE Eur. 2021. [Google Scholar]
- Harper, G.; Sommerville, R.; Kendrick, E.; Driscoll, L.; Slater, P.; Stolkin, R.; Walton, A.; Christensen, P.; Heidrich, O.; Lambert, S.; Abbott, A.; Ryder, K.; Gaines, L.; Anderson, P. Recycling lithium-ion batteries from electric vehicles. Nat. 2019 5757781 2019, 575, 75–86. [Google Scholar] [CrossRef]
- Woody, M.; Arbabzadeh, M.; Lewis, G. M.; Keoleian, G. A.; Stefanopoulou, A. Strategies to limit degradation and maximize Li-ion battery service lifetime - Critical review and guidance for stakeholders. J. Energy Storage 2020, 28, 101231. [Google Scholar] [CrossRef]
- Chung, C. H.; Jangra, S.; Lai, Q.; Lin, X. Optimization of Electric Vehicle Charging for Battery Maintenance and Degradation Management. IEEE Trans. Transp. Electrif. 2020, 6, 958–969. [Google Scholar] [CrossRef]
- Shen, L.; Li, J.; Meng, L.; Zhu, L.; Shen, H. T. Transfer Learning-based State of Charge and State of Health Estimation for Li-ion Batteries: A Review. IEEE Trans. Transp. Electrif. 2023. [Google Scholar] [CrossRef]
- Koleti, U. R. Fast charging strategies in lithium-ion batteries: detection and control of lithium plating, University of Warwick, 2020.
- Wenzl, H. BATTERIES | Capacity. Encycl. Electrochem. Power Sources 2009, 395–400. [Google Scholar]
- Peng, J.; Meng, J.; Chen, D.; Liu, H.; Hao, S.; Sui, X.; Du, X. A Review of Lithium-Ion Battery Capacity Estimation Methods for Onboard Battery Management Systems: Recent Progress and Perspectives. Batter. 2022, Vol. 8, Page 229 2022, 8, 229. [Google Scholar] [CrossRef]
- Jiang, J.; Zhang, C. Fundamentals and application of lithium-ion batteries in electric drive vehicles; Sons, J. W. & wiley: Singapore, 2015. [Google Scholar]
- IEC IEC 62660-2:2018 Secondary lithium-ion cells for the propulsion of electric road vehicles - Part 2: Reliability and abuse testing 2018, 37.
- ISO ISO 6469-1:2019 - Electrically propelled road vehicles — Safety specifications — Part 1: Rechargeable energy storage system (RESS) 2019, 26.
- IEEE IEEE Std 450-2020 - Recommended Practice for Maintenance, Testing, and Replacement of Vented Lead-Acid Batteries for Stationary Applications 2020, 68.
- Meng, J.; Cai, L.; Luo, G.; Stroe, D. I.; Teodorescu, R. Lithium-ion battery state of health estimation with short-term current pulse test and support vector machine. Microelectron. Reliab. 2018, 88–90, 1216–1220. [Google Scholar] [CrossRef]
- Song, Y.; Li, L.; Peng, Y.; Liu, D. Lithium-Ion Battery Remaining Useful Life Prediction Based on GRU-RNN. Proc. - 12th Int. Conf. Reliab. Maint. Safety, ICRMS 2018 2018, 317–322. [Google Scholar]
- Park, K.; Choi, Y.; Choi, W. J.; Ryu, H. Y.; Kim, H. LSTM-Based Battery Remaining Useful Life Prediction with Multi-Channel Charging Profiles. IEEE Access 2020, 8, 20786–20798. [Google Scholar] [CrossRef]
- de la Vega, J.; Riba, J. R.; Ortega-Redondo, J. A. Mathematical Modeling of Battery Degradation Based on Direct Measurements and Signal Processing Methods. Appl. Sci. 2023, Vol. 13, Page 4938 2023, 13, 4938. [Google Scholar] [CrossRef]
- Zhao, J.; Zhu, Y.; Zhang, B.; Liu, M.; Wang, J.; Liu, C.; Hao, X.; Kowal, J.; Zhao, J.; Zhu, Y.; Zhang, B.; Liu, M.; Wang, J.; Liu, C.; Hao, X. Review of State Estimation and Remaining Useful Life Prediction Methods for Lithium–Ion Batteries. Sustain. 2023, Vol. 15, Page 5014 2023, 15, 5014.
- MaximIntegrated MAX1726x ModelGauge m5 EZ User Guide 2018, 48.
- Plett, G. L. Extended Kalman filtering for battery management systems of LiPB-based HEV battery packs: Part 2. Modeling and identification. J. Power Sources 2004, 134, 262–276. [Google Scholar] [CrossRef]
- Hussein, A. A. H.; Batarseh, I. An overview of generic battery models. IEEE Power Energy Soc. Gen. Meet. 2011. [Google Scholar]
- Wang, Y.; Meng, D.; Chang, Y.; Zhou, Y.; Li, R.; Zhang, X. Research on online parameter identification and SOC estimation methods of lithium-ion battery model based on a robustness analysis. Int. J. Energy Res. 2021, 45, 21234–21253. [Google Scholar] [CrossRef]
- Pavković, D.; Kasać, J.; Krznar, M.; Cipek, M. Adaptive Constant-Current/Constant-Voltage Charging of a Battery Cell Based on Cell Open-Circuit Voltage Estimation. World Electr. Veh. J. 2023, Vol. 14, Page 155 2023, 14, 155. [Google Scholar] [CrossRef]
- Meng, J.; Azib, T.; Yue, M. Early-Stage end-of-Life prediction of lithium-Ion battery using empirical mode decomposition and particle filter. Proc. Inst. Mech. Eng. Part A J. Power Energy 2023, 0. [Google Scholar] [CrossRef]
- Wang, X.; Xu, J.; Zhao, Y. Wavelet Based Denoising for the Estimation of the State of Charge for Lithium-Ion Batteries. Energies 2018, Vol. 11, Page 1144 2018, 11, 1144. [Google Scholar] [CrossRef]
- Dogan, A.; Cidem Dogan, D. A Review on Machine Learning Models in Forecasting of Virtual Power Plant Uncertainties. Arch. Comput. Methods Eng. 2023, 30, 2081–2103. [Google Scholar] [CrossRef]
- Kwon, S. J.; Han, D.; Choi, J. H.; Lim, J. H.; Lee, S. E.; Kim, J. Remaining-useful-life prediction via multiple linear regression and recurrent neural network reflecting degradation information of 20Ah LiNixMnyCo1−x−yO2 pouch cell. J. Electroanal. Chem. 2020, 858, 113729. [Google Scholar] [CrossRef]
- Hochreiter, S.; Schmidhuber, J. Long Short-Term Memory. Neural Comput. 1997, 9, 1735–1780. [Google Scholar] [CrossRef] [PubMed]
- Cho, K.; van Merriënboer, B.; Bahdanau, D.; Bengio, Y. On the Properties of Neural Machine Translation: Encoder-Decoder Approaches. Proc. SSST 2014 - 8th Work. Syntax. Semant. Struct. Stat. Transl. 2014, 103–111. [Google Scholar]
- Preger, Y.; Barkholtz, H. M.; Fresquez, A.; Campbell, D. L.; Juba, B. W.; Romàn-Kustas, J.; Ferreira, S. R.; Chalamala, B. Degradation of Commercial Lithium-Ion Cells as a Function of Chemistry and Cycling Conditions. J. Electrochem. Soc. 2020, 167, 120532. [Google Scholar] [CrossRef]
- BatteryArchive.org https://www.batteryarchive.org/ (accessed Nov 27, 2023).
|
Disclaimer/Publisher’s Note: The statements, opinions and data contained in all publications are solely those of the individual author(s) and contributor(s) and not of MDPI and/or the editor(s). MDPI and/or the editor(s) disclaim responsibility for any injury to people or property resulting from any ideas, methods, instructions or products referred to in the content. |
© 2023 by the authors. Licensee MDPI, Basel, Switzerland. This article is an open access article distributed under the terms and conditions of the Creative Commons Attribution (CC BY) license (http://creativecommons.org/licenses/by/4.0/).
