1. Introduction
Inconel 718 is widely used to manufacture aircraft engine turbine disks due to its excellent mechanical properties. The high mechanical load makes low cycle fatigue (LCF) failure as one of the main failure modes of Inconel 718 parts.
Fatigue cracks tend to initiate at the surface and subsurface of parts [
1]. So, the fatigue life of machined parts is significantly affected by machined surface integrity, especially surface roughness and residual stress [
2,
3]. The lower surface roughness and compressive residual stress contribute to improving the fatigue properties of machined parts [
4,
5].
The fatigue crack initiation of polycrystalline metallic materials is caused by cyclic loading, as shown in
Figure 1. Firstly, dislocations accumulate within grains under cyclic loading. Subsequently, the persistent slip bands are formed in the grains. The microcracks generated from persistent bands as cyclic loading proceeds. As cyclic load proceeds, the microcracks expand to surrounding grains due to the stress concentration at the crack tips. Finally, microcracks accumulate and transformed to a macrocrack [
6,
7]. The formation of persistent slip bands and microcracks within Inconel 718 was observed using replica method [
8].
Tanaka and Mura proposed a theoretical cyclic slip dislocation pile-up model to describe crack nucleation in single-crystal [
9], which is expressed as Eq. (1).
where
G is the shear modulus,
Ws is the specific fracture energy per unit area of the material,
ν is the Poisson’s ratio,
Δτ is the average shear stress range on the slip band,
k is the frictional stress of dislocations on the slip plane,
d is the length of the slip band.
The Tanaka-Mura crack initiation cycle slip theory is suitable for single-crystal crack initiation life prediction. However, the model needs to be integrated with finite element methods (FEM) to predict crack initiation life of polycrystalline metallic materials. Bruckner et al. [
10] analyzed the crack initiation process of martensitic stainless steel using Tanaka-Mura theory and FEM. Rahim et al. [
11] predicted the crack initiation life of steel P91 at room temperature. Tanaka-Mura model has also been utilized in predicting the crack initiation life of welded structure [
12]. However, Tanaka-Mura model has seldom been applied to investigate the effect of different surface integrity on crack initiation life.
Crack propagation life is related to the crack stress intensity factor. Crack propagation life can be estimated analytically by integrating Paris law for simple cracks. However, the analytical integrating method is rarely applicable to complicated cracks. The eXtended Finite Element Method (XFEM) was proposed to simulate crack propagation process [
13,
14]. The XFEM has already been utilized for simulating fatigue crack propagation [
15,
16] and predicting fatigue life [
17,
18].
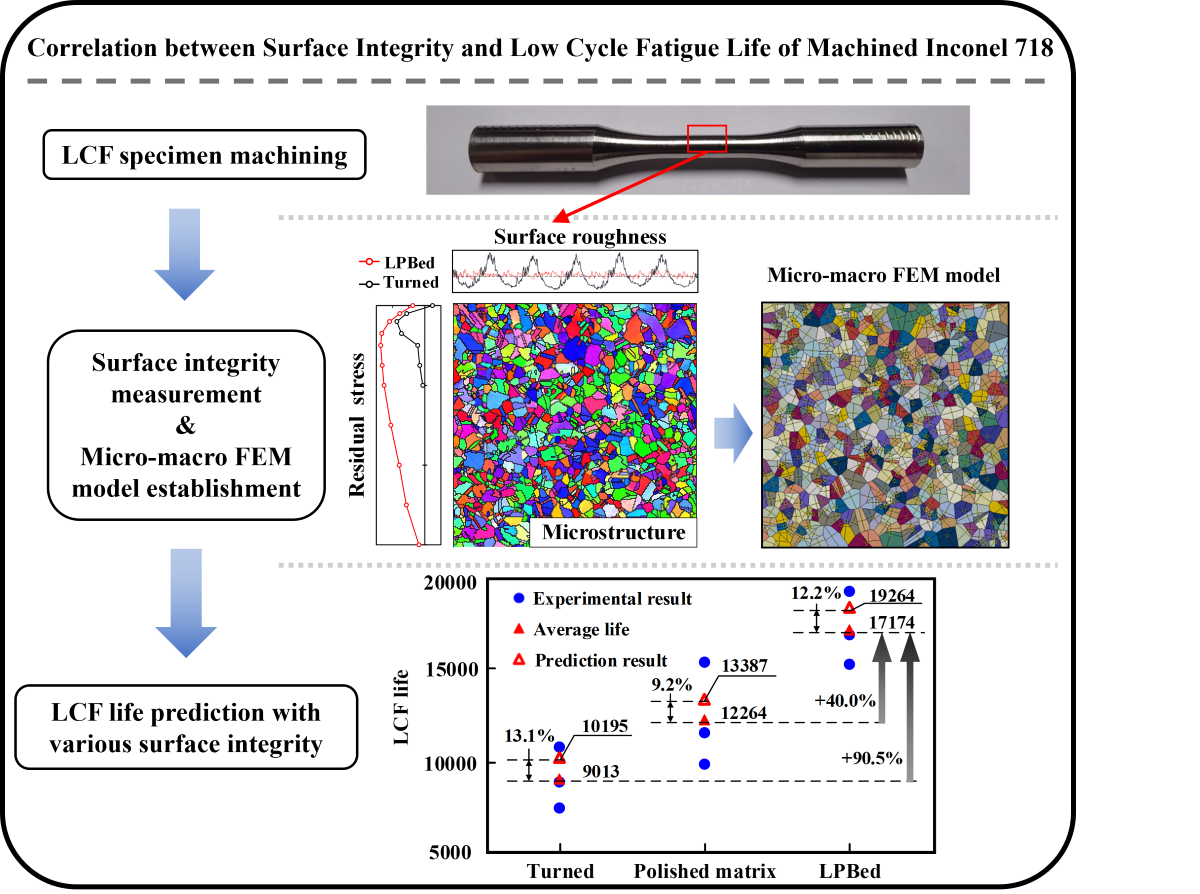
In this study, the micro-macro FEM model was established based on Tanaka-Mura model and XFEM. Firstly, three groups of LCF specimens with different surface integrity were machined using polishing (matrix LCF specimen), turning (turned LCF specimen) and LPB process (LPBed LCF specimen). The surface integrity of the specimens was measured and induced to the representative volume element (RVE) model. Subsequently, the effect of surface integrity on the Inconel 718 LCF life was investigated using the proposed model. The LCF life of the three groups specimens was predicted. Finally, LCF experiments were conduct to verified the proposed model. The flow diagram of this research is shown in
Figure 2.
3. Micro-macro FEM LCF life prediction model for Inconel 718
The LCF life of Inconel 718 was subdivided into crack initiation life and crack propagation life. The crack initiation life was predicted utilizing the micro FEM model based on Tanaka-Mura theory. The crack propagation life was predicted using macro FEM model based on XFEM method.
The micro FEM model was established based on the Tanaka-Mura theoretical cyclic slip dislocation pile-up model shown in Eq. (1). The material parameters of Inconel 718 used in Tanaka-Mura model are shown in
Table 2. The length of the slip band
d and average shear stress range on the slip band
Δτ are parameters to be determined. For polycrystalline material Inconel 718, the micro FEM analysis was performed cyclically to simulate crack initiation process and predict crack initiation life.
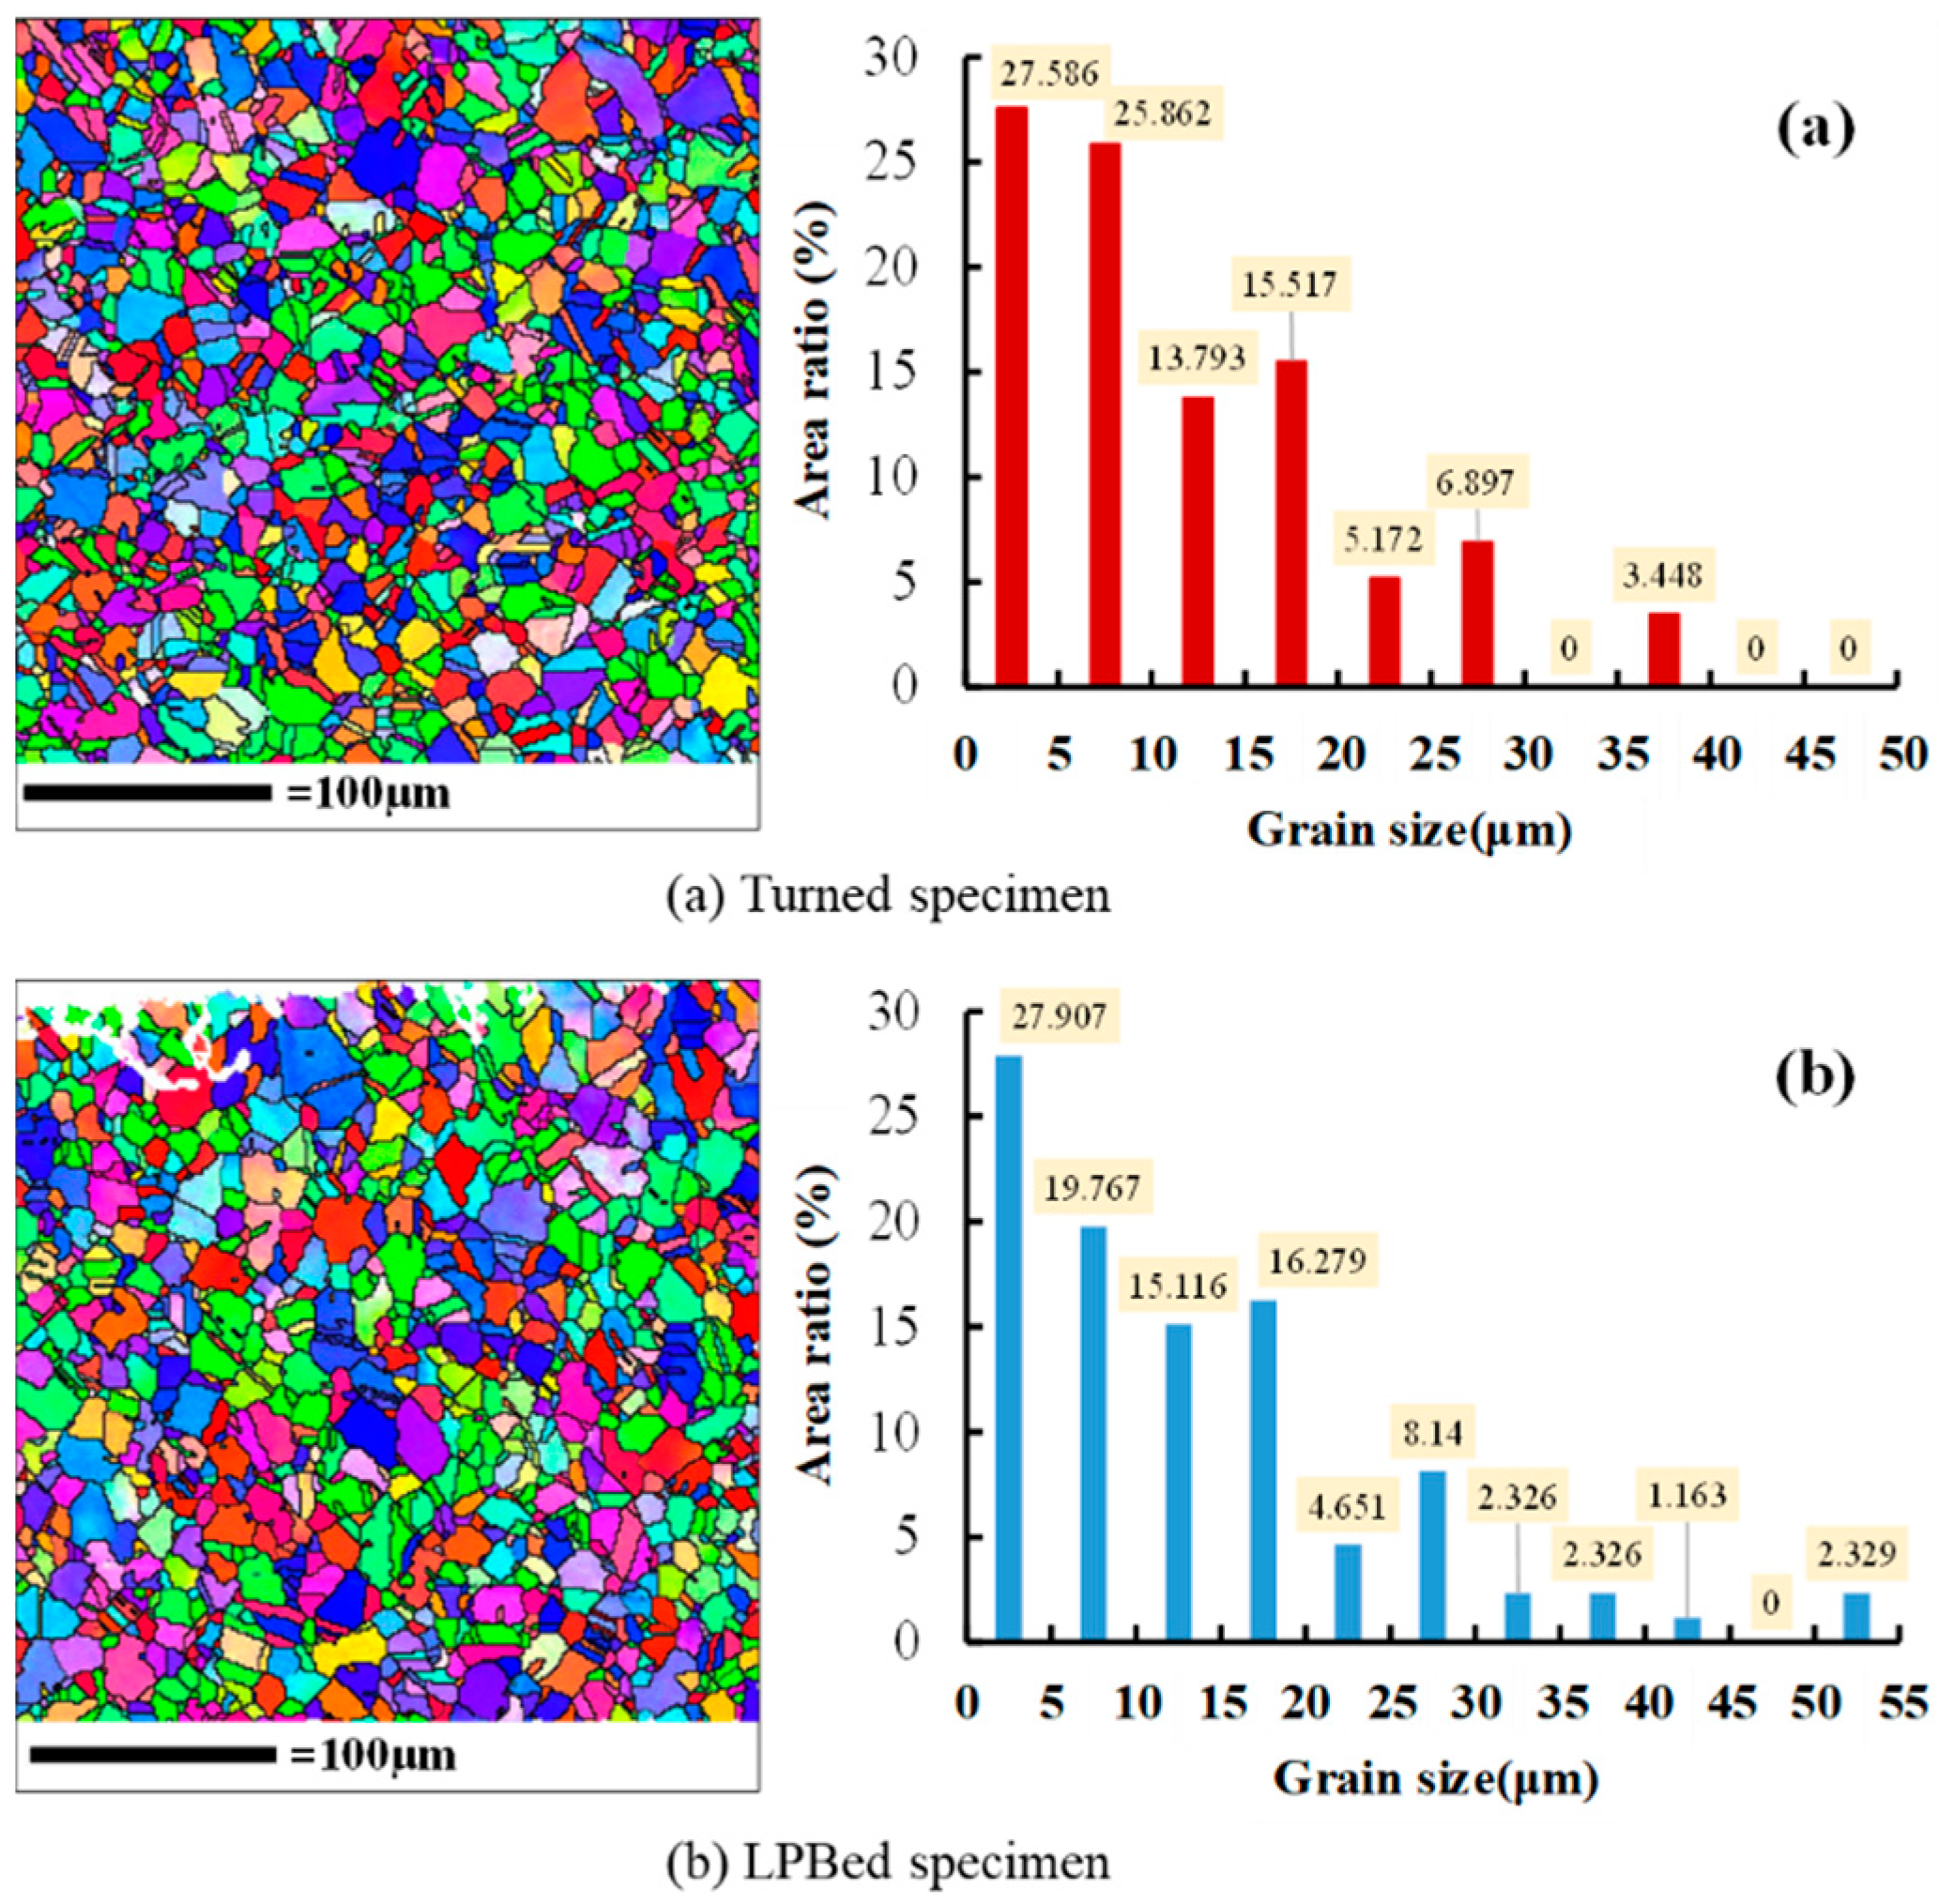
Firstly, the microstructure and grain size of the surface layer of specimens were measured using Electron Backscatter Diffraction (EBSD), as shown in
Figure 7. The microstructure of Inconel 718 was composed of equiaxed grains and crystal twin. The grain average size of turned specimen was measured as 12.26μm and 13.42μm for LPBed specimen.
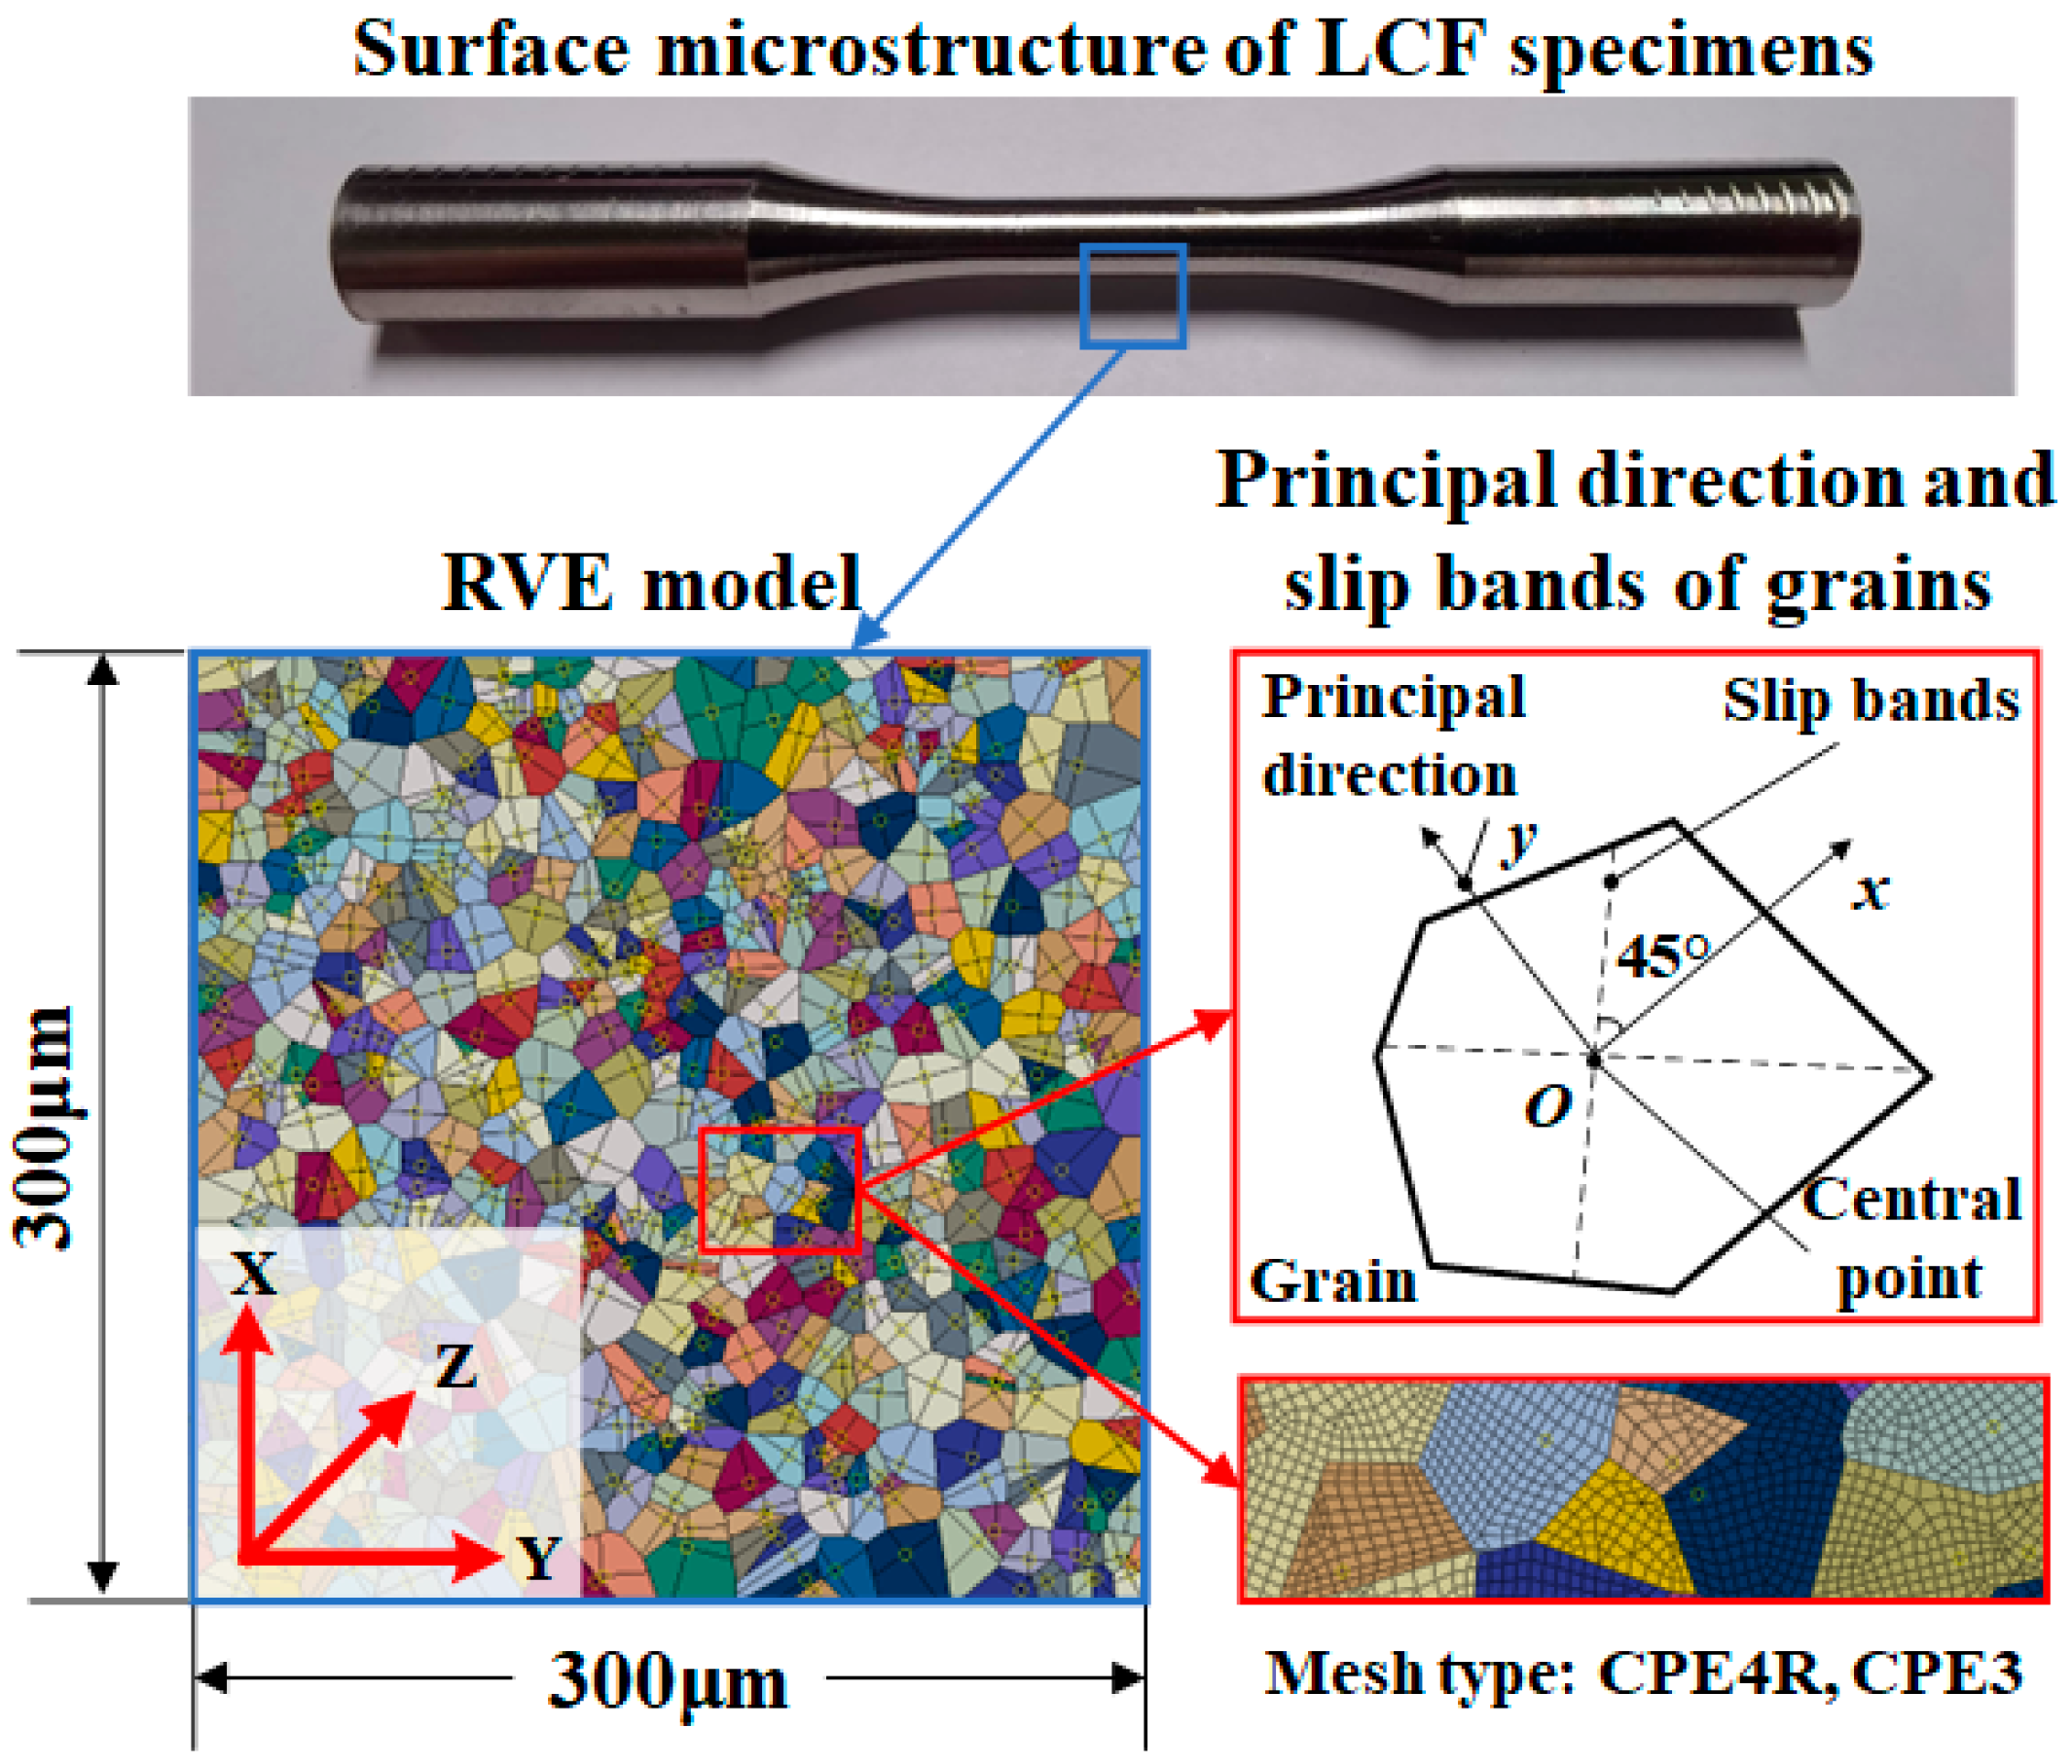
Subsequently, the representative volume element (RVE) model of Inconel 718 was established based on the observed Inconel 718 microstructure. The Voronoi diagram, a diagram consistent with the microstructure formation process of metal materials [
22], was employed to simulate the microstructure of Inconel 718 specimens.
Finally, the shear stress internal the grains during LCF loading was calculated using FEM. The microcracks were set up in grains according to Tanaka-Mura model. According to the study of Kramberger et al. [
23], the crack initiation stage concluded when the crack expanded to 300μm. Therefore, the RVE model with 600 grains was established within a 300μm*300μm square. The crack initiation simulation concluded when the microcrack penetrate the RVE model. The loading cycles corresponded to the crack initiation lifetime.
The mechanical properties of the Inconel 718 grains are anisotropic. The elastic orthotropic matrix parameters of Inconel 718 are shown in
Table 3. Grain principal directions were assigned using random number method since the grain directions are randomly distributed in Inconel 718.
According to the Tanaka-Mura crack initiation cycle slip theory, cracks initiate at the persistent slip bands internal the grains. Therefore, the slip bands were drawn inside the grains at an angle of 45° to the main direction, as shown in
Figure 8. The length of the slip bands and shear stress amplitude was substituted into the Tanaka-Mura model to calculate the crack initiation life of the grain. The RVE model was meshed using CPE4R and CPE3 with the size of 1μm. The established RVE model of Inconel 718 is shown in
Figure 8.
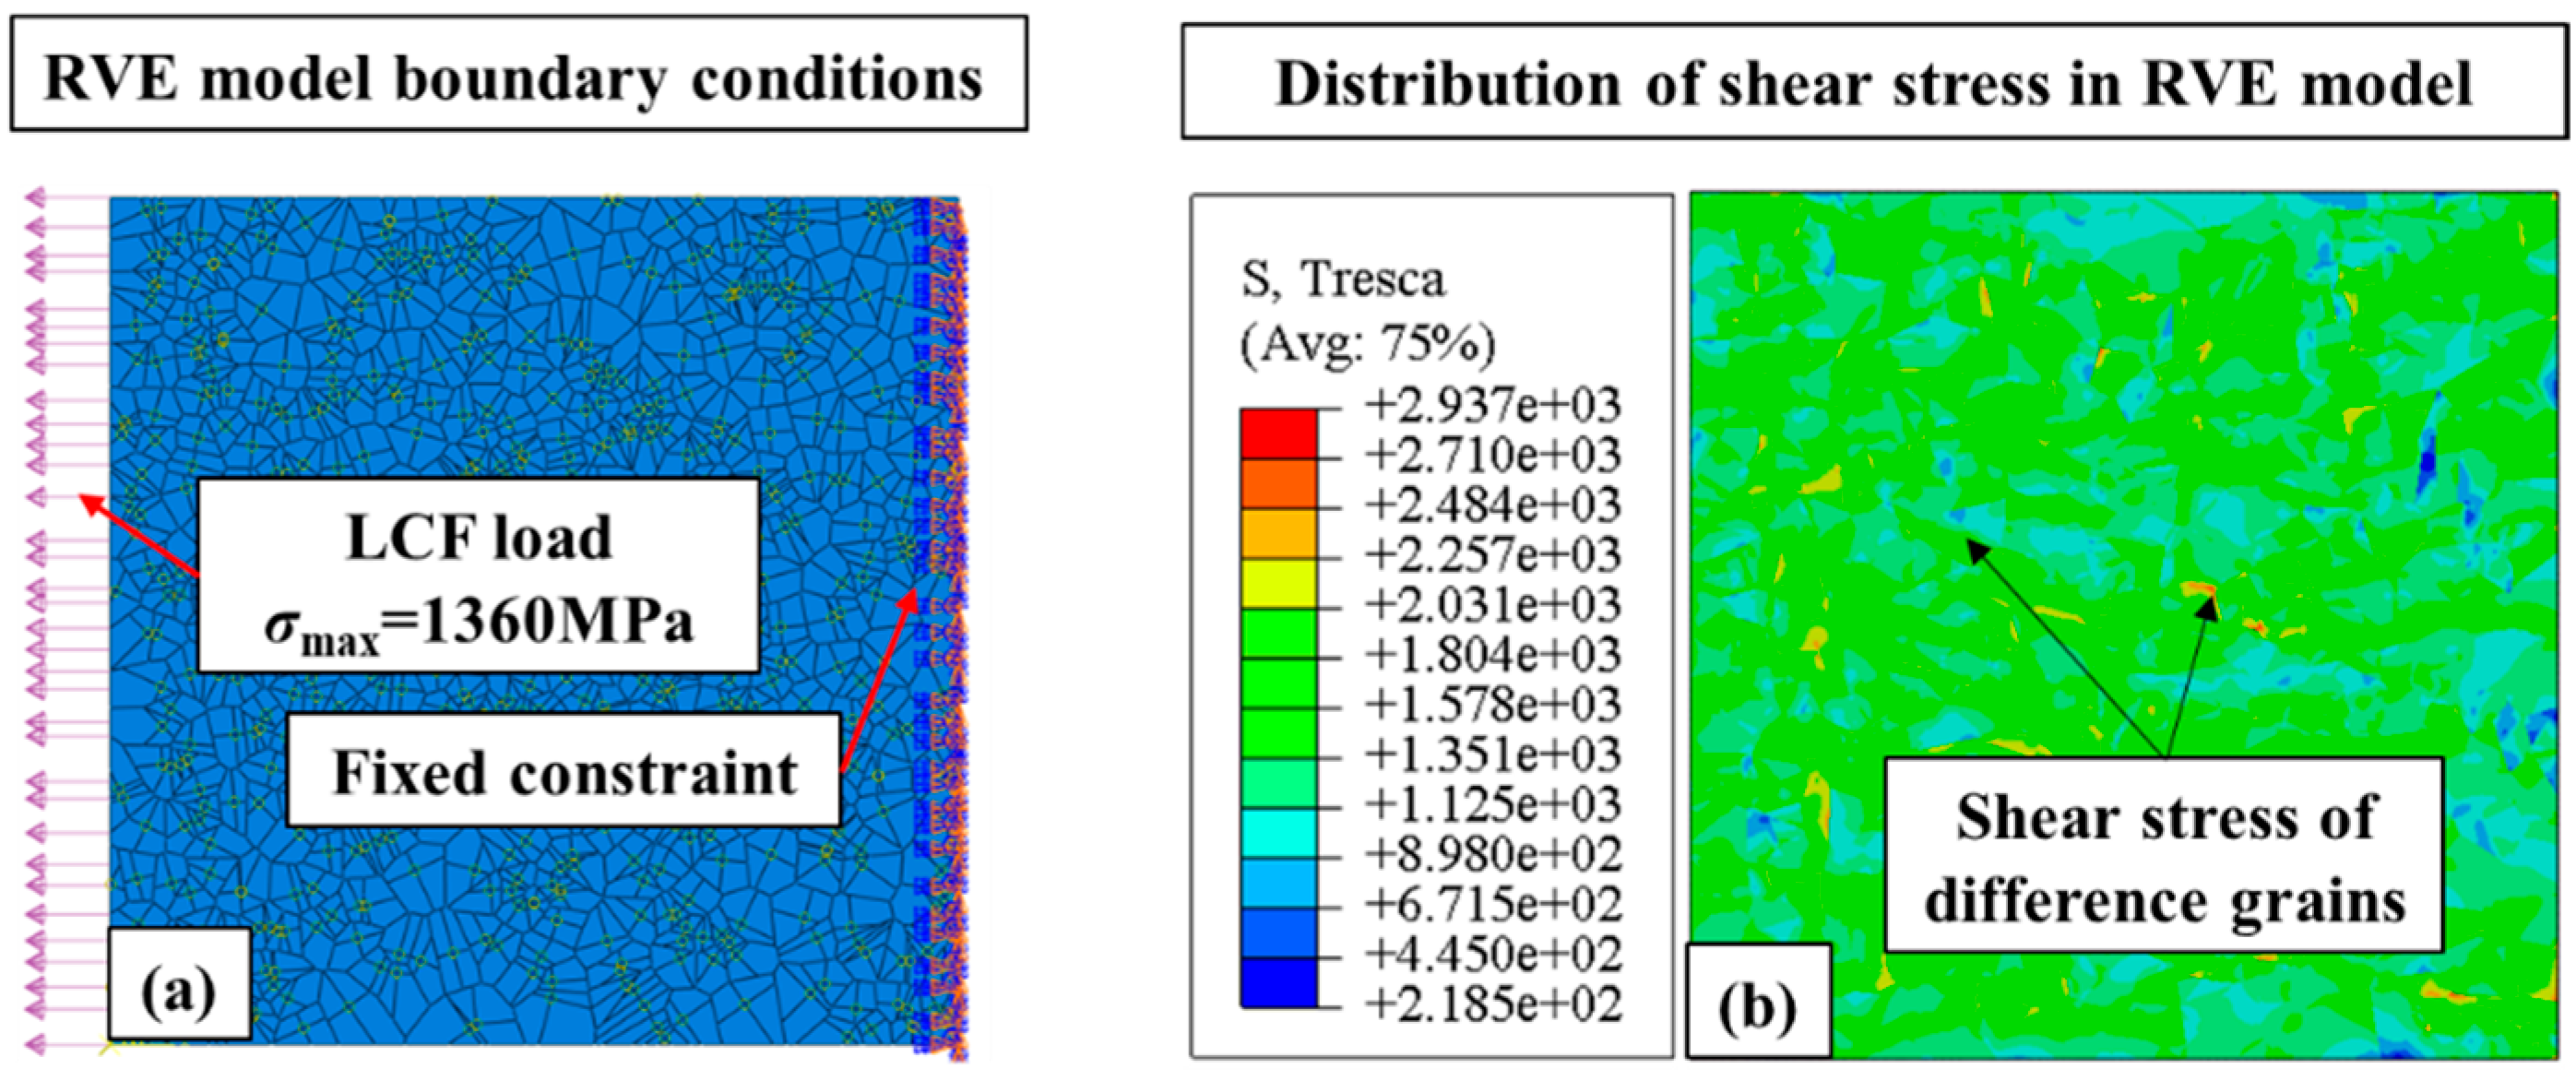
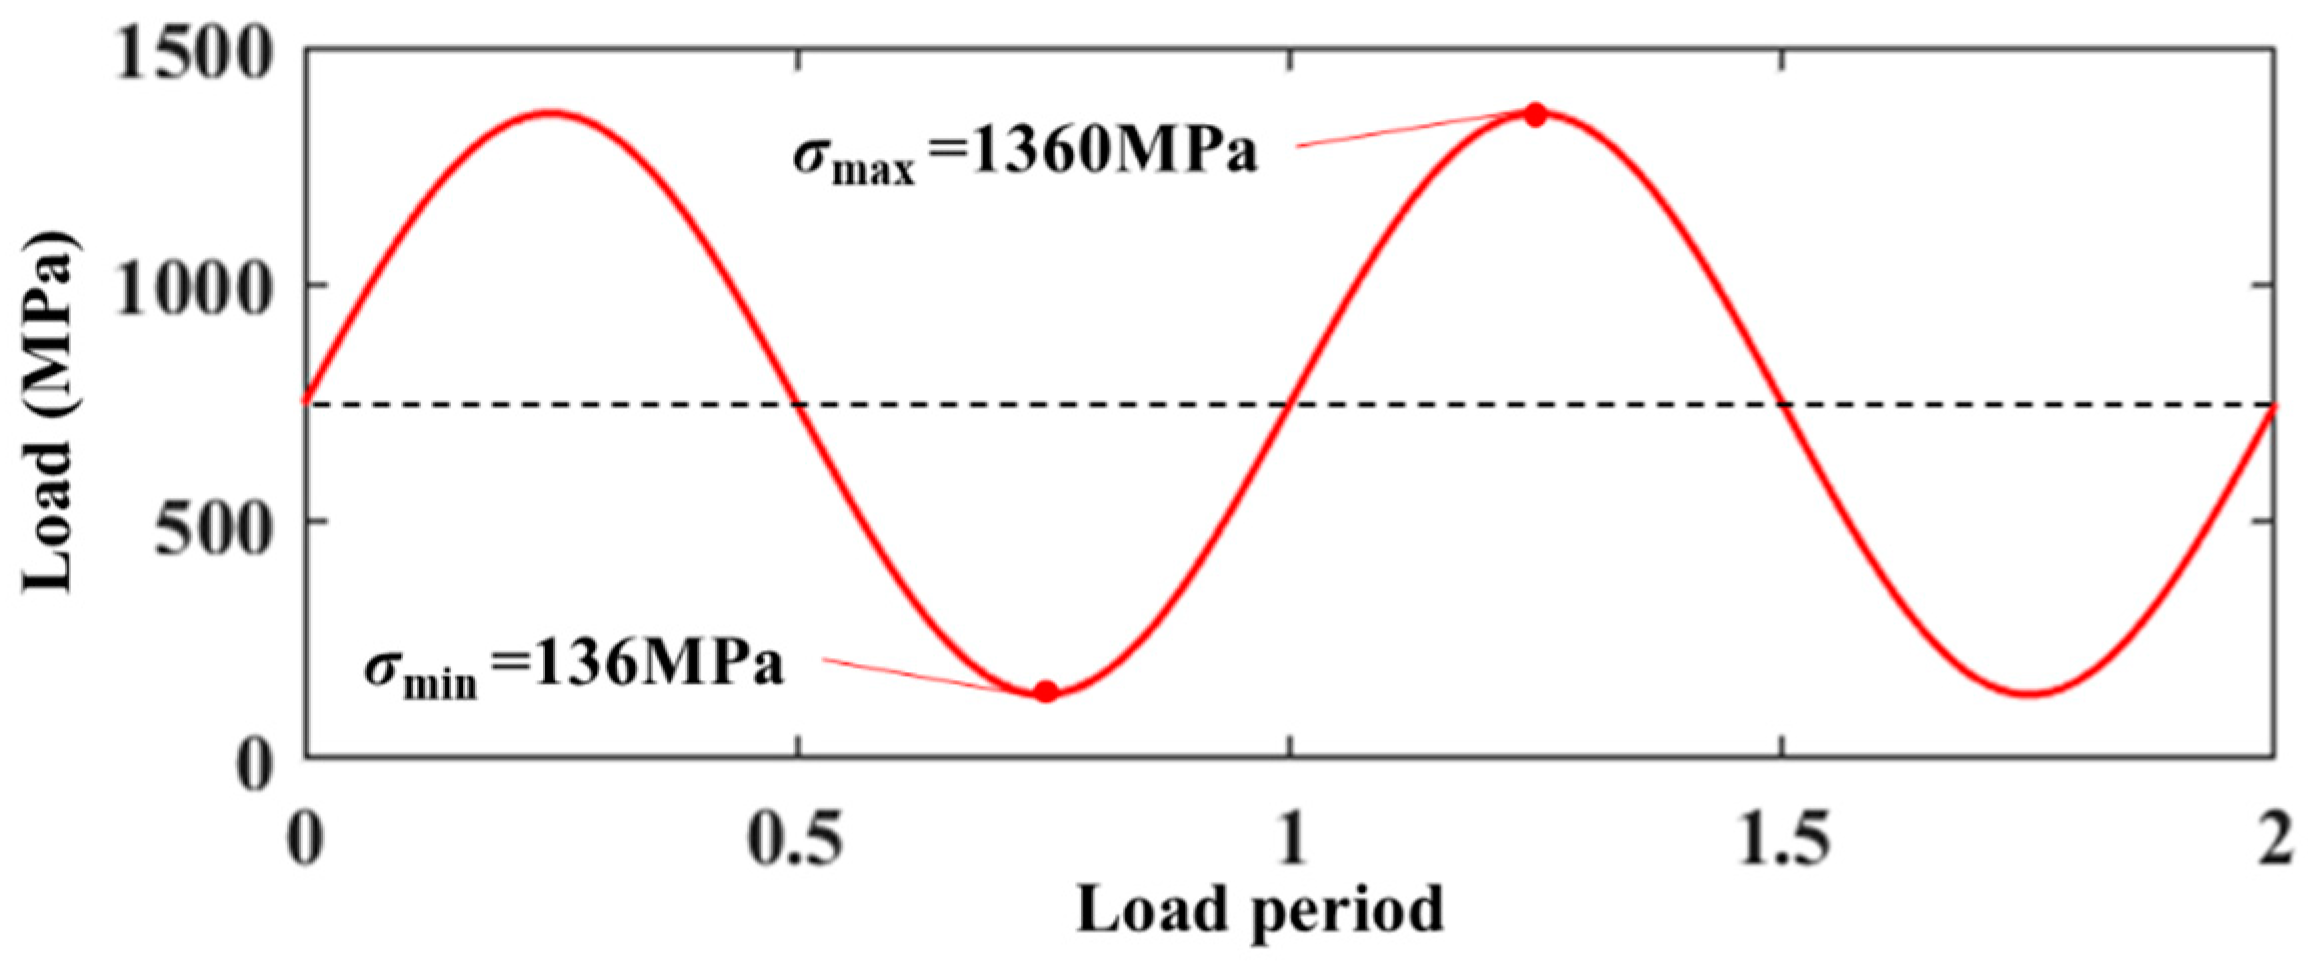
The boundary conditions were specified based on the surface integrity of the fatigue specimen and the LCF experiment. The maximum load was
σmax=1360 MPa and
R=0.1 for stress ratio. The fixed constraint and load were applied on the RVE model as shown in
Figure 9 (a). The distribution of shear stress in the RVE model is shown in
Figure 9 (b). The shear stress was uniformly distributed within each grain while varied between different grains. It was due to the anisotropic mechanical properties of the grains.
The maximum load σmax and minimum load σmin were applied to the RVE model. The maximum shear stress τmax and minimum shear stress τmin of each grain were extracted using Python and Matlab. The average shear stress range Δτ and the length of the slip band d were substituted into Eq. (1) to calculate the crack initiation life of each grain. The grain with the lowest crack initiation life was marked as the critical grain. The critical grain was cracked at the end of a single simulation, and its crack initiation life was taken as the life of the simulation.
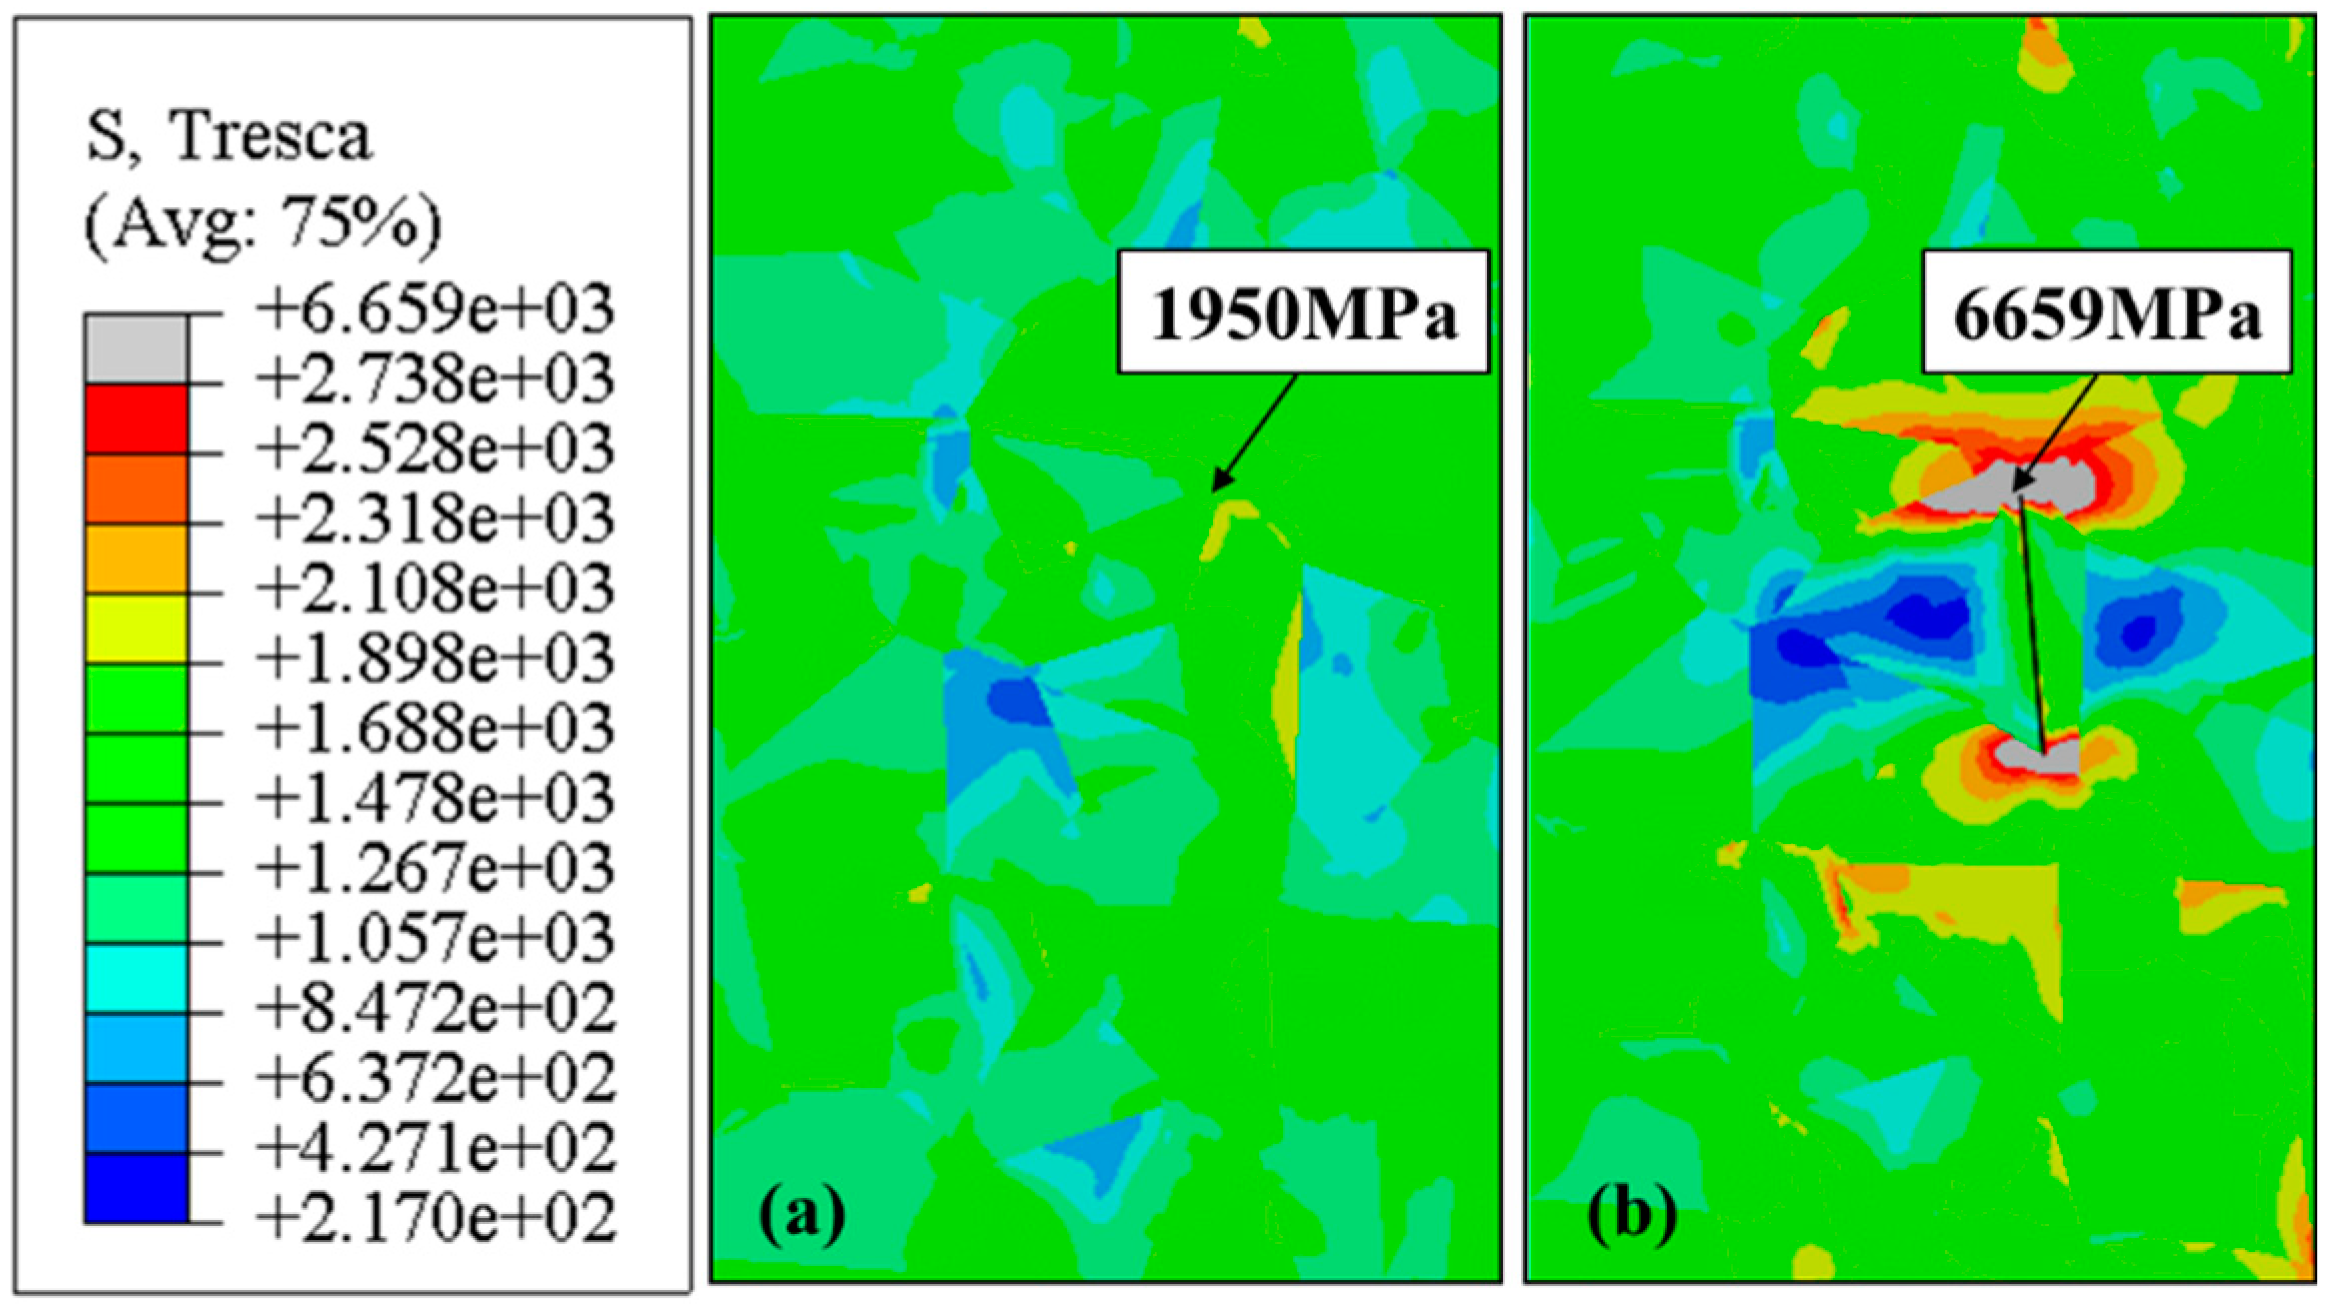
The shear stress distribution of the RVE model is shown in
Figure 10. The shear stress within surrounding grains was changed by stress concentration at the crack tip. Cyclic FEM simulation was used to simulate the crack initiation process and predict the crack initiation life. The crack was assigned in the critical grain at the end of each single simulation, and then the FEM process proceeded to the subsequent simulation cycle. The simulation of the crack initiation cycle stopped when the crack length exceeded the criterion length (0.3mm), and the total crack initiation life was then outputted.
The surface integrity of the specimens was measured experimentally in
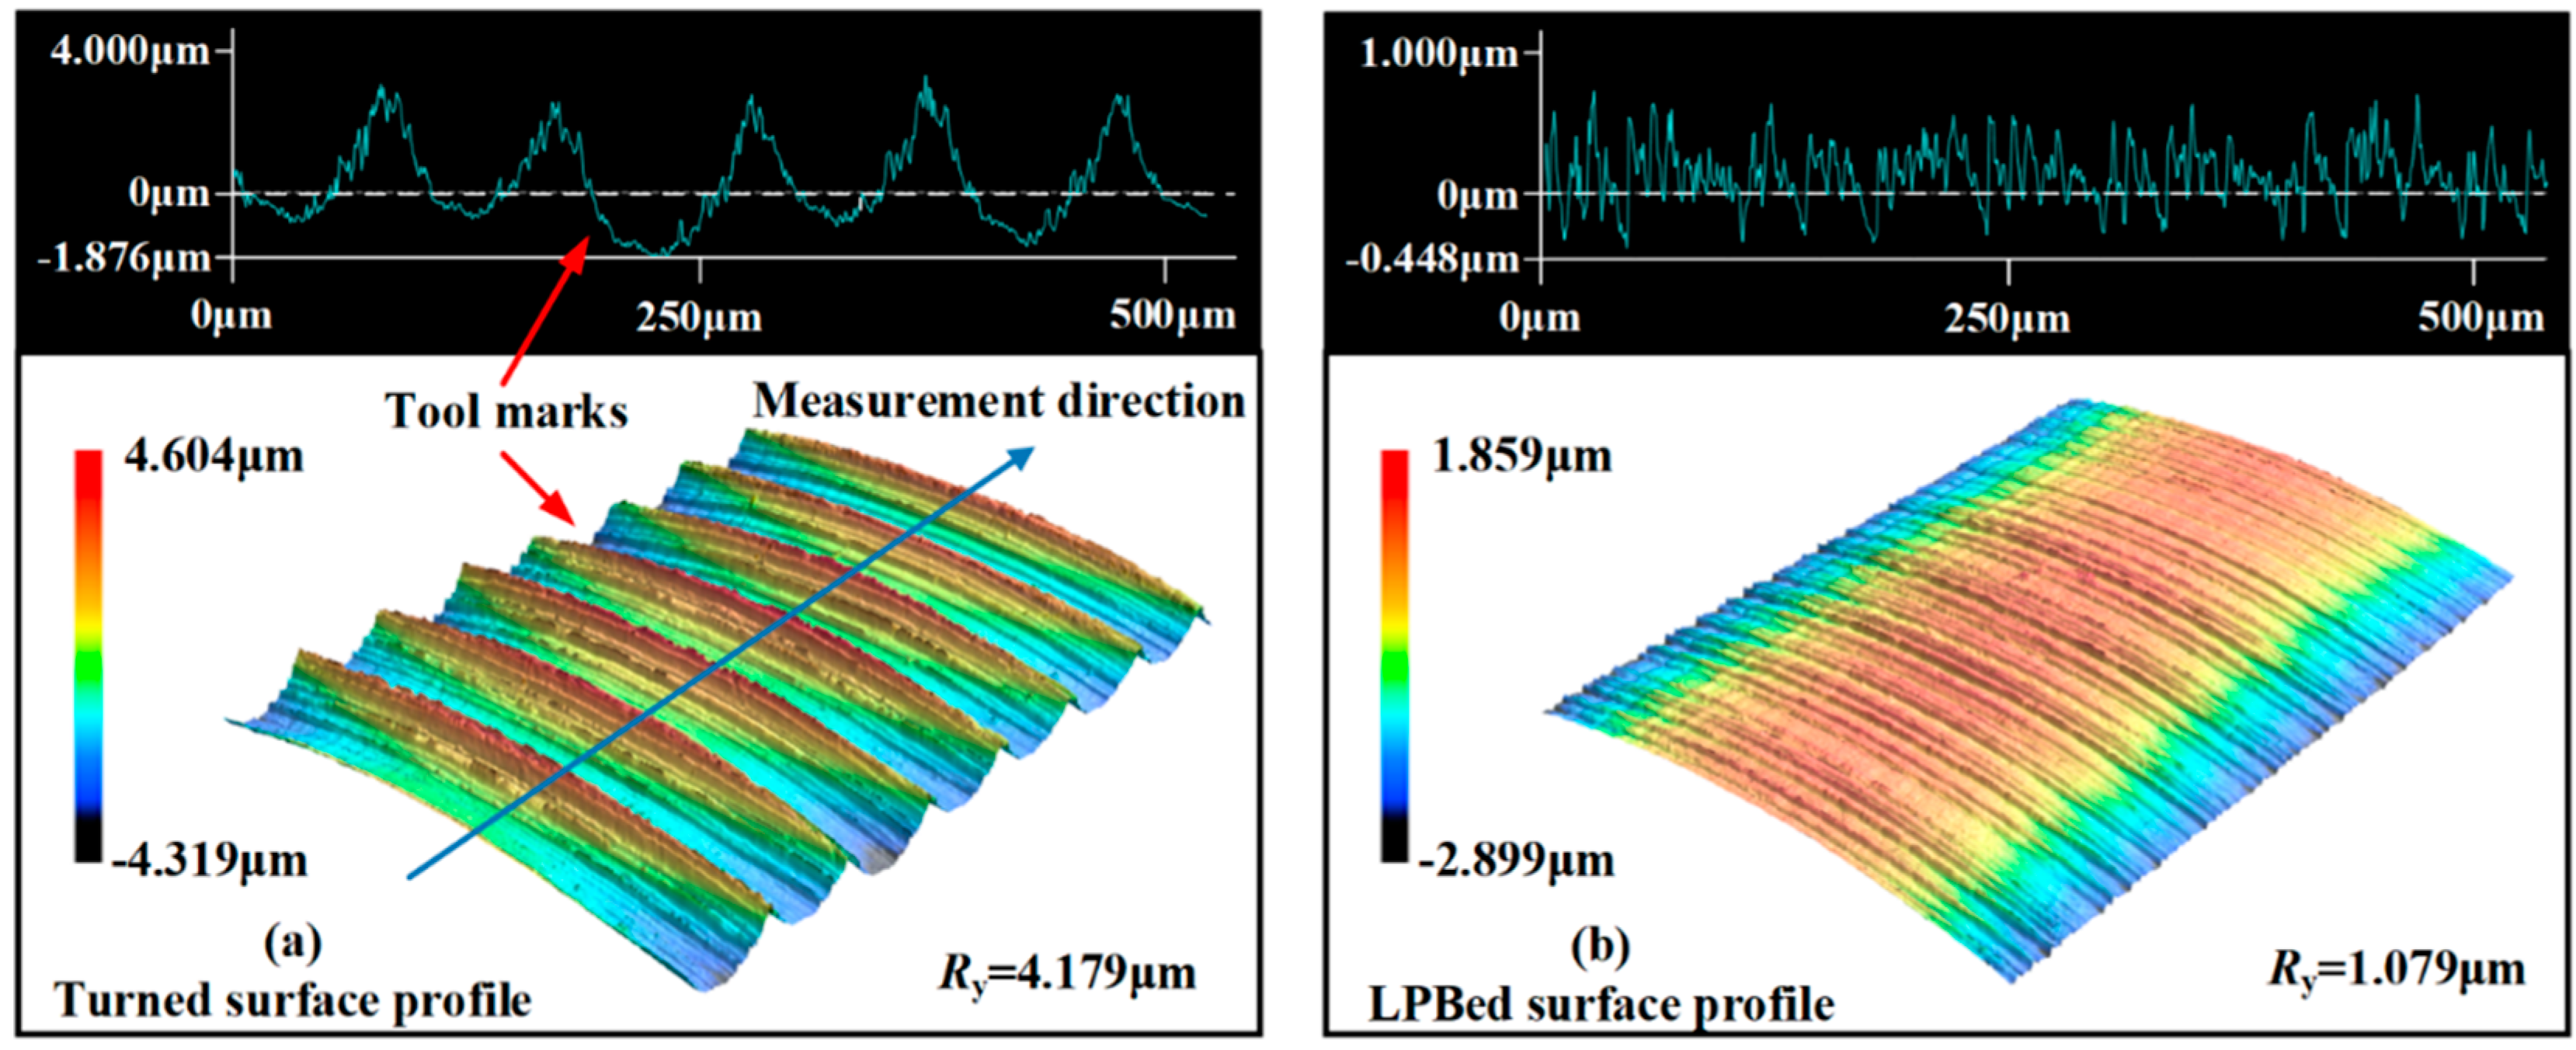
Section 2.1. Surface morphology and surface roughness of the turned specimen and LPBed specimen are shown in
Figure 11. As shown in
Figure 11 (a), tool marks were observed on the turned surface. The surface roughness of the turned specimen was 4.179μm. Tool marks were smoothed after the LPB process as shown in
Figure 11 (b), and the surface roughness was decreased to 1.079μm. The LPBed surface roughness was reduced by 77.6% compared to the turning results.
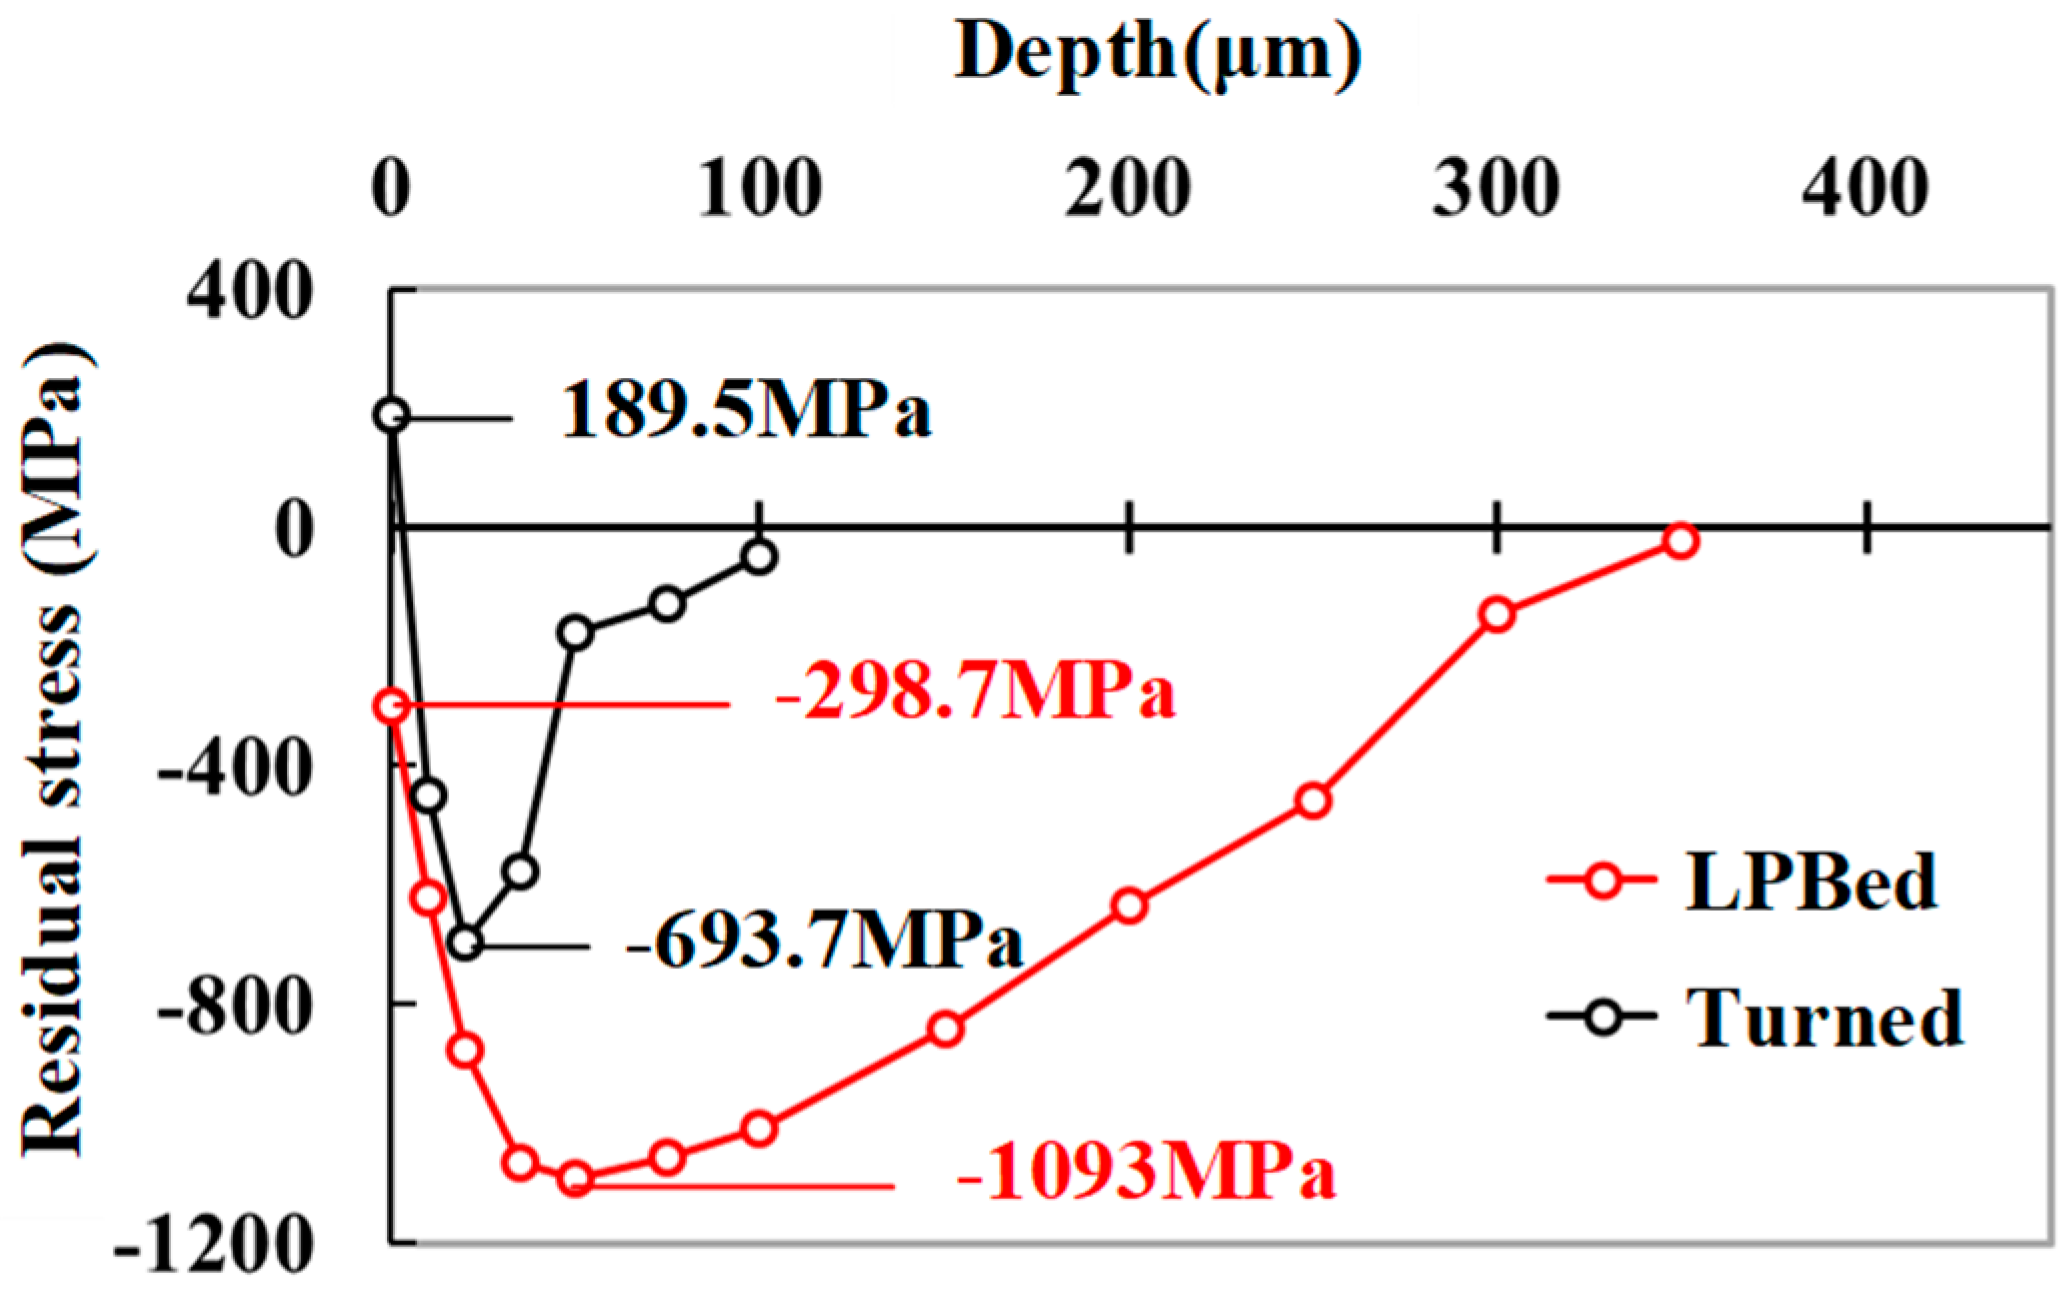
The residual stress field of the turned and LPBed specimens is depicted in
Figure 12. Tensile residual stress with the value of 189.5MPa was induced on the turned surface. The maximum compressive residual stress of turned specimen was -693.7MPa. The depth of the turned residual stress field was 100μm. The surface compressive residual stress of the LPBed specimen was -298.7MPa. The maximum compressive residual stress of LPBed specimen was measured at 50μm from surface with the value of -1093MPa (57.6% increasing compared with turned specimen). The depth of the LPBed residual stress field of was 350μm.
Surface integrity affects the LCF life by altering actual stress applied on the LCF specimens [
3,
25]. Stress concentration, caused by surface roughness, increases the surface stress, which in turn reduces the LCF life of specimen [
26]. The stress concentration field depth of the turned specimen was calculated using FEM, as shown in
Figure 13. The multi-notch model was established according to the turning surface topography. Material mechanical parameters of Inconel 718 are shown in
Table 1. The model was meshed using CPE4R. The size of fine meshes was 0.01mm. Fixed constraint was applied to the right side of the model, and load was applied to the left side. Microscopic morphology of the turned surface could not be replicated by FEM, so the surface roughness stress concentration coefficient was corrected using the Arola model [
27], as shown in Eq. (2).
where
Ra is the arithmetic mean deviation,
ρ is the radius of the arc at notch bottom, and
Rz is the maximum height. The surface roughness parameters of turning process are shown in
Table 4. The stress concentration coefficient of the turned surface roughness was 1.72, and the depth of the stress concentration field was 40μm.
The actual stress of specimens considering surface integrity is expressed as Eq. (3).
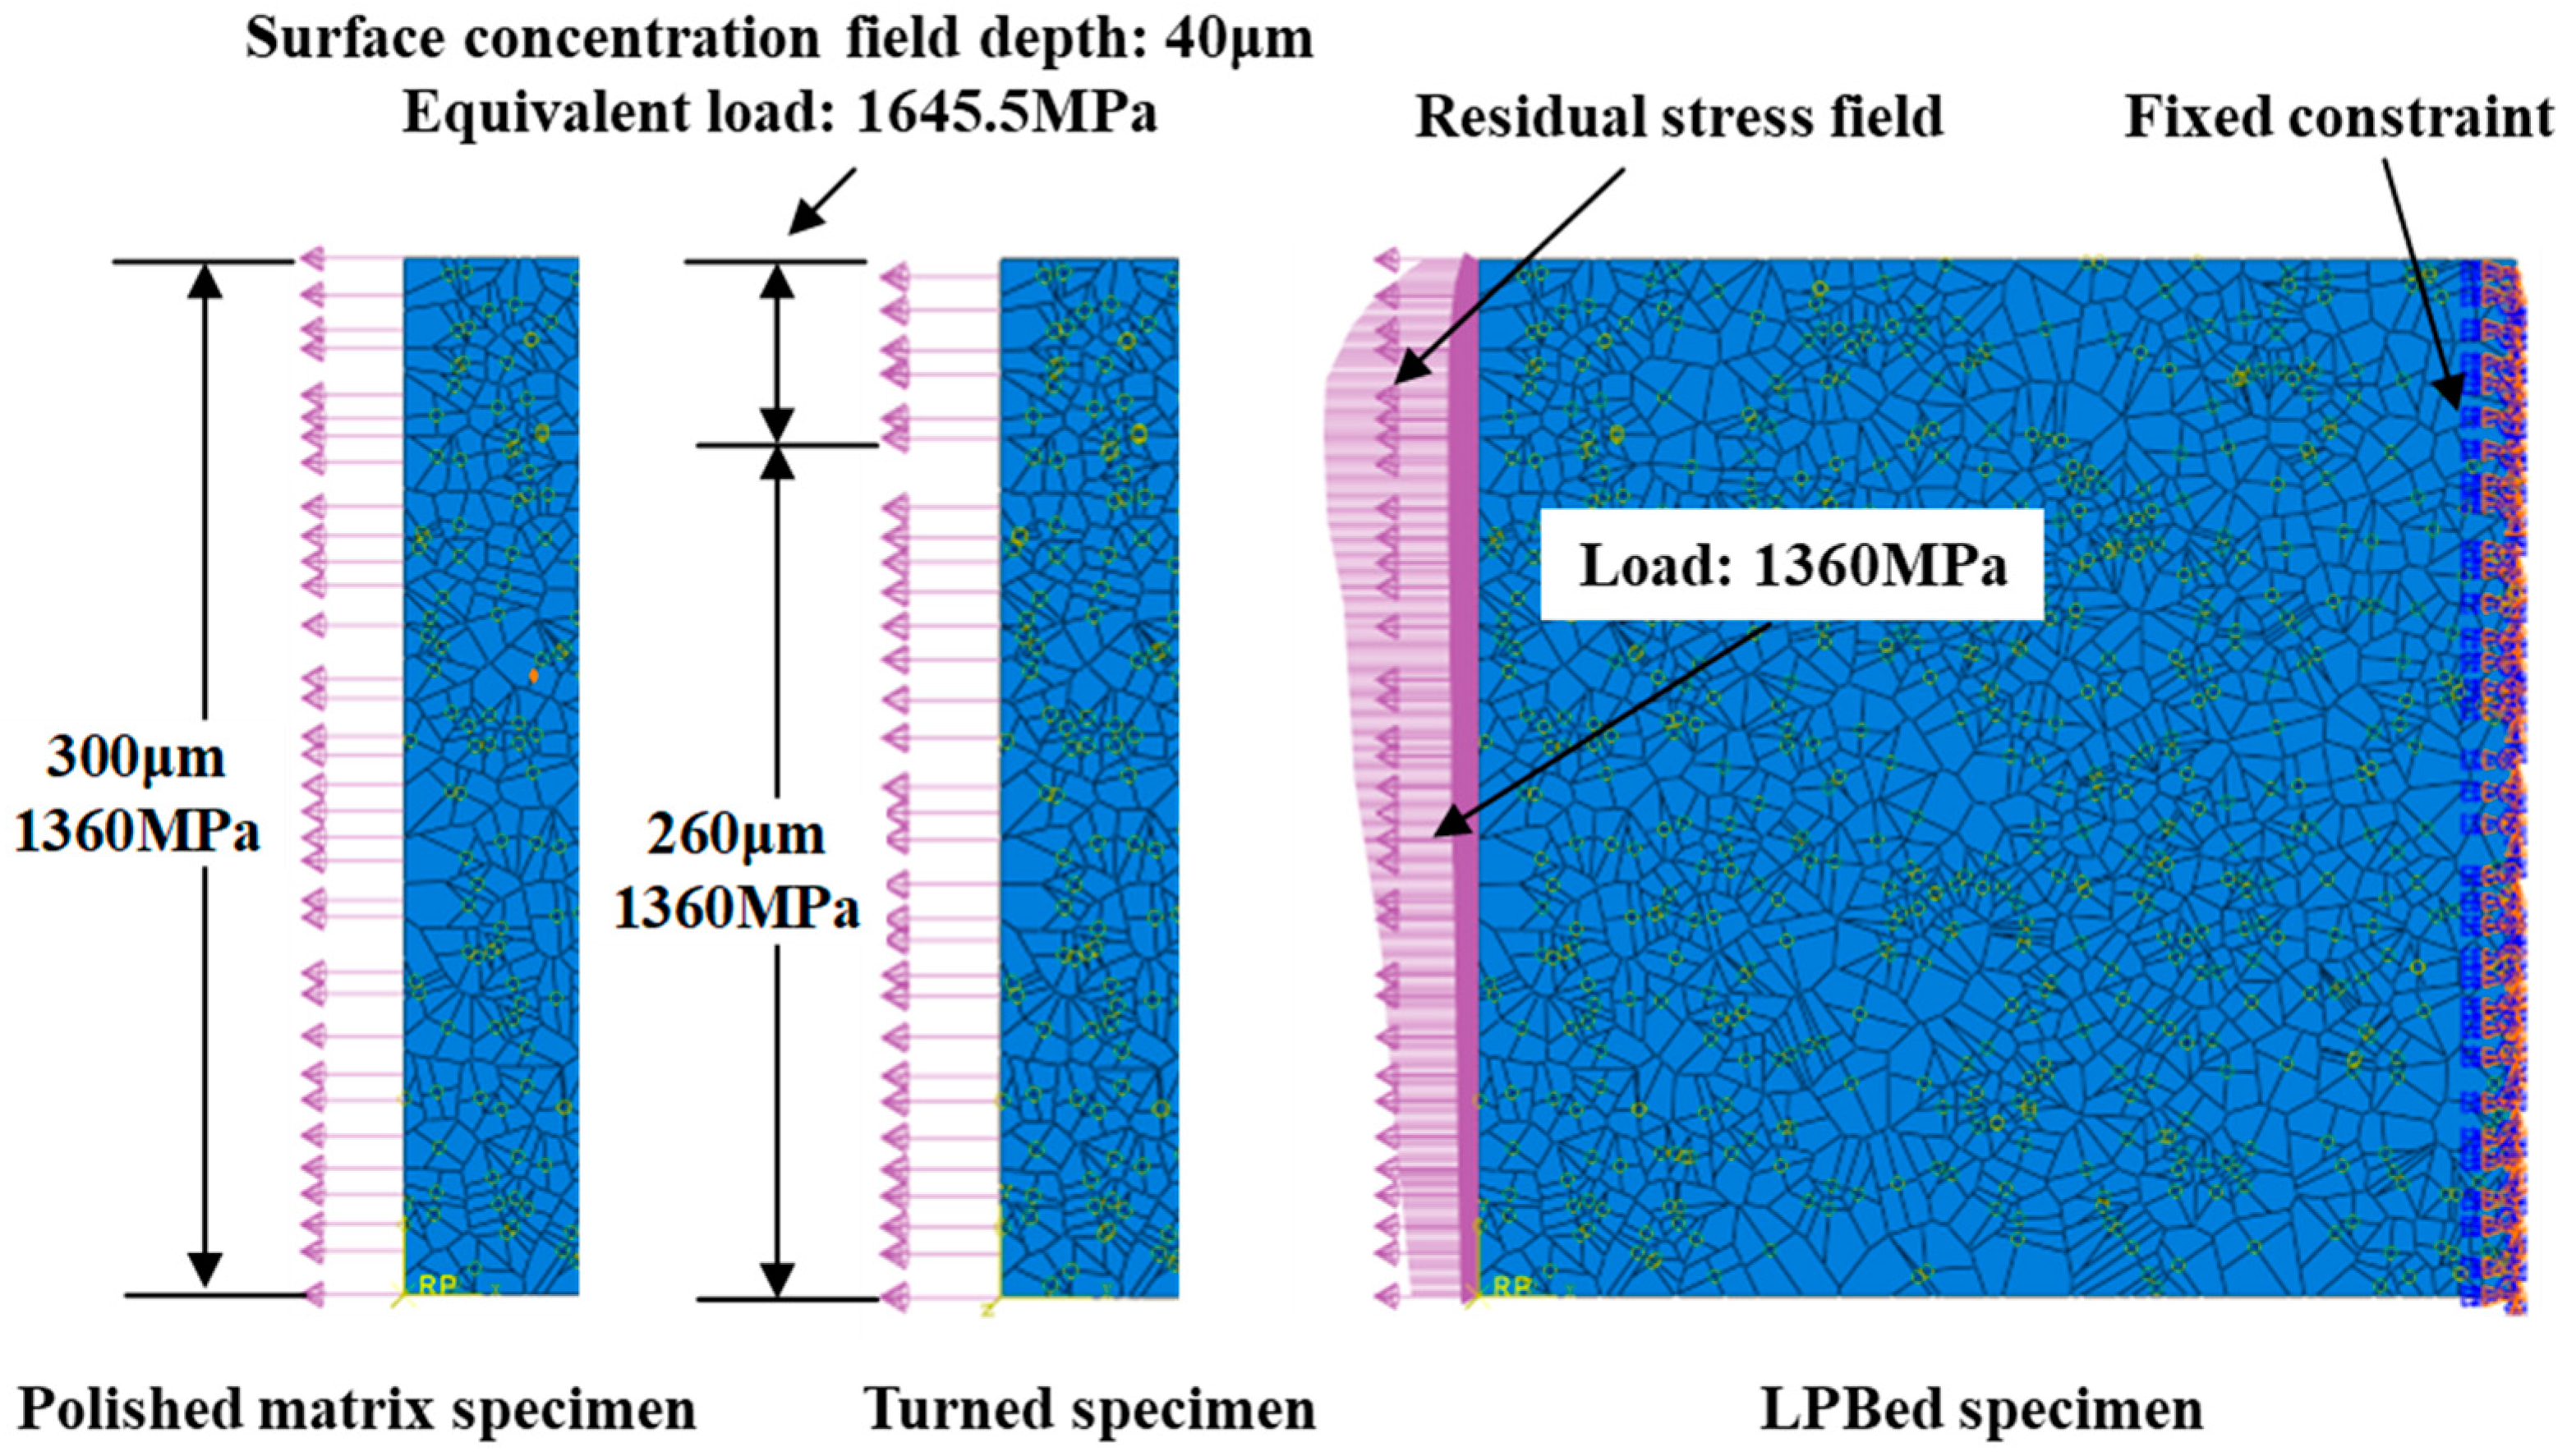
The actual stress on the turned specimen surface was 1645.5 MPa, and 1360 MPa internal the specimen. The compressive residual stress was applied to the LPBed specimen according to the measurement result shown in
Figure 12. The boundary conditions of polished matrix, turned and LPBed RVE model are shown in
Figure 14.
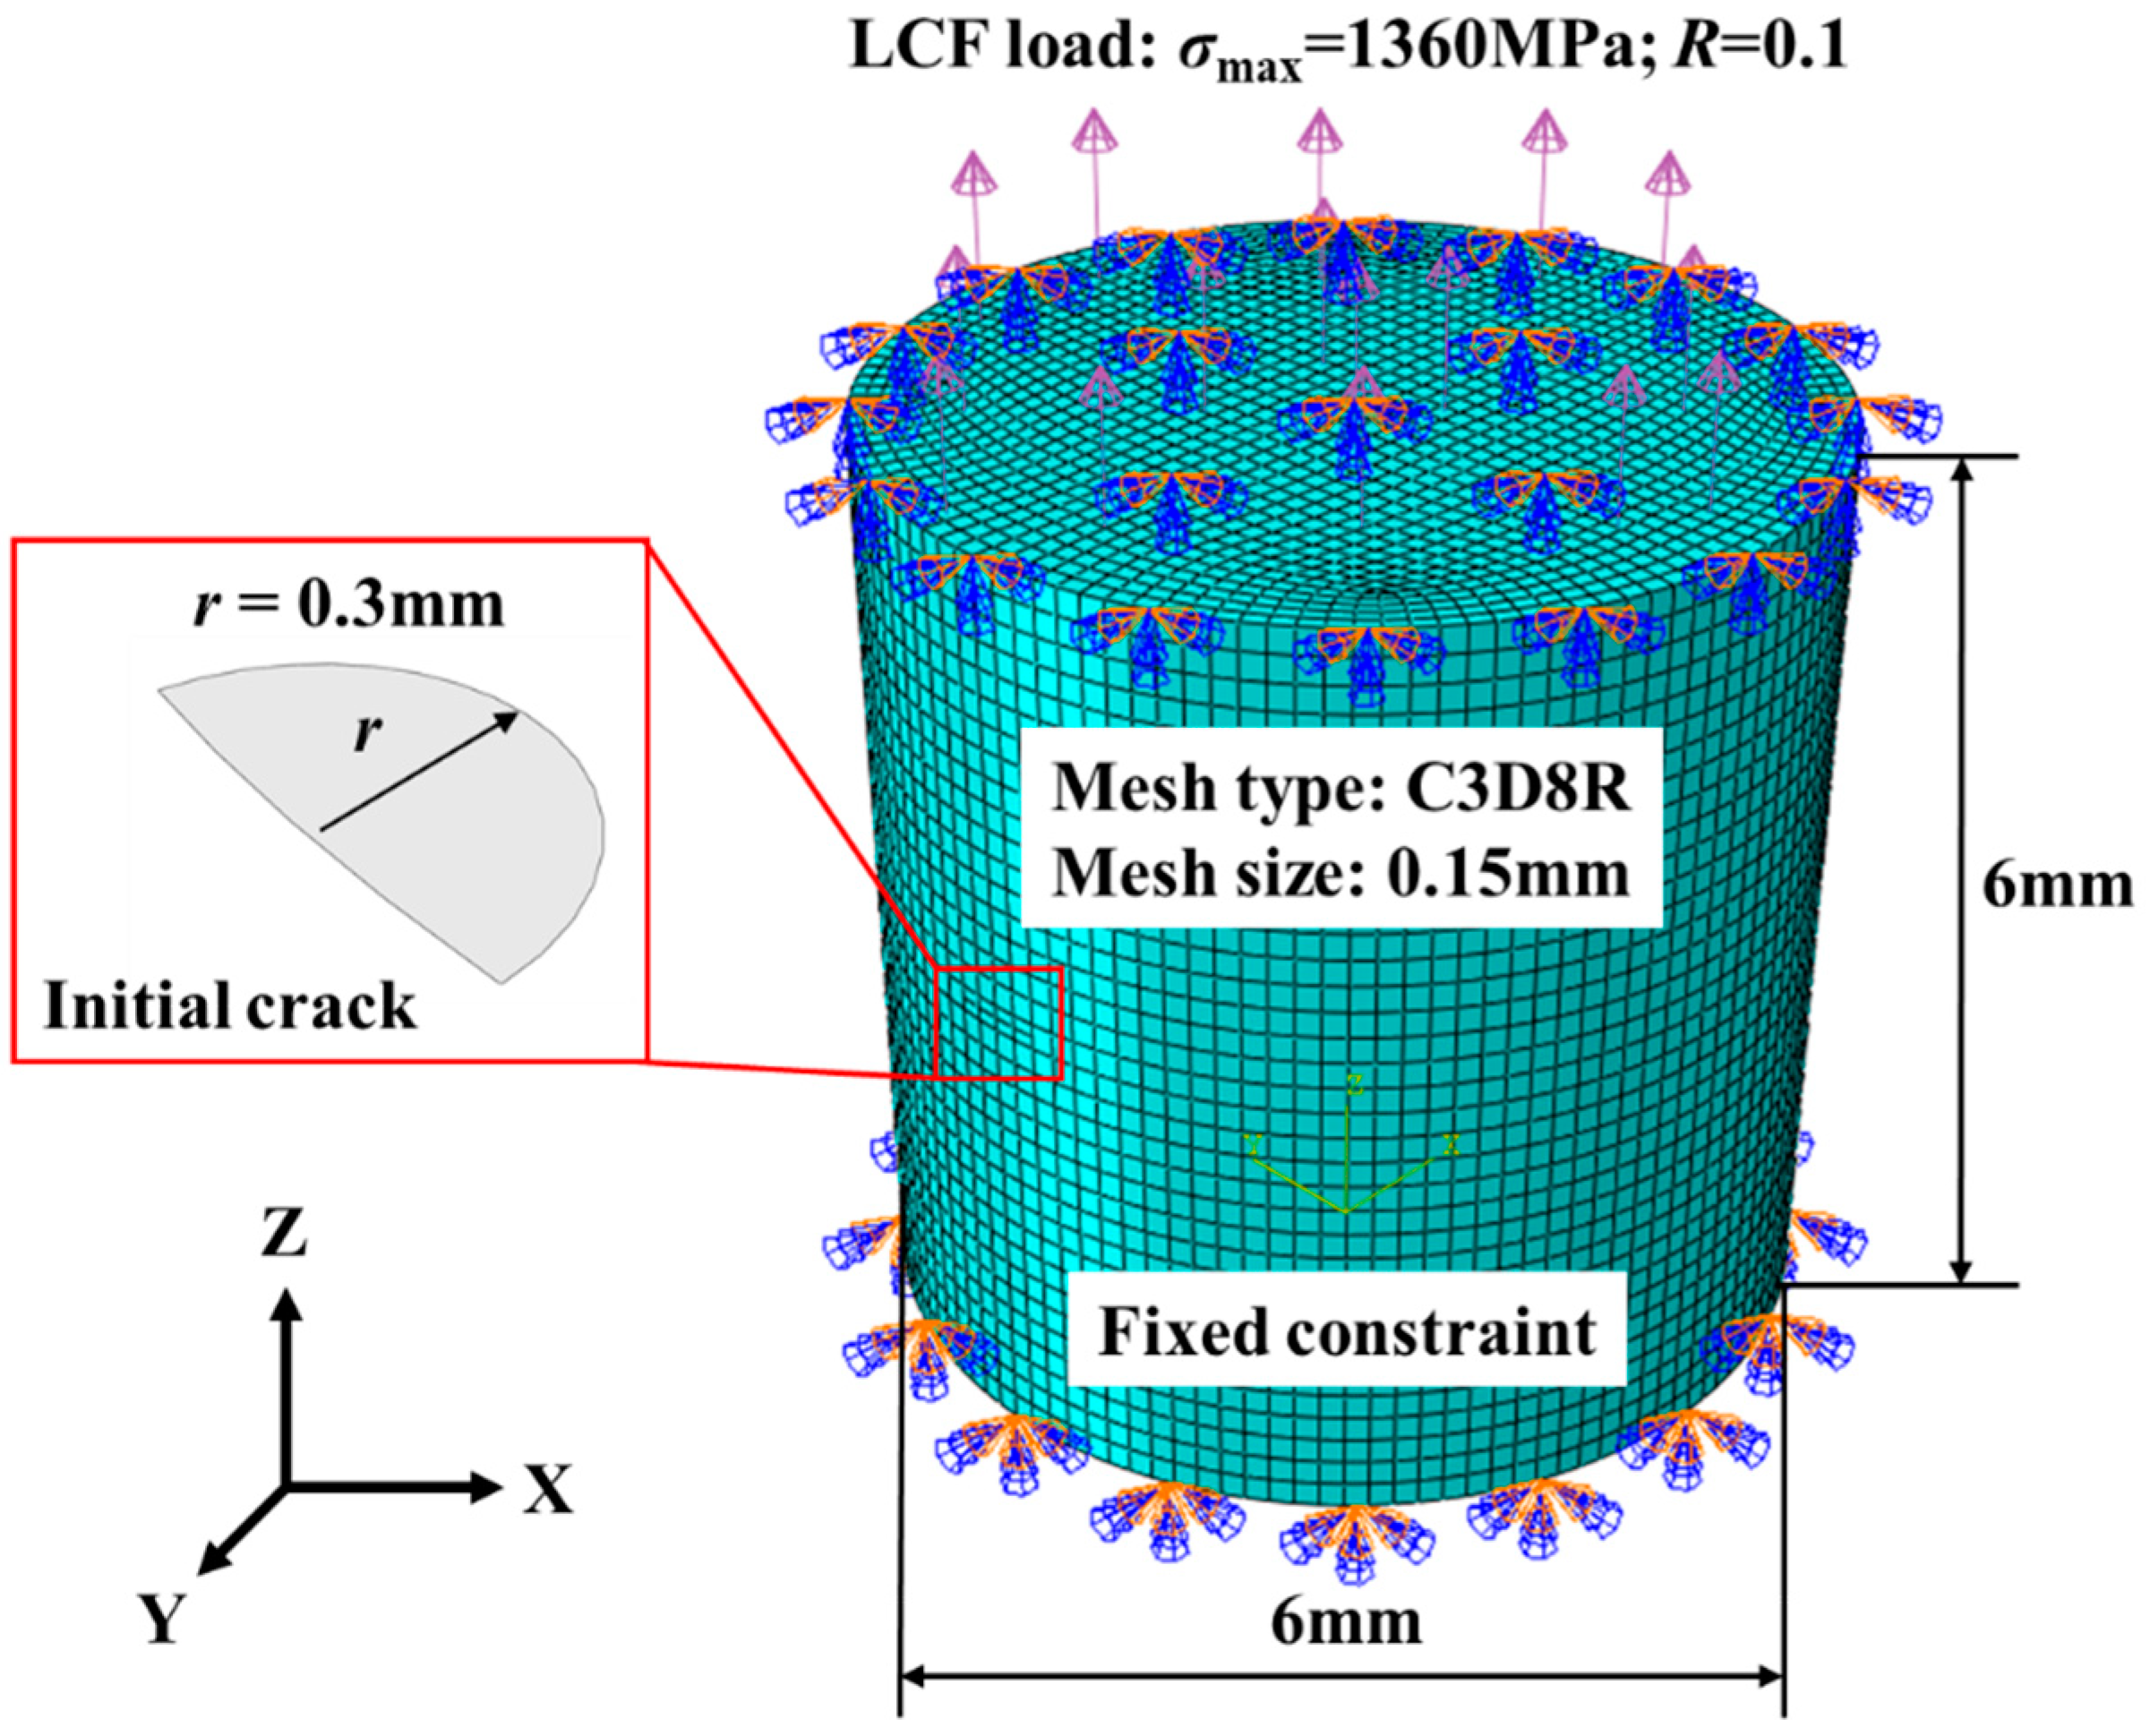
The crack propagation life of the specimens was predicted using the XFEM finite method. The 3D XFEM model was established based on the fatigue specimen structure, as shown in
Figure 15. The initial crack with smooth curve front was formed after the crack initiation stage [
28]. The semi-circular crack with the radius of 0.3mm was set up in middle of the model. Hexahedral meshes are the only suitable mesh for XFEM. The model was meshed using C3D8R with the size of 0.15mm to ensure convergence of XFEM simulation. The material parameters of Inconel 718 crack extension finite element analysis are shown in
Table 5. The cyclic loading analysis step was used to simulate LCF cyclic loading process. Fixed constraint was set on the bottom of the model. The freedom of the upper surface was constrained except z-direction displacement. Sinusoidal load was applied to the model. The maximum load
σmax=1360 MPa, stress ratio
R=0.1. The LCF load spectrum is shown in
Figure 16.
4. Result and discussion
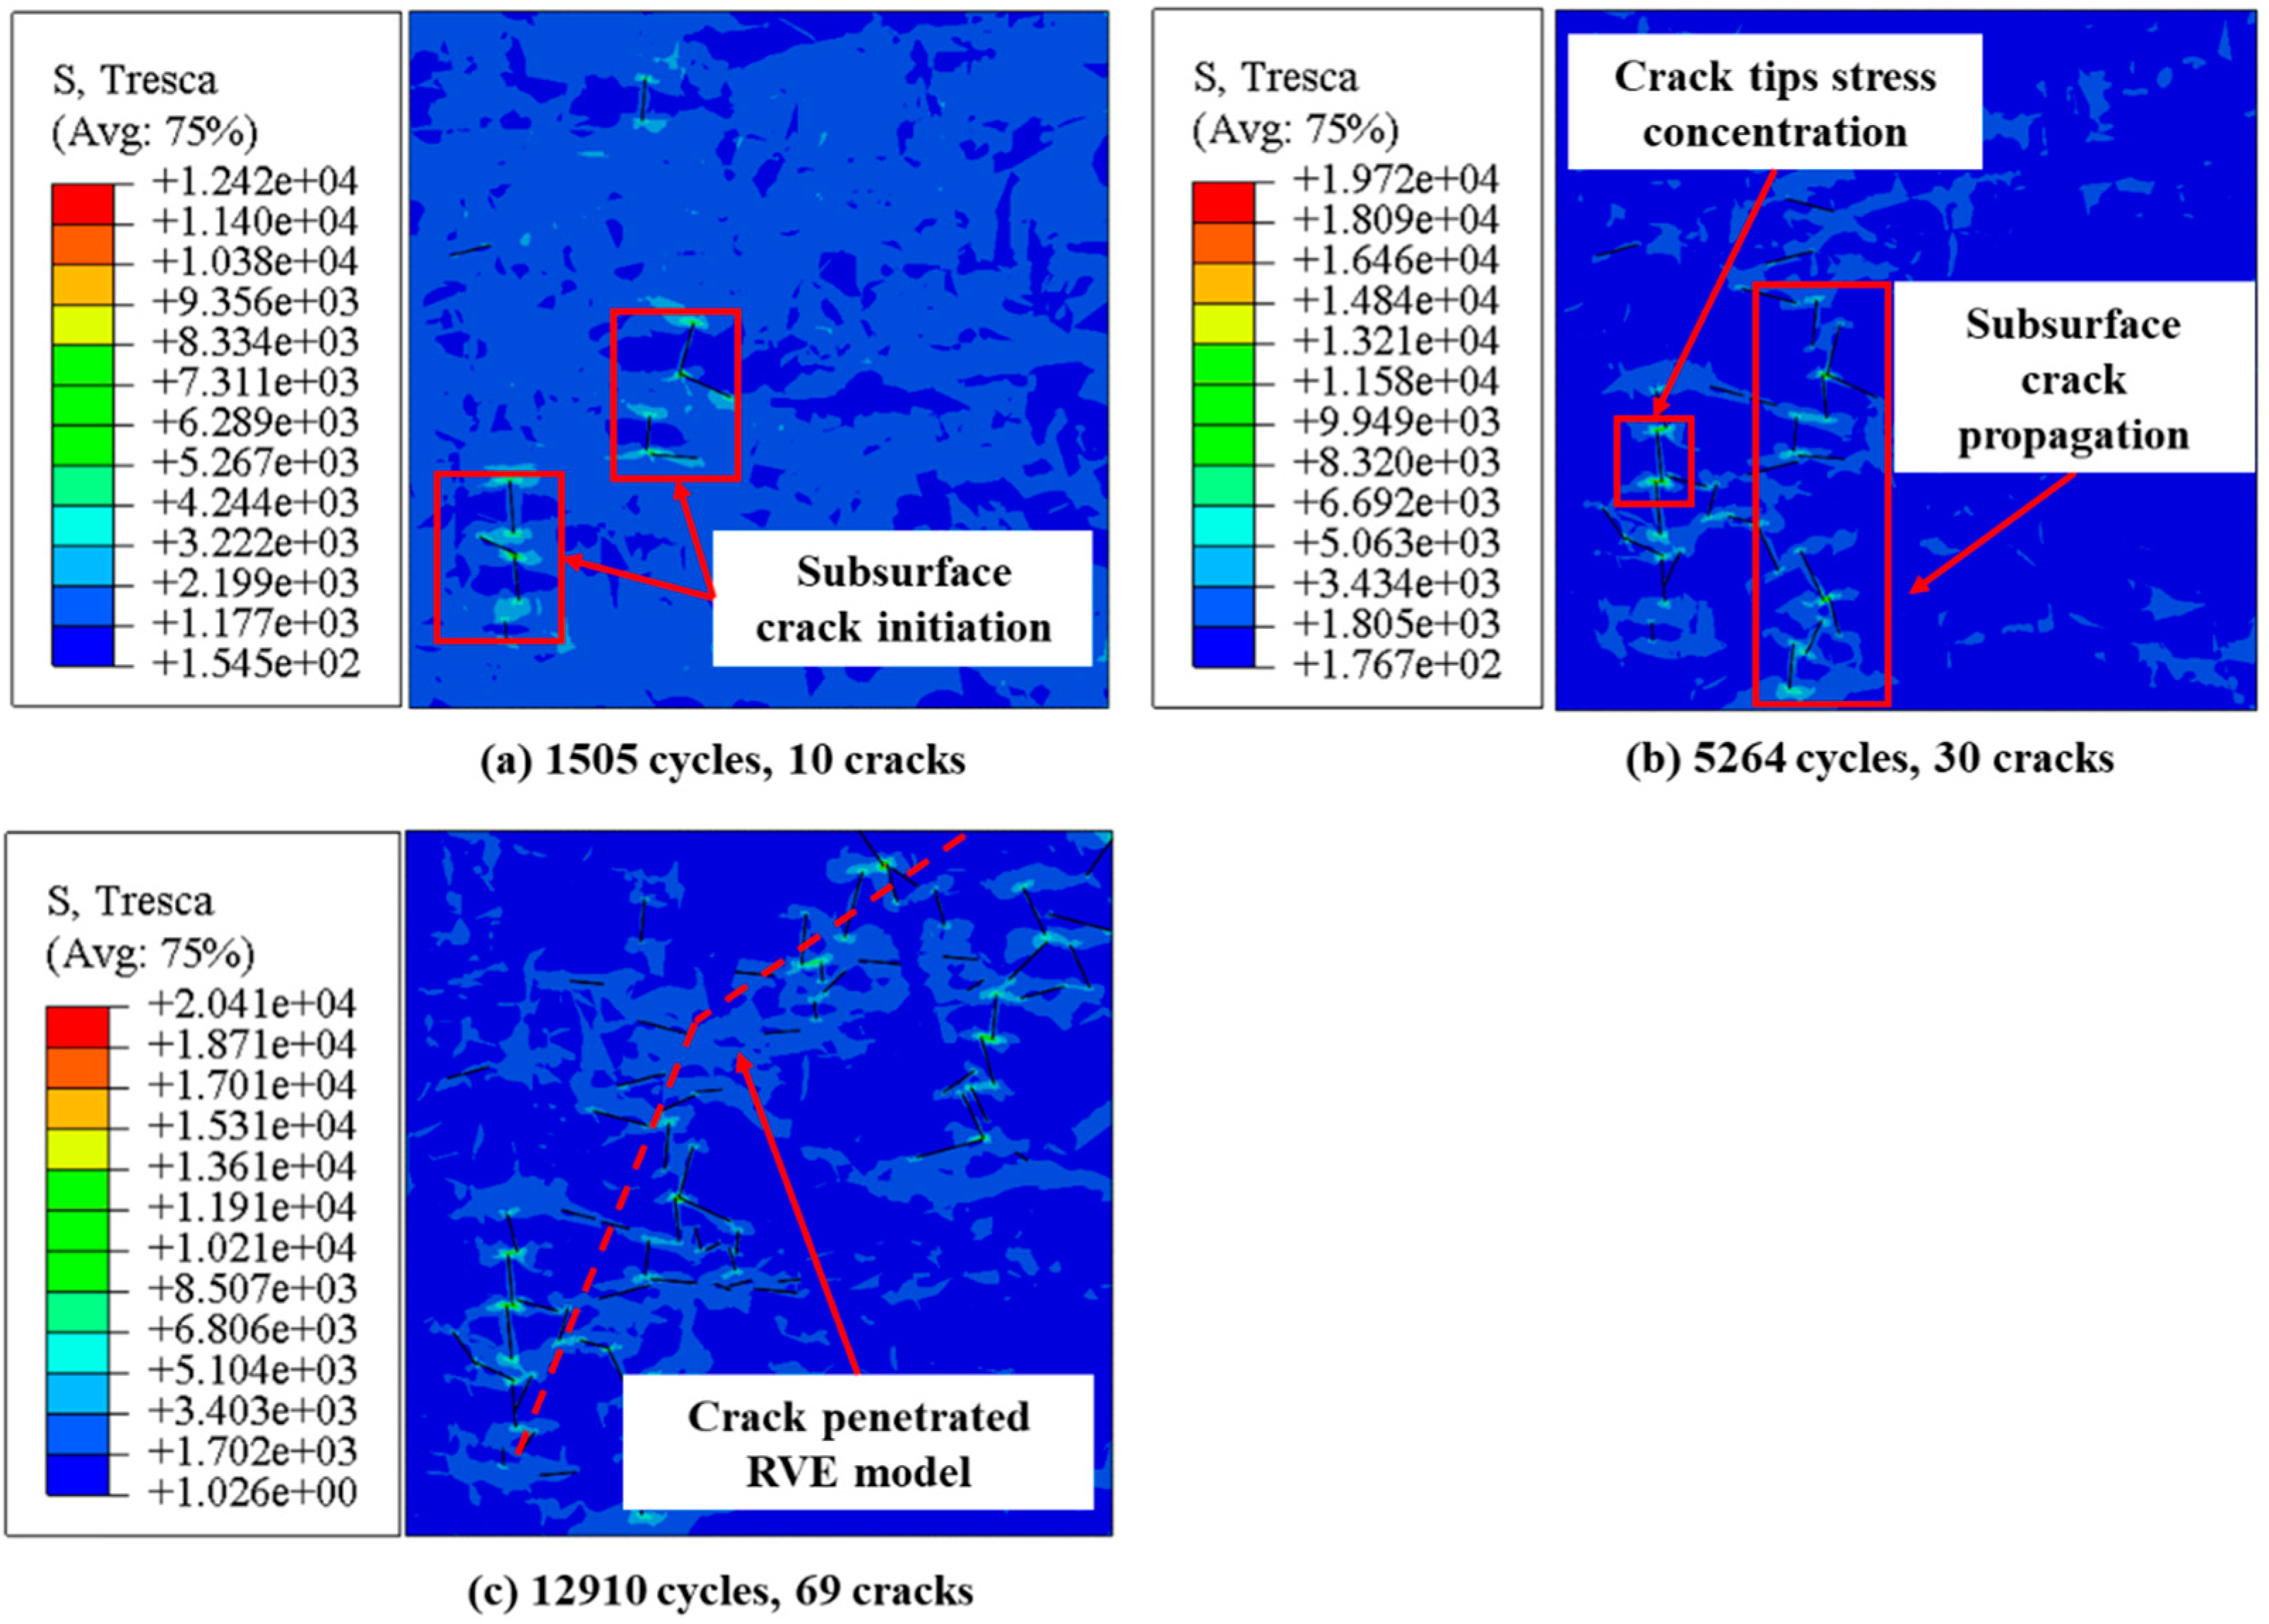
The crack initiation process of the polished matrix specimen simulated using FEM is shown in
Figure 17. Microcracks initiated in subsurface grains when loaded after 1505 cycles as shown in
Figure 17 (a). It is attributed to the absence of surface stress concentration on polished matrix specimen surface. The microcracks gathered and propagated to the surface with load proceeding as shown in
Figure 17 (b). The microcracks penetrated the RVE model after 12910 cycles as shown in
Figure 17 (c). The predicted crack initiation life for the polished matrix specimen was 9718 cycles.
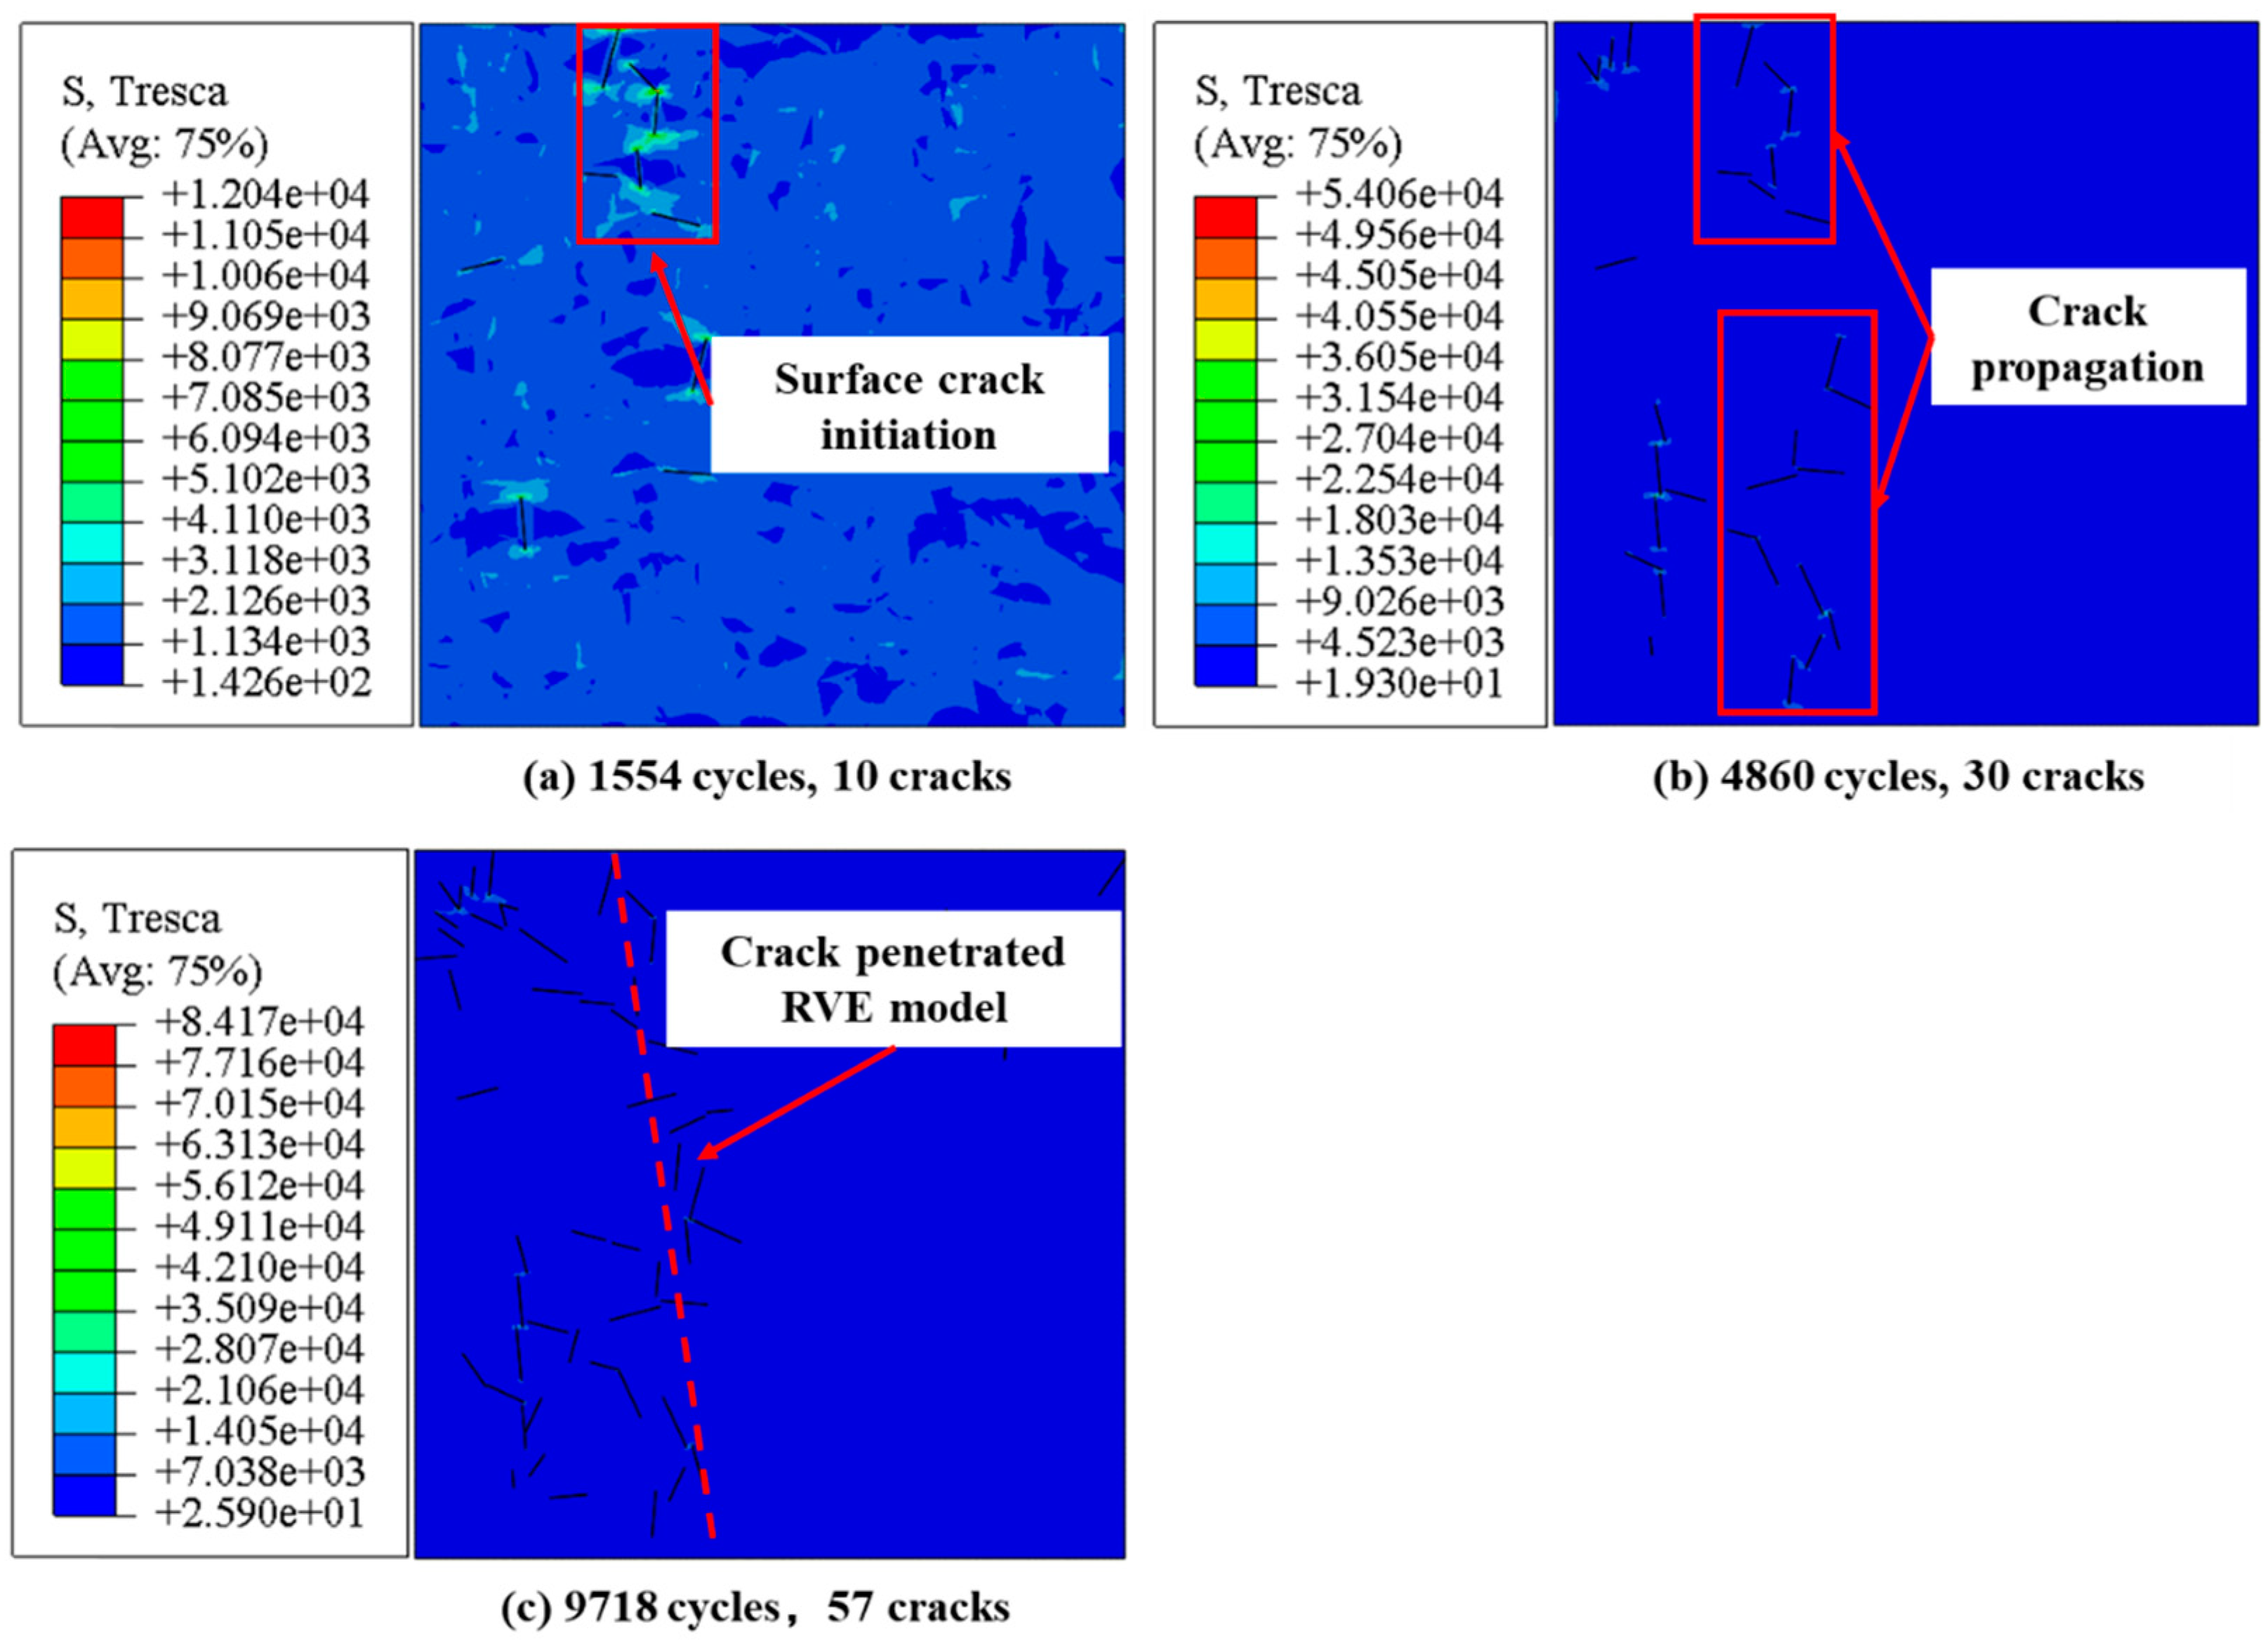
The crack initiation process of turned specimen simulated using FEM is shown in
Figure 18. As shown in
Figure 18 (a), microcracks initiated in the surface grains of turned specimen at 1554 cycles. The rapid crack initiation at the turned surface was attributed to the stress concentration induced by surface roughness. The actual stress on turned surface was much higher than the stress in substrate. As shown in
Figure 18 (b), the microcracks initiated in both of the surface and subsurface, indicating that the compressive residual stress of the turned specimen was insufficient to inhibit crack initiation inside the specimen. The two microcracks merged and penetrated the RVE model at 9718 cycles as depicted in
Figure 18 (c). The predicted crack initiation life of turned specimen was 9718 cycles.
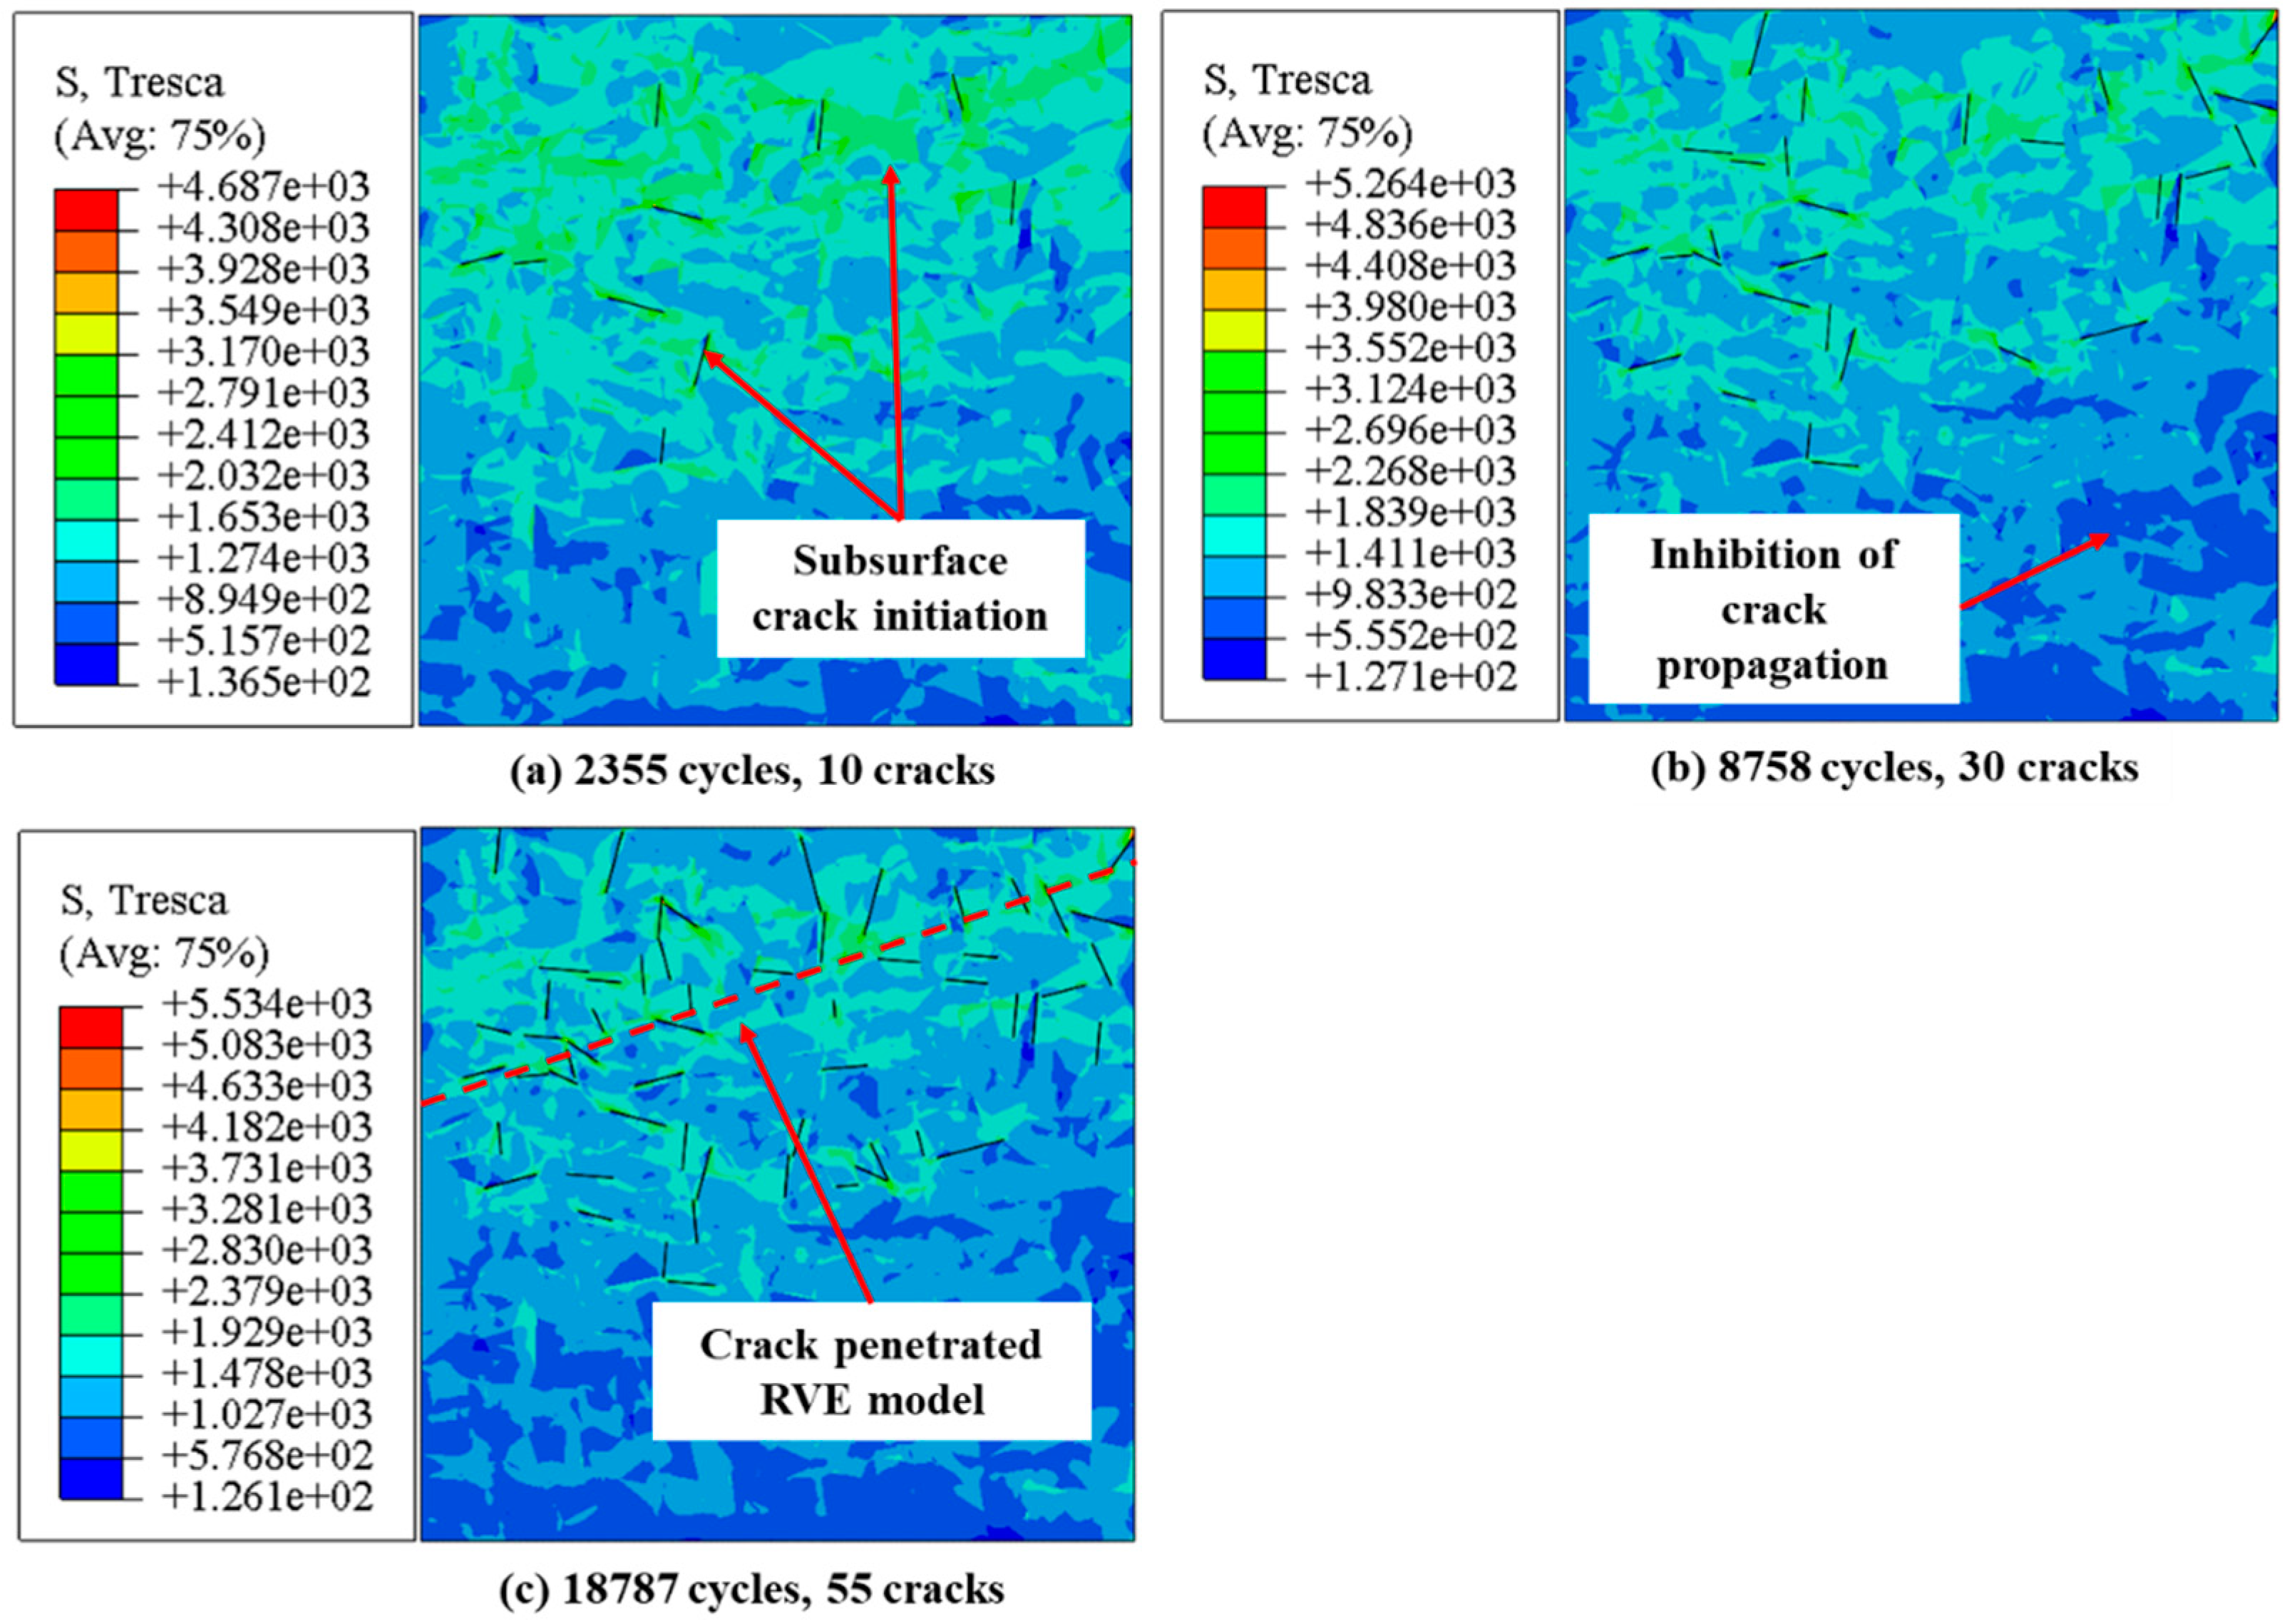
The crack initiation process of the LPBed specimen was simulated using FEM shown in
Figure 19. Microcracks were initiated in the subsurface layer of the LPBed specimen at 2355 cycles as shown in
Figure 19 (a). It is attributed to the low surface roughness and compressive residual stress field induced by the LPB process. The microcracks extended slowly within the LPBed specimen. The compressive residual stress delayed microcrack propagating to surrounding grains by mitigating the stress at the microcrack tips. The surface microcracks merged into the main crack penetrating the RVE model at 18787 cycles. The predicted crack initiation life of the LPBed specimen was 18787 cycles.
The XFEM model predicted crack propagation life is shown in
Figure 20. The crack extended slowly perpendicular to the load at the beginning of the crack propagation stage. It was due to the lower intensity factor. As the crack length increased, the crack propagation accelerated with the stress intensity factor increasing. The shear lip formed at the end of the crack propagation was attributed to ductile fracture. The XFEM predicted crack propagation life
Np of Inconel 718 was 477.
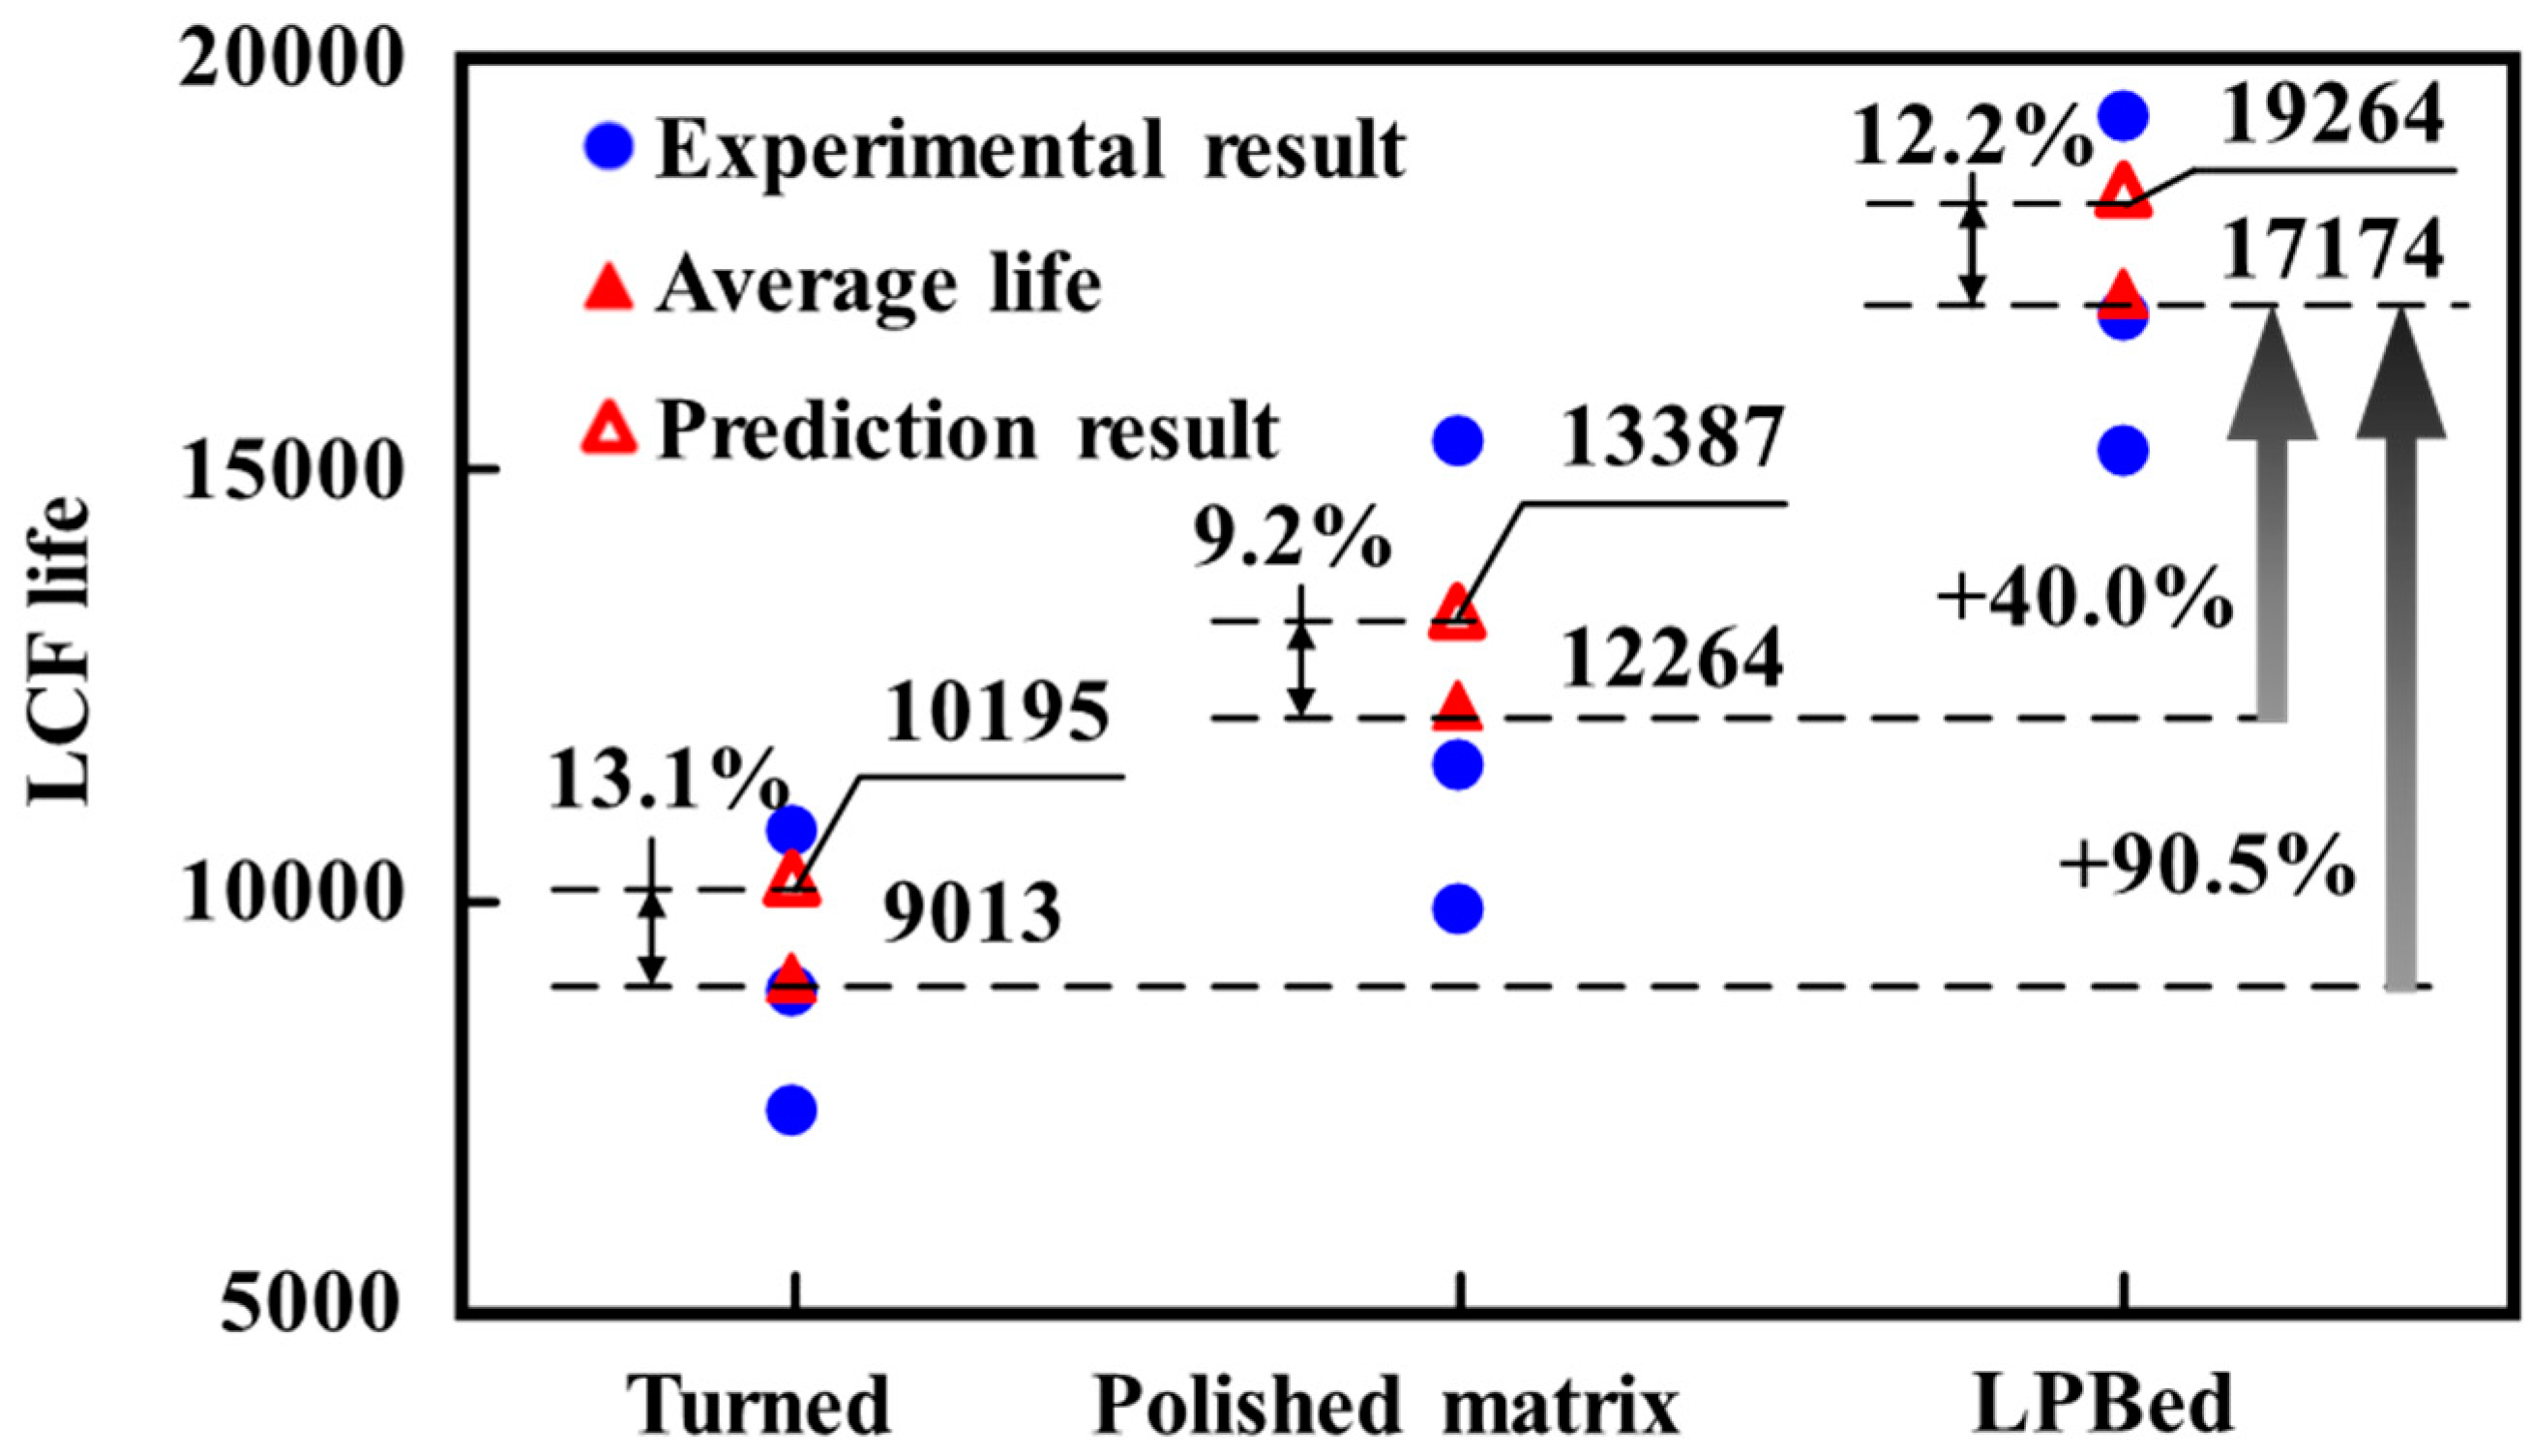
The experimental and FEM predicted results of Inconel 718 LCF life are shown in
Figure 21. The average experimental LCF life of the polished matrix specimen was 12264 cycles. The turned specimen exhibited the lowest average experimental LCF life (9013 cycles), which decreased by 26.5% compared with the polished matrix specimen. It was due to the surface stress concentration induced by turned surface roughness. The average experimental LCF life of the LPBed specimen was the highest (17174 cycles), which increased by 40.0% and 90.5% compared with the polished matrix and turned specimen, respectively. It was attributed to the deep compressive residual stress field and low surface roughness induced by the LPB process, which reduced the stress on the specimen surface.
The Inconel 718 LCF life predicted by micro-macro FEM model was calculated as to equation (4).
where
Ni,
Np and
Nf are the crack initiation life, crack propagation life and LCF life predicted by micro-macro FEM method.
The predicted LCF life of Inconel 718 was all located within the experimental life range. The respective errors between the prediction and experimental results of the turned specimen, polished matrix specimen, and LPBed specimen were 13.1%, 9.2%, and 12.2%. It suggested that the micro-macro FEM method based on crack initiation and propagation mechanisms can be used to predict the LCF life of Inconel 718 with different surface integrity. The micro-macro FEM method predicted LCF life was slightly higher than the experimental results. The overestimation of the LCF life was due to the fact that the grain boundary crack was not considered in FEM model.
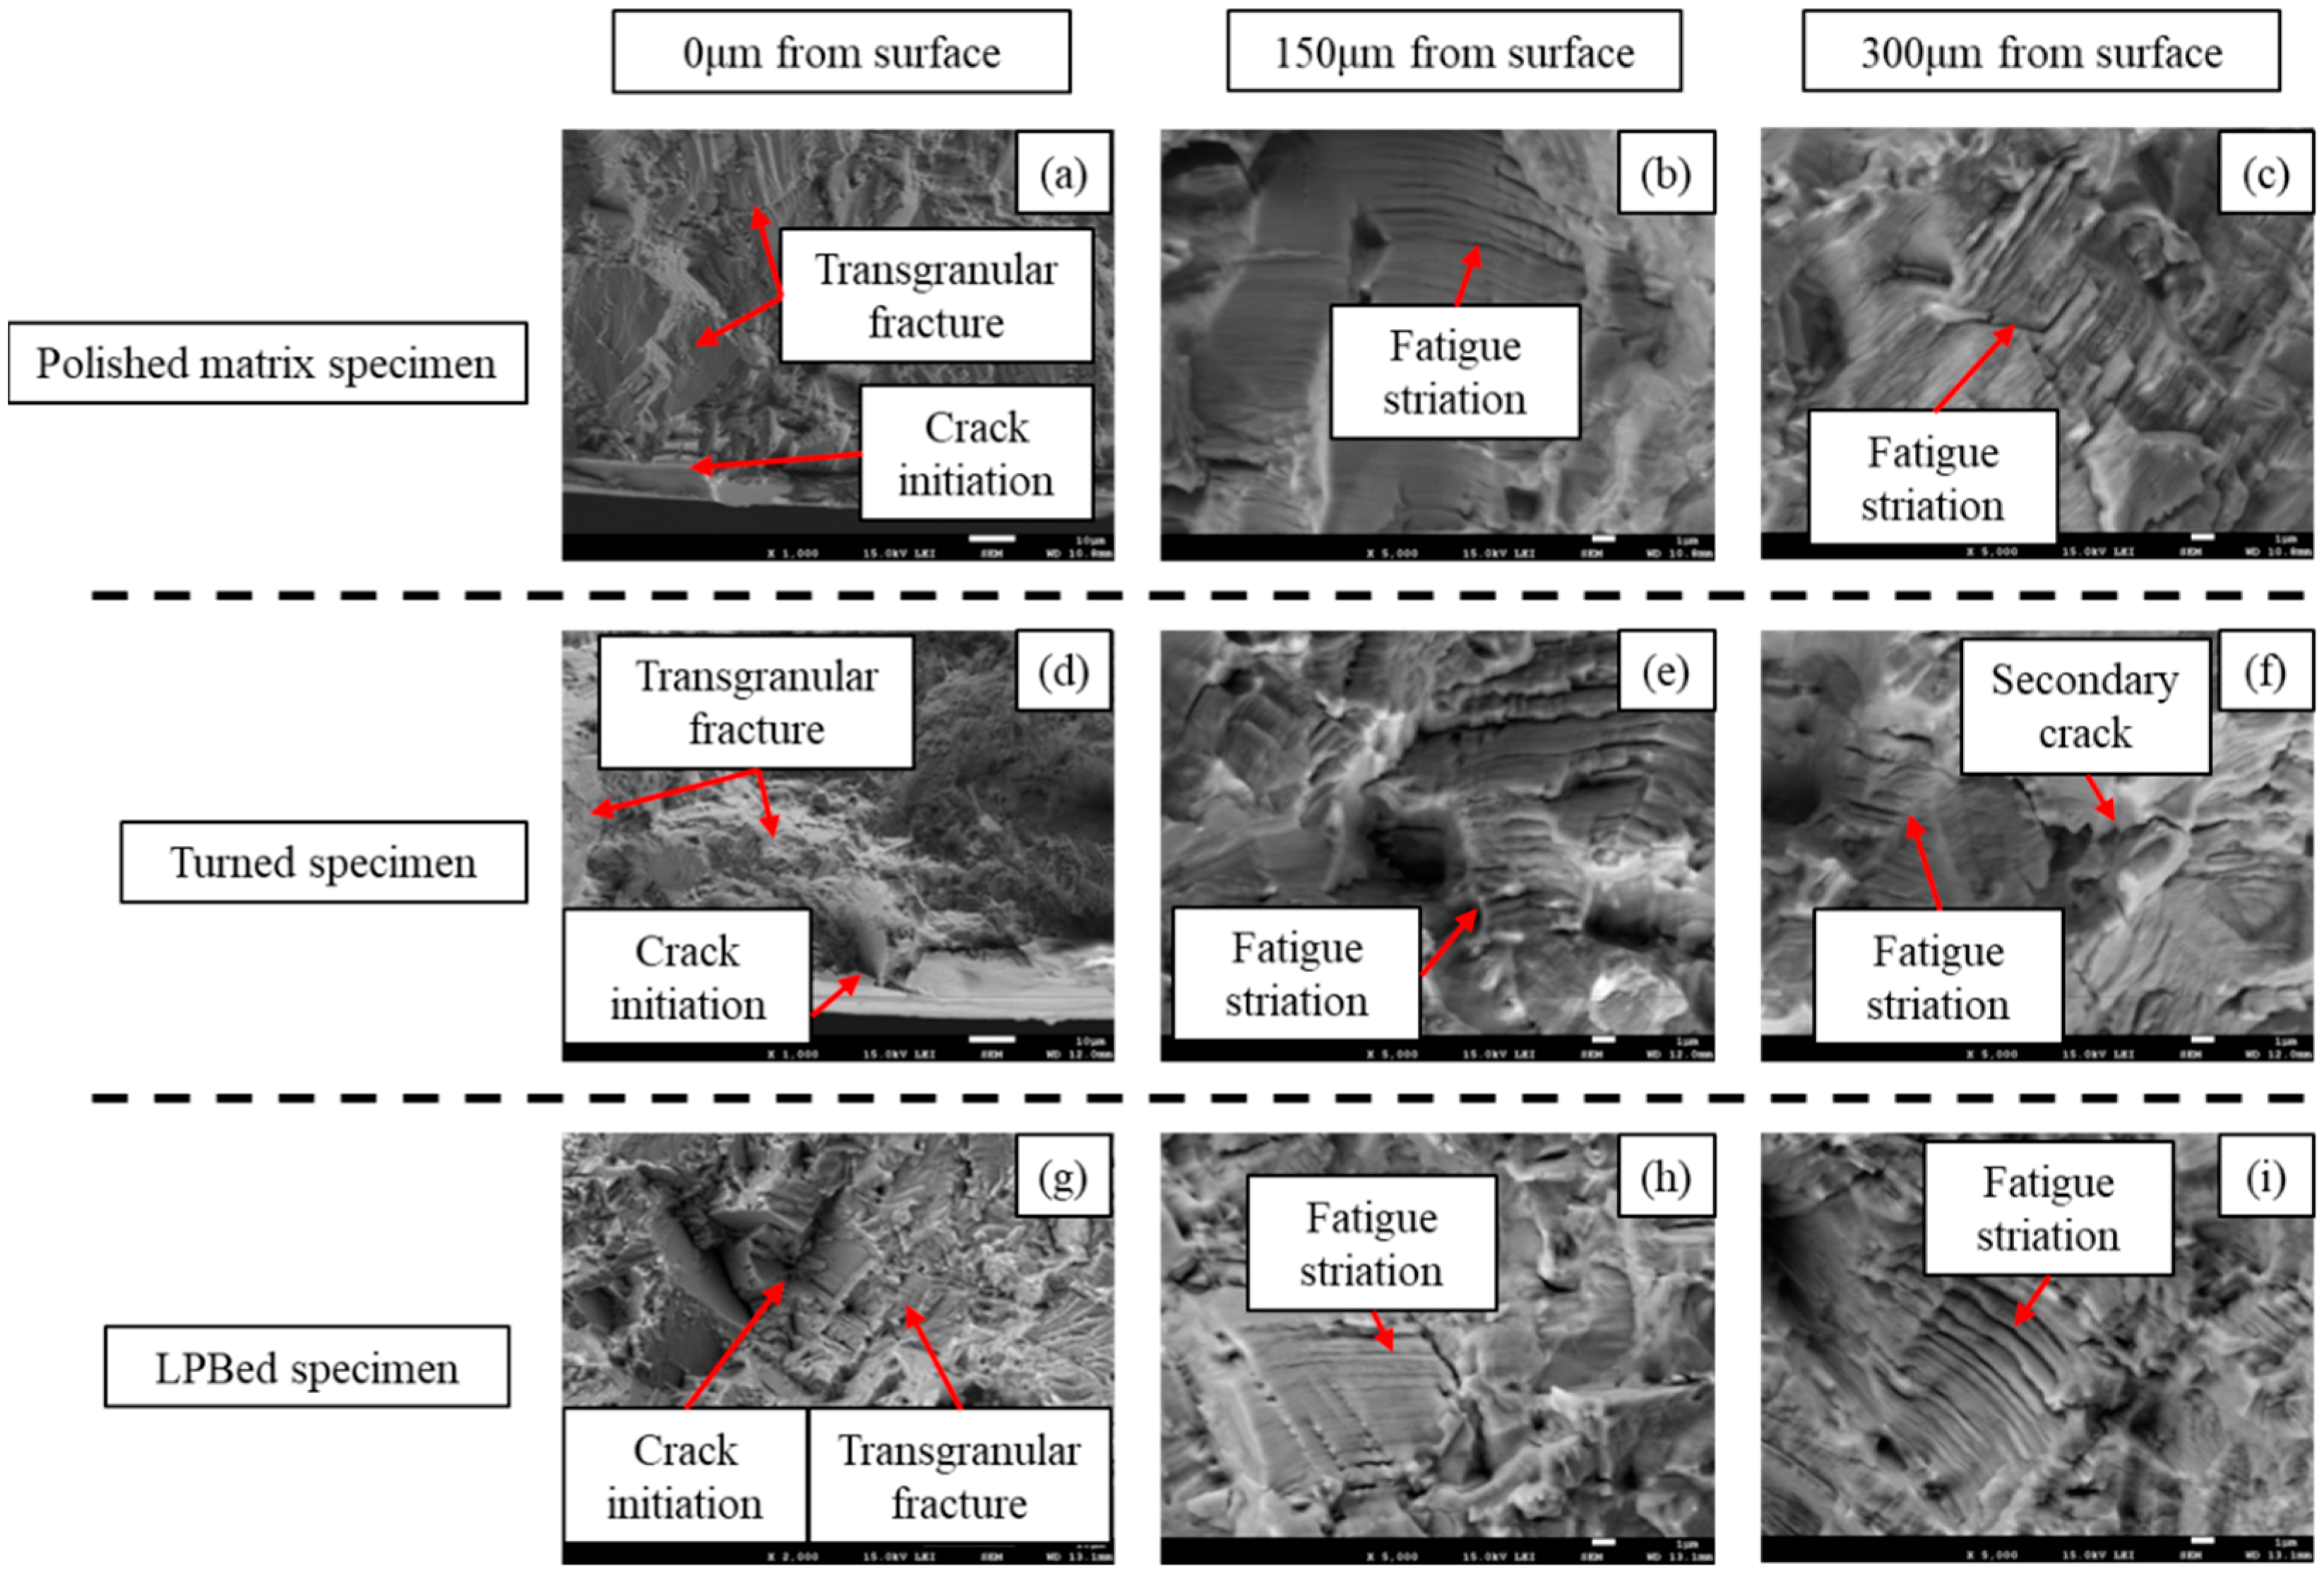
Fracture morphology of the polished matrix specimen, turned specimen and LPBed specimen is shown in
Figure 22. The fracture morphology of the polished matrix specimen is shown in
Figure 22 (a)-(c). The fatigue crack initiated on the surface of the polished matrix specimen as shown in
Figure 22 (a). The transgranular fracture was observed at the crack initiation area. It is due to the lower surface stress concentration of the polished surface. The transgranular fracture and fatigue striation were observed at 150μm from surface as shown in
Figure 22 (b). The crack propagation rate was calculated as 0.43μm per cycle by measuring fatigue striation per micron. The propagation rate increased to 0.80μm per cycle at 300μm from the surface as shown in
Figure 22 (c). It is due to the increment of the stress intensity factor with the crack propagating.
The fracture morphology of the turned specimen is shown in
Figure 22 (d)-(f). As shown in
Figure 22 (d), the fatigue cracks initiated at the surface tool marks, which is consistent with micro FEM simulation results. It was attribute to the high surface stress induced by stress concentration. As shown in
Figure 22 (e), fatigue streaks were observed at 150μm from turned surface. The crack propagation rate at 150μm of the turned specimen was measured at 0.57μm per cycle. The propagation rate increased to 0.67μm per cycle when the crack length grew to 300μm as shown in
Figure 22 (f).
The fracture morphology of LPBed specimen is shown in
Figure 22 (g)-(i). As shown in
Figure 22 (g), the crack was initiated at the subsurface of the LPBed specimen. The transgranular fracture and fatigue striation was observed at 150μm from the surface as shown in
Figure 22 (h). The LPBed specimens showed the densest fatigue striation compared with the other groups, and the crack propagation rate was calculated as 0.32μm per cycle. The surface crack initiation and propagation were delayed by the lower surface roughness and compressive residual stress field induced by LPB processing. The crack propagation rate at 300μm from surface was measured as 0.76μm per cycle as shown in
Figure 22 (i), which was similar to the other groups. It was due to the fact that the crack propagation was seldom affected by the surface integrity because the crack propagated beyond the surface integrity influence field.
Figure 1.
Crack initiation dislocation mechanism of Inconel 718.
Figure 1.
Crack initiation dislocation mechanism of Inconel 718.
Figure 2.
Research framework.
Figure 2.
Research framework.
Figure 3.
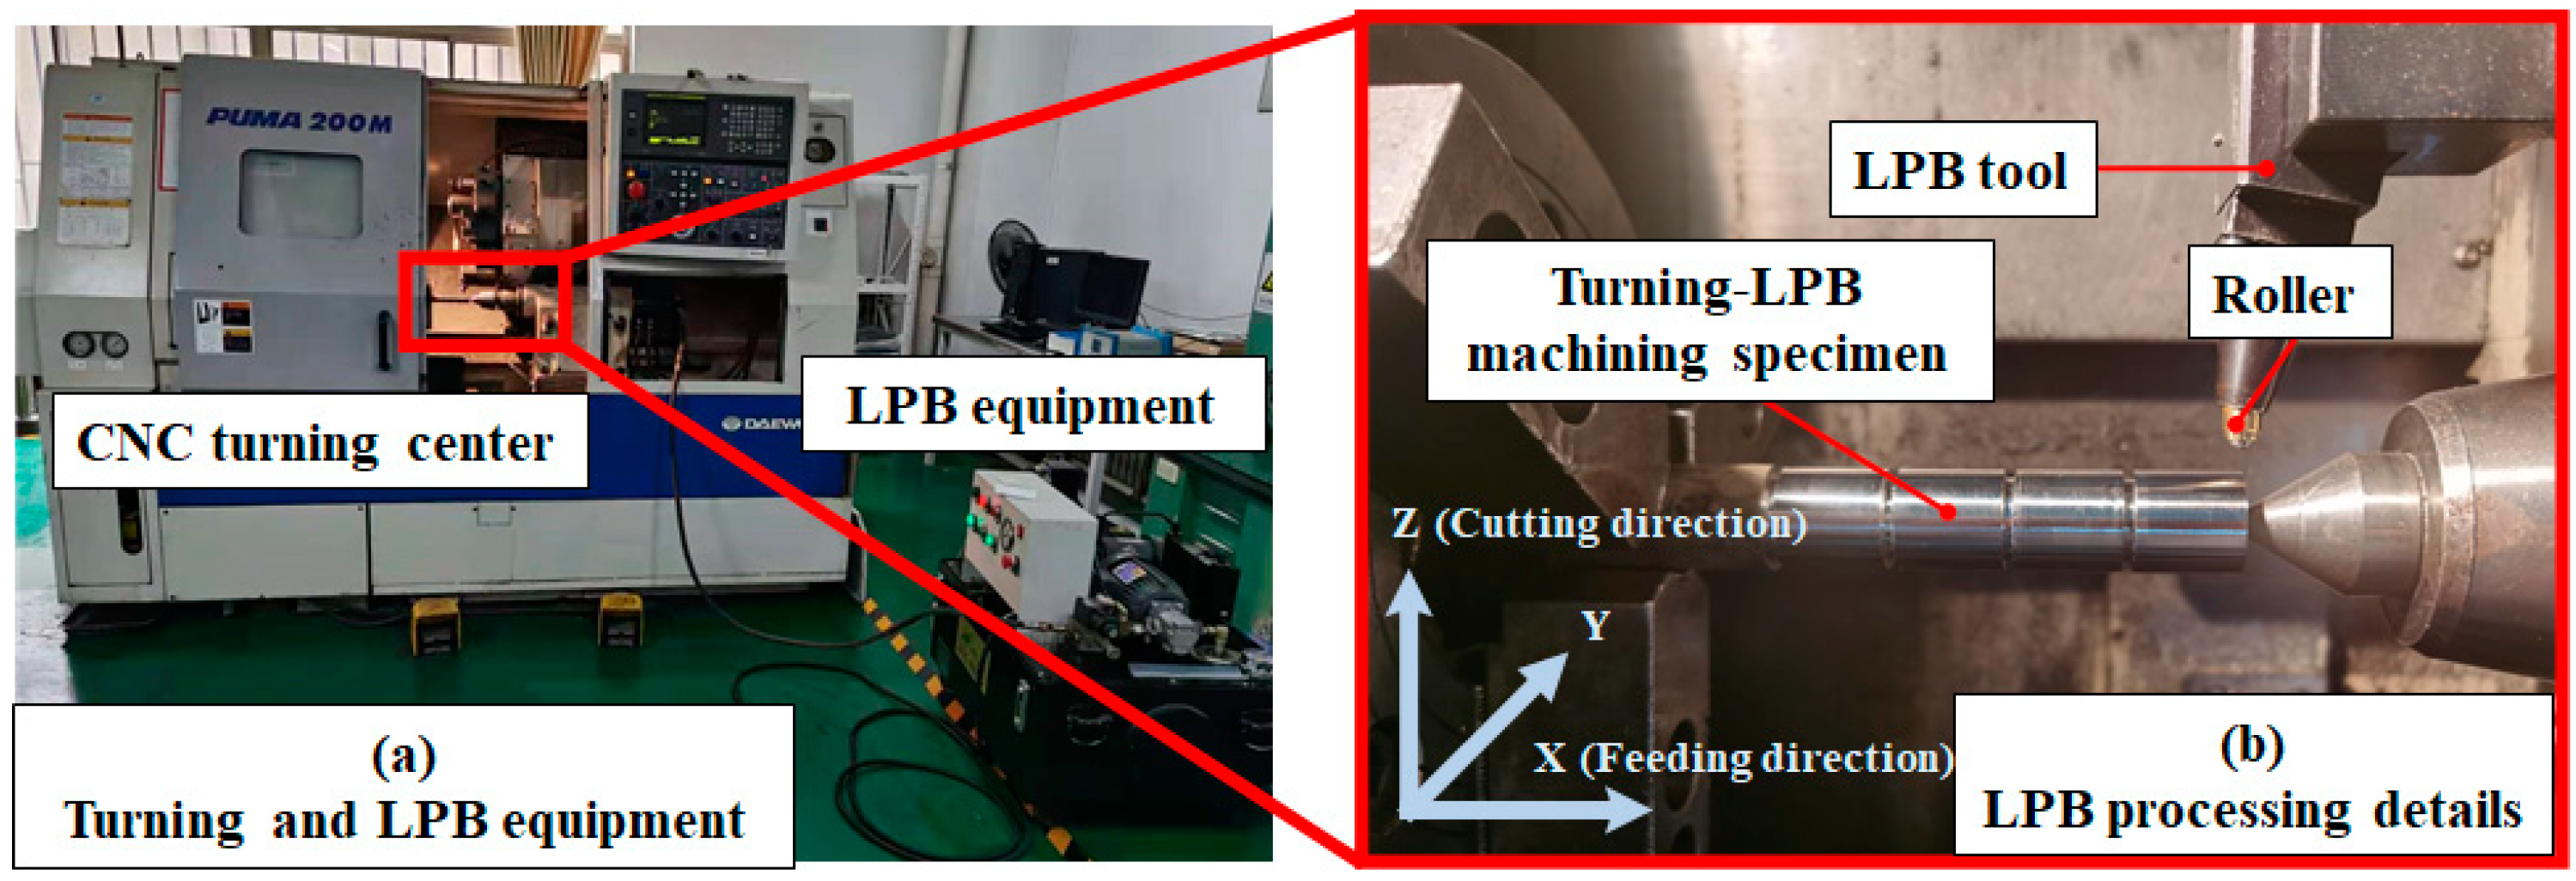
Turning and LPB process.
Figure 3.
Turning and LPB process.
Figure 4.
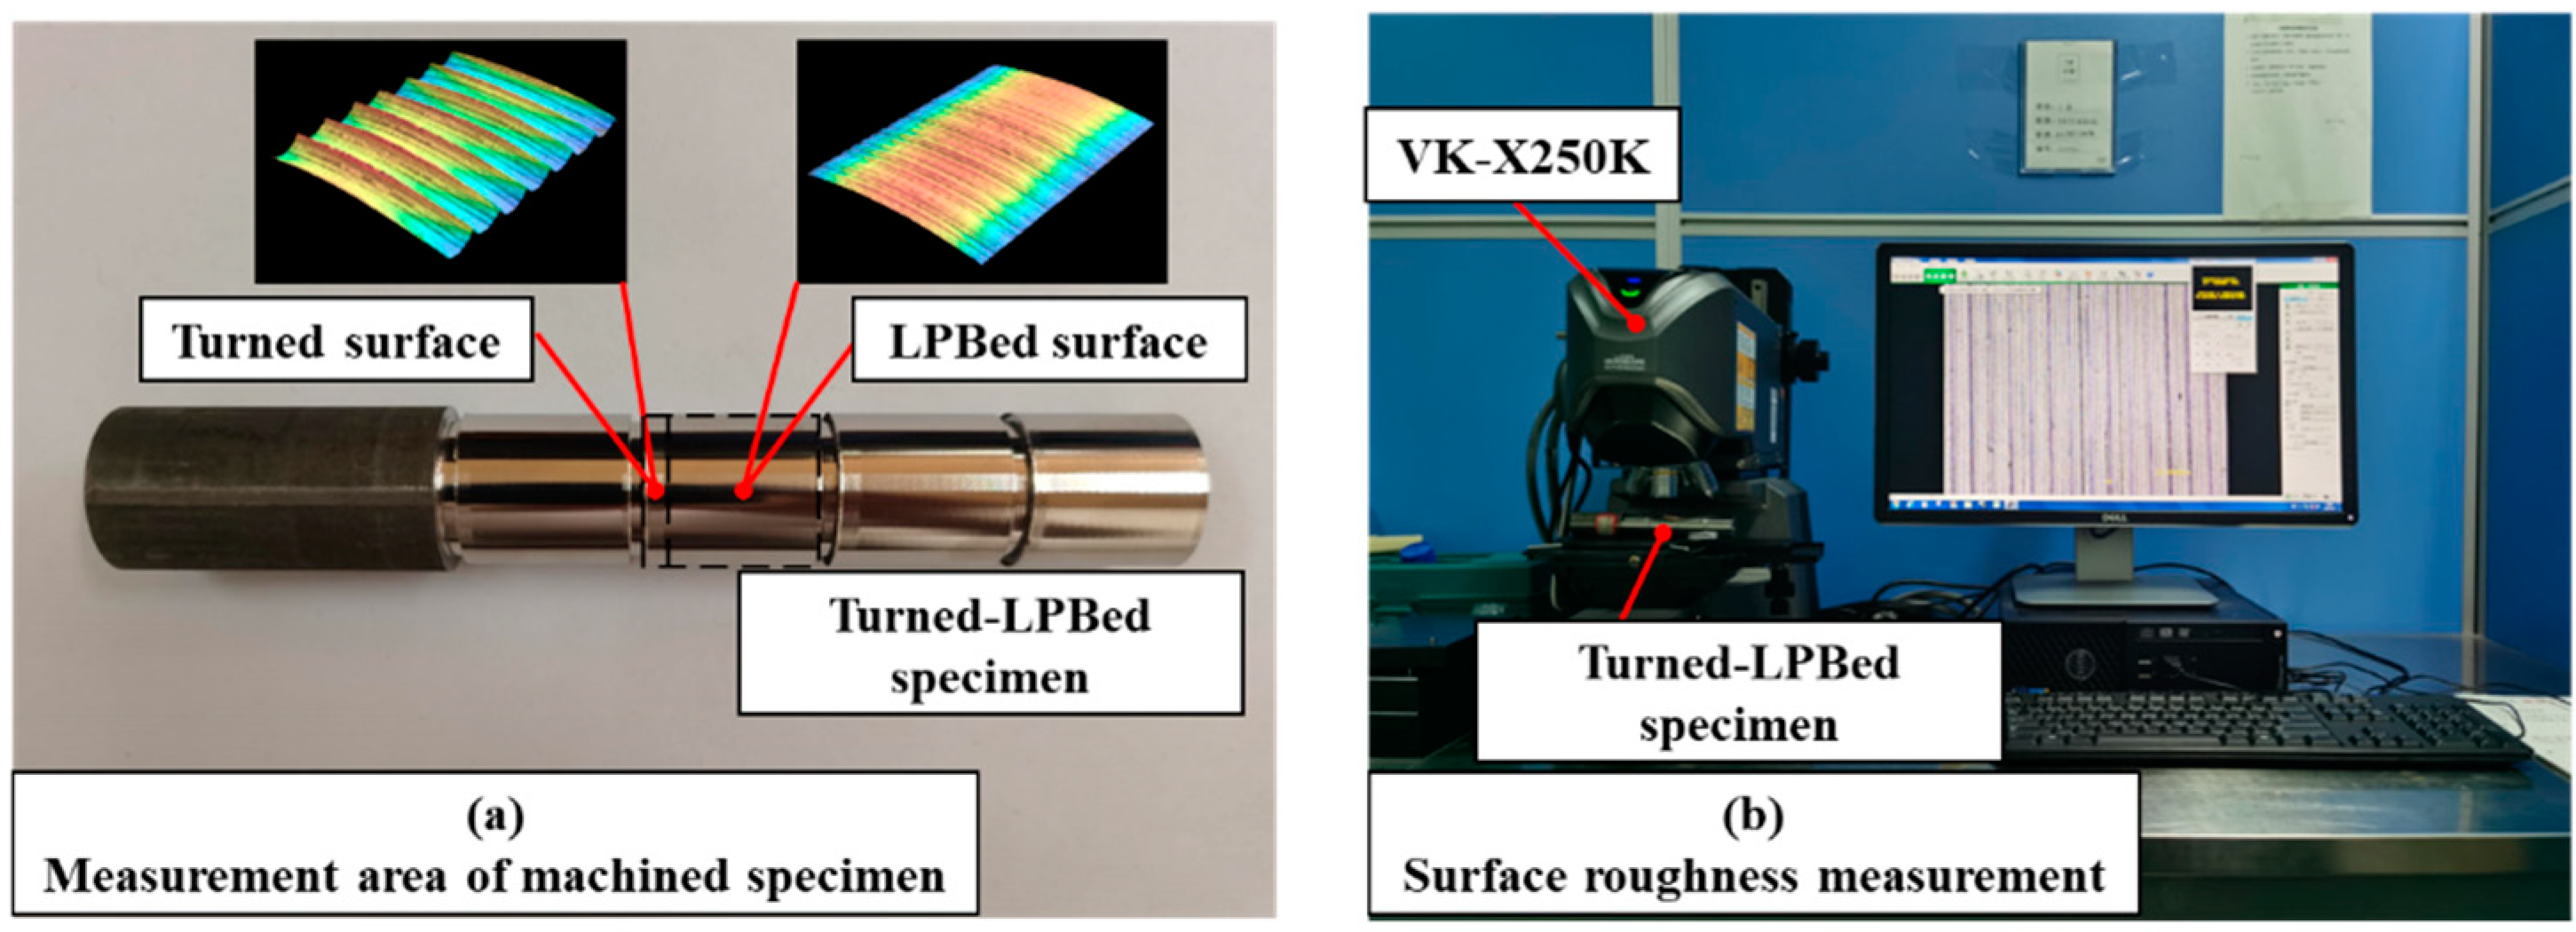
Surface roughness measurement of machined specimens.
Figure 4.
Surface roughness measurement of machined specimens.
Figure 5.
Residual stress measurement of machined specimens.
Figure 5.
Residual stress measurement of machined specimens.
Figure 6.
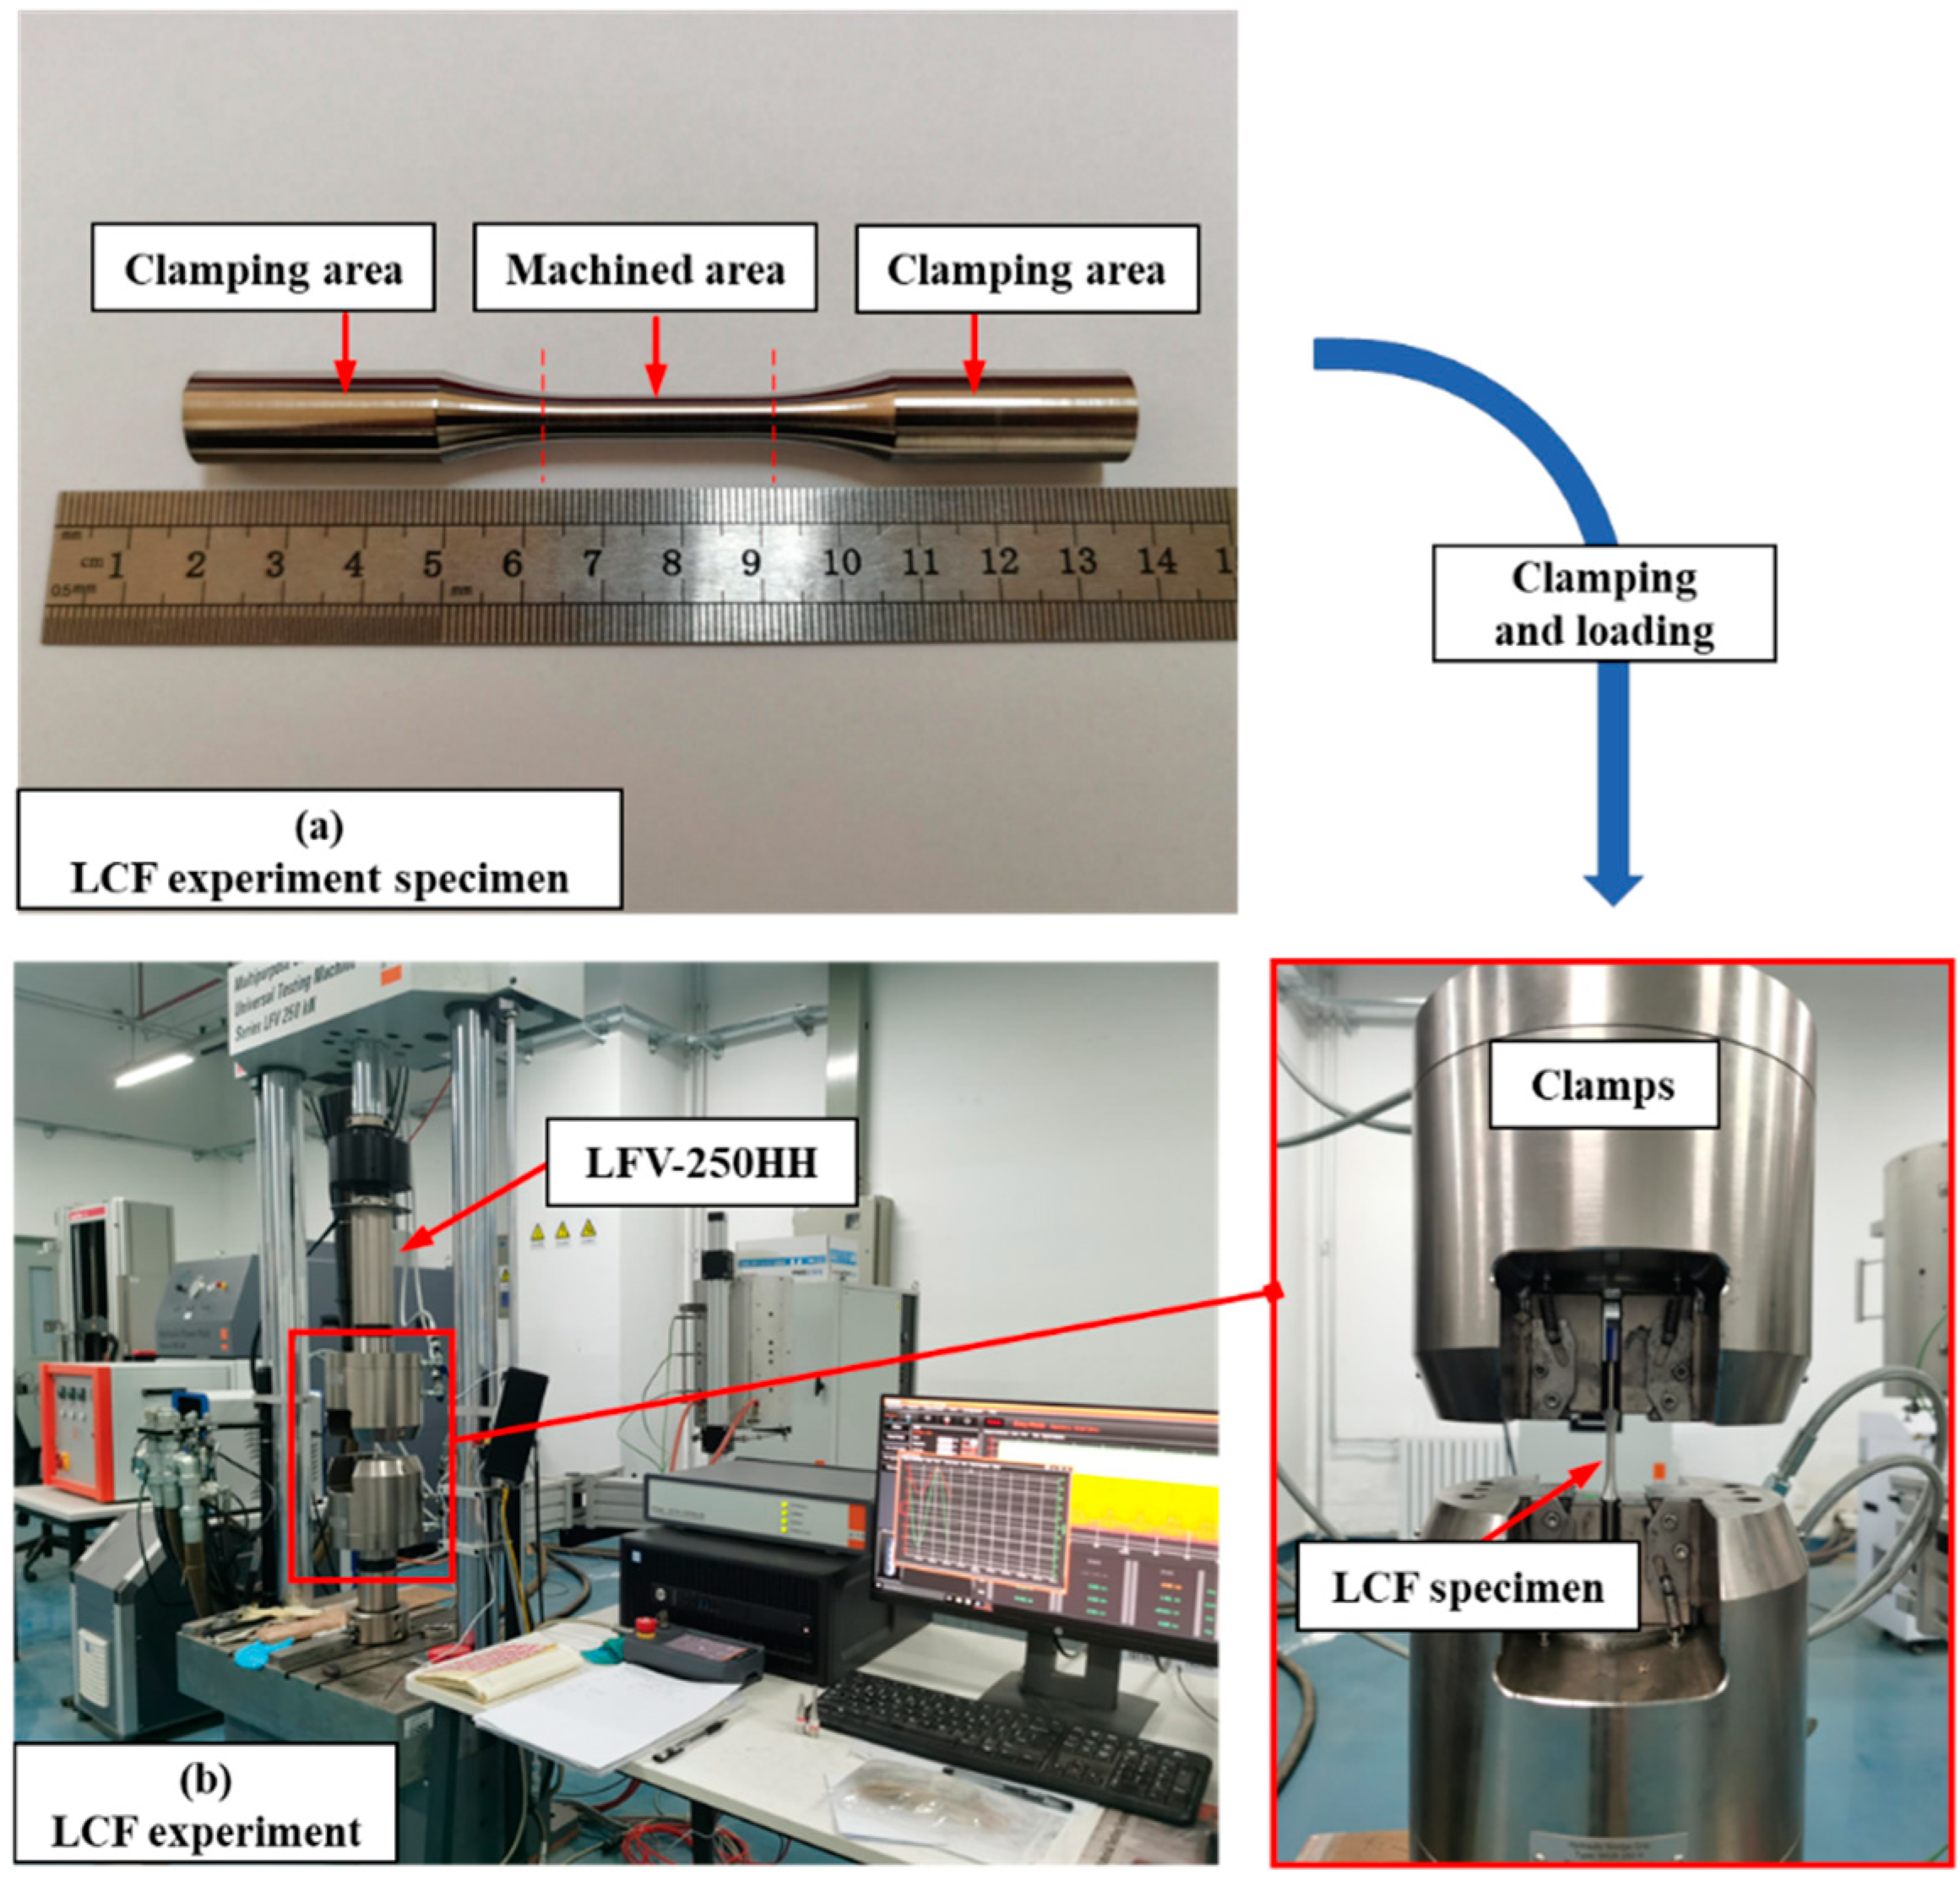
LCF experiment of machined LCF specimens with different surface integrity.
Figure 6.
LCF experiment of machined LCF specimens with different surface integrity.
Figure 7.
Surface microstructure and grain size statistic of turned and LPBed specimens.
Figure 7.
Surface microstructure and grain size statistic of turned and LPBed specimens.
Figure 8.
RVE model of Inconel 718 LCF specimens.
Figure 8.
RVE model of Inconel 718 LCF specimens.
Figure 9.
Boundary conditions and shear stress of the RVE model.
Figure 9.
Boundary conditions and shear stress of the RVE model.
Figure 10.
Shear stress distribution of RVE model (a) without crack and (b) with crack.
Figure 10.
Shear stress distribution of RVE model (a) without crack and (b) with crack.
Figure 11.
Surface topography and surface roughness of turned and LPBed specimens.
Figure 11.
Surface topography and surface roughness of turned and LPBed specimens.
Figure 12.
Residual stress field of turning and LPB specimens.
Figure 12.
Residual stress field of turning and LPB specimens.
Figure 13.
Surface stress concentration field FEM model of turned Inconel 718 specimen.
Figure 13.
Surface stress concentration field FEM model of turned Inconel 718 specimen.
Figure 14.
Boundary conditions of polished matrix, turned and LPBed RVE model.
Figure 14.
Boundary conditions of polished matrix, turned and LPBed RVE model.
Figure 15.
Crack propagation XFEM model.
Figure 15.
Crack propagation XFEM model.
Figure 16.
LCF load spectrum of Inconel 718 specimens.
Figure 16.
LCF load spectrum of Inconel 718 specimens.
Figure 17.
Crack initiation process of polished matrix RVE model.
Figure 17.
Crack initiation process of polished matrix RVE model.
Figure 18.
Crack initiation process of turned RVE model.
Figure 18.
Crack initiation process of turned RVE model.
Figure 19.
Crack initiation process of LPBed RVE model.
Figure 19.
Crack initiation process of LPBed RVE model.
Figure 20.
Crack propagation XFEM analysis of Inconel 718 specimen.
Figure 20.
Crack propagation XFEM analysis of Inconel 718 specimen.
Figure 21.
Experimental and FEM prediction result of Inconel 718 specimens.
Figure 21.
Experimental and FEM prediction result of Inconel 718 specimens.
Figure 22.
Fracture morphology of polished matrix specimen, turned specimen and LPBed specimens.
Figure 22.
Fracture morphology of polished matrix specimen, turned specimen and LPBed specimens.
Table 1.
Mechanical properties of superalloy Inconel 718 [
19].
Table 1.
Mechanical properties of superalloy Inconel 718 [
19].
| Elastic modulus |
Yield strength |
Tensile Strength |
Elongation |
Hardness |
|
E(GPa) |
σs(MPa) |
σb(MPa) |
(%) |
(HBW) |
| 210 |
1360.5 |
1502 |
19.3 |
439 |
Table 2.
The Tanaka-Mura model parameters of Inconel 718 [
20,
21].
Table 2.
The Tanaka-Mura model parameters of Inconel 718 [
20,
21].
| Material |
G(MPa) |
ν |
k(MPa) |
Ws(KJ·m–2) |
| Inconel 718 |
78850 |
0.3 |
150 |
6.5 |
Table 3.
The orthotropic elastic matrix constants of Inconel 718 [
24].
Table 3.
The orthotropic elastic matrix constants of Inconel 718 [
24].
|
C11(GPa) |
C22(GPa) |
C33(GPa) |
C12(GPa) |
C13(GPa) |
C23(GPa) |
C44(GPa) |
C55(GPa) |
C66(GPa) |
| 230 |
230 |
230 |
170 |
170 |
170 |
100 |
100 |
100 |
Table 4.
Stress concentration factor of turned surface.
Table 4.
Stress concentration factor of turned surface.
|
Ra(μm) |
Ry(μm) |
Rz(μm) |
ρ(mm) |
Kt
|
dt(μm) |
| 0.942 |
4.179 |
5.078 |
3.179 |
1.72 |
40 |
Table 5.
Crack propagation XFEM model parameters of Inconel 718 [
29].
Table 5.
Crack propagation XFEM model parameters of Inconel 718 [
29].
| Material |
G(GPa) |
ν |
Paris model parameters |
| C |
m |
| Inconel 718 |
210 |
0.3 |
1.13×10⁻¹¹
|
2.74 |
