1. Introduction
The Unmet Basic Needs (UBN) is an indicator that allows identifying the levels of poverty in the regions. The trend in Latin America, and therefore in Colombia, is that in its regions (or departments) with the best economic level (measured from the Gross Domestic Product, GDP per capita) they have the lowest indices of extreme poverty or UBN.
UBN are measured in different socioeconomic aspects, including the material condition of the housing, the lack of basic public services and overcrowding. These aspects are related to the need to generate low-income housing for the population with the greatest needs and thus contribute to reducing their UBN and helping them overcome the condition of poverty. Additionally, the generation of low-income housing contributes to compliance with the SDGs. A review of the 17 Sustainable Development Goals (SDGs) [
1] shows that one of the common elements between No. 1 “No Poverty,” No. 6 “Clean Water and Sanitation,” and No. 11 “Sustainable Cities and Communities” is to generate decent housing for the poorest communities. Whether it is: new home ownership, improved home ownership, or rental housing, but provided with minimum quality standards, help to improve the indicators for these 3 SDGs.
The construction of housing for low-income households is one of the options to help reduce poverty in a developing country such as Colombia, according to the Colombian Ministry of Housing, City and Territory (2022) [
2], Low-income or Social Interest Housing (VIS, in Spanish term) has the social function of being the lowest priced: “VIS has the elements that ensure habitability and that meet the quality standards of urban, architectural, and construction design. Their maximum value is one hundred thirty-five current legal monthly minimum wages (135 SMLM).”
1Housing units that, due to their sale price, exceed the VIS value, are called “no-VIS housing,” and are not intended to favor low-income households.
The hypothesis posed by this article is that the regions with the highest level of income, Colombia case, are those with a tendency to develop fewer VIS housing units because they have a lower percentage of the population in extreme poverty and with fewer housing needs. This is supported by high correlation values and negative sign (Spearman's Rho < -0.7) for the 33 departments of Colombia (
Table 1).
A huge social problem is the relationship between economic growth and low-income housing. Is exposed by entities such The Inter-American Development Bank (IDB) by stating that the housing sector, in Latin America and the Caribbean, has historically been affected by the economic situation, as recently demonstrated in the COVID-19 pandemic, and is related to the fulfillment of the Sustainable Development Goals (SDGs). For the IDB is clear that the development of the housing sector is a fundamental tool for sustainable and resilient growth in Latin America and the Caribbean (LAC) [
3].
The importance of low-income housing development in order to reduce poverty
It is important to highlight that the good economic situation of the regions has facilitated the reduction of the number of households with housing in poor condition; and to remember that Latin America and the Caribbean is the developing region with the highest level of urbanization in the world. This fact is related to the increase in human settlements and poverty; and housing development is essential for reducing social, economic, and environmental gaps. And it is even more worrying when you read the numbers: “If we add to this the high levels of poverty, labor informality and the slowdown in mortgage financing, we conclude that the probable scenario for the coming years is an expansion of precarious settlements in our region, beyond 17.7% of the population urban society that in 2020 lived in marginal neighborhoods” [
4].
In another document, the ECLAC highlights the relationship between urban population growth, economic opportunities, and the housing construction sector: “Population growth presents a negative relationship with economic growth. That is, accelerated population growth presents an opportunity cost in relation to economic growth, since rapid growth in the labor factor means that more capital has to be used to equip the growth of the labor force, which results in in slower growth of capital per worker”, and “The construction sector includes both the creation of new homes and the recovery and rehabilitation of those that are disused and/or deteriorated. Its development not only impacts the most vulnerable population. In addition to alleviating poverty, it is a sector of great relevance within the economy, due to the impact it generates on other sectors. On the one hand, it demands from other industries the inputs used in construction works, inducing dynamism in the latter” [
5].
According to the Ministry of Labor (Republic of Colombia) (2023) [
6], about 70% of inter-municipal migrants, for lack of work reasons, arrived in the following departments: Bogota, Cundinamarca, Valle del Cauca, Antioquia, Santander, Risaralda, Meta, Atlantico and Tolima. Eight of these nine regions are on the list of those ten with the best GDP per capita since 2015 [
7].
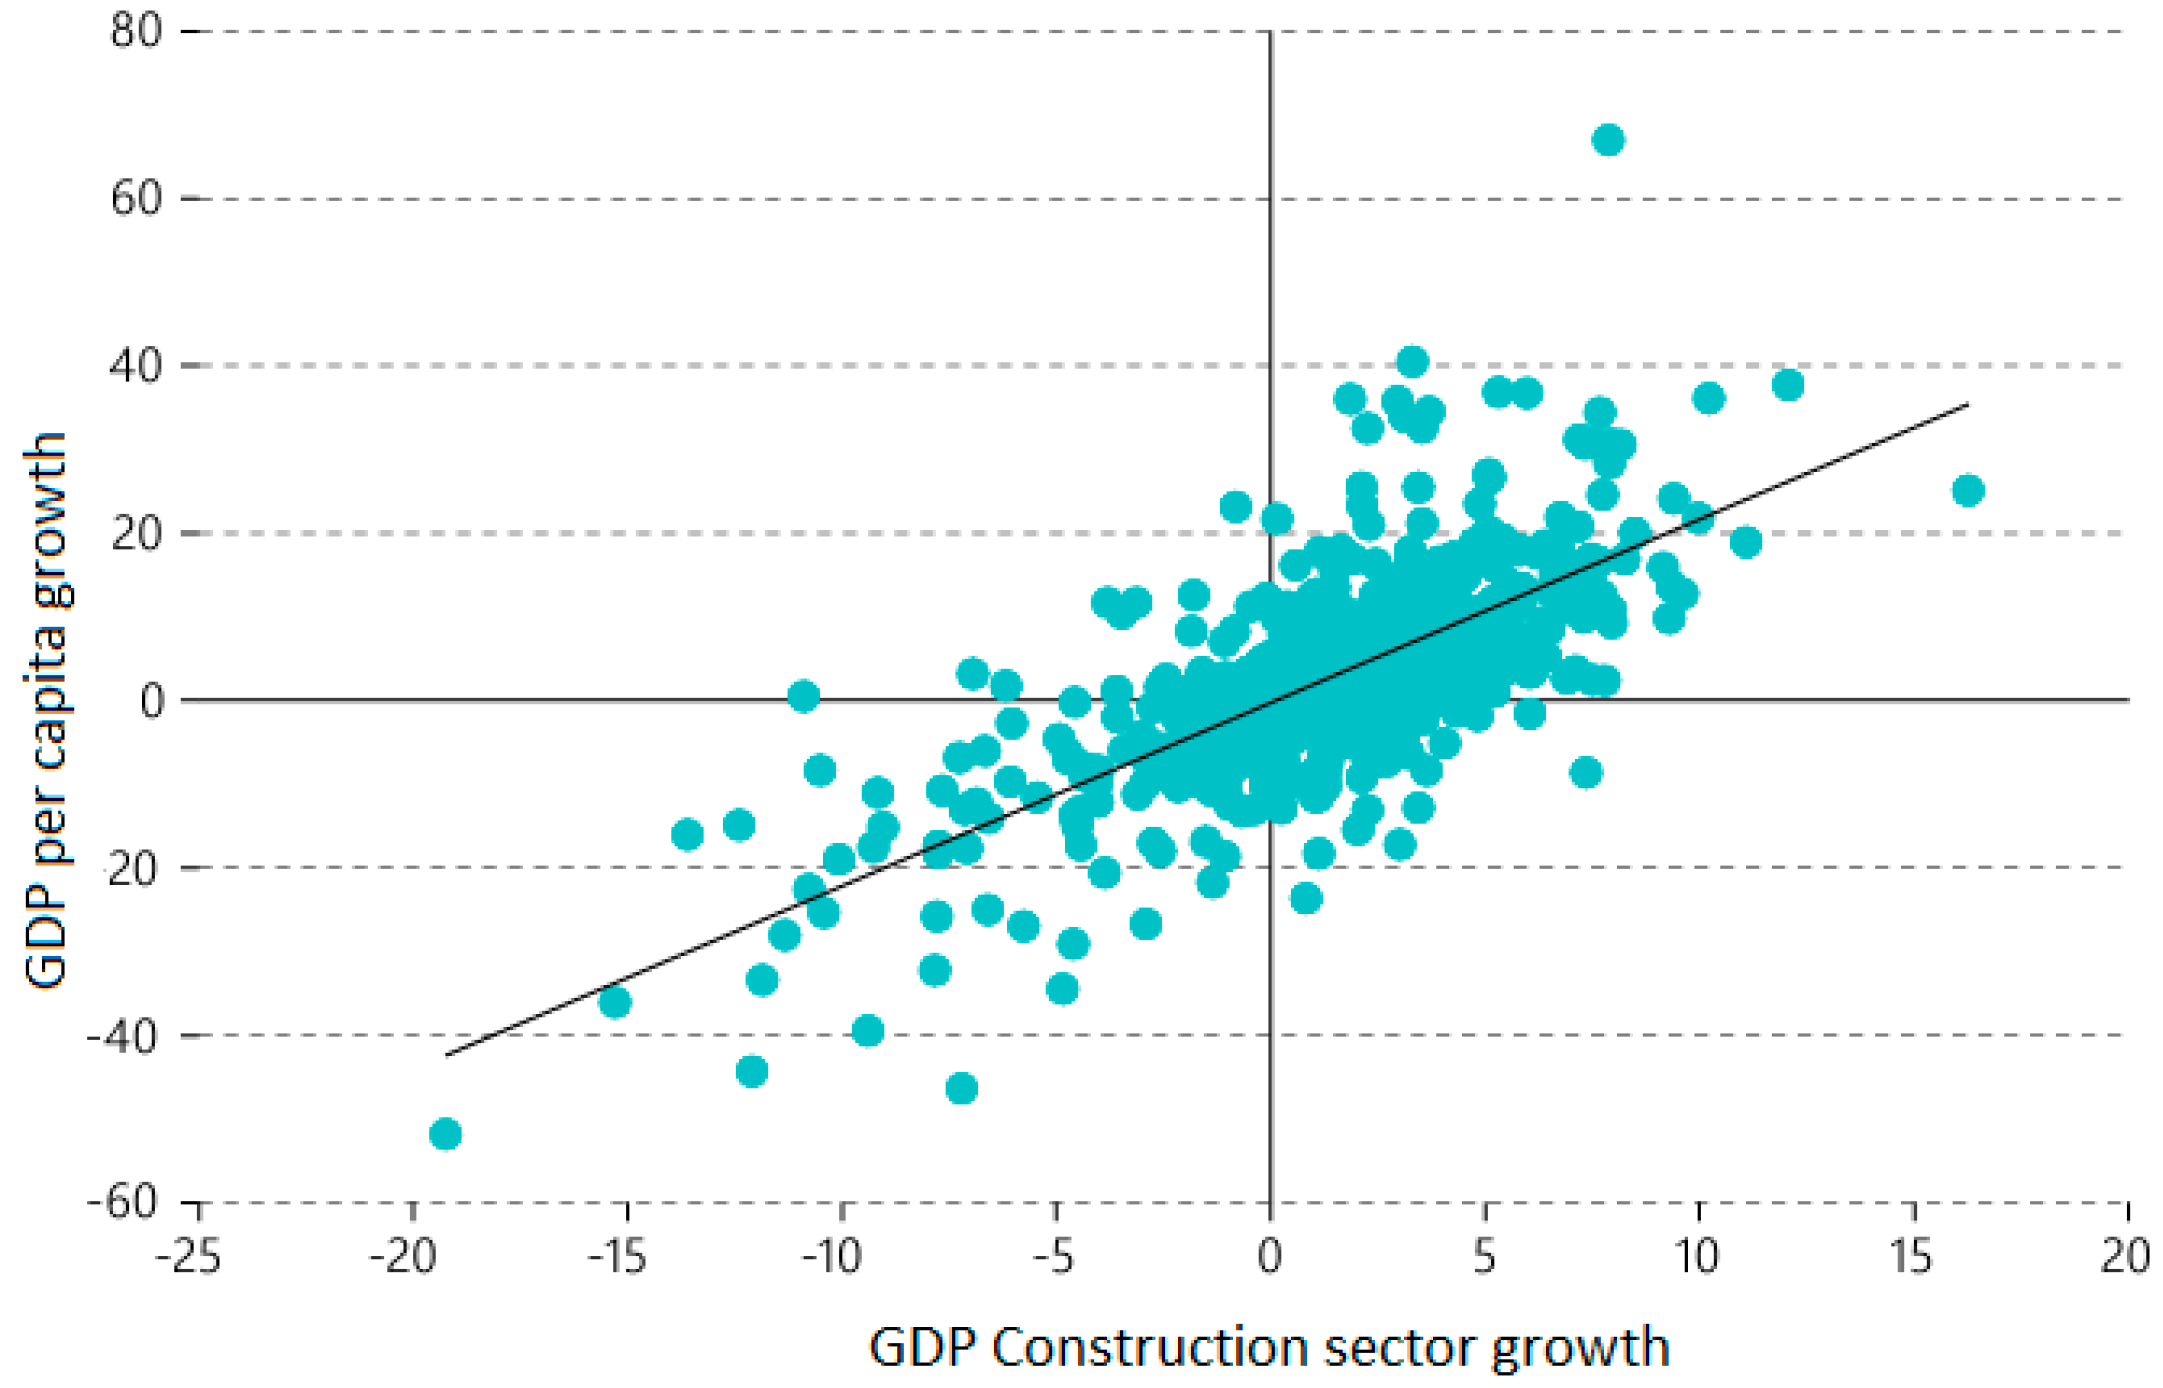
Figure 1 shows the strong and positive relationship between the growth of GDP per capita and the GDP of the construction sector, for a sample of 20 Latin American countries, between the years 1990 and 2020.
In Colombian case, when there is an economic crisis, what is built the most is low-income housing (VIS). In order to maintain the construction and housing sales sector, a solvent demand is needed, which is capable of having enough money to buy housing in the middle and upper strata segments. When there is a crisis, demand contracts and that is why the State gives subsidies to leverage that demand and it does so in low-income segments [
8].
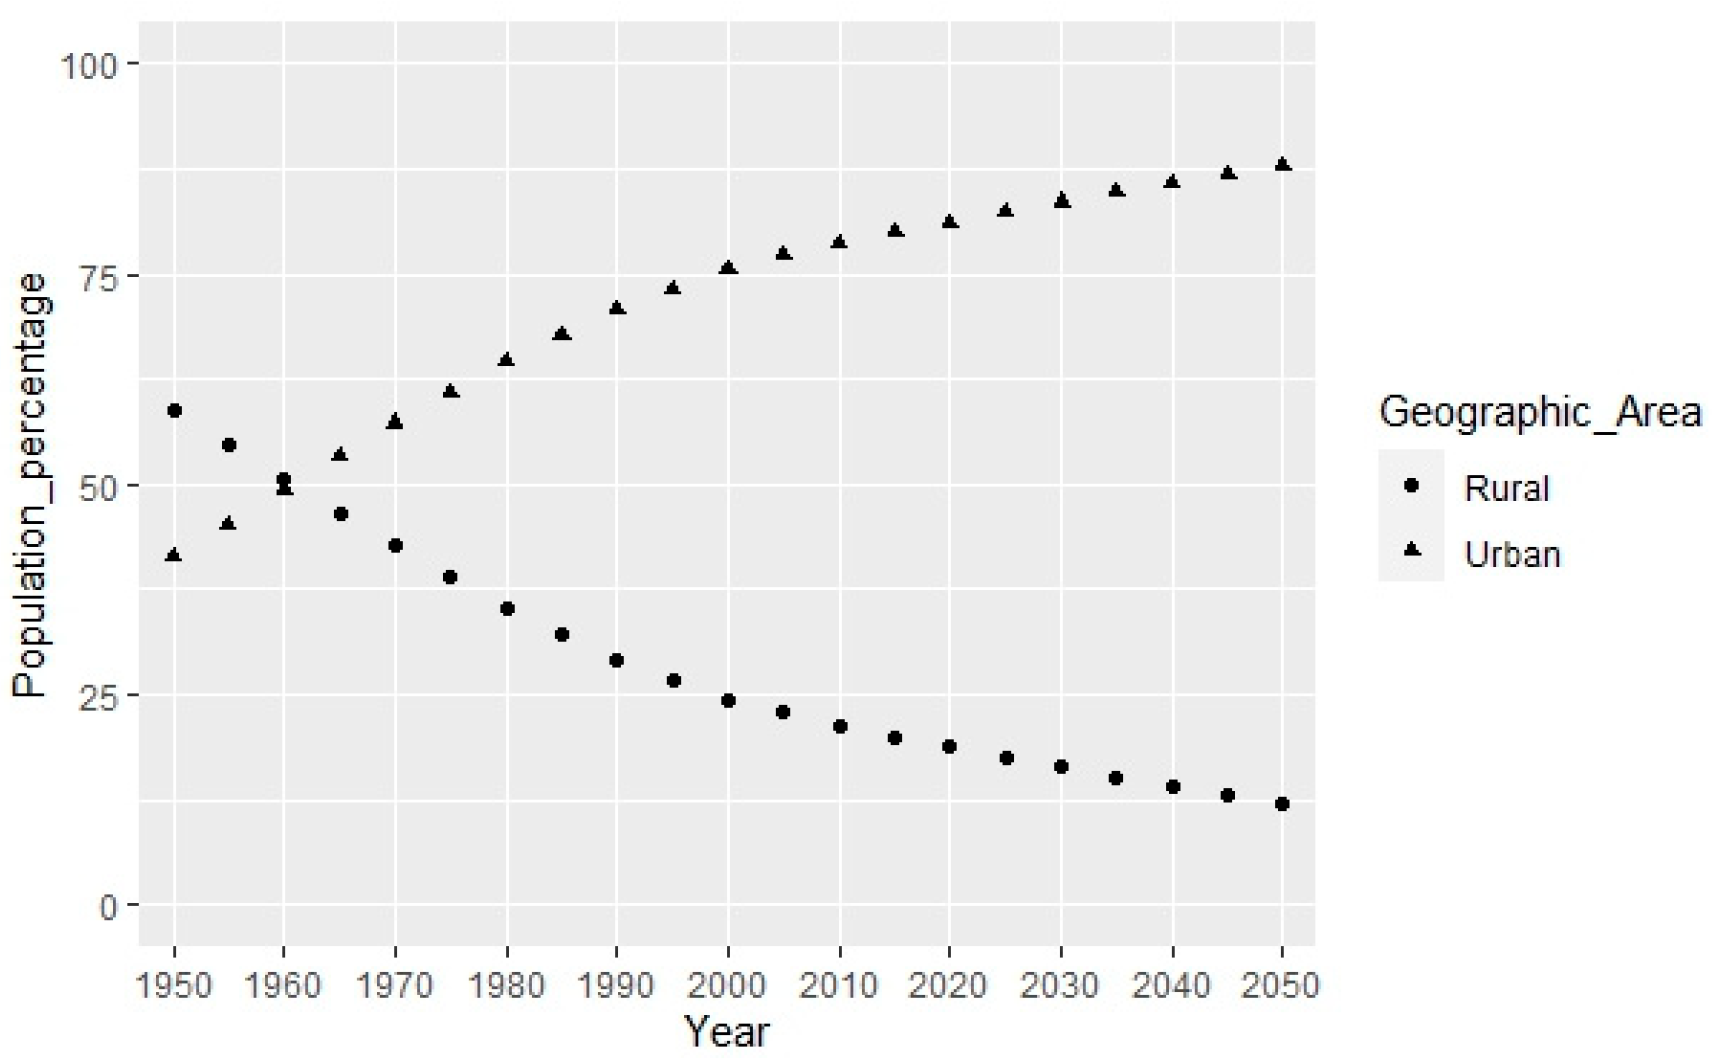
Now, regarding Latin America and the Caribbean, the importance of producing more quality social housing for the population classified as poor stems from the growth of the urban population coming from rural areas. The United Nations Economic Commission for Latin America and the Caribbean (ECLAC) presents projections for the population of the region and each of its countries [
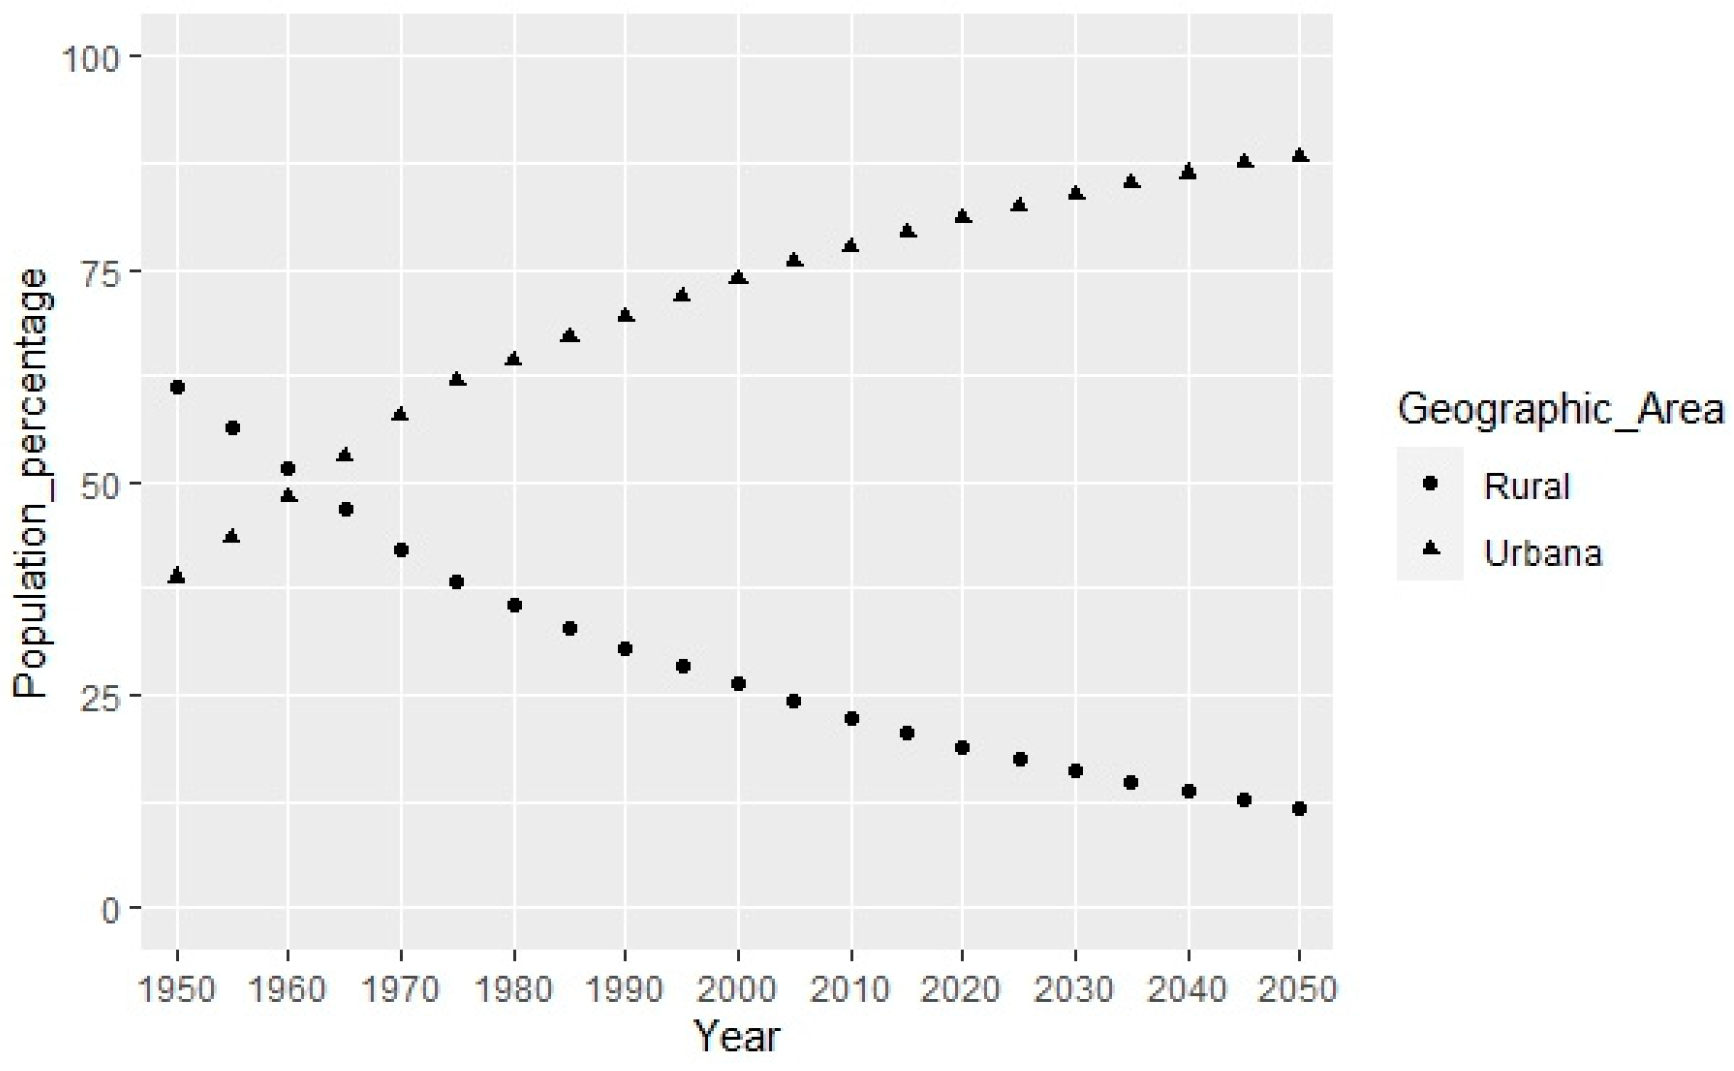
9]. According to the general data for Latin America and the Caribbean, the turning point between a higher percentage of the population living in urban areas compared to rural areas occurred in 1960. Since then, the difference has steadily been increasing and it is projected to remain this way at least until the year 2050 (
Figure 2). In the case of Colombia, the distribution of the population is very similar to the above data (
Figure 3).
The above suggests that the so-called “urbanization phenomenon” will continue in Colombia and in Latin America, generating a greater number of migrants from rural to urban areas. Most of this migration occurs under conditions of poverty and as a result, families arrive in the municipalities to occupy housing with very poor material conditions and without basic public utilities. Unfortunately, much of the causes of migration are linked to violence and lack of economic and job opportunities in many rural areas [
10,
11,
12]. In the case of Colombia, although the population living in poverty has decreased since the early 2000s, indicators continue to be higher in rural areas than in urban areas [
13]. It is also noteworthy that in recent years, there has been many people living in poverty who have migrated from Venezuela to Colombia, mostly to major cities [
14].
A review of the state of the art to explore the relationship between poverty and social housing shows that, according to Chiodelli (2016) [
15], the great proliferation of informal human settlements in the major cities of so-called developing countries began after World War II. This informal growth of cities led to poverty, creating what can be described as a “planet of slums” [
16]. For several years, government agencies failed to take significant action to address this issue. Only until the 1960s, and with greater force in the 1970s, did various government and multilateral agencies initiate housing policies consistently and with clear objectives to improve the housing conditions of poor households in the cities, to reduce the reality of urban poverty. Over the years, it has been shown that the location of low-income housing in the urban periphery (generated largely by the effects of rural-urban migration) results in transportation issues on work or study days due to increased commute time and costs. It also brings restrictions to urban development [
17].
The first initiatives to improve social housing focused on having the community itself actively participate in the construction or improvement of their precarious housing. However, the 1980s proved that self-built housing was not a good idea due to the quality of the construction process. From then on, housing policies focused on the fact that the State should intervene even more with new housing projects and provide households with financial planning, financial assistance through subsidies, and even rental housing options. The latter option has not been given due consideration by many governments in poor countries, but it is an option for regulating social housing [
18]. In the 1990s and 2000s, agencies such as the World Bank, the Inter-American Development Bank and UN-Habitat have been very active in promoting policies for social housing valuation and land regulation [
19]. Such housing policies strengthened the legal ownership of informal housing as a mechanism to reduce the state of poverty of households by increasing their net worth through home ownership [
20,
21,
22].
Between 1995 and 2009, housing conditions in Latin America improved by reducing the number of households in the housing deficit from 8% to 6%. Similarly, the proportion of occupants living in housing built with precarious materials fell from 12% to 8.8%. These improvements in the housing deficit correspond to an era of economic growth, measured in per capita income. However, criticism must be made of the lack of consistency between public policies for urban development and housing development. This disconnect has led to housing projects not being a solution to the quality of life of the inhabitants [
23].
Providing new housing or improving existing housing for lower-income households who cannot afford non-VIS housing is not solely about the actual building. Housing also implies providing basic public services and utilities such as water, sewerage, roads, energy, and adequate public space [
24,
25]. This implies that social housing in a country contributes to achieving Sustainable Development Goals (SDGs).
Some studies conclude that generating housing invigorates the economy by increasing the Gross Domestic Product (GDP) [
26].
The role of low-income housing in the building housing sector
Continuing the study of Latin America, the analysis of the evolution of the economy and social housing in Argentina, Brazil, Chile, and Colombia; concludes that in the last 50 years there has been a lack of response from governments to the problem of social housing. Then there was the expansion of informal settlements and the increase in the social housing deficit. Later, governments wanted to increase financing to reduce the social real estate crisis; and finally, the construction sector participated in an important offer of social housing located in the urban peripheries [
27].
The Colombian Chamber of Construction (Camacol)
2 (considered to be the top consulting agency in Colombia for the building industry) has recently stated that “with the reactivation of social housing the expected growth of the economy could be doubled” [
28].
The social housing policy in Colombia in recent years has been based on state subsidies to low-income families for the purchase or improvement of social housing. This financial aid encouraged the supply of social housing by construction companies, mainly in the regions of the country that had the greatest demand, that is, regions with greater economic movement and presence of migrant households. Furthermore, the regions or departments of Colombia with the best economy (Cundinamarca, Antioquia, Valle del Cauca and Atlántico) are those that have received the most internal migration of the armed conflict due to having greater employment opportunities, which is why they have developed more social housing projects, reaching low housing deficit rates and the greatest offers of social housing [
29].
The relationship between the building construction industry and economic legal monthly minimum wage, has been consistently exhibited in developing countries [
30], even in the United States of America [
31,
32]. Other articles focus the relation between new market housing construction on the low-income housing market [
33]. The present study was performed through a statistical validation of the correlation between indicators, employing a nonparametric method. The resulting value of each correlation allowed to establish whether our hypothesis was satisfied, and it determined most of our conclusions for this study.
Another model suggests that per capita income or wage income are not independent variables that explain urban growth; therefore, housing supply should be correlated with population growth. The study was conducted with information from 2001–2016 for the metropolitan areas of the U.S.A. [
34].
Bramley & Pawson (2002) [
35] establish that demographics, employment, poverty, income, the attractiveness of the area, and the amount of housing stock or housing for rent are the variables that explain the behavior of urban areas with low demand for housing (United Kingdom, UK).
Other documents relate the impact of policies in the low-income housing, like Ha (1994) [
36] in Korea case; Ikejiofor (1998) [
37] in Nigeria case; Choguill (1993) [
38] in Bangladesh case; and Yang et. Al. (2021) [
39] in U.S.A. case.
Housing policies with a focus on subsidies for new and existing (but legalized) housing continue until the present decade (2020), and pertain to cases such as Colombia, Chile, Uruguay, and South Africa, among others [
15]. Housing policies in Latin America share similarities and can also be individually analyzed on a global scale [
40]. It is also important to note that housing policies in developing countries are often implemented differently from those in developed countries [
41].
Summarizing, in Latin America results mainly in: (a.) an analysis of housing policies over the last decades [
15,
18,
19]; (b.) a comparative analysis between countries in the region or between developed and developing countries [
40,
41]; (c.) an analysis of the relationship between housing production and urban public utilities [
24,
25]; (d.) a review of the spatial characteristics of informal housing and qualitative deficit [
17,
42,
43,
44]; and (e.) an analysis of the relationship between social housing production and urban poverty reduction [
20,
21,
22,
26].
Camacol have analyzed the behavior of the building industry’s GDP, both at the national level and by departments, but they do not relate it to the supply of VIS. They have also studied the participation of 60 subsectors of the economy in the demand for goods and services related to the building construction industry; however, they do not relate this information to the number of housing units that are built [
45]. More recently, another publication presents a GDP projection for the construction industry but does not correlate other economic industries with housing supply, nor is it analyzed by region [
46,
47].
The objective of this study was to establish whether there is a statistically valid correlation between the supply of social interest housing (VIS) in a region (per department in Colombia) and socioeconomic and demographic variables such as the general GDP of the department, the main industry-specific GDPs, the general population of the department; based in the hypothesis that the regions with the highest level of income, Colombia case, are those with a tendency to develop fewer VIS housing units be-cause they have a lower percentage of the population in extreme poverty and with fewer housing needs.
After a search for technical articles on social housing demand modeling, we found a correlation analysis between housing production, deficit, and regional socioeconomic variables such as Gross Domestic Product (GDP), and population.
The state of the art makes clear the relationship between poverty and housing condition; and therefore, a contribution to the SDGs. But there are no publications on the analysis of the relationship between indicators at regional level to no one country in Latin America. This study analyzes whether the areas or departments in Colombia with greater economic development are related to a higher number of VIS housing units in the period between 2015 and 2021, making a reading of the contribution to the SDGs from the social building economic sector, according to the regional social and economic condition in Colombia.
This study is based on the trend for well-developed regions which receive an important migrant population, like from rural to urban areas due to social and economic conflicts, are linked to poverty; and due to the previous, requires a decent housing solution to reduce the UBN of population, and thus helping improve the indicators of the Sustainable Development Goals (SDGs) [
12,
48,
49,
50,
51].
2. Method
The information used in this study was obtained from the most reliable organizations and governmental agencies in Colombia. All information used is official for Colombia. It was obtained from the most recent reports published by the National Administrative Department of Statistics (DANE).
The first step was to establish whether to use parametric or nonparametric methods to validate the correlations. One of the most commonly used parametric tests is the Pearson correlation coefficient. An important aspect to consider is that in order to apply this method, the normal distribution of the variables to be correlated must be verified beforehand. The resulting coefficient (r) measures the strength or intensity of the linear relationship between 2 variables. To establish whether or not there is a statistically valid correlation, the normality test was initially performed using the “Shapiro–Wilk” command in R Studio, which yields the p-value. The normality of the data distribution can be validated if the p-value is ≥0.05 [
52].
The test was applied to the following variables (results are shown in 0):
Number of licensed VIS units reported for Colombia as a whole and for each of the 33 departments, 2015–2021.
Number of licensed non-VIS units reported for Colombia as a whole and for each of the 33 departments, 2015–2021.
Departmental GDP for the manufacturing industry, 2015–2021, for each of the 33 departments.
Departmental GDP for the construction industry, 2015–2021, for each of the 33 departments.
Departmental GDP for the real estate industry, 2015–2021, for each of the 33 departments.
Departmental GDP for the finance and insurance industry, 2015–2021, for each of the 33 departments.
Departmental GDP for the mining industry, 2015–2021, for each of the 33 departments.
Departmental GDP for the farming, livestock, forestry, and hunting and fishing (agriculture) industry, 2015–2021, for each of the 33 departments.
Overall GDP or total departmental GDP, 2015–2021, for each of the 33 departments.
It is worth noting that the housing unit indicator refers to licensed housing, i.e., housing units that potentially will be built, whether new or improved, according to the need to license the projected construction. This indicator does not factor in rental housing solutions or VIS or non-VIS constructions that have been developed without a license. It also does not disregard those that, after being licensed, have not been partially or completely built.
The result indicates that there is no normal distribution for any of the variables analyzed in the 2015–2020 period, in any of the 33 departments (shown in 0).
Since there was no normal distribution for the variables, we performed a nonparametric correlation test, namely Spearman’s test. We executed the following command using the R Studio statistical software program:
The value or result provided by the Spearman correlation test is rho, whose value measures the intensity of the correlation between 2 variables, and its limits are (-1, 1). If the value is close to unity, the correlation is good and directly proportional between the 2 variables. If the value is close to unity, but is negative (-1), the correlation between the 2 variables is also good but it is inverse. If the value is close to null, it is considered that there is no valid correlation between the variables [
53].
We then proceeded to calculate the value of the Spearman correlation (rho) with the data shown in 0, and with these results correlate the number of VIS units/year and the number of non-VIS units/year with:
a. the general economic performance of the country’s departments (measured based on the overall GDP), and
b. the economic performance for the main economic industries in Colombia (GDP by industry).
The conclusions were stablished regarding the hypothesis or assumption that there is a tendency to develop a greater number of social housing units in regions where there is greater economic development, especially in areas where the industrial and service industries are more prevalent.
4. Discussion
4.1. Low-income housing
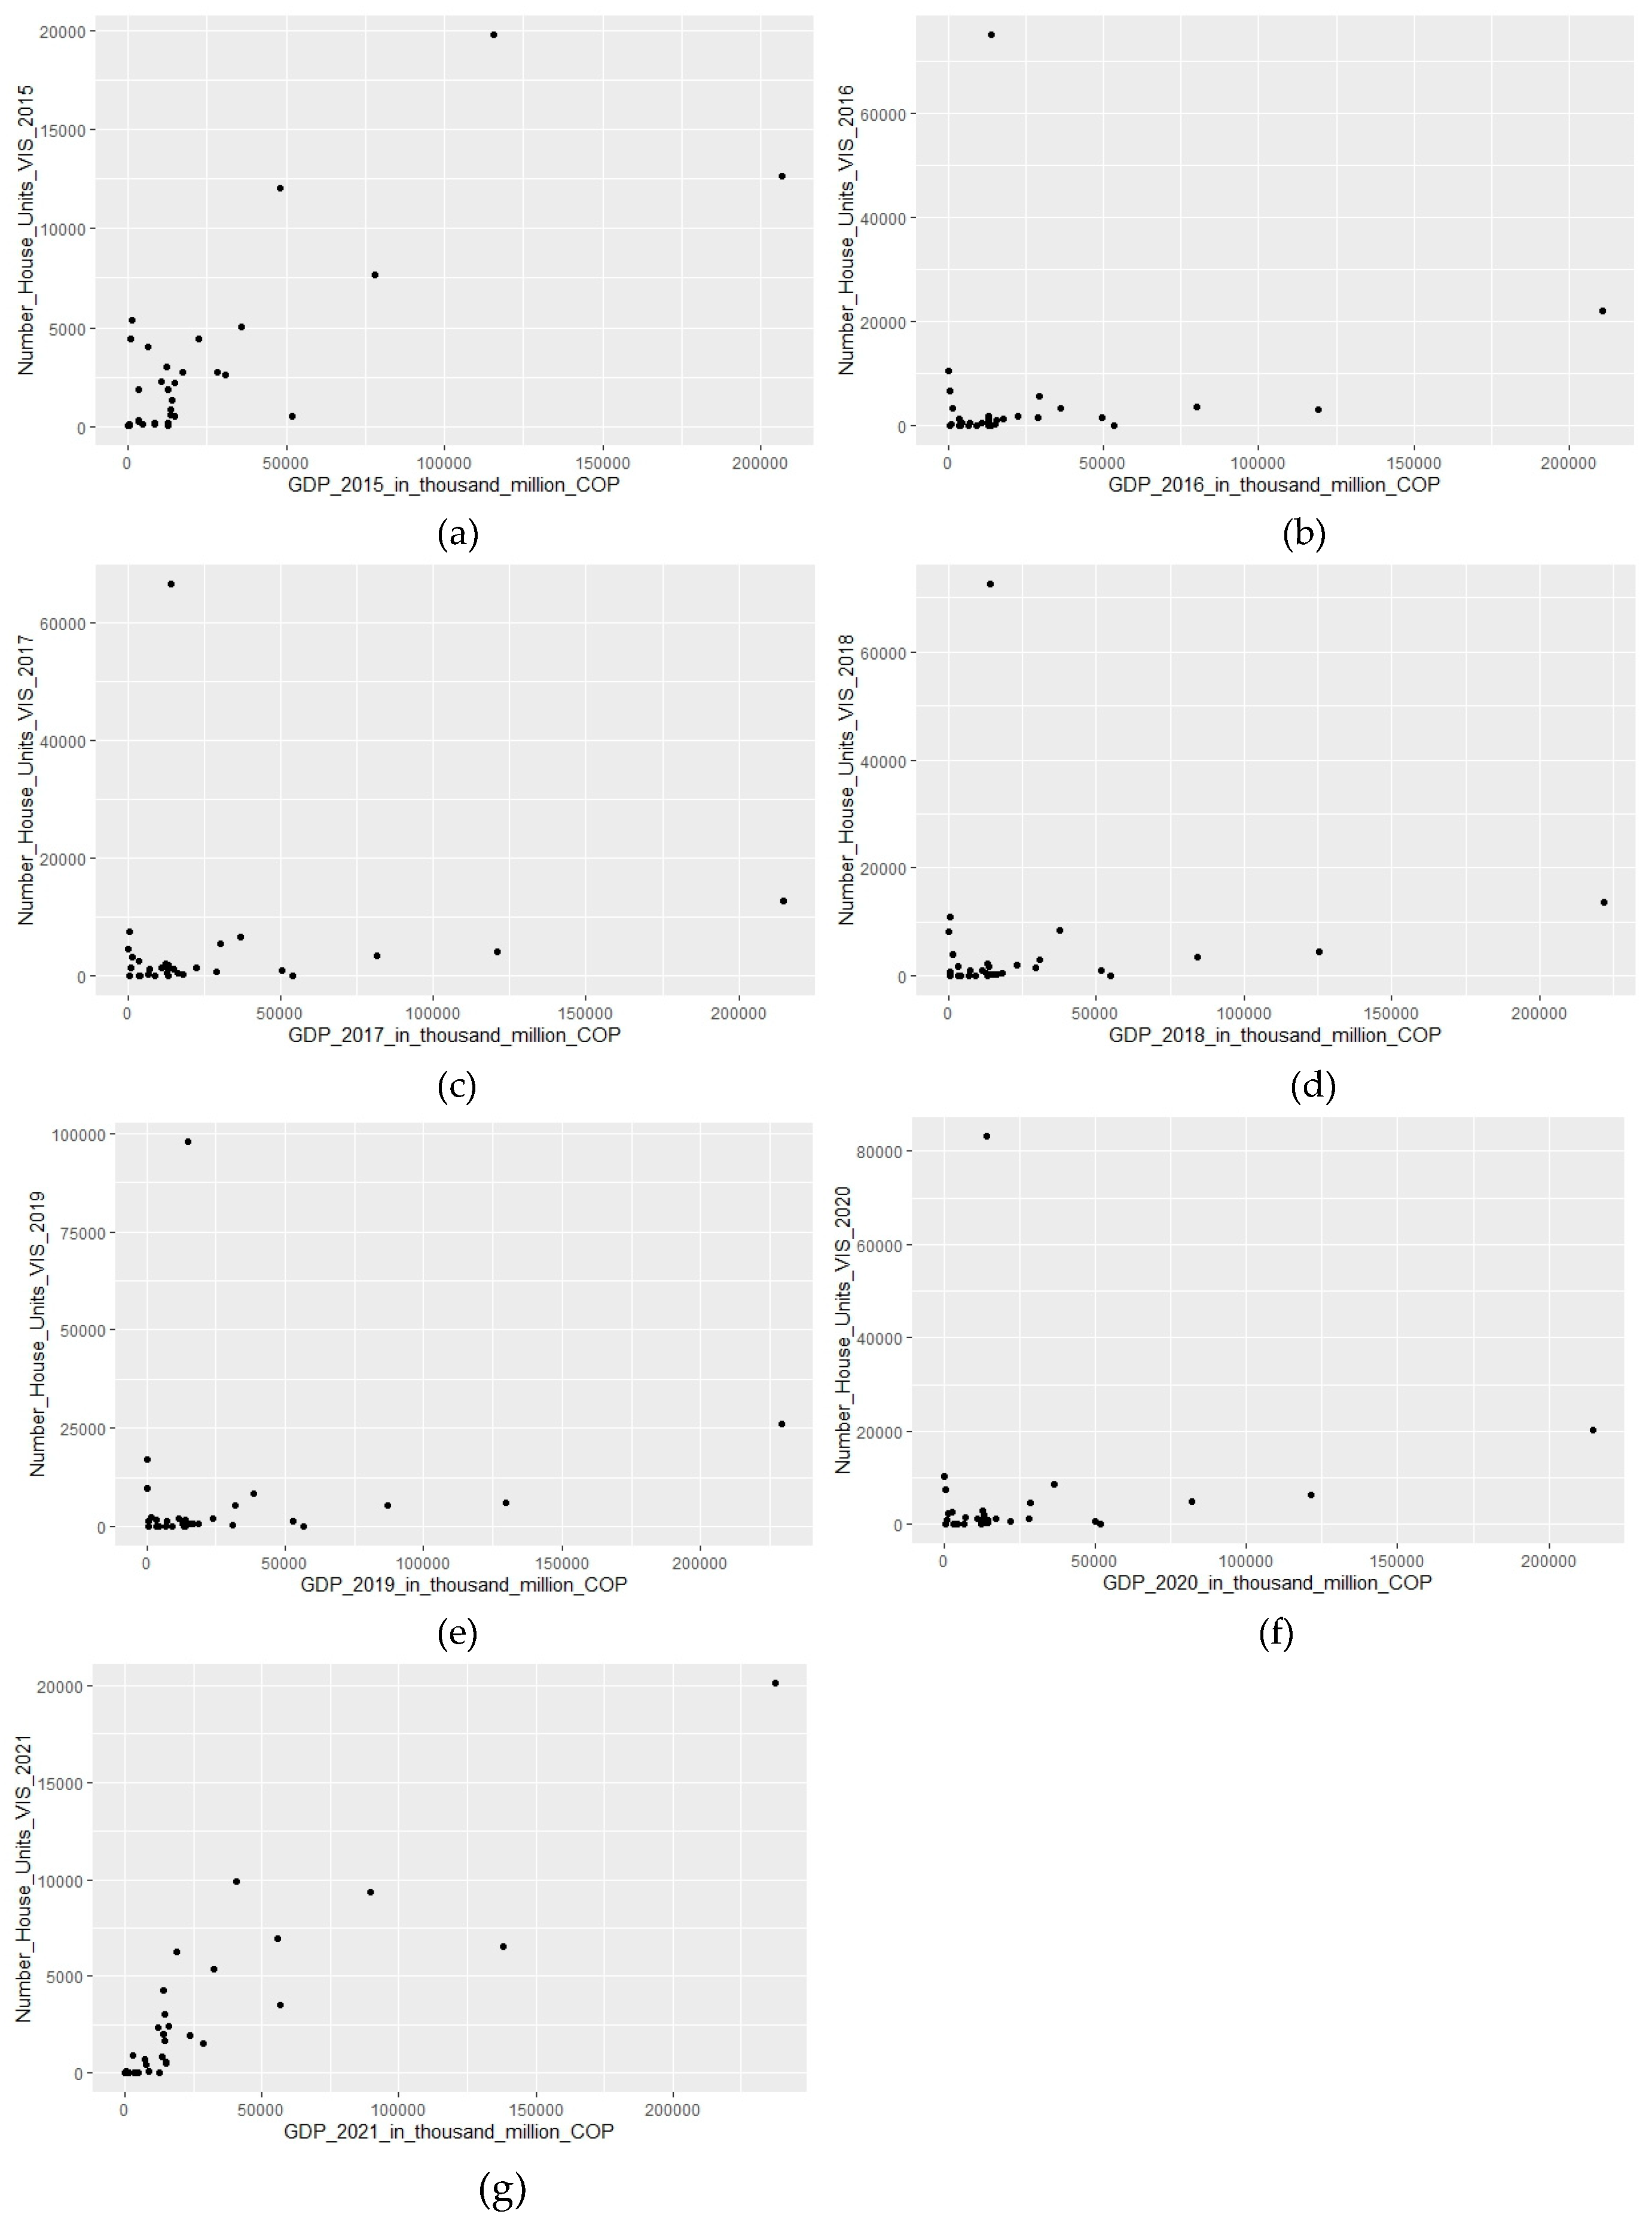
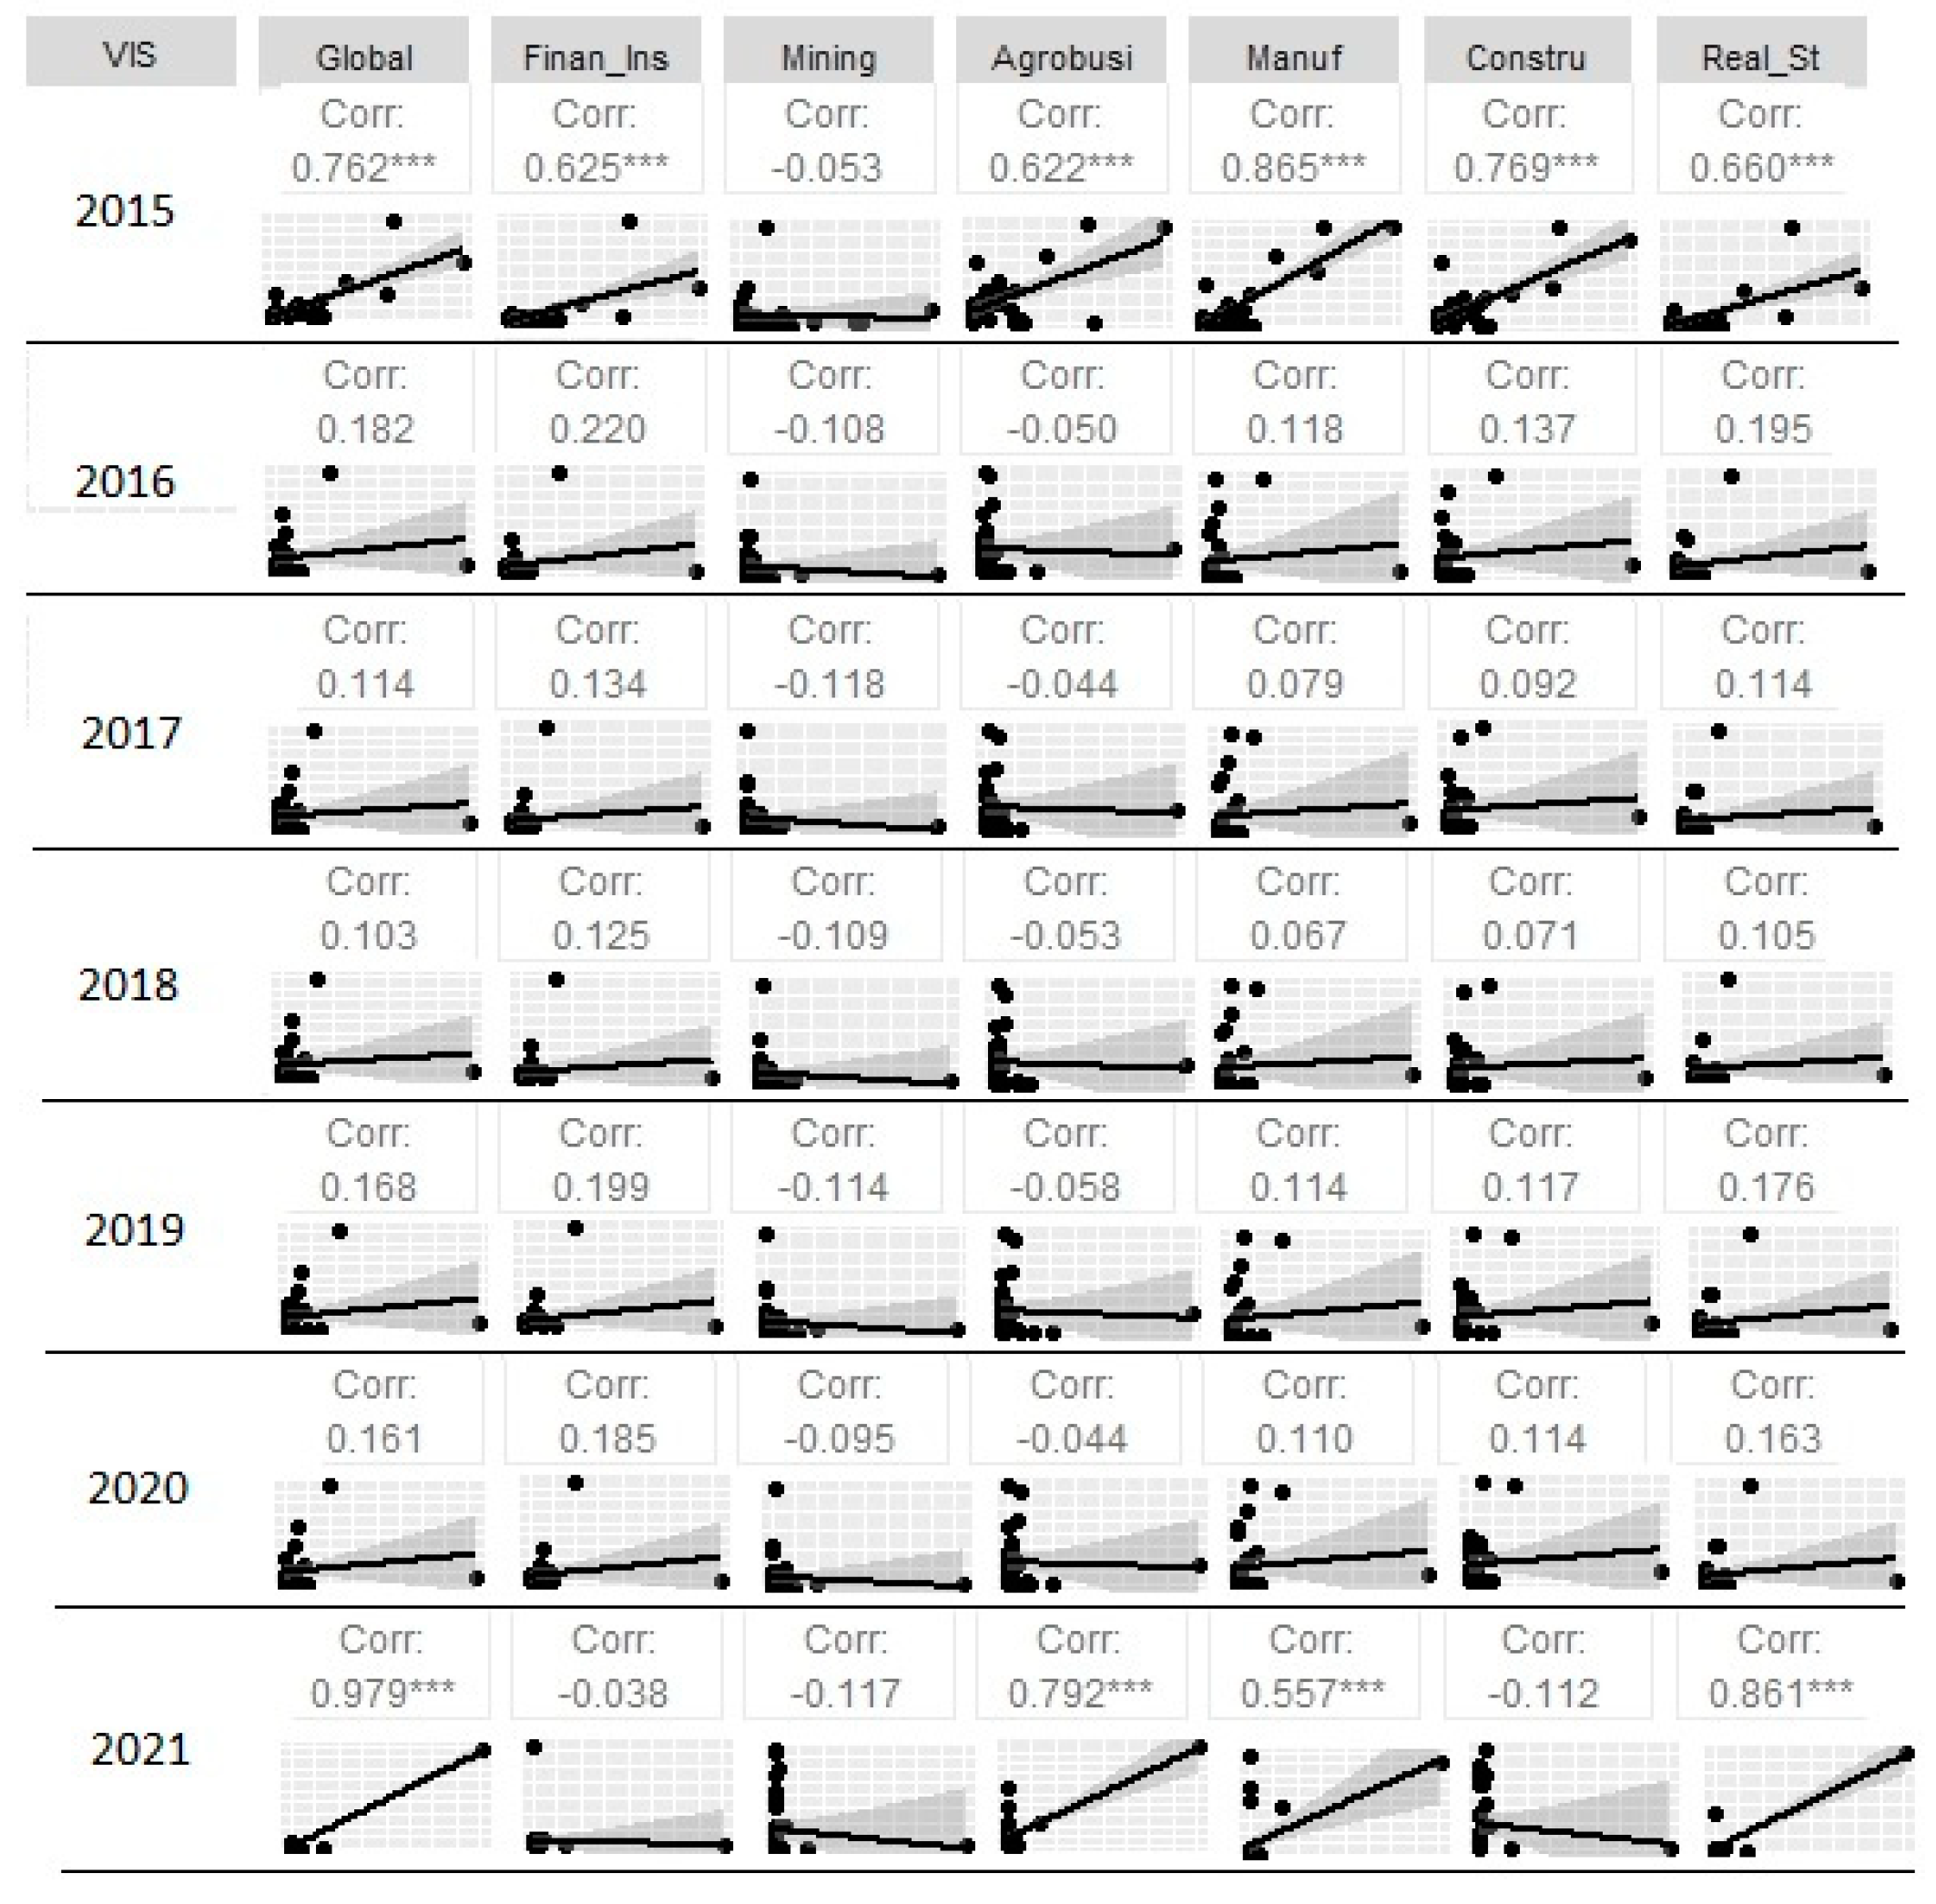
Regarding our hypothesis, the growth of the number of low-income (VIS) housing units offer in Colombia’s departments does not correlate with the overall economic development of each region (departmental GDP) in the 2016–2020 period. In 2015, the correlation was statistically acceptable (rho close to 0.60).
However, for 2021, the correlation is higher than in previous years (rho >0.80). This is because in 55% of the departments, the number of VIS units offer increased in 2021 compared to the average of previous years. In addition, Antioquia is the only region with a high economy that is included among the other 45% of departments that reduced their low-income housing units in 2021, with a reduction of only -10%. The other regions with the highest economies and VIS production in the country are Bogotá, Atlántico, Valle, Santander, and Cundinamarca, and they are all included in the group that did increase their number of VIS units in 2021.
Additionally, it can be seen that:
- (a)
the average percentage of the increase of VIS units between 2021 and the average of the previous years is 147%, while the difference is -72% for the departments that reduced their number of VIS in 2021.
- (b)
the standard deviation of the change in overall GDP in 2021 with respect to the average of previous years is 21%, and it is 164% for the number of VIS units.
The above explains that the increase in VIS units for 2021 was more significant than the decrease at the national level (in the corresponding departments). It also reveals that the considerable difference between the deviations of the 2 correlated variables means that one of them (general GDP) does not change significantly with respect to previous years, but the other (VIS) does, significantly modifying the rho value with respect to previous years.
The overall increase of VIS units in Colombia in 2021 was mainly driven by the need to generate more social housing to help improve the social and economic conditions of many people who fell into poverty due to the consequences of COVID-19.
The previous paragraphs support the significant change in the rho value for 2021 throughout almost the entire study.
The analysis divided by economic industries showed a similar behavior to that of the general GDP. On analyzing the correlation of the number of VIS units with the industry-specific GDPs for manufacturing, construction, real estate, and finance and insurance, these industries tend to be more developed in urban areas than in rural areas, which may be related to the fact that most of the VIS housing units are built in urban areas.
In contrast, mining and agriculture tend to be rural industries. In this case, the correlation with the number of VIS units is lower, and there is a significant difference between the two. For the mining industry, the rho value in 2015 is 0.06 while for agriculture, it is 0.37.
In the 2016–2020 period, the behavior of the 2 industries is similar with negative rho values (unlike the first 4 economic industries we analyzed) and they are not greater than - 0.22. Although the values are too low to validate a statistical correlation, them being negative confirms an inverse relationship between the development of rural industries and a higher investment in VIS housing.
In 2021, there is a significant rho value increase for the 2 industries: 0.30 for mining and 0.55 for agriculture. The explanation for this improved correlation is explained above with the explanation for the increase in VIS units.
4.2. Non-VIS housing
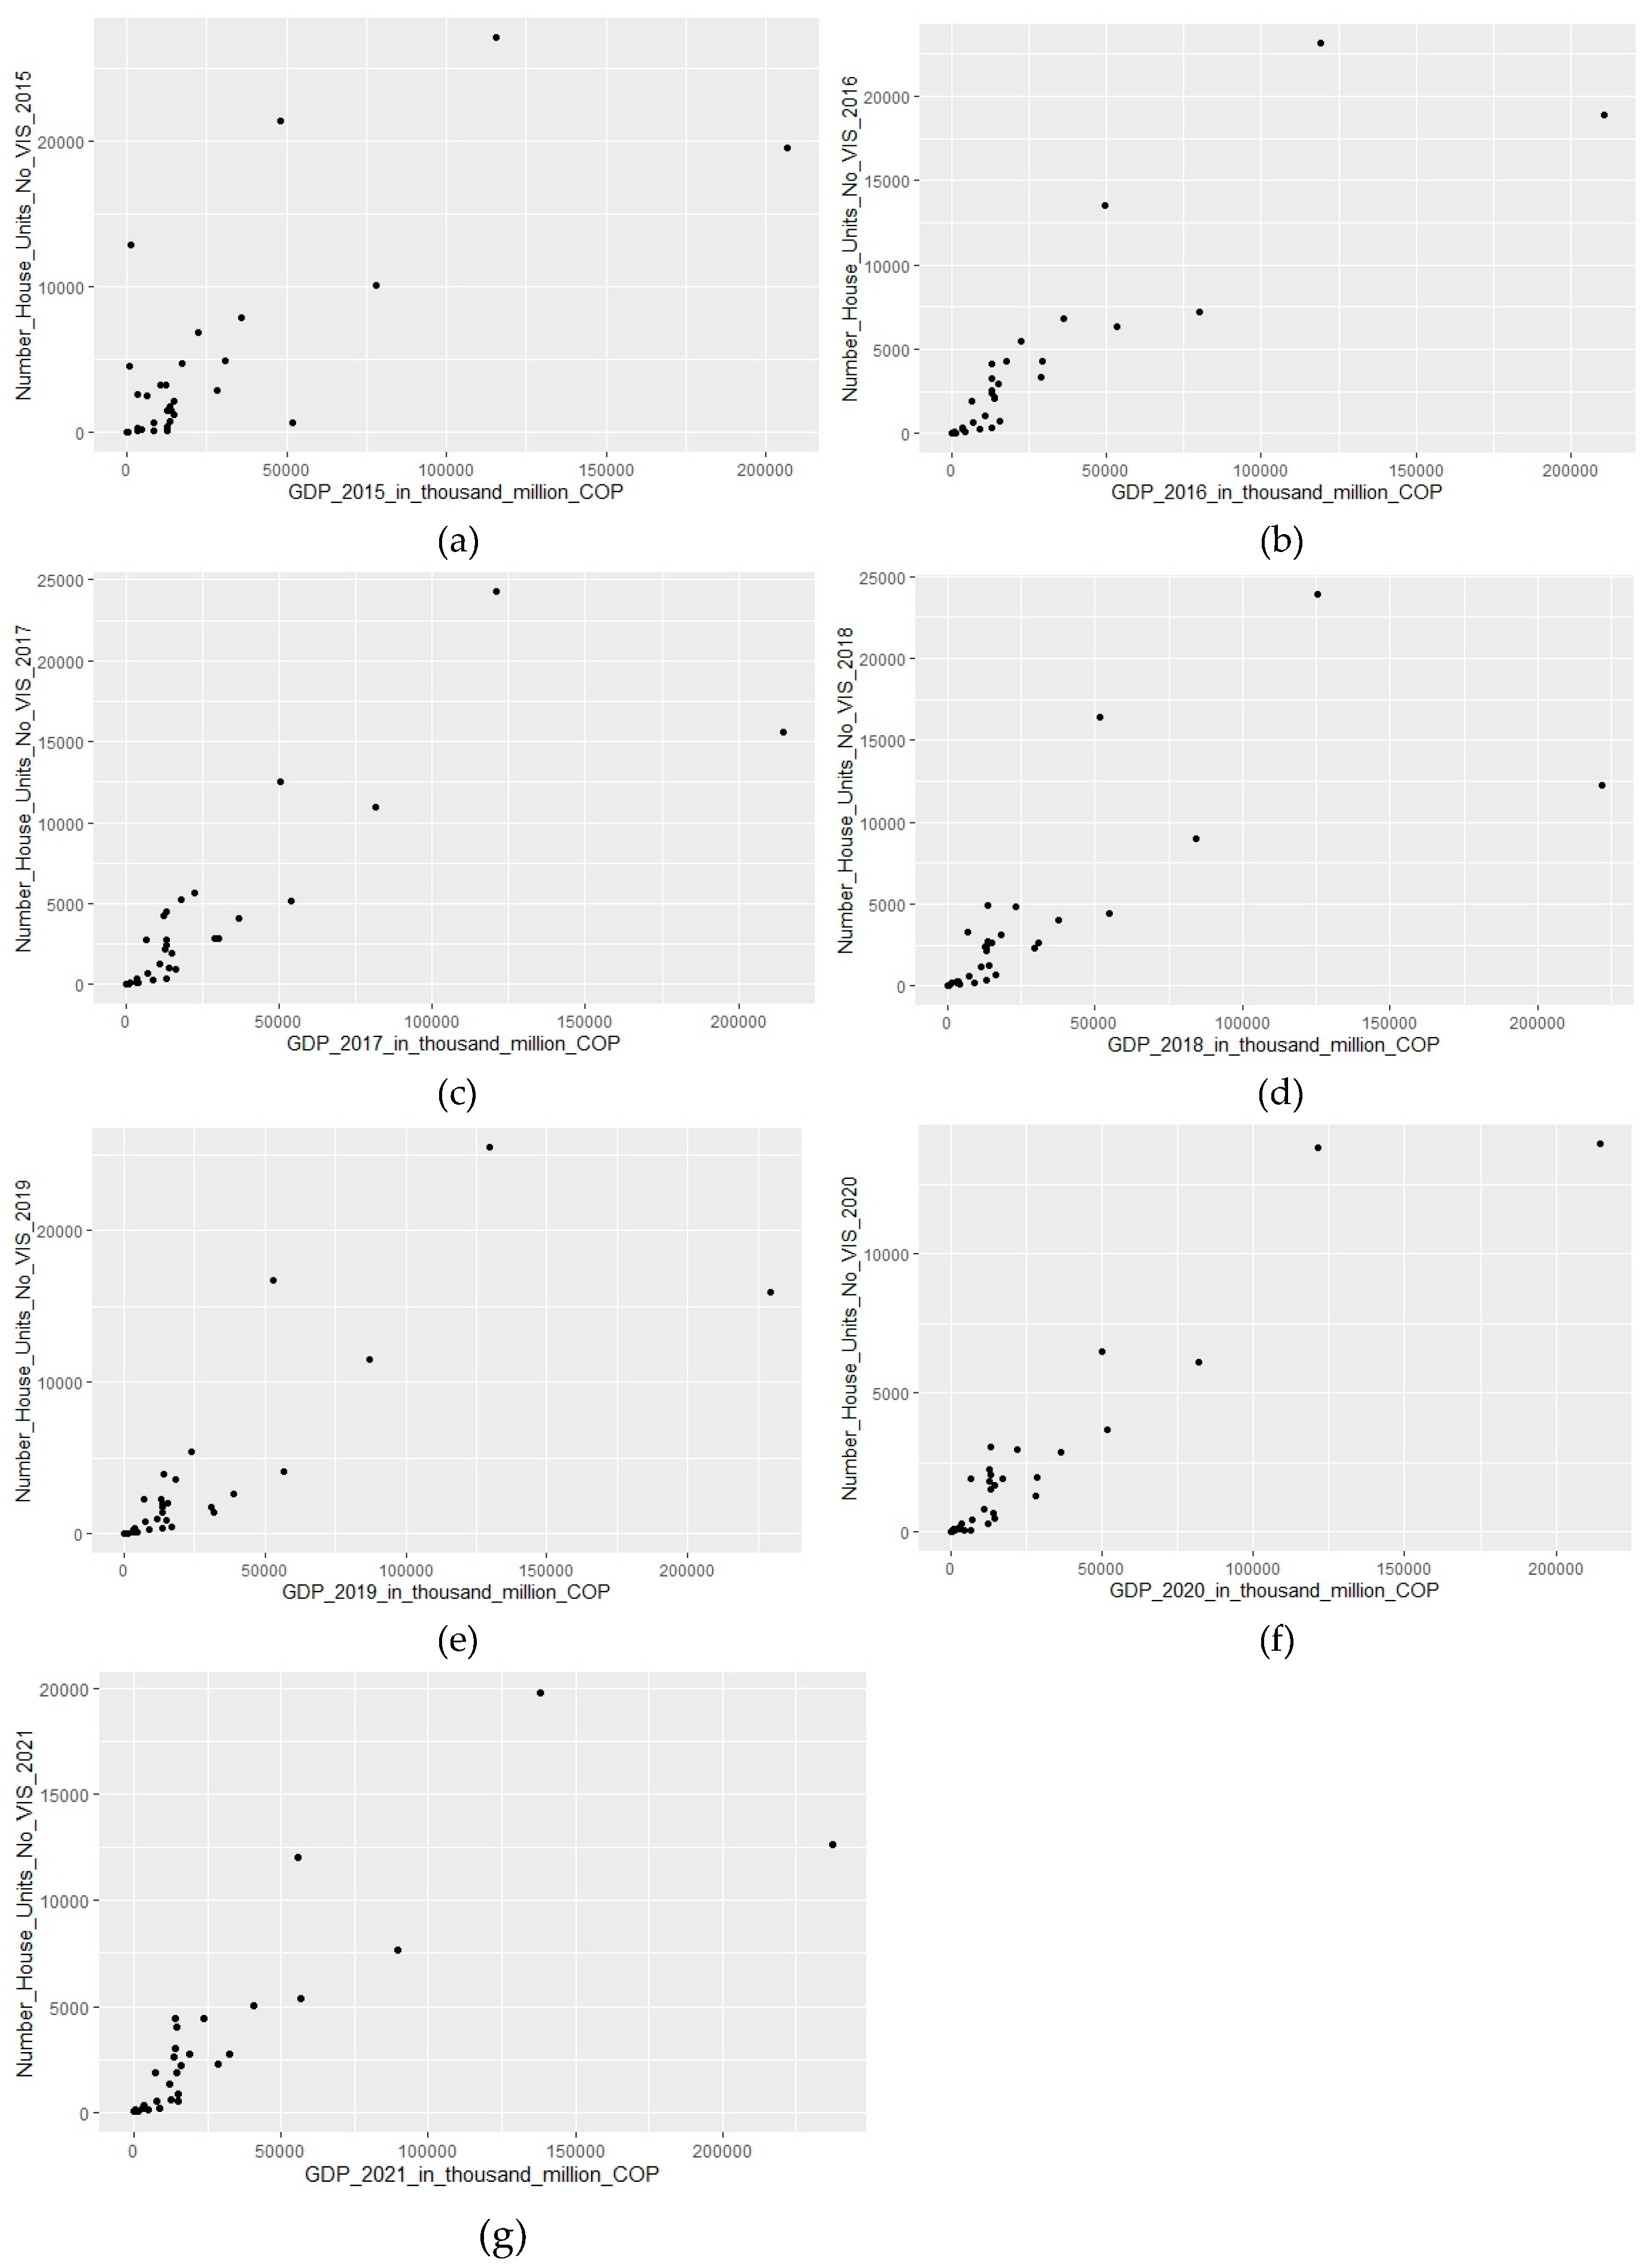
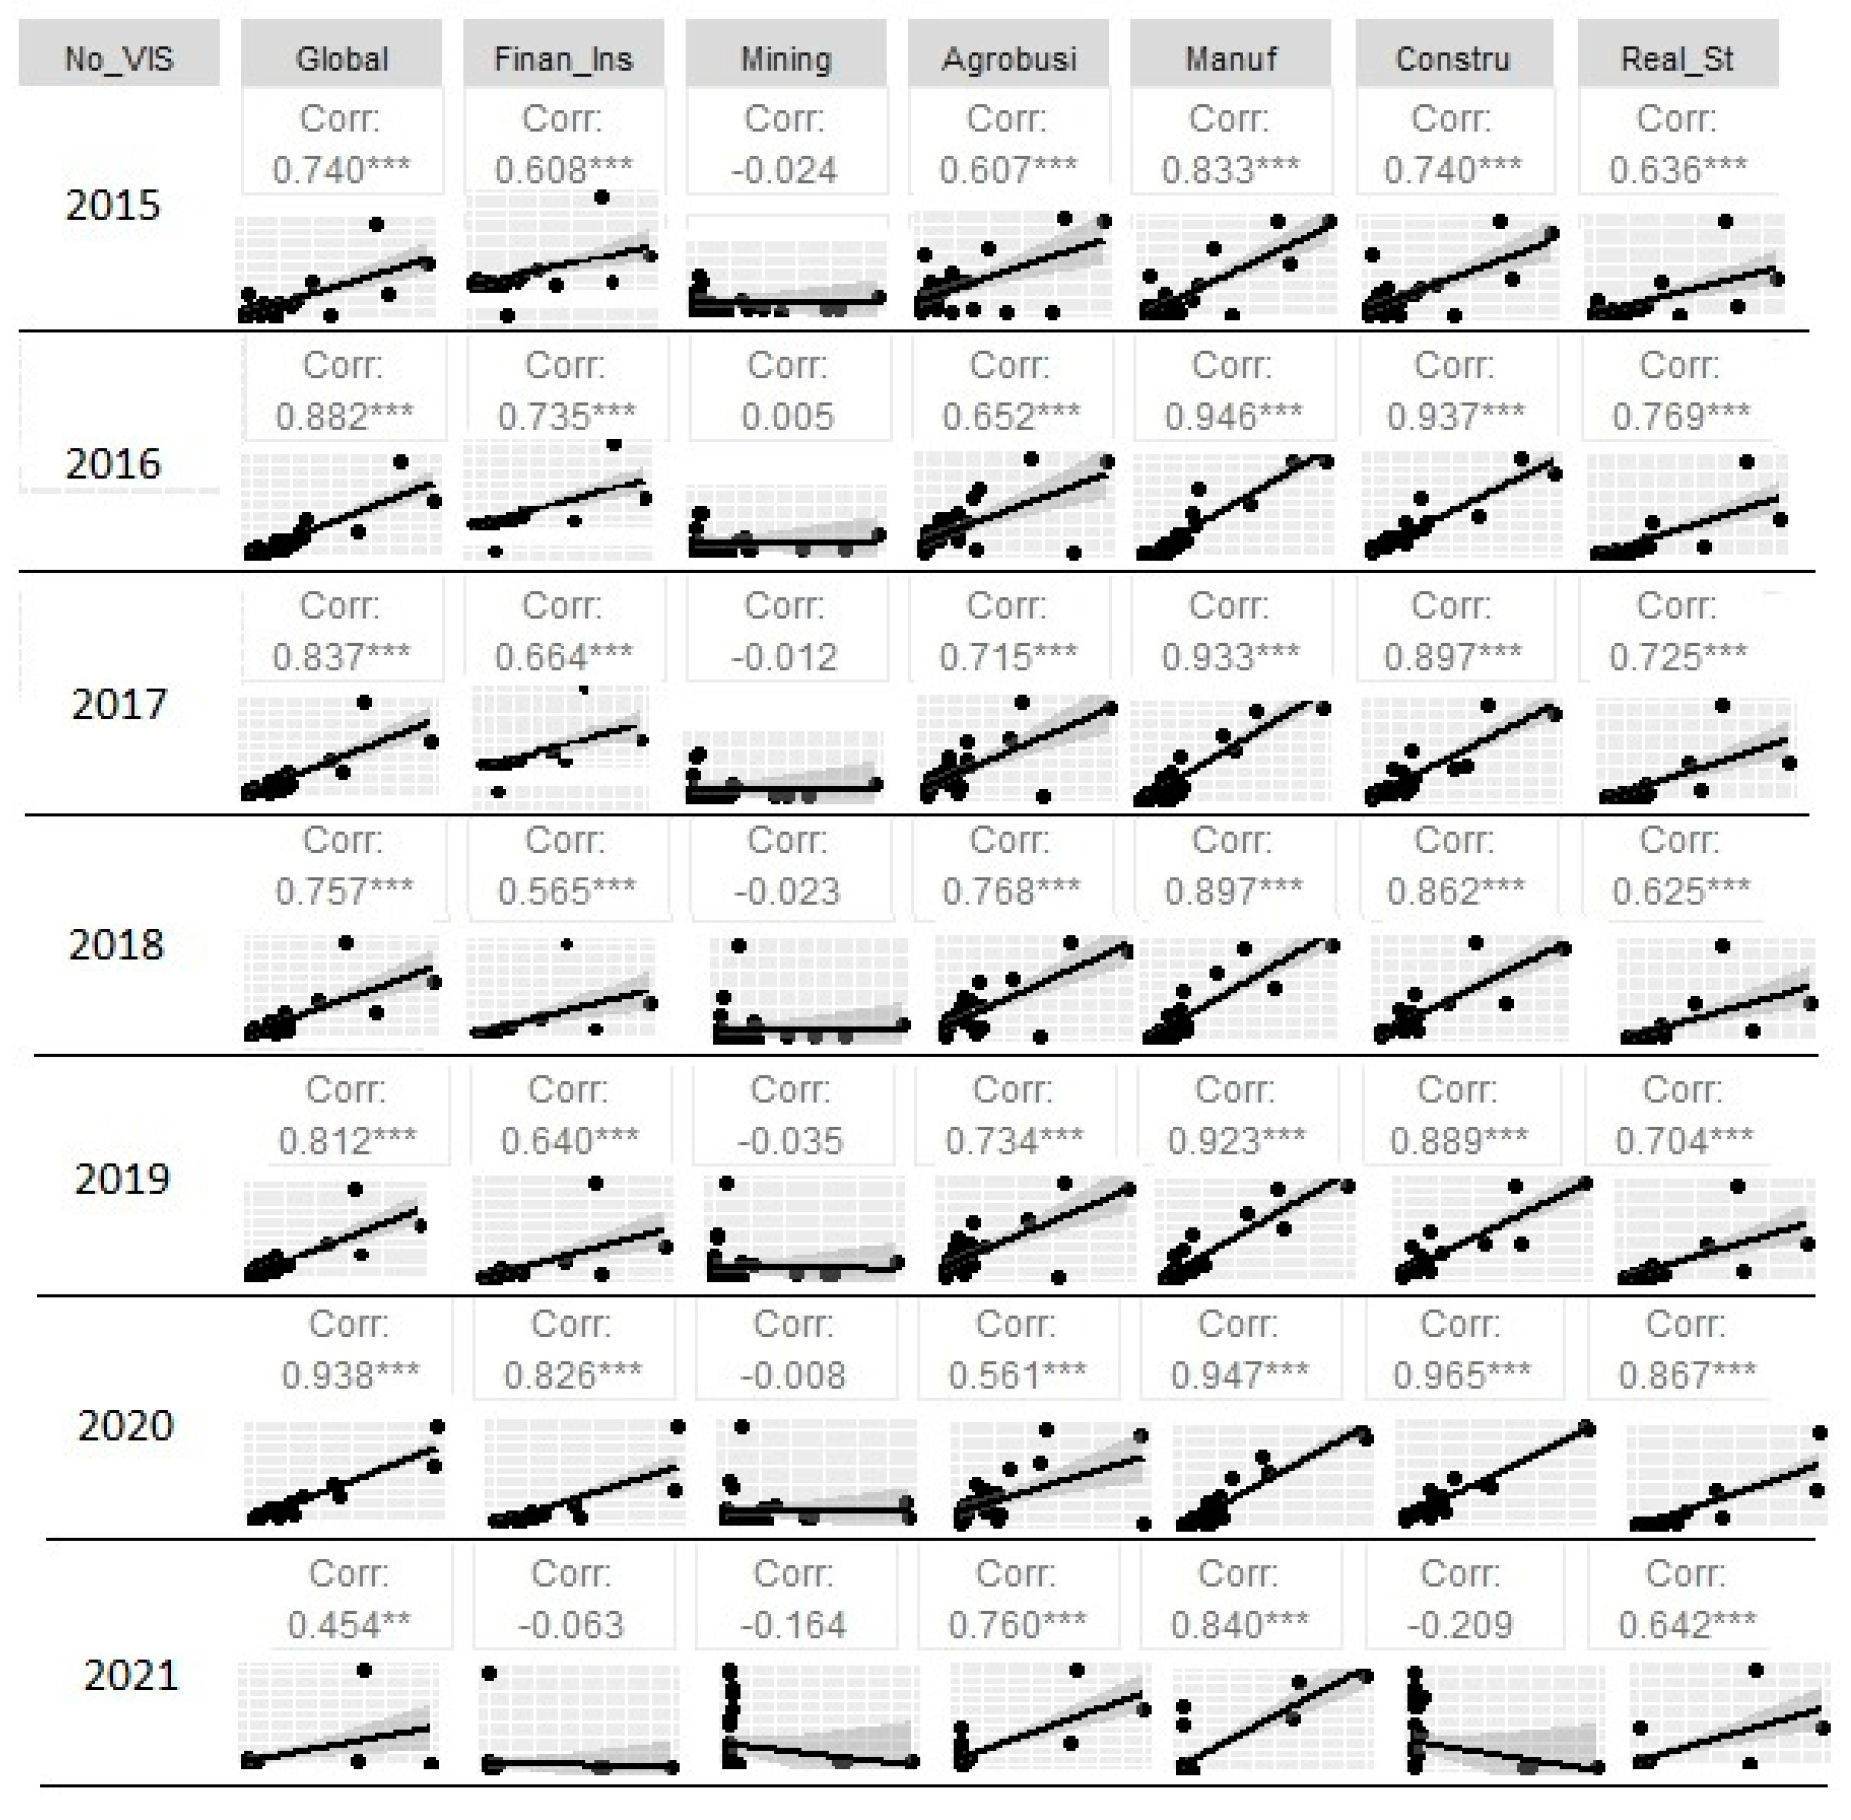
Correlating the economy of the departments (overall GDP) with the number of non-VIS units shows an important shift. In this case, the rho value remains high from 2016 onwards, with a minimum of 0.88. For the year 2021, the rho value does not vary significantly with respect to the previous years; in fact, it is vastly similar (= 0.92).
The industry-specific GDP analysis for manufacturing, construction, real estate, and finance and insurance yields an acceptable correlation for 2015 (rho close to 0.60) and a very good correlation between 2016 and 2021 (rho >0.90).
For the other 2 industries (mining and agriculture) the correlations improve compared to the data for VIS housing. The rho value for the former is very low for 2015 (= 0.16), and it improves in the following years with values close to 0.40. For the latter industry, the correlation improves with values close to 0.65 between 2016 and 2021.
Once again, as with the VIS units, the correlation between industry-specific economic development and the number of non-VIS housing units is better in the industries that are more prevalent in the urban context than in the rural context.
In general, economic development, measured by GDP, either overall or with industry-specific data, shows a better correlation with the development of non-VIS housing units. This is because non-VIS housing units are the most built in Colombia in terms of units and saleable area. They are also the most economically profitable for the building construction industry, considering that they are not social housing and are more expensive.
5. Conclusions
The economic standing of the departments in Colombia, measured through the overall GDP for the 2015–2021 period, has a very good statistical correlation with the number of non-VIS units, which hold the highest commercial value.
Conducting a correlation analysis using the general GDP of each department as an economic indicator should have similar results if replaced by the GDP per capita, since the correlation between these two indicators is very high.
At the economic-specific level, this correlation is higher with activities that are mostly developed in an urban environment, such as manufacturing, construction, real estate, and finance and insurance. The correlation is lower with industries such as mining and agriculture, which mostly operate in rural areas.
Conversely, the correlation of economic performance over the same period with the number of VIS social housing units offered is not good, except for the year 2021, which shows a significant increase in the number of registered housing units compared to previous years.
The industry-specific analysis for VIS housing yields low correlations, but are especially dismissible for more rural industries, such as mining and agriculture.
Given their low correlation, the above confirm the hypothesis that more low-income housing units are offered in departments with a stronger economy, due to its low level of poverty and unmet basic needs UBN.
It is also clear that regions with better economies develop the non-VIS housing market more (high rho values), especially in those that have better numbers in urban economic sector like manufacturing, construction, real estate, and finance and insurance; and have less relationship in those regions where the economic development has been better in rural activities like mining and agriculture.
Finally, the behavior of the non-VIS housing market (more expensive) is linked to the main economic sectors, but VIS social housing develops constantly, regardless of the situation of the main economic sectors.
Figure 1.
GDP per capita and GDP construction sector growth, in percentage (20 Latin America and Caribbean countries, between 1990 and 2020). Source: ECLAC (2022b).
Figure 1.
GDP per capita and GDP construction sector growth, in percentage (20 Latin America and Caribbean countries, between 1990 and 2020). Source: ECLAC (2022b).
Figure 2.
Population percentage distribution in urban and rural areas. Latin America and the Caribbean. Source: ECLAC (2022c).
Figure 2.
Population percentage distribution in urban and rural areas. Latin America and the Caribbean. Source: ECLAC (2022c).
Figure 3.
Population percentage distribution in urban and rural areas. Colombia. Source: ECLAC (2022c).
Figure 3.
Population percentage distribution in urban and rural areas. Colombia. Source: ECLAC (2022c).
Figure 4.
Colombia´s 33 departments number of house units VIS vs GDP, from (a) 2015; (b) 2016; (c) 2017; (d) 2018; (e) 2019; (f) 2020; and (g) 2021.
Figure 4.
Colombia´s 33 departments number of house units VIS vs GDP, from (a) 2015; (b) 2016; (c) 2017; (d) 2018; (e) 2019; (f) 2020; and (g) 2021.
Figure 5.
Colombia´s 33 departments number of house units No VIS vs GDP, from (a) 2015; (b) 2016; (c) 2017; (d) 2018; (e) 2019; (f) 2020; and (g) 2021.
Figure 5.
Colombia´s 33 departments number of house units No VIS vs GDP, from (a) 2015; (b) 2016; (c) 2017; (d) 2018; (e) 2019; (f) 2020; and (g) 2021.
Figure 6.
Rho values for the correlation between the number of VIS housing units and global and economic sectors GDP. Years from 2015 to 2021.
Figure 6.
Rho values for the correlation between the number of VIS housing units and global and economic sectors GDP. Years from 2015 to 2021.
Figure 7.
Rho values for the correlation between the number of No VIS housing units and global and economic sectors GDP. Years from 2015 to 2021.
Figure 7.
Rho values for the correlation between the number of No VIS housing units and global and economic sectors GDP. Years from 2015 to 2021.
Table 1.
Rho value for the correlation between Colombia regions GDPs per capita and UBN conditions., and inhabitants in extreme poverty.
Table 1.
Rho value for the correlation between Colombia regions GDPs per capita and UBN conditions., and inhabitants in extreme poverty.
| Percentage of UBN inhabitants |
Percentage of inhabitants in extreme poverty or misery |
Percentage of housing UBN inhabitants |
Percentage of basic public services UBN inhabitants |
Percentage of overcrowding UBN inhabitants |
| -0.84 |
-0.82 |
-0.75 |
-0.75 |
-0.80 |
Table 2.
Rho value for the correlation between general GDP and the number of VIS housing units.
Table 2.
Rho value for the correlation between general GDP and the number of VIS housing units.
| |
Gen_2015 |
Gen_2016 |
Gen_2017 |
Gen_2018 |
Gen_2019 |
Gen_2020 |
Gen_2021 |
| VIS_2015 |
0.59 |
|
|
|
|
|
|
| VIS_2016 |
|
0.29 |
|
|
|
|
|
| VIS_2017 |
|
|
0.20 |
|
|
|
|
| VIS_2018 |
|
|
|
0.27 |
|
|
|
| VIS_2019 |
|
|
|
|
0.26 |
|
|
| VIS_2020 |
|
|
|
|
|
0.28 |
|
| VIS_2021 |
|
|
|
|
|
|
0.86 |
Table 3.
Rho value for the correlation between general GDP and the number of No VIS housing units.
Table 3.
Rho value for the correlation between general GDP and the number of No VIS housing units.
| |
Gen_2015 |
Gen_2016 |
Gen_2017 |
Gen_2018 |
Gen_2019 |
Gen_2020 |
Gen_2021 |
| NoVIS_2015 |
0.64 |
|
|
|
|
|
|
| NoVIS_2016 |
|
0.94 |
|
|
|
|
|
| NoVIS_2017 |
|
|
0.90 |
|
|
|
|
| NoVIS_2018 |
|
|
|
0.88 |
|
|
|
| NoVIS_2019 |
|
|
|
|
0.88 |
|
|
| NoVIS_2020 |
|
|
|
|
|
0.89 |
|
| NoVIS_2021 |
|
|
|
|
|
|
0.91 |
Table 4.
Rho values for the correlation between the GDP of the manufacturing sector and the number of VIS housing units.
Table 4.
Rho values for the correlation between the GDP of the manufacturing sector and the number of VIS housing units.
| |
Manuf_2015 |
Manuf_2016 |
Manuf_2017 |
Manuf_2018 |
Manuf_2019 |
Manuf_2020 |
Manuf_2021 |
| VIS_2015 |
0.59 |
|
|
|
|
|
|
| VIS_2016 |
|
0.33 |
|
|
|
|
|
| VIS_2017 |
|
|
0.27 |
|
|
|
|
| VIS_2018 |
|
|
|
0.30 |
|
|
|
| VIS_2019 |
|
|
|
|
0.30 |
|
|
| VIS_2020 |
|
|
|
|
|
0.31 |
|
| VIS_2021 |
|
|
|
|
|
|
0.88 |
Table 5.
Rho values for the correlation between the GDP of the manufacturing sector and the number of No VIS housing units.
Table 5.
Rho values for the correlation between the GDP of the manufacturing sector and the number of No VIS housing units.
| |
Manuf_2015 |
Manuf_2016 |
Manuf_2017 |
Manuf_2018 |
Manuf_2019 |
Manuf_2020 |
Manuf_2021 |
| NoVIS_2015 |
0.62 |
|
|
|
|
|
|
| NoVIS_2016 |
|
0.96 |
|
|
|
|
|
| NoVIS_2017 |
|
|
0.92 |
|
|
|
|
| NoVIS_2018 |
|
|
|
0.93 |
|
|
|
| NoVIS_2019 |
|
|
|
|
0.91 |
|
|
| NoVIS_2020 |
|
|
|
|
|
0.92 |
|
| NoVIS_2021 |
|
|
|
|
|
|
0.91 |
Table 6.
Rho values for the correlation between the GDP of the construction sector and the number of VIS housing units.
Table 6.
Rho values for the correlation between the GDP of the construction sector and the number of VIS housing units.
| |
Const_2015 |
Const_2016 |
Const_2017 |
Const_2018 |
Const_2019 |
Const_2020 |
Const_2021 |
| VIS_2015 |
0.59 |
|
|
|
|
|
|
| VIS_2016 |
|
0.24 |
|
|
|
|
|
| VIS_2017 |
|
|
0.20 |
|
|
|
|
| VIS_2018 |
|
|
|
0.25 |
|
|
|
| VIS_2019 |
|
|
|
|
0.25 |
|
|
| VIS_2020 |
|
|
|
|
|
0.27 |
|
| VIS_2021 |
|
|
|
|
|
|
0.89 |
Table 7.
Rho values for the correlation between the GDP of the construction sector and the number of No VIS housing units.
Table 7.
Rho values for the correlation between the GDP of the construction sector and the number of No VIS housing units.
| |
Const_2015 |
Const_2016 |
Const_2017 |
Const_2018 |
Const_2019 |
Const_2020 |
Const_2021 |
| NoVIS_2015 |
0.63 |
|
|
|
|
|
|
| NoVIS_2016 |
|
0.96 |
|
|
|
|
|
| NoVIS_2017 |
|
|
0.93 |
|
|
|
|
| NoVIS_2018 |
|
|
|
0.90 |
|
|
|
| NoVIS_2019 |
|
|
|
|
0.91 |
|
|
| NoVIS_2020 |
|
|
|
|
|
0.91 |
|
| NoVIS_2021 |
|
|
|
|
|
|
0.94 |
Table 8.
Rho values for the correlation between the GDP of the real state sector and the number of VIS housing units.
Table 8.
Rho values for the correlation between the GDP of the real state sector and the number of VIS housing units.
| |
Real_2015 |
Real_2016 |
Real_2017 |
Real_2018 |
Real_2019 |
Real_2020 |
Real_2021 |
| VIS_2015 |
0.59 |
|
|
|
|
|
|
| VIS_2016 |
|
0.25 |
|
|
|
|
|
| VIS_2017 |
|
|
0.22 |
|
|
|
|
| VIS_2018 |
|
|
|
0.25 |
|
|
|
| VIS_2019 |
|
|
|
|
0.22 |
|
|
| VIS_2020 |
|
|
|
|
|
0.26 |
|
| VIS_2021 |
|
|
|
|
|
|
0.90 |
Table 9.
Rho values for the correlation between the GDP of the real state sector and the number of No VIS housing units.
Table 9.
Rho values for the correlation between the GDP of the real state sector and the number of No VIS housing units.
| |
Real_2015 |
Real_2016 |
Real_2017 |
Real_2018 |
Real_2019 |
Real_2020 |
Real_2021 |
| NoVIS_2015 |
0.63 |
|
|
|
|
|
|
| NoVIS_2016 |
|
0.97 |
|
|
|
|
|
| NoVIS_2017 |
|
|
0.96 |
|
|
|
|
| NoVIS_2018 |
|
|
|
0.93 |
|
|
|
| NoVIS_2019 |
|
|
|
|
0.94 |
|
|
| NoVIS_2020 |
|
|
|
|
|
0.95 |
|
| NoVIS_2021 |
|
|
|
|
|
|
0.95 |
Table 10.
Rho values for the correlation between the GDP of the financial sector and the number of No VIS housing units.
Table 10.
Rho values for the correlation between the GDP of the financial sector and the number of No VIS housing units.
| |
Finan_2015 |
Finan_2016 |
Finan_2017 |
Finan_2018 |
Finan_2019 |
Finan_2020 |
Finan_2021 |
| NoVIS_2015 |
0.62 |
|
|
|
|
|
|
| NoVIS_2016 |
|
0.97 |
|
|
|
|
|
| NoVIS_2017 |
|
|
0.95 |
|
|
|
|
| NoVIS_2018 |
|
|
|
0.92 |
|
|
|
| NoVIS_2019 |
|
|
|
|
0.92 |
|
|
| NoVIS_2020 |
|
|
|
|
|
0.93 |
|
| NoVIS_2021 |
|
|
|
|
|
|
0.95 |
Table 11.
Rho values for the correlation between the GDP of the financial sector and the number of VIS housing units.
Table 11.
Rho values for the correlation between the GDP of the financial sector and the number of VIS housing units.
| |
Finan_2015 |
Finan_2016 |
Finan_2017 |
Finan_2018 |
Finan_2019 |
Finan_2020 |
Finan_2021 |
| VIS_2015 |
0.57 |
|
|
|
|
|
|
| VIS_2016 |
|
0.30 |
|
|
|
|
|
| VIS_2017 |
|
|
0.24 |
|
|
|
|
| VIS_2018 |
|
|
|
0.28 |
|
|
|
| VIS_2019 |
|
|
|
|
0.26 |
|
|
| VIS_2020 |
|
|
|
|
|
0.30 |
|
| VIS_2021 |
|
|
|
|
|
|
0.90 |
Table 12.
Rho values for the correlation between the GDP of the mining sector and the number of VIS housing units.
Table 12.
Rho values for the correlation between the GDP of the mining sector and the number of VIS housing units.
| |
Min_2015 |
Min_2016 |
Min_2017 |
Min_2018 |
Min_2019 |
Min_2020 |
Min_2021 |
| VIS_2015 |
0.06 |
|
|
|
|
|
|
| VIS_2016 |
|
-0.09 |
|
|
|
|
|
| VIS_2017 |
|
|
-0.22 |
|
|
|
|
| VIS_2018 |
|
|
|
-0.13 |
|
|
|
| VIS_2019 |
|
|
|
|
-0.16 |
|
|
| VIS_2020 |
|
|
|
|
|
-0.13 |
|
| VIS_2021 |
|
|
|
|
|
|
0.30 |
Table 13.
Rho values for the correlation between the GDP of the mining sector and the number of No VIS housing units.
Table 13.
Rho values for the correlation between the GDP of the mining sector and the number of No VIS housing units.
| |
Min_2015 |
Min_2016 |
Min_2017 |
Min_2018 |
Min_2019 |
Min_2020 |
Min_2021 |
| NoVIS_2015 |
0.16 |
|
|
|
|
|
|
| NoVIS_2016 |
|
0.40 |
|
|
|
|
|
| NoVIS_2017 |
|
|
0.41 |
|
|
|
|
| NoVIS_2018 |
|
|
|
0.36 |
|
|
|
| NoVIS_2019 |
|
|
|
|
0.37 |
|
|
| NoVIS_2020 |
|
|
|
|
|
0.32 |
|
| NoVIS_2021 |
|
|
|
|
|
|
0.40 |
Table 14.
Rho values for the correlation between the GDP of the agrobusiness sector and the number of VIS housing units.
Table 14.
Rho values for the correlation between the GDP of the agrobusiness sector and the number of VIS housing units.
| |
Agro_2015 |
Agro_2016 |
Agro_2017 |
Agro_2018 |
Agro_2019 |
Agro_2020 |
Agro_2021 |
| VIS_2015 |
0.37 |
|
|
|
|
|
|
| VIS_2016 |
|
-0.04 |
|
|
|
|
|
| VIS_2017 |
|
|
-0.13 |
|
|
|
|
| VIS_2018 |
|
|
|
-0.09 |
|
|
|
| VIS_2019 |
|
|
|
|
-0.08 |
|
|
| VIS_2020 |
|
|
|
|
|
-0.05 |
|
| VIS_2021 |
|
|
|
|
|
|
0.55 |
Table 15.
Rho values for the correlation between the GDP of the agrobusiness sector and the number of No VIS housing units.
Table 15.
Rho values for the correlation between the GDP of the agrobusiness sector and the number of No VIS housing units.
| |
Agro_2015 |
Agro_2016 |
Agro_2017 |
Agro_2018 |
Agro_2019 |
Agro_2020 |
Agro_2021 |
| NoVIS_2015 |
0.42 |
|
|
|
|
|
|
| NoVIS_2016 |
|
0.68 |
|
|
|
|
|
| NoVIS_2017 |
|
|
0.68 |
|
|
|
|
| NoVIS_2018 |
|
|
|
0.64 |
|
|
|
| NoVIS_2019 |
|
|
|
|
0.68 |
|
|
| NoVIS_2020 |
|
|
|
|
|
0.62 |
|
| NoVIS_2021 |
|
|
|
|
|
|
0.67 |
