Submitted:
06 December 2023
Posted:
07 December 2023
You are already at the latest version
Abstract
Keywords:
1. Introduction
2. Materials and Methods
2.1. Samples Preparation


2.2. Samples Characterization
2.3. Computational Details
3. Results and Discussion
3.1. Mechanochemical Synthesis of Mg-HA

3.2. Lattice Parameters Predicted by DFT
3.3. Thermal Stability of Mg-HA
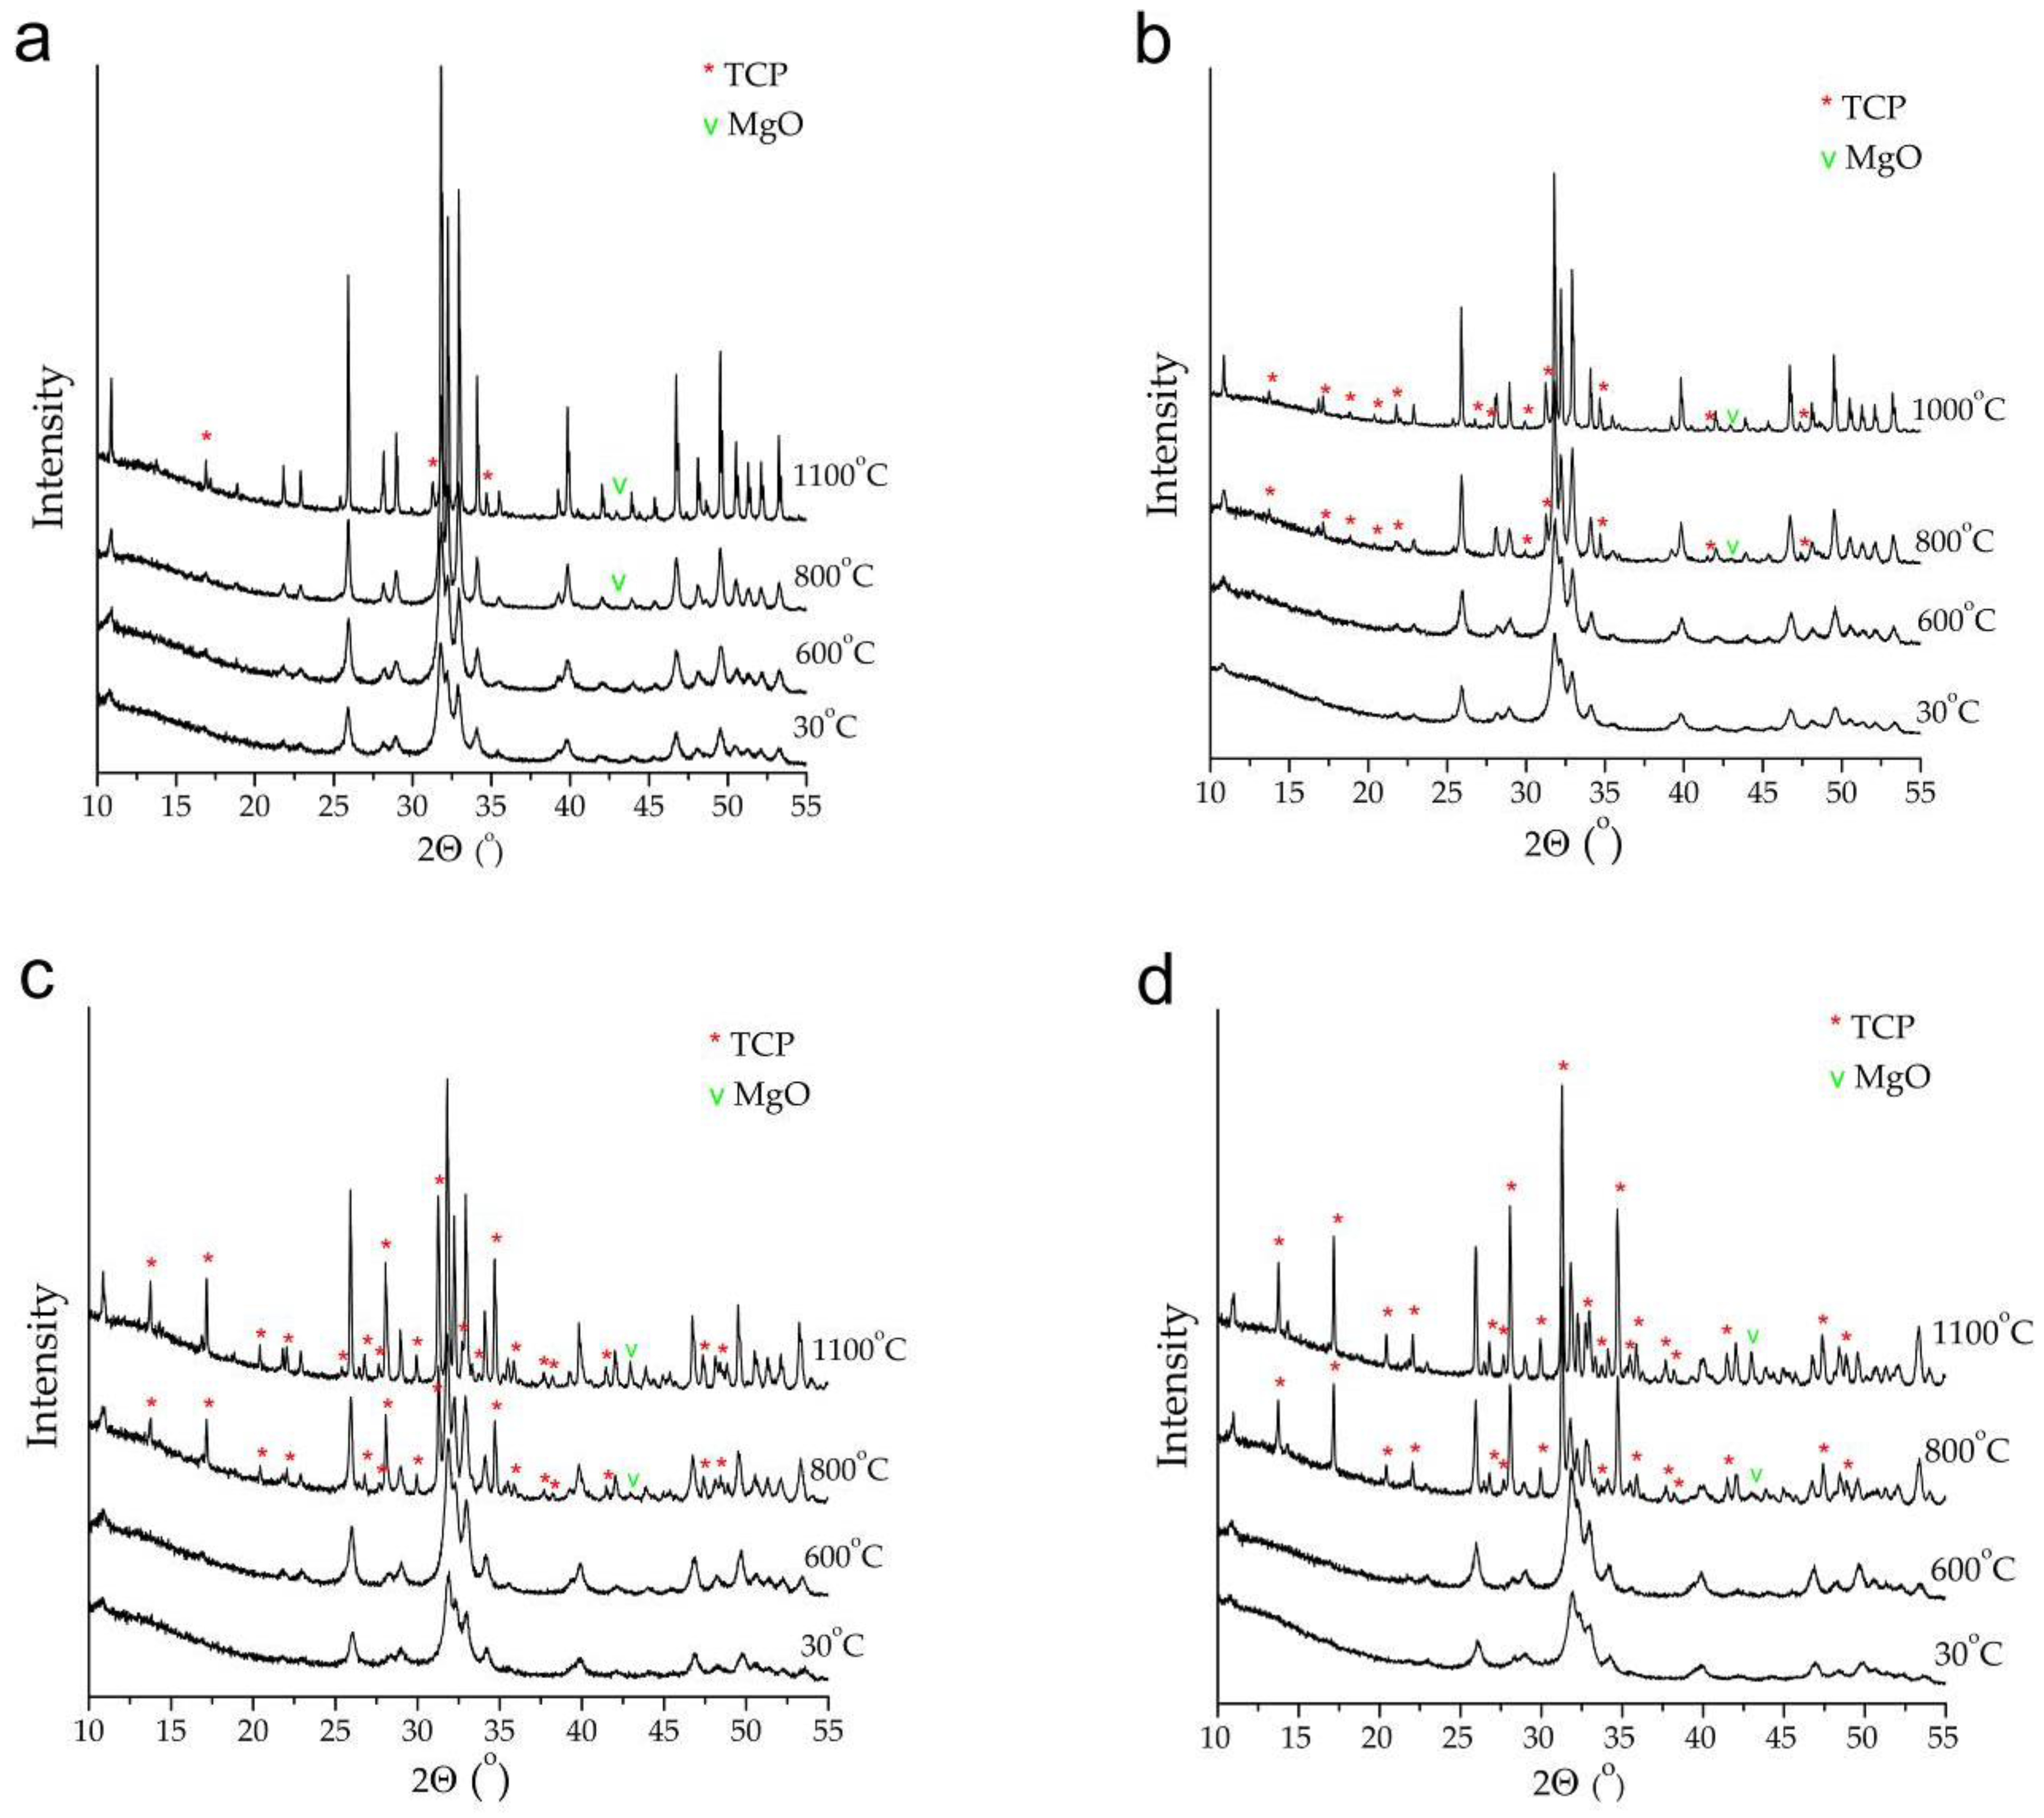
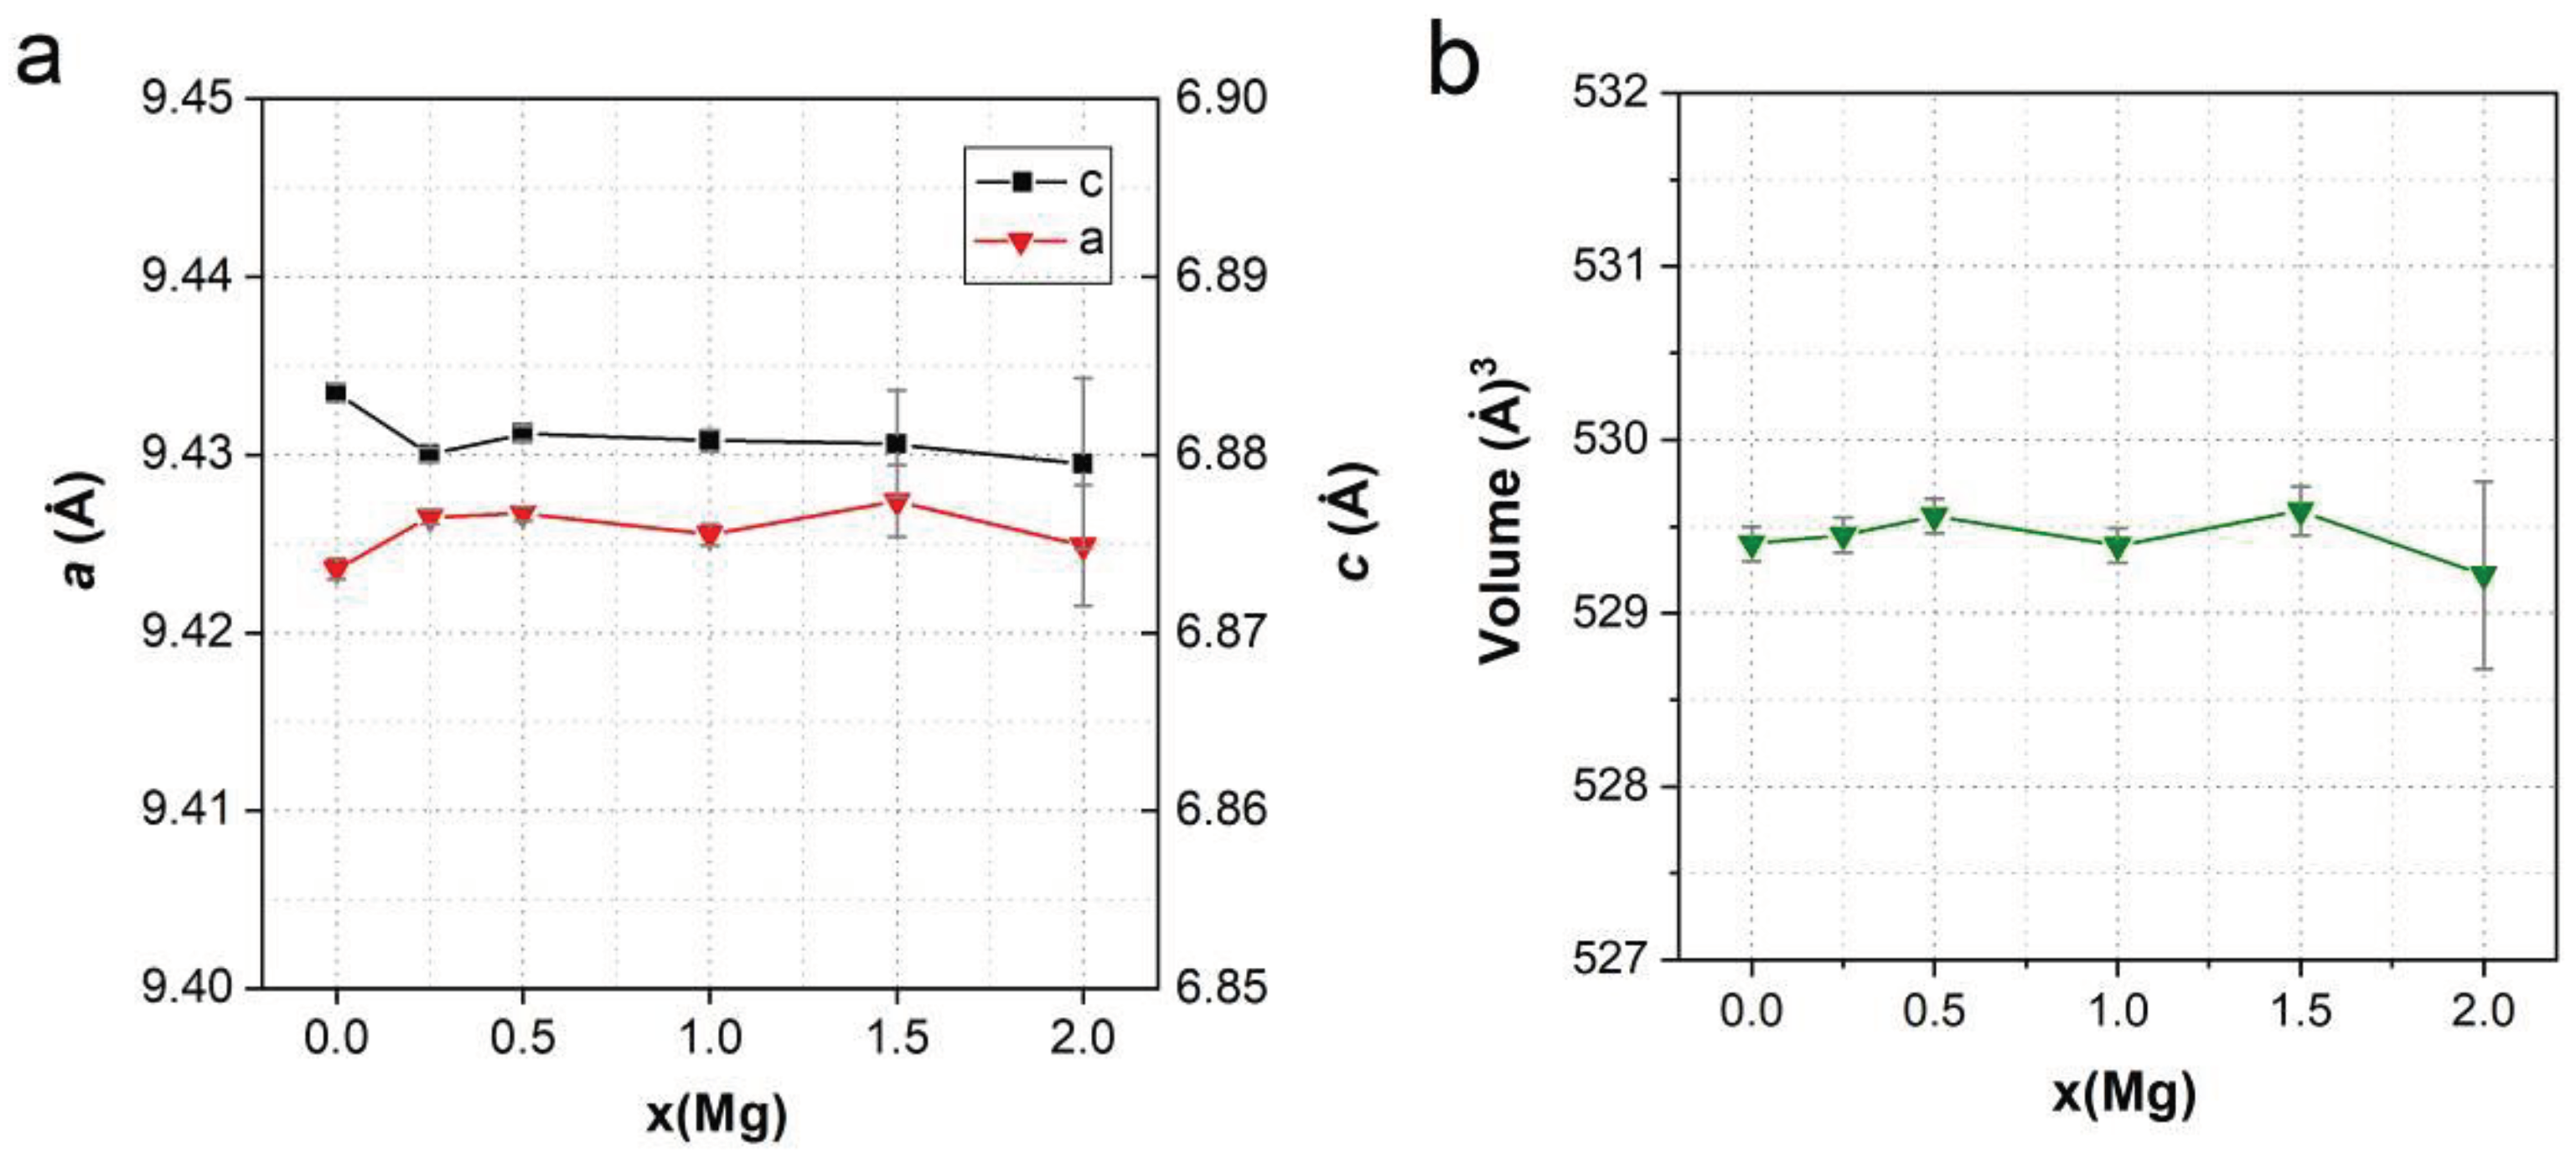


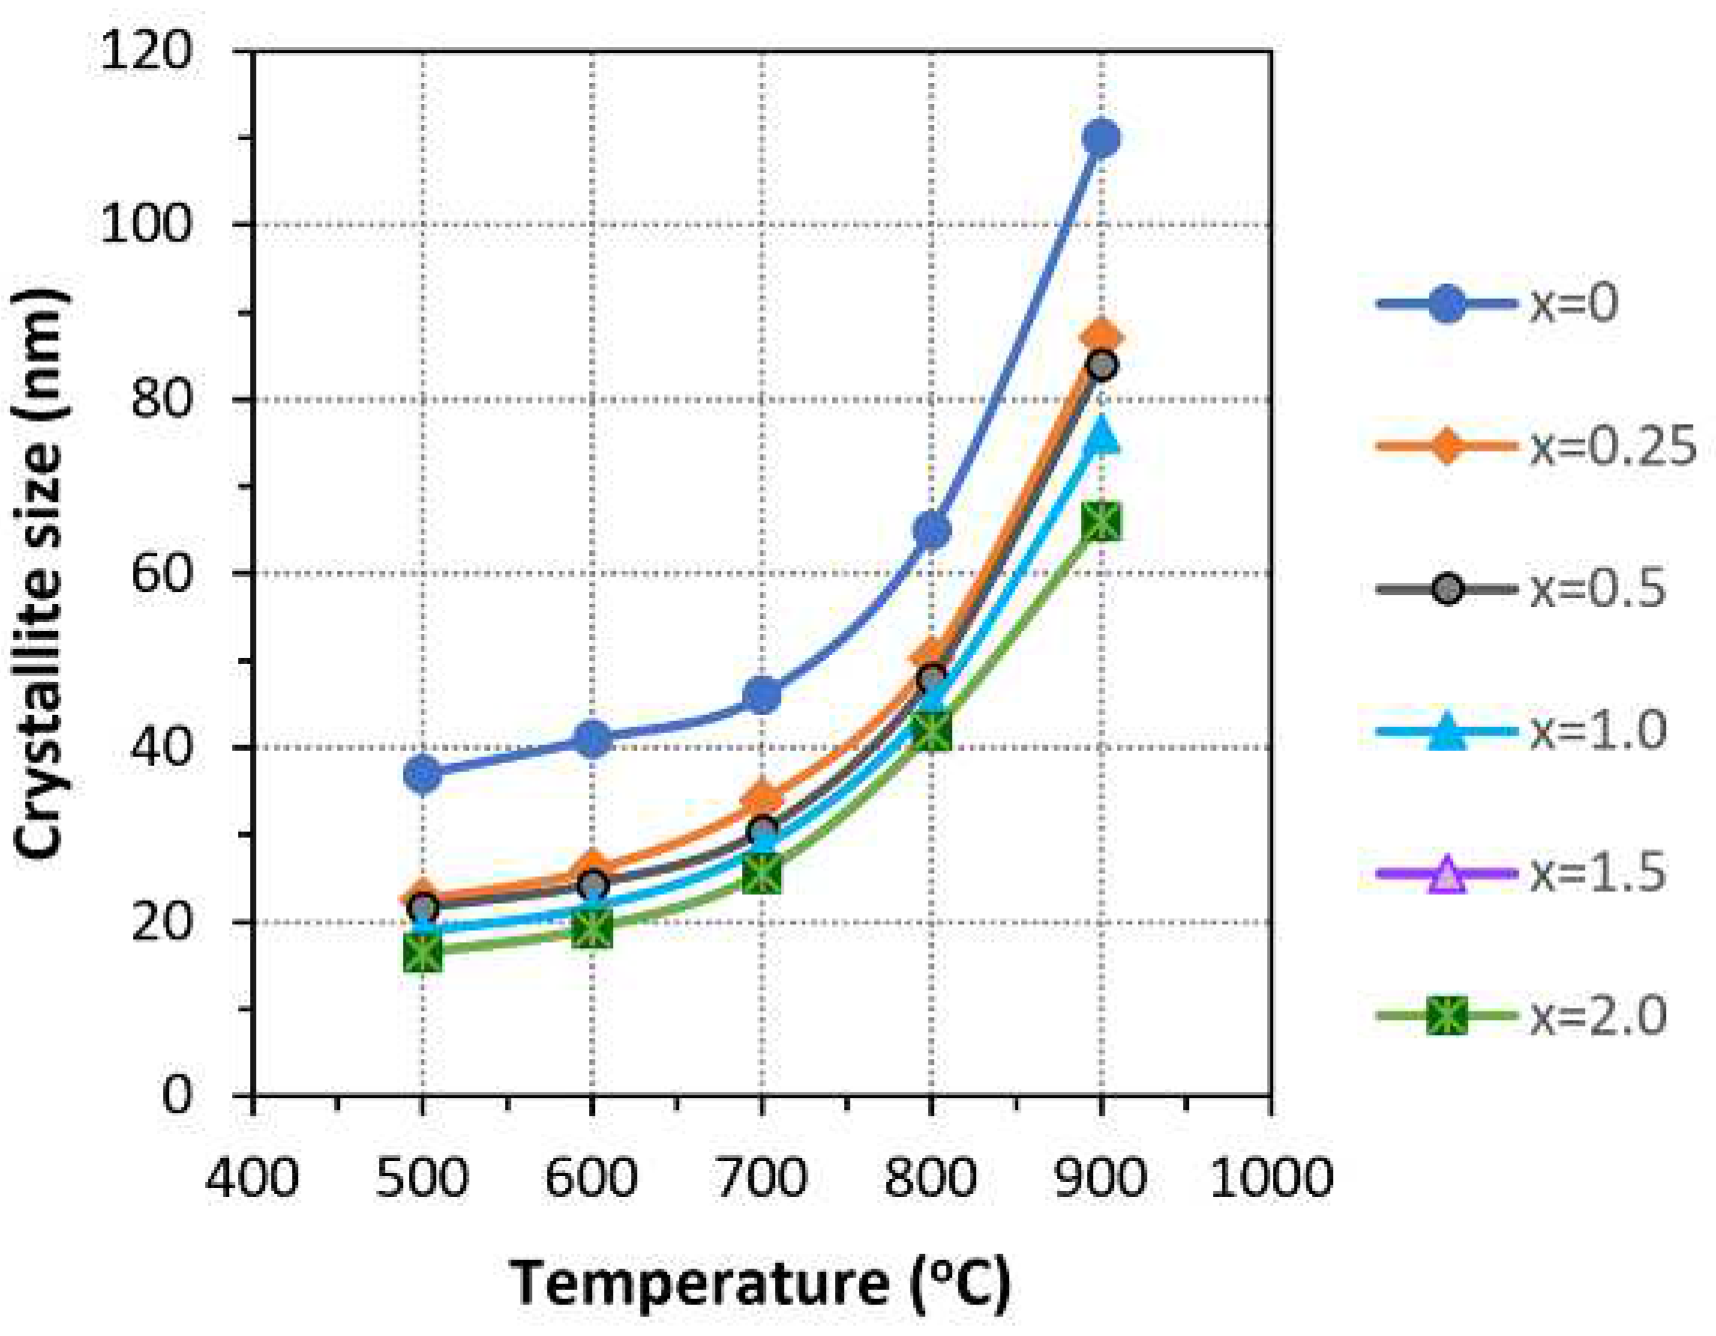
4. Conclusions
Supplementary Materials
Author Contributions
Funding
Institutional Review Board Statement
Informed Consent Statement
Data Availability Statement
Acknowledgments
Conflicts of Interest
References
- Thirumalai, J. Hydroxyapatite: advances in composite nanomaterials, biomedical applications and its technological facets. Intech Open, London, 2018. [CrossRef]
- Dorozhkin, S.V. Calcium orthophospates (CaPO4): occurrence and properties. Prog. Biomater. 2016, 5, 9–70. [Google Scholar] [CrossRef] [PubMed]
- Ratner, B.D.; Hoffman, A.S.; Schoen, F.J.; Lemons, J.E. Biomaterials Science, 3rd ed.; Academic Press: Oxford, UK, 2013; ISBN 978-0-12-374626-9. [Google Scholar]
- Elliott, J.C. Structure and chemistry of the apatites and other calcium orthophosphates; Elsevier Science: Amsterdam, The Netherlands, 1994; ISBN 0-444-81582-1. [Google Scholar]
- Supova, M. Substituted hydroxyapatites for biomedical applications: A review. Ceram. Int., 2015, 41, 9203–9231. [Google Scholar] [CrossRef]
- Tite, T.; Popa, A.-C.; Balescu, L.M.; Bogdan, I.M.; Pasuk, I.; Ferreira, J.M.F.; Stan, G.E. Cationic substitutions in hydroxyapatite: current status of the derived biofunctional effects and their in vitro interrogation methods. Materials 2018, 11, 2081. [Google Scholar] [CrossRef] [PubMed]
- Pepa, G.D.; Brandi, M.L. Microelements for bone boost: the last but not the least. Review. Review. Clin. Cases Miner. Bone Metab. 2016, 3, 181–185. [Google Scholar] [CrossRef] [PubMed]
- Lagier, R.; Baud, C.-A. Magnesium whitlockite, a calcium phosphate crystal of special interest in pathology. Pathol. Res. Pract. 2003, 199, 5–335. [Google Scholar] [CrossRef] [PubMed]
- Rude, R.K. Magnesium deficiency: a cause of heterogenous disease in humans. J. Bone Miner. Res. 1998, 13, 4–749. [Google Scholar] [CrossRef] [PubMed]
- Serre, C.M.; Papillard, M.; Chavassieux, P.; Voegel, J.C.; Boivin, G. Influence of magnesium substitution on a collagen-apatite biomaterial on the production of a calcifying matrix by human osteoblasts. J. Biomed. Mater. Res. 1998, 42, 4–626. [Google Scholar] [CrossRef]
- Ergun, C.; Webster, T.J.; Bizias, R.; Doremus, R.H. Hydroxylapatite with substituted magnesium, zinc, cadmium, and yttrium. I. Structure and microstructure. J. Biomed. Mater. Res. 2002, 59, 2–305. [Google Scholar] [CrossRef] [PubMed]
- Creedon, A.; Flynm, A.; Cashman, K. The effect of moderately and severely restricted dietary magnesium intakes on bone composition and bone metabolism in the rat. Br. J. Nutr. 2007, 82, 1–63. [Google Scholar] [CrossRef]
- Kannan, S.; Lemos, I.A. F.; Rocha, J.H. G.; Ferreira, J.M.F. Synthesis and characterization of magnesium substituted biphasic mixtures of controlled hydroxyapatite/β-tricalcium phosphate ratios. J. Sol. St. Chem. 2005, 178, 10–3190. [Google Scholar] [CrossRef]
- Rude, R.K.; Singer, F.R.; Gruber, H.E. Skeletal and hormonal effects of magnesium deficiency. J. Am. Coll. Nutr. 2009, 28, 2–131. [Google Scholar] [CrossRef] [PubMed]
- Toba, Y.; Kajita, Y.; Masuyama, R.; Takada, Y.; Suzuki, K.; Aoe, S. Dietary magnesium supplementation affects bone metabolism and dynamic strength of bone in ovariectomized rats. J. Nutr. 2000, 130, 2–216. [Google Scholar] [CrossRef]
- Landi, E.; Logroscino, G.; Proietti, L.; Tampieri, A.; Sandri, M.; Sprio, S. Biomimetic Mg-substituted hydroxyapatite: from synthesis to in vivo behavior. J Mater Sci: Mater Med. 2008, 19, 239–247. [Google Scholar] [CrossRef] [PubMed]
- Stipniece, L.; Salma-Ancane, K.; Borodajenko, N.; Sokolova, M.; Jakovlevs, D.; Berzina-Cimdina, L. Characterization of Mg-substituted hydroxyapatite synthesized by wet chemical method. Ceram. Int. 2014, 40, 2–3261. [Google Scholar] [CrossRef]
- Suchanek, W.L.; Byrappa, K.; Shuk, P.; Riman, R.E.; Janas, V.F. Kevor; TenHuisen, S. Preparation of magnesium-substituted hydroxyapatite powders by the mechanochemical–hydrothermal method. Biomaterials 2004, 25, 19–4647. [Google Scholar] [CrossRef] [PubMed]
- Ren, F.; Leng, Y.; Xin, R.; Ge, X. Synthesis, characterization and ab initio simulation of magnesium-substituted hydroxyapatite. Acta Biomater. 2010, 6, 2787–2796. [Google Scholar] [CrossRef] [PubMed]
- Goldberg, M.A.; Fomin, A.S.; Murzakhanov, F.F.; Makshakova, O.N.; Donskaya, N.O.; Antonova, O.S.; Gnezdilov, O.I.; Mikheev, I.V.; Knotko, A.V.; Kudryavtsev, E.A.; et al. The improved textural properties, thermal stability, and cytocompatibility of mesoporous hydroxyapatite by Mg2+ doping. Mater. Chem. Phys. 2022, 289, 126461. [Google Scholar] [CrossRef]
- Nagyné-Kovács, T.; Studnicka, L.; Kincses, A.; Spengler, G.; Molnár, M.; Tolner, M.; Lukács, I.E.; Szilágyi, I.M.; Pokol, G. Synthesis and characterization of Sr and Mg-doped hydroxyapatite by a simple precipitation method. Ceram. Int. 2018, 44, 18–22976. [Google Scholar] [CrossRef]
- Farzadi, A.; Bakhshi, F.; Solati-Hashjin, M.; Asadi-Eydivand, M.; A. abu Osman, N. Magnesium incorporated hydroxyapatite: Synthesis and structural properties characterization. Ceram. Int. 2014, 40, 4–6021. [Google Scholar] [CrossRef]
- Mayer, I.; Schlam, R.; Featherstone, J.D.B. Magnesium-containing carbonate apatites, J. Inorg. Biochem. 1997, 66, 1–1. [Google Scholar] [CrossRef]
- Cox, S.C.; Jamshidi, P.; Grover, L.M.; Mallick, K.K. Preparation and characterisation of nanophase Sr, Mg, and Zn substituted hydroxyapatite by aqueous precipitation. Mater. Sci. Eng. C 2014, 35, 106–114. [Google Scholar] [CrossRef] [PubMed]
- Yasukawa, A.; Ouchi, S.; Kandori, K.; Ishikawa, T. Preparation and characterization of magnesium–calcium hydroxyapatites. J. Mater. Chem. 1996, 6, 8–1401. [Google Scholar] [CrossRef]
- Shepherd, J.H.; Shepherd, D.V.; Best, S.M. Substituted hydroxyapatites for bone repair. J Mater Sci: Mater Med., 2012, 23, 2335–2347. [Google Scholar] [CrossRef] [PubMed]
- Geng, Z.; Cui, Z.; Li, Z.; Zhu, S.; Liang, Y.; Lu, W.W.; Yang, X. Synthesis, characterization and the formation mechanism of magnesium- and strontium-substituted hydroxyapatite. J. Mater. Chem. B. 2015, 3, 3738–3746. [Google Scholar] [CrossRef] [PubMed]
- Moussa, S.B.; Mehri, A.; Gruselle, M.; Beaunier, P. , Costentin, G.; Badraoui, B. Combined effect of magnesium and amino glutamic acid on the structure of hydroxyapatite prepared by hydrothermal method. Mater. Chem. Phys. 2018, 212, 21–29. [Google Scholar] [CrossRef]
- Evis, Z.; Sun. Z. P. Structural and mechanical investigations of magnesium and fluoride doped nanosize calcium phosphates. J. Ceram. Process. Res. 2010, 11, 6–701. [Google Scholar]
- Bigi, A.; Foresti, E.; Gregorini, R.; Ripamonti, A.; Roveri, N.; Shah. J.S. The role of magnesium on the structure of biological apatites. Calcif Tissue Int. 1992, 50, 5–439. [Google Scholar] [CrossRef]
- Bertoni, E.; Bigi, A.; Cojazzi, G.; Gandolfi, M.; Panzavolta, S.; Roveri, N. Nanocrystals of magnesium and fluoride substituted hydroxyapatite. J Inorg Biochem. 1998, 72, 1–2. [Google Scholar] [CrossRef]
- Gomes, S.; Renaudin, G.; Jallot, E.; Nedelec, J.M. Structural characterization and biological fluid interaction of Sol-Gel-derived Mg-substituted biphasic calcium phosphate ceramics. ACS Appl Mater Interfaces 2009, 1, 2–505. [Google Scholar] [CrossRef]
- Ezhova, Zh. A.; Koval, E.M.; Orlovskii, V.P. Synthesis and physicochemical study of collagen-containing calcium carbonatehydroxyapatites. Rus. J. Inorg. Chem. 2003, 48, 2–284. [Google Scholar]
- Rietveld, H.M. A Profile Refinement Method for Nuclear and Magnetic Structures. J. Appl. Cryst. 1969, 2, 65–70. [Google Scholar] [CrossRef]
- Bystrov, V.S.; Paramonova, E.V.; Avakyan, L.A.; Eremina, N.V.; Makarova, S.V.; Bulina, N.V. Effect of Magnesium Substitution on Structural Features and Properties of Hydroxyapatite. Materials 2023, 16, 17–5945. [Google Scholar] [CrossRef] [PubMed]
- Heyd, J.; Scuseria, G.E.; Ernzerhof, M. Hybrid functionals based on a screened Coulomb potential. J. Chem. Phys. 2003, 118, 18–8207. [Google Scholar] [CrossRef]
- Krukau, A.V.; Vydrov, O.A.; Izmaylov, A.F.; Scuseria, G.E. Influence of the exchange screening parameter on the performance of screened hybrid functionals. J. chem. Phys. 2006, 125, 22–224106. [Google Scholar] [CrossRef] [PubMed]
- Perdew, J.P.; Burke, K.; Ernzerhof, M. Generalized gradient approximation made simple. Phys. Rev. Lett. 1996, 77, 3865–3868. [Google Scholar] [CrossRef] [PubMed]
- Quantum ESPRESSO. Available online: https://www.quantum-espresso.org/ (accessed on 27 October 2023).
- Aryal, S.; Matsunaga, K.; Ching, W.Y. Ab initio simulation of elastic and mechanical properties of Zn- and Mg-doped hydroxyapatite (HAP). J. Mech. Behav. Biomed. Mater. 2015, 47, 135–146. [Google Scholar] [CrossRef] [PubMed]
- Shannon, R.D. Revised effective ionic radii and systematic studies of interatomic distances in halides and chalcogenides. Acta Cryst. A. 1976, 32, 5–751. [Google Scholar] [CrossRef]
- Chaikina, M.V.; Bulinaa, N.V.; Vinokurova, O.B.; Prosanov, I.Y.; Dudina, D.V. Interaction of calcium phosphates with calcium oxide or calcium hydroxide during the “soft” mechanochemical synthesis of hydroxyapatite. Ceram. Int. 2019, 45, 16927–1693. [Google Scholar] [CrossRef]
- Chaikina, M.V.; Bulinа, N.V.; Vinokurova, O.B.; Gerasimov, K.B.; Prosanov, I.Y.; Kompankov, N.B.; Lapina, O.B.; Papulovskiy, E.S.; Ischenko, A.V.; Makarova, S.V. Possibilities of mechanochemical synthesis of apatites with different Ca/P ratios. Ceramics 2022, 5, 404–422. [Google Scholar] [CrossRef]
- Moreira, M.P.; de Almeida Soares, G.D.; Dentzer, J.; Anselme, K.; de Sena, L.Á.; Kuznetsov, A.; dos Santos, E.A. Synthesis of magnesium- and manganese-doped hydroxyapatite structures assisted by the simultaneous incorporation of strontium. Mater Sci Eng C Mater Biol Appl. 2016, 1, 61–736. [Google Scholar] [CrossRef]
- Bohner, M.; Santoni, L.B.G.; Döbelin, N. β-tricalcium phosphate for bone substitution: Synthesis and properties. Acta Biomater. 2020, 113, 23–41. [Google Scholar] [CrossRef] [PubMed]
| Initial concentration | Powder composition after synthesis, wt.% | |||
|---|---|---|---|---|
| x(Mg) | MgО, wt.% | Mg-HA | MgO | TCP |
| 0 | 0 | 100 | 0 | 0 |
| 0.25 | 0.97 | 99.5 | 0.5 | 0 |
| 0.5 | 1.95 | 99.3 | 0.7 | 0 |
| 1.0 | 3.93 | 98.1 | 1.9 | 0 |
| 1.5 | 5.94 | 96.2 | 3.8 | 0 |
| 2.0 | 7.99 | 82.9 | 6.4 | 10.7 |
| Initial concentration of Mg (x) | MgO using (reaction 1) |
Mg(OH)2 using (reaction 2) |
Mg(Н2PO4)2·2Н2О using (reaction 3) |
||
|---|---|---|---|---|---|
| Mg-HA | MgO | TCP | Mg-HA | Mg-HA | |
| 0 | 100 | 0 | 0 | 100 | 100 |
| 0.25 | 99.2 | 0.8 | 0 | 100 | 100 |
| 0.5 | 98.6 | 1.4 | 0 | 100 | 100 |
| 1.0 | 97.5 | 2.5 | 0 | 100 | 100 |
| 1.5 | 92.6 | 3.3 | 4.1 | 100 | 100 |
| 2.0 | 74.8 | 4.1 | 21.1 | 100 | 100 |
| x(Mg) | Phase | Temperature (°C) | |||||
|---|---|---|---|---|---|---|---|
| 600 | 700 | 800 | 900 | 1100 | 1200 | ||
| 0.25 | HA | 100 | 100 | 99.7 | 94.1 | 94.1 | 91.1 |
| MgO | – | – | 0.3 | 0.5 | 0.8 | 0.6 | |
| TCP | – | – | – | 5.4 | 7.2 | 8.3 | |
| 0.5 | HA | 100 | 99.9 | 88.8 | 81.1 | 80.7 | 79.6 |
| MgO | – | 0.1 | 1.0 | 1.4 | 1.3 | 1.3 | |
| TCP | – | – | 10.2 | 17.5 | 17.9 | 19.0 | |
| 1.0 | HA | 100 | 99.0 | 70.0 | 58.0 | 56.8 | 54.6 |
| MgO | – | 1.0 | 2.0 | 2.6 | 2.6 | 2.8 | |
| TCP | – | – | 28.0 | 39.4 | 40.6 | 42.6 | |
| 1.5 | HA | 100 | 96.6 | 36.2 | 27.6 | 28.0 | 25.7 |
| MgO | – | 3.4 | 4.7 | 4.3 | 4.2 | 4.1 | |
| TCP | – | – | 59.1 | 68.1 | 67.8 | 70.2 | |
| 2.0 | HA | 100 | 94.3 | 14.3 | 6.1 | 5.1 | 6.4 |
| MgO | – | 3.1 | 6.6 | 5.9 | 5.7 | 5.8 | |
| TCP | – | 2.6 | 79.1 | 88.0 | 89.3 | 87.8 | |
Disclaimer/Publisher’s Note: The statements, opinions and data contained in all publications are solely those of the individual author(s) and contributor(s) and not of MDPI and/or the editor(s). MDPI and/or the editor(s) disclaim responsibility for any injury to people or property resulting from any ideas, methods, instructions or products referred to in the content. |
© 2023 by the authors. Licensee MDPI, Basel, Switzerland. This article is an open access article distributed under the terms and conditions of the Creative Commons Attribution (CC BY) license (http://creativecommons.org/licenses/by/4.0/).


