1. Introduction
The development of pharmaceuticals has led to longer life spans, saving millions of lives from deadly diseases, and improving the quality of life [
1]. The growing of the human population causes an increasement in the global consumption of pharmaceuticals [
2], thus representing a new class of emerging environmental contaminant and have raised the attention of global environmental researchers, because they are constantly released in the environment [
1] through wastewater treatment plants, surface-waters or soils, or human and animal excretion [
3].
The most studied pharmaceuticals are represented by antibiotics, painkillers, cardiovascular drugs due to their worldwide use [
4]. Taking into account that leading cause of death worldwide is represented by cancer [
5], the production and consumption of another class of pharmaceuticals – cytostatic is increasing, and therefore also their presence in the environment will increase [
2,
6]. Besides their ability to kill tumor cells, cytostatic are not specific to cancerous cells affecting also healthy cells [
7]. Once entered in the blood stream, these compounds are excreted in their unmetabolized form or as metabolites, the resulting effluents from hospitals, homes, and pharmacies reach the sewage system, with a negative impact on health of humans and the ecosystems [
6,
8].
Cyclophosphamide (CPP,
N,N-bis(2-chloroethyl)-1,3,2-oxazaphosphinan-2-amine 2-oxide) is an antineoplastic drug that is still being used to treat multiple myeloma, malignant lymphomas, leukemias, and carcinoma of the breast [
9]. Other cytostatic drugs such as doxorubicin (DOX, (7S,9S)-7-[(2R,4S,5S,6S)-4-amino 5-hydroxy-6-methyloxan-2-yl]oxy-6,9,11-trihydroxy-9-(2-hydroxyacetyl)-4-methoxy-8,10-dihydro-7
H-tetracene-5,12-dione), which belongs to the class of anthracycline antibiotics, is used for treating solid tumors, leukemia, lymphomas and breast cancer. Another cytostatic drug commonly reported to be present water is capecitabine (CPB, pentyl [1-(3,4-dihydroxy-5-methyltetrahydrofuran-2-yl)-5-fluoro-2-oxo-1H-pyrimidin-4-yl]carbamate), which is an oral chemotherapeutic agent used in the treatment of breast, esophageal and larynx, gastrointestinal and genitourinary tract cancers [
10].
Although the concentrations reported in surface water for cytostatic are usually below the concentration (or dose) effective in producing 50% of the maximal response (EC50) reported for a range of aquatic organisms [
11], their toxicological properties combined with poor biodegradability, could have negative impact on human and ecological health, even at very low concentrations. Therefore, it is important to assess the occurrence and fate of anticancer drugs in the environment, since their consumption has increased and it is expected to further increase in following years [
6].
Current employed methods for the detection of cytostatic pollutants in environmental samples rely mostly on chromatographic methods, such as liquid chromatography coupled to mass spectrometry (LC–MS) [
12,
13]. Although sensitive and reliable, they present several disadvantages such as time consuming and expensive technique, which requires sample pretreatment.
A promising and cheaper alternative could be the electroanalytical methods, which have high sensitivity and rapid response [
10] and also, due to their ease of use, accuracy, and reliability, being able to determine the levels of electroactive species quantitatively and qualitatively in a solution. The detection of the pollutants from water can be realized by the use of voltammetric or amperometric sensors, which can be developed related to the electrode composition together with the electrochemical techniques [
14].
The most important role for the sensing performance is given by the working electrode material, and carbon-based electrode material is very common and useful in electroanalysis but not always appropriate for detection at trace level concentrations due to electrode process kinetics, and slower electron mobility [
15]. This disadvantage is overcome by modifying carbon-based composition. Various chemically modified carbon paste electrodes have been widely used in electrochemical applications as sensitive and selective electrodes for the determination of different compounds [
16,
17,
18,
19,
20]. Also, a new kind of porous nanostructure characterized by high surface area, high electrical conductivity, significant mechanical strength and chemical stability is offered by carbon nanotubes (CNTs) [
21,
22].
Ferrocene (Fc), widely employed as an internal standard in electrochemistry, has a sandwich structure with the d-π interactions between Fe(II) and the cyclopentadienyl rings leading to unique chemical properties, the most important being the ability to undergo reversible oxidation to ferrocenium ion (Fc
+) [
23]. Other key features of this molecule are the chemical stability, low toxicity and its ease of functionalization on either one or both of the cyclopentadienyl rings maintaining the electrochemical reversibility of the parent molecule [
24], leading to the research of Fc and its derivatives as electrochemical sensors for the detection of environmental pollutant [
23]. Recently, ferrocene-containing gallic acid derivative (Gal-Fc) have been characterized by our team and it have been found to possess properties suitable as candidate in sensing application [
25]. Therefore, the ferrocene and its derivatives may be used as materials in different areas of current interest such as: sensing and catalysis.
Gallic acid or 3,4,5-trihydroxybenzoic acid is one common polyphenolic compound found in plants [
26]. Gallic acid and its derivatives are mostly researched due to its various biological activities, such as antibacterial, antiviral, anti-inflammatory, and antitumor activities etc. [
27]. The presence of carboxylic and hydroxylic functional groups on this type of molecules makes them potential candidates for electrochemical applications. For example, propyl gallate was used as a modified paste electrode for the detection of low concentrations of uranium [
28], while epigallocatechin gallate was used as electrochemical sensors for the simultaneous detection of redox-active biomolecules, such as dopamine, uric acid and ascorbic acid [
29].
Based on this background, and our preliminary reported results [
25], the aim of this study is to modify carbon nanotubes (CNT) with ferrocene-containing gallic acid derivative (Gal-Fc) in paraffin oil by simple mechanical mixing to develop sensitive method for the electrochemical detection of cytostatic, i.e., doxorubicin (DOX), capecitabine (CPB), and cyclophosphamide (CPP). Considering electrocatalytic activity of Gal-Fc-CNT, differential-pulsed and square-wave voltammetry techniques are exploited to develop simultaneous and/ or selective detection of cytostatic in water samples.
2. Materials and Methods
Ferrocene, anhydrous AlCl3, NaBH4, DCM and THF were purchased from Sigma Aldrich, Darmstadt, Germany and were used as received. The solvents used for the column chromatography were technical grade and were purchased from Carlo Erba, Emmendingen, Germany. Multiwall carbon nanotubes (CNT) synthesized by catalytic carbon vapor deposition (CCVD) were purchased from NanocylTM, Belgium. Standard stock solution of 1 g⸱L-1 doxorubicin (DOX), capecitabine (CPB), and cyclophosphamide (CPP) were prepared daily from analytical grade Sigma Aldrich reagents using double distilled water. The supporting electrolyte for the characterization and application of electrode material in detection process was 0.1 M NaOH solution, which was freshly prepared from NaOH of analytical purity (Merck) with double distillated water. 0.1 M Na2SO4 was used to adjust the pH (3 and 5) of the supporting electrolyte.
Infrared spectra were recorded on a Cary 630 FT-IR spectrophotometer (Penang, Malaysia) in the range 4000-400 cm-1, as KBr pellets.
The 1H-NMR were recorded in CDCl3 using Bruker FOURIER 300 MHz (Karlsruhe, Germany).
A Flash 2000 microanalyzer from ThermoFisher Scientific (Dartford, UK) was used for CHN Elemental analysis.
The working paste electrode was obtained by simple mechanical mixing of certain amount of carbon nanotubes (CNT), with ferrocene-containing gallic acid derivative (Gal-Fc) and paraffin oil (oil), to assure the weight ratio of Gal-Fc: CNT: oil= 1: 1: 2.5 for Gal-Fc-CNT paste electrode.
The voltammetric techniques, i.e., cyclic voltammetry (CV), differential-pulsed voltammetry (DPV), square-wave voltammetry (SWV), were employed at ambient room temperature (∼20◦C) using an Autolab potentiostat/ galvanostat PGSTAT 302N (EcoChemie, Utrecht, the Netherlands), controlled by 4.9 GPES software. The classical three-electrode cell, consisting of the working Gal-Fc-CNT paste electrodes, saturated calomel electrode (SCE) as reference electrode for checking the electrode potential, and a platinum counter electrode (Pt).
The lowest limit of detection (LOD) and the limit of the quantification (LQ) were determined with the equations of LOD = 3 SD/m and LQ = 10 SD/m, where SD is the standard deviation of three blanks and m is the slope of the analytical plots [
21,
30]. The reproducibility of the electrodes using the above-mentioned technique was evaluated by the relative standard deviation (RSD) for three replicates measurements of DOX, CPB, and CPP concentrations.
3. Results
The Gal-Fc compound, with the chemical structure presented in
Figure 1, was obtained in a multi-step procedure according to our previously published work [
25] and the synthetic route is presented in
Supplementary Materials-Scheme S1. Briefly, compound I was obtained through the electrophilic aromatic substitution of the ferrocene ring by the acyl chloride of 11-bromoundecanoic acid employing a Friedel-Crafts reaction [
31], while the intermediate compound 2 was obtained by modifying the molar ratio between the gallic acid, base (K
2CO
3) and the corresponding alkyl bromide to favor the formation of the desired compound (see
Supplementary Materials). Gal-Fc was obtained after a Williamson etherification reaction between intermediate compound I and compound II, followed by the ester hydrolysis in basic media (
Supplementary Materials-Scheme S1).
The intermediates and the targeted compound Gal-Fc were characterized by FT-IR (
Figure 2) and
1H-NMR spectroscopies (
Figure 3).
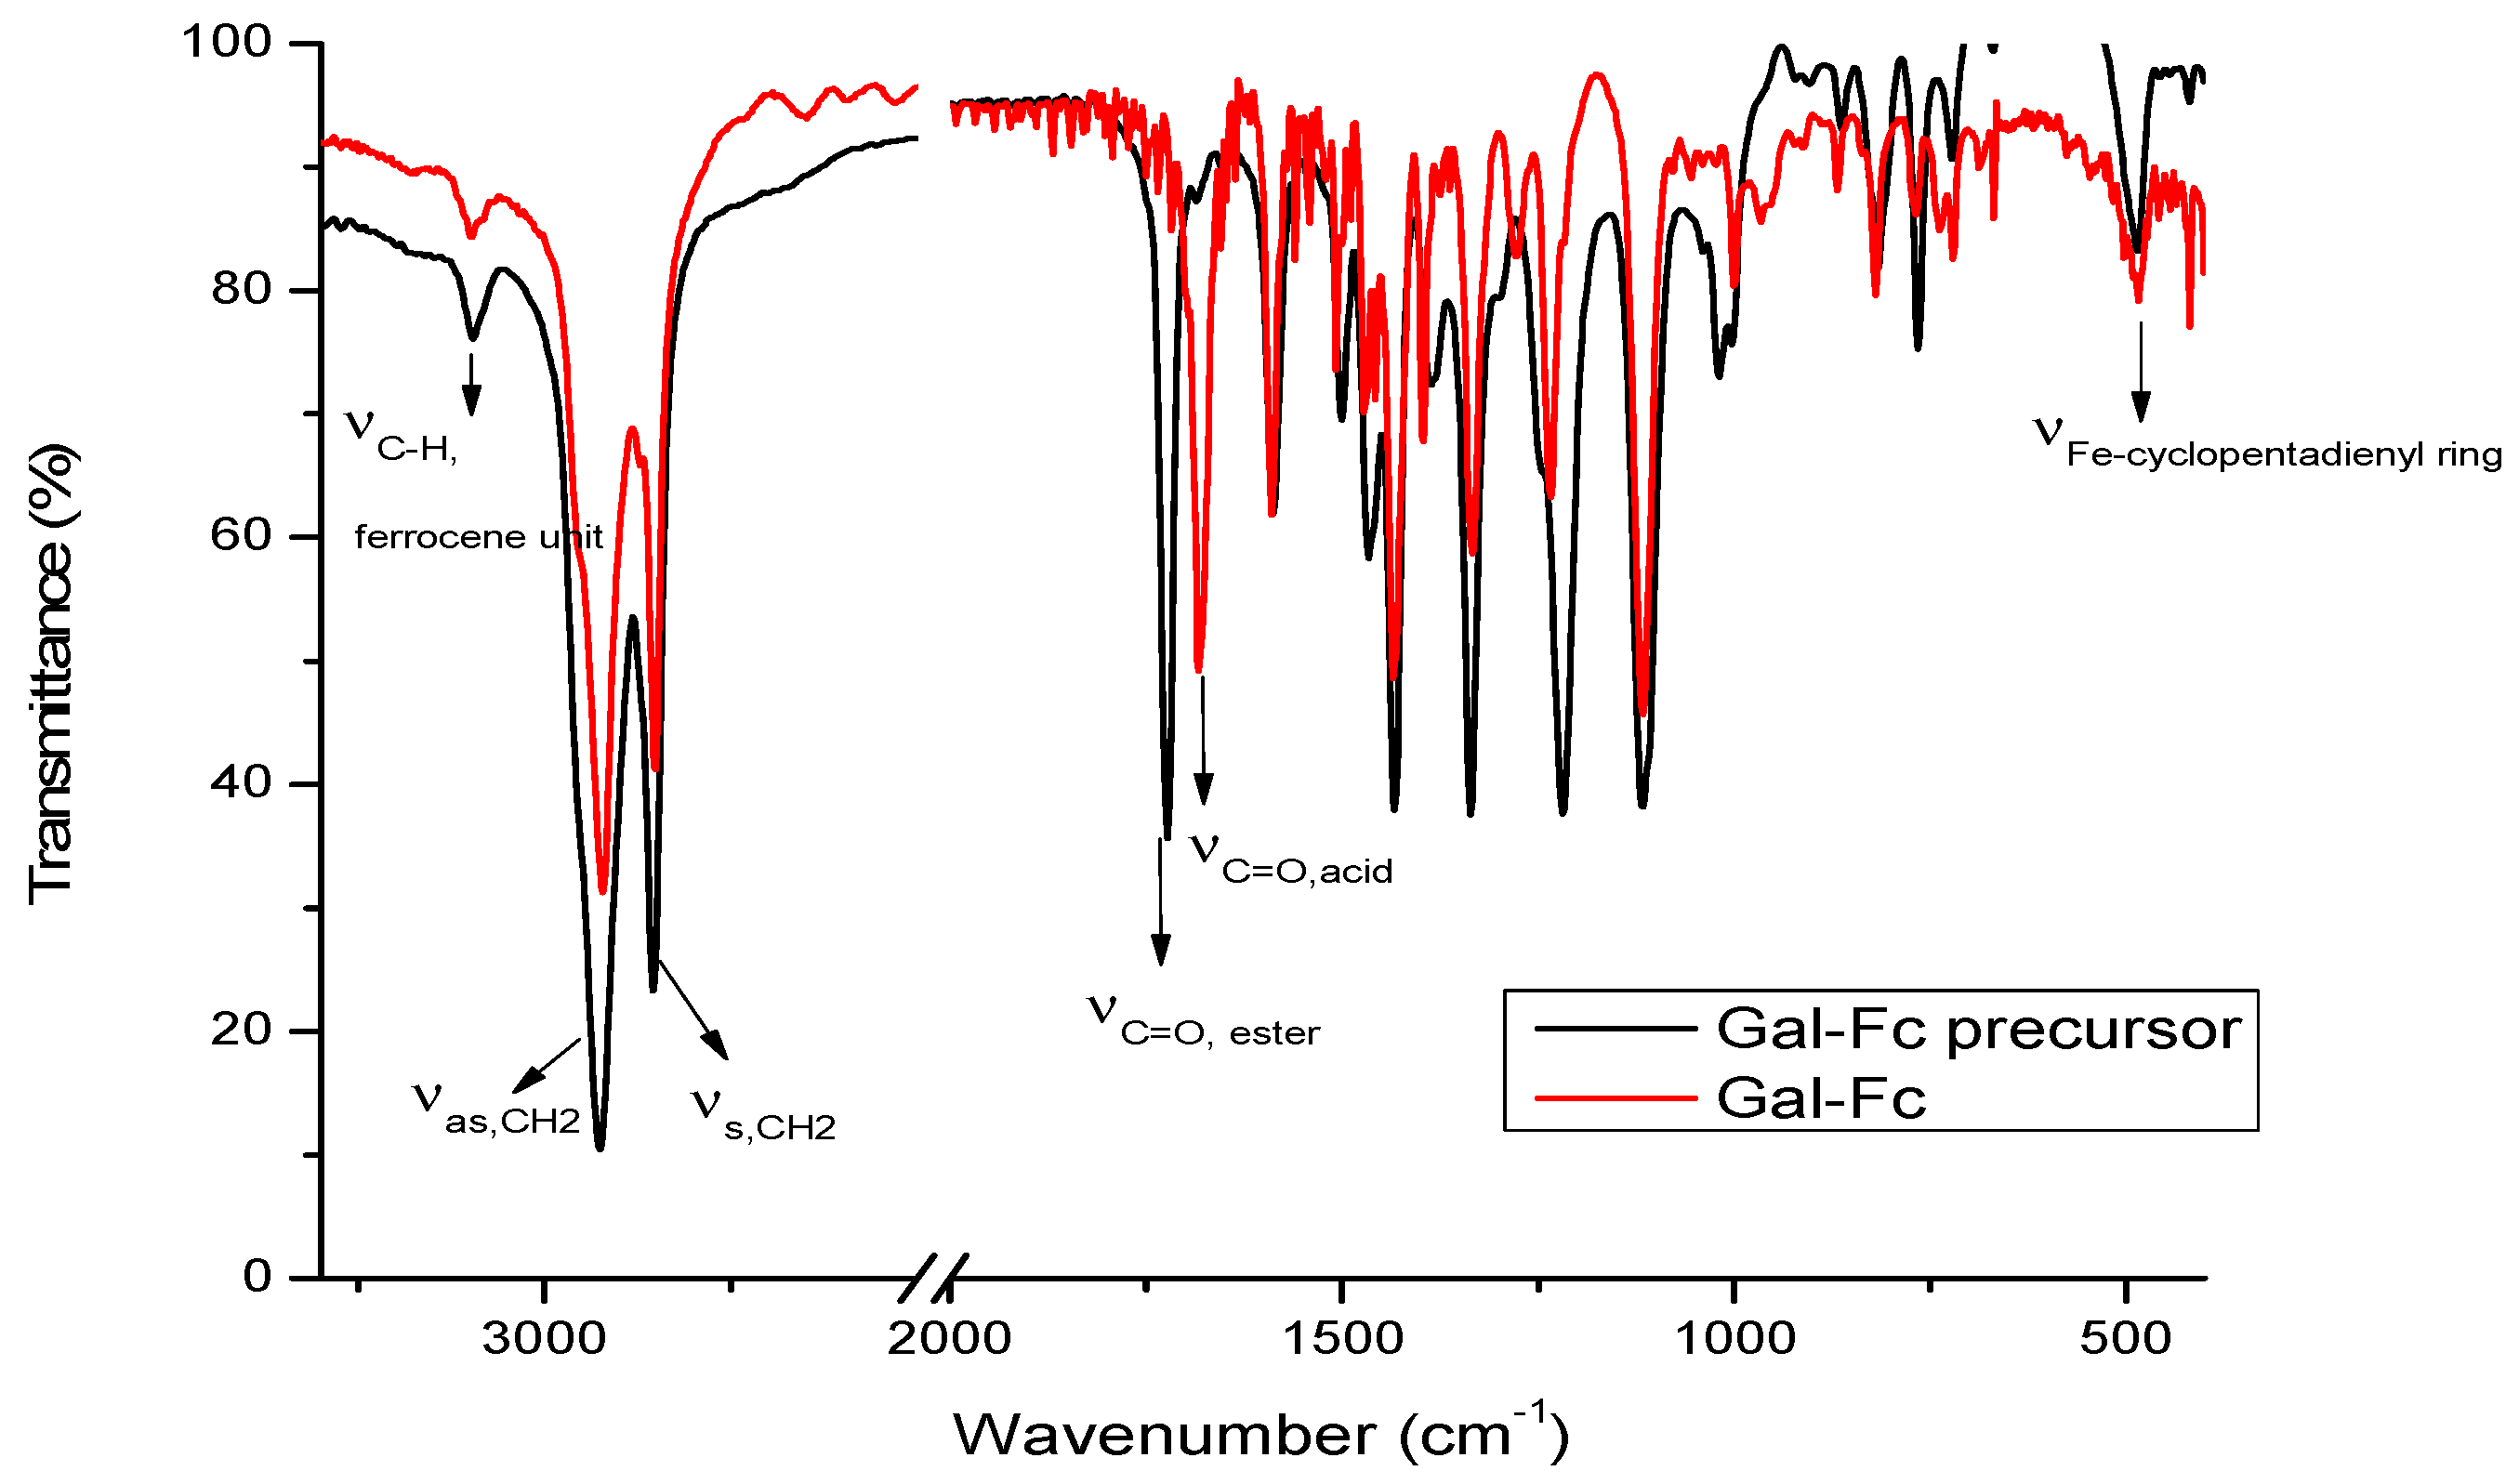
The spectra of compounds Gal-Fc_precursor and Gal-Fc (
Figure 2) presented the expected characteristic absorption bands of the stretching vibration of the asymmetric (2925 cm
-1) and symmetric (2855 cm
-1) for the carbon-hydrogen bond belonging to the methylene groups present in the molecule [
32]. Moreover, the presence of the ferrocene unit is confirmed by the presence of the characteristic absorption band of the stretching vibration of the carbon-hydrogen bond from cyclopentadienyl ring around 3091 cm
-1, and at about 485 cm
-1 characteristic for the stretching vibration band between Fe(II) and the cyclopentadienyl ring [
33]. By comparing the spectra of Gal-Fc with that of its precursor Gal-Fc_precursor, the successful conversion to the corresponding carboxylic acid was confirmed by e shifting the characteristic absorption band of the carbonyl group from 1719 cm
-1 in Gal-Fc_precursor to 1678 cm
-1 in Gal-Fc.
The
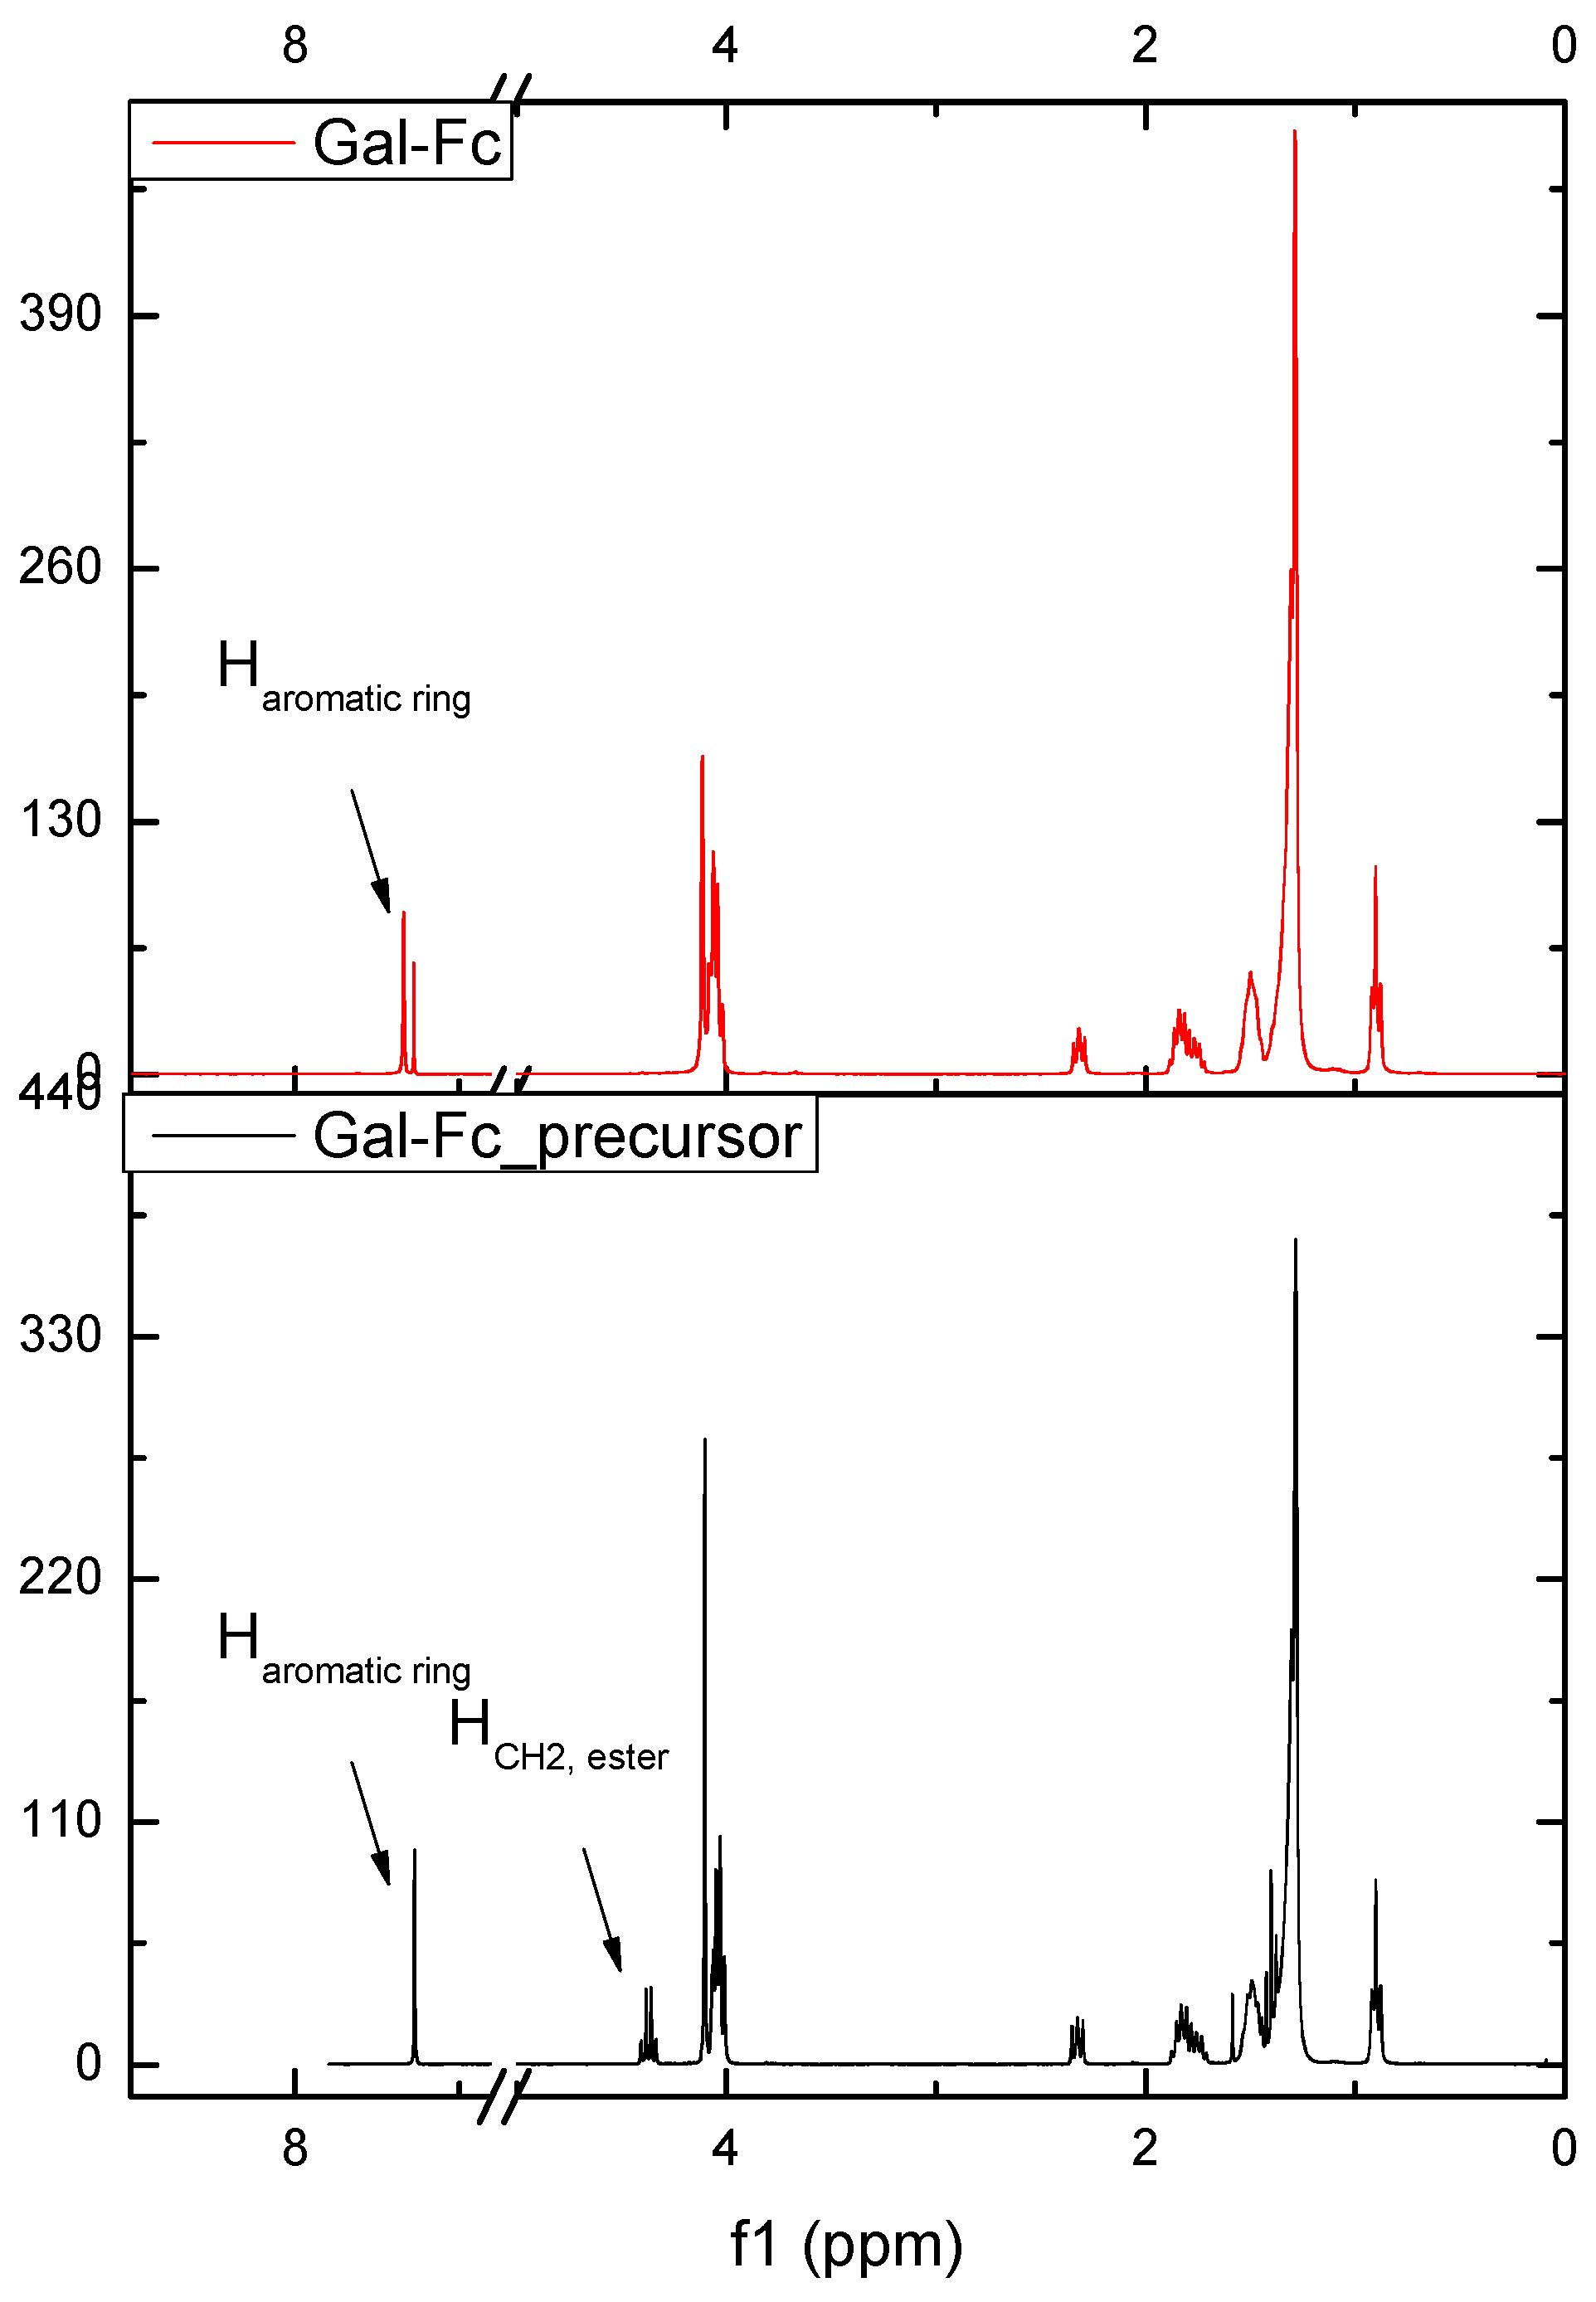
1H-NMR (
Figure 3) further confirmed the above results by the chemical shifts of the aromatic proton from the gallate unit from 7.27 ppm in Gal-Fc_precursor (overlapped with the signals of CDCl
3) to 7.34 ppm in case of Gal-Fc. Also, the disappearance of the proton belonging to the methylene group of the ester were not present in the final compound Gal-Fc.
The
1H-NMR (
Figure 3) further confirmed the above results by the chemical shifts of the aromatic proton from the gallate unit from 7.27 ppm in Gal-Fc_precursor (overlapped with the signals of CDCl
3) to 7.34 ppm in case of Gal-Fc. Further confirmation on the formation of the carboxylic acid was evidenced from the disappearance of the proton corresponding to the methylene group of the ester.
3.2. Electrochemistry testing
3.2.1. Cyclic voltammetry (CV)
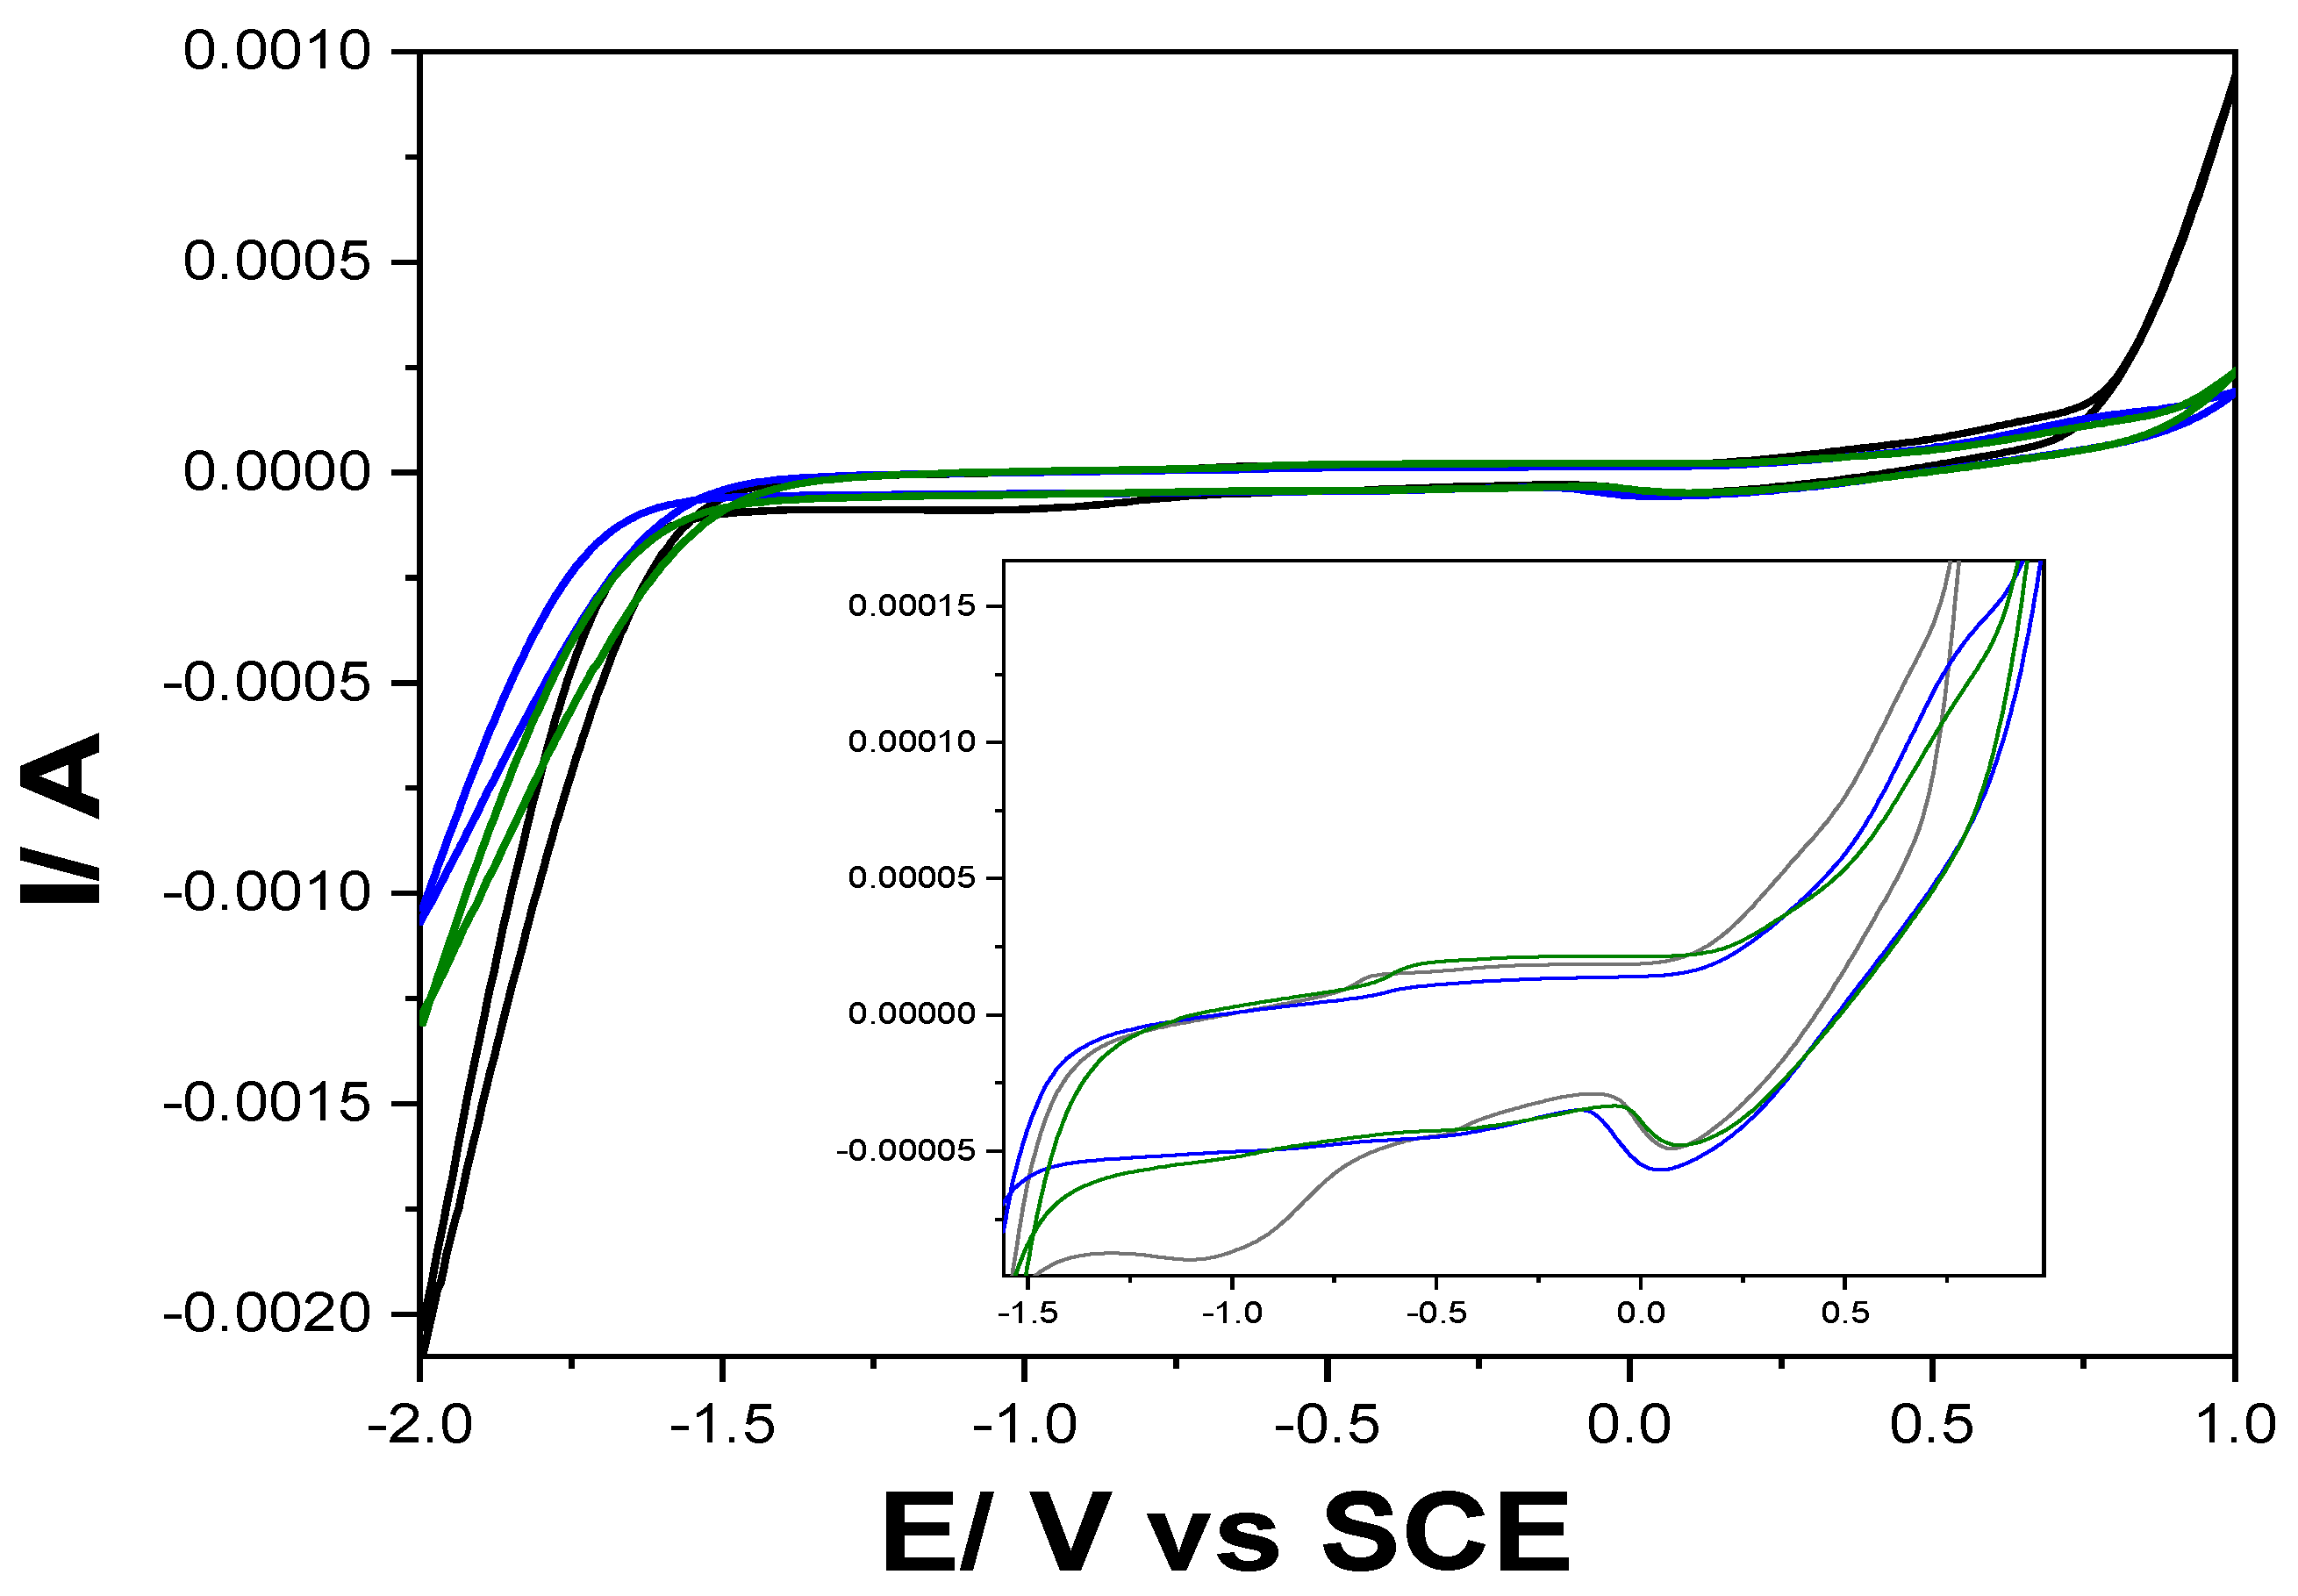
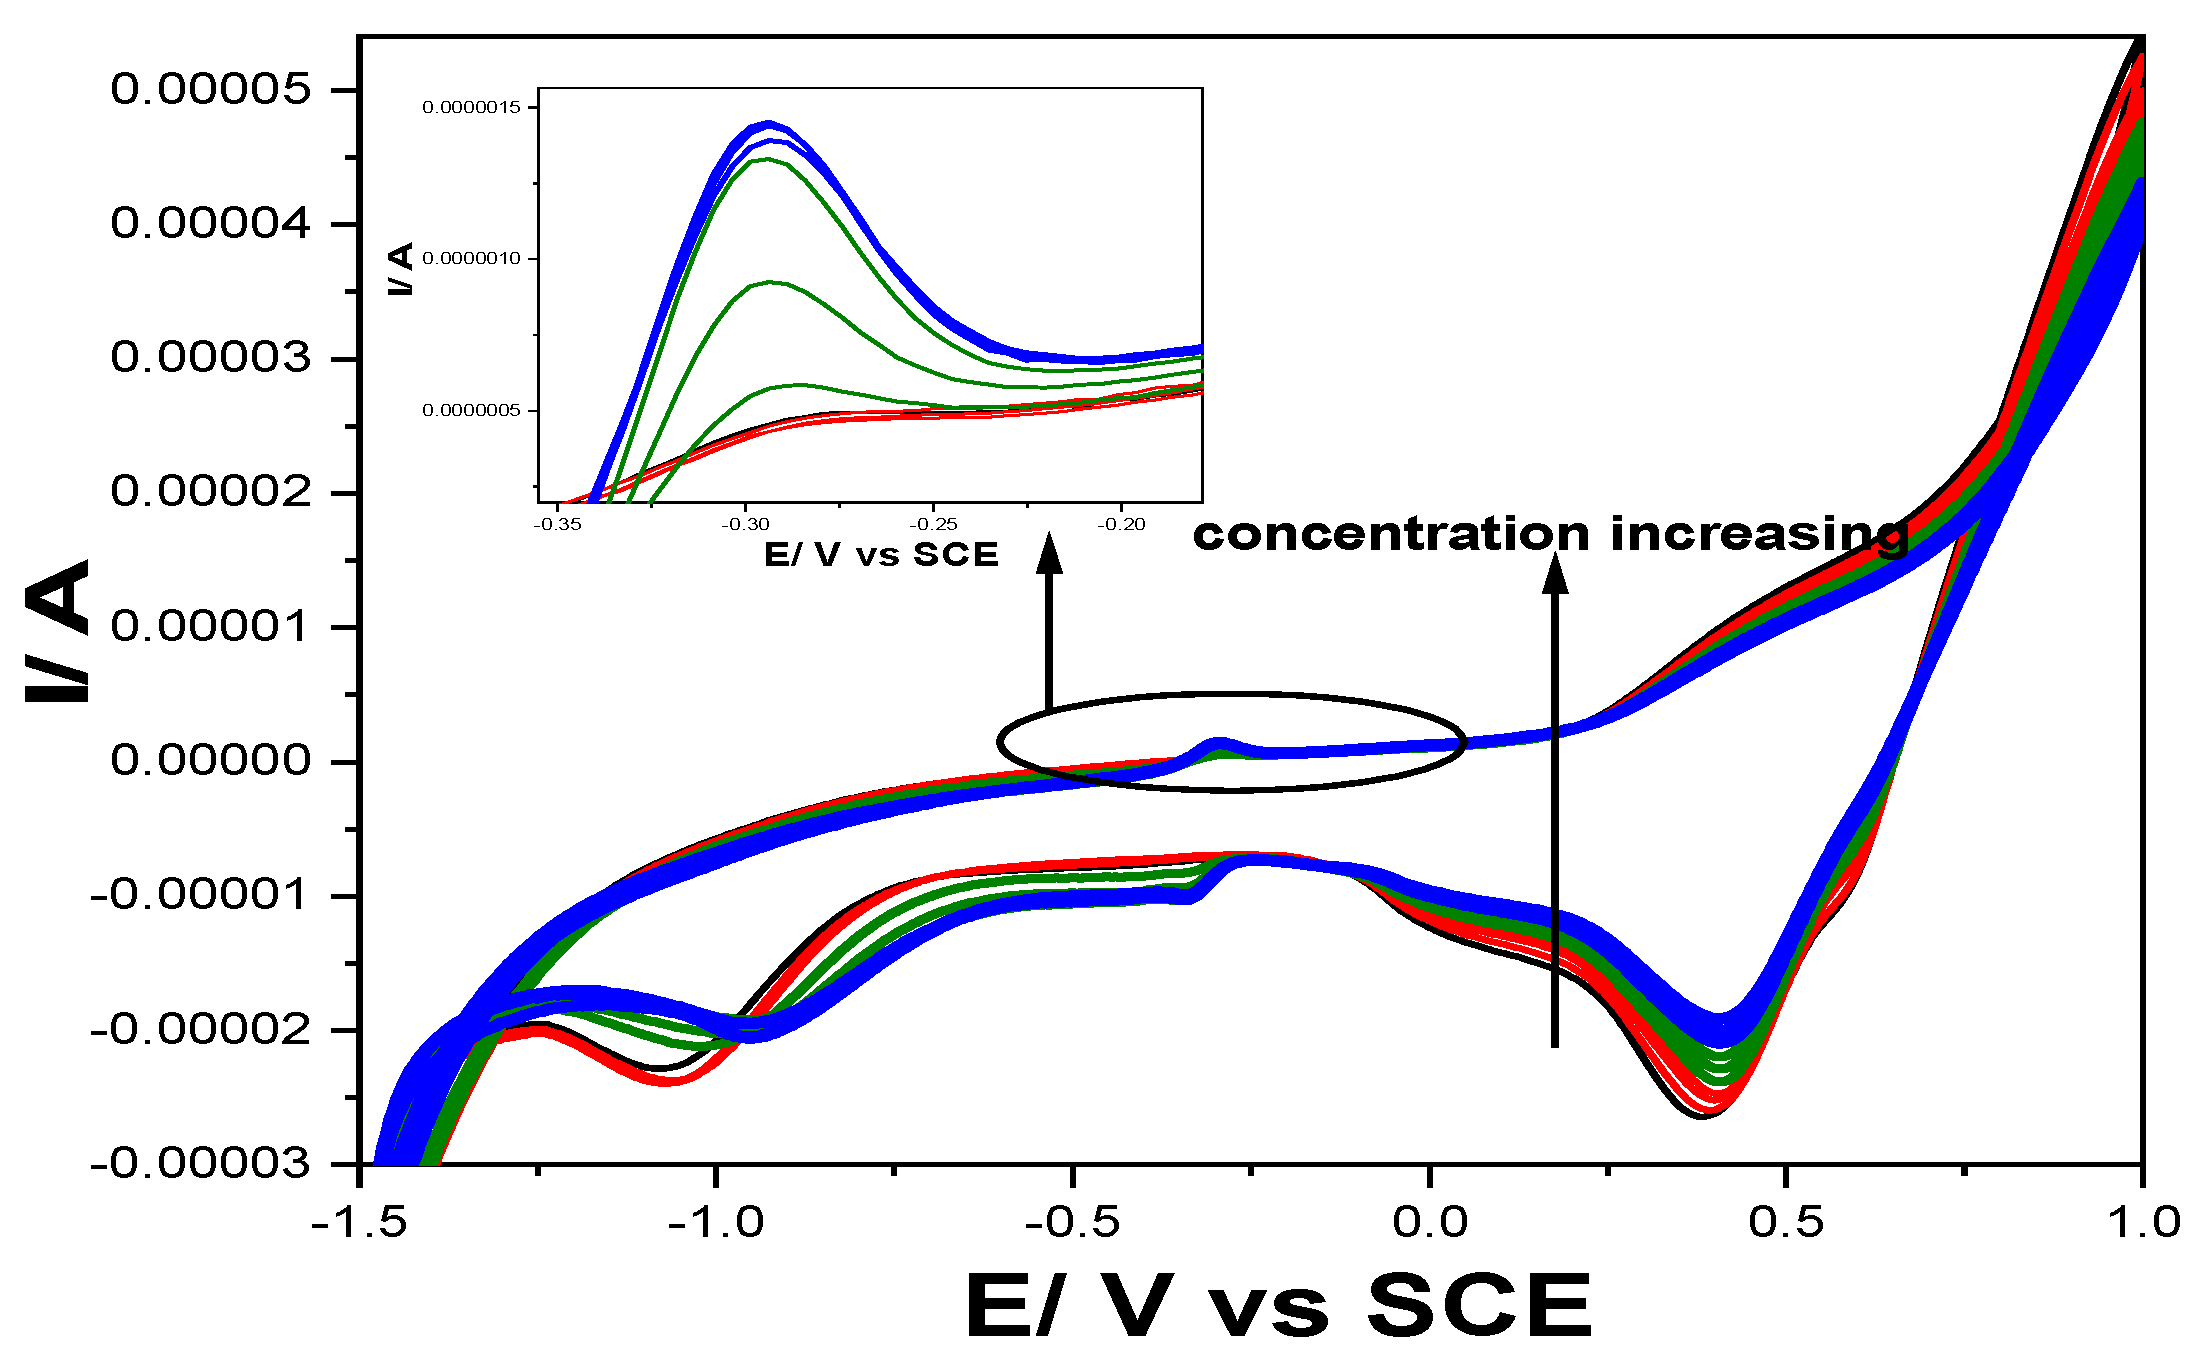
Taking into account the results presented already for Gal-Fc modified CNT paste electrode by film-casting under the potential range from -1.50 to +1.00 V/SCE [
25], the shape of CVs recorded for Gal-Fc-CNT paste electrode at various pH values of 3, 5 and 12 under enlarged potential range to cathodic branch presented in
Figure 4 is characteristics to manifesting ferrocene/ferrocenium redox couple, further ferrocenium oxidation and to Fe/Fe(II) redox couple where oxidation peak occurred at about −0.66 V vs SCE and the corresponding reduction peak at about −1.00 V vs SCE, which overlayed the CNT oxidation and reduction processes.
As we expected, the alkaline medium favoured from thermodynamic point of view the oxygen and hydrogen evolution and the peaks corresponding to the redox couples are better evidenced, especially the Fe (II) reduction at the potential value of -1.00 V/SCE.
The electrochemical behaviour of the Gal-Fc-CNT paste electrode was tested at each pH value in the presence of 1 mg∙L
-1 of each DOX, CPB and CPP from the cytostatic class. (examples are presented in
Supplementary material–Figure S1a-c). The utile signal reached at each pH value are gathered in
Table 1.
It can be noticed that at pH of 12, all cytostatic gave the anodic utile signal, while for pH of 3 only DOX exhibited the anodic utile signal. Based on these findings two approaches were considered to develop the method for their simultaneous detection and for the selective detection of DOX.
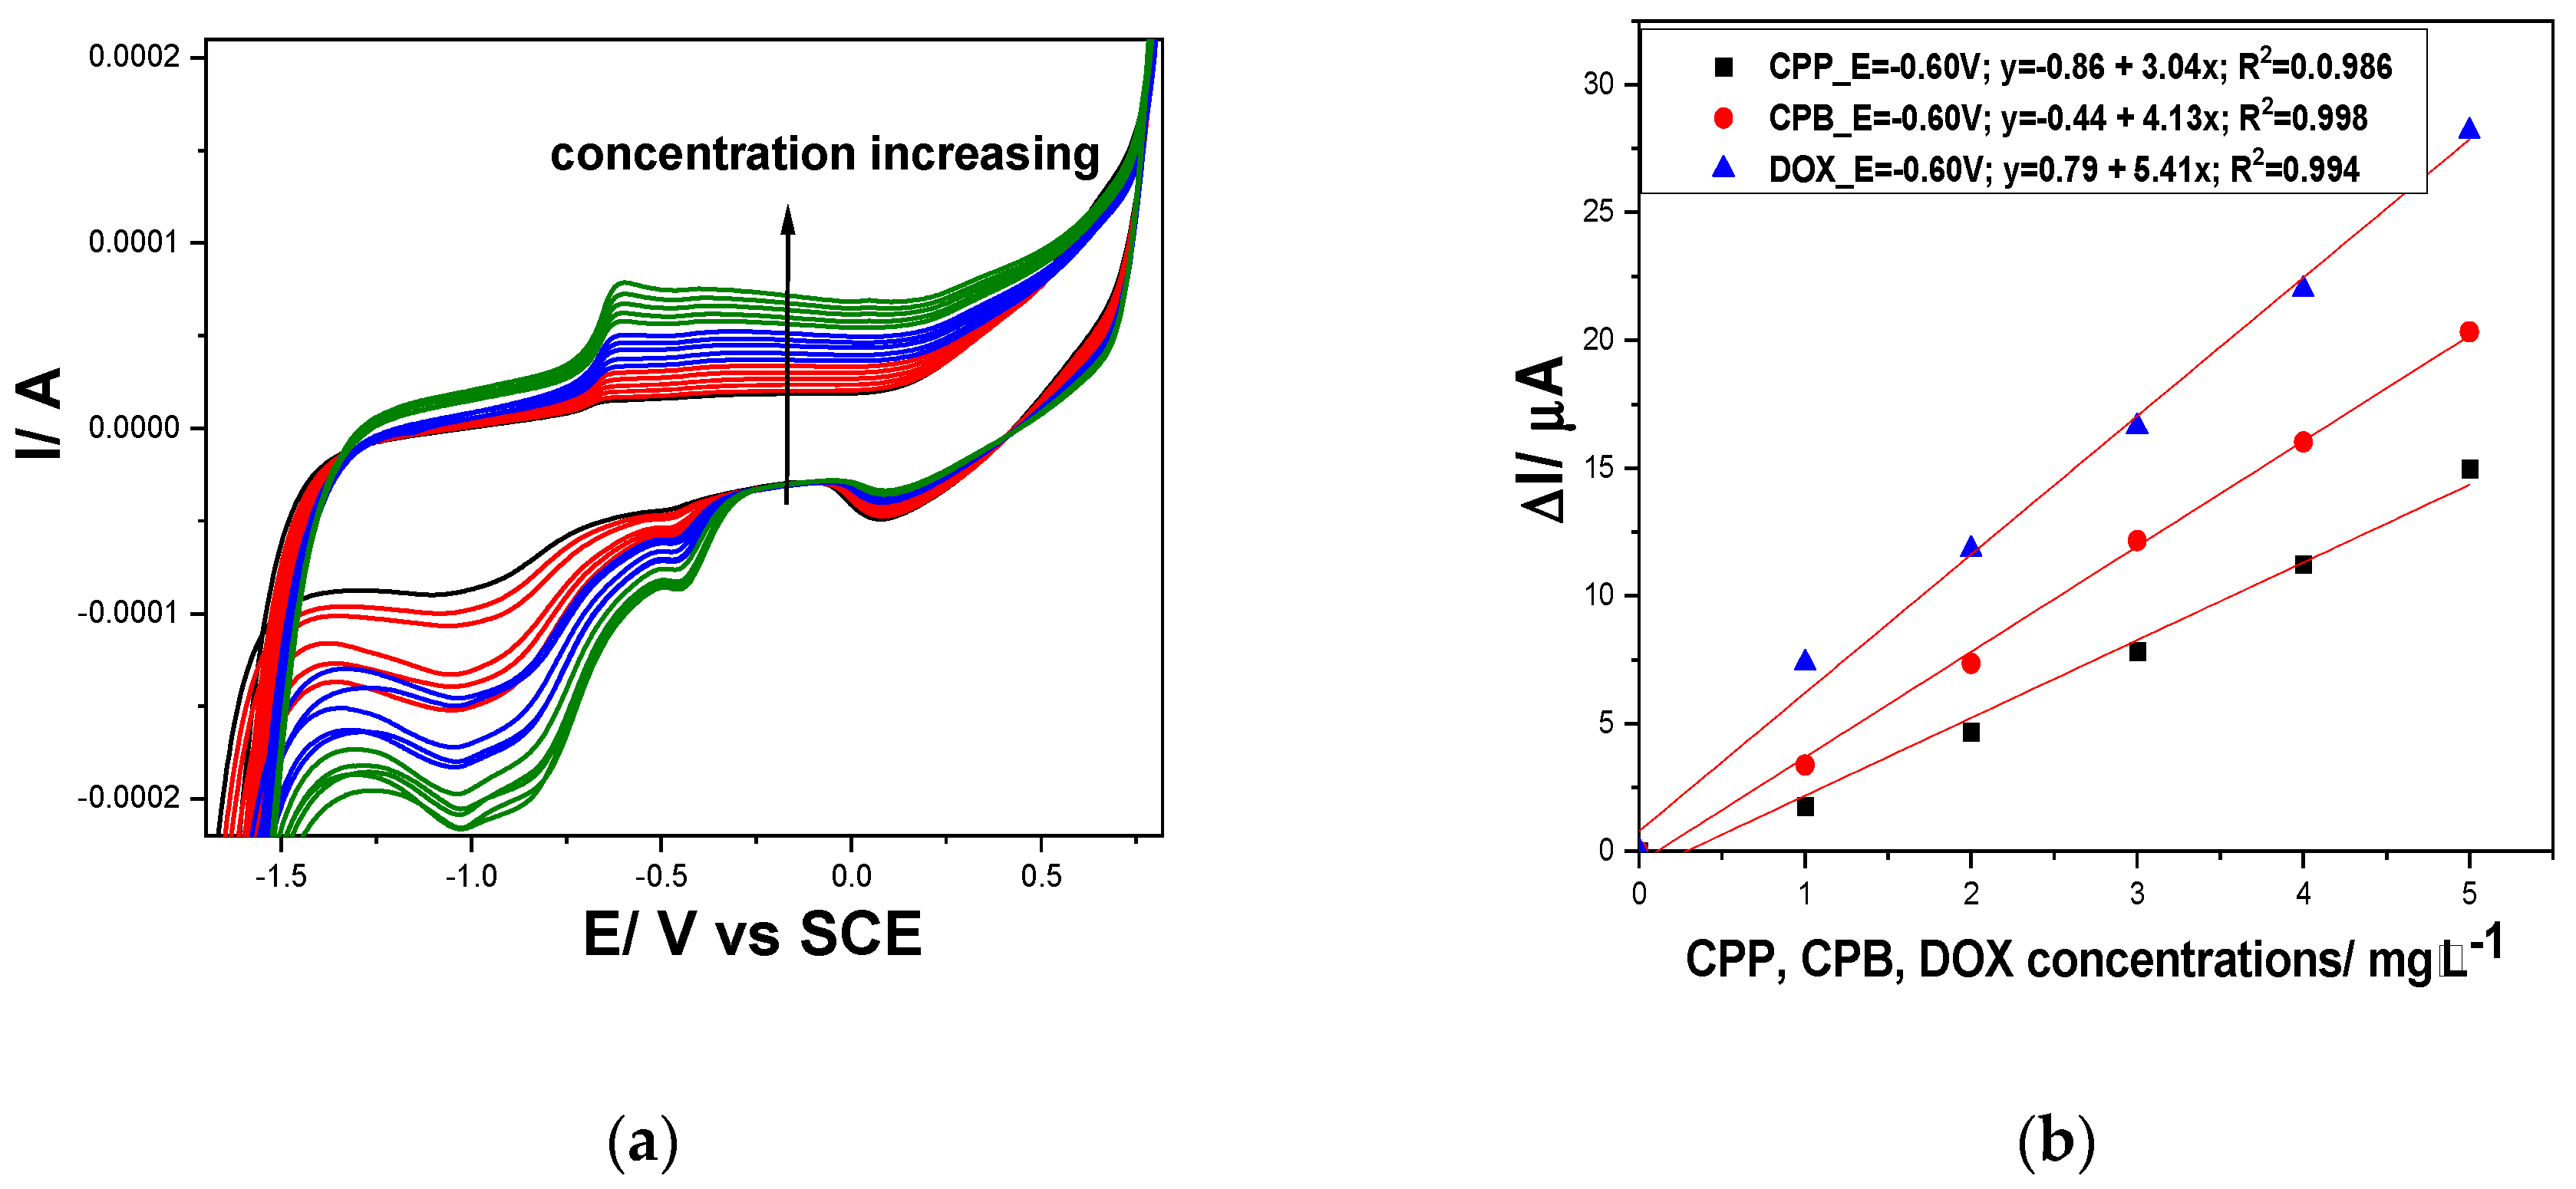
The electrochemical behaviour of Gal-Fc-CNT electrode in the presence of various concentrations ranged from 1 to 5 mg∙L
-1 of cyclophosphamide (CPP), capecitabine (CPB) and doxorubicin (DOX) at pH of 12 are presented in
Figure 5.
Similar behaviour is noticed for each cytostatic, which is oxidized starting with the potential value corresponding to Fe (II) oxidation at about -0.50 V/SCE and occurred in more steps involving also the ferrocene /ferrocenium redox couple at the potential value of about +0.25 V vs SCE. Also, the cathodic responses involving Fe (II) reduction at about -1.00 V/ SCE are noticed that did not increase linearly with cytostatic concentration, probably due to the complexity of the reduction reactions of each compound and their byproducts.
The electrochemical behaviour of Gal-Fc-CNT electrode under potential ranged from -1.50 to +1.00 V/SCE in the presence of various concentrations ranged from 1 to 3 mg∙L
-1 of CPP, CPB and DOX at pH of 3 are presented in
Figure 6.
It is obviously that only DOX is oxidized at the potential value slightly more positive (-0.30 V/SCE) versus -0.46 V /SCE achieved under enlarged potential range (from -2.00 to +1.00 V/SCE) and gave an analytical signal of 0.30 µA/mg⸱L-1, which is lower in comparison with one get at pH of 12. No anodic peak current increased in the presence of CPB and CPP because no oxidation occurred and implicit their detection, which should be exploited for further development of the selective detection of DOX in the presence of CPP and CPB. Also, the cathodic behaviour under Fe species reduction showed a reduction process only in the presence of DOX that is related to the anodic one.
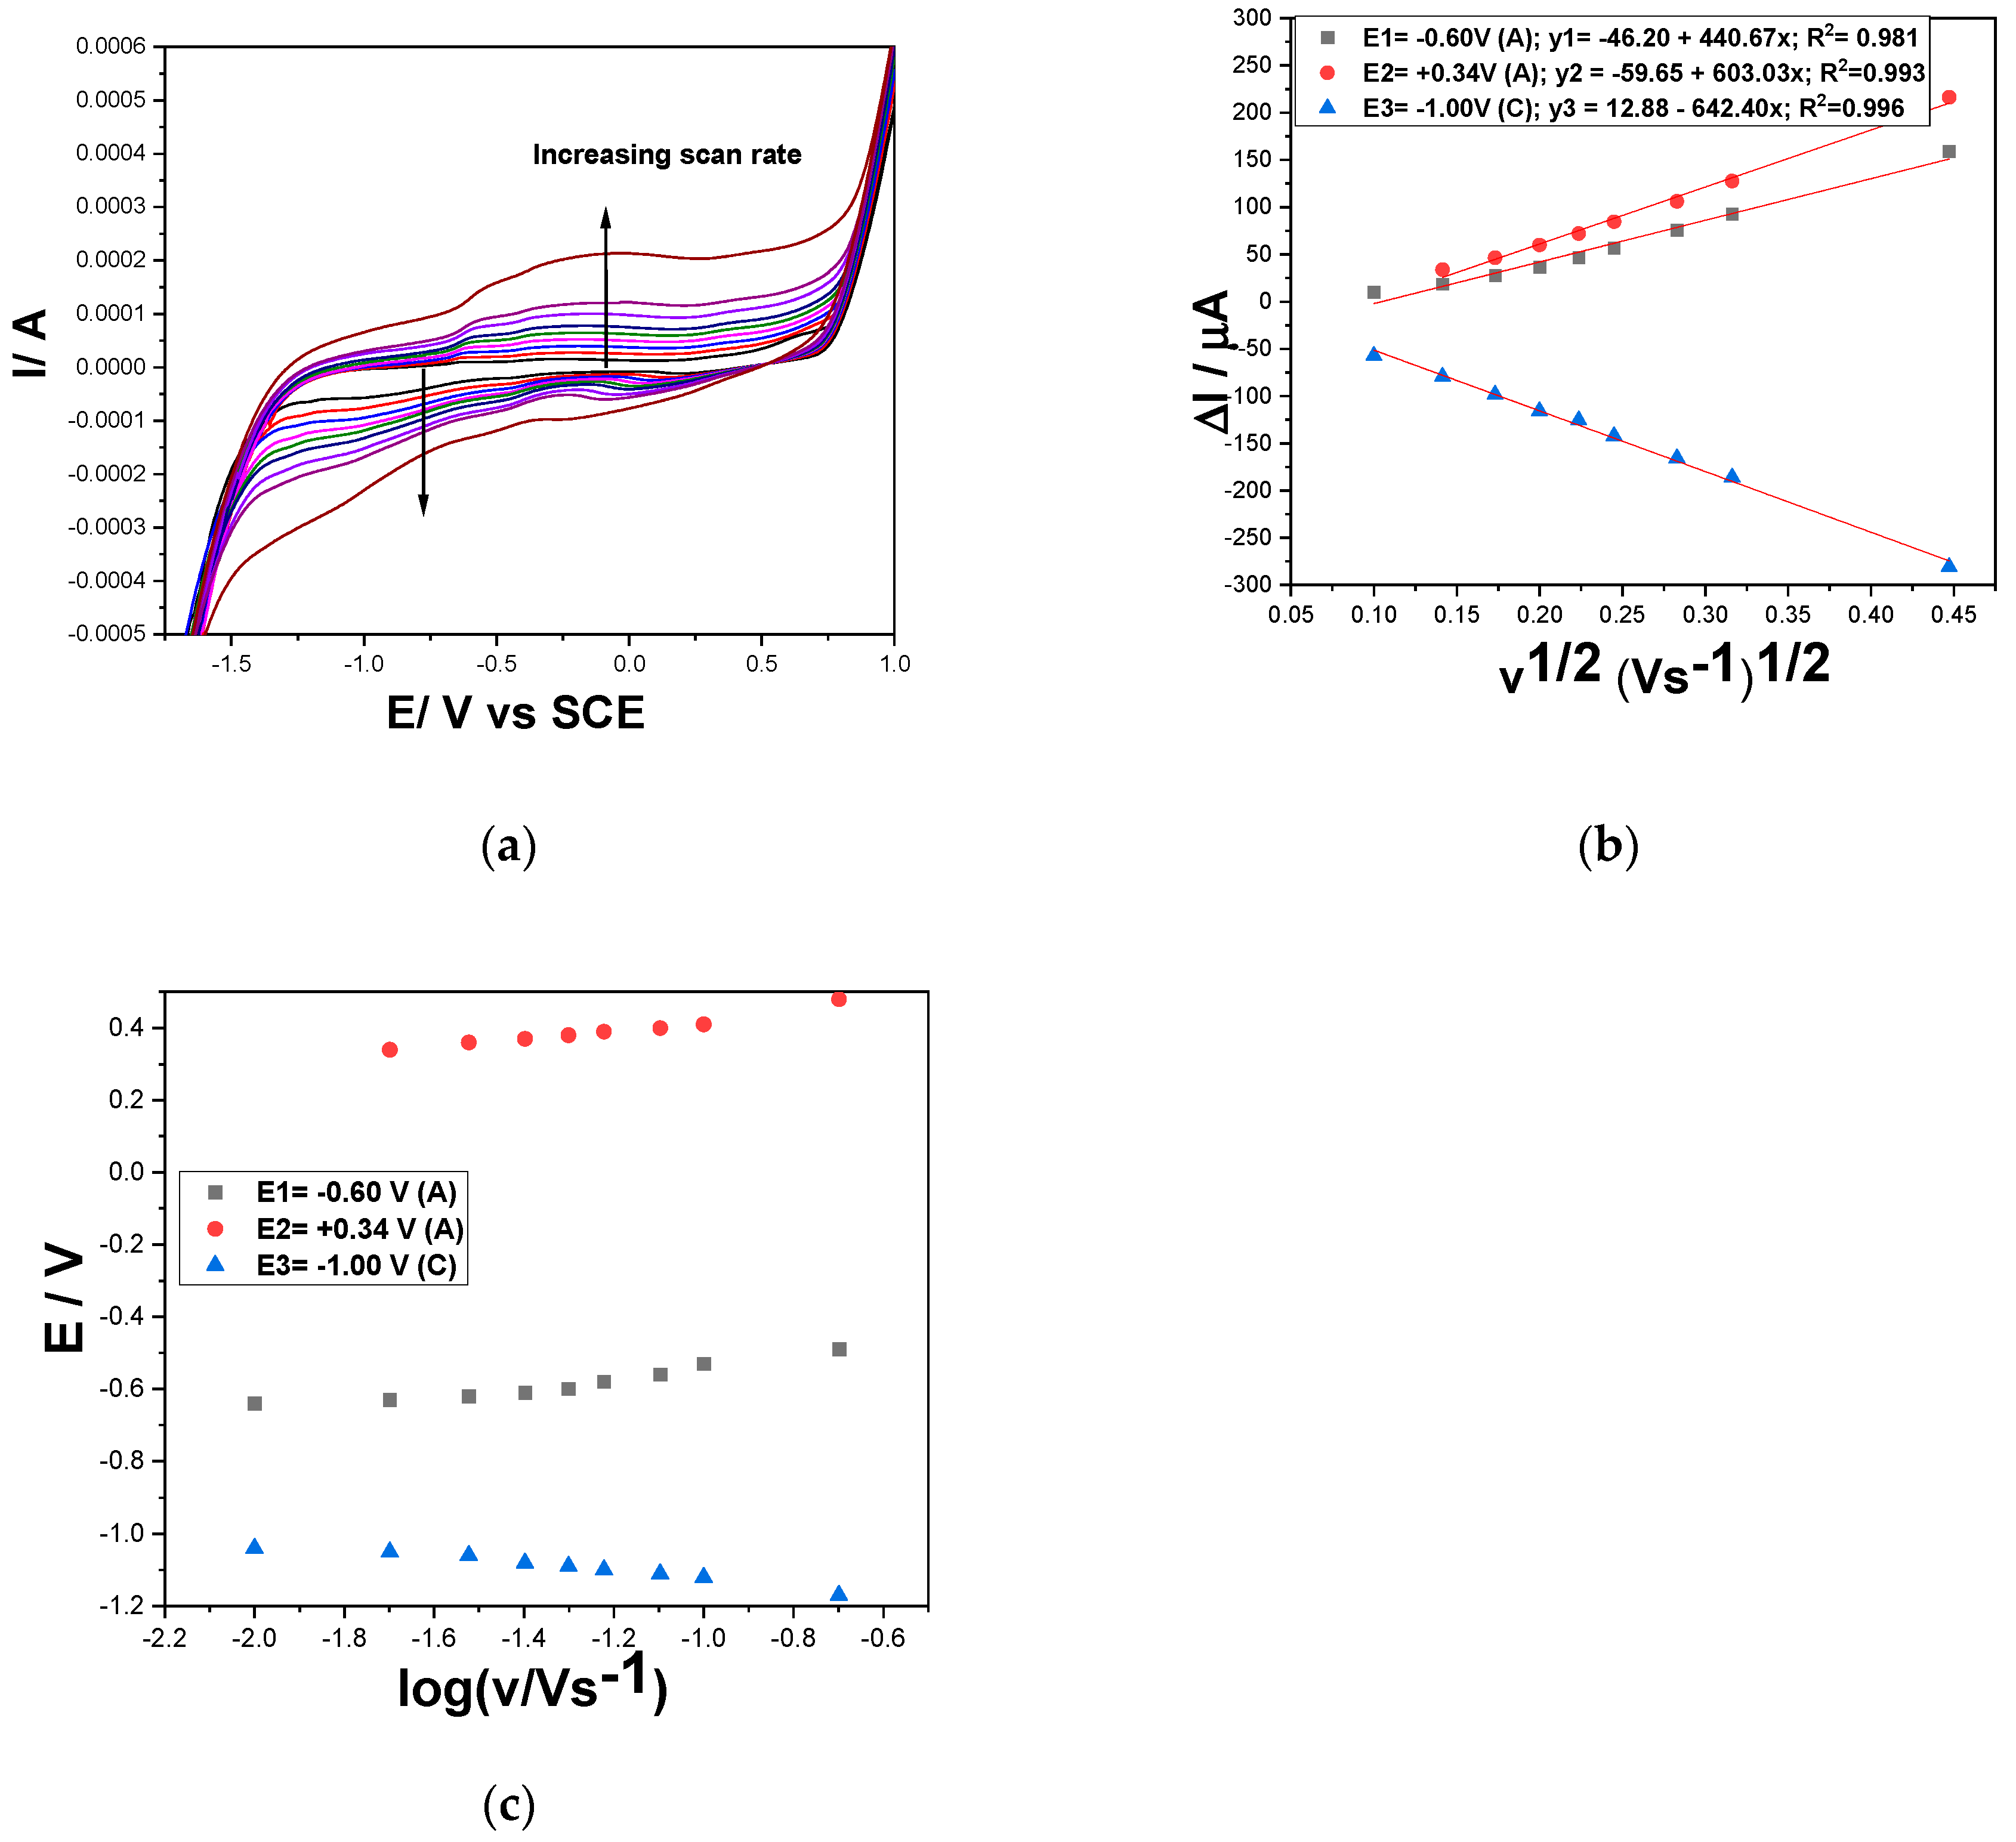
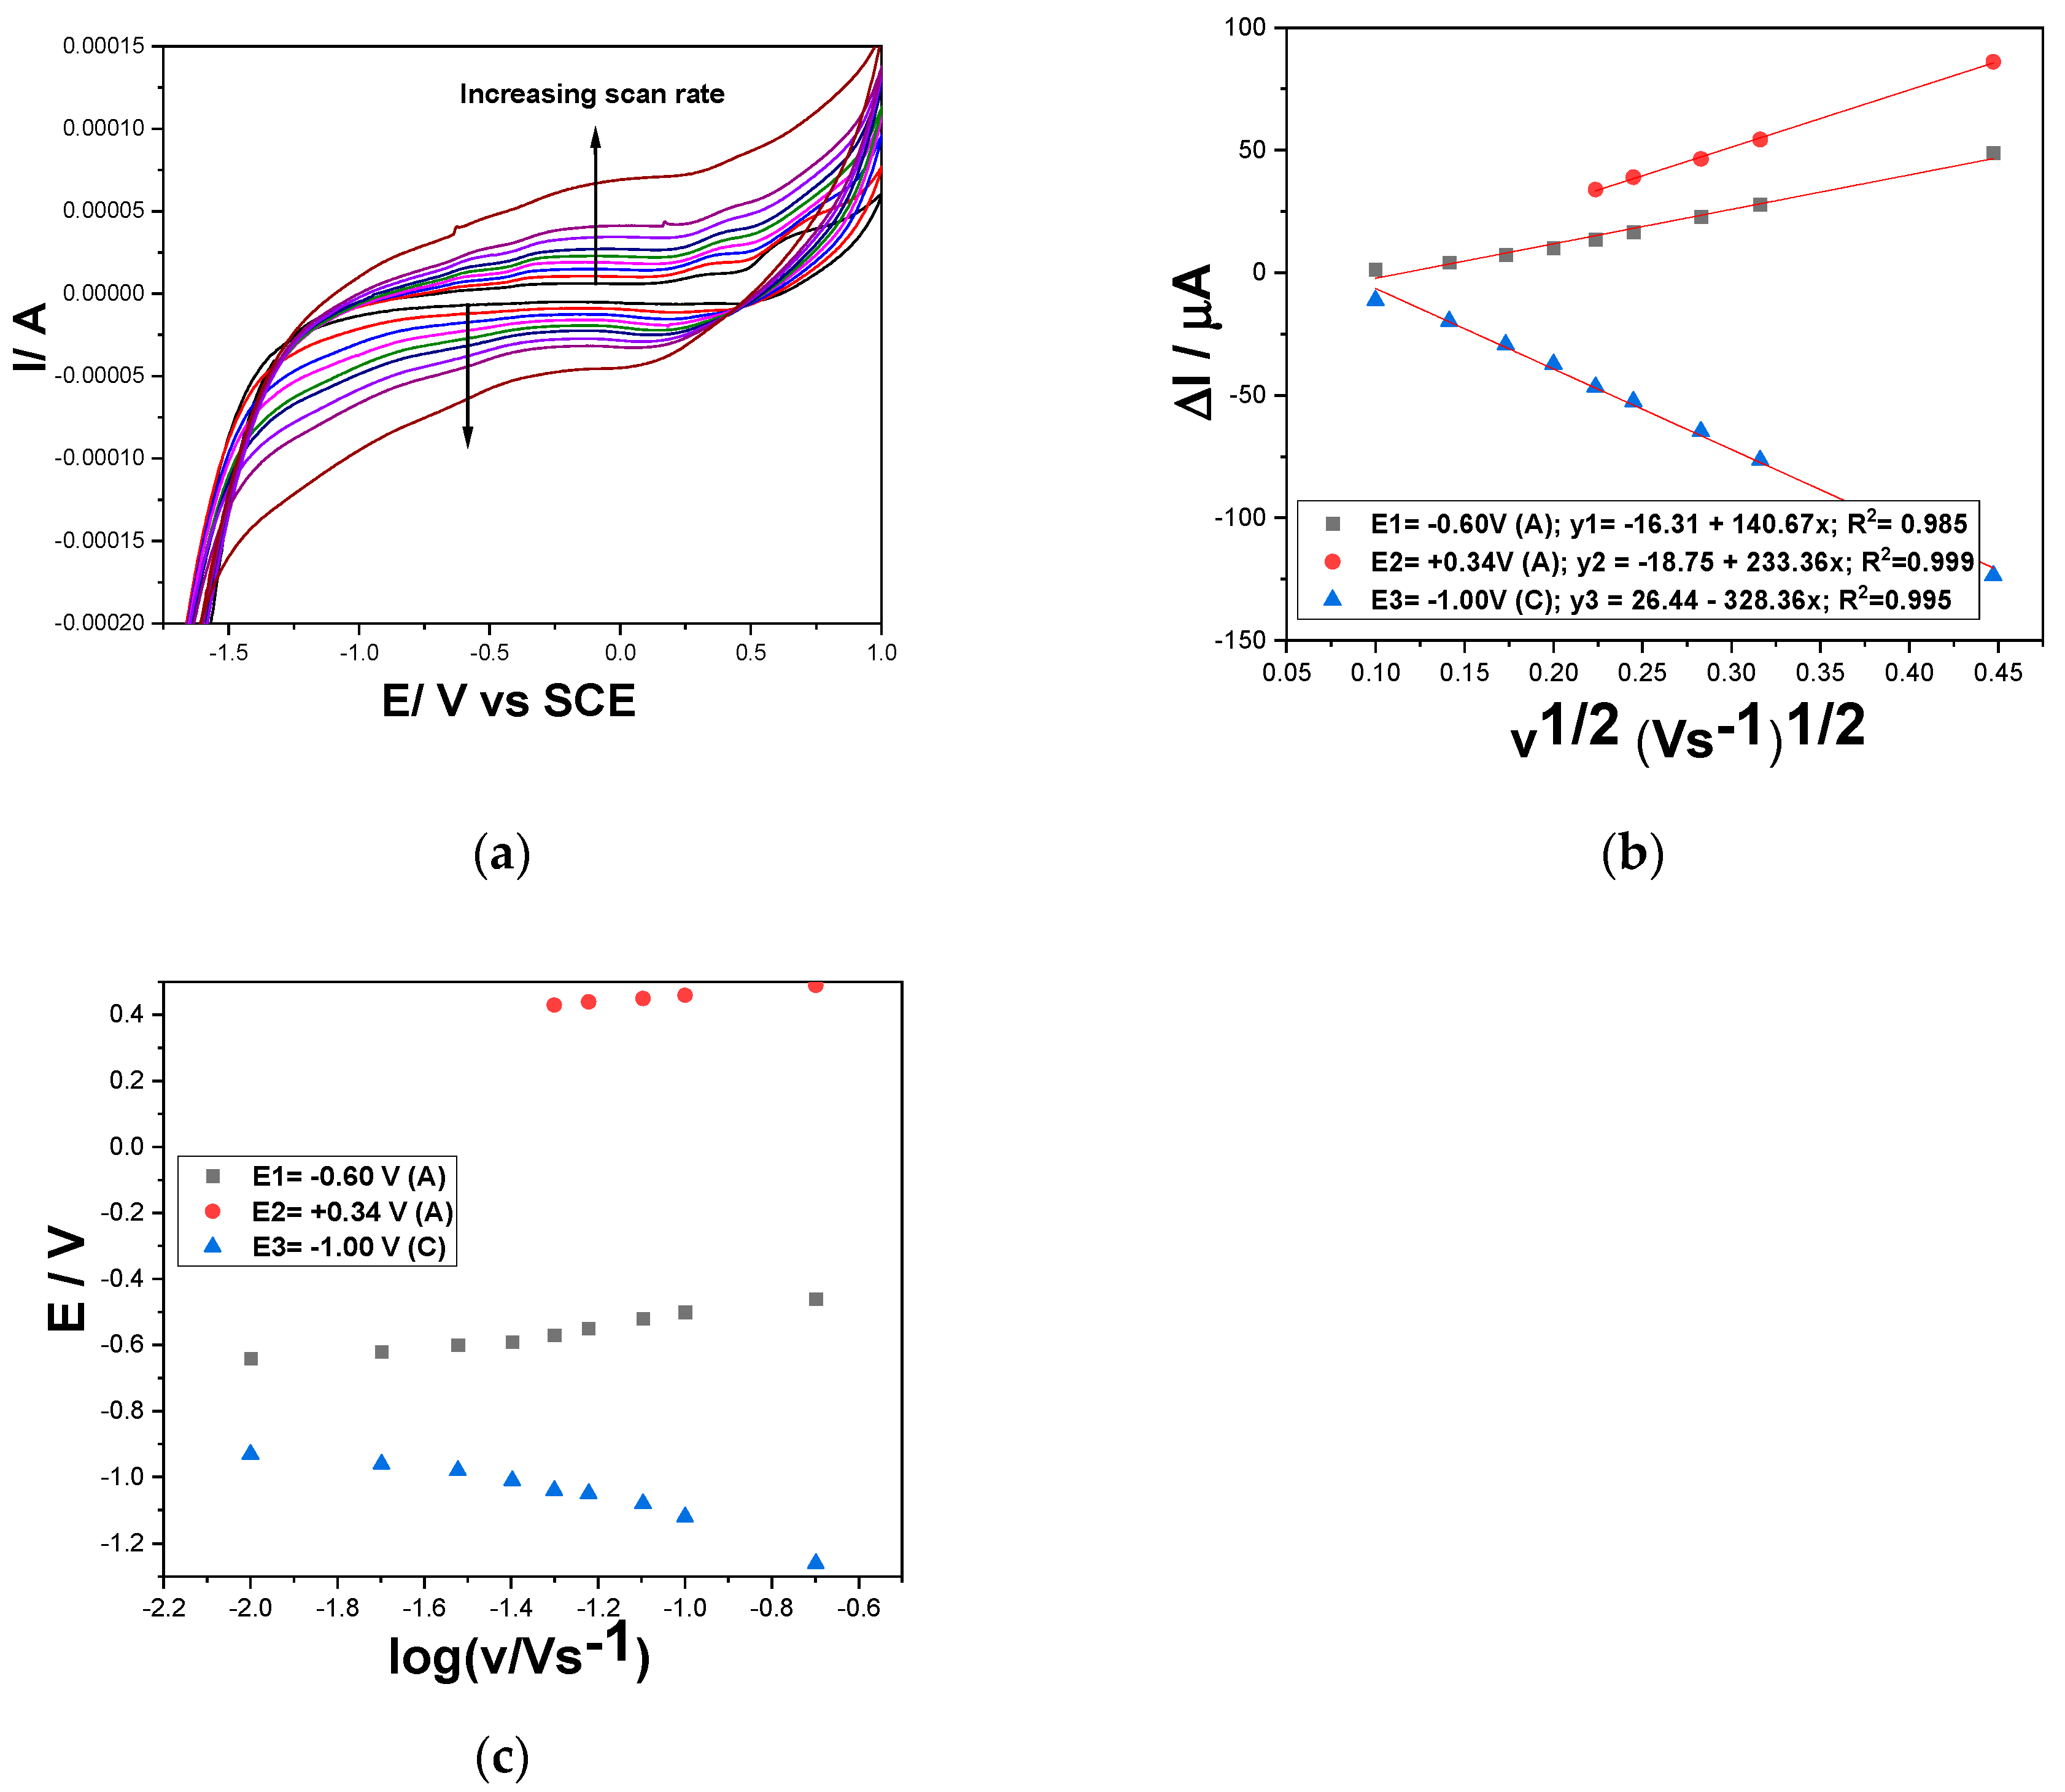
For better evidence of the pH effect onto DOX oxidation, the scan rate influence on the CVs shapes in the presence of 2 mg⸱L
-1 DOX at pH of 3 and 12 was studied. The results involving the utile current dependence versus the square root of the scan rate and oxidation/reduction potential evolution versus logarithm of the scan rate are presented in
Figure 7a–c and
Figure 8a–c at increasing scan rate ranged from 10 to 200 mV·s
−1. The differences between the series of CVs are related to the lower potential value for O
2 and H
2 evolution similar with the results obtained without the analyte presence as presented in
Figure 4. Also, the Fe
- species and ferrocene-based redox couples are more evidenced in alkaline medium probably some oxyhydroxides are formed with a better electrocatalytic activity.
The linear dependence of the utile anodic and cathodic currents determined for 2 mg⸱L
-1 DOX by the supporting electrolyte currents subtracting vs. the square root of the scan rate are expressed by the equations (1) at pH=12 and (2) at pH =3:
It should be mentioned that at pH of 3 the utile signal appeared only at the scan rate higher than 40 mV·s−1 suggesting a faster kinetics of DOX oxidation process vs pH =12. It is obviously that all diffusion-controlled oxidation and reduction processes are characterised by better diffusion process rate at pH of 12 vs pH=3. Also, no zero reverse interception suggested very complex mechanism for all oxidation and reduction processes responsible for DOX detection, and moreover, no ideal reversible character is suggested by the results of the E-log v dependence.
Considering the literature data related to DOX detection mechanism [
20,
22,
34] corroborated with the above-presented results, two-electrons based DOX electrooxidation and electroreduction involving Fe species and ferrocene redox couple are proposed for both pHs of 12 and 3 with very fast kinetics at pH of 3. Also, the two-electrons oxidation and reduction processes are proposed for CPP and its oxidized form in accordance with the literature data [
35] and for CPB oxidation and reduction, also as reported in the literature [
36,
37,
38]. No anodic and cathodic peak current intensification with increasing CPP and CPB concentrations at pH of 3 should be explained by much lower kinetics or quite lack of their oxidation and reduction processes in comparison with DOX ones and also with the scan rate higher than 50 mV·s
−1.
3.2.2. Simultaneous detection of cytostatic / selective detection of DOX using differential-pulsed and square-wave voltammetry techniques
In view of improvement the electroanalytical performance for both simultaneous detection of DOX, CPB and CPP at pH of 12 and for selective detection of DOX at pH of 3 was employed DPV technique that is characterized by significantly diminishing the current background and more evidenced oxidation and reduction peaks characteristic to the detection. The specific operating parameters are optimized related to the electrode composition considering the sensitivity and the electrode stability. Thus, the best results at pH of 12 were achieved for modulation amplitude of 100 mV, step potential of 25 mV and the scan rate of 0.05 V·s
−1 (
Figure 9a) and at pH of 3 for modulation amplitude of 200 mV, step potential of 25 mV and the similar scan rate of 0.05 V·s
−1 (
Figure 9b).
At pH of 12 for the simultaneous detection of DOX, CPB and CPP, at the detection potential of -0.20 V/SCE better sensitivities were achieved in comparison with CV. Thus, 73.71 µA/mg⸱L-1 compared with 5.41 µA/mg⸱L-1 for DOX, 5.00 µA/mg⸱L-1 compared with 4.13 µA/mg⸱L-1 for CPB and 6.55 µA/mg⸱L-1 compared with 3.04 µA/mg⸱L-1 for CPP.
At pH of 3 for the selective detection of DOX at the detection potentials values of -0.46 V/SCE sensitivity for DOX detection was 40.25 µA/mg⸱L-1 (compared with 0.30 µA/mg⸱L-1 get by CV) and 269.5 µA/mg⸱L-1 at the potential value of +0.45 V/SCE at which no signal was achieved by CV. Increasing current at the potential value of +0.45 V/SCE informed about the ferrocene redox couple involvement in DOX oxidation under acidic medium.
Also, considering the peculiarities of the SWV as fastest voltammetry technique, various operating conditions were tested for optimization for both cytostatic simultaneous detection and DOX selective detection. For simultaneous detection of cytostatic at pH of 12, modulation amplitude of 100 mV, step potential of 4 mV, frequency of 25 Hz and 100 mV·s
−1 potential scan rate (
Figure 10a) and similar conditions excepting the frequency of 50 Hz that assured double potential scan rate of 200 mV·s
−1 were found optimum for the selective detection of DOX at pH of 3 (
Figure 10b).
These optimum conditions generating the better sensitivities than ones obtained for DPV at shorter time of half or even a quarter of the DPV time. The comparative sensitivities of both voltammetric techniques are compared in
Table 2.
It can be concluded that SWV exhibit great potential for either fast of simultaneous detection of DOX, CPB and CPP or selective detection of DOX with better sensitivity in comparison with CV and DPV.
The lowest limit of detection was achieved also using SWV for both simultaneous cytostatic detection and selective detection of DOX (see
Supplementary Material-Table S1). Thus, the lowest limits of detection of 0.71 µg⸱L
-1 at pH =12 and 0.75 µg⸱L
-1 at pH =3 were achieved for DOX and at pH=12 the lowest limits of detection of 13 µg⸱L
-1 for CPB and 9 µg⸱L
-1 for CPP were reached as simultaneous determination. It is obviously that a cumulative voltammetric signal is achieved for cytostatic determination at pH of 12 at detection potential of -0.60 V/SCE that can be exploited as
a cytostatic index. Also, the selective quantitative determination of DOX offers the possibility to assess its contribution in the
cytostatic index.
Besides the possibility to assess
cytostatic index and selective determination of DOX, the lowest limits of detection are similar and quite better in comparison with the reported data related to only individual detection of these cytostatic (
Table 3).
The accuracy and precision of the SWV voltammetric method using CNT-Fc paste electrode were checked by recovery experiments. The different concentrations of DOX, CPB and CPP were spiked to the tap water sample and three replicate measurements were done for each sample at pH =12 and respective, at pH =3. The standard addition method was applied for both the quantitative simultaneous determination of DOX, CPB and CPP at pH =12 and selective determination of DOX at pH =3 in real sample. None of cytostatics were found in real tap water from Timisoara city, Romania. The recovery degree values were close to the 100 % (102.50–104.25 %, 98.75–99.80 % and 97.40–98.50 % for DOX, CPB and CPP, respectively) at pH = 12 and 101.20-104.80 % at pH =3 indicate the accuracy of the SWV based method using CNT-Fc paste electrode, which shows its suitability for the practical application for screening real water samples considering cytostatic index and DOX quantification.
Figure 1.
Proposed chemical structure of compound Gal-Fc.
Figure 1.
Proposed chemical structure of compound Gal-Fc.
Figure 2.
FT-IR spectrum of Gal-Fc plotted is Gal-Fc_precursor.
Figure 2.
FT-IR spectrum of Gal-Fc plotted is Gal-Fc_precursor.
Figure 3.
1H-NMR spectra of Gal-Fc_precursor and Gal-Fc.
Figure 3.
1H-NMR spectra of Gal-Fc_precursor and Gal-Fc.
Figure 4.
Cyclic voltammograms recorded at a scan rate of 0.05 Vꞏs−1 with Gal-Fc-CNT paste electrode in 0. 1 M NaOH supporting electrolyte pH=12 (black line), 0.1 M Na2SO4 adjusted at pH=3 (blue line), 0.1 M Na2SO4 adjusted at pH=5 (green line), within the potential range of −2.0 to +1.0 V/SCE.
Figure 4.
Cyclic voltammograms recorded at a scan rate of 0.05 Vꞏs−1 with Gal-Fc-CNT paste electrode in 0. 1 M NaOH supporting electrolyte pH=12 (black line), 0.1 M Na2SO4 adjusted at pH=3 (blue line), 0.1 M Na2SO4 adjusted at pH=5 (green line), within the potential range of −2.0 to +1.0 V/SCE.
Figure 5.
(a) CVs recorded with Gal-Fc-CNT electrode in 0.1 M NaOH supporting electrolyte within the potential range from -2.00 to +1.00 V/SCE at the scan rate of 0.05 V∙s-1 in the presence of: 1-5 mg∙L-1 CPP (red line); 1-5 mg∙L-1 CPB (blue line); 1-5 mg∙L-1 DOX (green line); (b) Linear dependence of the anodic current recorded at -0.60 V vs CPP, CPB and DOX concentrations.
Figure 6.
CVs recorded with Gal-Fc-CNT electrode in 0.1 M Na2SO4 adjusted at pH=3 within the potential range from -1.50 to +1.00 V/SCE at the scan rate of 0.05 V∙s-1 in the presence of: 1-3 mg∙L-1 CPP (red line); 1-3 mg∙L-1 DOX (green line); 1-3 mg∙L-1 CPB (blue line); Inset: Detail of CVs.
Figure 6.
CVs recorded with Gal-Fc-CNT electrode in 0.1 M Na2SO4 adjusted at pH=3 within the potential range from -1.50 to +1.00 V/SCE at the scan rate of 0.05 V∙s-1 in the presence of: 1-3 mg∙L-1 CPP (red line); 1-3 mg∙L-1 DOX (green line); 1-3 mg∙L-1 CPB (blue line); Inset: Detail of CVs.
Figure 7.
(a) CVs recorded at various scan rates of 10 mV·s−1 (curve 1), 20 mV·s−1 (curve 2), 30 mV·s−1 (curve 3), 40 mV·s−1 (curve 4), 50 mV·s−1 (curve 5), 60 mV·s−1 (curve 6), 80 mV·s−1 (curve 7), 100 mV·s−1 (curve 8), and 200 mV·s−1 (curve 9) with the Gal-Fc-CNT paste electrode in 0.1 M NaOH supporting electrolyte (pH=12), and in the presence of 2 mg⸱L-1 DOX concentration. (b) Dependence of anodic and cathodic peaks current vs. square root of the scan rate. (c) Dependence of anodic and cathodic peak potentials vs logarithm of the scan rate.
Figure 8.
(a) CVs recorded at various scan rates of 10 mV·s−1 (curve 1), 20 mV·s−1 (curve 2), 30 mV·s−1 (curve 3), 40 mV·s−1 (curve 4), 50 mV·s−1 (curve 5), 60 mV·s−1 (curve 6), 80 mV·s−1 (curve 7), 100 mV·s−1 (curve 8), and 200 mV·s−1 (curve 9) with the Gal-Fc-CNT paste electrode in 0.1 M Na2SO4 adjusted at pH=3, and in the presence of 2 mg⸱L-1 DOX concentration. (b) Dependence of anodic and cathodic peaks current vs. square root of the scan rate. (c) Dependence of anodic and cathodic peak potentials vs logarithm of the scan rate.
Figure 9.
(a) Differential-pulsed voltammograms at Gal-Fc-CNT paste electrode in 0.1 M NaOH supporting electrolyte (curve 1-black), pH=12, and in the presence of different DOX concentrations: 2-10 µg⸱L−1 DOX (green curves), and in the presence of 100 and 200 µg⸱L−1 CPP (red curves) and 100 and 200 µg⸱L−1 CPB concentrations (blue curves); at 25 mV step potential; 100 mV modulation amplitude, 50 mV·s−1 potential scan rate; potential range: −1.50 to +1.00 V vs. SCE. (b) Differential-pulsed voltammograms at Gal-Fc-CNT paste electrode in 0.1 M Na2SO4 adjusted at pH=3 (curve 1-black), and in the presence of different DOX concentrations: 20-100 µg⸱L−1 DOX (green curves), and in the presence of 100 and 200 CPP µg⸱L−1 (red curves) and 100-200 µg⸱L−1 CPB concentrations (blue curves); at 25 mV step potential; 200 mV modulation amplitude, 50 mV·s−1 potential scan rate; potential range: −1.50 to +1.00 V vs. SCE. Inset: Calibration plots of the currents recorded at E = −0.46 V and +0.45 V/SCE vs DOX concentrations.
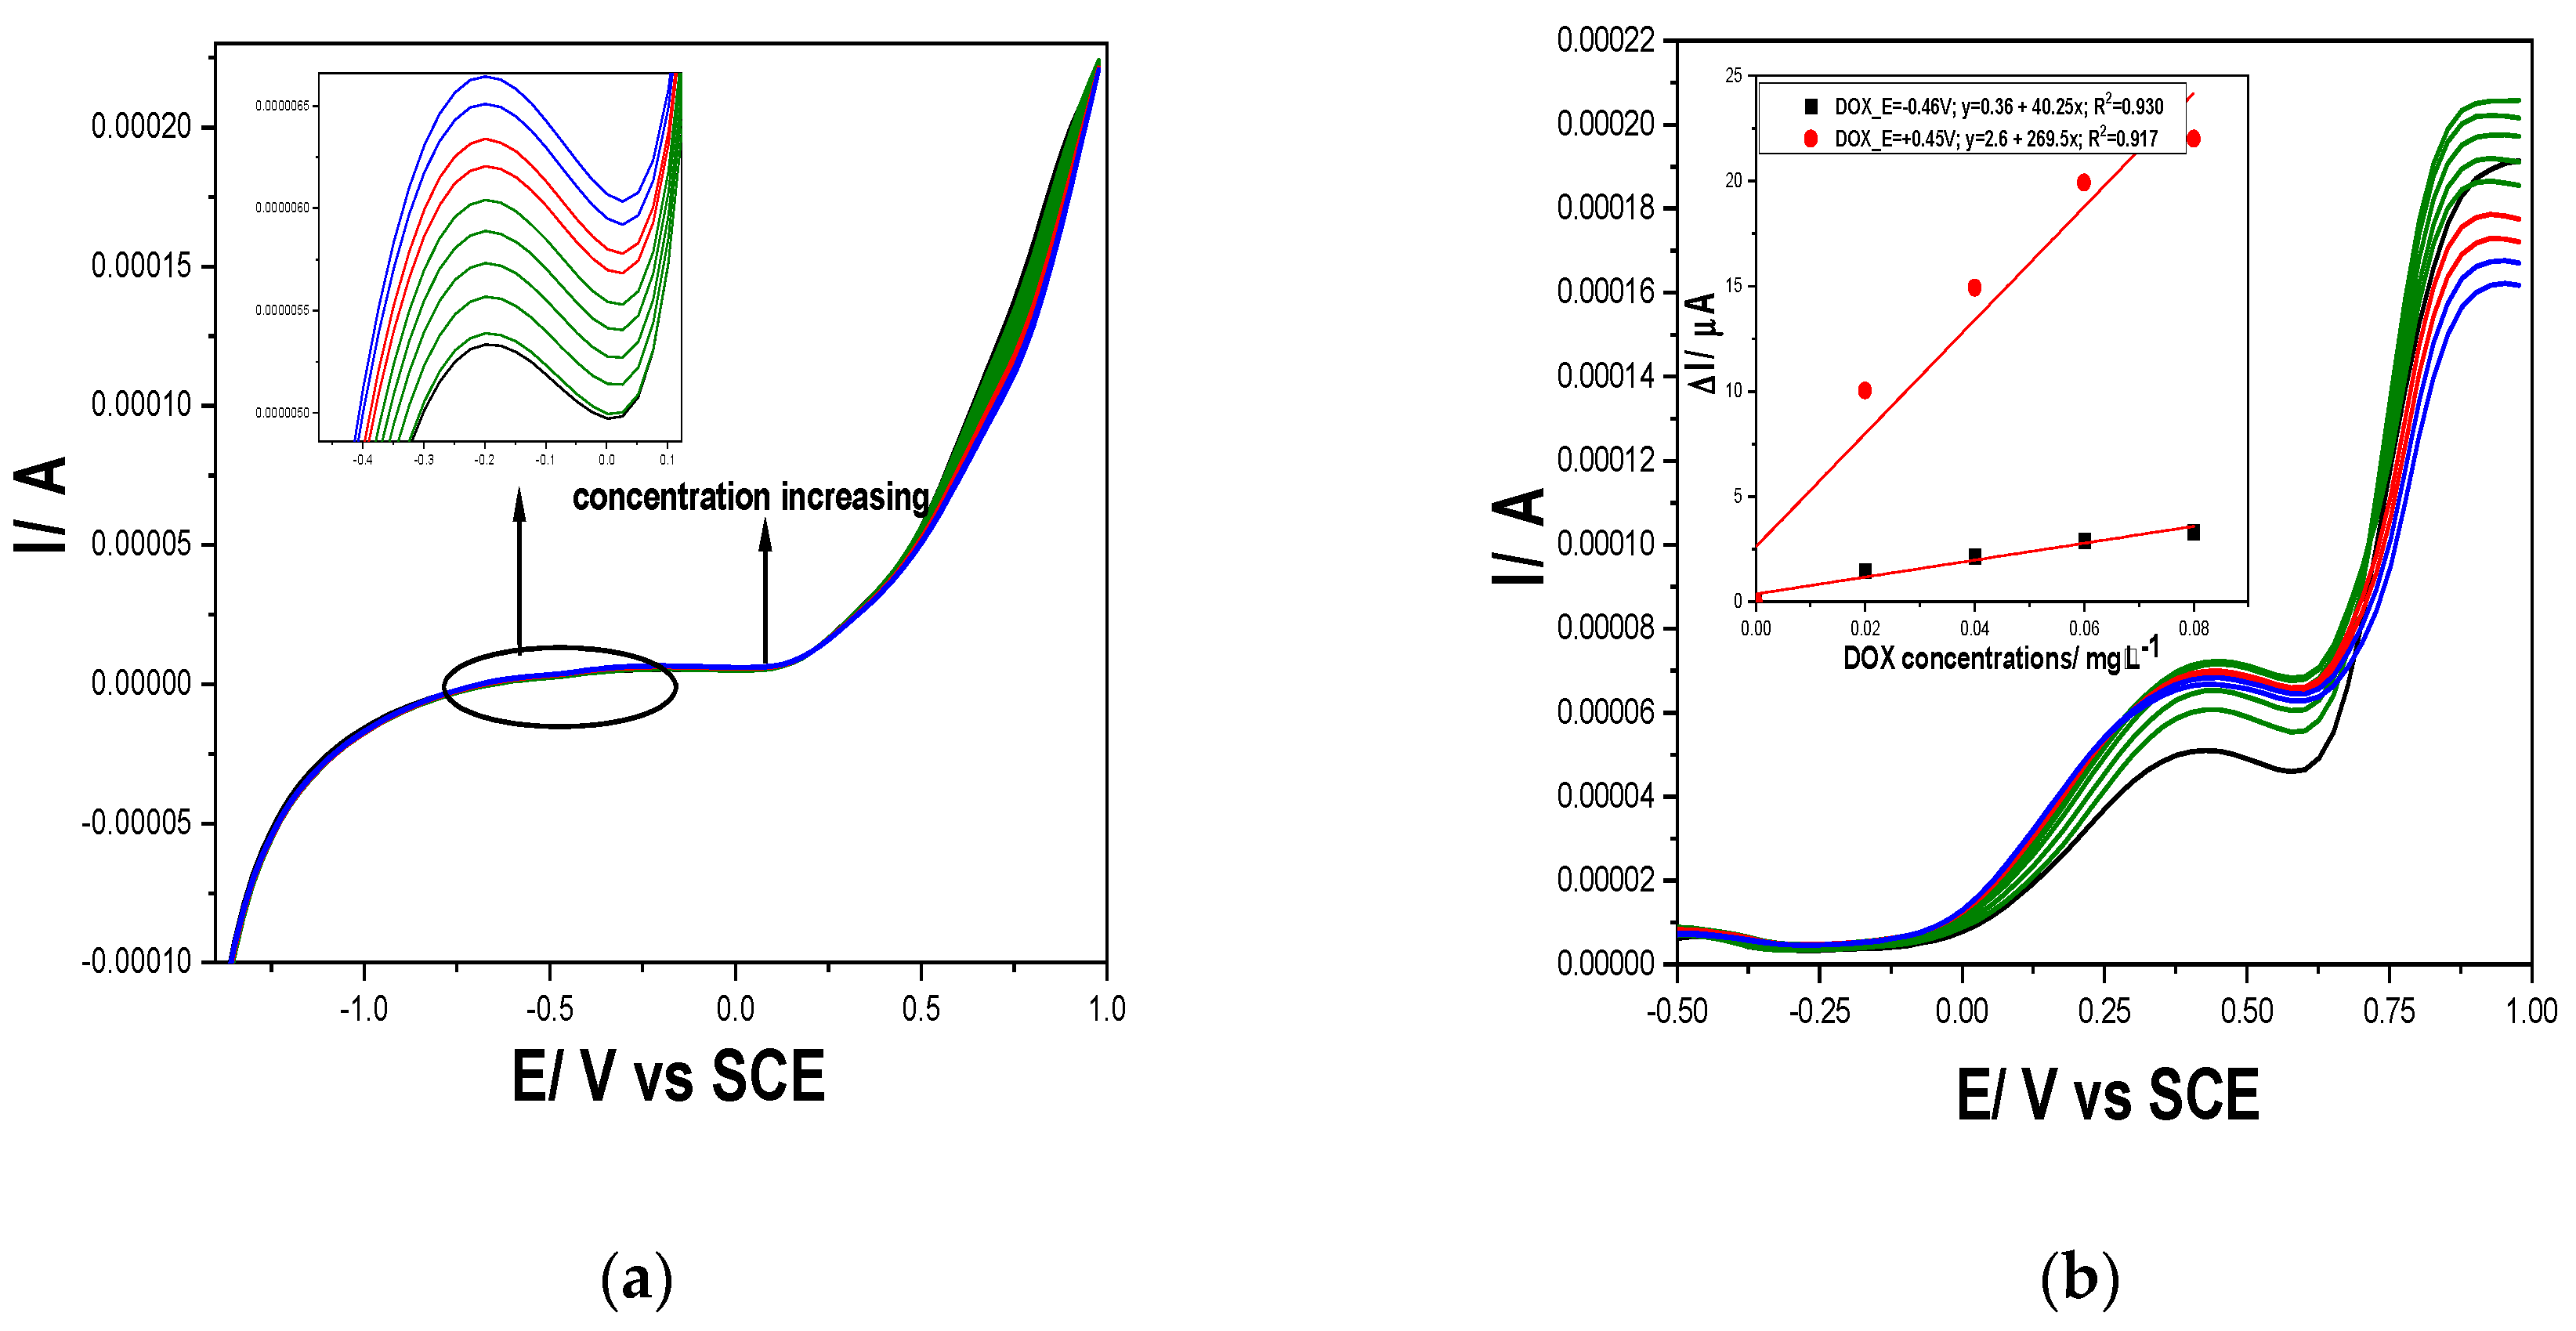
Figure 10.
(a) Square-wave voltammograms at Gal-Fc-CNTpaste electrode in 0.1 M NaOH supporting electrolyte (curve 1-black), pH=12, and in the presence of different DOX concentrations: 4-10 µg⸱L−1 DOX (green curves), and in the presence of 100 and 200 µg⸱L−1 CPP (red curves) and 100 and 200 µg⸱L−1 CPB (blue curves); at 4 mV step potential; 100 mV modulation amplitude, frequency=25 Hz, 100 mV·s−1 potential scan rate; potential range: −1.50 to +1.00 V/ SCE; (b) Square-wave voltammograms at CNT-Fc paste electrode in 0.1 M Na2SO4 adjusted at pH=3 (curve 1-black), and in the presence of different DOX concentrations: 2-10 µg⸱L−1 DOX (green curves), and in the presence of 100 and 200 µg⸱L−1 CPP (red curves) and 100 and 200 µg⸱L−1 CPB concentrations (blue curves); at 4 mV step potential; 100 mV modulation amplitude, frequency=50 Hz, 200 mV·s−1 potential scan rate; potential range: −1.50 to +1.00 V vs. SCE. Inset: Calibration plots of the currents recorded at E= +0.47 V/SCE vs DOX concentrations.
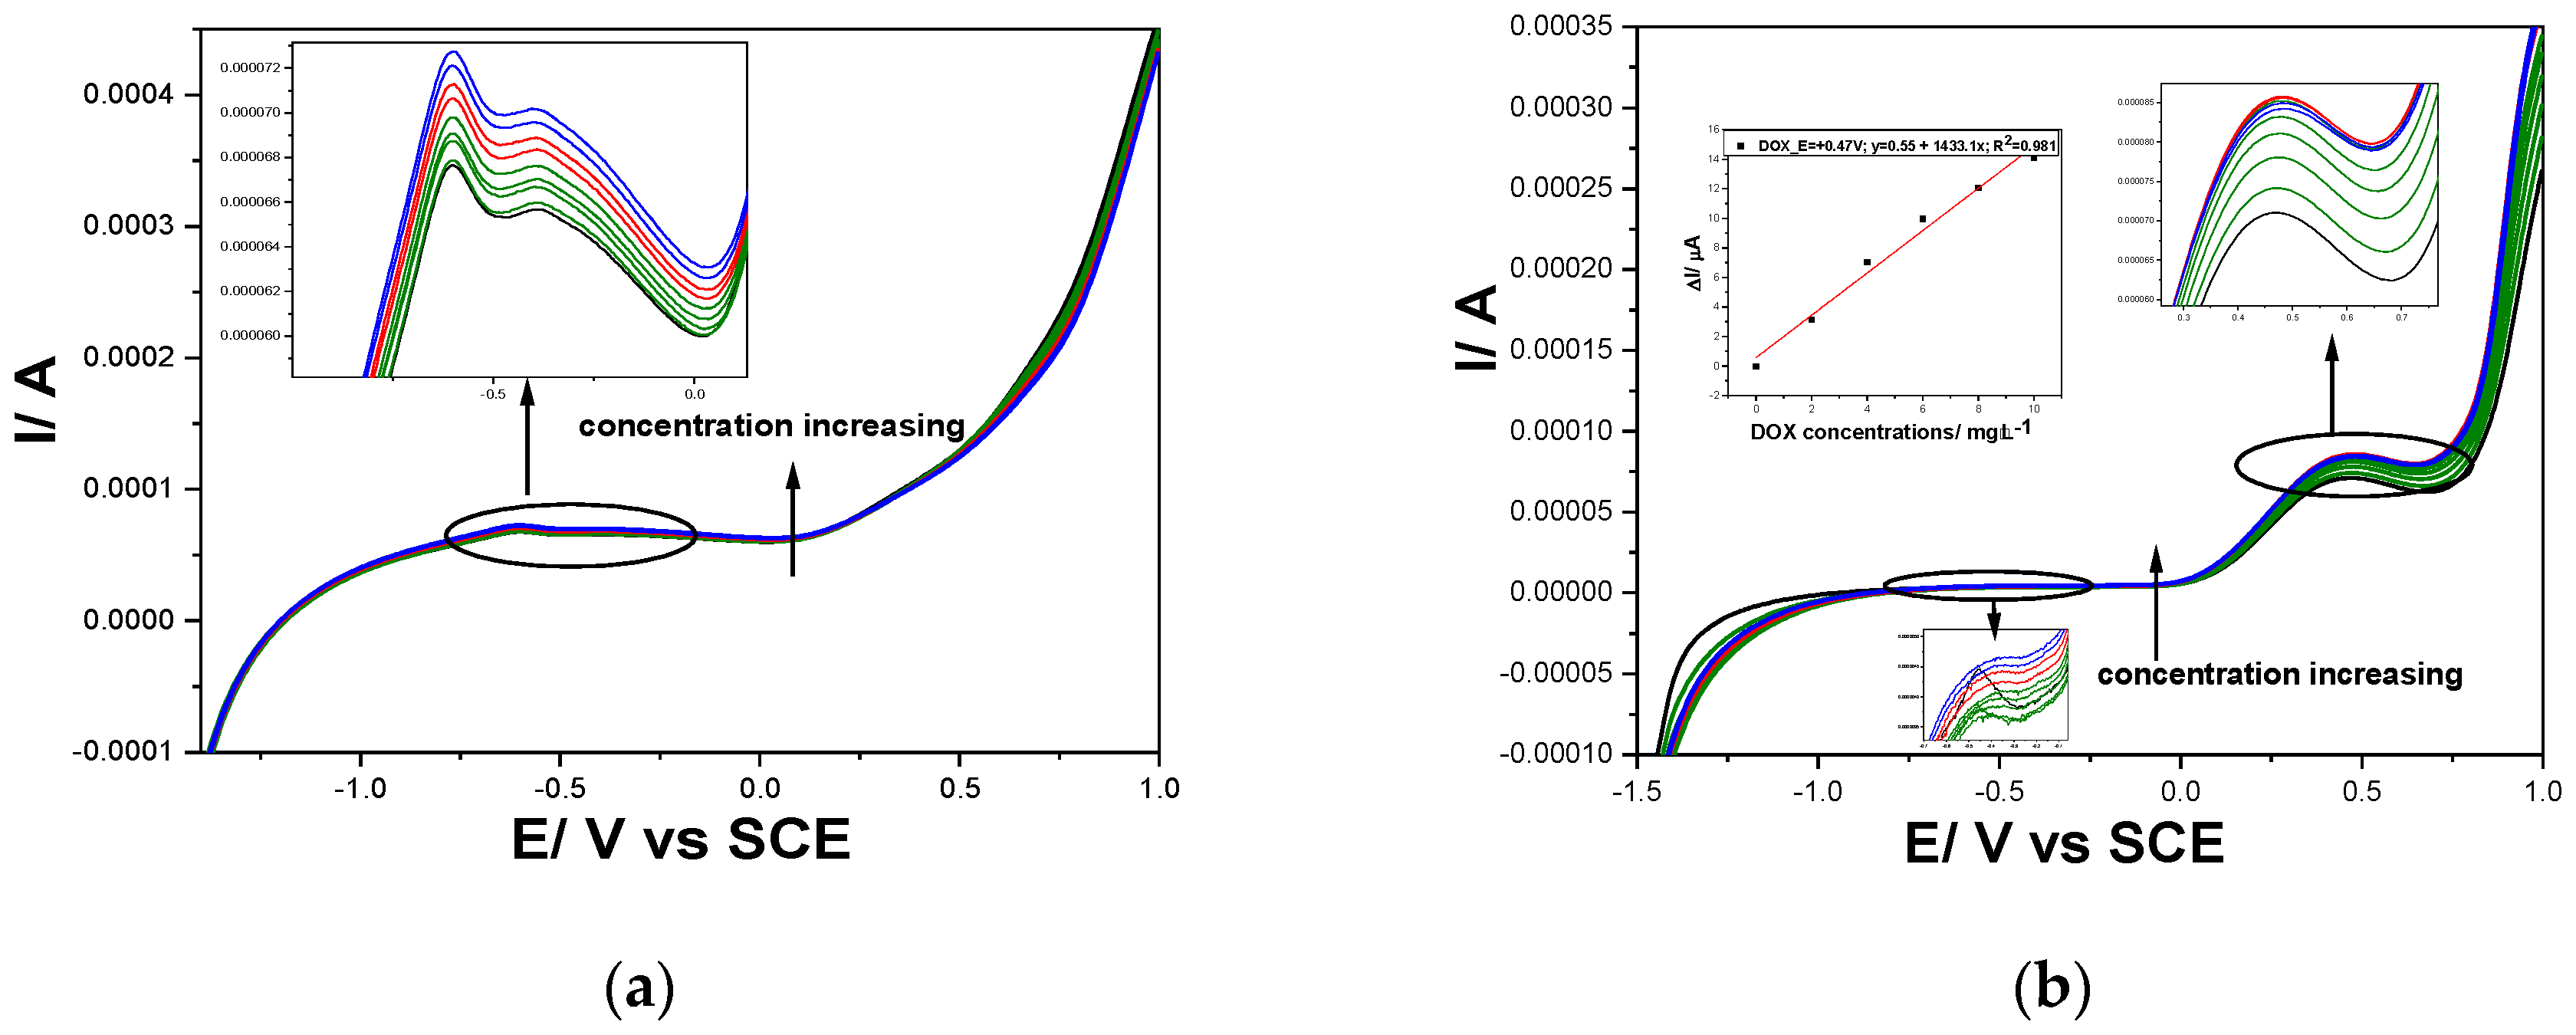
Table 1.
The utile signal determined for DOX, CPB and CPP at each pH value.
Table 1.
The utile signal determined for DOX, CPB and CPP at each pH value.
| pH |
DOX |
CPB |
CPP |
| E/V vs SCE |
ΔI/
µA/mg⸱L-1
|
E/V vs SCE |
ΔI/
µA/mg⸱L-1
|
E/V
vs SCE |
ΔI/
µA/mg⸱L-1
|
| 3 |
-0.46 |
0.51 |
-0.46 |
- |
-0.46 |
- |
| 5 |
0.46 |
4.05 |
-0.46 |
3.25 |
-0.50 |
2.76 |
| 12 |
-0.60 |
5.41 |
-0.60 |
4.13 |
-0.60 |
3.04 |
Table 2.
Comparative utile signal achieved for simultaneous detection of DOX, CPB and CPP at pH of 12.
Table 2.
Comparative utile signal achieved for simultaneous detection of DOX, CPB and CPP at pH of 12.
| Technique |
DOX |
CPB |
CPP |
| E/V vs SCE |
ΔI/
µA/mg⸱L-1
|
E/V vs SCE |
ΔI/
µA/mg⸱L-1
|
E/V
vs SCE |
ΔI/
µA/mg⸱L-1
|
| DPV |
-0.20 |
73.71 |
-0.20 |
5.00 |
-0.20 |
6.55 |
| SWV |
-0.60 |
311.9 |
-0.60 |
22.90 |
-0.60 |
30.25 |
Table 3.
The performance of Gal-Fc-CNT paste electrode in comparison with reported ones.
Table 3.
The performance of Gal-Fc-CNT paste electrode in comparison with reported ones.
| Electrode |
Analyte |
LOD |
Method |
Reference |
| CDs-5.0/MgO/SPCE |
DOX |
90 nM |
CV |
[39] |
| Pt/MWCNTs |
DOX |
3.7 nM |
CV |
[40] |
| graphite-based disposable SPE |
DOX/
Simvastatin* |
180 nM |
CA |
[34] |
| 2.78 µM |
LSV |
| CuNPs-CB-Nafion/GCE |
DOX/
Methotrexate* |
24 nM |
SWV |
[41] |
| MOF-235/GO nanocomposite modified CPE |
DOX |
5 nM |
CV |
[42] |
| SNPs@MOF/BNSs-Fc/GCE |
DOX |
2 nM |
SWV |
[43] |
| ZnO/MWCNTs/CPE |
CPB |
30 nM |
DPV |
[10] |
| AuNPs/SGNF-modified GCE |
CPB |
17 nM |
DPV |
[44] |
| MWCNT-PUFIX/HF-PGE |
CPB/ Erlotinib* |
0.110 µM |
DPV |
[45] |
| GCE |
CPP |
1.1 µM |
CV |
[46] |
| Current work |
DOX/CPB/CPP* |
1.13/ 30/ 32 nM |
SWV |
- |

