1. Introduction
Foxtail millet (
Setaria italica) is increasingly gaining attention from the public due to its unique food and medicinal properties [
1]. The main edible part of foxtail millet is starch, which accounts for about 70% of the total content [
2,
3,
4]. Starch is composed of amylose and amylopectin [
5], and the proportion of these two substances directly affects the quality of foxtail millet [
6,
7]. A lower proportion of amylose results in stickiness and glossiness, while a higher proportion leads to dryness, dark color, and poor palatability [
8]. Therefore, achieving rapid detection of amylose and amylopectin in foxtail millet holds significant practical significance in terms of product processing and quality evaluation.
Currently, the main methods for detecting the starch content in foxtail millet mainly use chemical detection[
9,
10,
11], which has high reliability but is cumbersome in operation and high in cost, making them unable to achieve rapid detection. Hyperspectral imaging, as a rapid detection technology, combines the advantages of imaging and spectral analysis [
12,
13,
14,
15]. It has been widely used in qualitative classification and quantitative detection of components in agricultural products [
16,
17,
18,
19,
20,
21]. Due to the high dimensionality of hyperspectral data and the overlapping reflection of functional group spectral information in a single band [
22,
23], to reduce variable dimensions and improve the prediction accuracy of the model, key band extraction combined algorithm is generally used to select key bands from the target variable data set. Zhao et al. [
24] used CARS to extract key bands from the full spectral data of two types of whole wheat flour and established PLSR models for adulteration testing, achieving prediction accuracies with R2 values of 0.993 and 0.991, respectively. Yang et al. [
25] used the MSC-IRIV-RSEL model to select the optimal hyperspectral wavelengths for maize seed and detected of the purity of maize seeds, providing a new method for maize seed purity recognition using hyperspectral technology. Presently, the key band extraction combined algorithm is being more widely applied in key band extraction. Yu et al. [
26] proposed a three-step combined strategy for selecting near-infrared spectral wavelengths, which improves the prediction accuracy of the model while highlighting the advantages of each algorithm and overcoming their limitations.
In this study, hyperspectral data of foxtail millet flour under different sheep manure application rates were collected. The amylose and amylopectin content of the samples were determined using traditional chemical methods. Combining the knowledge of chemometrics, prediction models for rapid detection of amylose and amylopectin in foxtail millet flour were established. The visualization of the accumulation patterns of amylose and amylopectin content in foxtail millet flour was achieved through the prediction models established by the key band extraction combined algorithm. The aim was to explore a method for rapid, non-toxic, non-contact, low-cost, and visual prediction of amylose and amylopectin content in foxtail millet flour. Studying the feasibility of applying hyperspectral detection technology combined with chemometrics in the detection of nutritional components in foxtail millet. The research results can provide a reference for further selection of foxtail millet agronomic traits, optimization of breeding and cultivation methods. Simultaneously, provide theoretical support for the classification and grading of product quality, and enhances the value of foxtail millet end products.
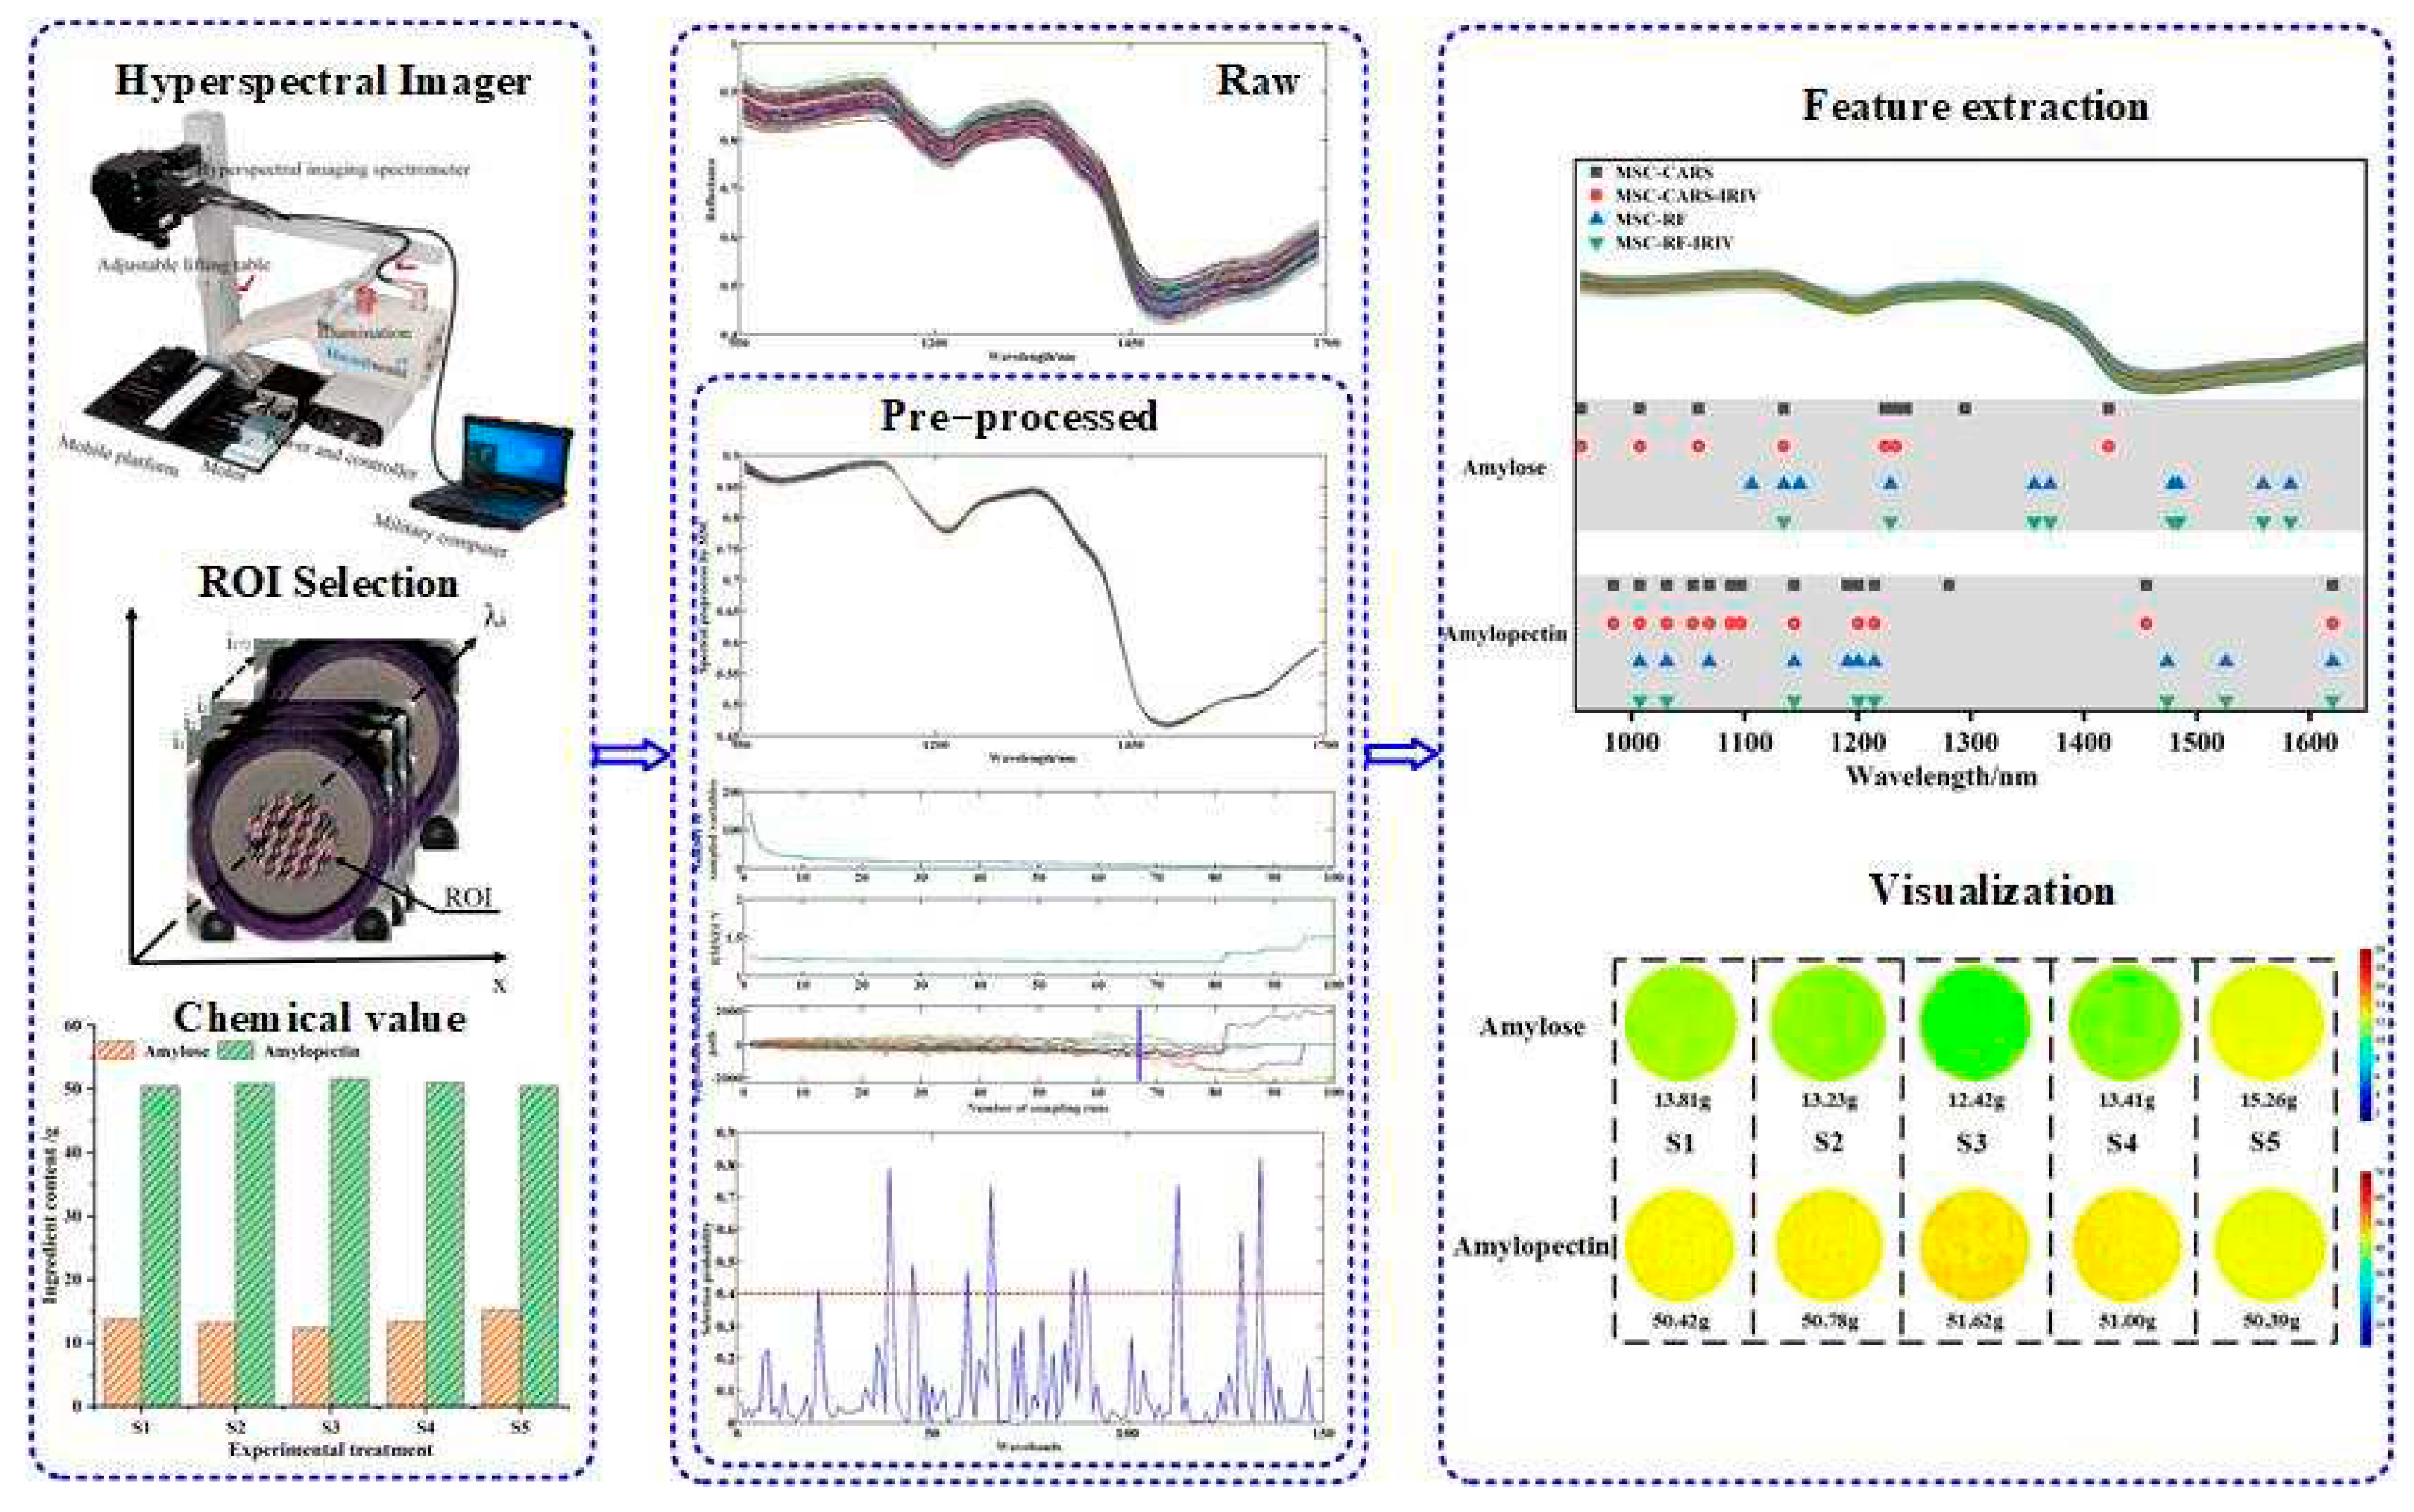
Figure 1 illustrates the flow of this study.
2. Materials and Methods
2.1. Experimental design ang sample collection
The experimental samples selected for this study were provided by the Millet Research Institute of Shanxi Agricultural University. The tested sheep manure had an organic matter content of 42.7%, nitrogen 1.86%, phosphorus 1.47%, and potassium 2.02%. Five treatments were set up: S1 with 4 m3 of sheep manure per acre, S2 with 5 m3, S3 with 6 m3, S4 with 7 m3, and S5 as the blank control. Sampling was conducted using the chessboard sampling method, with 180 points sampled per experimental plot, each with a 2 m2 area. The sampling points were mixed in the instrument every 5 points. After the experimental samples were sun-dried, cleaned, and polished, a total of 358 foxtail millet flour samples were collected. After passing through an 80-mesh screen, the samples were sealed and numbered for record keeping.
2.2. Hyperspectral imaging system
Hyperspectral data acquisition was performed using a Starter Kit-type hyperspectral imager (Headwall Photonics, USA), which consists of a scanning stage, a hyperspectral imager (aperture 1.4, focal length 25 mm), a light source, a portable computer, and a spectral range of 900~1700 nm, a spectral resolution of 4.715 nm, and a total of 172 bands. The acquisition parameters were set as follows: the surface of the sample was 25 mm from the lens, the stage translation speed was 16 mm/s, and the camera exposure time was 0.9 ms.
2.3. Data acquisition
2.3.1. Hyperspectral data acquisition of foxtail millet flour
The experimental samples were placed in 5 cm diameter and 1 cm deep experimental vessels to ensure that the surface of the tested samples was flat and compact. Each sample was collected three times for hyperspectral data, and the data results were sequentially numbered and saved. Before collecting hyperspectral data, the black-and-white correction was applied according to equation 1, and the correction was repeated every 3 images were collected [
27].
Among these, X refers to the corrected hyperspectral images; B represents the dark background light intensity; W represents the white background light intensity; and I denotes the original hyperspectral images.
2.3.2. Measurement of amylose and amylopectin content in foxtail millet flour
After the hyperspectral data collection of the samples, the content of amylose and amylopectin was determined. In order to reduce the error caused by the single-wavelength spectrophotometry method for determining starch content, the samples were subjected to defatting treatment and then the amylose and amylopectin content were determined using the dual-wavelength spectrophotometry method [
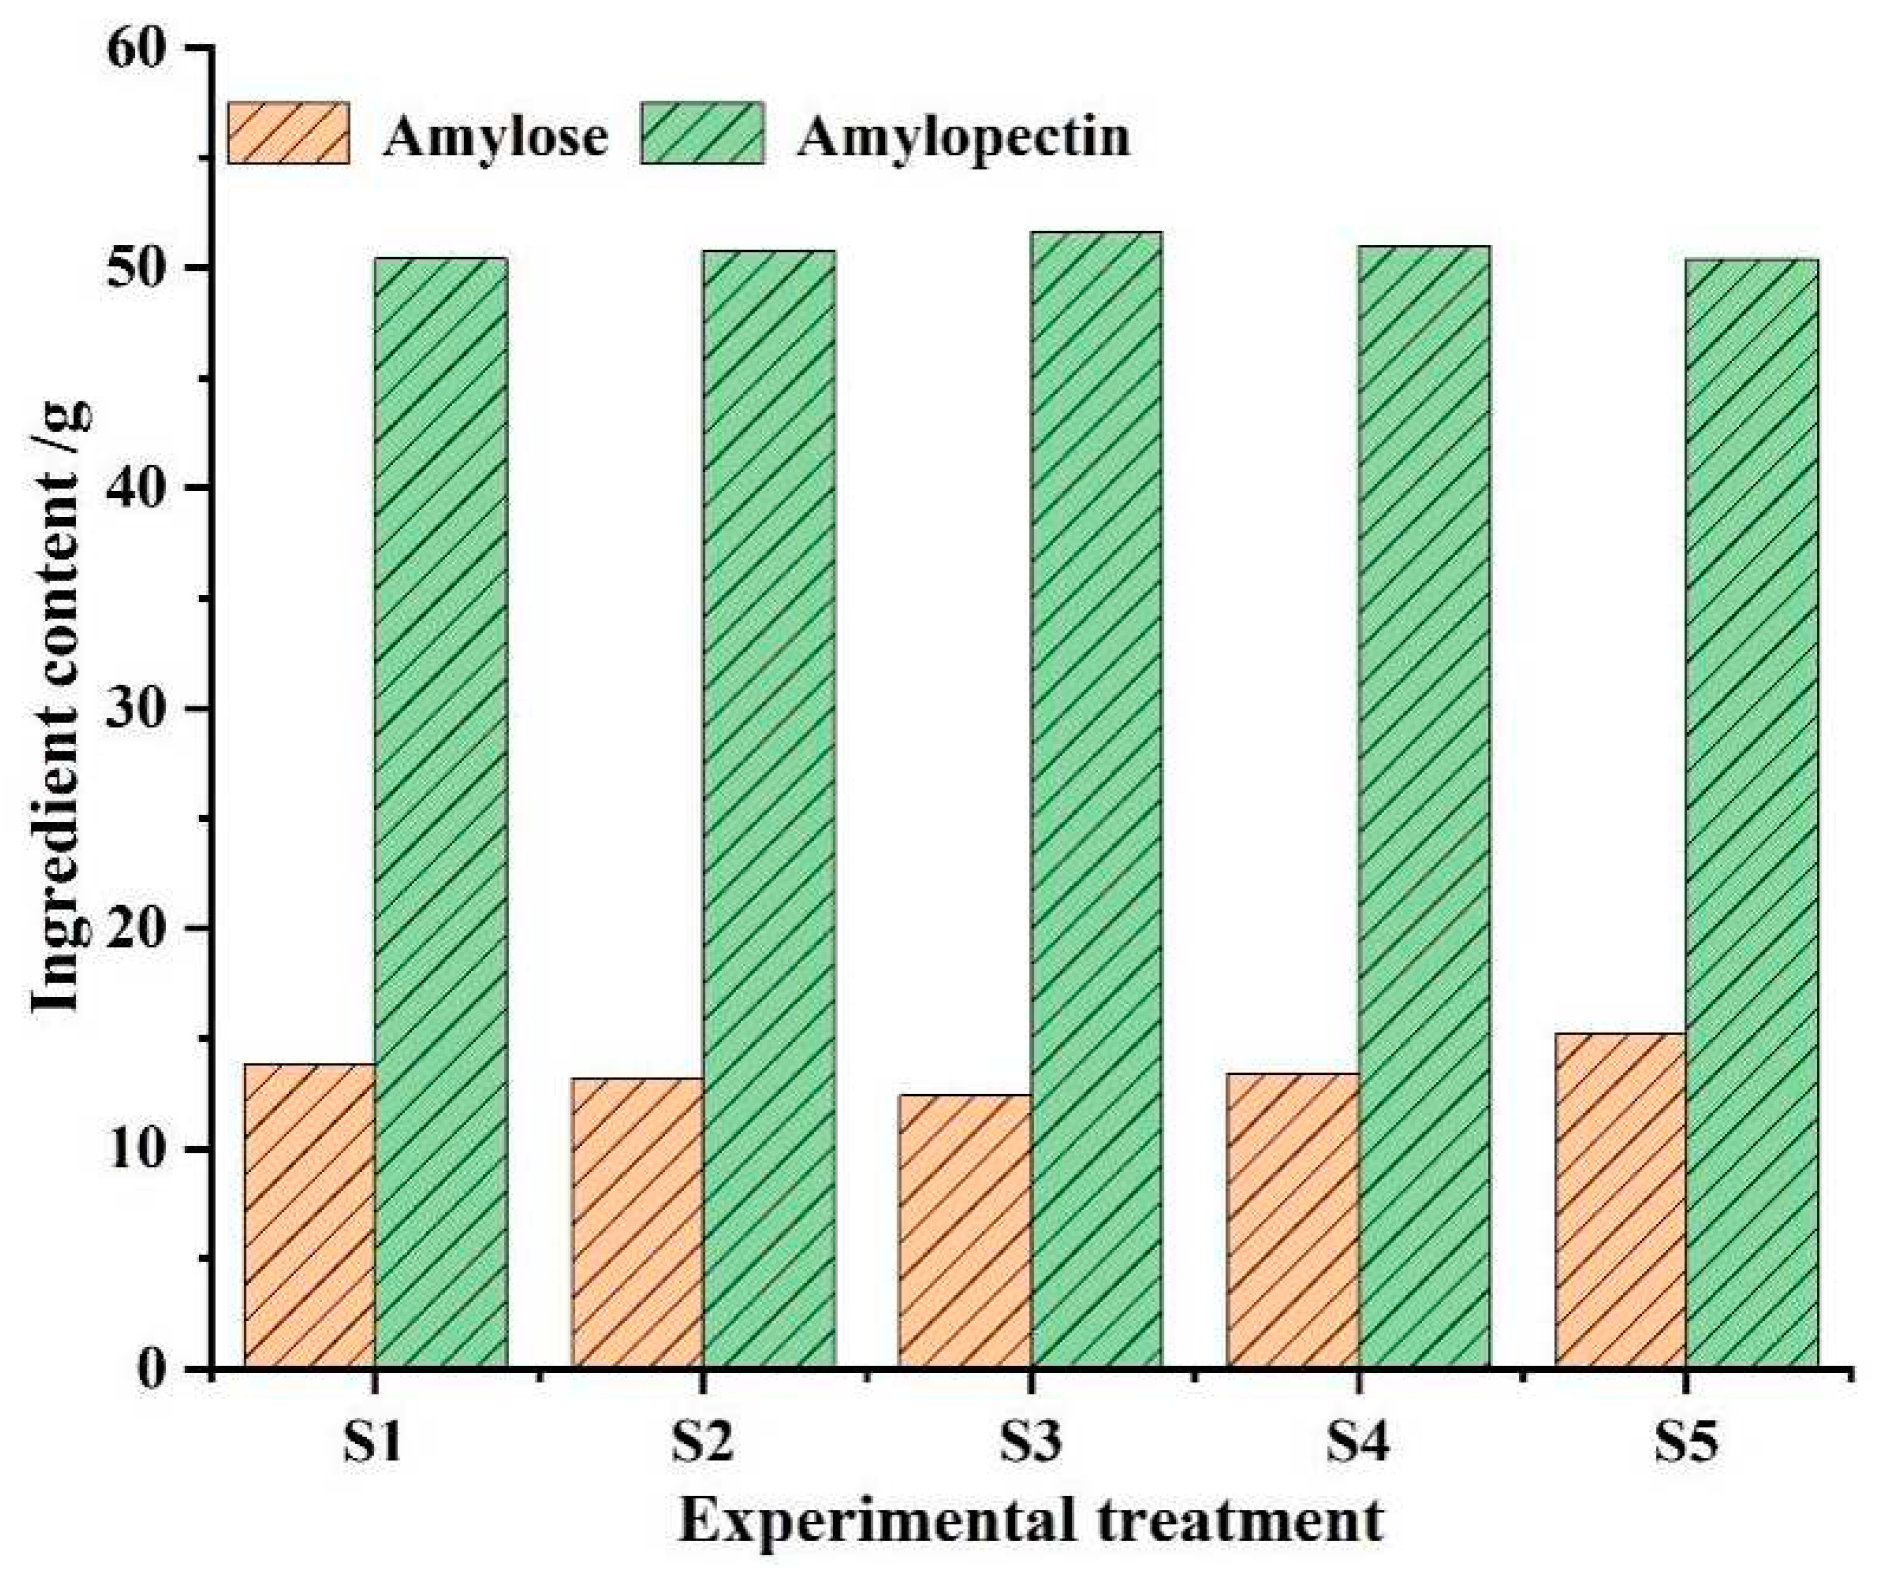
28]. The content statistics results are shown in
Figure 2.
Current studies show that low amylose and high amylopectin content in foxtail millet make it soft and sticky, corresponding to a higher quality and good commercial value. As can be seen from
Figure 2, the different application quantities of sheep manure will reflect the differences in the content of sample components. The average content of amylopectin in the S3 treatment reached the highest value of 51.62 g, and the average content of amylose was the lowest at 12.42 g. Data results show that a significant content gradient can be displayed and S3 treatment is the optimal choice for starch accumulation.
2.4. Hyperspectral data analysis
Hyperspectral data processing was conducted on foxtail millet using the Kennard-Stone algorithm to divide the spectral data into training and prediction sets in a 2:1 ratio [
29]. The MSC pre-processing method was applied to preprocess the foxtail millet flour hyperspectral data set [
30,
31]. The key band extraction combined algorithm was used to extract spectral data key bands and establish PLSR models to predict the amylose and amylopectin content in samples. The best model was selected to establish regression equations and visualize the results. Model evaluation was conducted using
R and
RMSE.
2.4.1. Hyperspectral data pre-processing
To eliminate the data differences caused by varying levels of sample scattering, this study employed the MSC for hyperspectral data. This algorithm enables the calculation of baseline shifts and offsets for each sample spectrum through a univariate regression with the average spectrum data. The obtained results are then used to correct the samples' spectral data, which helps reduce random errors and improve the signal-to-noise ratio to enhance the accuracy of model predictions [
32].
2.4.2. Key band extraction
By using key band extraction, it is possible to effectively reduce the risk of decreased model prediction capability due to redundant variables and enhance variable interpretability [
33,
34,
35,
36]. In this study, the key band extraction combined algorithm is proposed to minimize the number of variables while ensuring model accuracy and improving computational speed, using a "coarse-to-fine" extraction process. Based on this, MSC-CARS-IRIV and MSC-RF-IRIV were selected for key band extraction in this study. Subsequently, PLSR prediction models were established to predict the content of amylose and amylopectin in foxtail millet flour.
CARS is a method that simulates the concept of "survival of the fittest" in Darwin's theory of evolution. It utilizes an adaptive reweighted sampling technique to select wavelengths with larger absolute regression coefficients calculated by partial least squares regression. It also uses cross-validation to select the combination set with the lowest root mean square error. Due to the stochastic nature of the algorithm, multiple iterations are required to retain the wavelengths selected more frequently to improve the stability of subsequent regression models [
37].
The computational principle of the CARS algorithm is as follows:
ⅰ) By the Monte Carlo method, 80% of the samples are randomly selected from the calibration set to form the modeling set, and the remaining samples are used to establish the PLS model for prediction. The absolute value weights of the regression coefficients are recorded for each sampling. The ?
bi?represents the absolute value of the regression coefficient for the ith variable, and
wi represents the absolute value weight of the regression coefficient for the ith variable. m represents the number of remaining variables for each sampling;
ⅱ) Using the exponentially decreasing function (EDF), forcefully eliminate the wavelengths with relatively small absolute value weights of the regression coefficients. When establishing the PLS model based on the Monte Carlo sampling for the ith time, the retained wavelength proportion
Ri is obtained according to the EDF;
In the formula, μ and k are constants, which can be calculated in the following two cases:
1) When a single sampling is performed for calculation, all bands participate in the modeling analysis, and Ri = 1;
2) When the last sampling (the Nth time) is completed and calculated, only two bands are left to participate in the modeling. At this time,
Ri = 2/n, where
n is the original number of bands. Therefore, from the initial and final sampling conditions, we can know that
μ and
k are respectively:
ⅲ) During each sampling, adaptive reweighted sampling (ARS) is used to select Ri*n bands from the variables in the previous sampling for modeling and calculation of the root mean square error of cross-validation(RMSECV);
ⅳ) Set the sampling number to N, execute the operation, and the variable corresponding to the minimum RMSECV is the selected band.
RF is an intelligent optimization algorithm that can utilize a small number of variables for iterative modeling to achieve variable selection in high-dimensional data, characterized by fast running time and a simple process. It calculates the probability of variable selection by simulating a Markov chain that follows a steady distribution, thus completing the extraction of key bands [
38].
The computational principle of the RF algorithm is as follows:
ⅰ) Initialize a subset V0 of variables containing Q elements;
ⅱ) Generate a candidate subset V* of Q* variables from the original subset V0, and choose V* by calculating RMSECV between V* and V0. Assign the value of V1 to V*, so that ultimately V0 = V1. Iterate the calculation N times to complete the operation;
ⅲ) Calculate the probability of each variable being selected. Variables with high selection probabilities will be selected.
The IRIV algorithm is based on the idea of model cluster analysis, and it fully considers the joint effect of variables. It randomly combines variables to generate a binary matrix, where the rows represent variable combinations and the columns represent the number of variables. Based on each row, a PLS model is established, and the effectiveness of these combined models is evaluated through RMSECV. Finally, the contribution is divided into four types: strong information variables, weak information variables, no information variables, and interference information variables. The retained variables are determined by the difference between mean values (DMEAN) and P-value, where the former is the mean value of the root mean square error when the wavelength variable is included and not included, and the latter is the P-value of the Mann-Whitney U test. After executing the algorithm multiple times, invalid and interference variables are excluded, and the best feature bands are extracted from the strong and weak information variables through reverse elimination [
39].
3. Results
3.1. Samples spectral characteristics
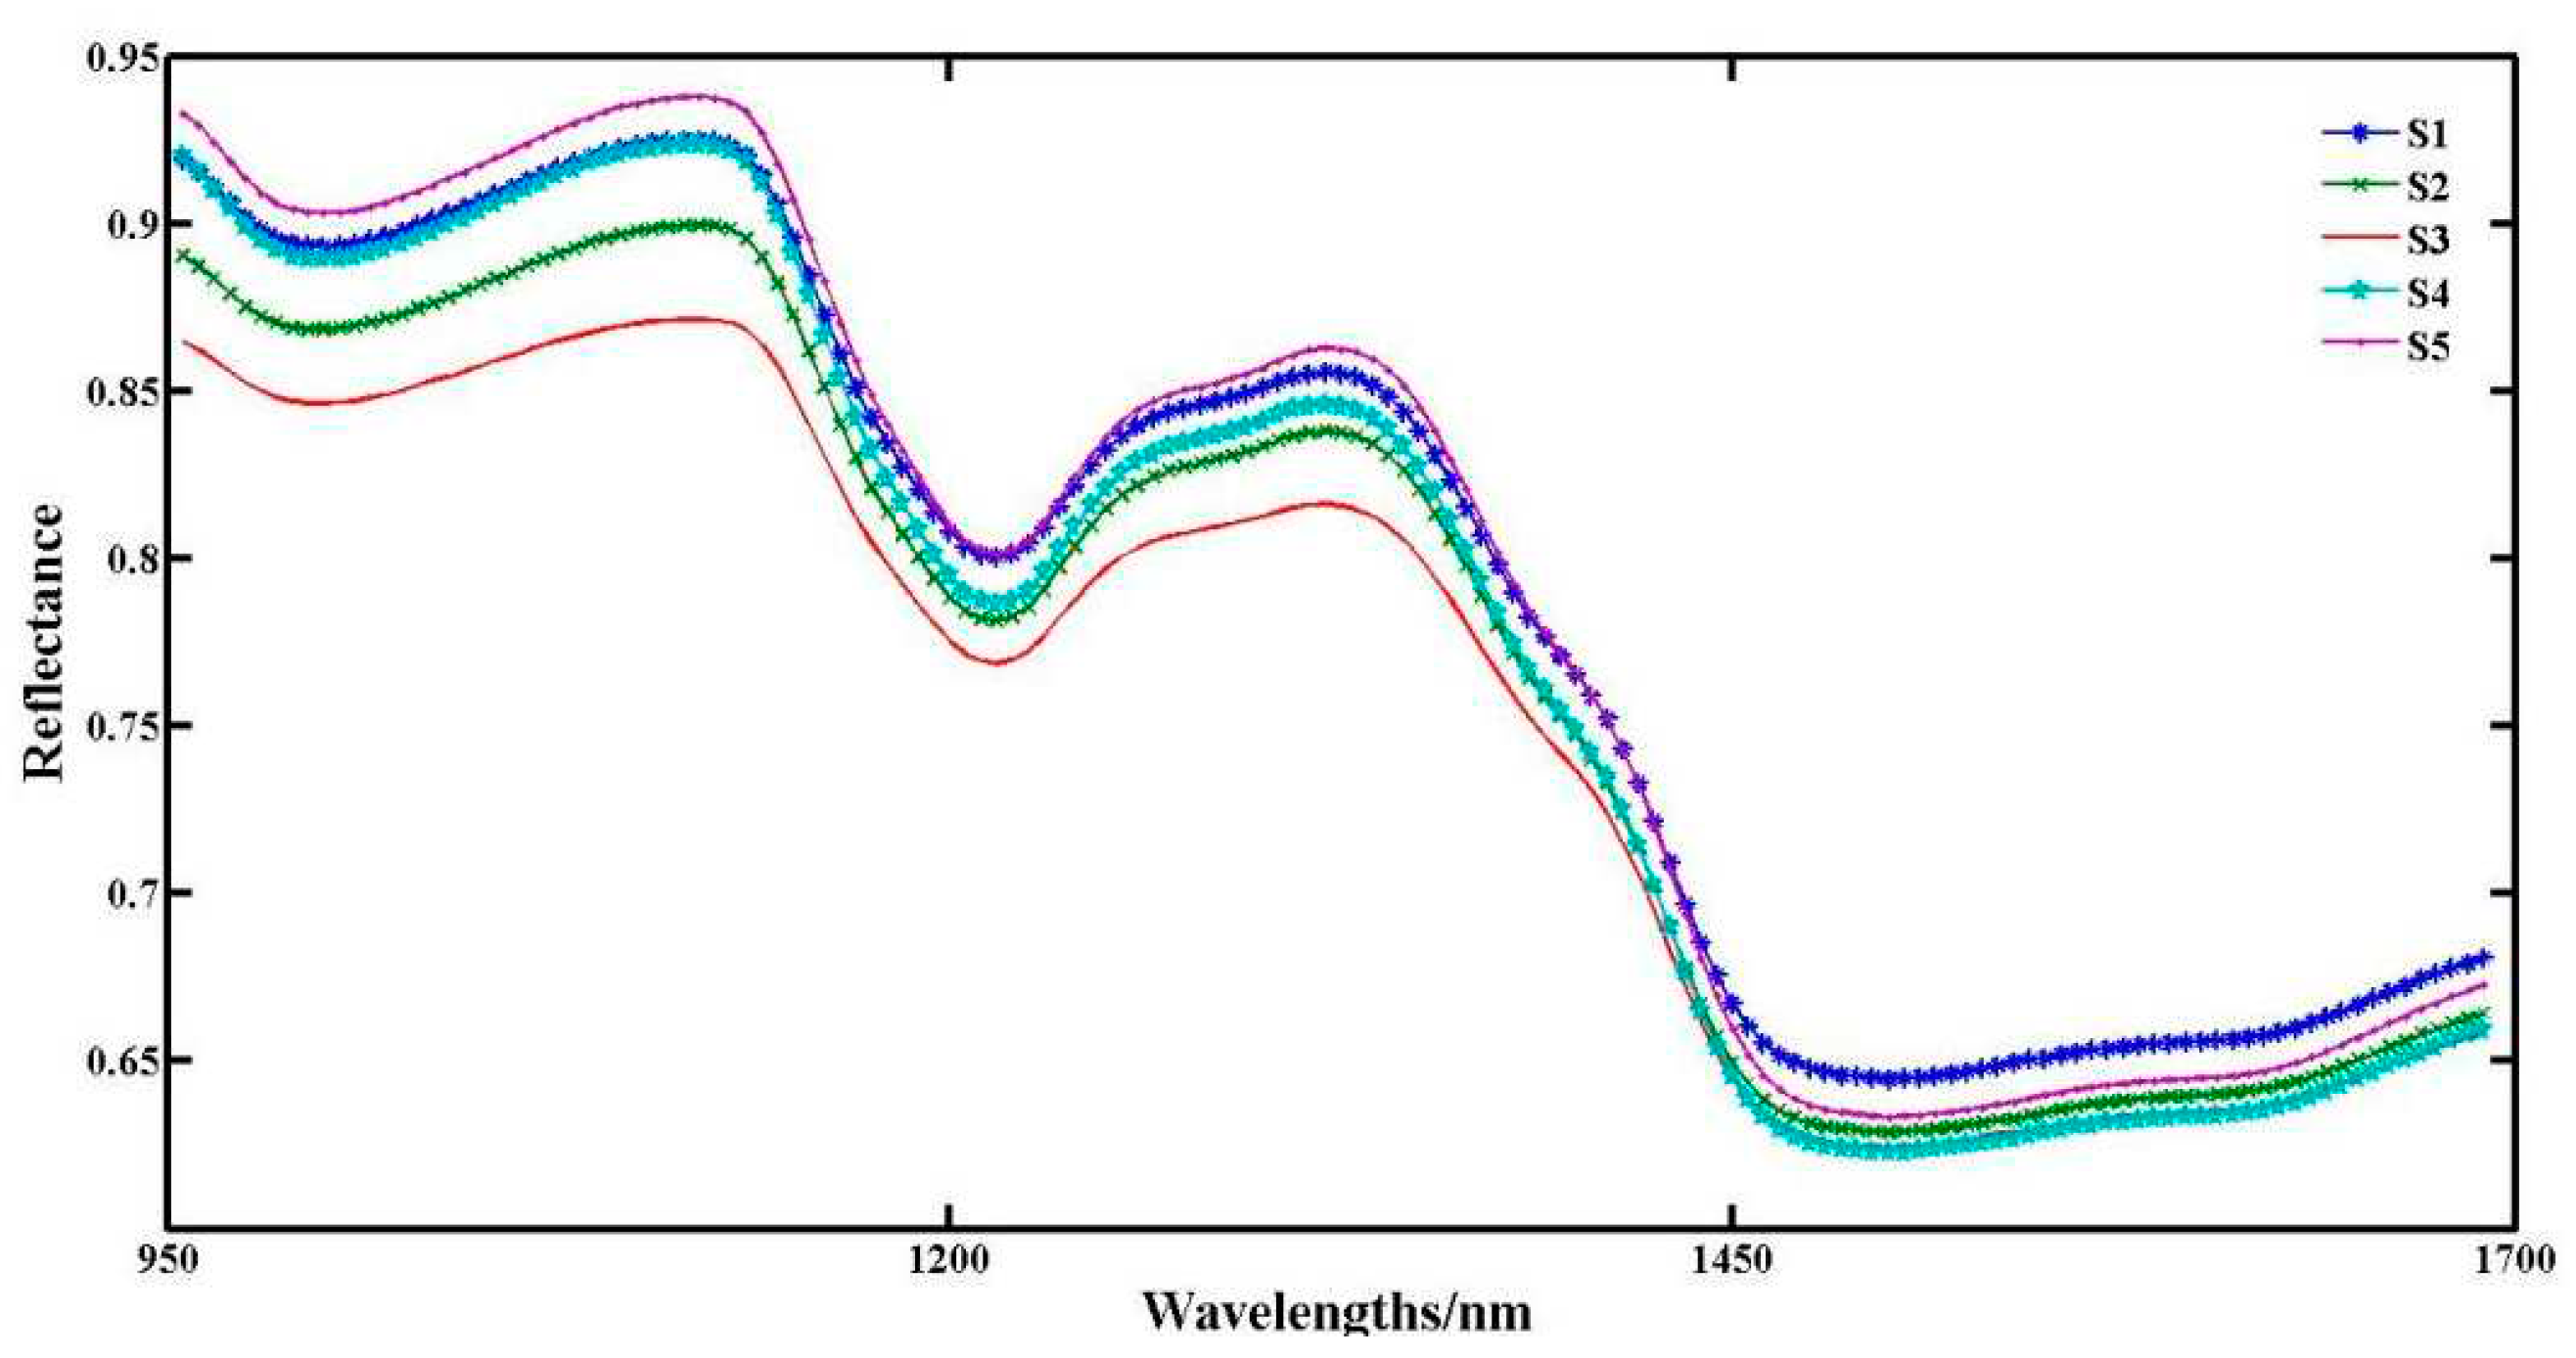
The average spectral curves were plotted by collecting samples under five treatments. The reflection interference at both ends of the graph is strong, and the data stability is poor. The spectral data in the range of 950~1650 nm from each sample is selected as the base spectral data. In this spectral range, the spectral data of the material to be tested contains rich chemical functional group information. The appearance of the valley represents that the sample molecules in the waveband have adsorption effects on the radiation light, and chemical bond vibrations occur. It can be seen from the
Figure 3 that the five curves show basically the same trend. The average spectral curves of different sheep manure application rates show different reflectance values in each waveband. The reflectance in the regions of 950~980 nm, 1100~1250 nm, and 1300~1450 nm shows a decreasing trend. Among them, the reflectance of S3 is overall lower, S2 is higher than S3, S1, and S4 are basically overlapping in the range of 950~1200 nm, and S5 has the highest reflectance. In the range of 1200~1350 nm, the gradient is significant. The reflectance is S3 < S2 < S4 < S1 < S5. After 1450 nm, the curves of the five treatments change smoothly and the gradients are not significant. In this waveband range, the samples' spectral reflectance is greatly affected by the moisture content. According to relevant literature [
13], the range of 950~ 980 nm is the OH combined frequency absorption spectrum band, 1100~1250 nm is the CH double frequency absorption spectrum band, and 1300~1450 nm is the OH combined frequency absorption spectrum band and NH single frequency absorption spectrum band. These absorption peaks can all reflect the content of amylose and amylopectin in the samples.
3.2. PLSR model for key band extraction
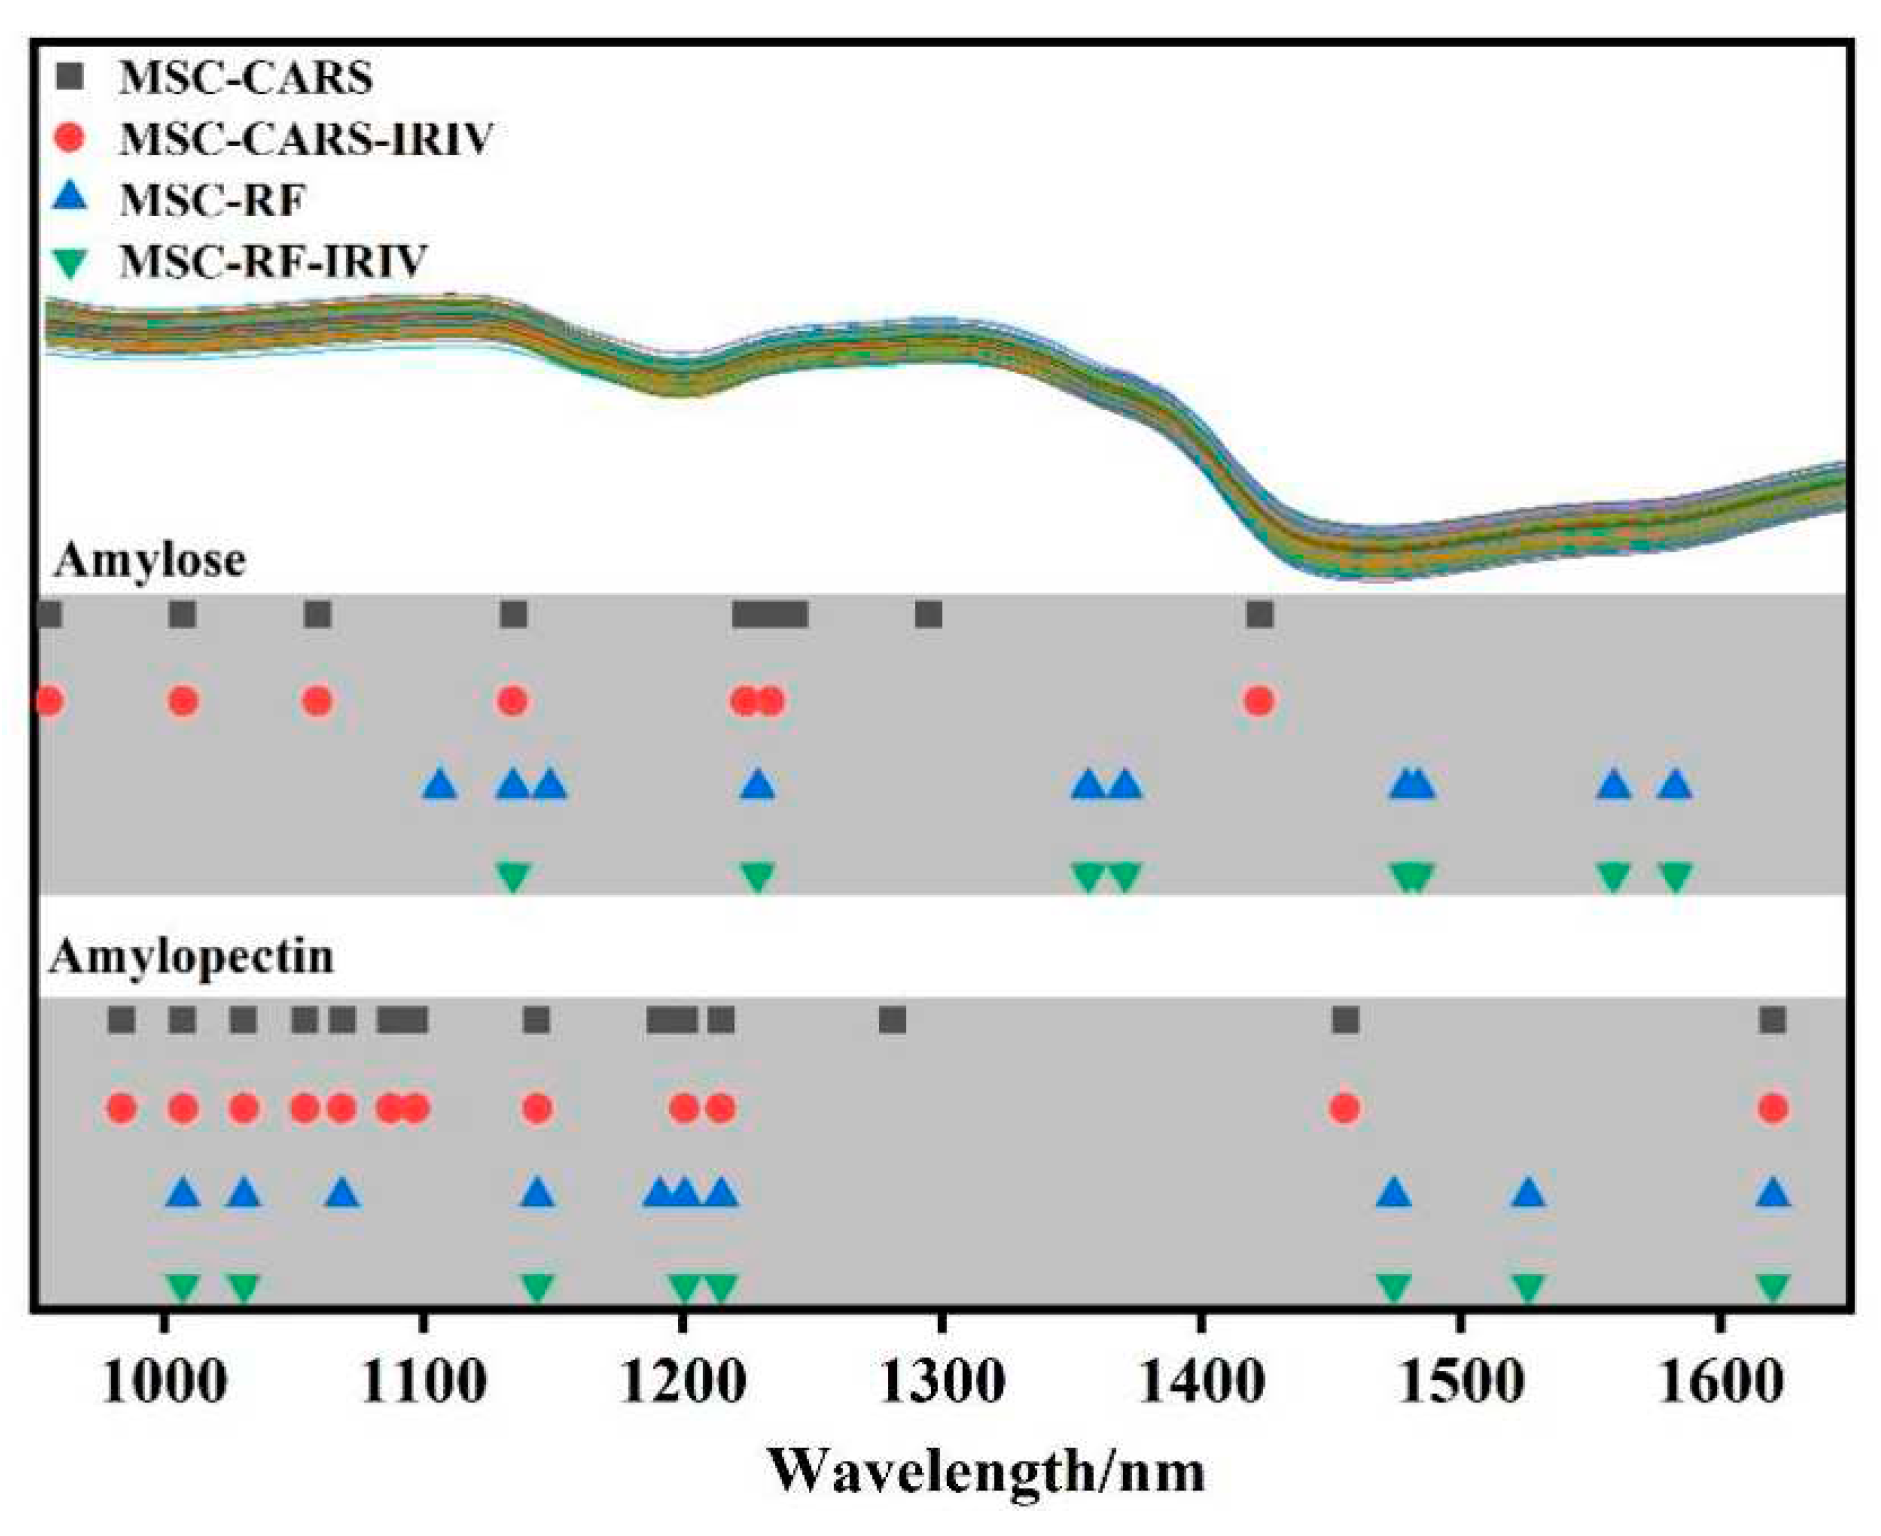
Based on the combined algorithm of key band extraction, the spectral data extraction was carried out using MSC-CARS, MSC-CARS-IRIV, MSC-RF, and MSC-RF-IRIV algorithms, and
Figure 4 shows the extraction results.
From this figure, it can be seen that the selected bands go through the "coarse-to-fine" selection process by the IRIV algorithm, trying to eliminate as many redundant variables as possible and retain less variable information. Among them, the amylose was selected by MSC-CARS-IRIV and MSC-RF-IRIV, respectively, to retain 7 and 8 feature bands, while the amylopectin was selected by MSC-CARS-IRIV and MSC-RF-IRIV, respectively, to retain 12 and 8 key bands. The number of variables was less than the number of variables extracted without the combined algorithm of key band extraction. Under the condition of ensuring the accuracy of the prediction model, this algorithm also simplifies the modeling process. For the extracted key bands, PLSR models were established separately.
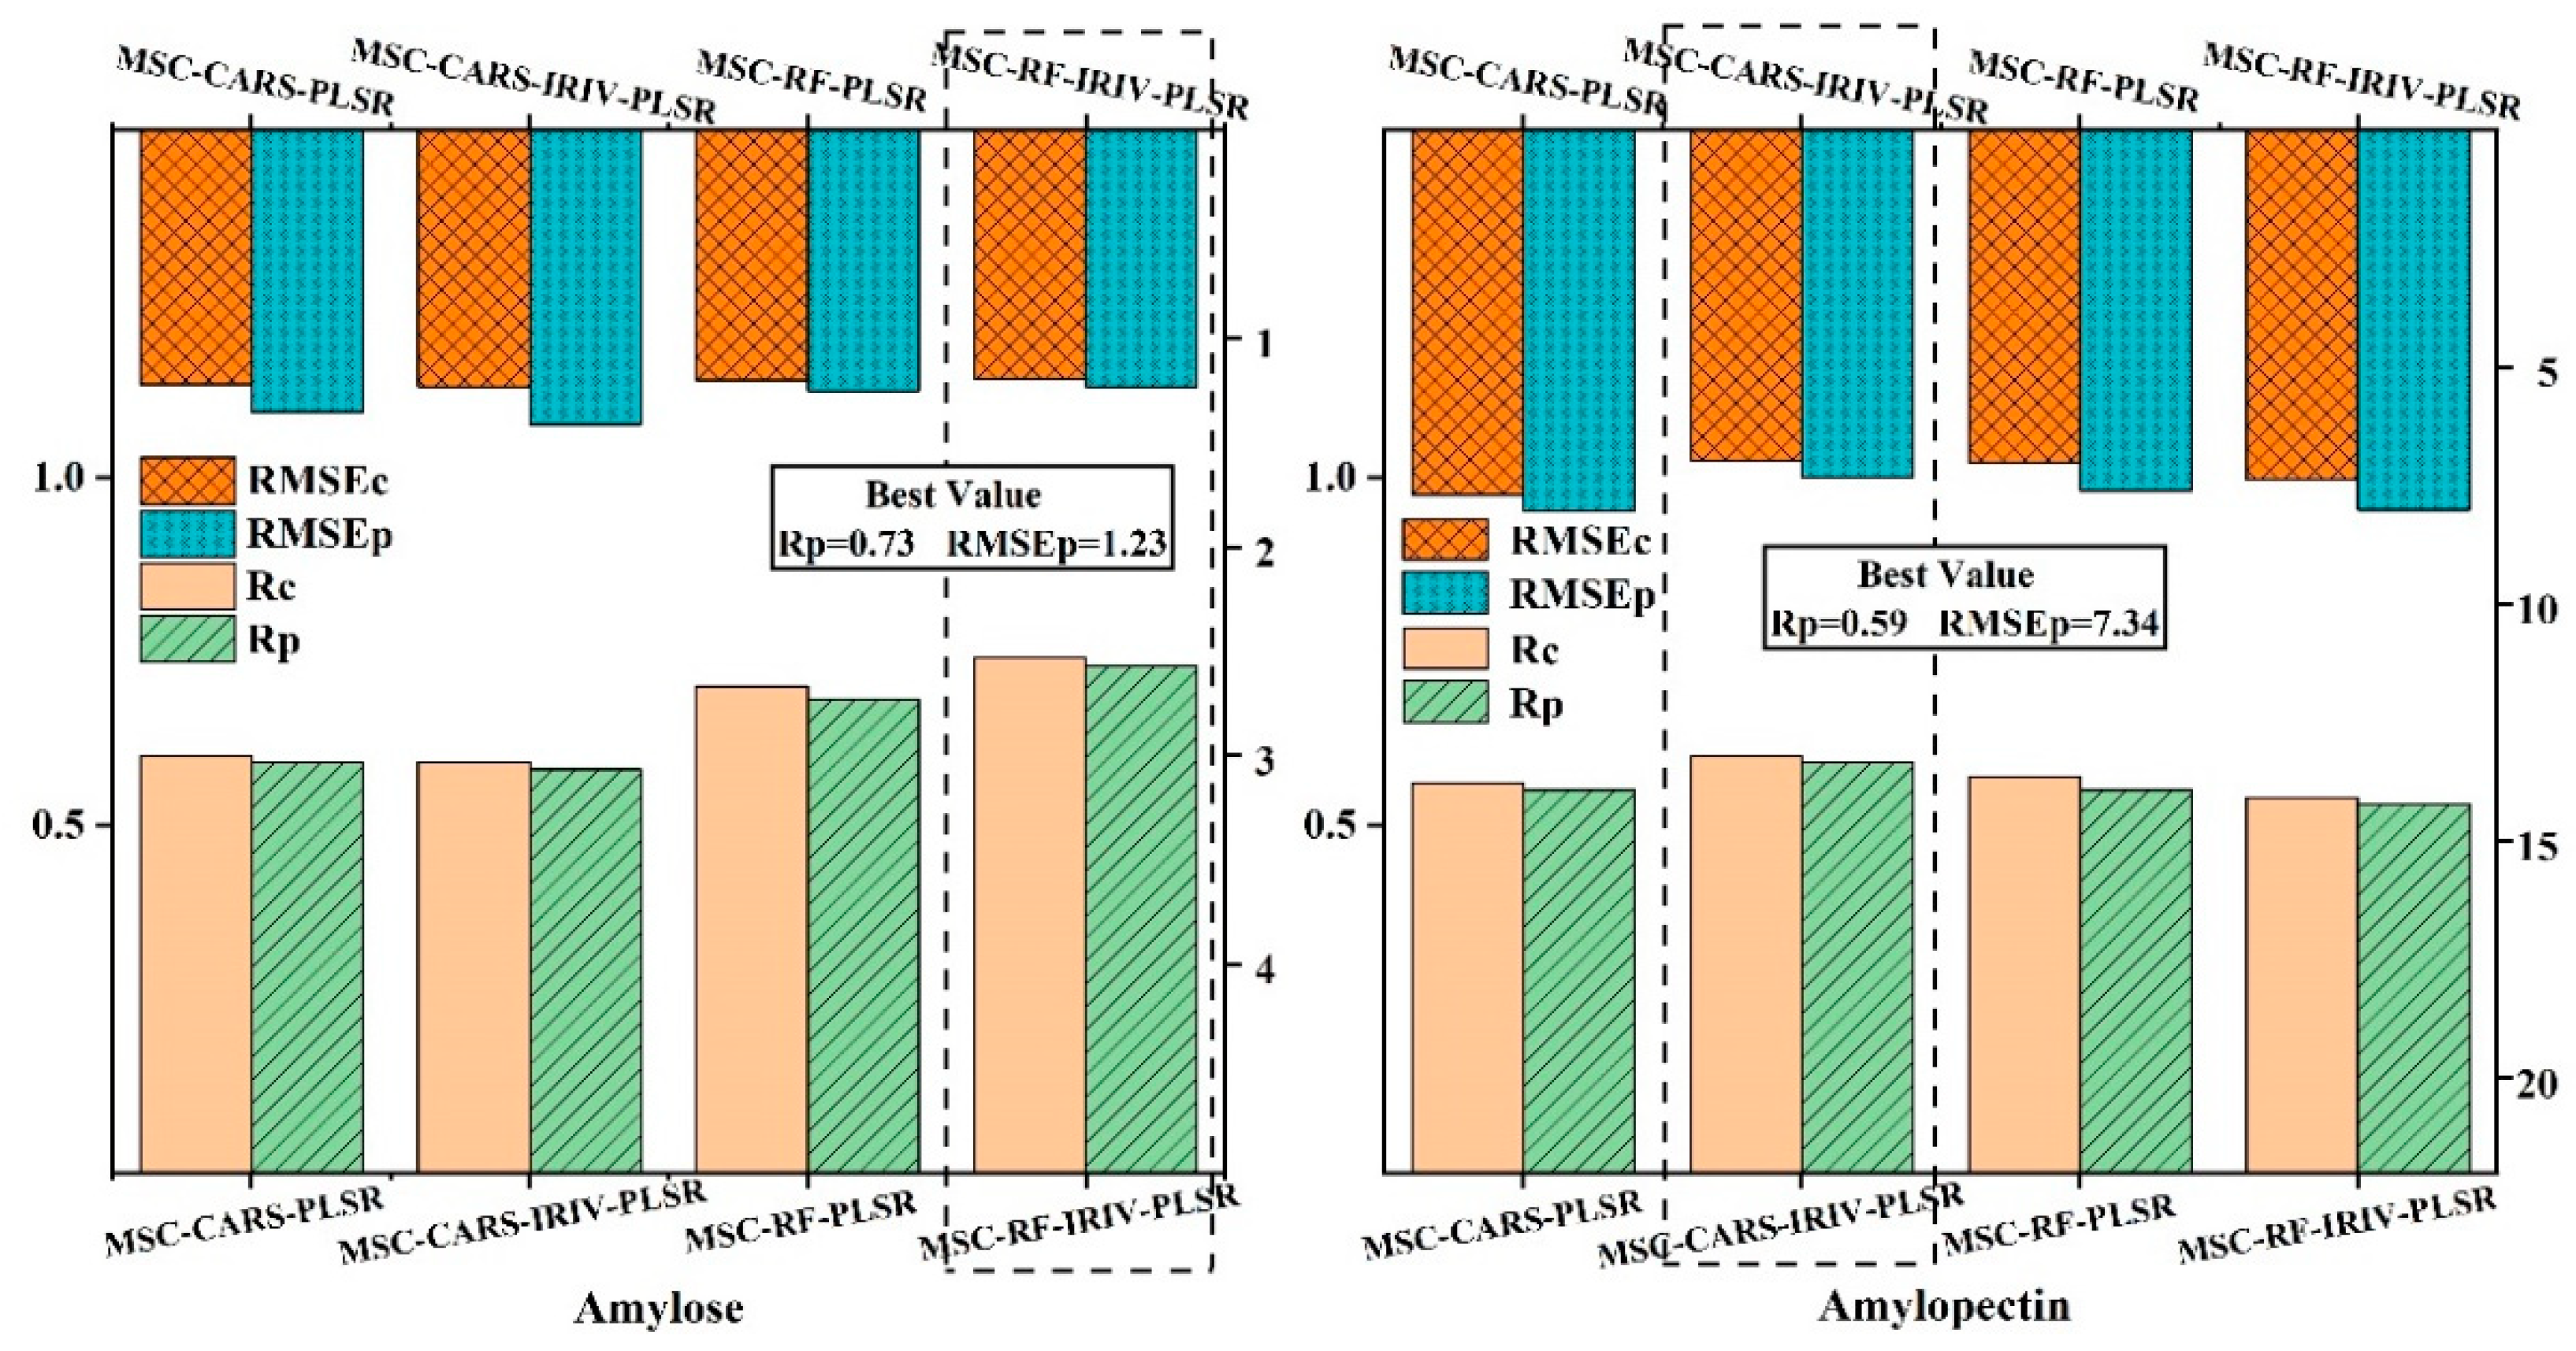
Figure 5 shows the PLSR models established by the combined algorithm of key band extraction.
It can be seen that the PLSR prediction model established after the key band extraction combined algorithm was slightly better than the PLSR model established by the key band extraction. The overall prediction effect of amylose was better than that of amylopectin. Among them, the prediction model MSC-RF-IRIV-PLSR for amylose has a better prediction effect, with a predicted Rp value of 0.73 and an RMSEp value of 1.23. The prediction model MSC-CARS-IRIV-PLSR for amylopectin has a better prediction effect, with a predicted Rp value of 0.59 and an RMSEp value of 7.34. The regression equation for amylose is shown in Equation 6, and the regression equation for amylopectin is shown in Equation 7. In the following, the regression equations will be used to visualize the changes in the content of amylose and amylopectin in foxtail millet flour under different sheep manure application rates.
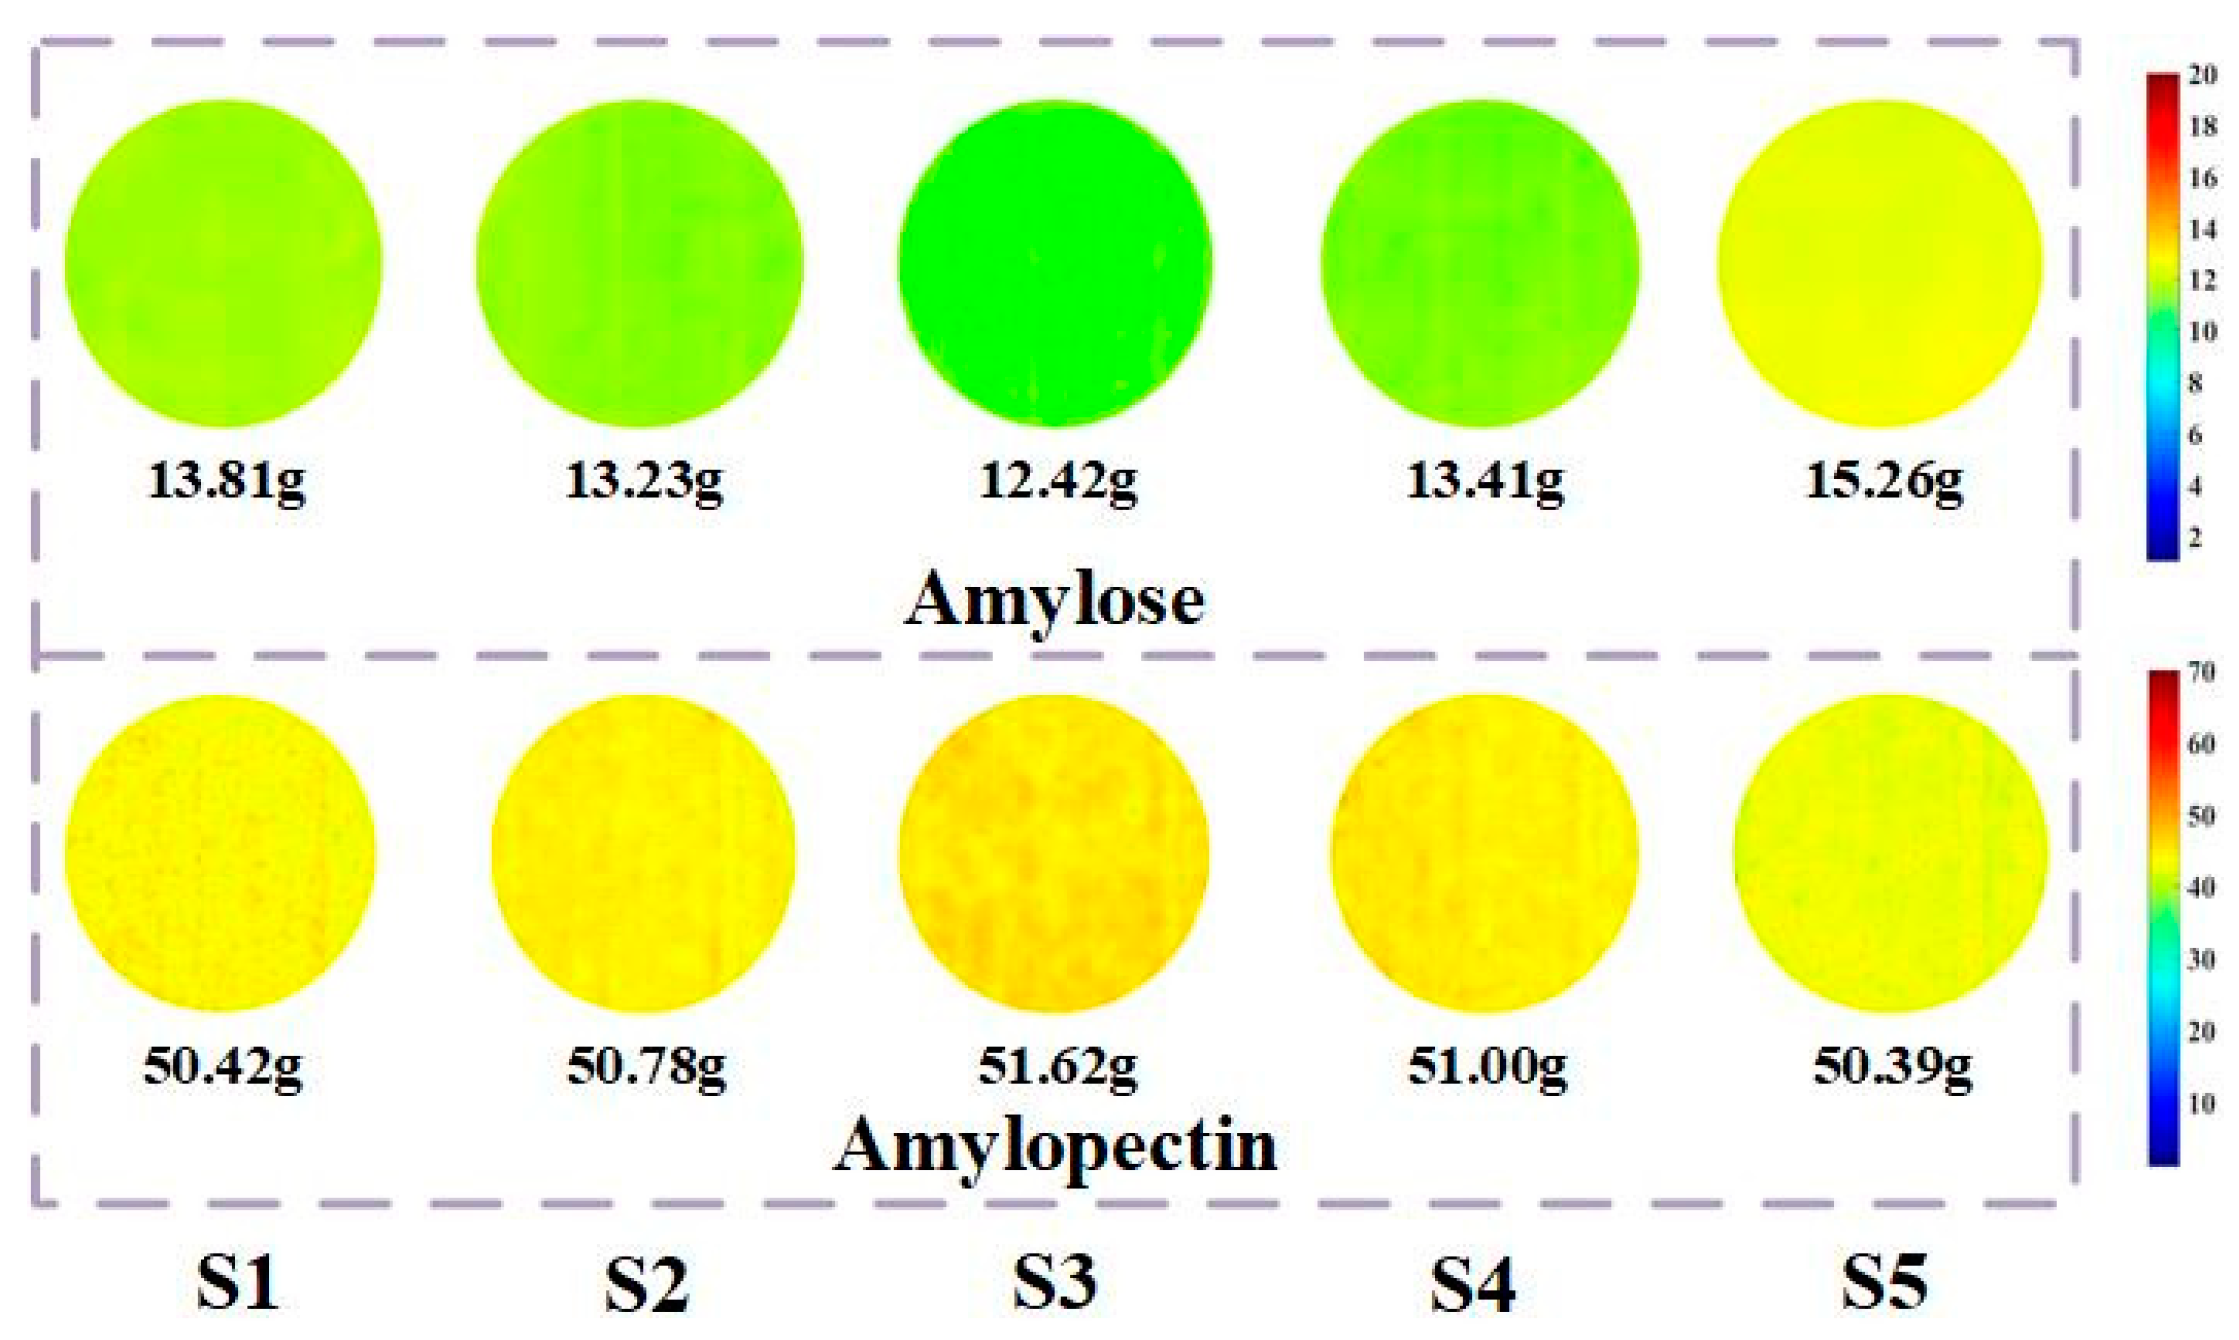
3.3. Visualization of amylose and amylopectin content in foxtail millet flour
Using the regression equations, the visualization of the changes in the content of amylose and amylopectin in foxtail millet flour was expressed.
Figure 6 shows the visualization images of the content of amylose and amylopectin in foxtail millet flour under different sheep manure application rates. Overall, it can be seen from the figure that the visualization of the content of amylose shows a gradual change among the treatments, while the visualization of the content of amylopectin was slightly higher only in the S3. Among them, the S3 has the lowest content of amylose and the highest content of amylopectin, while the S5 has the highest content of amylose and the lowest content of amylopectin.
4. Discussion
In the past, scholars generally used hyperspectral imaging for the classification of foxtail millet varieties and the detection of nutritional components [
40,
41,
42]. This study combined hyperspectral imaging with chemometrics to set different rates of sheep manure application and collected 358 samples of foxtail millet flour for the detection of amylose and amylopectin content. The best model for amylose was MSC-RF-IRIV-PLSR, among which the spectral bands of 1134 nm, 1228 nm are in the CH secondary harmonic absorption spectrum, 1355 nm, 1370 nm are in the combined frequency absorption spectrum, and 1478 nm, 1483 nm, 1558 nm, 1582 nm are in the NH primary harmonic absorption spectrum; The best model for amylopectin was MSC-CARS-IRIV-PLSR, among which the spectral band of 983 nm is in the free OH secondary harmonic absorption spectrum, 1007 nm, 1030 nm, 1054 nm, 1068 nm, 1087 nm, 1096 nm are in the combined OH secondary harmonic absorption spectrum, 1143 nm, 1200 nm, 1214 nm are in the CH secondary harmonic absorption spectrum, 1454 nm is in the combined frequency spectrum, and 1619 nm is in the NH primary harmonic absorption spectrum [
43]. These selected key bands were all on the chemical groups related to amylose and amylopectin content. The key band extraction combined algorithm eliminates redundant bands and reduces data dimensions while retaining as much spectral information of amylose and amylopectin as possible.
According to the visualization results, the accumulation of amylose and amylopectin in foxtail millet flour under different sheep manure application rates is shown. The reason for this situation was that the selected experimental variety has good adaptability and amylopectin is the main nutritional component in foxtail millet, with differences in content depending on the stable expression of genes. Therefore, the visualization shown in the
Figure 6 also confirms the good stress resistance of the experimental samples. Combined with the detection results of the content of amylose and amylopectin in foxtail millet flour shown in
Figure 2, it can be concluded that under the optimal sheep manure application rate, the content of amylose in foxtail millet is relatively low, and the amylopectin is high, which can be visually reflected by the visualization expression.
5. Conclusion
This study focuses on foxtail millet flour under different sheep manure application rates and uses hyperspectral technology combined with chemometric methods to predict and visualize the content of amylose and amylopectin in foxtail millet flour. By preprocessing the spectral data using MSC and key band extraction combined algorithm for key band extraction based on sample spectral data to establish PLSR models, the optimal algorithms for extracting key bands from spectral data of amylose and amylopectin were determined to be MSC-RF-IRIV-PLSR and MSC-CARS-IRIV-PLSR, respectively. The predicted Rp values were 0.73 and 0.59, and the RMSEp values were 1.23 and 7.34, respectively. According to the regression equations of the models, visualization expressions were carried out. The results show that the content of amylose changes significantly under the effect of different sheep manure application rates, while the content of amylopectin was best expressed in the S3.
In conclusion, this data analysis method can be used for multidimensional reduction and visualization expression of component content. The research conclusions can provide theoretical support for the hyperspectral simultaneous and rapid detection of nutritional components in foxtail millet flour.
Author Contributions
Conceptualization, G.W.; Methodology, G.W., A.Z., H.D, and H.X.; Investigation, E.G., X.C.; Writing - original draft, G.W., H.X., and X.C.; Writing - review and editing, G.W. and A.Z.. All authors have read and agreed to the published version of the manuscript.
Funding
This work was supported by Construction Project of National Modern Agricultural Industry Technology System, grant number CARS-06-14.5-A21; Central Government Guides Local Funds for Scientific and Technological Development, grant number YDZJSX20231A042; Construction Project of Shanxi Province Modern Agricultural Industry Technology System for Millet, grant number 2023CYJSTX04-04; Major Projects of Shanxi Province Key R&D, grant number 2022ZDYF119.
Acknowledgments
The content of the amylose and amylopectin content were determined in the the Millet Research Institute, Shanxi Agricultural University. We thank to Professor K.C.'s team for providing the experimental instruments and reagents.
Conflicts of Interest
The authors declare no conflict of interests. The funders have no role in the experimental design, data collection and analysis, decision to publish, or preparation of the manuscript.
References
- Liu T, Yang X G, Batchelor W D; et al. A case study of climate-smart management in foxtail millet (Setaria italica) production under future climate change in Lishu county of Jilin, China[J]. AGR FOREST METEOROL 2020, 292, 108131. [Google Scholar] [CrossRef]
- Kumar R R, Singh N, Singh S; et al. Nutritional supremacy of pearl- and foxtail millets: assessing the nutrient density, protein stability and shelf-life of flours in millets and cereals for developing nutri-stable foods[J]. J PLANT BIOCHEM BIOT 2022, 31, 837–852. [Google Scholar] [CrossRef]
- Mahajan P, Bera MB, Panesar PS; et al. Millet starch: A review. INT J BIOL MACROMOL 2021, 180, 61–79. [Google Scholar] [CrossRef] [PubMed]
- Kaimal A M, Mujumdar A S, Thorat B N. Resistant starch from millets: Recent developments and applications in food industries[J]. TRENDS FOOD SCI TECH 2021, 111, 563–580. [Google Scholar] [CrossRef]
- Lv P, Liu J L, Wang Q; et al. Influence of accelerating storage of foxtail millet on the edible and cooking quality of its porridge: An insight into the structural alteration of the in-situ protein and starch and physicochemical properties[J]. INT J BIOL MACROMOL 2023, 240, 124375. [Google Scholar] [CrossRef]
- Xing B, Yang X S, Zou L; et al. Starch chain-length distributions determine cooked foxtail millet texture and starch physicochemical properties[J]. CARBOHYD POLYM 2023, 320. [Google Scholar] [CrossRef]
- Annor G A, Marcone M, Bertoft E; et al. Physical and molecular characterization of millet starches[J]. CEREAL CHEM 2014, 91, 286–292. [Google Scholar] [CrossRef]
- Aprodu I, Banu I. Impact of brown foxtail millet (Setaria italica) flour on thermo-mechanical properties of flours from different rice varieties[J]. INT J FOOD SCI TECH 2021, 56, 3227–3234. [Google Scholar] [CrossRef]
- Li K H, Zhang T Z, Sui Z Q; et al. Genetic variation in starch physicochemical properties of Chinese foxtail millet (Setaria italica Beauv.)[J]. INT J BIOL MACROMOL 2019, 133, 337–345. [Google Scholar] [CrossRef]
- Abedin M J, Abdullah A M, Satter M A; et al. Physical, functional, nutritional and antioxidant properties of foxtail millet in Bangladesh[J]. HELIYON 2022, 8, e11186. [Google Scholar] [CrossRef]
- Verma S, Srivastava S, Tiwari N. Comparative study on nutritional and sensory quality of barnyard and foxtail millet food products with traditional rice products[J]. J FOOD SCI TECH MYS 2015, 52, 5147–5155. [Google Scholar] [CrossRef]
- Wu D, Sun D W. Advanced applications of hyperspectral imaging technology for food quality and safety analysis and assessment: A review — Part II: Applications[J]. INNOV FOOD SCI EMERG 2013, 19, 15–28. [Google Scholar] [CrossRef]
- Xia Y, Xu Y F, Li J B; et al. Recent advances in emerging techniques for non-destructive detection of seed viability: A review[J]. AIIA 2019, 5, 35–47. [Google Scholar] [CrossRef]
- Saha D, Manickavasagan A. Machine learning techniques for analysis of hyperspectral images to determine quality of food products: A review[J]. CRFS 2021, 4, 28–44. [Google Scholar] [CrossRef]
- Pu H B, Lin L, Sun D W. Principles of hyperspectral microscope imaging techniques and their applications in food quality and safety detection: A review[J]. COMPR REV FOOD SCI F 2019, 18, 853–866. [Google Scholar] [CrossRef] [PubMed]
- Tsai F, Lin E-K, Yoshino K. Spectrally segmented principal component analysis of hyperspectral imagery for mapping invasive plant species[J]. INT J REMOTE SENS 2007, 28, 1023–1039. [Google Scholar] [CrossRef]
- Zou X B, Zhou J W, Holmes M; et al. Independent component analysis in information extraction from visible/near-infrared hyperspectral imaging data of cucumber leaves[J]. CHEMOMETR INTELL LAB 2010, 104, 265–270. [Google Scholar] [CrossRef]
- Bonah E, Huang X, Aheto J H; et al. Application of hyperspectral imaging as a nondestructive technique for foodborne pathogen detection and characterization[J]. FOODBORNE PATHOG DIS 2019, 16, 712–722. [Google Scholar] [CrossRef] [PubMed]
- Huang M, He C J, Zhu Q B; et al. Maize seed variety classification using the integration of spectral and image features combined with feature transformation based on hyperspectral imaging[J]. APPLIED SCIENCES 2016, 6, 183–186. [Google Scholar] [CrossRef]
- Kong W W, Zhang C, Liu F; et al. Rice seed cultivar identification using Near-Infrared hyperspectral imaging and multivariate data analysis[J]. SENSORS-BASEL 2013, 13, 8916–8927. [Google Scholar] [CrossRef]
- Gao J F, Li X L, Zhu F L; et al. Application of hyperspectral imaging technology to discriminate different geographical origins of Jatropha curcas L.seeds[J]. COMPUT ELECTRON AGR 2013, 99, 186–193. [Google Scholar] [CrossRef]
- Wang M, Ellsworth P Z, Zhou J F; et al. Evaluation of water-use efficiency in foxtail millet (Setaria italica) using visible-near infrared and thermal spectral sensing techniques[J]. TALANTA 2016, 152, 531–539. [Google Scholar] [CrossRef] [PubMed]
- Behmann J, Mahlein A K, Rumpf T; et al. A review of advanced machine learning methods for the detection of biotic stress in precision crop protection[J]. PRECIS AGRIC 2014, 16, 239–260. [Google Scholar] [CrossRef]
- Zhao X, Wang W, Ni X Z; et al. Utilising near-infrared hyperspectral imaging to detect low-level peanut powder contamination of whole wheat flour[J]. BIOSYST ENG 2019, 184, 55–68. [Google Scholar] [CrossRef]
- Yang H, Wang C, Zhang H; et al. Recognition of maize seed varieties based on hyperspectral imaging technology and integrated learning algorithms[J]. PEERJ COMPUT SCI 2023, 9, e1354. [Google Scholar] [CrossRef] [PubMed]
- Yu H D, Qing L W, Yan D T; et al. Hyperspectral imaging in combination with data fusion for rapid evaluation of tilapia fillet freshness[J]. FOOD CHEM 2021, 348, 129129. [Google Scholar] [CrossRef]
- Wang X, Li Z, Zheng D; et al. Nondestructive identification of millet varieties using hyperspectral imaging technology[J]. J APPL SPECTROSC+ 2020, 87, 54–61. [Google Scholar] [CrossRef]
- Wang J P, Li Y, Tian Y Q; et al. A novel triple-wavelength colorimetric method for measuring amylose and amylopectin contents[J]. STARCH-STARKE 2010, 62, 508–516. [Google Scholar] [CrossRef]
- Chen J, Ren X, Zhang Q; et al. Determination of protein, total carbohydrates and crude fat contents of foxtail millet using effective wavelengths in NIR spectroscopy[J]. J CEREAL SCI 2013, 58, 241–247. [Google Scholar] [CrossRef]
- Wang D M, Ji J M, Gao H Z. The effect of MSC spectral pretreatment regions on near infrared spectroscopy calibration results[J]. SPECTROSC SPECT ANAL 2014, 34, 2387–2390. [Google Scholar] [CrossRef]
- Wang G L, Yu K Q, Cheng K; et al. Hyperspectral Technique Coupled With Chemometrics Methods for Predicting Alkali Spreading Value of Millet Flour[J]. SPECTROSC SPECT ANAL 2021, 41, 3189–3193. [Google Scholar] [CrossRef]
- Thennadil S N, Martens H, Kohler A. Physics-based multiplicative scatter correction approaches for improving the performance of calibration models[J]. APPL SPECTROSC 2006, 60, 315–321. [Google Scholar] [CrossRef] [PubMed]
- Martin G, Francisco J. Optical path length and wavelength selection using Vis/NIR spectroscopy for olive oil's free acidity determination[J]. INT J FOOD SCI TECH 2015, 50, 1461–1467. [Google Scholar] [CrossRef]
- Yun Y H, Bin J, Liu D L; et al. A hybrid variable selection strategy based on continuous shrinkage of variable space in multivariate calibration[J]. ANAL CHIM ACTA 2019, 1058, 58–69. [Google Scholar] [CrossRef] [PubMed]
- Xie S G, Ding F J, Chen S G; et al. Prediction of soil organic matter content based on characteristic band selection method[J]. SPECTROCHIM ACTA A 2022, 273, 120949. [Google Scholar] [CrossRef]
- Mao Y L, Li H, Wang Y; et al. Prediction of tea polyphenols, free amino acids and caffeine content in tea leaves during wilting and fermentation using hyperspectral imaging[J]. FOODS 2022, 11, 2537. [Google Scholar] [CrossRef]
- Wang Q Q, Liu Y H, Gao X W; et al. Potential of hyperspectral imaging for nondestructive determination of chlorogenic acid content in Flos Lonicerae[J]. J FOOD MEAS CHARACT 2019, 13, 2603–2612. [Google Scholar] [CrossRef]
- He J, Zhang C, He Y. Application of Near-Infrared hyperspectral imaging to detect sulfur dioxide residual in the fritillaria thunbergii bulbus treated by sulfur fumigation[J]. APPLIED SCIENCES 2017, 7, 77–87. [Google Scholar] [CrossRef]
- Li G Y, Gao X H, Xiao N W; et al. Estimation of soil organic matter content based on characteristic variable selection and regression methods[J]. ACTA OPT SIN 2019, 39, 361–371. [Google Scholar] [CrossRef]
- Zhang F, Cui X H, Zhang C C; et al. Rapid non-destructive identification of selenium-enriched millet based on hyperspectral imaging technology[J]. CZECH J FOOD SCI 2022, 40, 445–455. [Google Scholar] [CrossRef]
- Ji H Y, Ren Z Q, Rao Z H. Discriminant analysis of millet from different origins based on hyperspectral imaging technology[J]. SPECTROSC SPECT ANAL 2019, 39, 2271–2277. [Google Scholar] [CrossRef]
- Zhang J, Guo Z, Ren Z S; et al. Rapid determination of protein, starch and moisture content in wheat flour by near-infrared hyperspectral imaging[J]. J FOOD COMPOS ANAL 2023, 117, 105134. [Google Scholar] [CrossRef]
- Wang F X, Wang C G, Song S Y. Origin identification of foxtail millet (Setaria italica) by using green spectral imaging coupled with chemometrics[J]. INFRARED PHYS TECHN 2022, 123, 104179. [Google Scholar] [CrossRef]
|
Disclaimer/Publisher’s Note: The statements, opinions and data contained in all publications are solely those of the individual author(s) and contributor(s) and not of MDPI and/or the editor(s). MDPI and/or the editor(s) disclaim responsibility for any injury to people or property resulting from any ideas, methods, instructions or products referred to in the content. |
© 2023 by the authors. Licensee MDPI, Basel, Switzerland. This article is an open access article distributed under the terms and conditions of the Creative Commons Attribution (CC BY) license (http://creativecommons.org/licenses/by/4.0/).
