Submitted:
08 December 2023
Posted:
08 December 2023
You are already at the latest version
Abstract
Keywords:
1. Introduction
2. Materials and Methods
3. Results
3.1. Material Characterization
4. Conclusions
- 1)
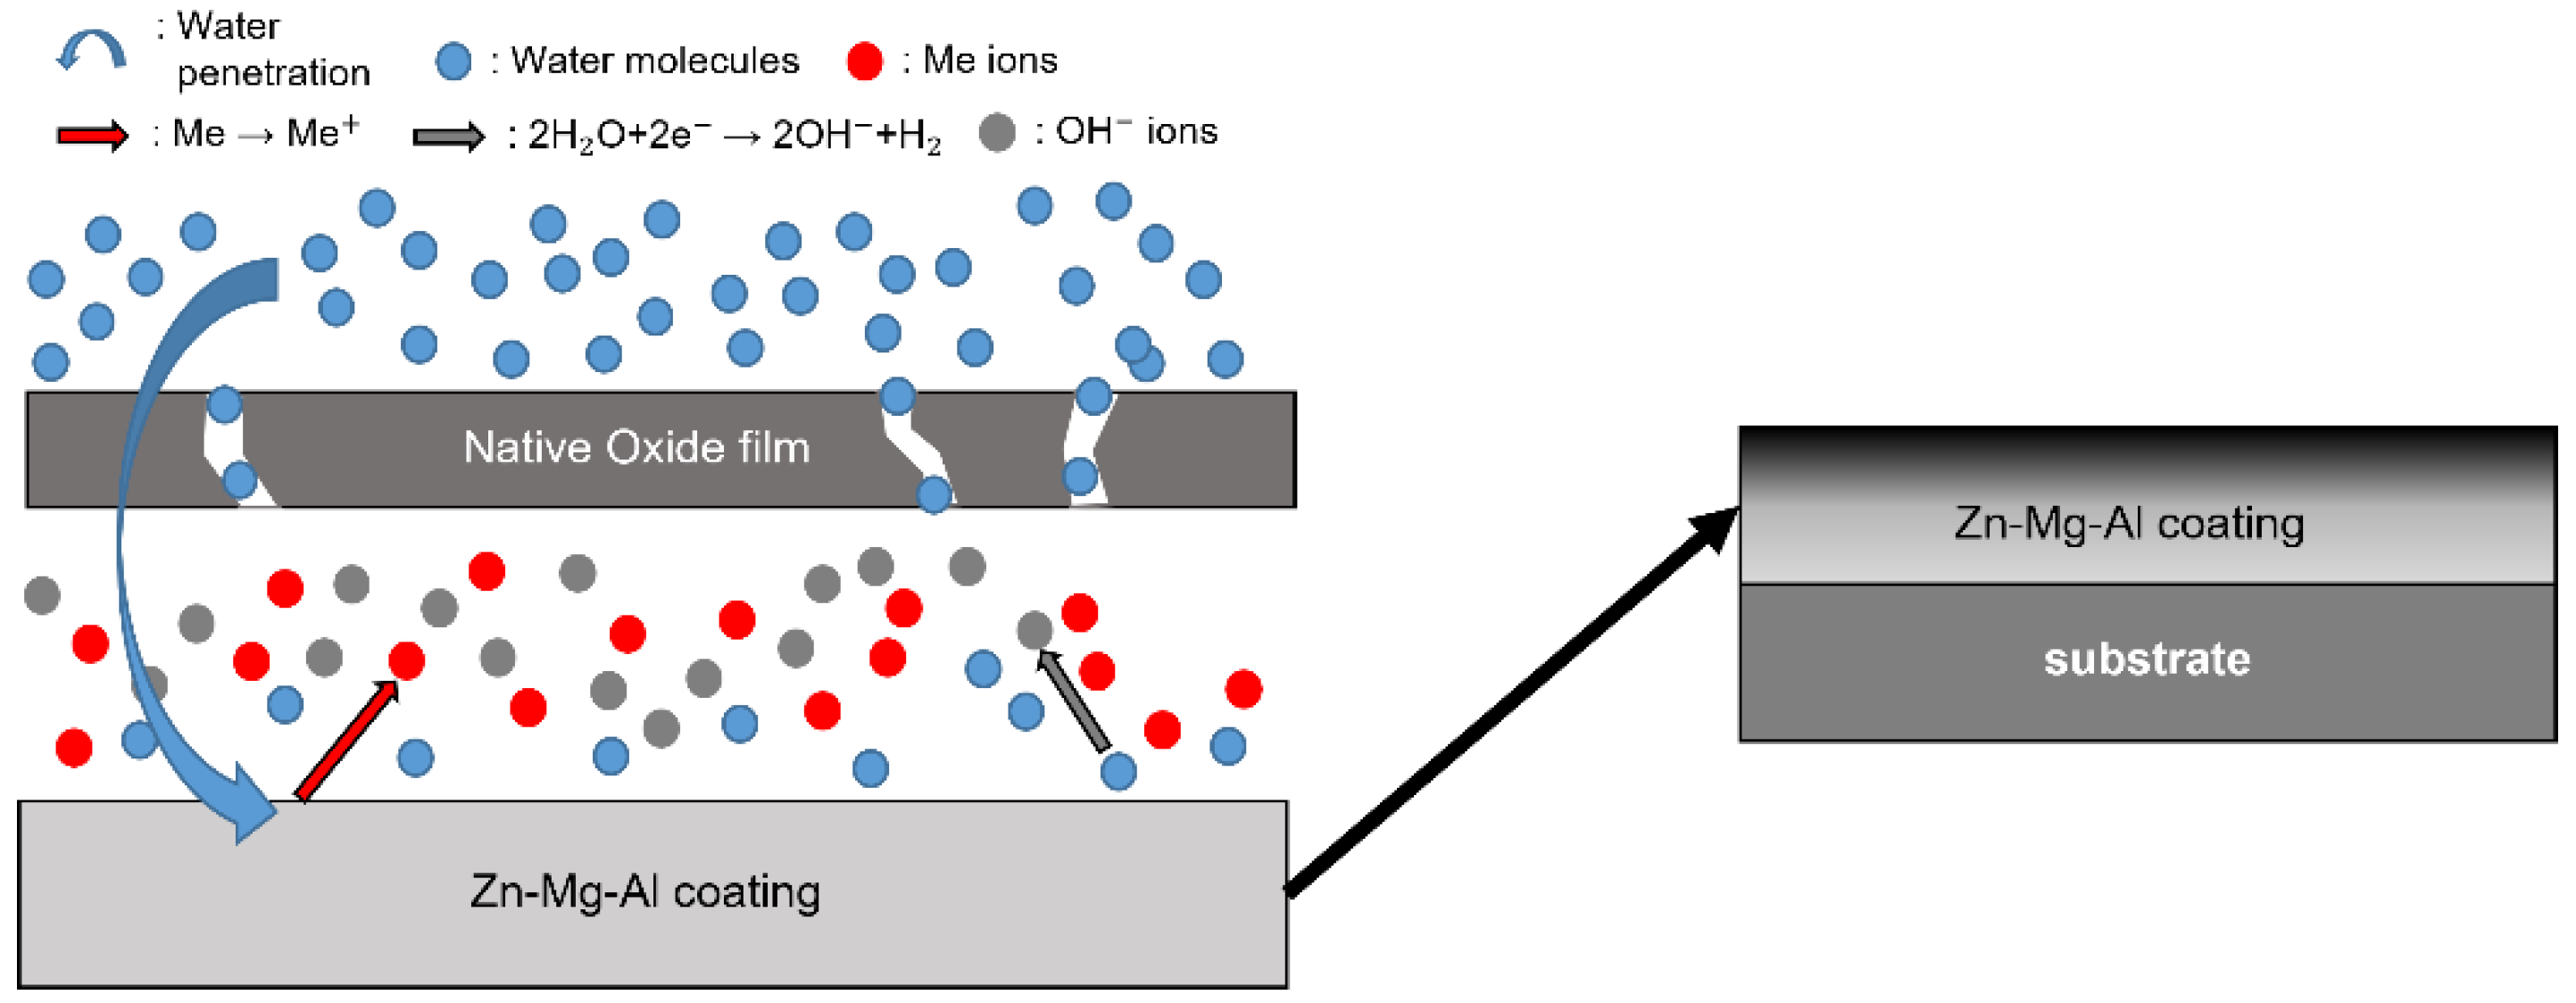
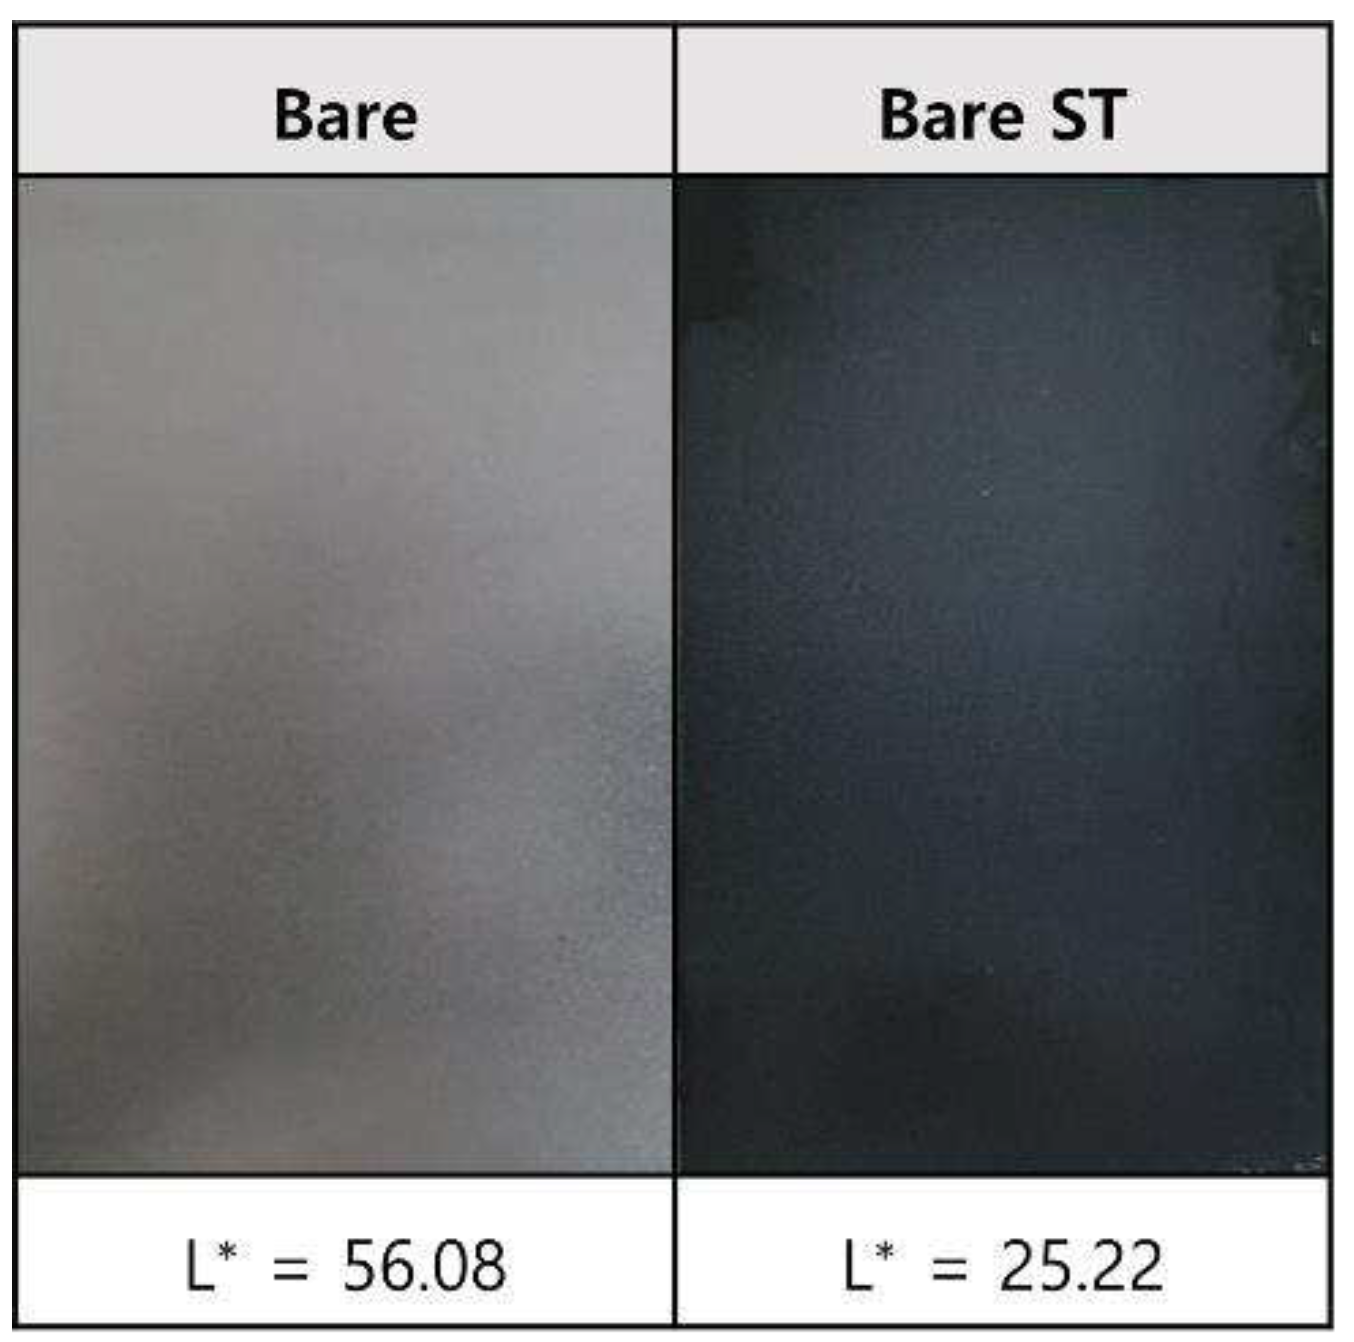
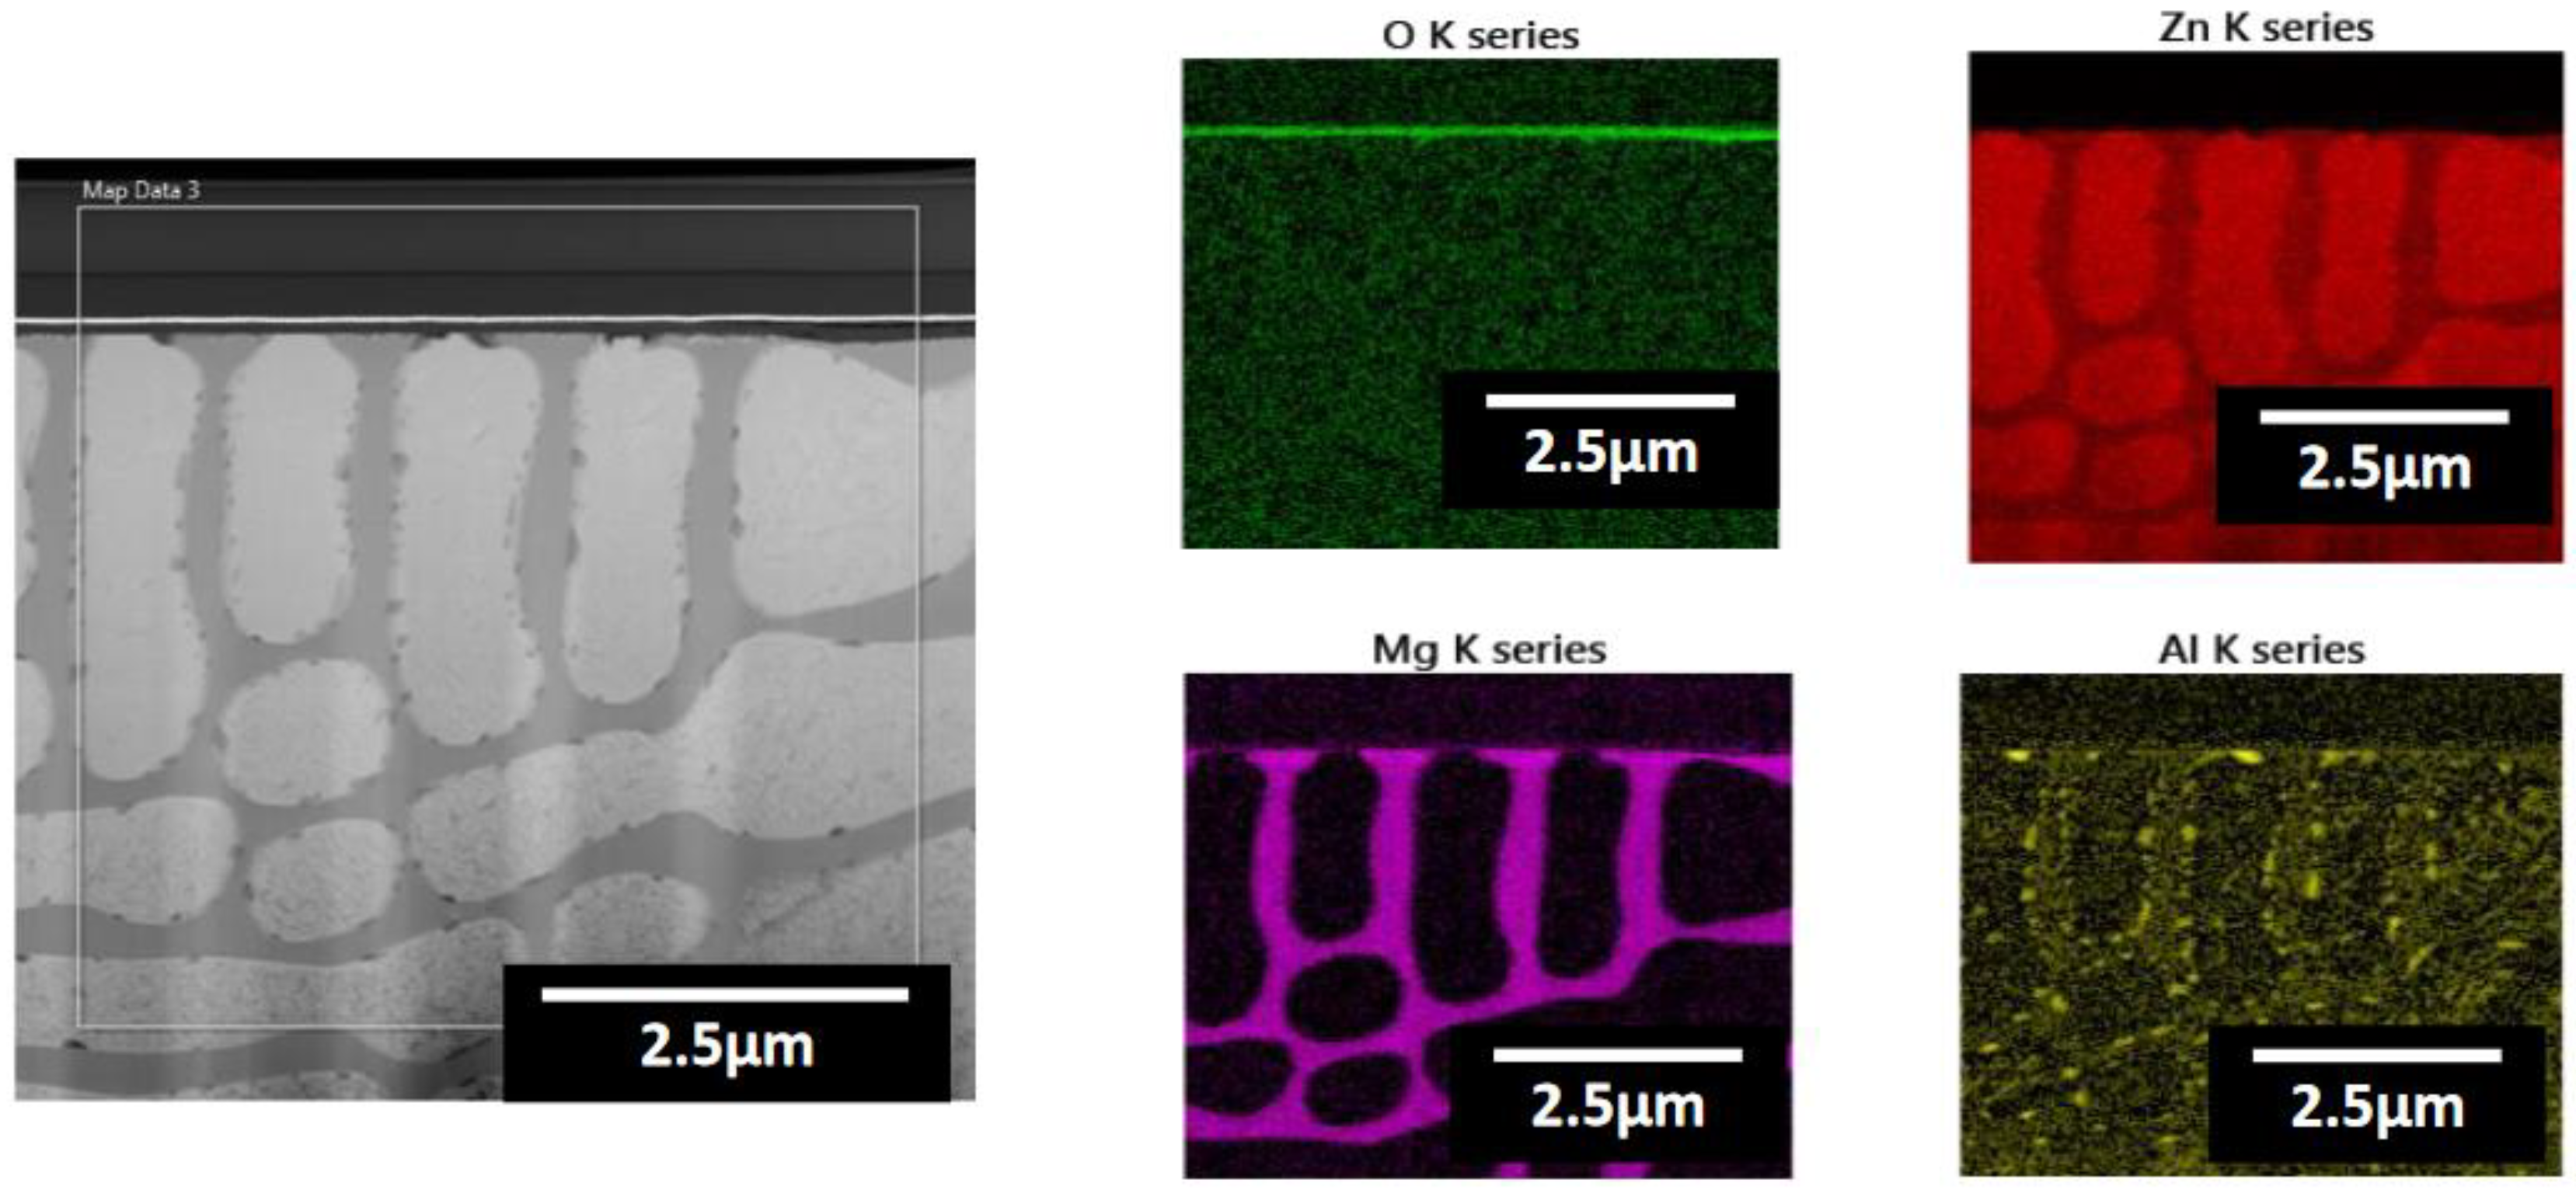
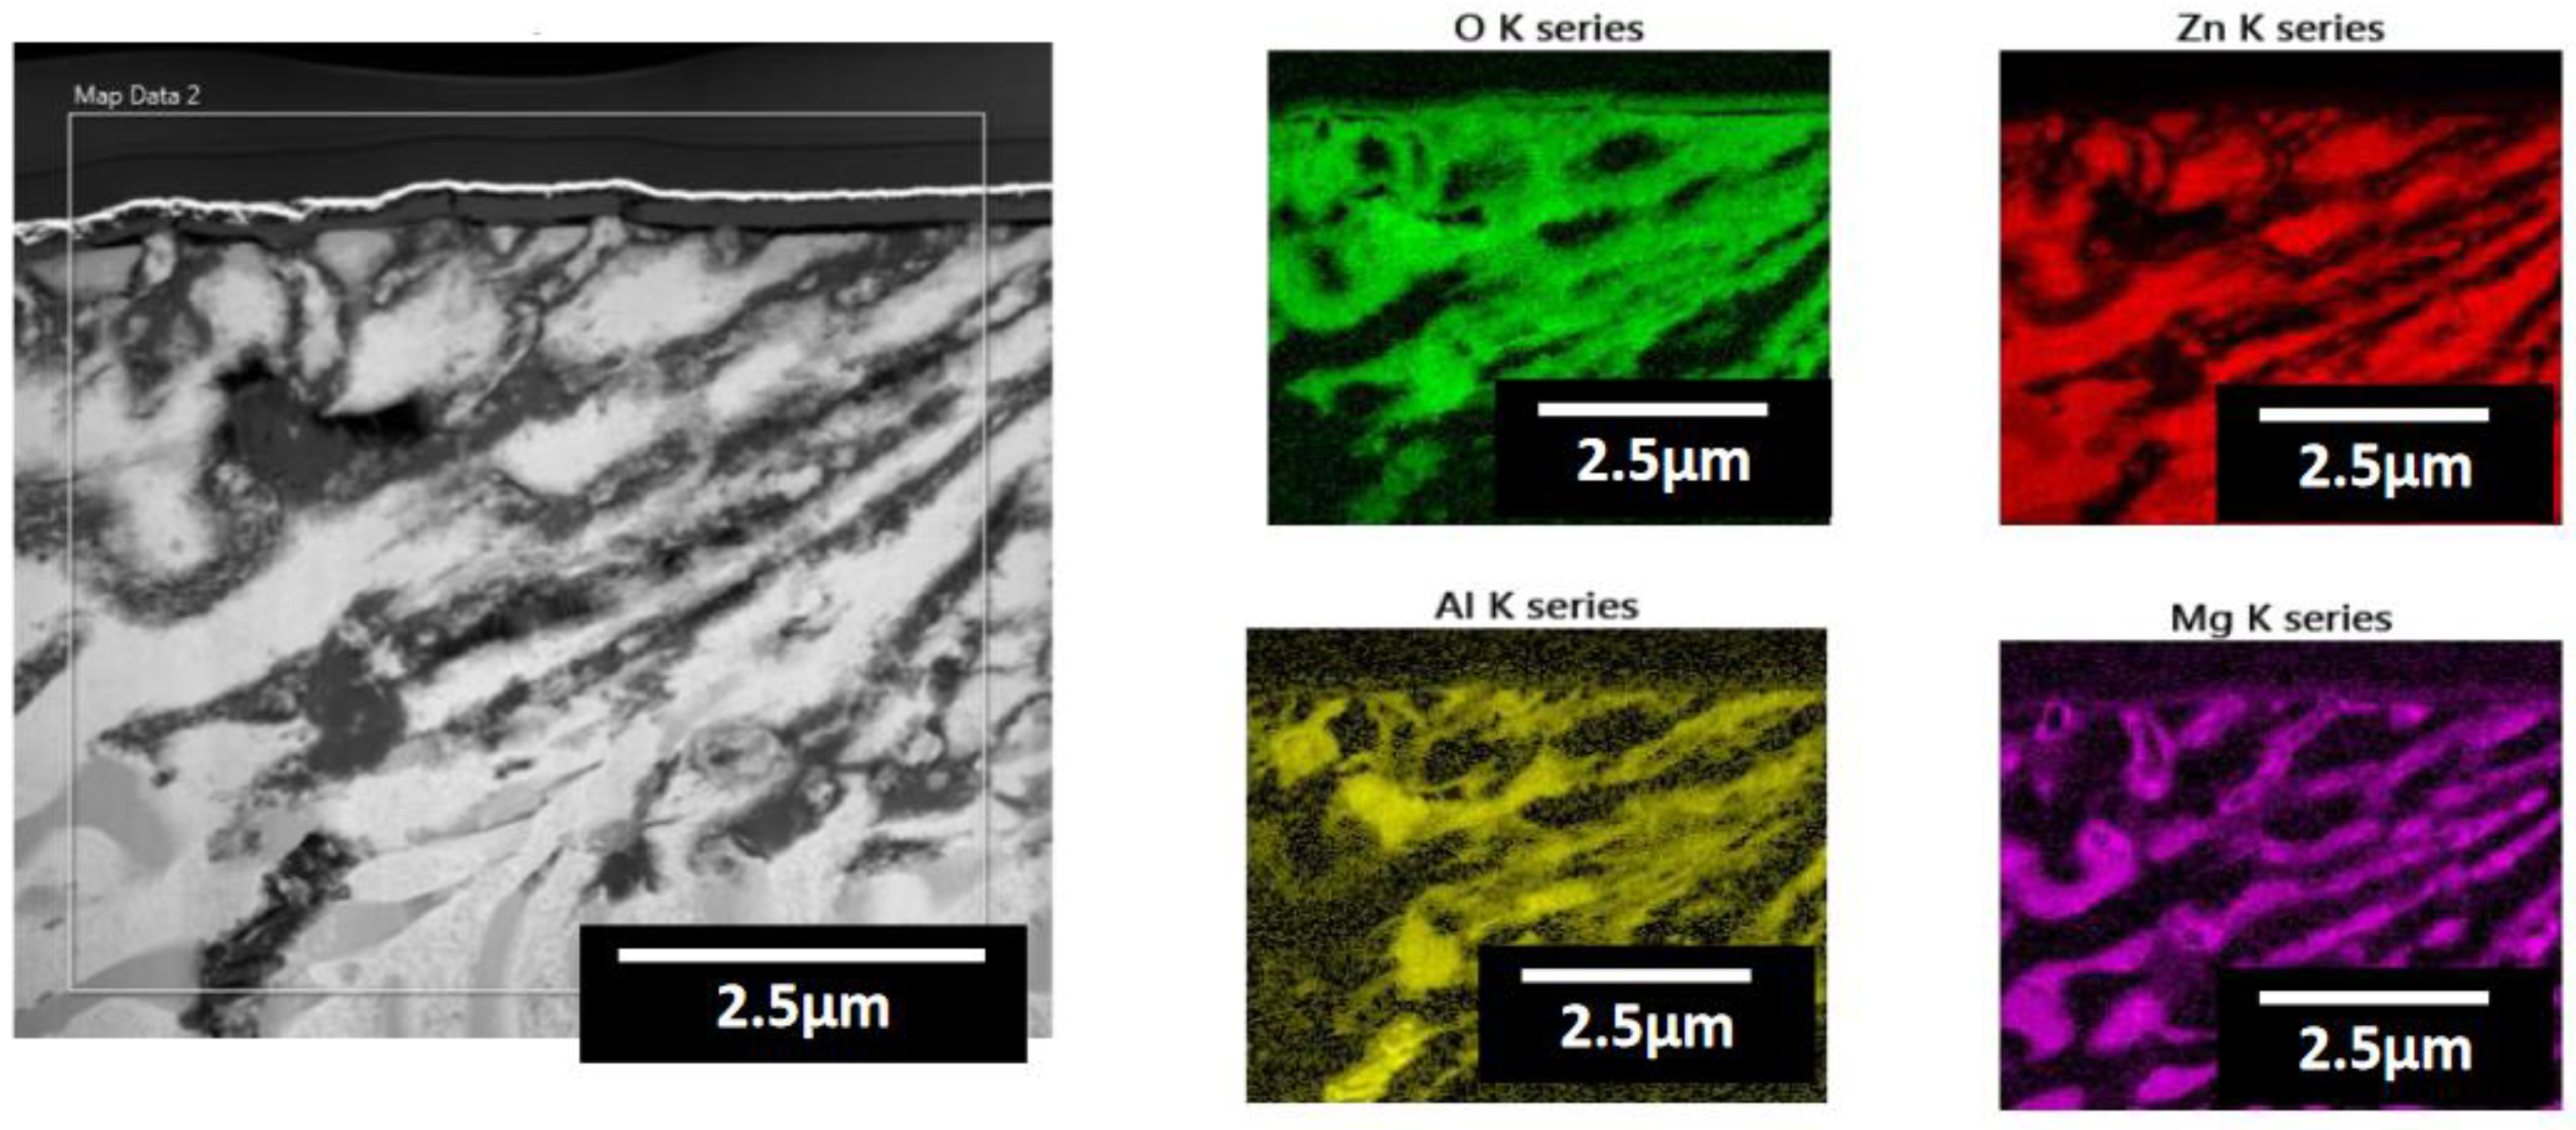
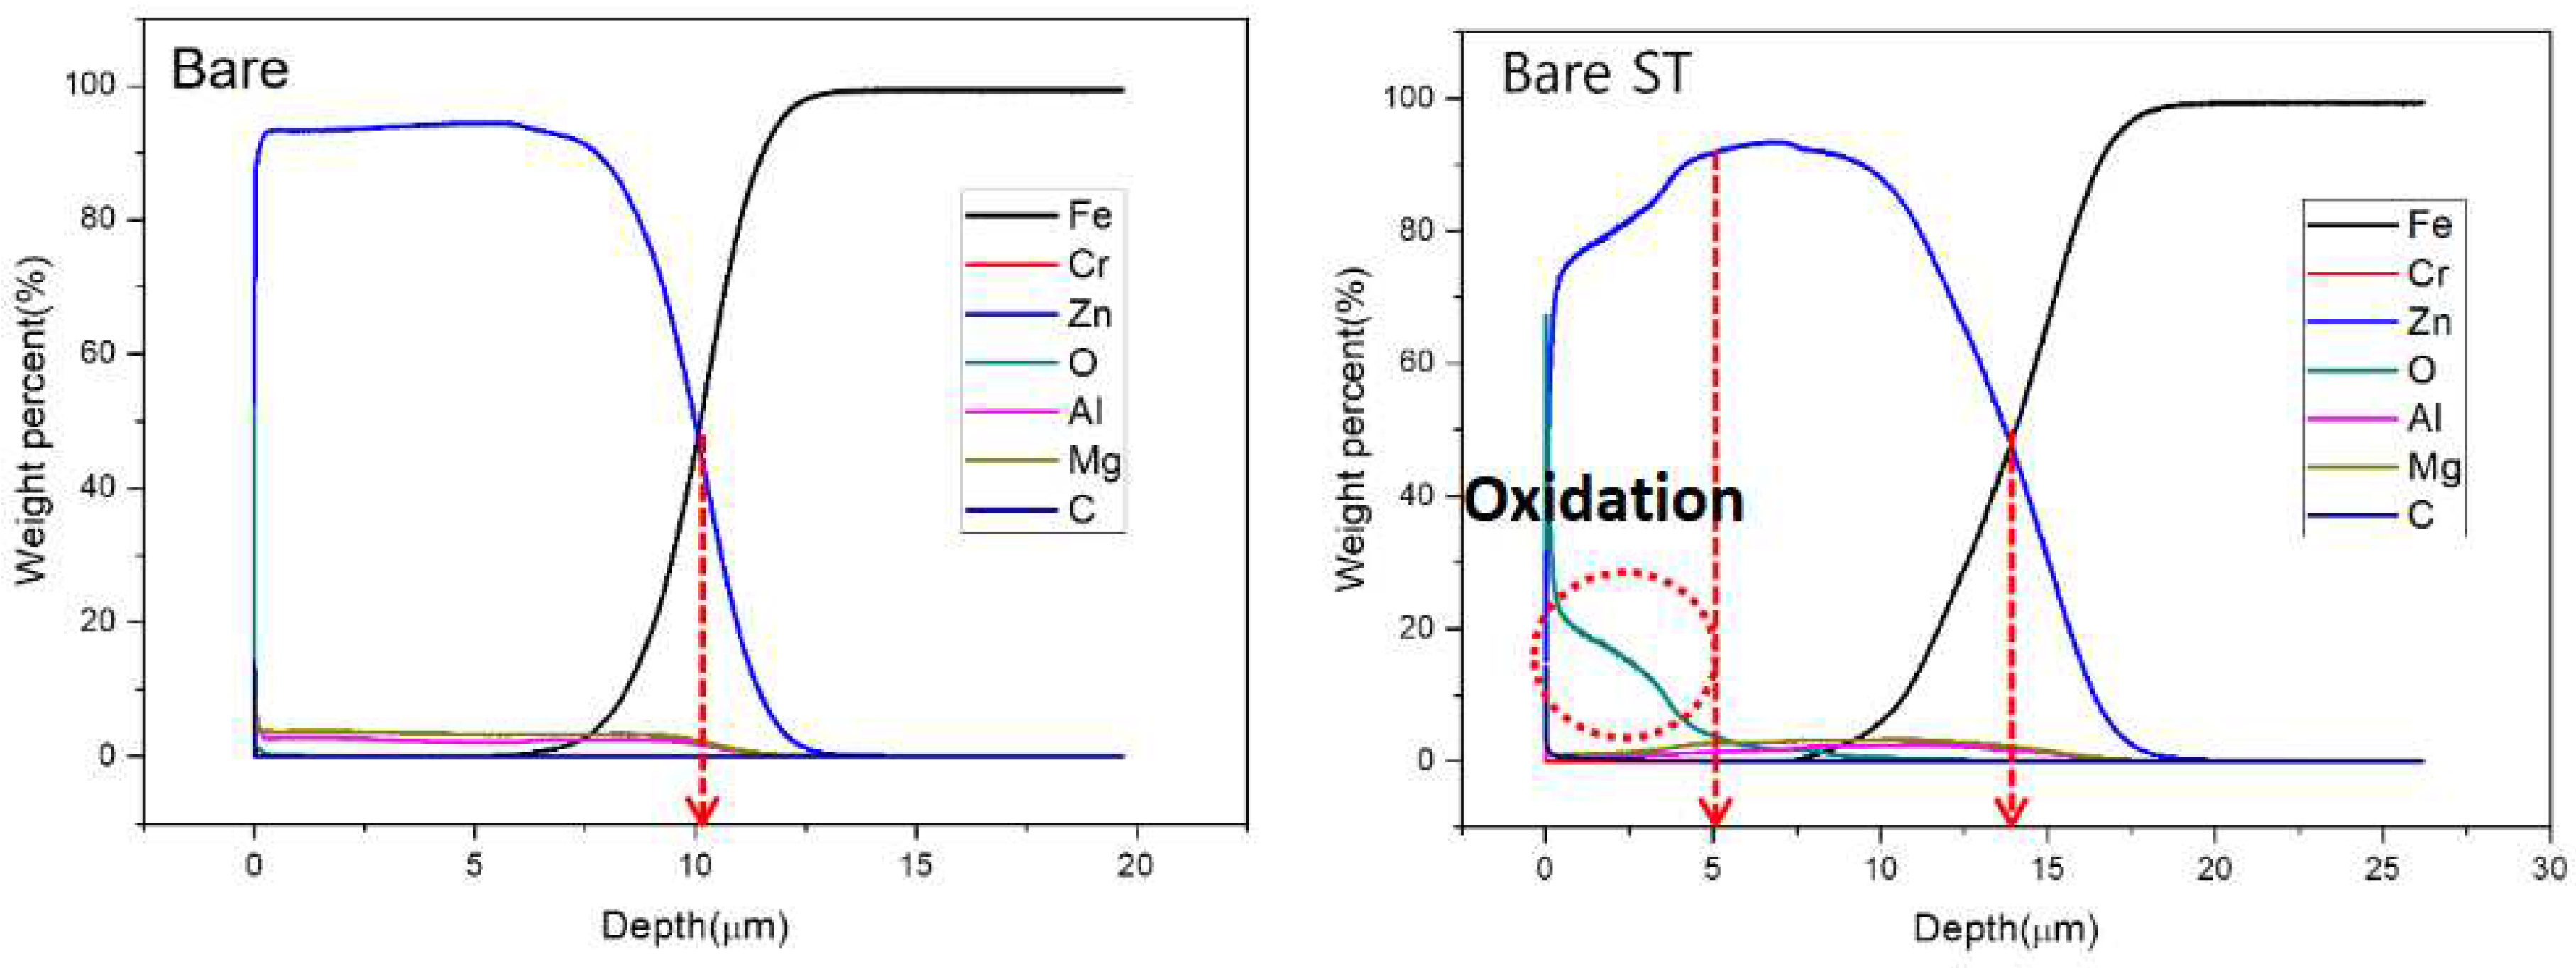
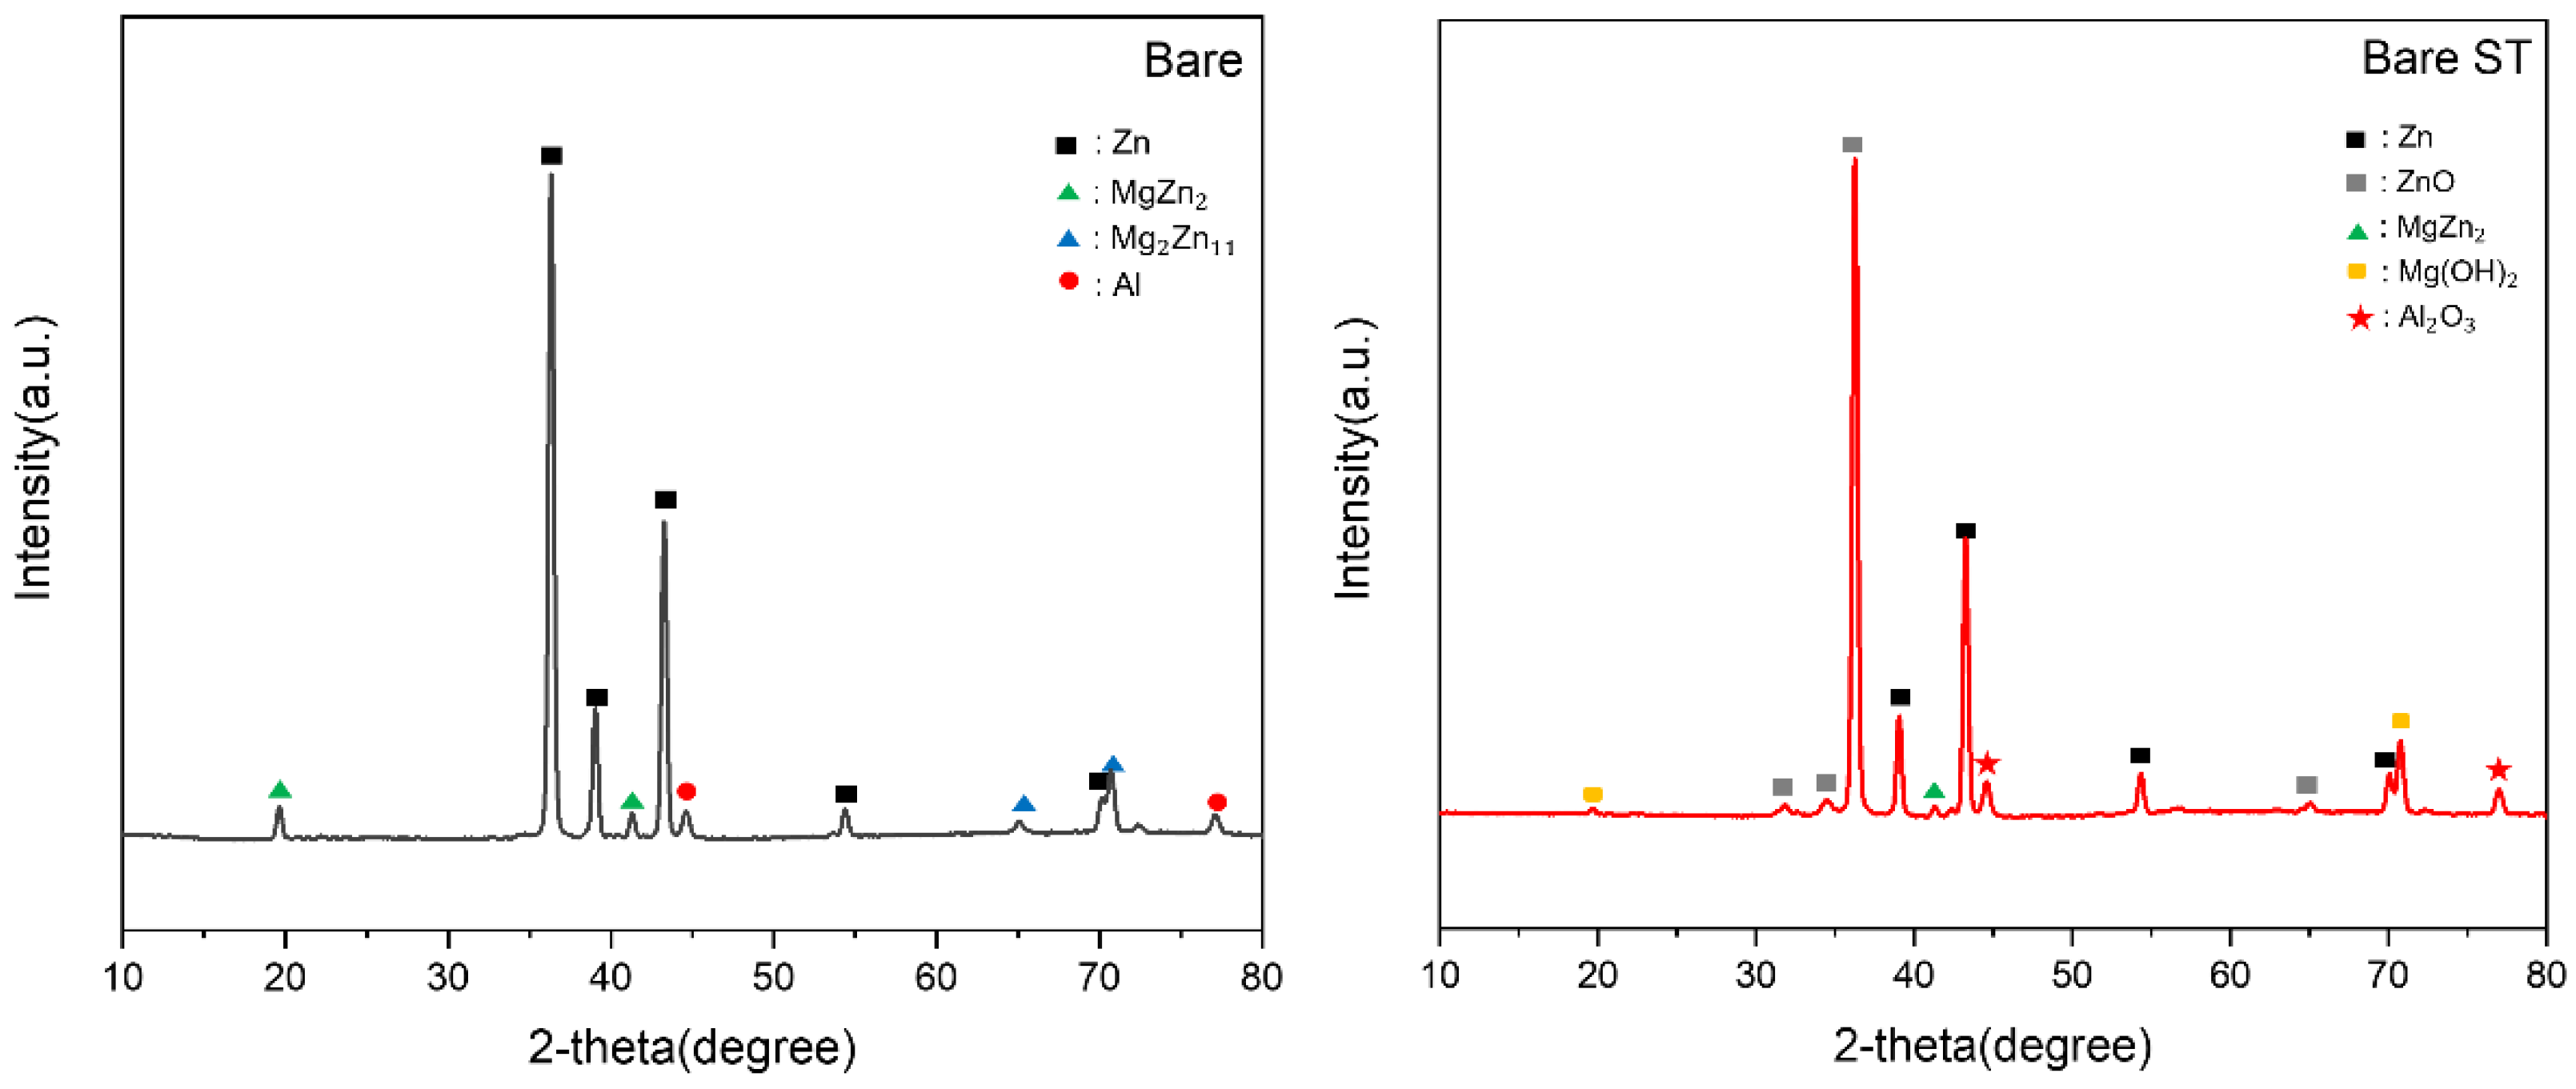
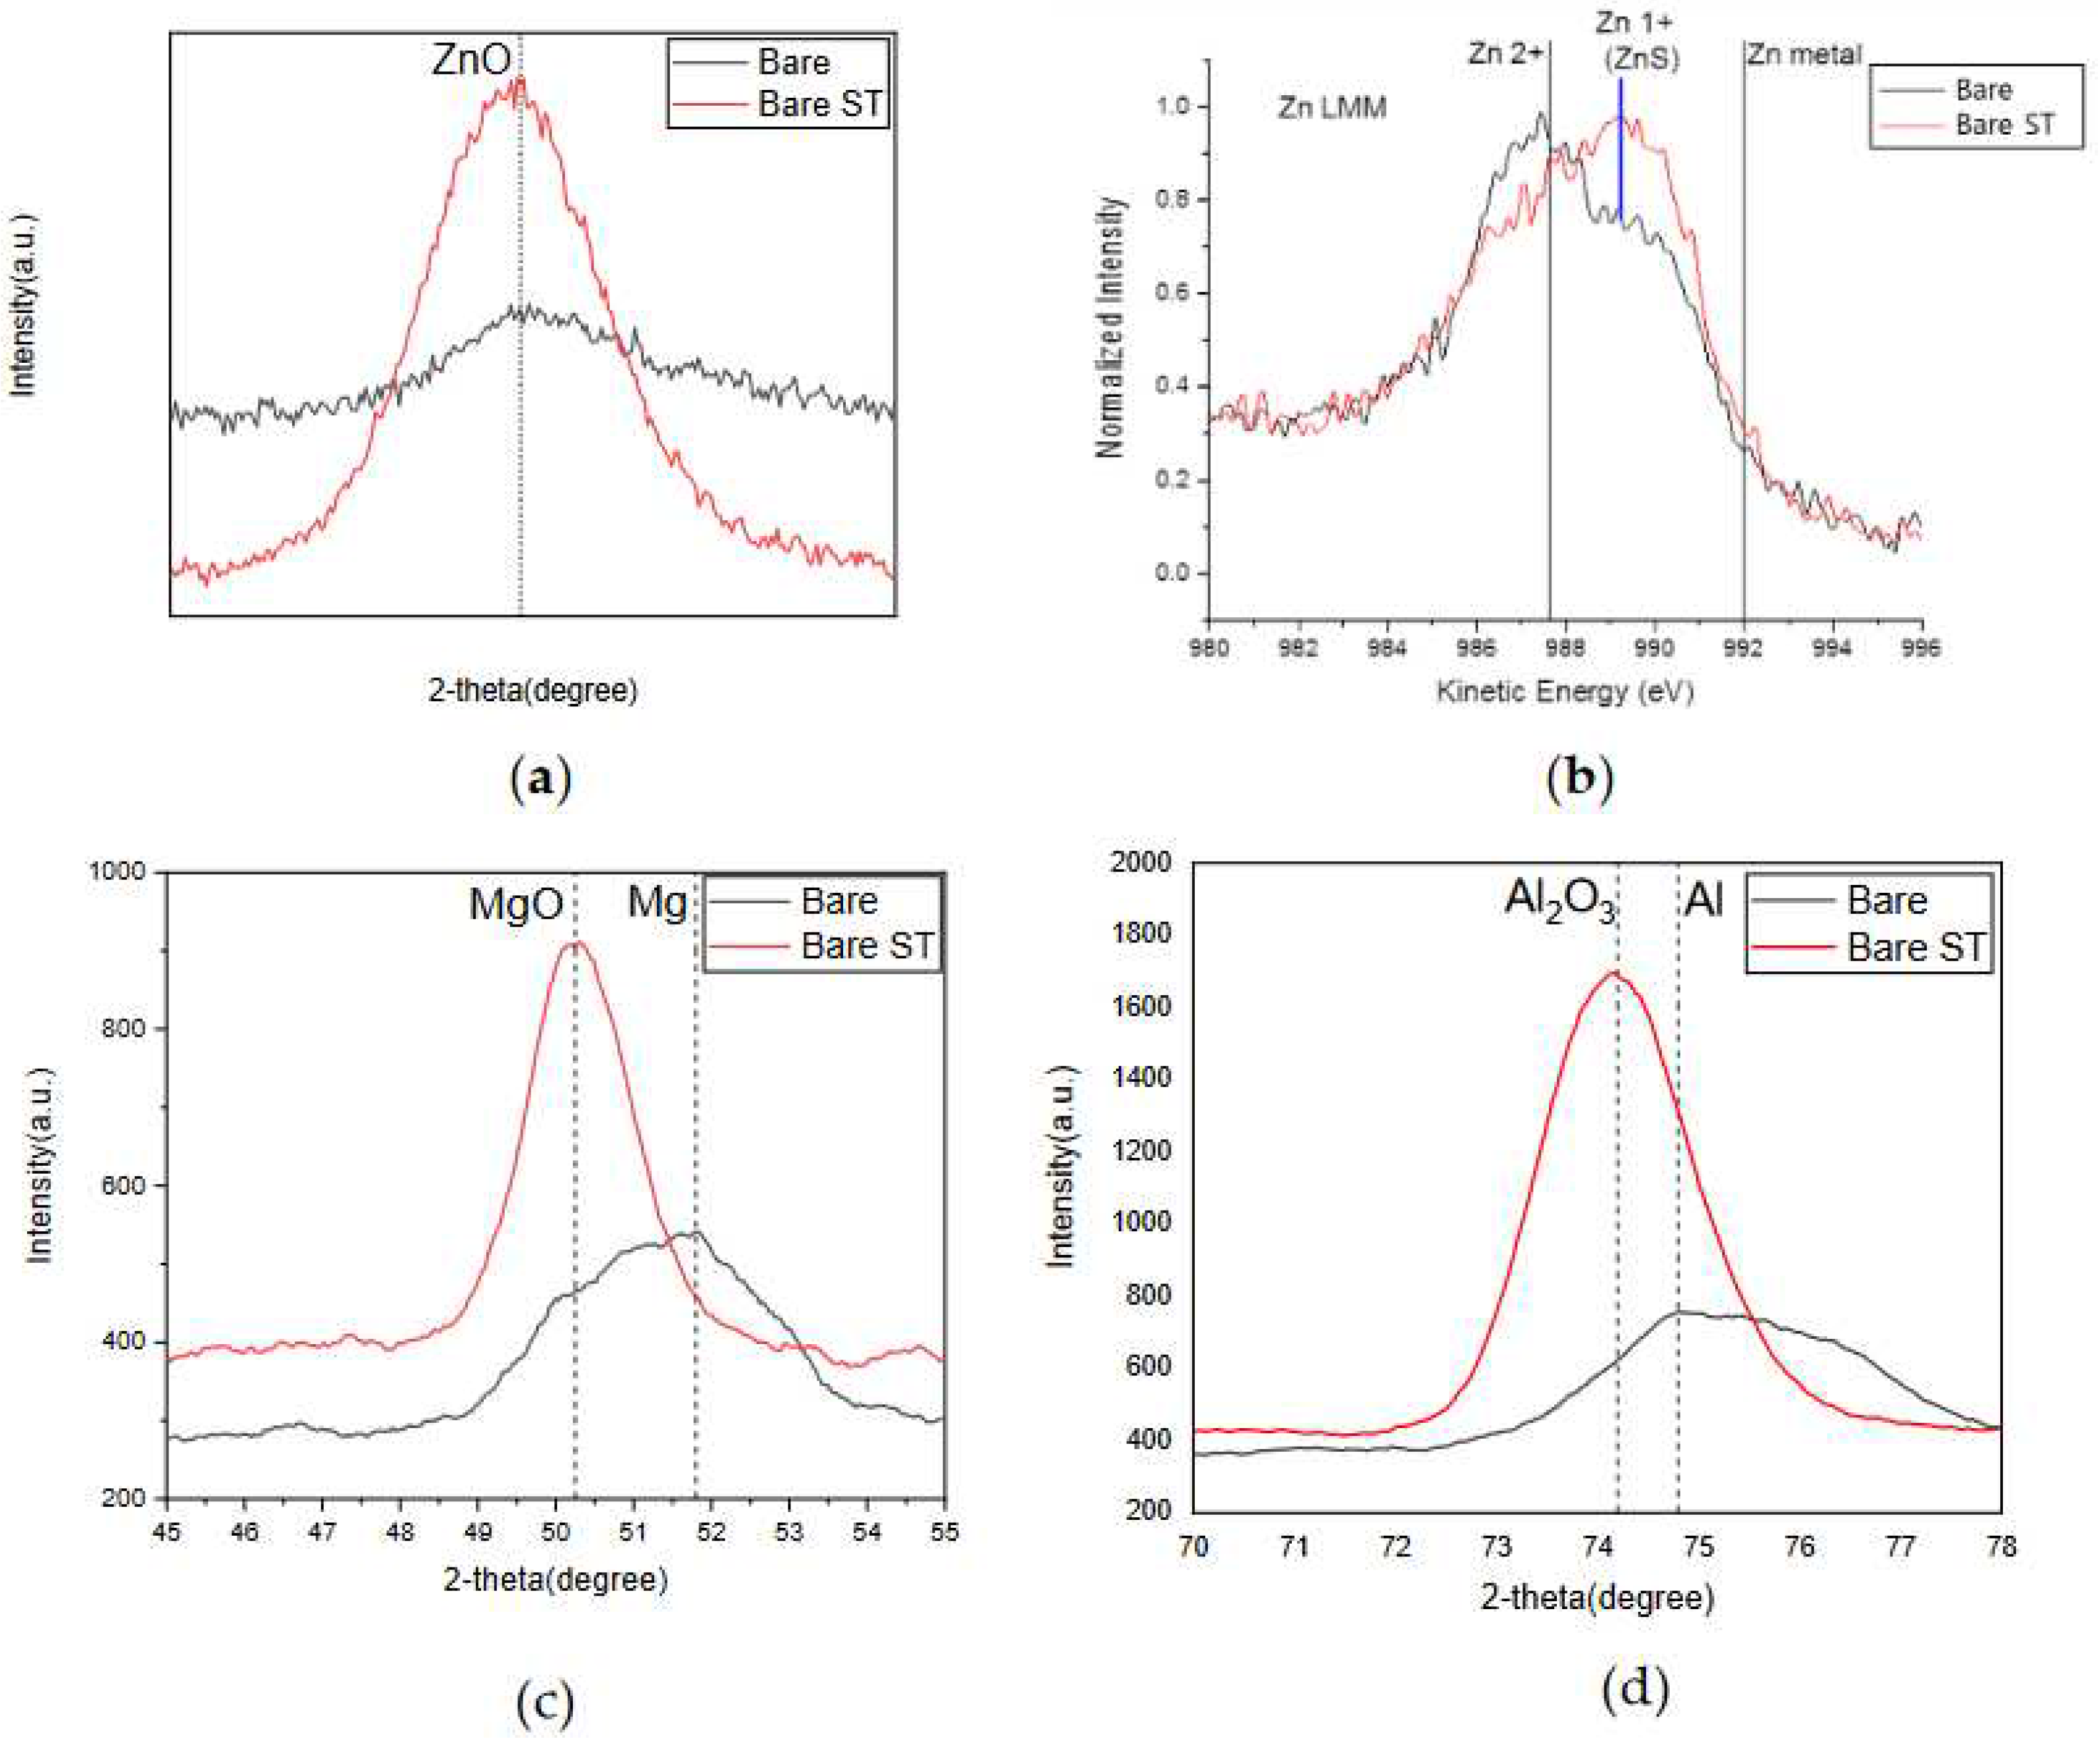
- Following water vapor treatment of the Zn-Mg-Al alloy-plated steel sheet, surface roughness increased, and particle size slightly grew. Examination of the surface and cross-section after water vapor treatment revealed the formation of an oxide layer, suggesting that the primary contributor to blackening is likely the influence of oxides, such as ZnO and Mg(OH)2 in the surface layer.
- 2)
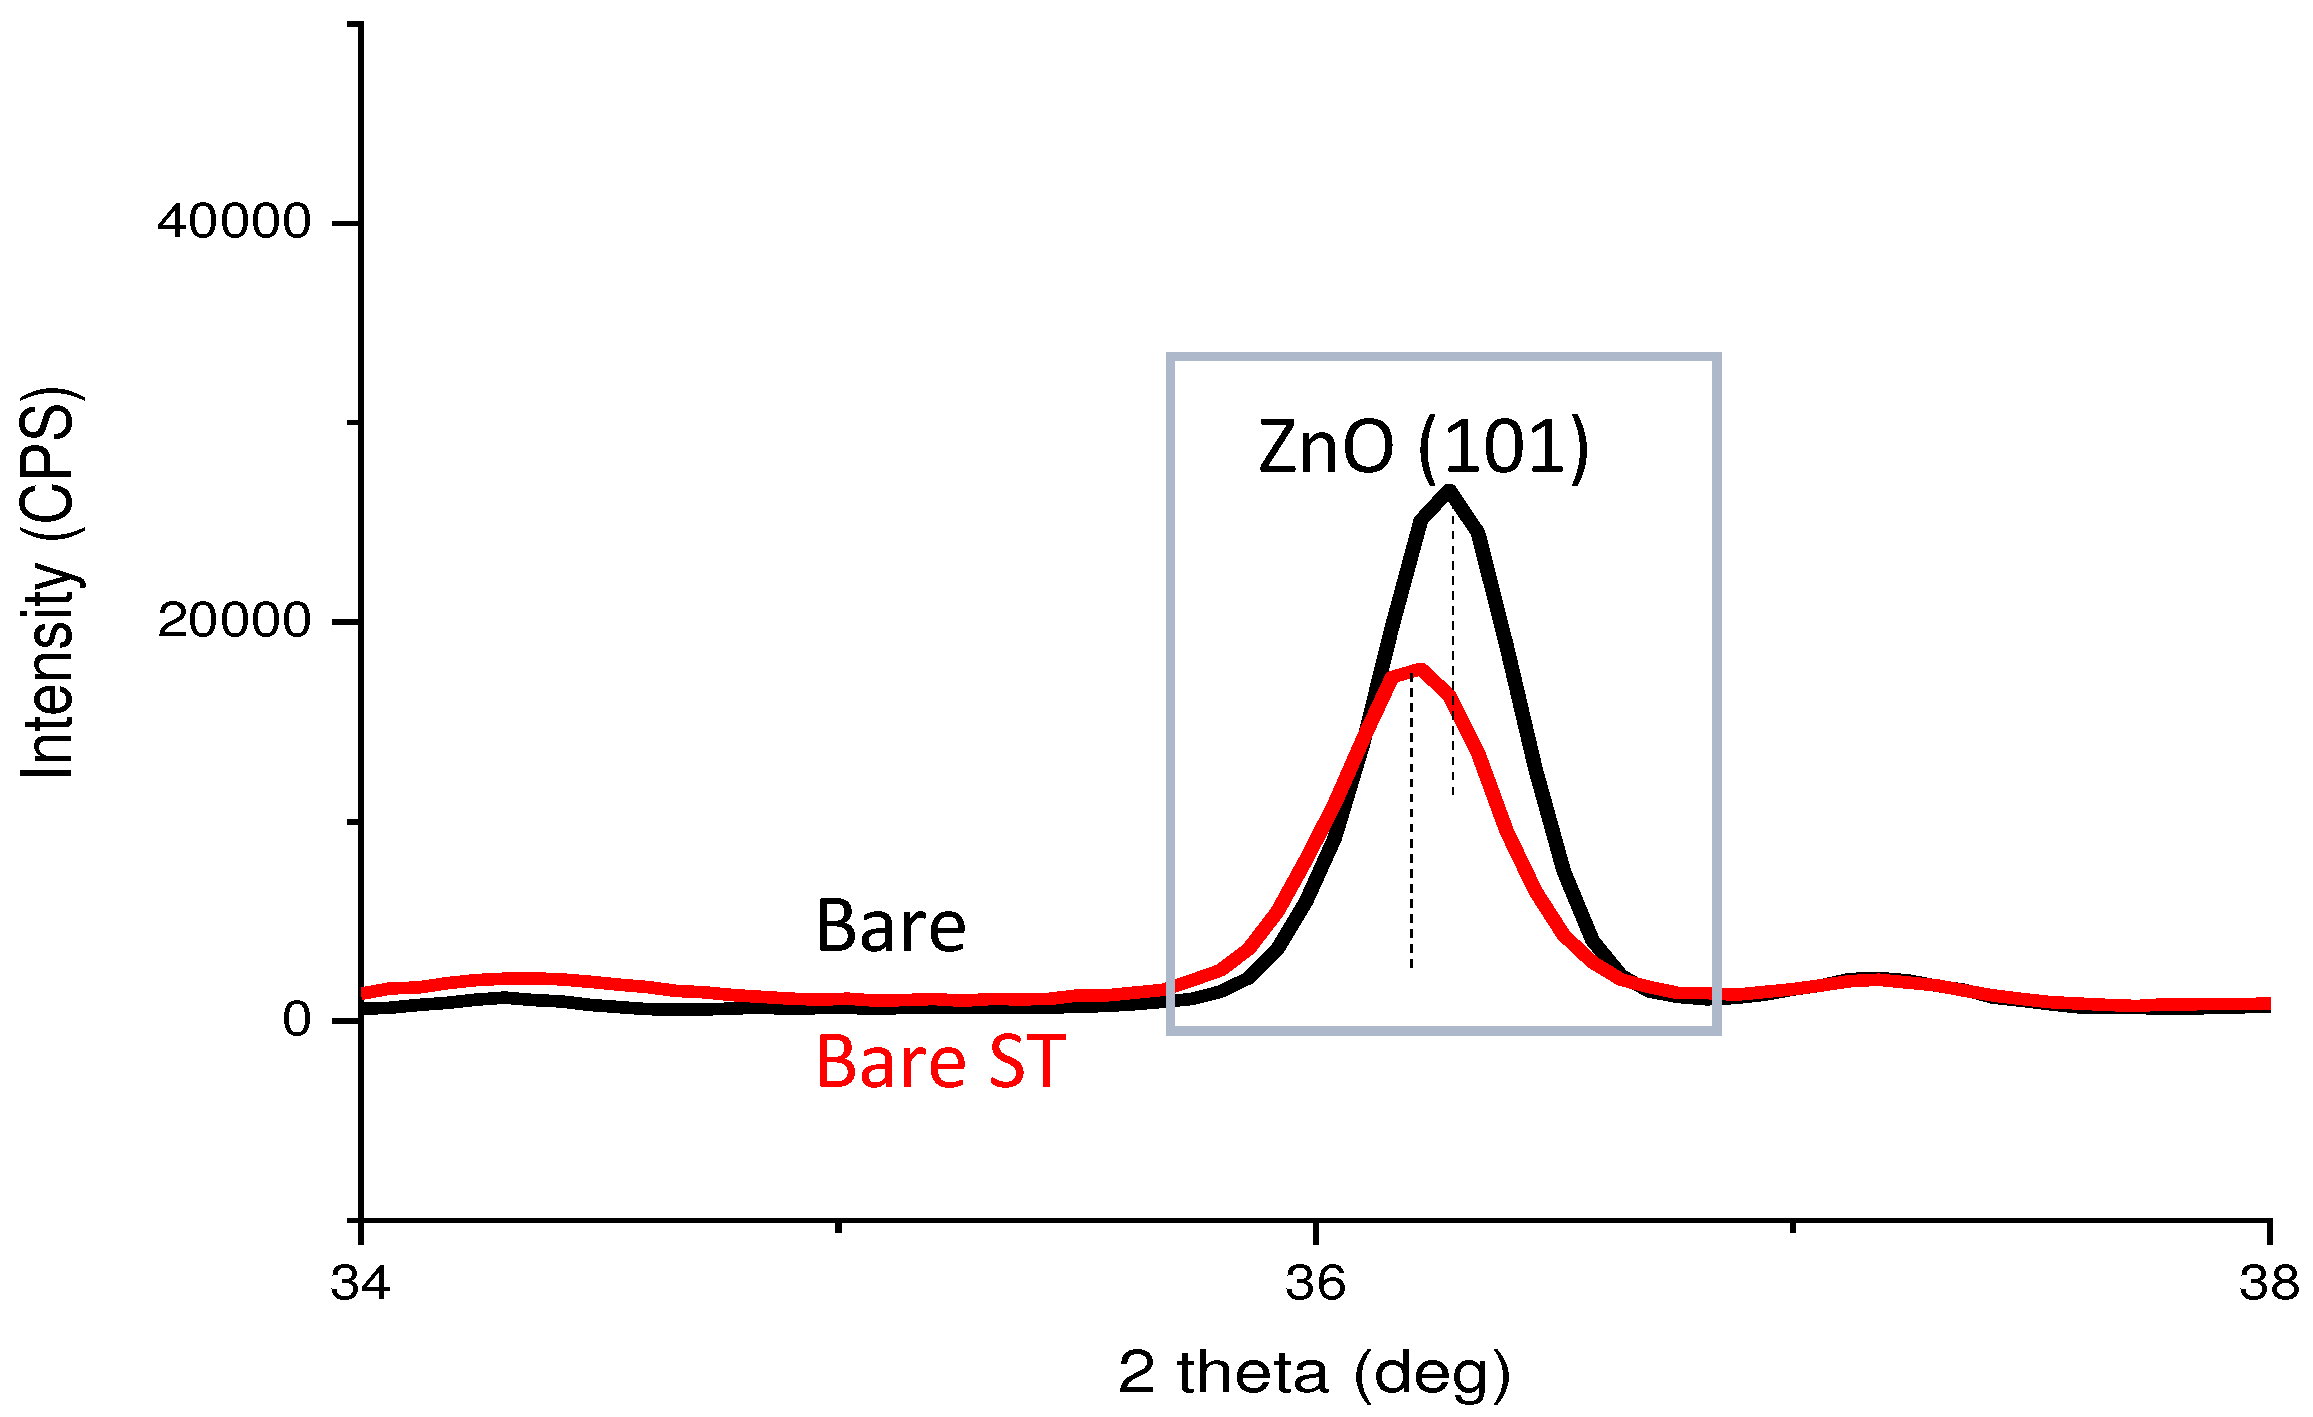
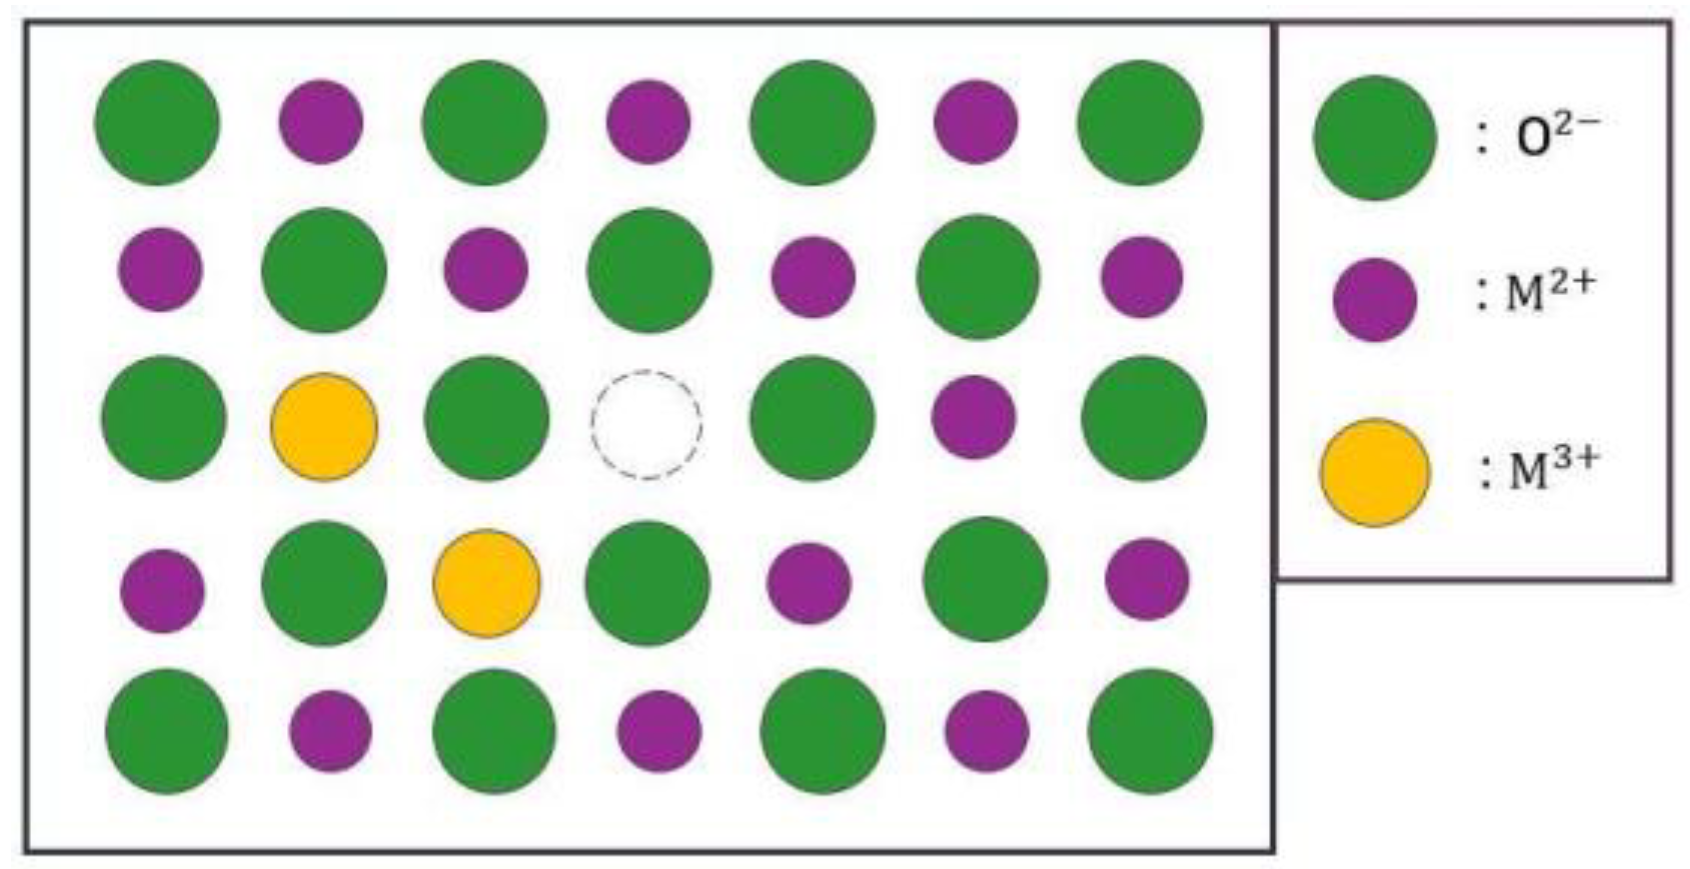
- Oxides and hydrated oxides were confirmed to form after water vapor treatment, leading to the creation of oxygen vacancies. This resulted in an increase in the lattice spacing of ZnO and the formation of oxygen-deficient oxide.
- 3)
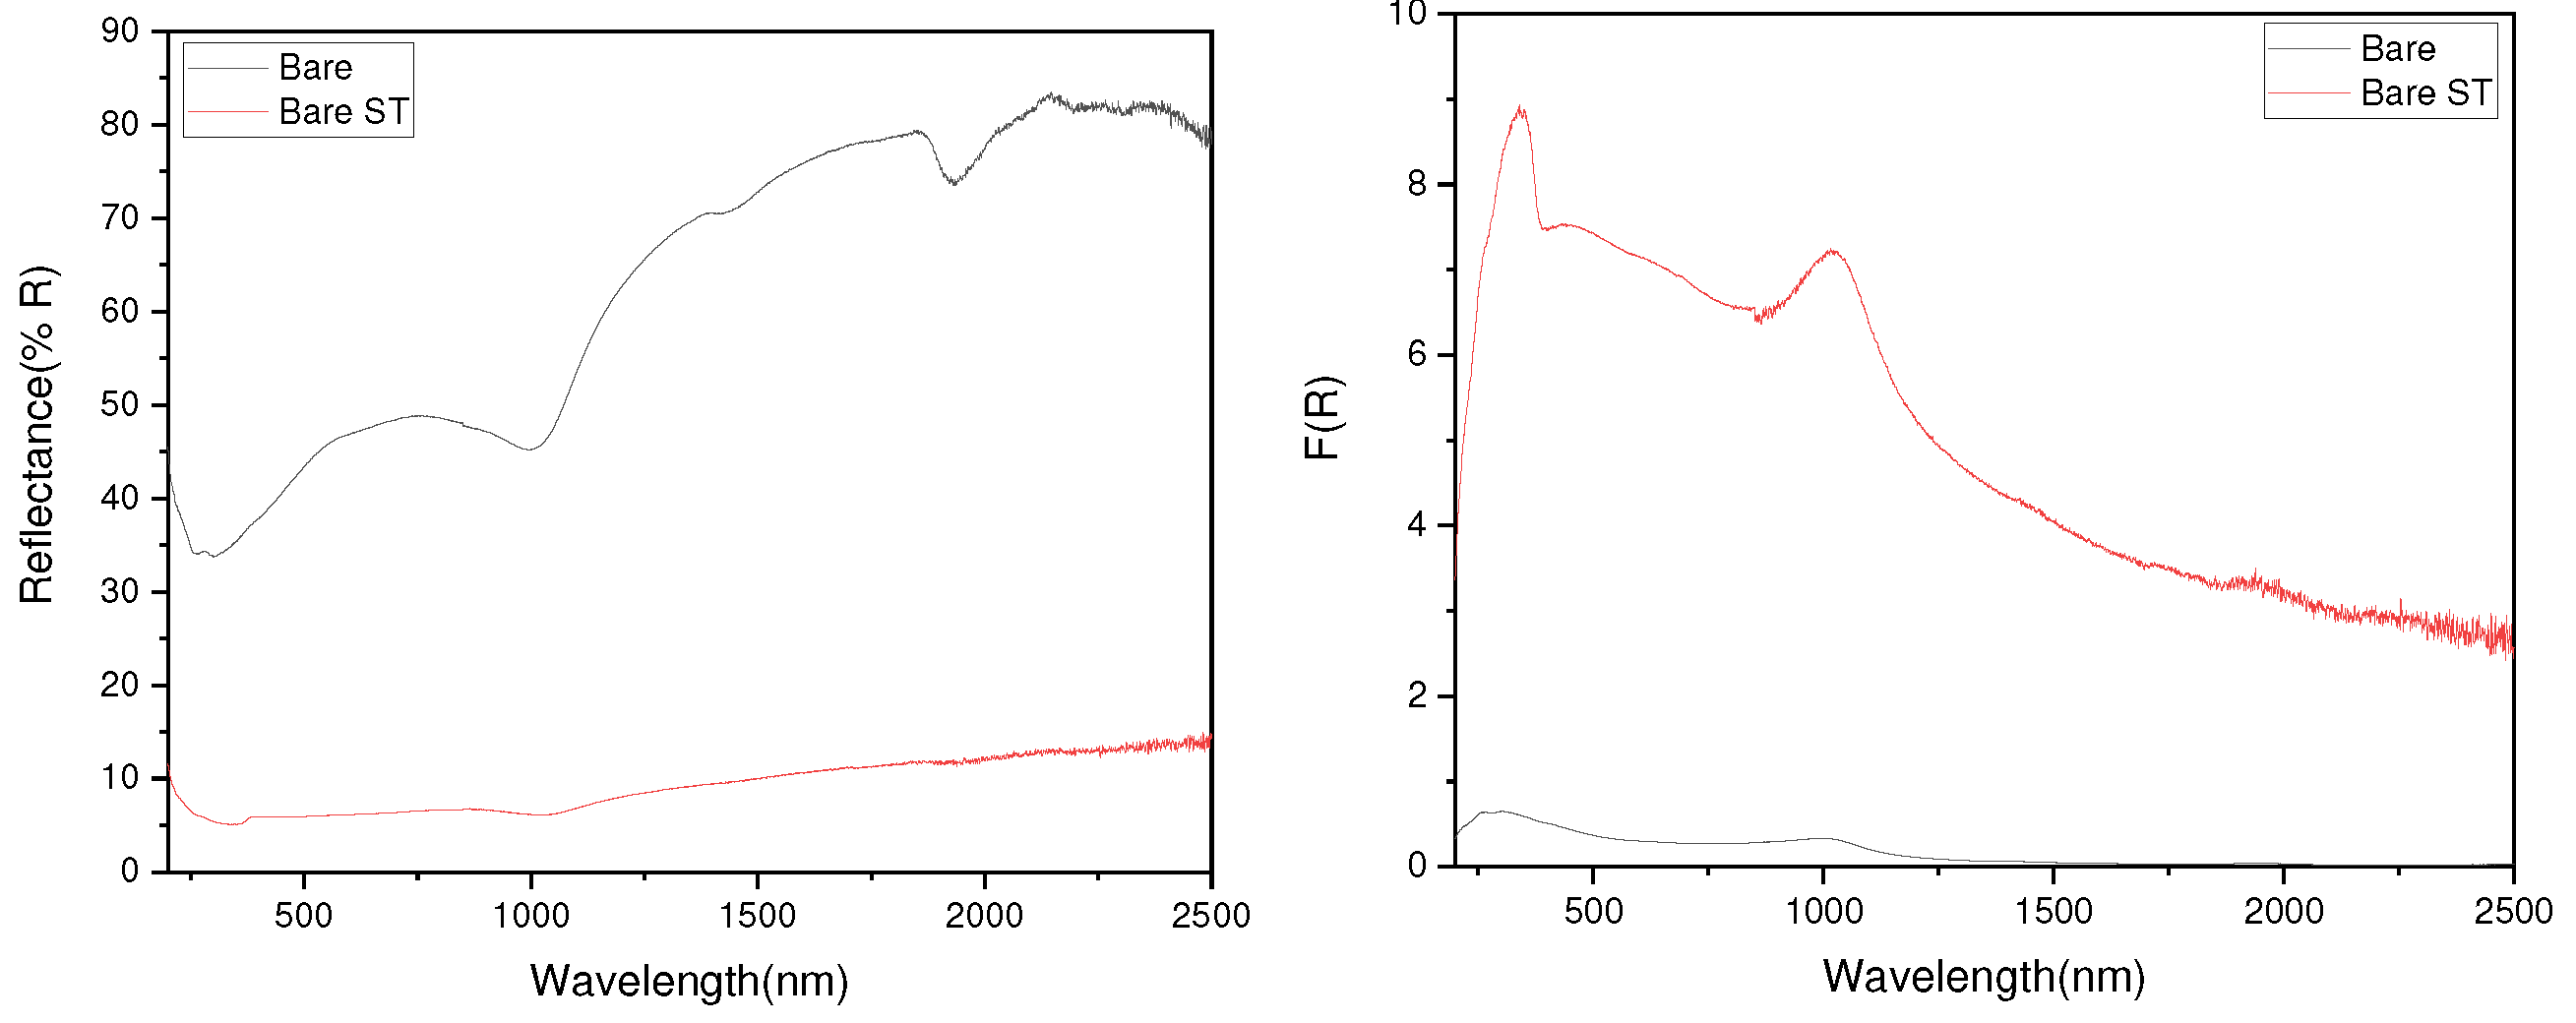
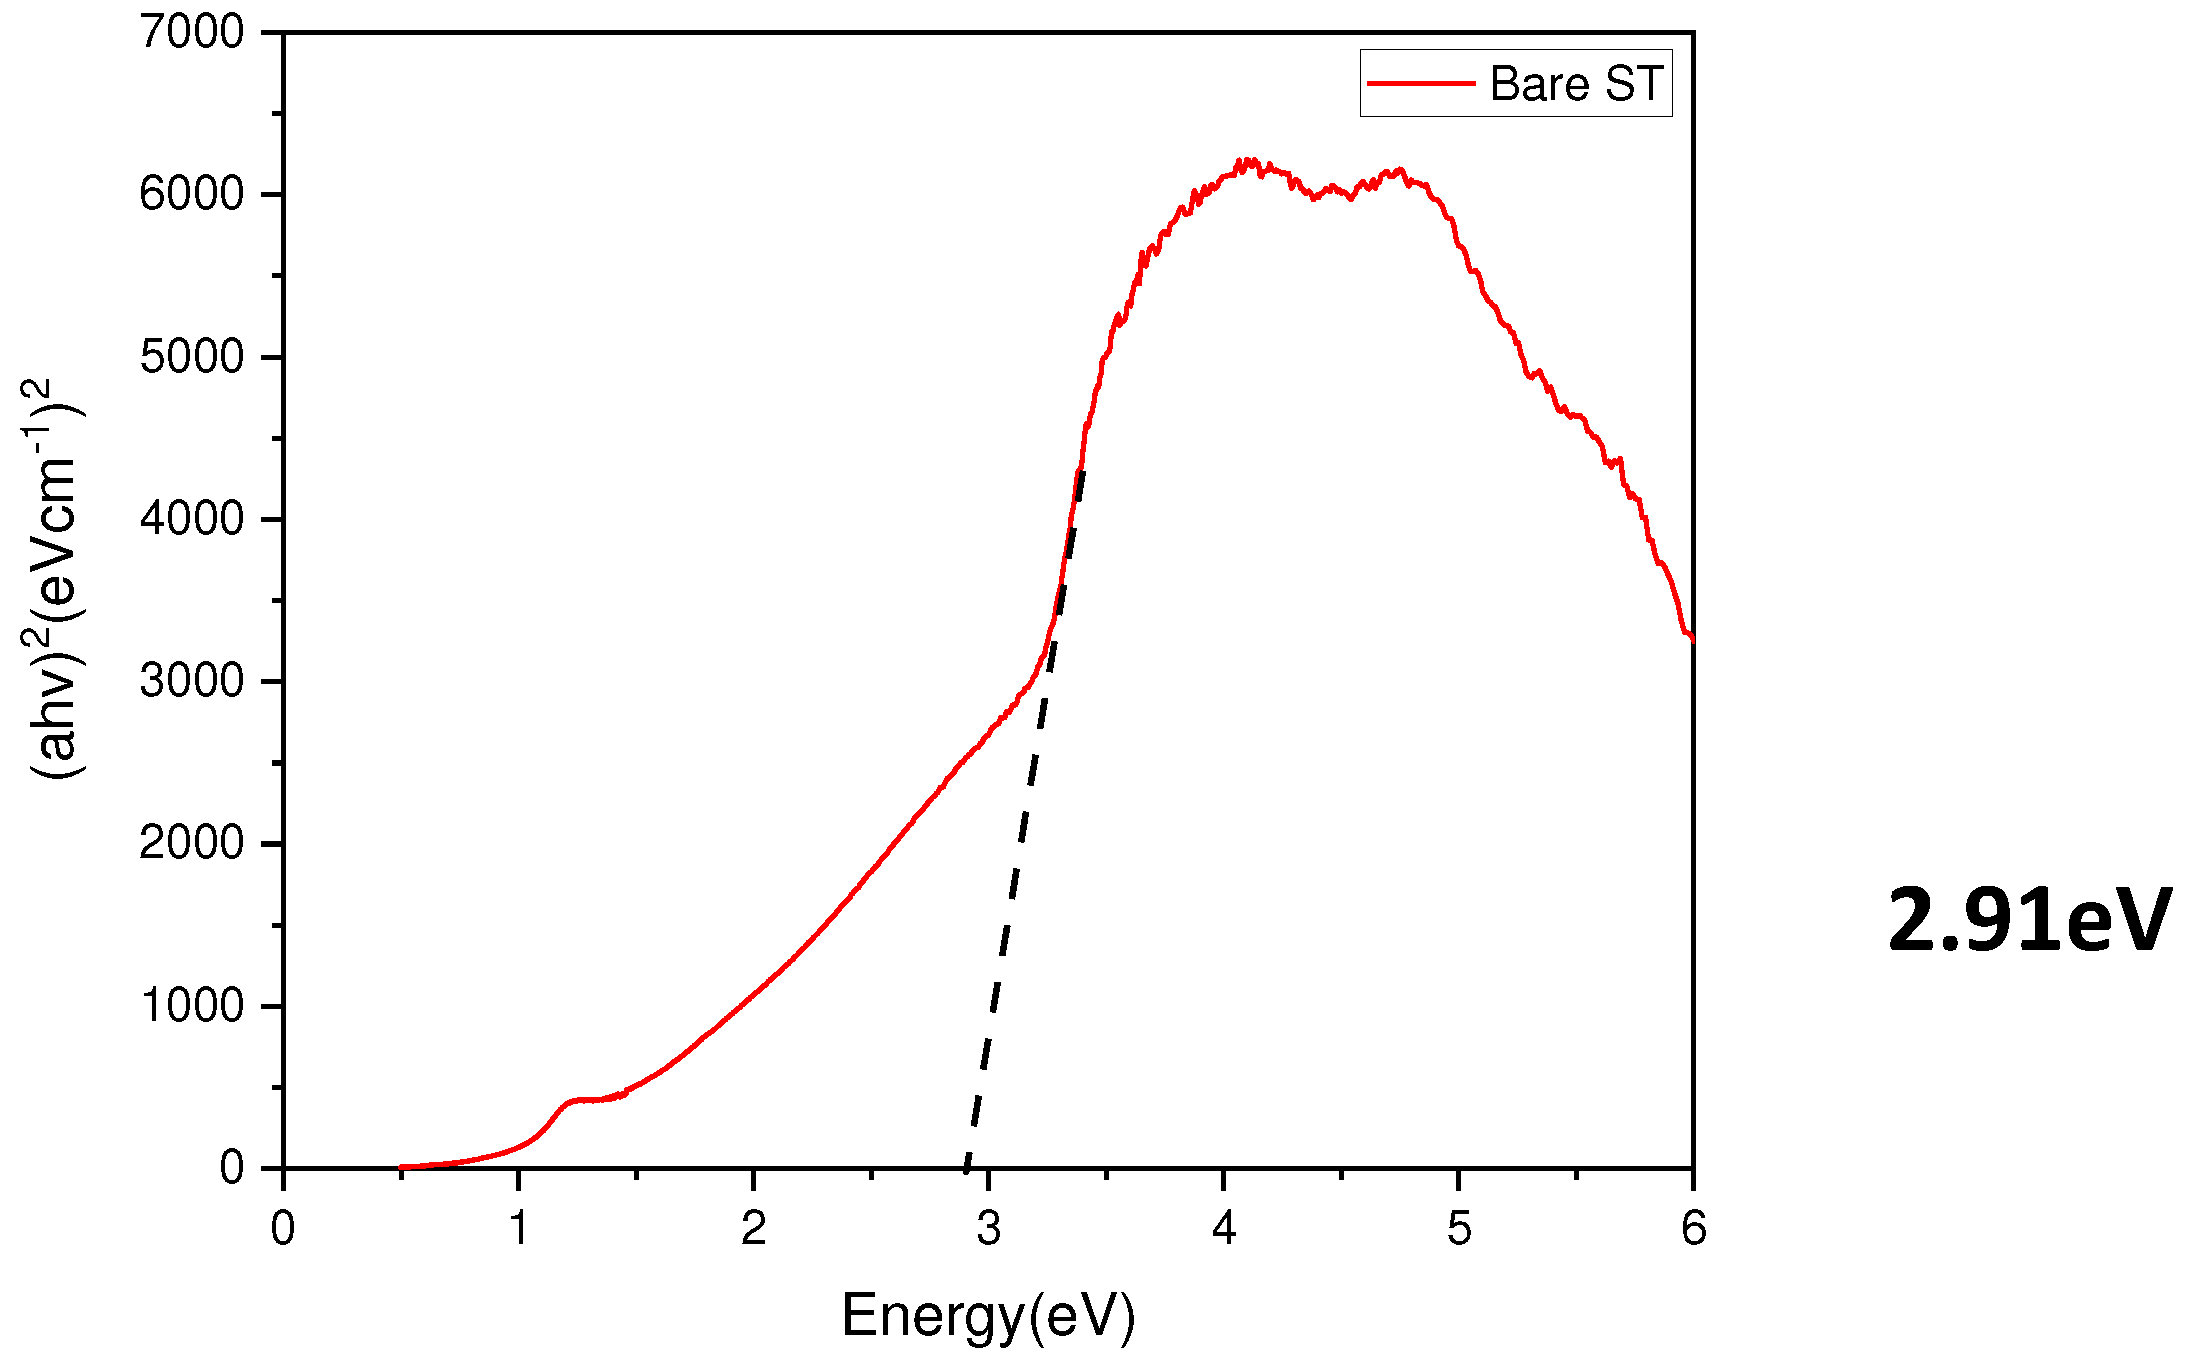
- Measurement of the optical bandgap of the blackened test specimen yielded a value of approximately 2.9 eV, significantly lower than the 3.4 eV of ZnO. This indicates the formation of a non-stoichiometric structure, ZnO1-x, due to the presence of defects. Visible light absorption by these defects is determined to be the cause of blackening.
- 4)
- The test specimen in this study had a composition of Zn 94.5 wt.%, Mg 3.0 wt.%, Al 2.5 wt%. Future research should explore blackening under improved conditions by varying the ratios of Mg and Al, investigating factors promoting blackening at lower energy levels.
Author Contributions
Funding
Institutional Review Board Statement
Informed Consent Statement
Data Availability Statement
Acknowledgments
Conflicts of Interest
References
- Babolhavaeji, M.; Vakilian, M.A.; Slambolchi, A. The role of product color in consumer behavior. Advanced social humanities and management 2015, 2, 9–15. [Google Scholar]
- Labrecque, L.I.; Patrick, V.M.; Milne, G.R. The marketers’ prismatic palette: A review of color research and future directions. Psychology & Marketing 2013, 30, 187–202. [Google Scholar]
- Lee, J.; Kim, D.; Choi, C.; Chung, W. Nanoporous anodic alumina oxide layer and its sealing for the enhancement of radiative heat dissipation of aluminum alloy. Nano energy 2017, 31, 504–513. [Google Scholar] [CrossRef]
- Nakano, T.; Yamamoto, M.; Taketsu, H. 2017. Method for producing black-plated steel sheet, and method for producing molded article of black-plated steel sheet. U.S. Patent 9,598,759, March 21.
- Nakano, T.; Ueno, S.; Yamamoto, M. 2020. Method for manufacturing black plated steel sheet, apparatus for manufacturing black plated steel sheet, and system for manufacturing black plated steel sheet. U.S. Patent 10,697,053, 30 June.
- Porwal, T. Paint pollution harmful effects on environment. Social Issues and Environmental Problems 2015, 3, 2394–3629. [Google Scholar] [CrossRef]
- Nakano, T.; Yamamoto, M.; Taketsu, H. 2018. Black-plated steel sheet. U.S. Patent 9,863,027, 9 January.
- Lee, K.H.; Jeong, J.I.; Kim, H.J.; Yang, J.H. 2023. Black plated steel sheet and manufacturing method thereof. U.S. Patent 11,555,240, 17 January.
- Kim, S.J.; Kwak, Y.J.; Kim, T.Y.; Jung, W.S.; Kim, K.Y. Surface darkening phenomenon of Zn–Mg alloy coated steel exposed to aqueous environment at high temperature. J Mater Res 2015, 30, 3605–3615. [Google Scholar] [CrossRef]
- Masuda, R.; Kowalski, D.; Kitano, S.; Aoki, Y.; Nozawa, T.; Habazaki, H. Characterization of dark-colored nanoporous anodic films on zinc. Coatings 2020, 10, 1014. [Google Scholar] [CrossRef]
- Pistofidis, N.; Vourlias, G.; Konidaris, S.; Pavlidou, E.; Stergioudis, G. The combined effect of nickel and bismuth on the structure of hot-dip zinc coatings. Mater Lett 2007, 61. [Google Scholar] [CrossRef]
- Dutta, M.; Halder, A.K.; Singh, S.B. Morphology and properties of hot dip Zn–Mg and Zn–Mg–Al alloy coatings on steel sheet. Surface and Coatings Technology 2010, 205, 2578–2584. [Google Scholar] [CrossRef]
- Epp, J. X-ray diffraction (XRD) techniques for materials characterization. In Materials characterization using nondestructive evaluation (NDE) methodsElsevier: 2016; pp. 81-124.
- Li, X.; Wang, Y.; Liu, W.; Jiang, G.; Zhu, C. Study of oxygen vacancies′ influence on the lattice parameter in ZnO thin film. Mater Lett 2012, 85, 25–28. [Google Scholar] [CrossRef]
- Cho, S.W.; Kim, K.S.; Jung, S.H.; Cho, H.K. Towards environmentally stable solution-processed oxide thin-film transistors: a rare-metal-free oxide-based semiconductor/insulator heterostructure and chemically stable multi-stacking. Journal of Materials Chemistry C 2017, 5, 10498–10508. [Google Scholar] [CrossRef]
- Shen, J.; Li, Y.; He, J. On the Kubelka–Munk absorption coefficient. Dyes and Pigments 2016, 127, 187–188. [Google Scholar] [CrossRef]
- Jubu, P.R.; Obaseki, O.S.; Nathan-Abutu, A.; Yam, F.K.; Yusof, Y.; Ochang, M.B. Dispensability of the conventional Tauc’s plot for accurate bandgap determination from UV–vis optical diffuse reflectance data. Results in Optics 2022, 9, 100273. [Google Scholar] [CrossRef]
- Dostanko, A.P.; Ageev, O.A.; Golosov, D.A.; Zavadski, S.M.; Zamburg, E.G.; Vakulov, D.E.; Vakulov, Z.E. Electrical and optical properties of zinc-oxide films deposited by the ion-beam sputtering of an oxide target. Semiconductors 2014, 48, 1242–1247. [Google Scholar] [CrossRef]
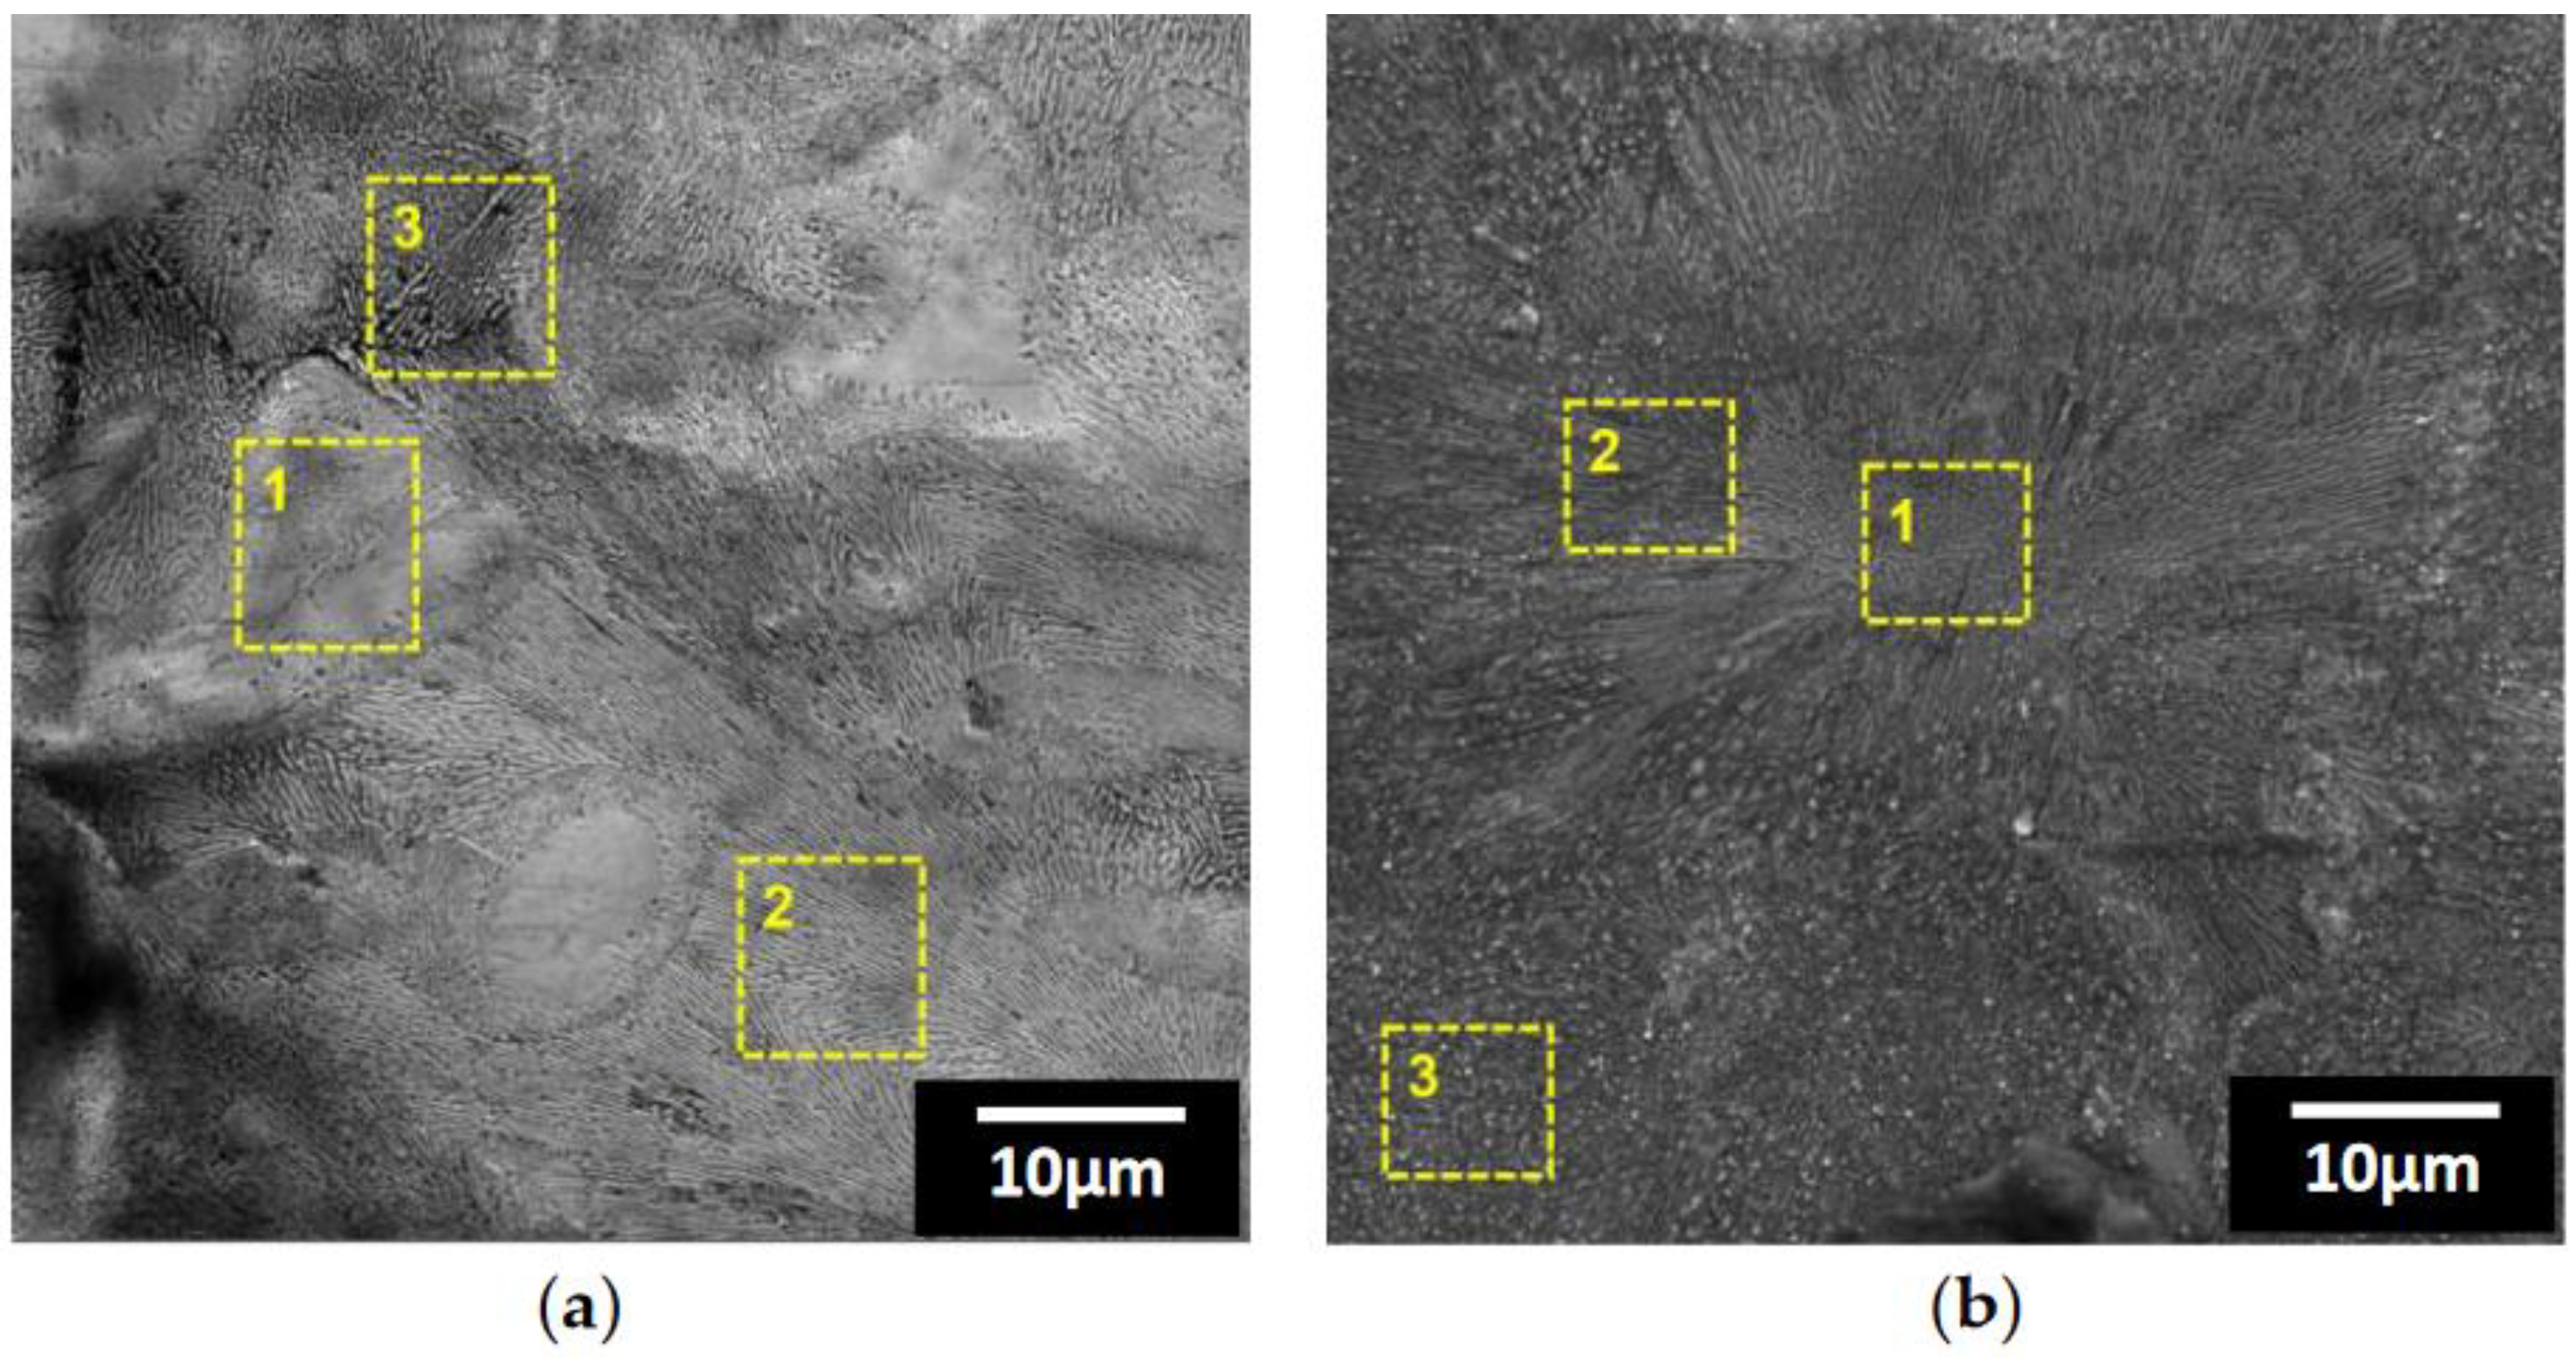


| Point | Zn(at.%) | Mg(at.%) | Al(at.%) | O(at.%) |
|---|---|---|---|---|
| 1 | 85.15 | 4.30 | 6.76 | 3.79 |
| 2 | 76.12 | 8.99 | 12.65 | 2.24 |
| 3 | 63.79 | 10.12 | 12.10 | 13.99 |
| Point | Zn(at.%) | Mg(at.%) | Al(at.%) | O(at.%) |
|---|---|---|---|---|
| 1 | 43.10 | 9.55 | 12.38 | 34.97 |
| 2 | 36.94 | 10.28 | 13.75 | 39.03 |
| 3 | 30.25 | 8.46 | 16.26 | 45.03 |
Disclaimer/Publisher’s Note: The statements, opinions and data contained in all publications are solely those of the individual author(s) and contributor(s) and not of MDPI and/or the editor(s). MDPI and/or the editor(s) disclaim responsibility for any injury to people or property resulting from any ideas, methods, instructions or products referred to in the content. |
© 2023 by the authors. Licensee MDPI, Basel, Switzerland. This article is an open access article distributed under the terms and conditions of the Creative Commons Attribution (CC BY) license (http://creativecommons.org/licenses/by/4.0/).


