Submitted:
10 December 2023
Posted:
11 December 2023
You are already at the latest version
Abstract
Keywords:
1. Introduction
2. Materials and Methods
2.1. Animals
2.2. Chemicals
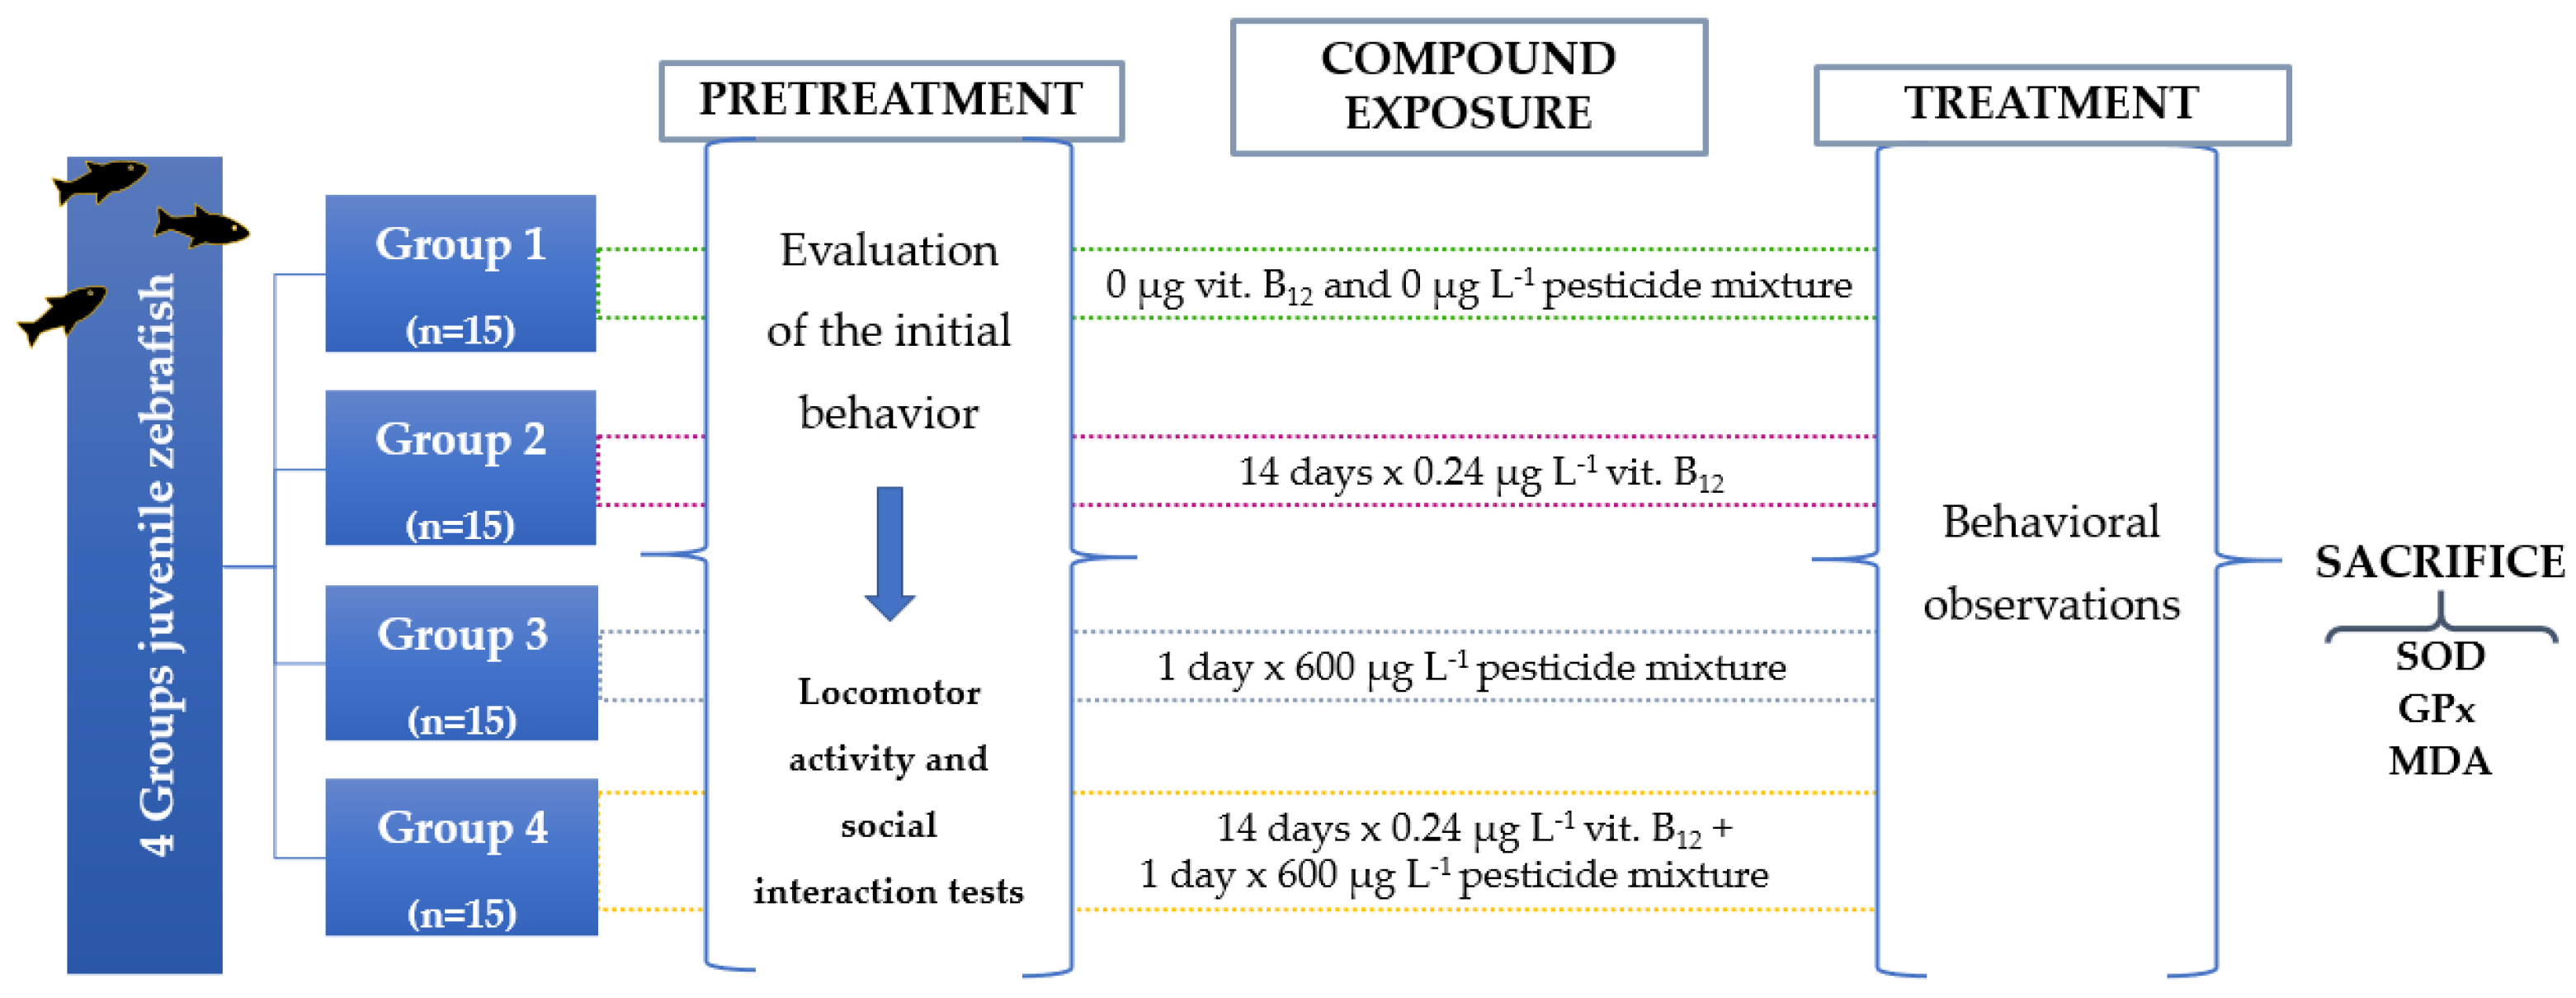
2.3. Experimental design
2.3. Behavioral tests
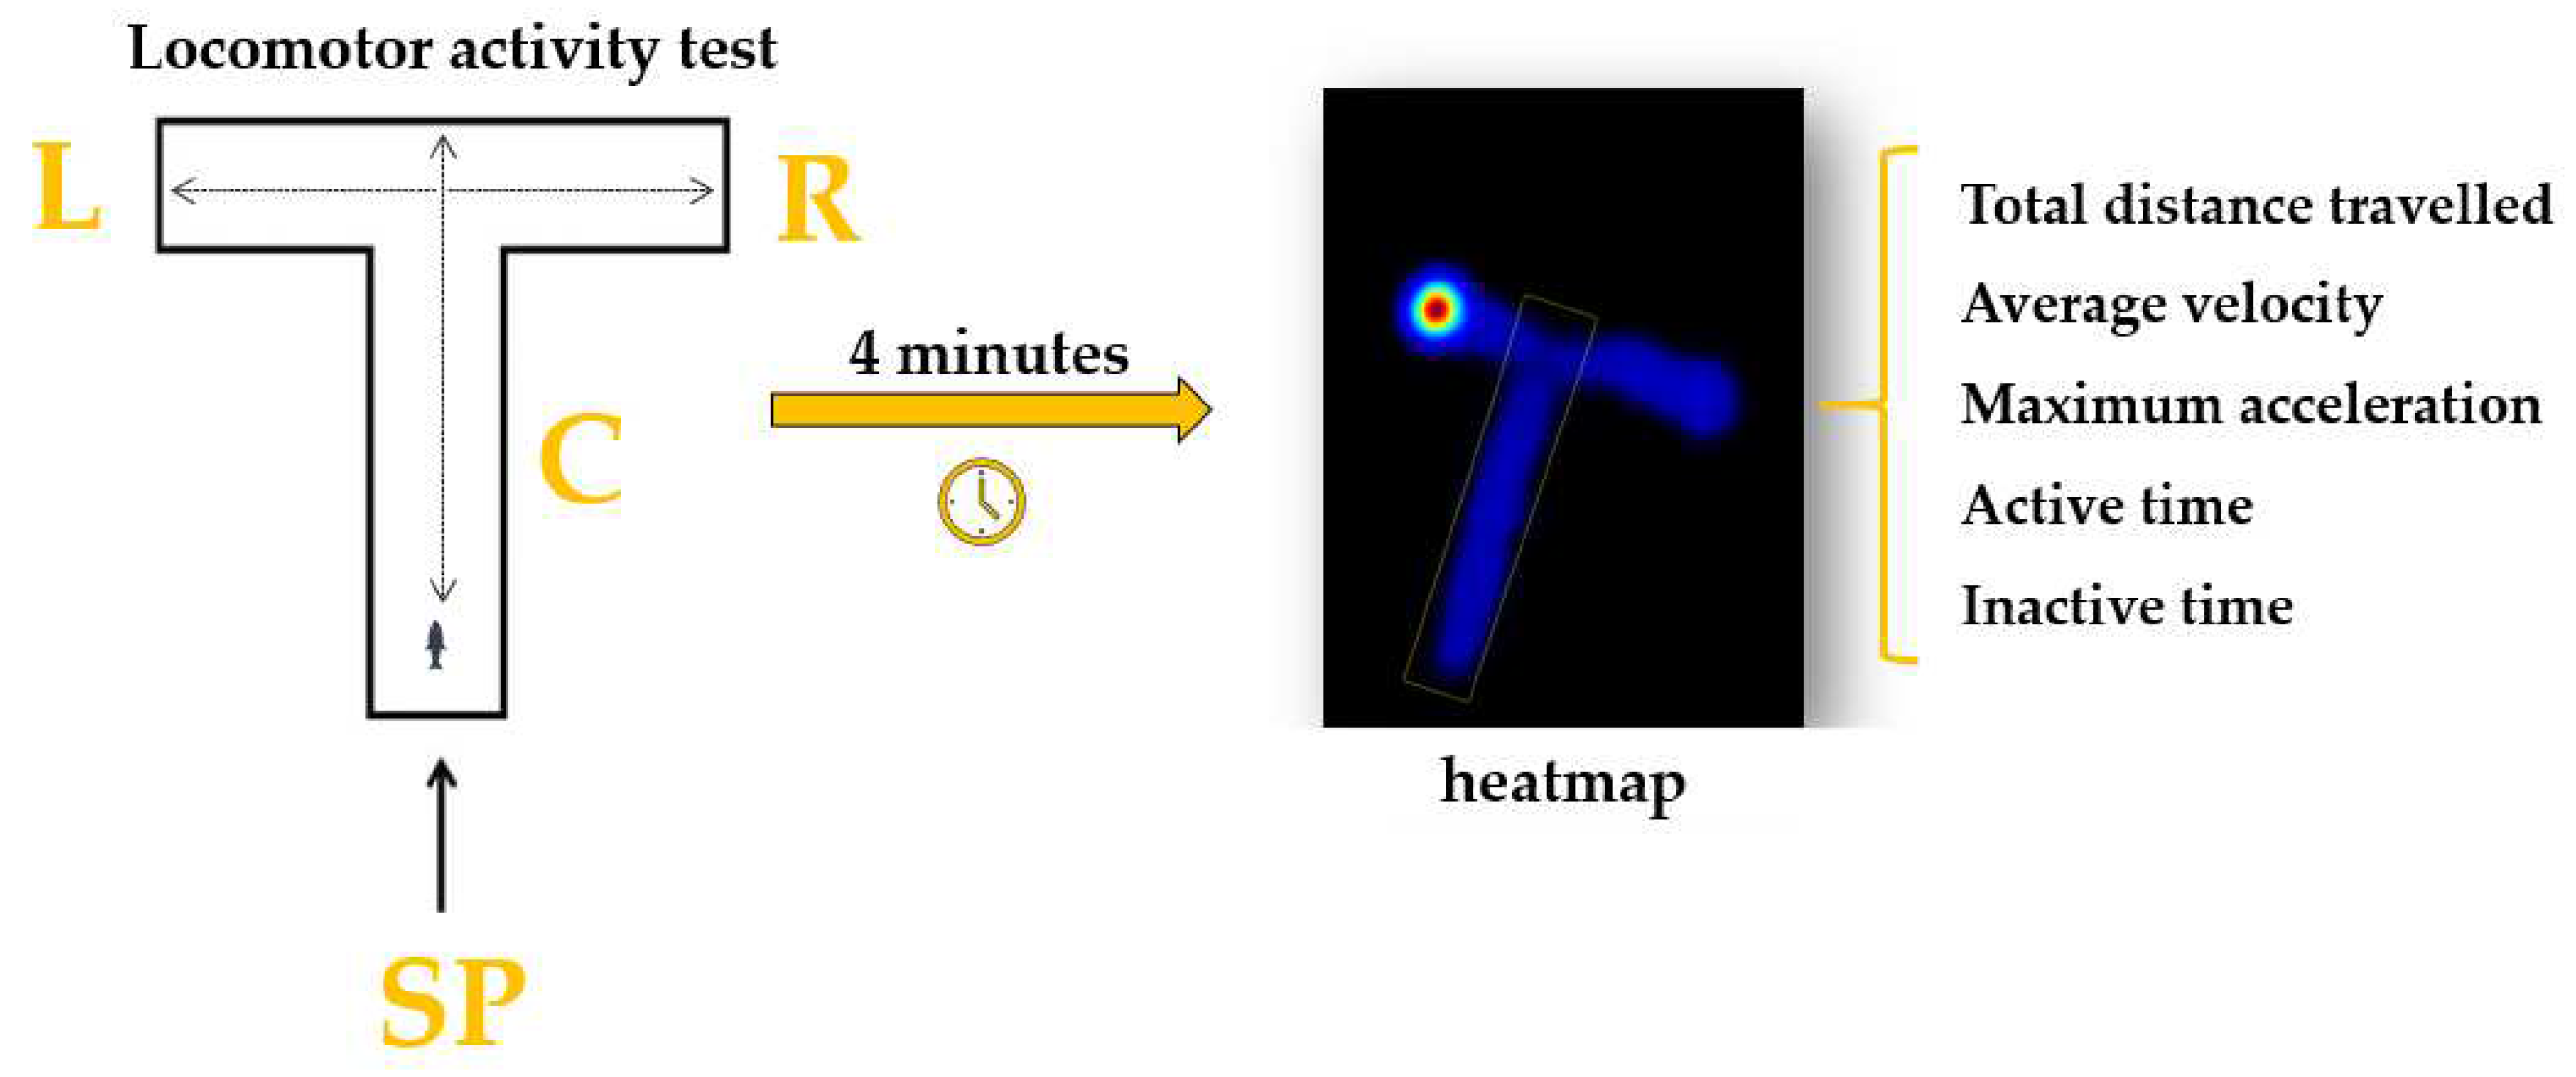
2.3.1. Locomotor activity test
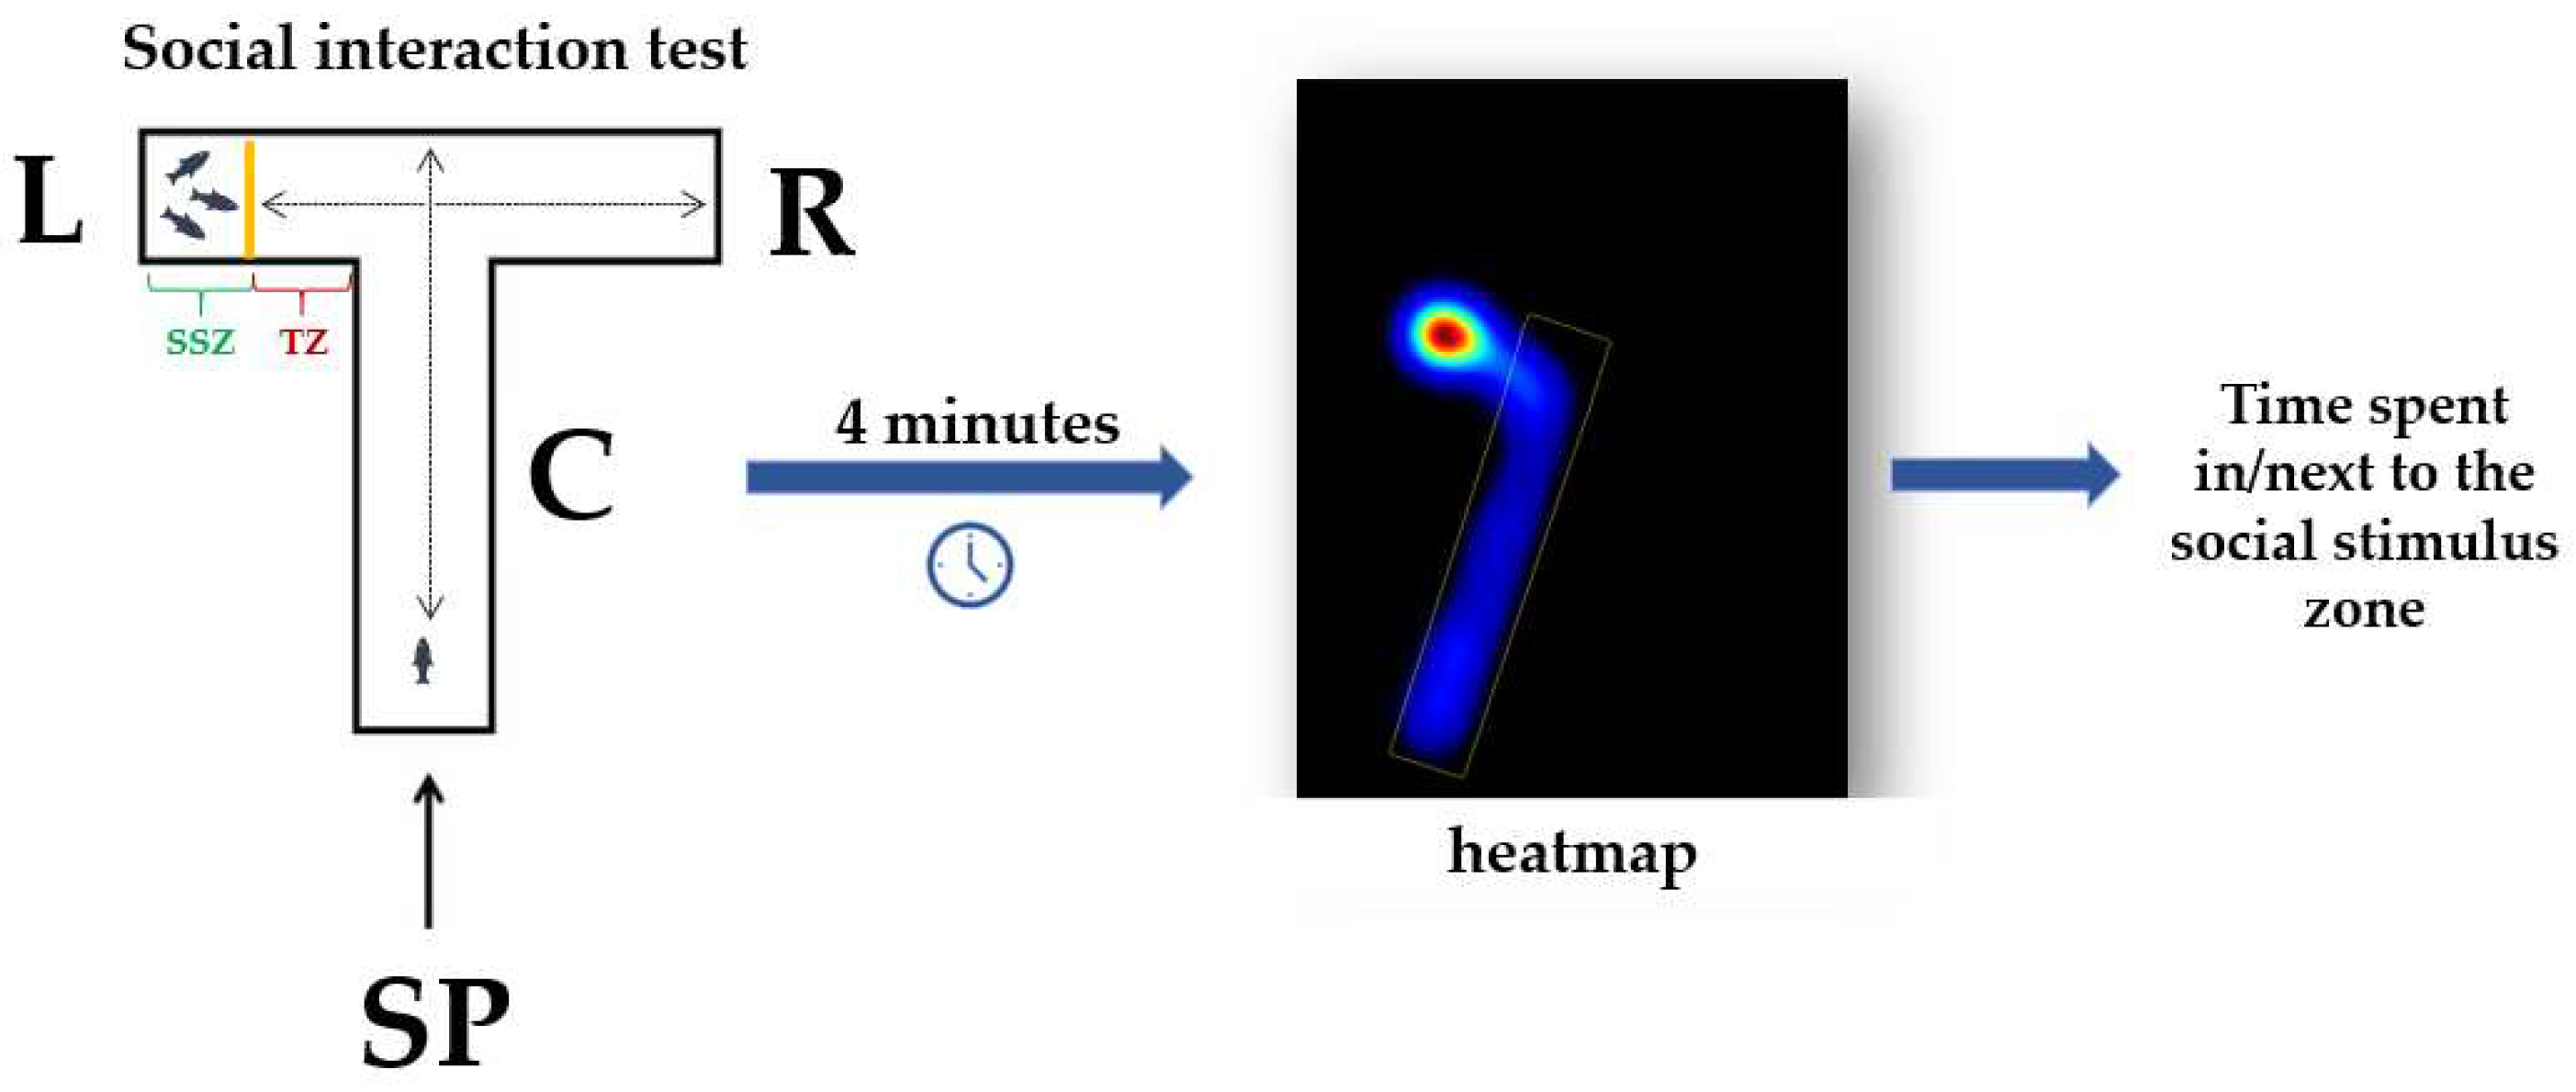
2.3.2. Social interaction test
2.4. Oxidative stress measurement
2.5. Statiscal analysis
2.6. Ethical note
3. Results
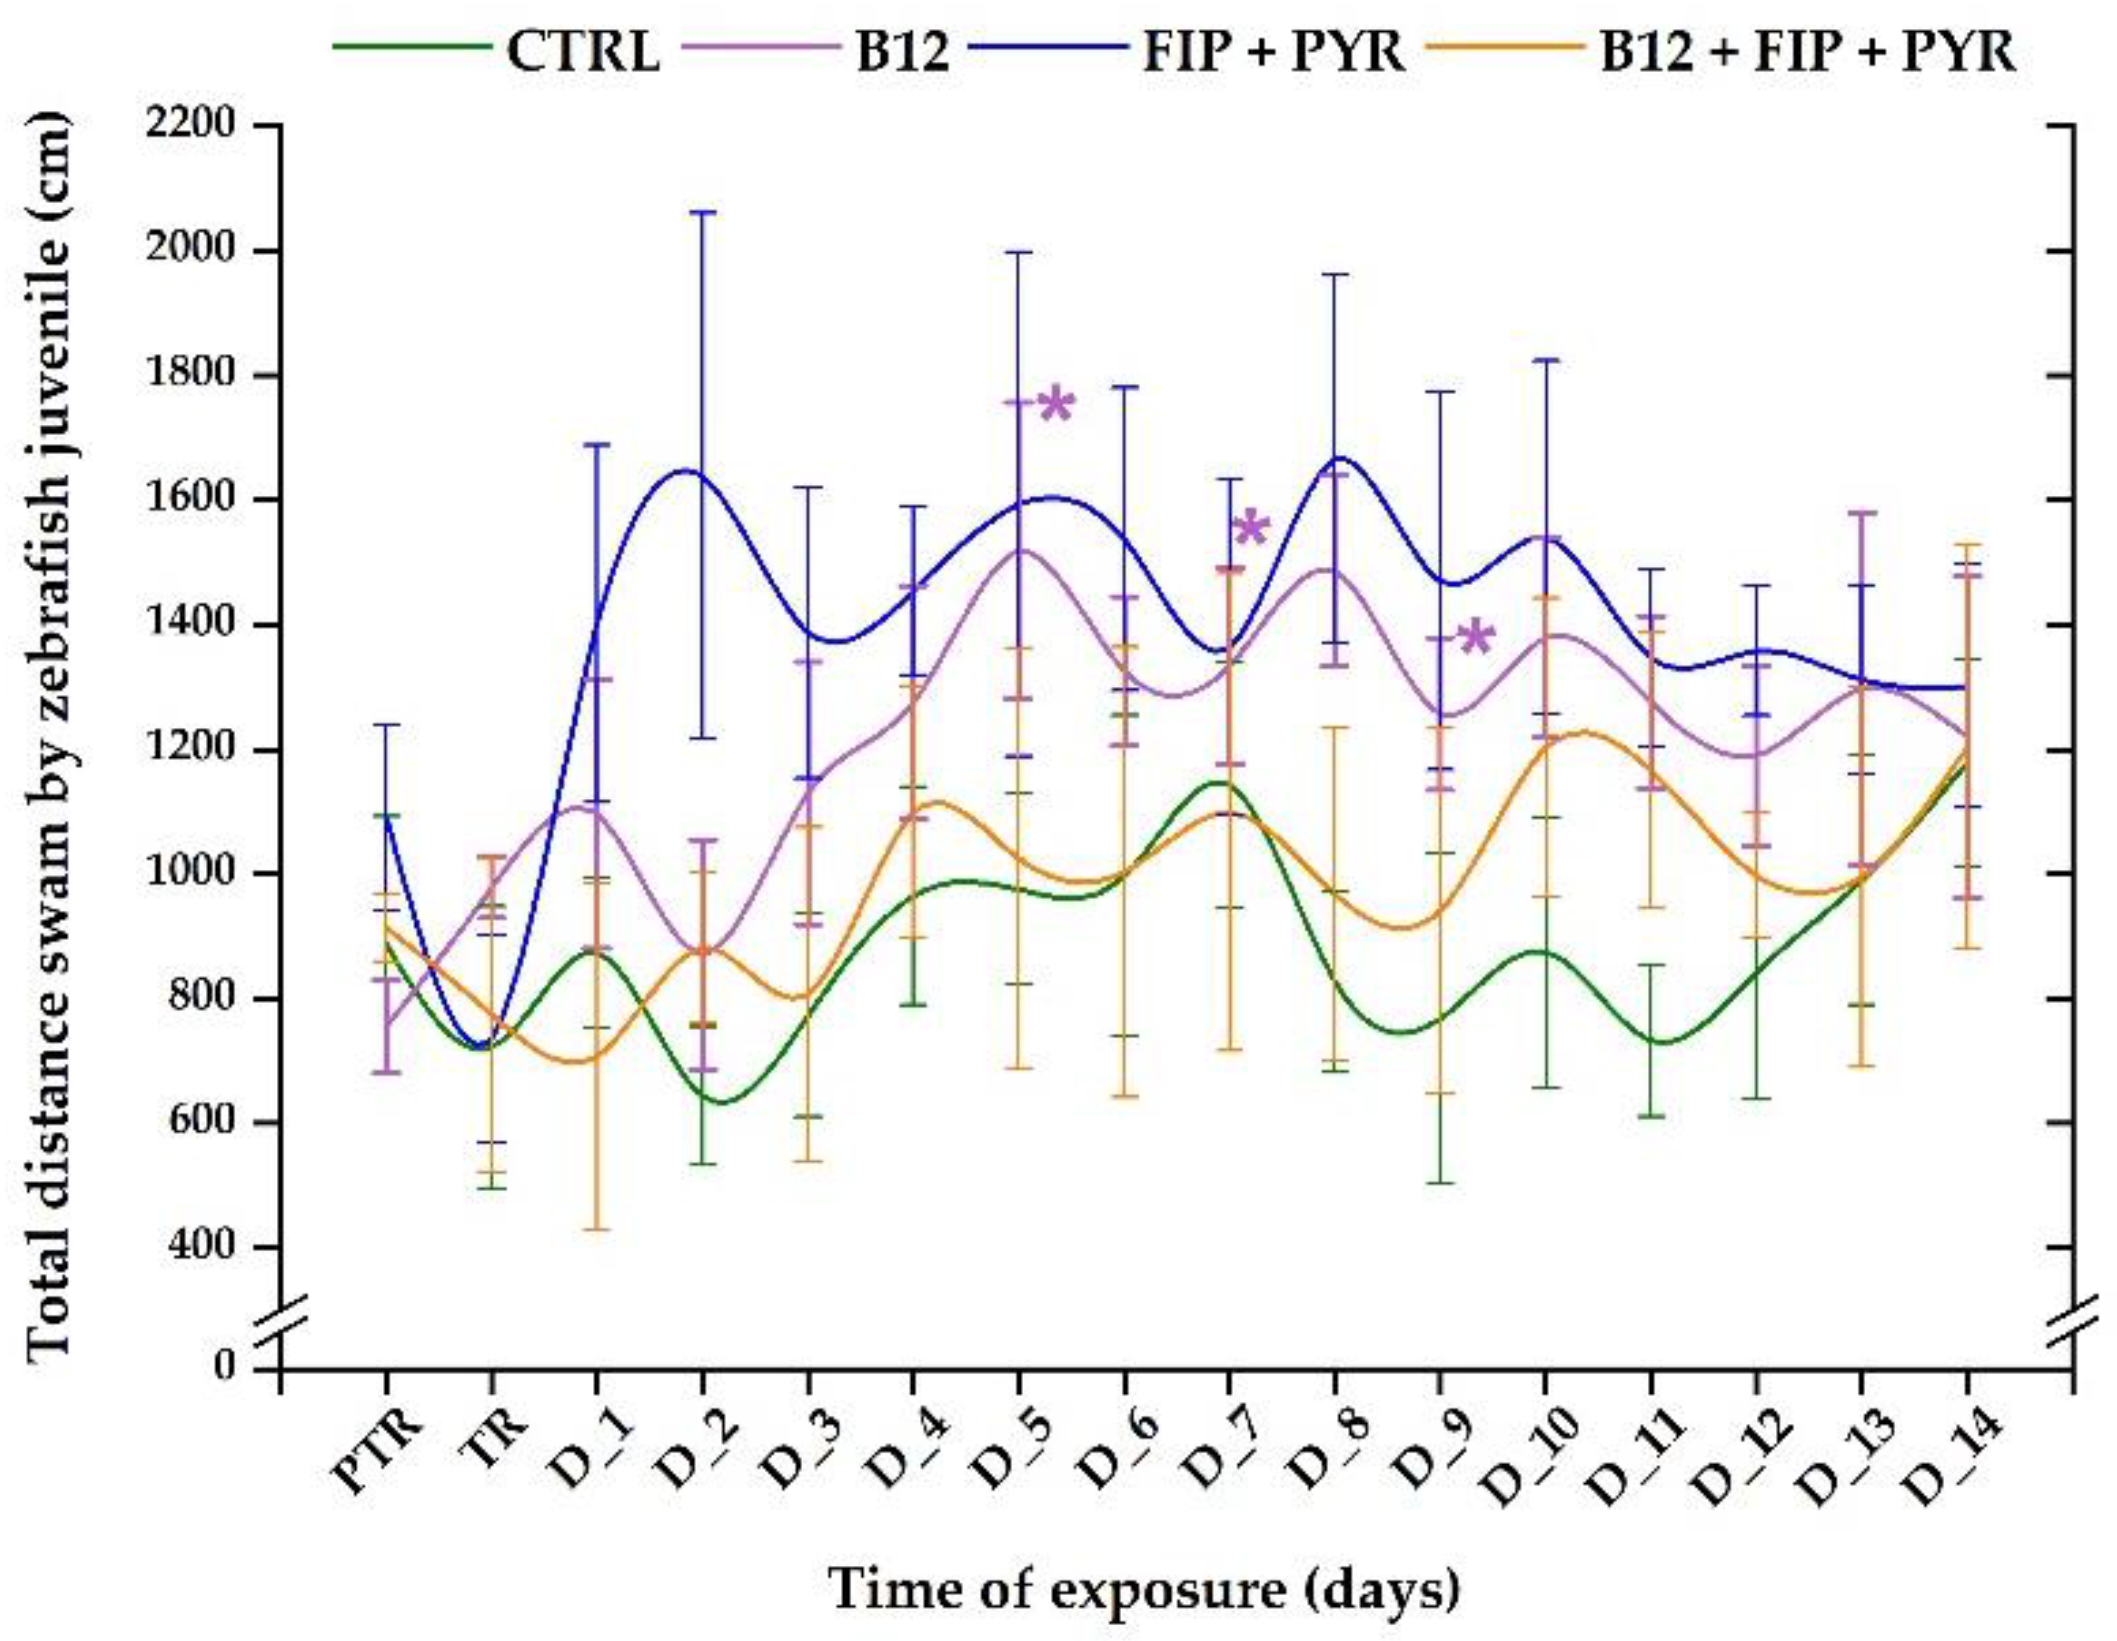
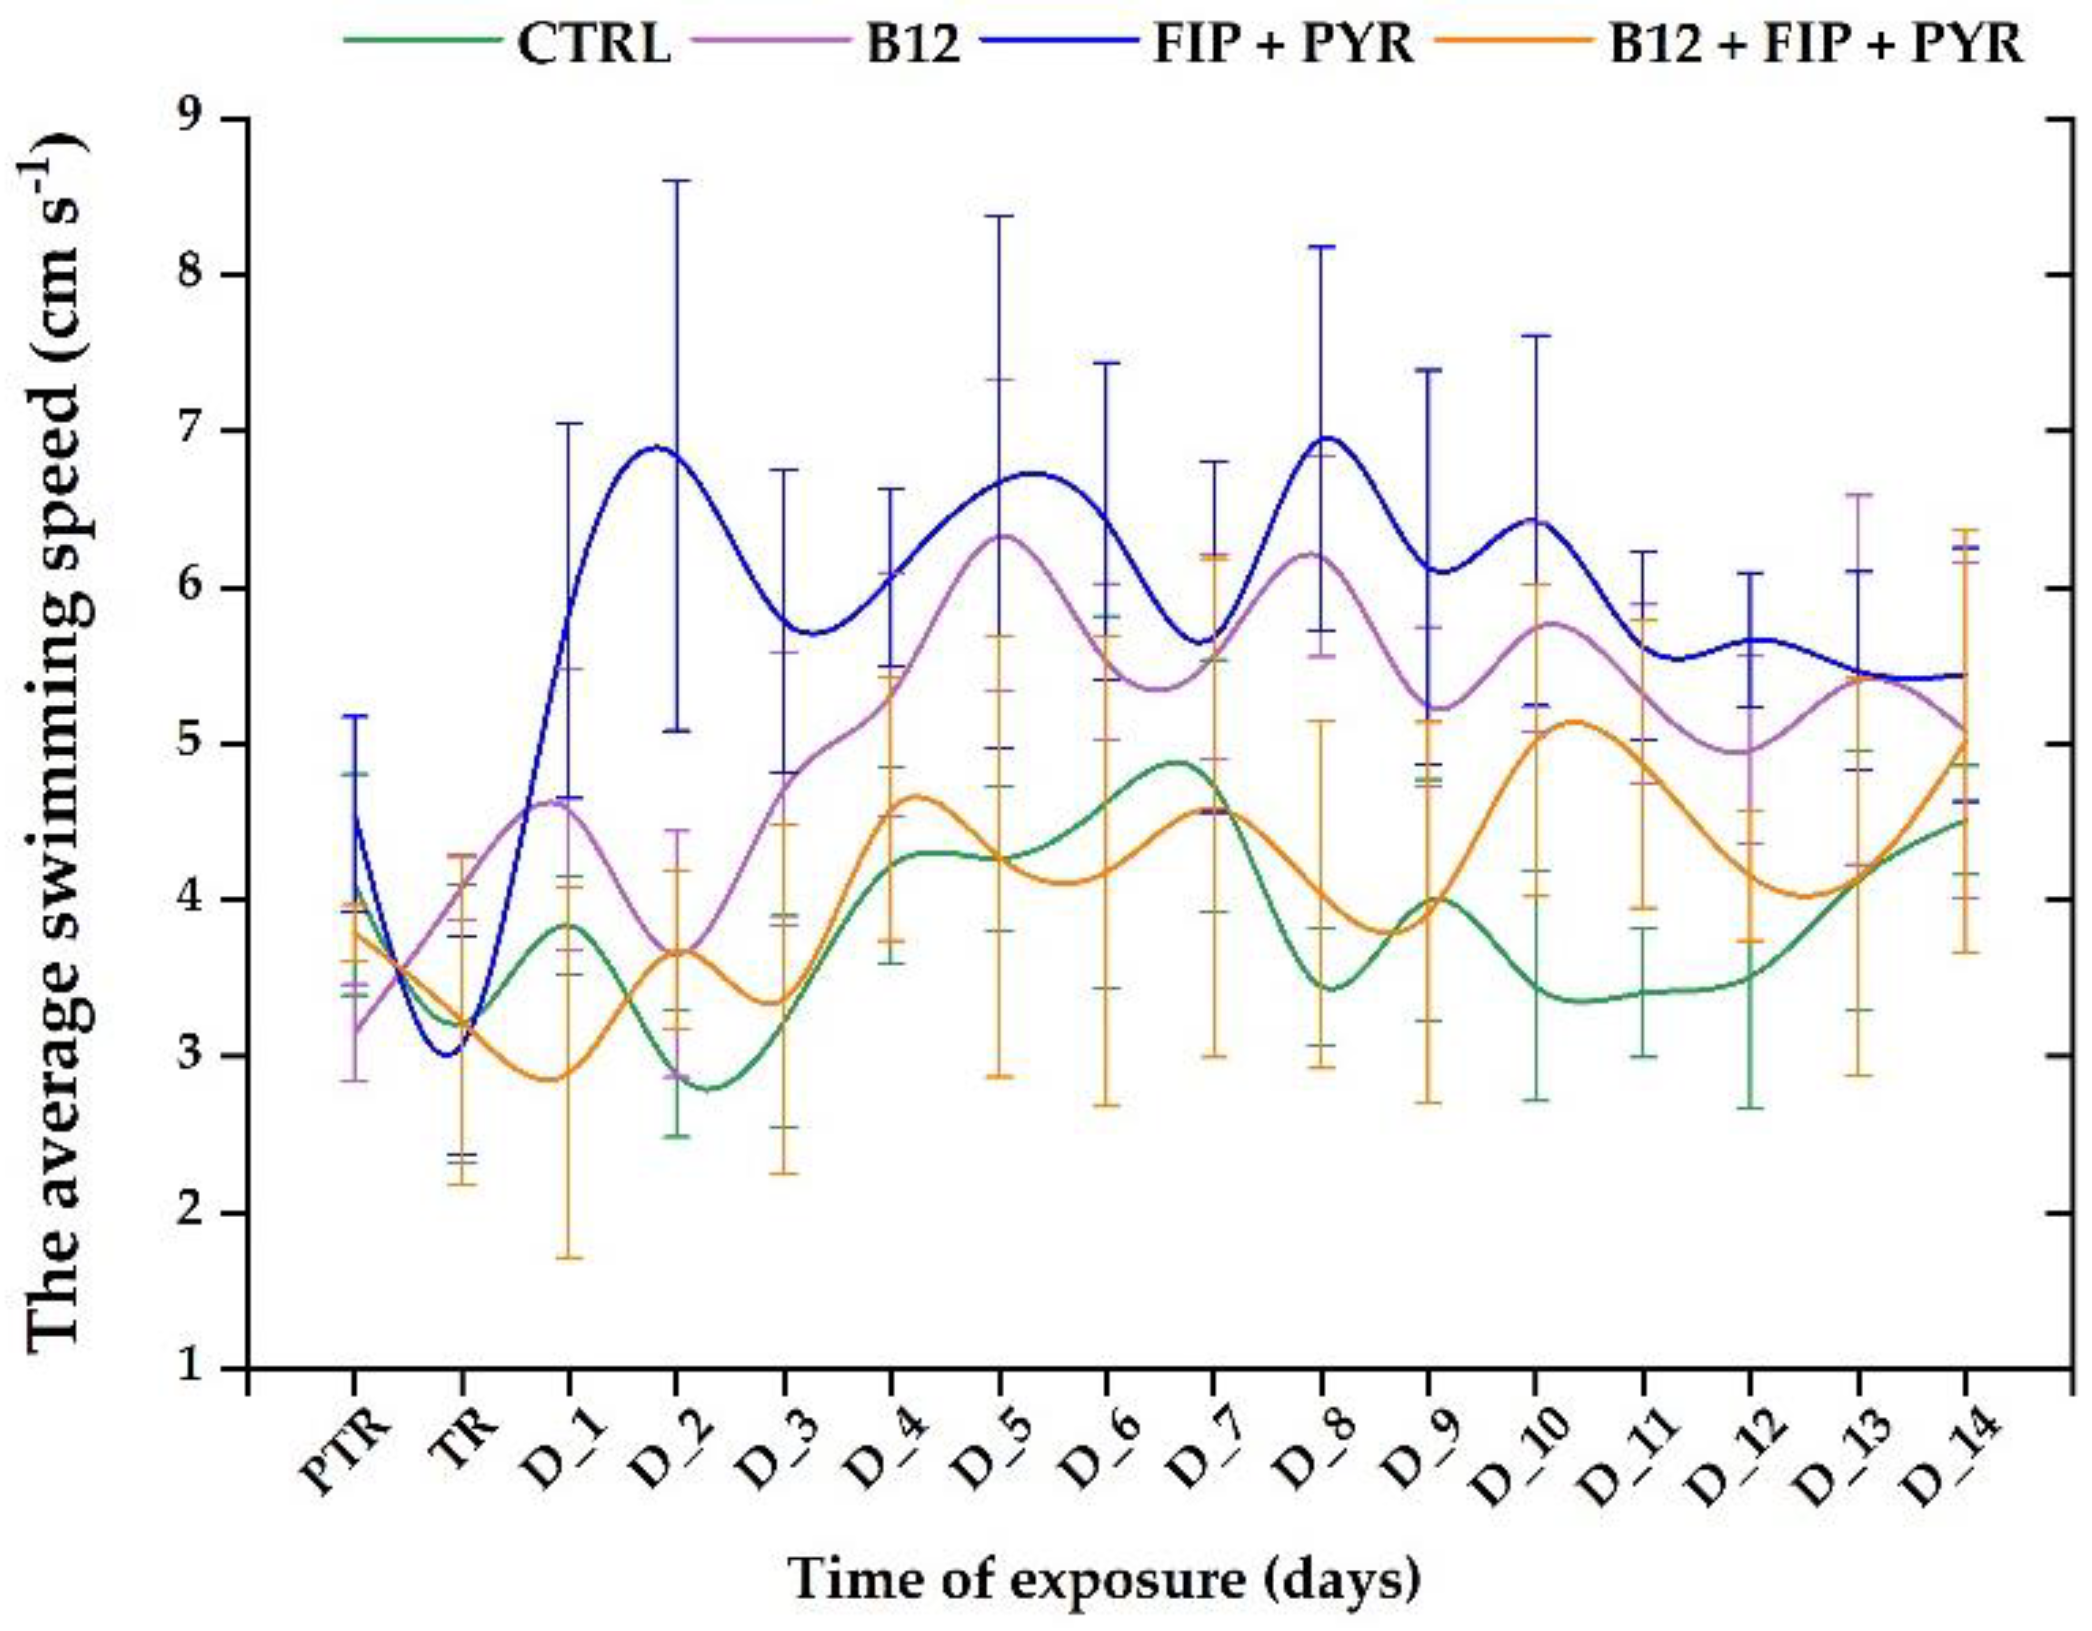
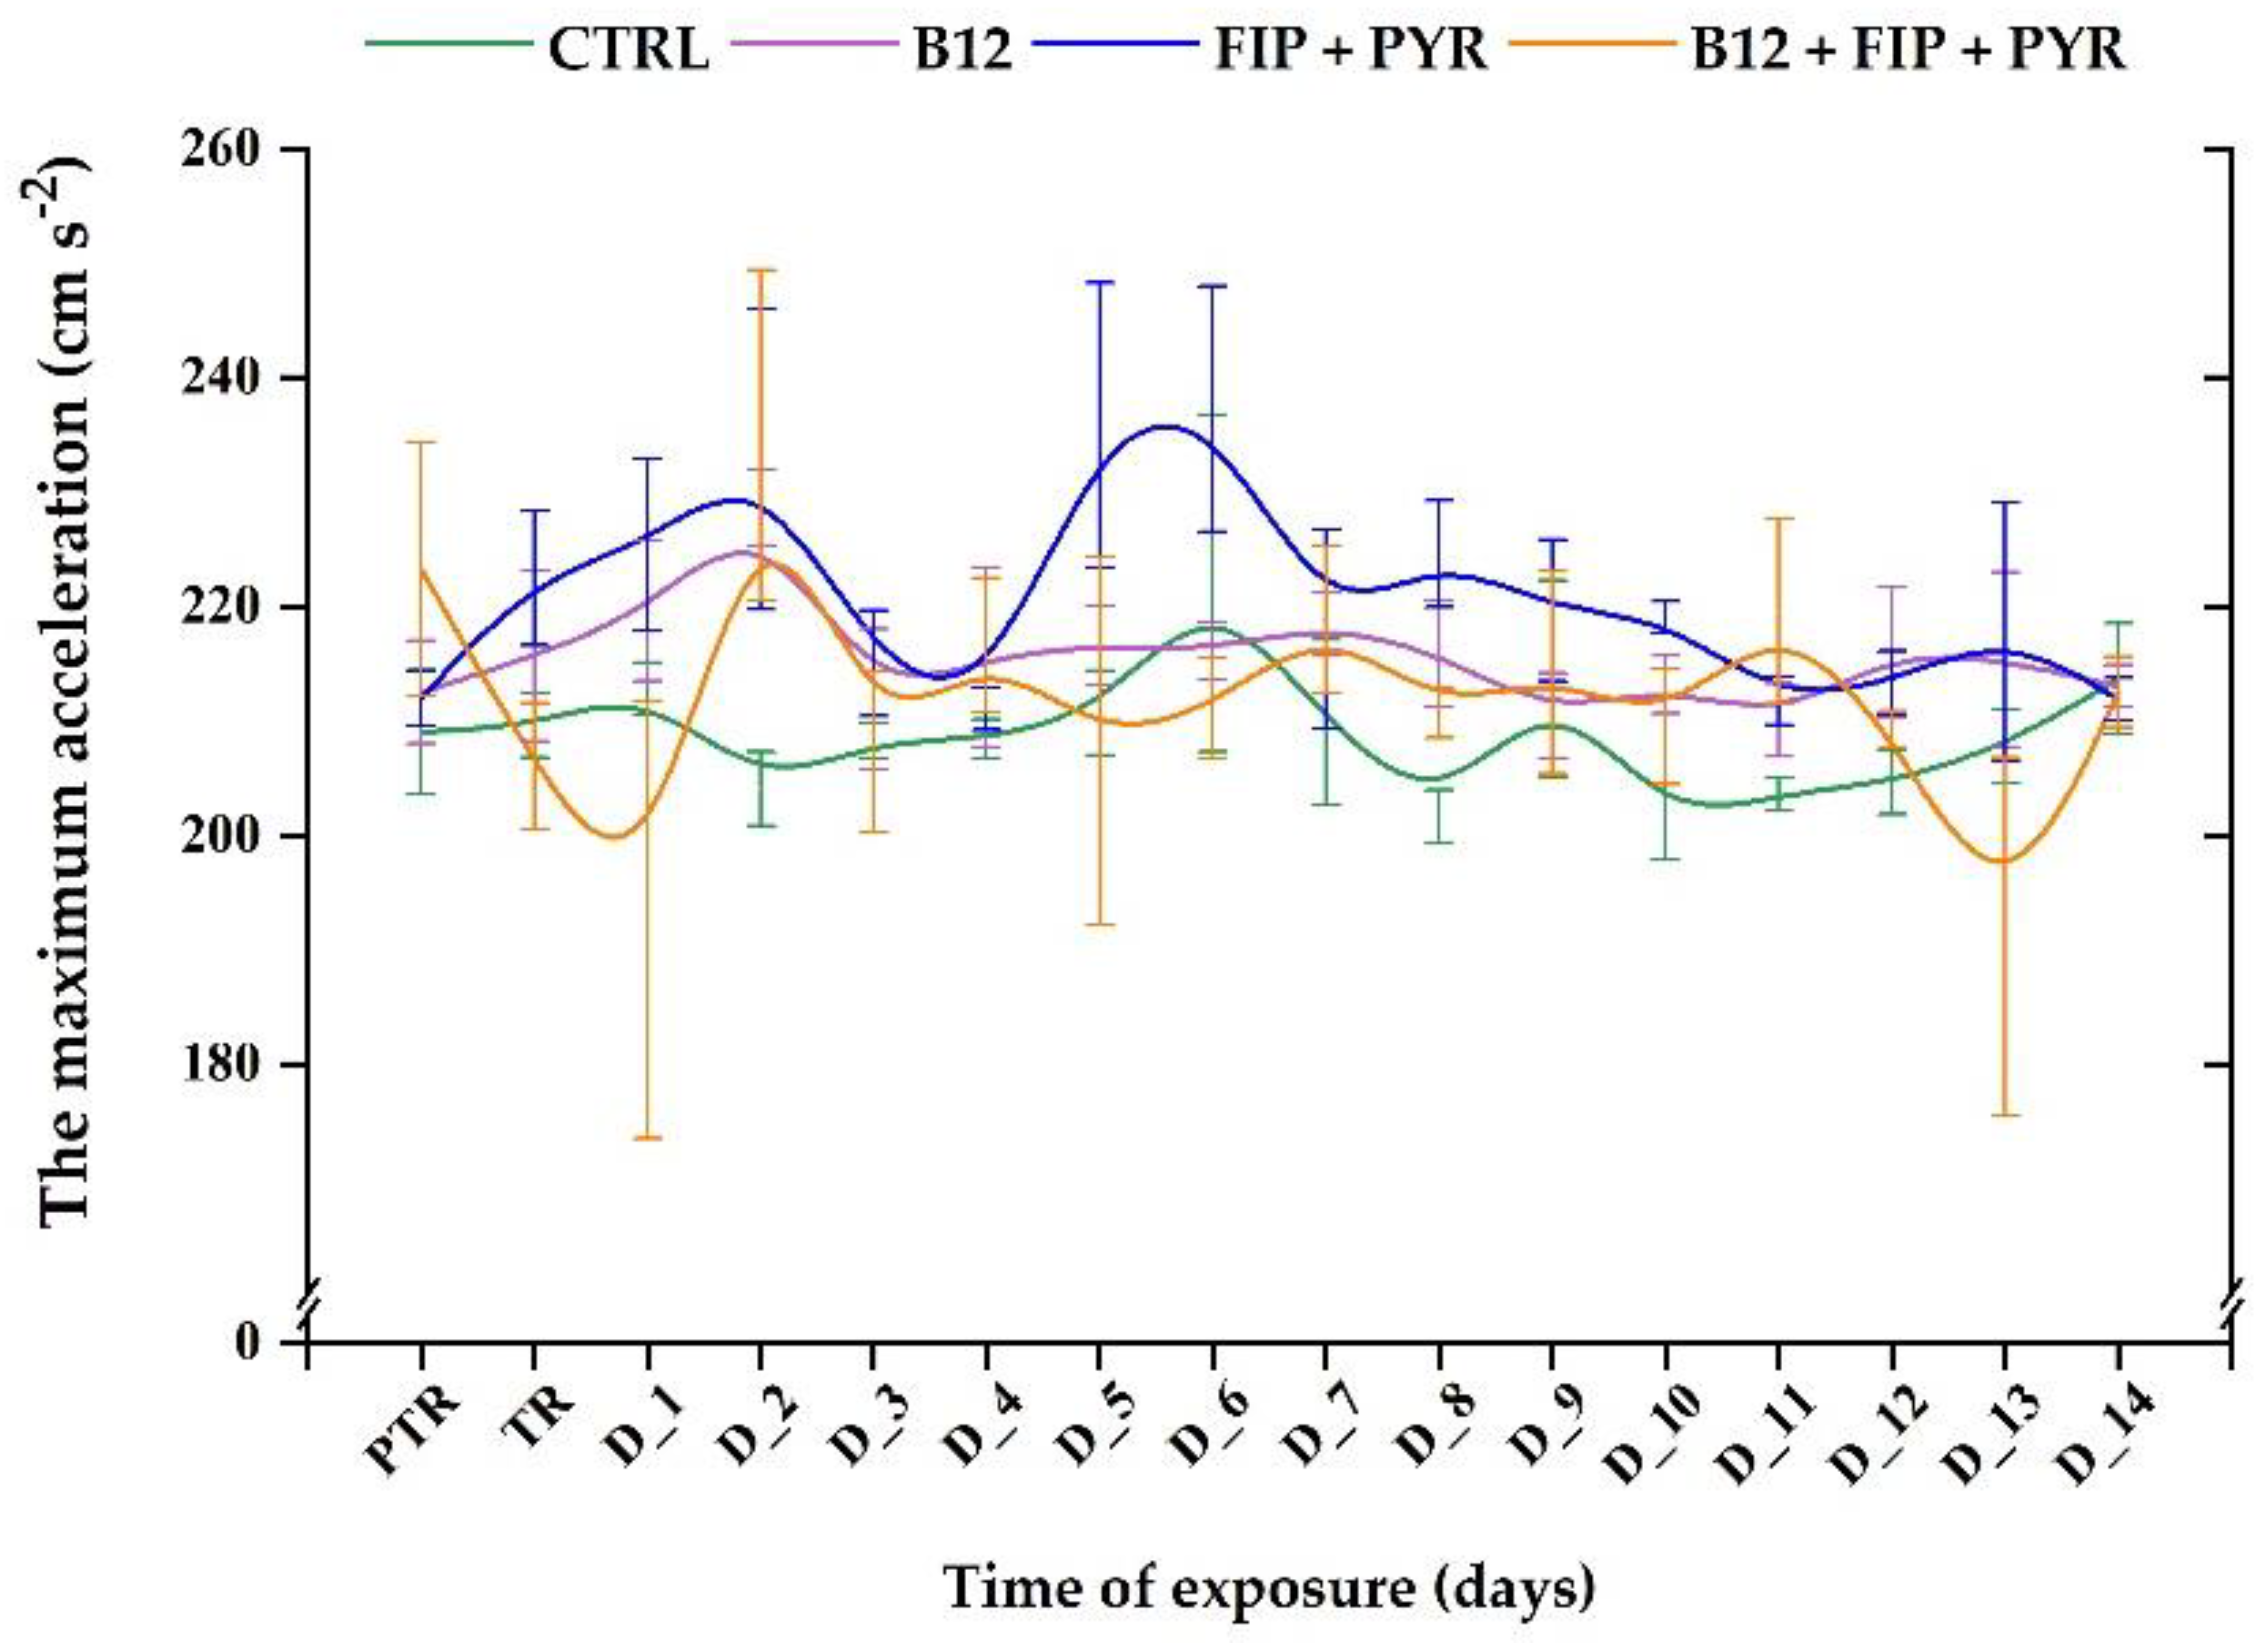
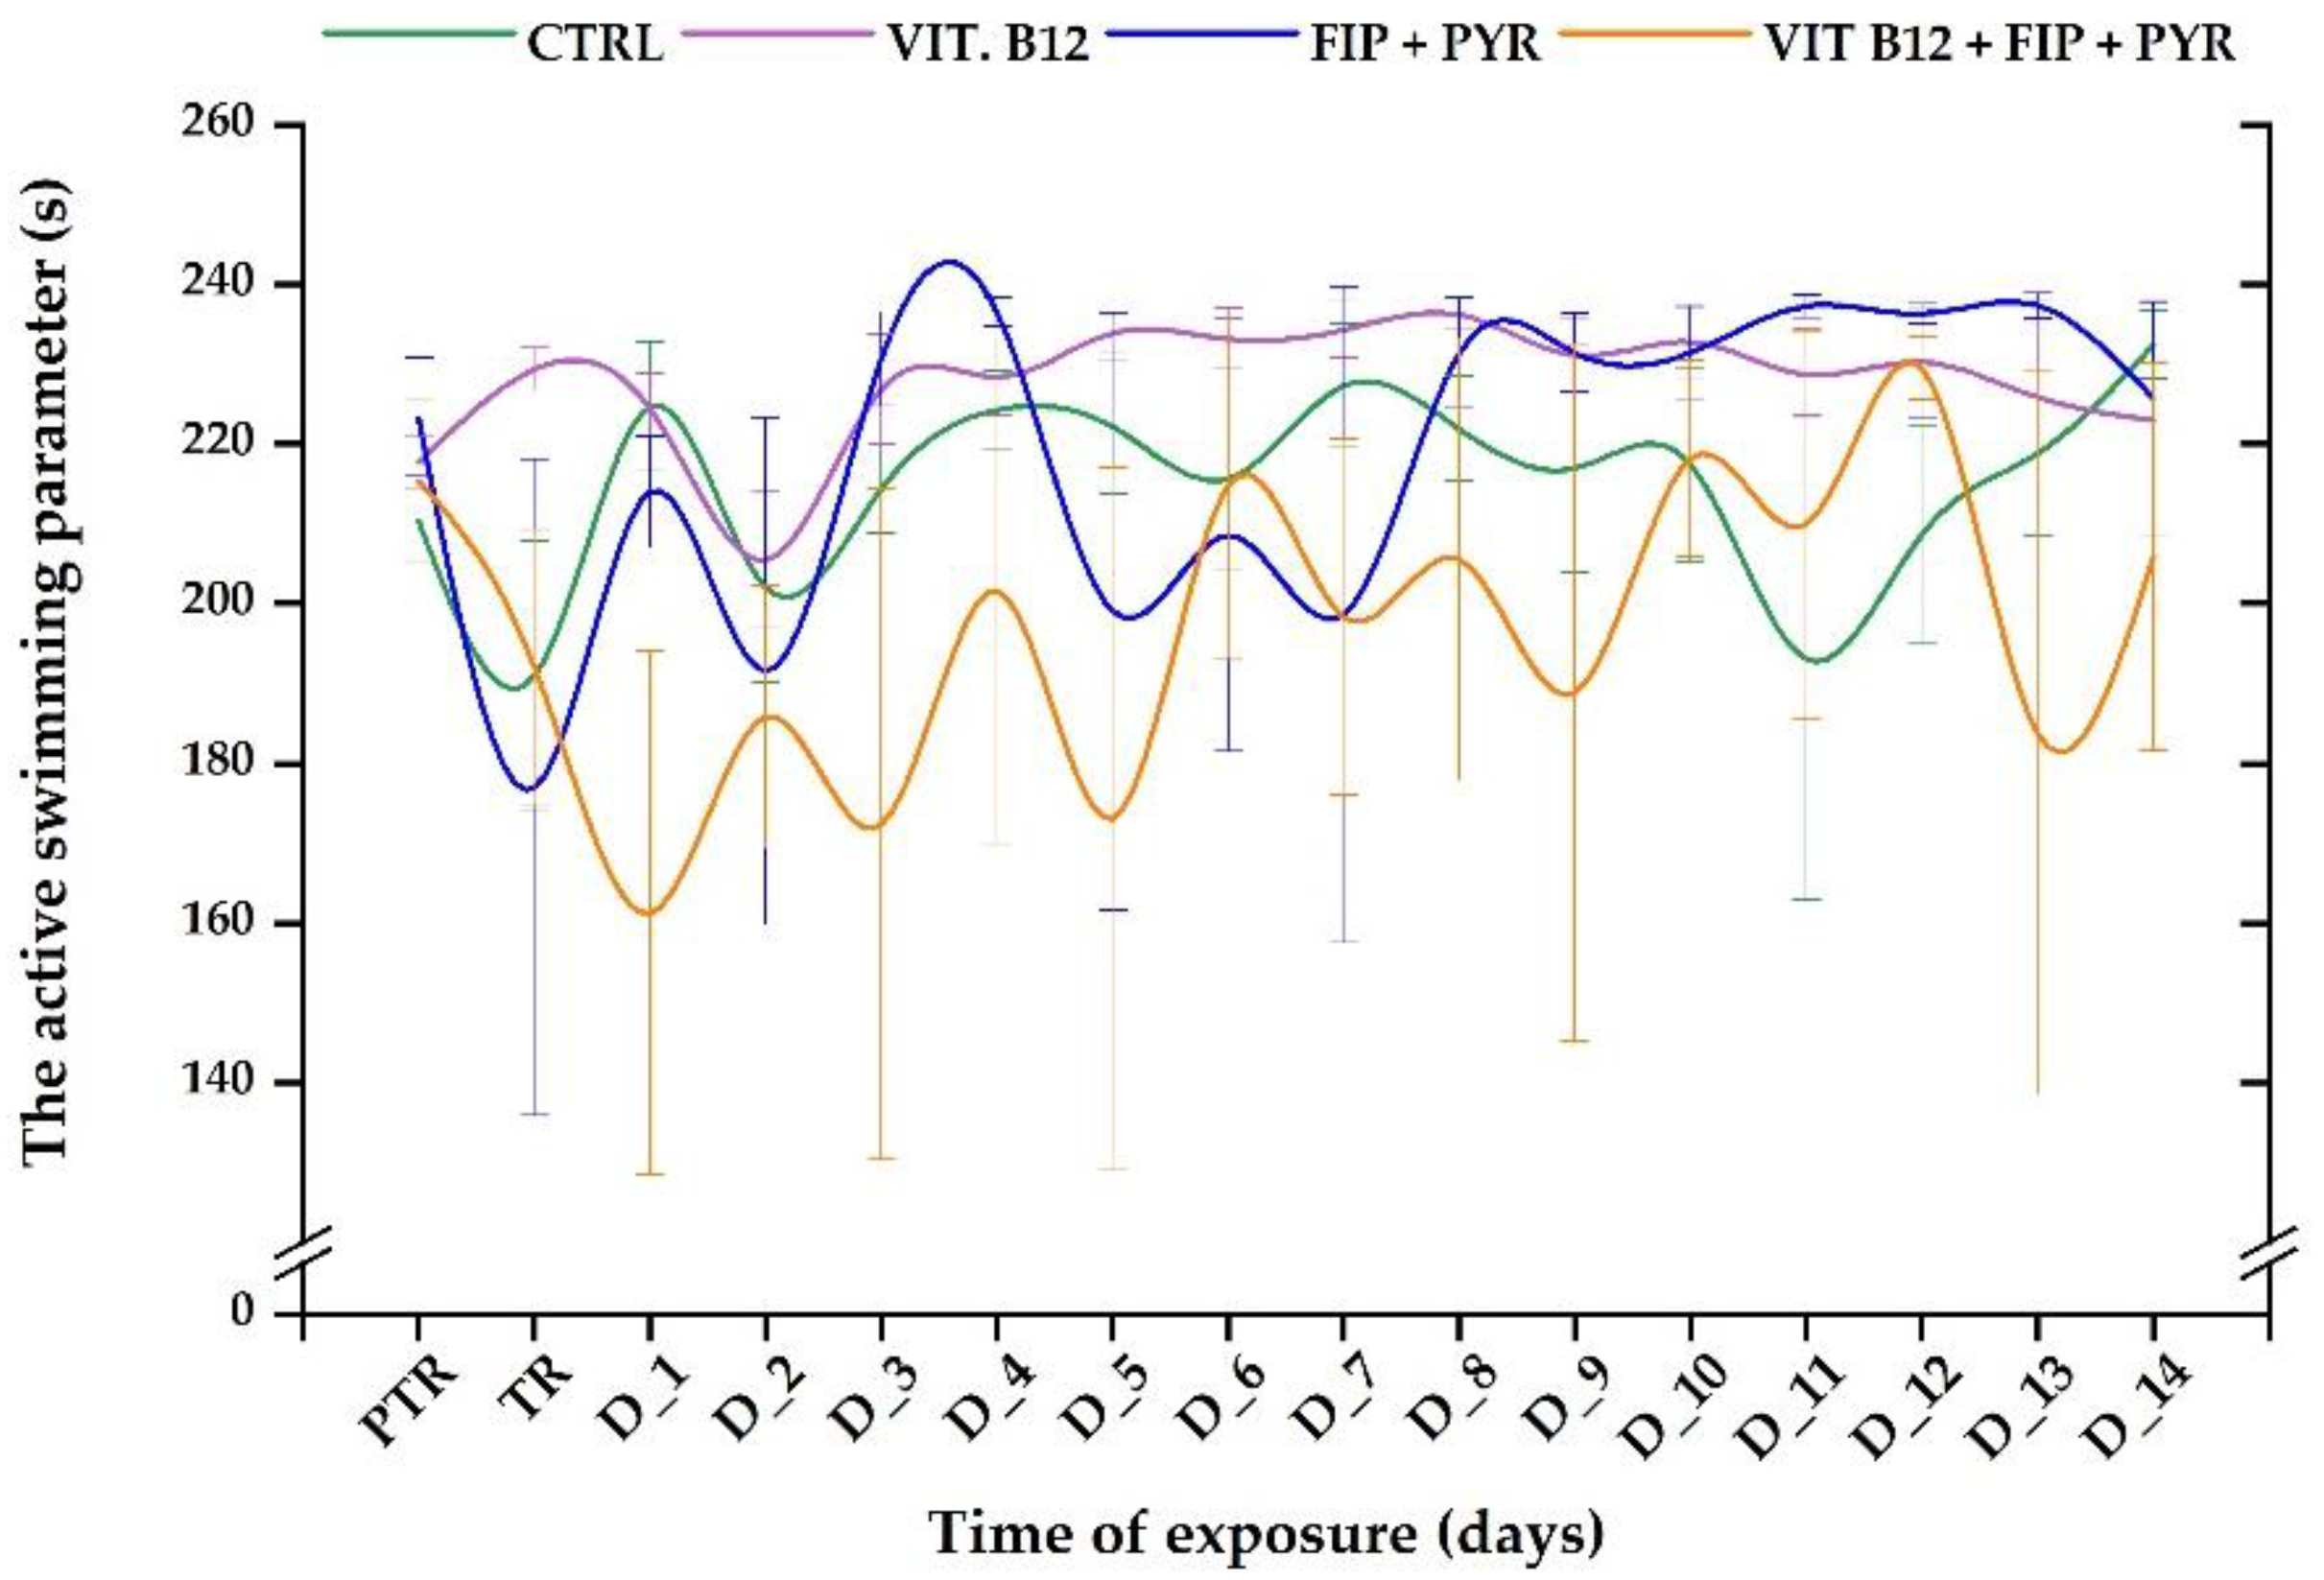
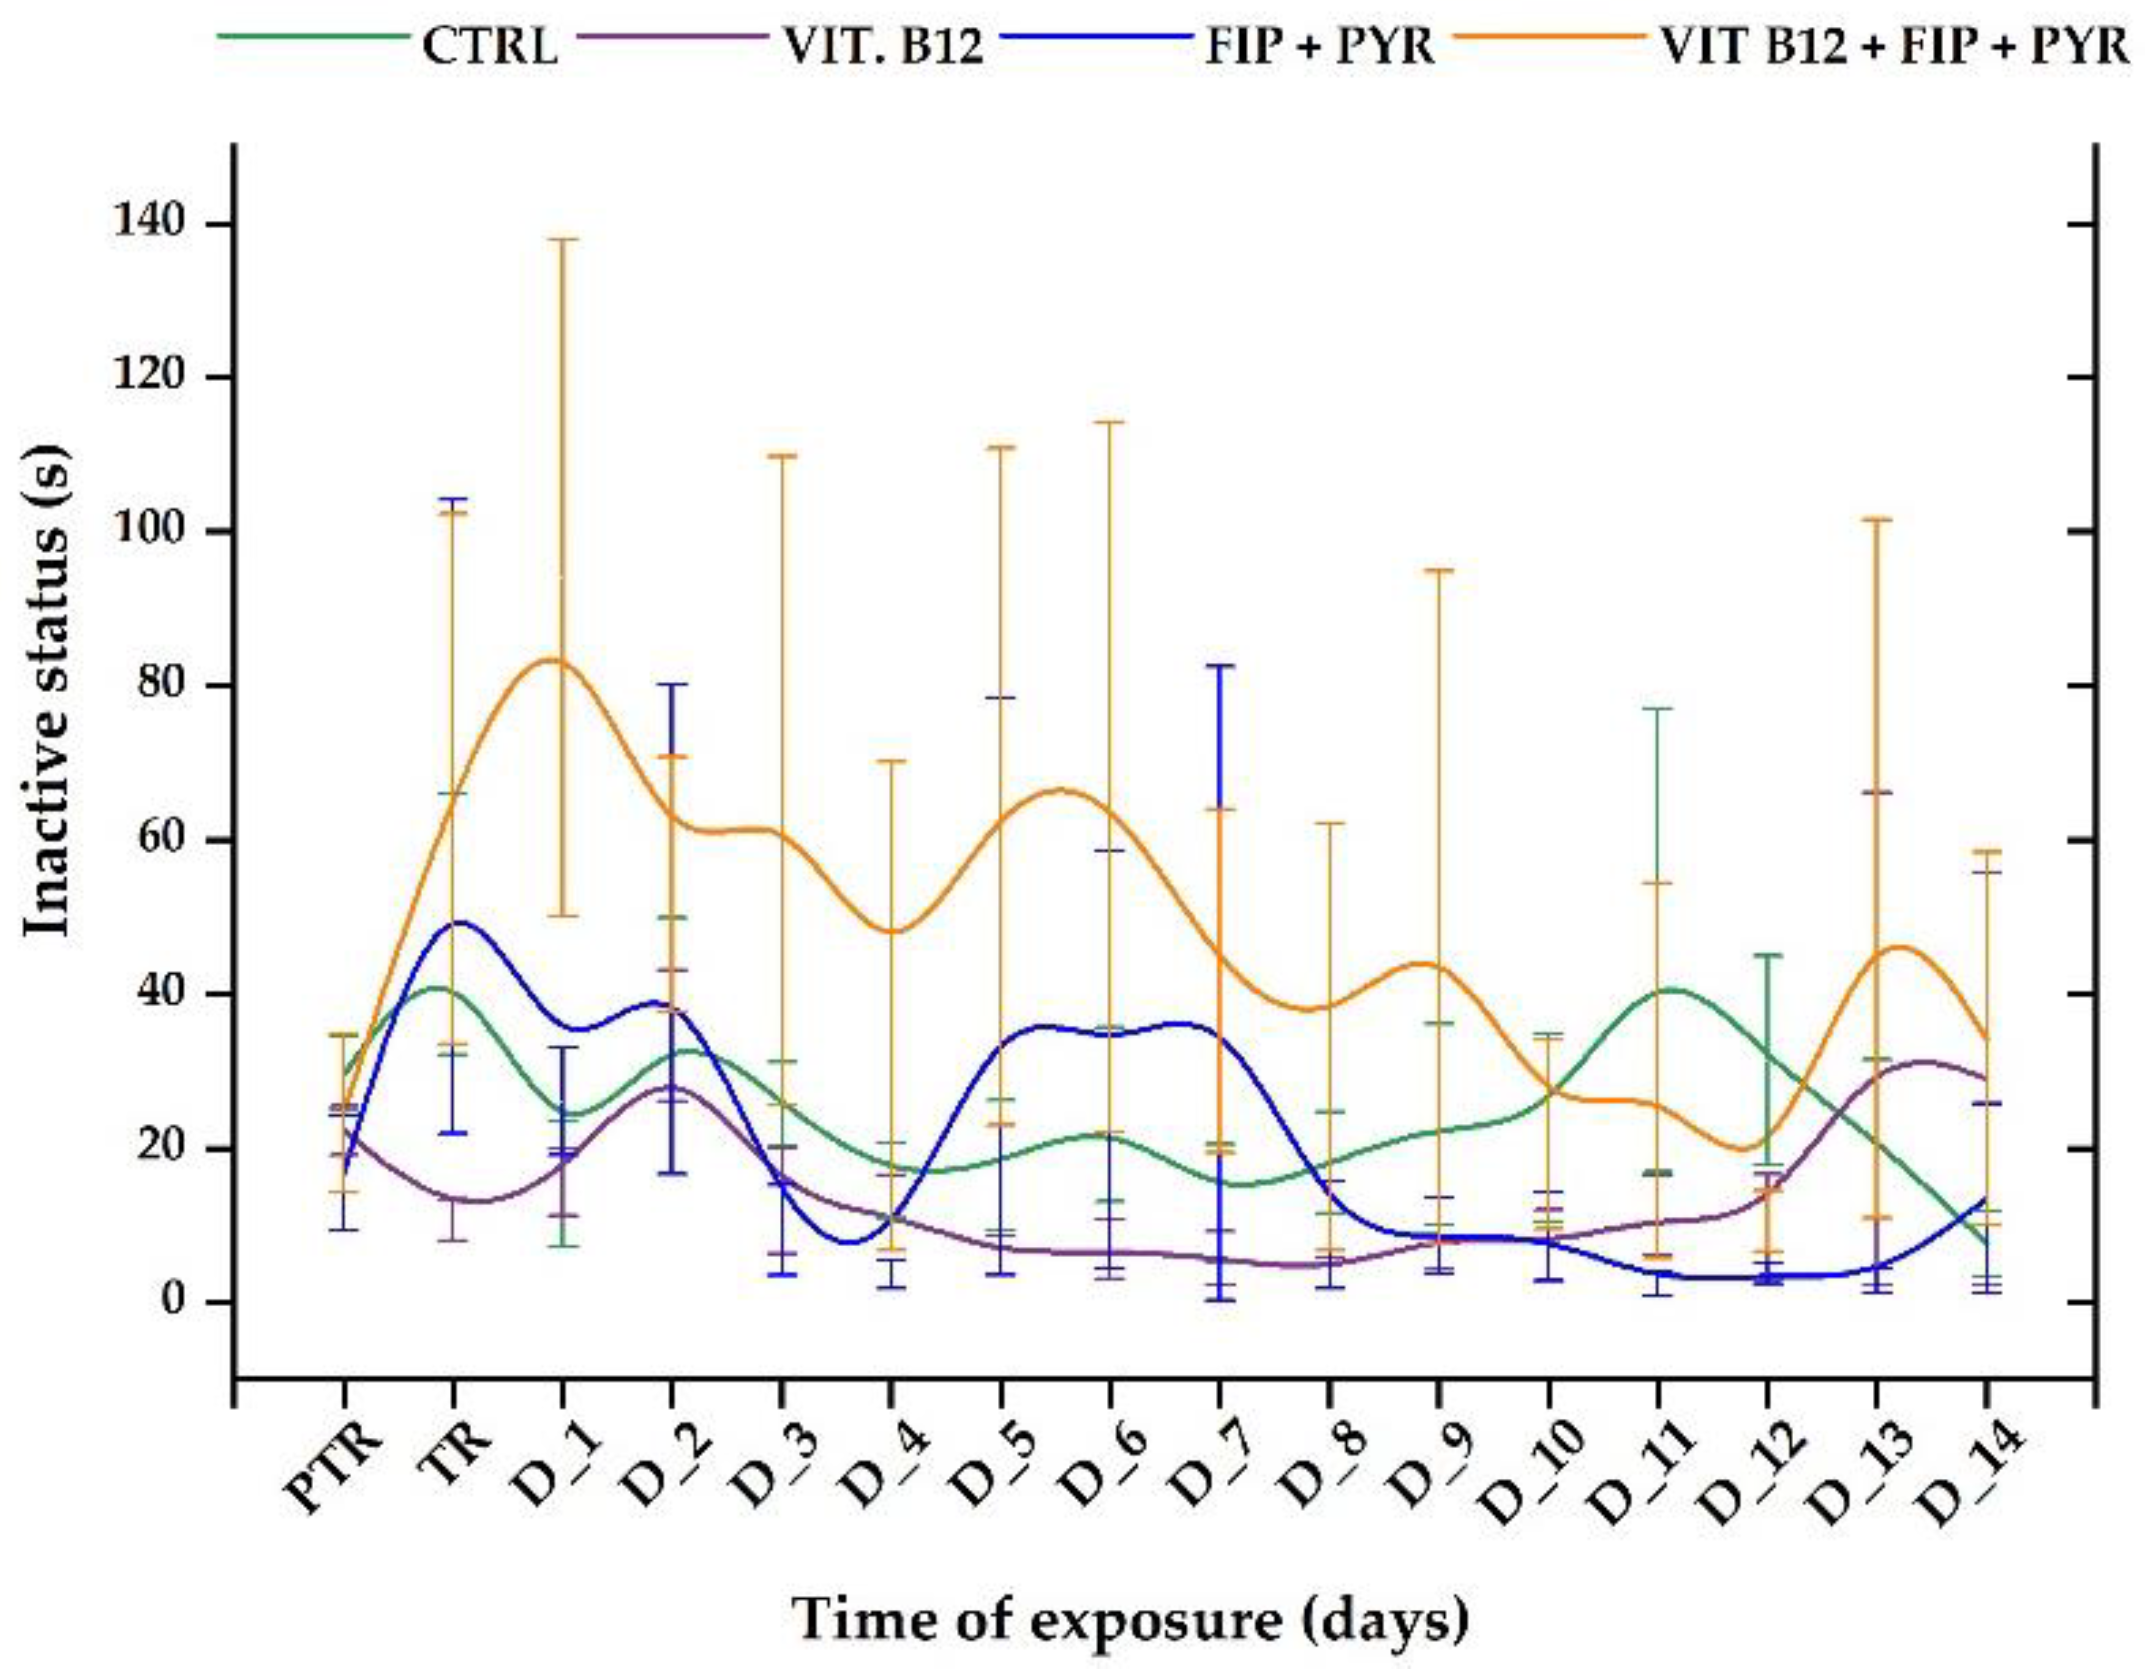
3.1. Short-term changes in locomotor activity due to the presence of vitamin B12
3.2. Impact of the presence of vitamin B12 on zebrafish social behavior
3.3. Antioxidant boost after vitamin B12 supplementation
4. Discussion
5. Conclusions
Author Contributions
Funding
Institutional Review Board Statement
Data Availability Statement
Conflicts of Interest
References
- Green, R.; Allen, L. H.; Bjorke-Monsen, A.-L.; Brito, A.; Gueant, J.-L.; Miller, J. W.; Molloy, A. M.; Nexo, E.; Stabler, S.; Toh, B.-H.; Ueland, P. M.; Yajnik, C. Vitamin B12 Deficiency. Nat. Rev. Dis. Prim. 2017, 3, 17040. [Google Scholar] [CrossRef] [PubMed]
- Calderón-Ospina, C. A.; Nava-Mesa, M. O. B Vitamins in the Nervous System: Current Knowledge of the Biochemical Modes of Action and Synergies of Thiamine, Pyridoxine, and Cobalamin. CNS Neurosci. Ther. 2020, 26(1), 5–13. [Google Scholar] [CrossRef] [PubMed]
- Briani, C.; Dalla Torre, C.; Citton, V.; Manara, R.; Pompanin, S.; Binotto, G.; Adami, F. Cobalamin Deficiency: Clinical Picture and Radiological Findings. Nutrients 2013, 5(11), 4521–4539. [Google Scholar] [CrossRef] [PubMed]
- Zhang, Y.; Hodgson, N. W.; Trivedi, M. S.; Abdolmaleky, H. M.; Fournier, M.; Cuenod, M.; Do, K. Q.; Deth, R. C. Decreased Brain Levels of Vitamin B12 in Aging, Autism and Schizophrenia. PLoS One 2016, 11(1), e0146797–e0146797. [Google Scholar] [CrossRef]
- Serin, H. M.; Arslan, E. A. Neurological Symptoms of Vitamin B12 Deficiency: Analysis of Pediatric Patients. Acta Clin. Croat. 2019, 58(2), 295–302. [Google Scholar] [CrossRef] [PubMed]
- Froese, D. S.; Kopec, J.; Fitzpatrick, F.; Schuller, M.; McCorvie, T. J.; Chalk, R.; Plessl, T.; Fettelschoss, V.; Fowler, B.; Baumgartner, M. R.; Yue, W. W. Structural Insights into the MMACHC-MMADHC Protein Complex Involved in Vitamin B12 Trafficking. J. Biol. Chem. 2015, 290(49), 29167–29177. [Google Scholar] [CrossRef] [PubMed]
- Hayden, M. R.; Tyagi, S. C. Homocysteine and Reactive Oxygen Species in Metabolic Syndrome, Type 2 Diabetes Mellitus, and Atheroscleropathy: The Pleiotropic Effects of Folate Supplementation. Nutr. J. 2004, 3, 4. [Google Scholar] [CrossRef]
- Sies, H.; Berndt, C.; Jones, D. P. Oxidative Stress. Annu. Rev. Biochem. 2017, 86(1), 715–748. [Google Scholar] [CrossRef] [PubMed]
- Manivasagam, T.; Arunadevi, S.; Essa, M. M.; SaravanaBabu, C.; Borah, A.; Thenmozhi, A. J.; Qoronfleh, M. W. Role of Oxidative Stress and Antioxidants in Autism. Adv. Neurobiol. 2020, 24, 193–206. [Google Scholar] [CrossRef]
- Liu, X.; Lin, J.; Zhang, H.; Khan, N. U.; Zhang, J.; Tang, X.; Cao, X.; Shen, L. Oxidative Stress in Autism Spectrum Disorder-Current Progress of Mechanisms and Biomarkers. Front. psychiatry 2022, 13, 813304. [Google Scholar] [CrossRef]
- Sies, H. Oxidative Stress: Concept and Some Practical Aspects. Antioxidants (Basel, Switzerland) 2020, 9(9). [Google Scholar] [CrossRef] [PubMed]
- Jelinek, M.; Jurajda, M.; Duris, K. Oxidative Stress in the Brain: Basic Concepts and Treatment Strategies in Stroke. Antioxidants (Basel, Switzerland) 2021, 10(12). [Google Scholar] [CrossRef] [PubMed]
- Pangrazzi, L.; Balasco, L.; Bozzi, Y. Oxidative Stress and Immune System Dysfunction in Autism Spectrum Disorders. Int. J. Mol. Sci. 2020, 21(9), 3293. [Google Scholar] [CrossRef] [PubMed]
- Fakhoury, M. Autistic Spectrum Disorders: A Review of Clinical Features, Theories and Diagnosis. Int. J. Dev. Neurosci. 2015, 43, 70–77. [Google Scholar] [CrossRef] [PubMed]
- Lord, C.; Elsabbagh, M.; Baird, G.; Veenstra-Vanderweele, J. Autism Spectrum Disorder. Lancet (London, England) 2018, 392(10146), 508–520. [Google Scholar] [CrossRef]
- Wormwood, K. L.; Charette, L.; Ryan, J. P.; Darie, C. C.; Woods, A. G. A Proteomics Investigation of Salivary Profiles as Potential Biomarkers for Autism Spectrum Disorder (ASD). Protein J. 2023, 42(5), 607–620. [Google Scholar] [CrossRef] [PubMed]
- Wallis, K. E.; Adebajo, T.; Bennett, A. E.; Drye, M.; Gerdes, M.; Miller, J. S.; Guthrie, W. Prevalence of Autism Spectrum Disorder in a Large Pediatric Primary Care Network. Autism 2023, 27(6), 1840–1846. [Google Scholar] [CrossRef] [PubMed]
- Salari, N.; Rasoulpoor, S.; Rasoulpoor, S.; Shohaimi, S.; Jafarpour, S.; Abdoli, N.; Khaledi-Paveh, B.; Mohammadi, M. The Global Prevalence of Autism Spectrum Disorder: A Comprehensive Systematic Review and Meta-Analysis. Ital. J. Pediatr. 2022, 48(1), 112. [Google Scholar] [CrossRef] [PubMed]
- Association, A. P. Diagnostic and Statistical Manual of Mental Disorders, fifth.; American Psychiatric Association: London, England, 2013. [Google Scholar] [CrossRef]
- Zwaigenbaum, L.; Penner, M. Autism Spectrum Disorder: Advances in Diagnosis and Evaluation. BMJ 2018, 361, k1674. [Google Scholar] [CrossRef]
- Al-Dewik, N.; Al-Jurf, R.; Styles, M.; Tahtamouni, S.; Alsharshani, D.; Alsharshani, M.; Ahmad, A. I.; Khattab, A.; Al Rifai, H.; Walid Qoronfleh, M. Overview and Introduction to Autism Spectrum Disorder (ASD). Adv. Neurobiol. 2020, 24, 3–42. [Google Scholar] [CrossRef]
- Sealey, L. A.; Hughes, B. W.; Sriskanda, A. N.; Guest, J. R.; Gibson, A. D.; Johnson-Williams, L.; Pace, D. G.; Bagasra, O. Environmental Factors in the Development of Autism Spectrum Disorders. Environ. Int. 2016, 88, 288–298. [Google Scholar] [CrossRef] [PubMed]
- Lord, C.; Risi, S.; Lambrecht, L.; Cook, E. H.; Leventhal, B. L.; DiLavore, P. C.; Pickles, A.; Rutter, M. The Autism Diagnostic Observation Schedule—Generic: A Standard Measure of Social and Communication Deficits Associated with the Spectrum of Autism. J. Autism Dev. Disord. 2000, 30(3), 205–223. [Google Scholar] [CrossRef]
- Scheffer, I. E.; Nabbout, R. SCN1A-Related Phenotypes: Epilepsy and Beyond. Epilepsia 2019, 60 Suppl 3, S17–S24. [Google Scholar] [CrossRef]
- Moh, T. A.; Magiati, I. Factors Associated with Parental Stress and Satisfaction during the Process of Diagnosis of Children with Autism Spectrum Disorders. Res. Autism Spectr. Disord. 2012, 6(1), 293–303. [Google Scholar] [CrossRef]
- Modabbernia, A.; Velthorst, E.; Reichenberg, A. Environmental Risk Factors for Autism: An Evidence-Based Review of Systematic Reviews and Meta-Analyses. Mol. Autism 2017, 8, 13. [Google Scholar] [CrossRef] [PubMed]
- Ramaswami, G.; Geschwind, D. H. Genetics of Autism Spectrum Disorder. Handb. Clin. Neurol. 2018, 147, 321–329. [Google Scholar] [CrossRef] [PubMed]
- Ongono, J. S.; Béranger, R.; Baghdadli, A.; Mortamais, M. Pesticides Used in Europe and Autism Spectrum Disorder Risk: Can Novel Exposure Hypotheses Be Formulated beyond Organophosphates, Organochlorines, Pyrethroids and Carbamates? - A Systematic Review. Environ. Res. 2020, 187, 109646. [Google Scholar] [CrossRef] [PubMed]
- Wang, L.; Wang, B.; Wu, C.; Wang, J.; Sun, M. Autism Spectrum Disorder: Neurodevelopmental Risk Factors, Biological Mechanism, and Precision Therapy. International Journal of Molecular Sciences. 2023. [CrossRef] [PubMed]
- Vissoker, R. E.; Latzer, Y.; Gal, E. Eating and Feeding Problems and Gastrointestinal Dysfunction in Autism Spectrum Disorders. Res. Autism Spectr. Disord. 2015, 12, 10–21. [Google Scholar] [CrossRef]
- Schreck, K. A.; Williams, K. Food Preferences and Factors Influencing Food Selectivity for Children with Autism Spectrum Disorders. Res. Dev. Disabil. 2006, 27(4), 353–363. [Google Scholar] [CrossRef]
- Liu, X.; Liu, J.; Xiong, X.; Yang, T.; Hou, N.; Liang, X.; Chen, J.; Cheng, Q.; Li, T. Correlation between Nutrition and Symptoms: Nutritional Survey of Children with Autism Spectrum Disorder in Chongqing, China. Nutrients 2016, 8(5). [Google Scholar] [CrossRef] [PubMed]
- Sharp, W. G.; Postorino, V.; McCracken, C. E.; Berry, R. C.; Criado, K. K.; Burrell, T. L.; Scahill, L. Dietary Intake, Nutrient Status, and Growth Parameters in Children with Autism Spectrum Disorder and Severe Food Selectivity: An Electronic Medical Record Review. J. Acad. Nutr. Diet. 2018, 118(10), 1943–1950. [Google Scholar] [CrossRef]
- Lundin Remnélius, K.; Neufeld, J.; Isaksson, J.; Bölte, S. Eating Problems in Autistic Females and Males: A Co-Twin Control Study. J. Autism Dev. Disord. 2022, 52(7), 3153–3168. [Google Scholar] [CrossRef]
- Al-Farsi, Y. M.; Waly, M. I.; Deth, R. C.; Al-Sharbati, M. M.; Al-Shafaee, M.; Al-Farsi, O.; Al-Khaduri, M. M.; Gupta, I.; Ali, A.; Al-Khalili, M.; Al-Adawi, S.; Hodgson, N. W.; Ouhtit, A. Low Folate and Vitamin B12 Nourishment Is Common in Omani Children with Newly Diagnosed Autism. Nutrition 2013, 29(3), 537–541. [Google Scholar] [CrossRef] [PubMed]
- Yektaş, Ç.; Alpay, M.; Tufan, A. E. Comparison of Serum B12, Folate and Homocysteine Concentrations in Children with Autism Spectrum Disorder or Attention Deficit Hyperactivity Disorder and Healthy Controls. Neuropsychiatr. Dis. Treat. 2019, 15, 2213–2219. [Google Scholar] [CrossRef] [PubMed]
- Mahruba, S.; Begum, S.; Shahjadi, S.; Afroz, S.; Siddiqi, U.; Parvin, J. Serum Vitamin B12 and Folic Acid Status in Autism Spectrum Disorder Children. J. Bangladesh Soc. Physiol. 2020, 14(2), 43–47. [Google Scholar] [CrossRef]
- Li, B.; Xu, Y.; Pang, D.; Zhao, Q.; Zhang, L.; Li, M.; Li, W.; Duan, G.; Zhu, C. Interrelation between Homocysteine Metabolism and the Development of Autism Spectrum Disorder in Children. Front. Mol. Neurosci. 2022, 15, 947513. [Google Scholar] [CrossRef]
- Laud, R. B.; Girolami, P. A.; Boscoe, J. H.; Gulotta, C. S. Treatment Outcomes for Severe Feeding Problems in Children with Autism Spectrum Disorder. Behav. Modif. 2009, 33(5), 520–536. [Google Scholar] [CrossRef] [PubMed]
- Bertoglio, K.; Jill James, S.; Deprey, L.; Brule, N.; Hendren, R. L. Pilot Study of the Effect of Methyl B12 Treatment on Behavioral and Biomarker Measures in Children with Autism. J. Altern. Complement. Med. 2010, 16(5), 555–560. [Google Scholar] [CrossRef]
- Hendren, R. L.; James, S. J.; Widjaja, F.; Lawton, B.; Rosenblatt, A.; Bent, S. Randomized, Placebo-Controlled Trial of Methyl B12 for Children with Autism. J. Child Adolesc. Psychopharmacol. 2016, 26(9), 774–783. [Google Scholar] [CrossRef]
- Allen, L. H.; Miller, J. W.; de Groot, L.; Rosenberg, I. H.; Smith, A. D.; Refsum, H.; Raiten, D. J. Biomarkers of Nutrition for Development (BOND): Vitamin B-12 Review. J. Nutr. 2018, 148 (suppl_4), 1995S–2027S. [Google Scholar] [CrossRef] [PubMed]
- Rossignol, D. A.; Frye, R. E. The Effectiveness of Cobalamin (B12) Treatment for Autism Spectrum Disorder: A Systematic Review and Meta-Analysis. J. Pers. Med. 2021, 11(8). [Google Scholar] [CrossRef]
- Held, J. R. Appropriate Animal Models. Ann. N. Y. Acad. Sci. 1983, 406, 13–19. [Google Scholar] [CrossRef] [PubMed]
- Davidson, M. K.; Lindsey, J. R.; Davis, J. K. Requirements and Selection of an Animal Model. Isr. J. Med. Sci. 1987, 23(6), 551–555. [Google Scholar]
- Kalueff, A. V; Stewart, A. M.; Gerlai, R. Zebrafish as an Emerging Model for Studying Complex Brain Disorders. Trends Pharmacol. Sci. 2014, 35(2), 63–75. [Google Scholar] [CrossRef]
- Stewart, A. M.; Nguyen, M.; Wong, K.; Poudel, M. K.; Kalueff, A. V. Developing Zebrafish Models of Autism Spectrum Disorder (ASD). Prog. Neuropsychopharmacol. Biol. Psychiatry 2014, 50, 27–36. [Google Scholar] [CrossRef] [PubMed]
- Meshalkina, D. A.; N. Kizlyk, M.; V. Kysil, E.; Collier, A. D.; Echevarria, D. J.; Abreu, M. S.; Barcellos, L. J. G.; Song, C.; Warnick, J. E.; Kyzar, E. J.; Kalueff, A. V. Zebrafish Models of Autism Spectrum Disorder. Exp. Neurol. 2018, 299, 207–216. [Google Scholar] [CrossRef]
- Shams, S.; Rihel, J.; Ortiz, J. G.; Gerlai, R. The Zebrafish as a Promising Tool for Modeling Human Brain Disorders: A Review Based upon an IBNS Symposium. Neurosci. Biobehav. Rev. 2018, 85, 176–190. [Google Scholar] [CrossRef] [PubMed]
- Tayanloo-Beik, A.; Hamidpour, S. K.; Abedi, M.; Shojaei, H.; Tavirani, M. R.; Namazi, N.; Larijani, B.; Arjmand, B. Zebrafish Modeling of Autism Spectrum Disorders, Current Status and Future Prospective. Front. Psychiatry 2022, 13. [Google Scholar] [CrossRef]
- Sloan, J. L.; Achilly, N. P.; Arnold, M. L.; Catlett, J. L.; Blake, T.; Bishop, K.; Jones, M.; Harper, U.; English, M. A.; Anderson, S.; Trivedi, N. S.; Elkahloun, A.; Hoffmann, V.; Brooks, B. P.; Sood, R.; Venditti, C. P. The Vitamin B12 Processing Enzyme, Mmachc, Is Essential for Zebrafish Survival, Growth and Retinal Morphology. Hum. Mol. Genet. 2020, 29(13), 2109–2123. [Google Scholar] [CrossRef]
- Hannibal, L.; Jacobsen, D. W. Intracellular Processing of Vitamin B(12) by MMACHC (CblC). Vitam. Horm. 2022, 119, 275–298. [Google Scholar] [CrossRef]
- Hansen, A.-C.; Olsvik, P. A.; Hemre, G.-I. Effect of Different Dietary Vitamin B12 Levels on Their Retention in the Body of Zebrafish Danio rerio and on the Gene Expression of Vitamin B12 Binding Proteins. Aquac. Nutr. 2013, 19(3), 413–420. [Google Scholar] [CrossRef]
- Karmakar, S.; Sen Gupta, P.; Bhattacharya, S.; Sarkar, A.; Rahaman, A.; Mandal, D. P.; Bhattacharjee, S. Vitamin B12 Alleviates Malathion-Induced Toxicity in Zebrafish by Regulating Cytochrome P450 and PgP Expressions. Toxicol. Mech. Methods 2023, 33(5), 364–377. [Google Scholar] [CrossRef]
- Coghlan, S.; Horder, J.; Inkster, B.; Mendez, M. A.; Murphy, D. G.; Nutt, D. J. GABA System Dysfunction in Autism and Related Disorders: From Synapse to Symptoms. Neurosci. Biobehav. Rev. 2012, 36(9), 2044–2055. [Google Scholar] [CrossRef]
- Purkayastha, P.; Malapati, A.; Yogeeswari, P.; Sriram, D. A Review on GABA/Glutamate Pathway for Therapeutic Intervention of ASD and ADHD. Curr. Med. Chem. 2015, 22(15), 1850–1859. [Google Scholar] [CrossRef]
- Umesawa, Y.; Matsushima, K.; Atsumi, T.; Kato, T.; Fukatsu, R.; Wada, M.; Ide, M. Altered GABA Concentration in Brain Motor Area Is Associated with the Severity of Motor Disabilities in Individuals with Autism Spectrum Disorder. J. Autism Dev. Disord. 2020, 50(8), 2710–2722. [Google Scholar] [CrossRef]
- Gupta, R. C.; Miller Mukherjee, I. R.; Malik, J. K.; Doss, R. B.; Dettbarn, W.-D.; Milatovic, D. Chapter 26 - Insecticides; Gupta, R. C. B. T.-B. in T. (Second E., Ed.; Academic Press, 2019; pp 455–475. [CrossRef]
- Gupta, R. C.; Anadón, A. Chapter 42 - Fipronil; Gupta, R. C. B. T.-V. T. (Third E., Ed.; Academic Press, 2018; pp 533–538. [CrossRef]
- Singh, N. S.; Sharma, R.; Singh, S. K.; Singh, D. K. A Comprehensive Review of Environmental Fate and Degradation of Fipronil and Its Toxic Metabolites. Environ. Res. 2021, 199, 111316. [Google Scholar] [CrossRef]
- Sullivan, J. J.; Goh, K. S. Environmental Fate and Properties of Pyriproxyfen. J. Pestic. Sci. 2008, 33, 339–350. [Google Scholar] [CrossRef]
- Bedient, P.; Horsak, R.; Schlenk, D.; Hovinga, R.; Pierson, J. Environmental Impact of Fipronil to the Louisiana Crawfish Industry. Environ. Forensics - Env. FORENSICS 2005, 6, 289–299. [Google Scholar] [CrossRef]
- Mehrnoush, G.; Mehrdad, S.; Saeid, K. H. A. Effect Of Pyriproxyfen On Function And Tissue Of Testis In Adult Rat. Int. J. Curr. Res. Rev. 2013, 5, 66–74. [Google Scholar]
- Wu, H.; Gao, C.; Guo, Y.; Zhang, Y.; Zhang, J.; Ma, E. Acute Toxicity and Sublethal Effects of Fipronil on Detoxification Enzymes in Juvenile Zebrafish (Danio rerio). Pestic. Biochem. Physiol. 2014, 115, 9–14. [Google Scholar] [CrossRef]
- Badgujar, P. C.; Chandratre, G. A.; Pawar, N. N.; Telang, A. G.; Kurade, N. P. Fipronil Induced Oxidative Stress Involves Alterations in SOD1 and Catalase Gene Expression in Male Mice Liver: Protection by Vitamins E and C. Environ. Toxicol. 2016, 31(9), 1147–1158. [Google Scholar] [CrossRef] [PubMed]
- Wang, X.; Martínez, M. A.; Wu, Q.; Ares, I.; Martínez-Larrañaga, M. R.; Anadón, A.; Yuan, Z. Fipronil Insecticide Toxicology: Oxidative Stress and Metabolism. Crit. Rev. Toxicol. 2016, 46(10), 876–899. [Google Scholar] [CrossRef]
- Araújo, C. V. M.; Roque, D.; Blasco, J.; Ribeiro, R.; Moreira-Santos, M.; Toribio, A.; Aguirre, E.; Barro, S. Stress-Driven Emigration in Complex Field Scenarios of Habitat Disturbance: The Heterogeneous Multi-Habitat Assay System (HeMHAS). Sci. Total Environ. 2018, 644, 31–36. [Google Scholar] [CrossRef]
- Ghazanfar, M.; Shahid, S.; Qureshi, I. Z. Vitamin C Attenuates Biochemical and Genotoxic Damage in Common Carp (Cyprinus carpio) upon Joint Exposure to Combined Toxic Doses of Fipronil and Buprofezin Insecticides. Aquat. Toxicol. 2018, 196, 43–52. [Google Scholar] [CrossRef]
- Gusso, D.; Reolon, G. K.; Gonzalez, J. B.; Altenhofen, S.; Kist, L. W.; Bogo, M. R.; Bonan, C. D. Pyriproxyfen Exposure Impairs Cognitive Parameters and Alters Cortisol Levels in Zebrafish. Front. Behav. Neurosci. 2020, 14, 103. [Google Scholar] [CrossRef]
- Bownik, A.; Szabelak, A. Short-Term Effects of Pesticide Fipronil on Behavioral and Physiological Endpoints of Daphnia magna. Environ. Sci. Pollut. Res. 2021, 28(25), 33254–33264. [Google Scholar] [CrossRef]
- Staldoni de Oliveira, V.; Gomes Castro, A. J.; Marins, K.; Bittencourt Mendes, A. K.; Araújo Leite, G. A.; Zamoner, A.; Van Der Kraak, G.; Mena Barreto Silva, F. R. Pyriproxyfen Induces Intracellular Calcium Overload and Alters Antioxidant Defenses in Danio rerio Testis That May Influence Ongoing Spermatogenesis. Environ. Pollut. 2021, 270, 116055. [Google Scholar] [CrossRef]
- Pena, I. A.; Roussel, Y.; Daniel, K.; Mongeon, K.; Johnstone, D.; Weinschutz Mendes, H.; Bosma, M.; Saxena, V.; Lepage, N.; Chakraborty, P.; Dyment, D. A.; van Karnebeek, C. D. M.; Verhoeven-Duif, N.; Bui, T. V.; Boycott, K. M.; Ekker, M.; MacKenzie, A. Pyridoxine-Dependent Epilepsy in Zebrafish Caused by Aldh7a1 Deficiency. Genetics 2017, 207(4), 1501–1518. [Google Scholar] [CrossRef]
- Balmus, I.-M.; Lefter, R.; Ciobica, A.; Cojocaru, S.; Guenne, S.; Timofte, D.; Stanciu, C.; Trifan, A.; Hritcu, L. Preliminary Biochemical Description of Brain Oxidative Stress Status in Irritable Bowel Syndrome Contention-Stress Rat Model. Medicina (Kaunas). 2019, 55(12). [Google Scholar] [CrossRef]
- Jin, Y.; Liu, Z.; Liu, F.; Ye, Y.; Peng, T.; Fu, Z. Embryonic Exposure to Cadmium (II) and Chromium (VI) Induce Behavioral Alterations, Oxidative Stress and Immunotoxicity in Zebrafish (Danio rerio). Neurotoxicol. Teratol. 2015, 48, 9–17. [Google Scholar] [CrossRef]
- Bradford, M. M. A Rapid and Sensitive Method for the Quantitation of Microgram Quantities of Protein Utilizing the Principle of Protein-Dye Binding. Anal. Biochem. 1976, 72, 248–254. [Google Scholar] [CrossRef]
- Commission Recommendation. Guidelines for the Accommodation and Care of Animals Used for Experimental and Other Scientific Purposes (Notified under Document Number C(2007) 2525). Off. J. Eur. Union 2007, 50. [Google Scholar]
- Directive 63. The Protection of Animals Used for Scientific Purposes. Off. J. Eur. Union 2010, 53. [Google Scholar]
- Stehr, C. M.; Linbo, T. L.; Incardona, J. P.; Scholz, N. L. The Developmental Neurotoxicity of Fipronil: Notochord Degeneration and Locomotor Defects in Zebrafish Embryos and Larvae. Toxicol. Sci. 2006, 92(1), 270–278. [Google Scholar] [CrossRef]
- Wang, C.; Qian, Y.; Zhang, X.; Chen, F.; Zhang, Q.; Li, Z.; Zhao, M. A Metabolomic Study of Fipronil for the Anxiety-like Behavior in Zebrafish Larvae at Environmentally Relevant Levels. Environ. Pollut. 2016, 211, 252–258. [Google Scholar] [CrossRef]
- Matsunaga, H.; Yoshino, H.; Isobe, N.; Kaneko, H.; Nakatsuka, I.; Yamada, H. Metabolism of Pyriproxyfen in Rats. 1. Absorption, Disposition, Excretion, and Biotransformation Studies with [Phenoxyphenyl-14C]Pyriproxyfen. J. Agric. Food Chem. 1995, 43(1), 235–240. [Google Scholar] [CrossRef]
- Wei, Y.; Cui, J.; Zhai, W.; Liu, X.; Zhou, Z.; Wang, P.; Liu, D. Toxicity and Fate of Chiral Insecticide Pyriproxyfen and Its Metabolites in Zebrafish (Danio rerio). Environ. Pollut. 2021, 280, 116894. [Google Scholar] [CrossRef]
- Wu, C.-H.; Lu, C.-W.; Hsu, T.-H.; Wu, W.-J.; Wang, S.-E. Neurotoxicity of Fipronil Affects Sensory and Motor Systems in Zebrafish. Pestic. Biochem. Physiol. 2021, 177, 104896. [Google Scholar] [CrossRef] [PubMed]
- Robea, M. A.; Jijie, R.; Nicoara, M.; Plavan, G.; Ciobica, A. S.; Solcan, C.; Audira, G.; Hsiao, C.-D.; Strungaru, S.-A. Vitamin C Attenuates Oxidative Stress and Behavioral Abnormalities Triggered by Fipronil and Pyriproxyfen Insecticide Chronic Exposure on Zebrafish Juvenile. Antioxidants (Basel, Switzerland) 2020, 9(10). [Google Scholar] [CrossRef]
- Manzanares, W.; Hardy, G. Vitamin B12: The Forgotten Micronutrient for Critical Care. Curr. Opin. Clin. Nutr. Metab. Care 2010, 13(6), 662–8. [Google Scholar] [CrossRef]
- Brito, A.; Grapov, D.; Fahrmann, J.; Harvey, D.; Green, R.; Miller, J. W.; Fedosov, S. N.; Shahab-Ferdows, S.; Hampel, D.; Pedersen, T. L.; Fiehn, O.; Newman, J. W.; Uauy, R.; Allen, L. H. The Human Serum Metabolome of Vitamin B-12 Deficiency and Repletion, and Associations with Neurological Function in Elderly Adults. J. Nutr. 2017, 147(10), 1839–1849. [Google Scholar] [CrossRef]
- Suarez-Moreira, E.; Yun, J.; Birch, C. S.; Williams, J. H. H.; McCaddon, A.; Brasch, N. E. Vitamin B(12) and Redox Homeostasis: Cob(II)Alamin Reacts with Superoxide at Rates Approaching Superoxide Dismutase (SOD). J. Am. Chem. Soc. 2009, 131(42), 15078–15079. [Google Scholar] [CrossRef]
- Ayesha, A.; Bahnson, E. M.; Kayashima, Y.; Wilder, J.; Huynh, P. K.; Hiller, S.; Maeda-Smithies, N.; Li, F. Vitamin B12 Does Not Increase Cell Viability after Hydrogen Peroxide Induced Damage in Mouse Kidney Proximal Tubular Cells and Brain Endothelial Cells. Adv. redox Res. an Off. J. Soc. Redox Biol. Med. Soc. Free Radic. Res. 2022, 4. [Google Scholar] [CrossRef]
- Ahmed Mohammed, R.; Fadheel, Q. J. Hepatoprotective Effect of Vitamin B12 in Acetaminophen Induce Hepatotoxicity in Male Rats. Arch. Razi Inst. 2023, 78(1), 419–425. [Google Scholar] [CrossRef]
- Konwick, B. J.; Garrison, A. W.; Black, M. C.; Avants, J. K.; Fisk, A. T. Bioaccumulation, Biotransformation, and Metabolite Formation of Fipronil and Chiral Legacy Pesticides in Rainbow Trout. Environ. Sci. Technol. 2006, 40(9), 2930–2936. [Google Scholar] [CrossRef] [PubMed]
- Mohamed, F.; Senarathna, L.; Percy, A.; Abeyewardene, M.; Eaglesham, G.; Cheng, R.; Azher, S.; Hittarage, A.; Dissanayake, W.; Sheriff, M. H. R.; Davies, W.; Buckley, N. A.; Eddleston, M. Acute Human Self-Poisoning with the N-Phenylpyrazole Insecticide Fipronil—a GABAA-Gated Chloride Channel Blocker. J. Toxicol. Clin. Toxicol. 2004, 42(7), 955–963. [Google Scholar] [CrossRef]
- Dallarés, S.; Dourado, P.; Sanahuja, I.; Solovyev, M.; Gisbert, E.; Montemurro, N.; Torreblanca, A.; Blázquez, M.; Solé, M. Multibiomarker Approach to Fipronil Exposure in the Fish Dicentrarchus labrax under Two Temperature Regimes. Aquat. Toxicol. 2020, 219, 105378. [Google Scholar] [CrossRef]
- Metyas, M. M.; Abdelhakim, A. S.; Ghandour, H. H. Screening of Vitamin B12 in Children Diagnosed as Autism Spectrum Disorder. QJM An Int. J. Med. 2020, 113 (Supplement_1). [Google Scholar] [CrossRef]
- Choi, Y. M.; Kim, Y.-I.; Choi, J.-H.; Bhandari, S.; Nam, I.-K.; Hong, K.; Kwak, S.; So, H.-S.; Park, D.-S.; Kim, C.-H.; Choi, T.-Y.; Choe, S.-K. Loss of Abcd4 in Zebrafish Leads to Vitamin B12-Deficiency Anemia. Biochem. Biophys. Res. Commun. 2019, 514(4), 1264–1269. [Google Scholar] [CrossRef] [PubMed]
- Yahn, G.; Wasek, B.; Bottiglieri, T.; Jadavji, N. A Dietary Vitamin B12 Deficiency Impairs Balance and Coordination After Ischemic Injury to the Sensorimotor Cortex in Adult Male and Female Mice. Curr. Dev. Nutr. 2021, 5, 932. [Google Scholar] [CrossRef]
- Arora, K.; Sequeira, J. M.; Hernández, A. I.; Alarcon, J. M.; Quadros, E. V. Behavioral Alterations Are Associated with Vitamin B12 Deficiency in the Transcobalamin Receptor/CD320 KO Mouse. PLoS One 2017, 12(5), e0177156. [Google Scholar] [CrossRef] [PubMed]
| Type of tank | Temperature (° C) |
pH | Conductivity (µS cm-1) | Salinity | Ammonia (mg L-1) |
|---|---|---|---|---|---|
| Housing tank | 26 ± 0.5 | 7.6 | 551 | 0.26 | 0.05 |
| Experimental tanks | 25 ± 0.5 | 7.5 | 553 | 0.24 | 0.06 |
Disclaimer/Publisher’s Note: The statements, opinions and data contained in all publications are solely those of the individual author(s) and contributor(s) and not of MDPI and/or the editor(s). MDPI and/or the editor(s) disclaim responsibility for any injury to people or property resulting from any ideas, methods, instructions or products referred to in the content. |
© 2023 by the authors. Licensee MDPI, Basel, Switzerland. This article is an open access article distributed under the terms and conditions of the Creative Commons Attribution (CC BY) license (http://creativecommons.org/licenses/by/4.0/).


