Submitted:
08 December 2023
Posted:
11 December 2023
You are already at the latest version
Abstract
Keywords:
1. Introduction
2. Materials and Methods
2.1. Device fabrication
2.2. Characterization
3. Results and Discussion
4. Conclusion
Acknowledgments
References
- Kojim, A.; Teshima, K.; Shirai, Y.; Miyasaka, T. Organometal Halide Perovskites as Visible-Light Sensitizers for Photovoltaic Cells, J. Am. Chem. Soc. 2009, 131, 6050–6051. [Google Scholar] [CrossRef] [PubMed]
- Best research-cell efficiency chart, NREL (2023). https://www.nrel.gov/pv/cell-efficiency.html.
- Luo, D.; Yang, W.; Wang, Z.; Sadhanala, A.; Hu, Q.; Su, R.; Shivanna, R.; Trindade, G.F.; Watts, J.F.; Xu, Z.; Liu, T.; Chen, K.; Ye, F.; Wu, P.; Zhao, L.; Wu, J.; Tu, Y.; Zhang, Y.; Yang, X.; Zhang, W.; Friend, R.H.; Gong, Q.; Snaith, J.H.; Zhu, R. Enhanced photovoltage for inverted planar heterojunction perovskite solar cells. Science 2018, 360, 1442–1446. [Google Scholar] [CrossRef] [PubMed]
- Yip, H.-L.; Jen, A.K.-Y. Recent advances in solution-processed interfacial materials for efficient and stable polymer solar cells. Energy Environ. Sci. 2012, 5, 5994–6611. [Google Scholar] [CrossRef]
- Liu, T.; Chen, K.; Hu, Q.; Zhu, R.; Gong, Q. Inverted perovskite solar cells: progresses and perspectives, Adv. Energy Mater. 2016, 6, 1600457. [Google Scholar] [CrossRef]
- Hu, Y.; Tang, Y.; Zhang, Z.; Yang, F.; Jiang, L.; Song, Y.; Liu, H. Improving the efficiency of inverted perovskite solar cells by Bis (acetylacetonato) dioxomolybdenum (VI)-doped PEDOT: PSS, Mater. Lett. 2022, 306, 130911. [Google Scholar] [CrossRef]
- Xu, L.; Li, Y.; Zhang, C.; Liu, Y.; Zheng, C.; Lu, W.; Li, M.; Chen, Y.; Huang, W.; Chen, R. Improving the efficiency and stability of inverted perovskite solar cells by CuSCN-doped PEDOT: PSS, Solar Energy Mater. Solar Cells 2020, 206, 110316. [Google Scholar] [CrossRef]
- Liu, D.; Li, Y.; Yuan, J.; Hong, Q.; Shi, G.; Yuan, D.; Wei, J.; Huang, C.; Tang, J.; Fung, M.-K. Improved performance of inverted planar perovskite solar cells with F4-TCNQ doped PEDOT: PSS hole transport layers, J. Mater. Chem. 2017, A5, 5701–5708. [Google Scholar] [CrossRef]
- Niu, J.; Yang, D.; Ren, X.; Yang, Z.; Liu, Y.; Zhu, X.; Zhao, W.; Liu, S. Graphene-oxide doped PEDOT: PSS as a superior hole transport material for high-efficiency perovskite solar cell, Org. Electron. 2017, 48, 165–171 https://doiorg /101016 /jorgel201705044. [Google Scholar]
- Redondo-Obispo, C.; Ripollesa, T.S.; Cortijo-Campos, S.; Álvareza, A.L.; Climent-Pascual, E.; de Andrés, A.; Coya, C. Enhanced stability and efficiency in inverted perovskite solar cells through graphene doping of PEDOT: PSS hole transport layer, Mater. Design 2020, 191, 108587. [Google Scholar] [CrossRef]
- Hu, L.; Sun, K.; Wang, M.; Chen, W.; Yang, B.; Fu, J.; Xiong, Z.; Li, X.; Tang, X.; Zang, Z.; Zhang, S.; Sun, L.; Li, M. Inverted planar perovskite solar cells with a high fill factor and negligible hysteresis by the dual effect of NaCl-doped PEDOT: PSS, ACS Appl. Mater. Interfac. 2017, 9, 43902–43909. [Google Scholar] [CrossRef]
- Jiang, K.; Wu, F.; Zhang, G.; Chow, P.C.Y.; Ma, C.; Li, S.; Wong, K.S.; Zhu, L.; Yan, H. Inverted planar perovskite solar cells based on CsI-doped PEDOT: PSS with efficiency beyond 20% and small energy loss, J. Mater. Chem. 2019, A7, 21662–21667. [Google Scholar] [CrossRef]
- Huang, P.; Liu, Y.; Zhang, K.; Yuan, L.; Li, D.; Hou, G.; Dong, B.; Zhou, Y.; Song, B.; Li, Y. Catechol derivatives as dopants in PEDOT: PSS to improve the performance of p–i–n perovskite solar cells. J. Mater. Chem. 2017, A5, 24275–24281. [Google Scholar] [CrossRef]
- Zhu, Y.; Wang, S.; Ma, R.; Wang, C. The improvement of inverted perovskite solar cells by the introduction of CTAB into PEDOT: PSS. Solar Energy 2019, 188, 28–34. [Google Scholar] [CrossRef]
- Erazoa, E.A.; Castillo-Bendeck, D.; Ortiz, P.; Cortés, M.T. NaCl doped electrochemical PEDOT: PSS layers for inverted perovskite solar cells with enhanced stability, Synth. Met. 2019, 257, 116178. [Google Scholar] [CrossRef]
- Wang, W.; Qin, F.; Zhu, X.; Liu, Y.; Jiang, X.; Sun, L.; Xie, C.; Zhou, Y. Exploring the Chemical Interaction between Diiodooctane and PEDOT-PSS Electrode for Metal Electrode-Free Nonfullerene Organic Solar Cell, ACS Appl. Mater. Interfaces 2020, 12, 3800–3805. [Google Scholar] [CrossRef]
- Xia, Y.; Dai, S. Review on applications of PEDOTs and PEDOT: PSS in perovskite solar cells, J. Mater. Sci.: Mater. Electro. 2021, 32, 12746–12757. [Google Scholar] [CrossRef]
- Wang, Q.; Chueh, C.-C.; Eslamian, M.; Jen, A.K.-Y. Modulation of PEDOT:PSS pH for efficient inverted perovskite solar cells with reduced potential loss and enhanced stability, ACS Appl. Mater. Interfaces 2016, 8, 32068–32076. [Google Scholar] [CrossRef] [PubMed]
- Xue, Q.; Liu, M.; Li, Z.; Yan, L.; Hu, Z.; Zhou, J.; Li, W.; Jiang, X.-F.; Xu, B.; Huang, F.; Li, Y.; Yip, H.-L.; Cao, Y. Efficient and stable perovskite solar cells via dual functionalization of dopamine semiquinone radical with improved trap passivation capabilities. Adv. Funct. Mater. 2018, 28, 1707444. [Google Scholar] [CrossRef]
- Yang, L.; Cai, F.; Yan, Y.; Li, J.; Liu, D.; Pearson, A.J.; Wang, T. Conjugated small molecule for efficient hole transport in high-performance p-i-n type perovskite solar cells. Adv. Funct. Mater. 2017, 27, 1702613. [Google Scholar] [CrossRef]
- Kim, J.H.; Williams, S.T.; Cho, N.; Chueh, C.-C.; Jen, A.K.-Y. Enhanced Environmental Stability of Planar Heterojunction Perovskite Solar Cells Based on Blade-Coating. Adv. Energy Mater. 2015, 5, 1401229. [Google Scholar] [CrossRef]
- Liang, P.-W.; Liao, C.-Y.; Chueh, C.-C.; Zuo, F.; Williams, S.T.; Xin, X.-K.; Lin, J.; Jen, A.K.-Y. Additive enhanced crystallization of solution-processed perovskite for highly efficient planar-heterojunction solar cells, Adv. Mater. 2014, 26, 3748–3754 https:// doiorg/101002/adma201400231. [Google Scholar]
- Zhao, Y.; Zhu, K. Optical Bleaching of Perovskite (CH3NH3)PbI3 Through Room-Temperature Phase Transformation Induced by Ammonia, Chem. Commun. 2014, 50, 1605–1607. [Google Scholar] [CrossRef] [PubMed]
- Miccoli, I.; Edler, F.; Pfnür, H.; Tegenkamp, C. The 100th anniversary of the four-point probe technique: the role of probe geometries in isotropic and anisotropic systems, J. Phys. Condens. Matter 2015, 27, 223201. [Google Scholar] [CrossRef]
- Zuo, L.; Guo, H.; deQuilettes, D.W.; Jariwala, S.; De Marco, N.; Dong, S.; DeBlock, R.; Ginger, D.S.; Dunn, B.; Wang, M.; Yang, Y. Polymer-modified halide perovskite films for efficient and stable planar heterojunction solar cells, Sci. Adv. 2017, 3, e1700106. [Google Scholar] [CrossRef] [PubMed]
- Terry, M.L.; Straub, A.; Inns, D.; Song, D.; Aberle, A.G. Large open-circuit voltage improvement by rapid thermal annealing of evaporated solid-phase-crystallized thin-film silicon solar cells on glass. Appl. Phys. Lett. 2005, 86, 172108 https://doiorg /101063/11921352. [Google Scholar] [CrossRef]
- Li, X.; Dar, M.I.; Yi, C.; Luo, J.; Tschumi, M.; Zakeeruddin, S.M.; Nazeeruddin, M.K.; Han, H.; Grätzel, M. , Improved performance and stability of perovskite solar cells by crystal crosslinking with alkylphosphonic acid ω-ammonium chlorides. Nature Chem. 2015, 7, 703–711. [Google Scholar] [CrossRef]
- Wang, Y.; Zhang, T.; Kan, M.; Zhao, Y. Bifunctional Stabilization of All-Inorganic α-CsPbI3 Perovskite for 17% Efficiency Photovoltaics, J. Am. Chem. Soc. 2018, 140, 12345–12348. [Google Scholar] [CrossRef]
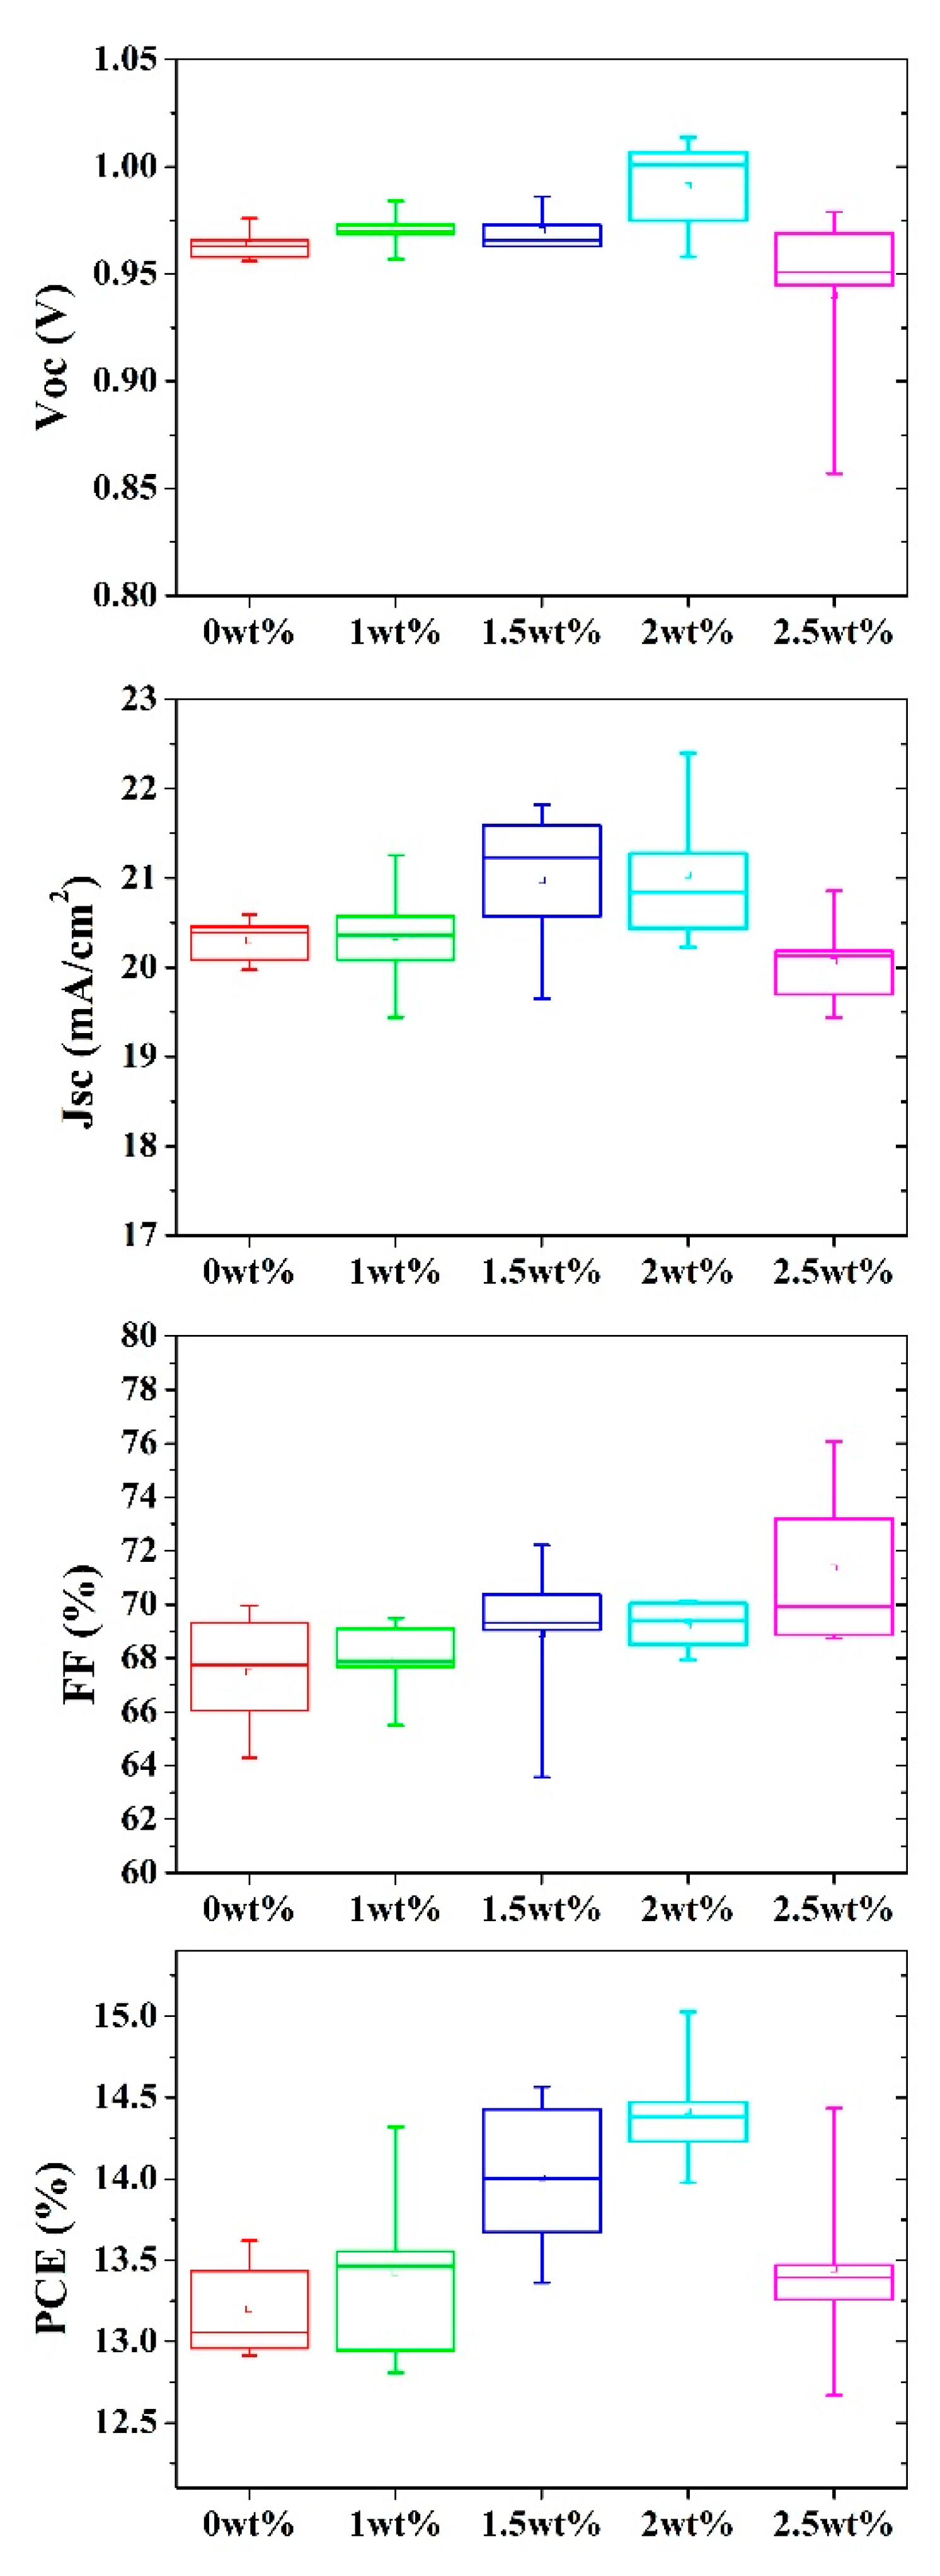

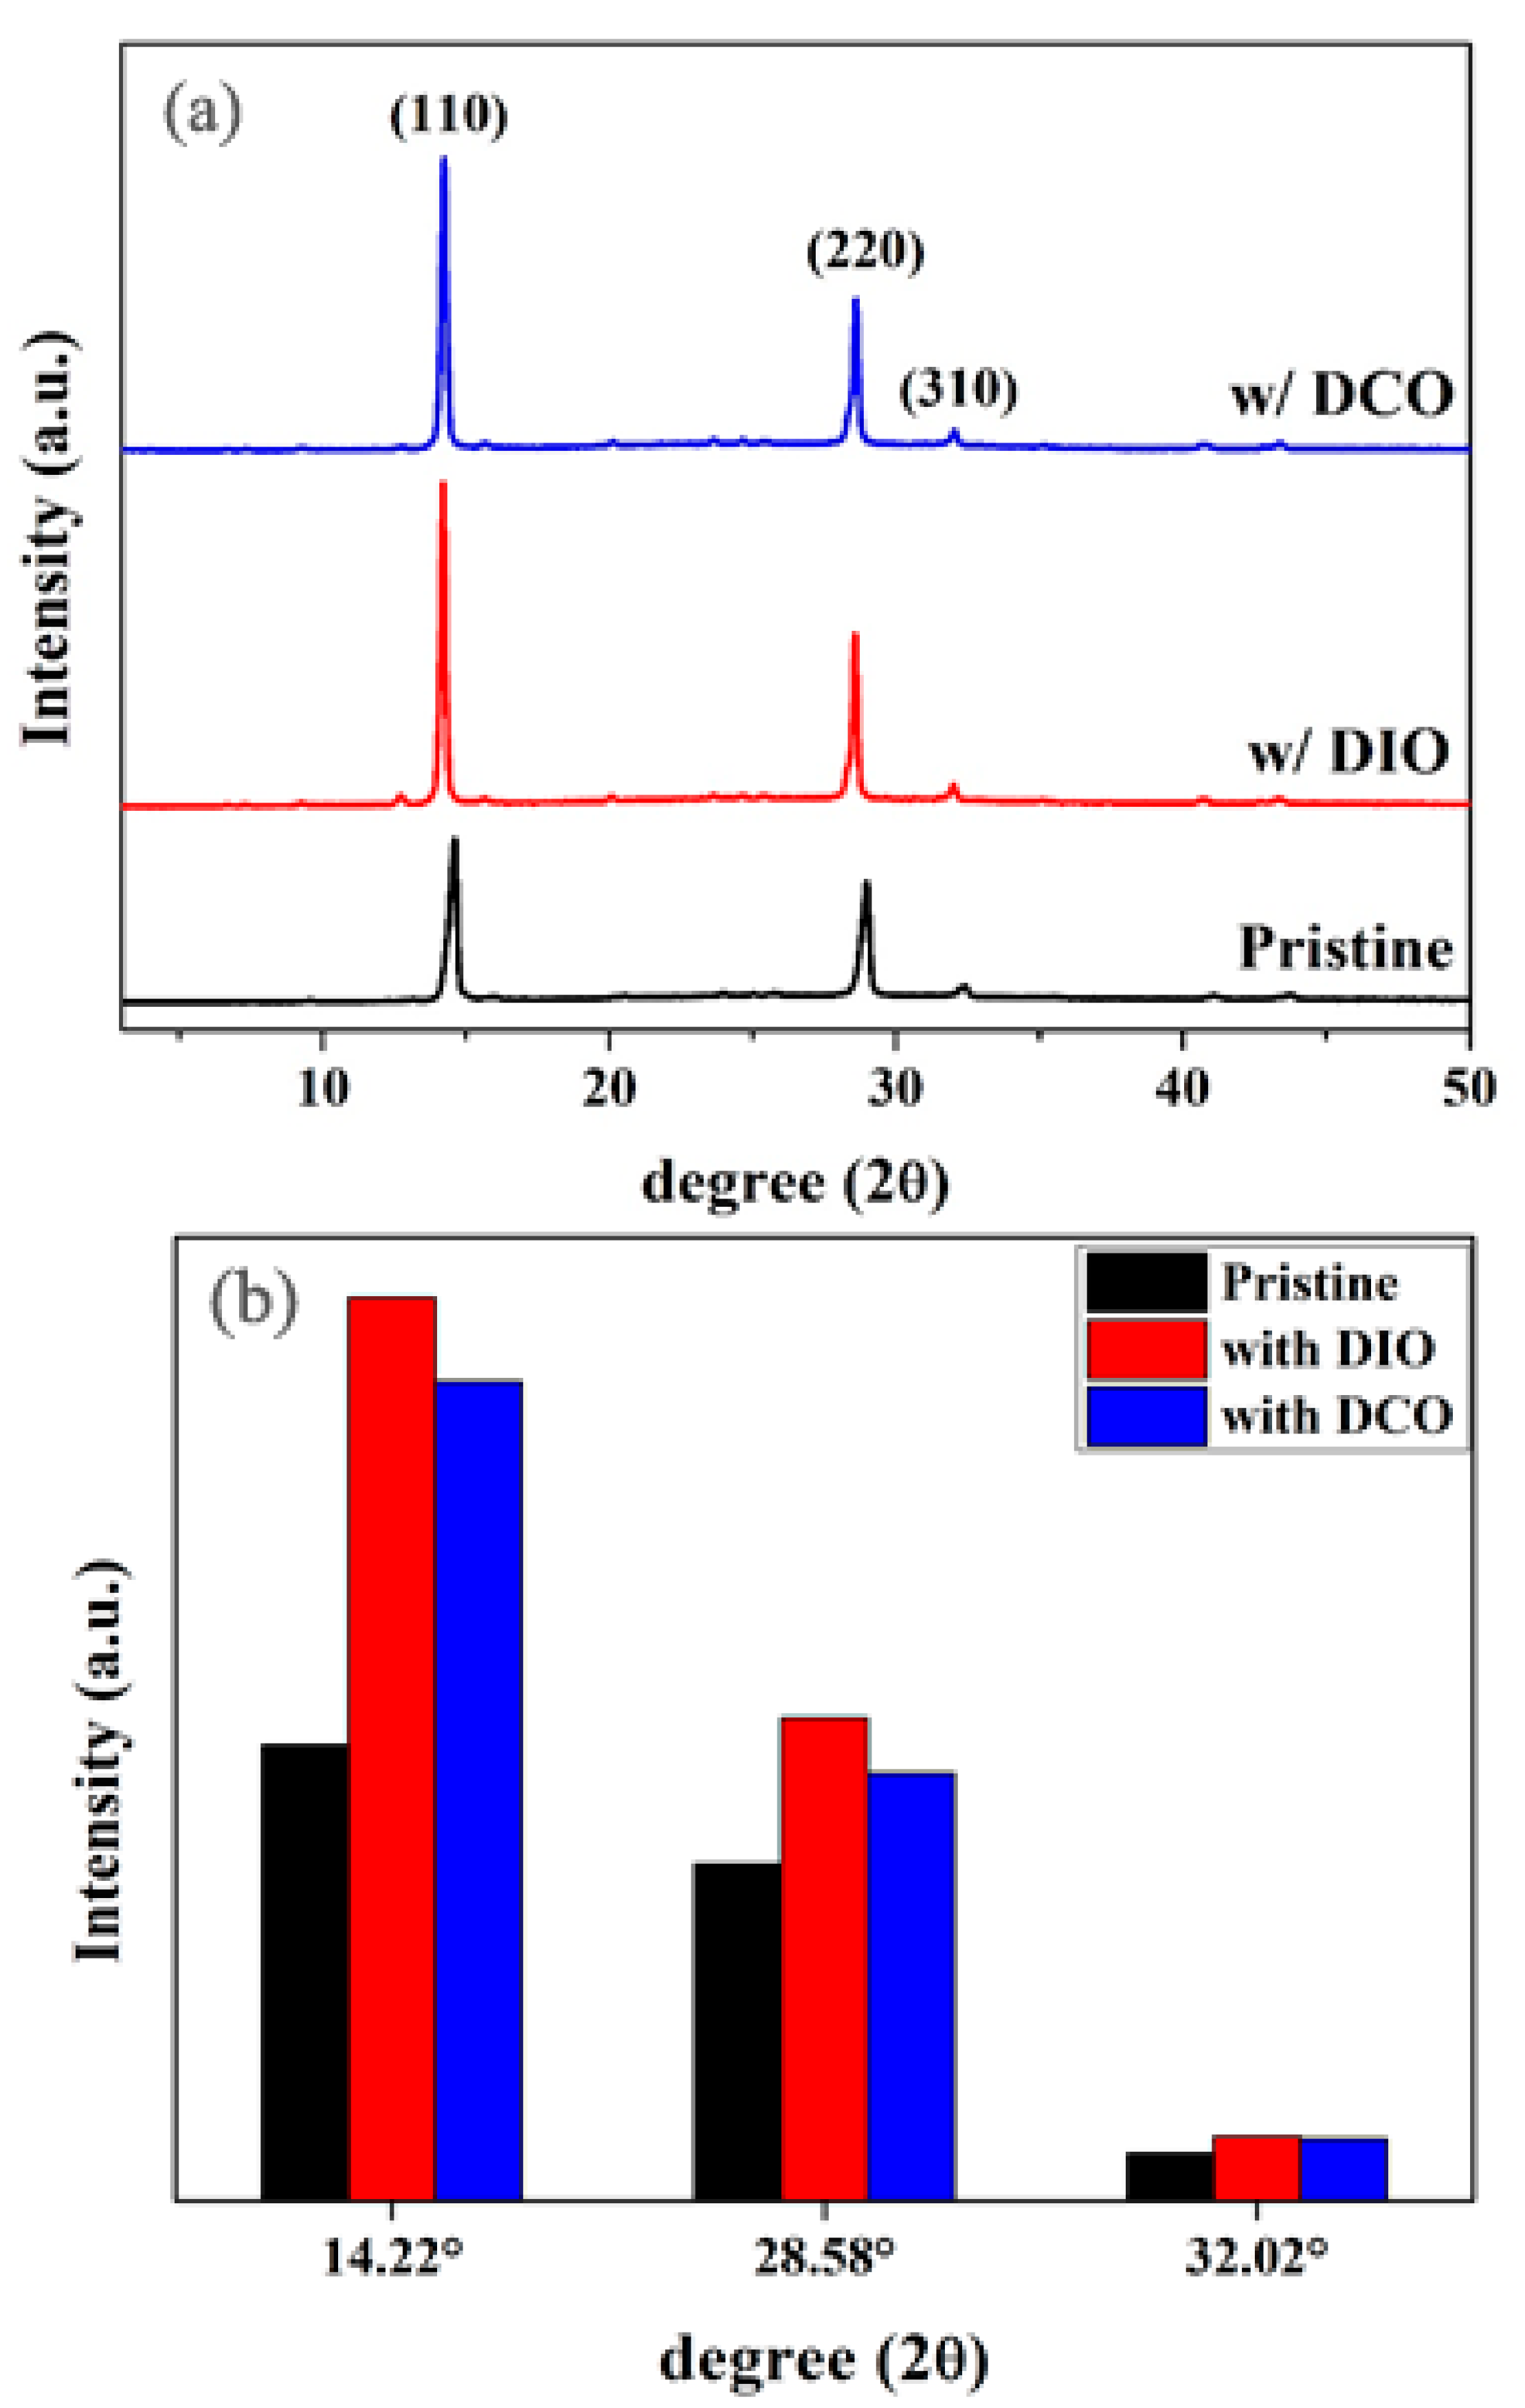
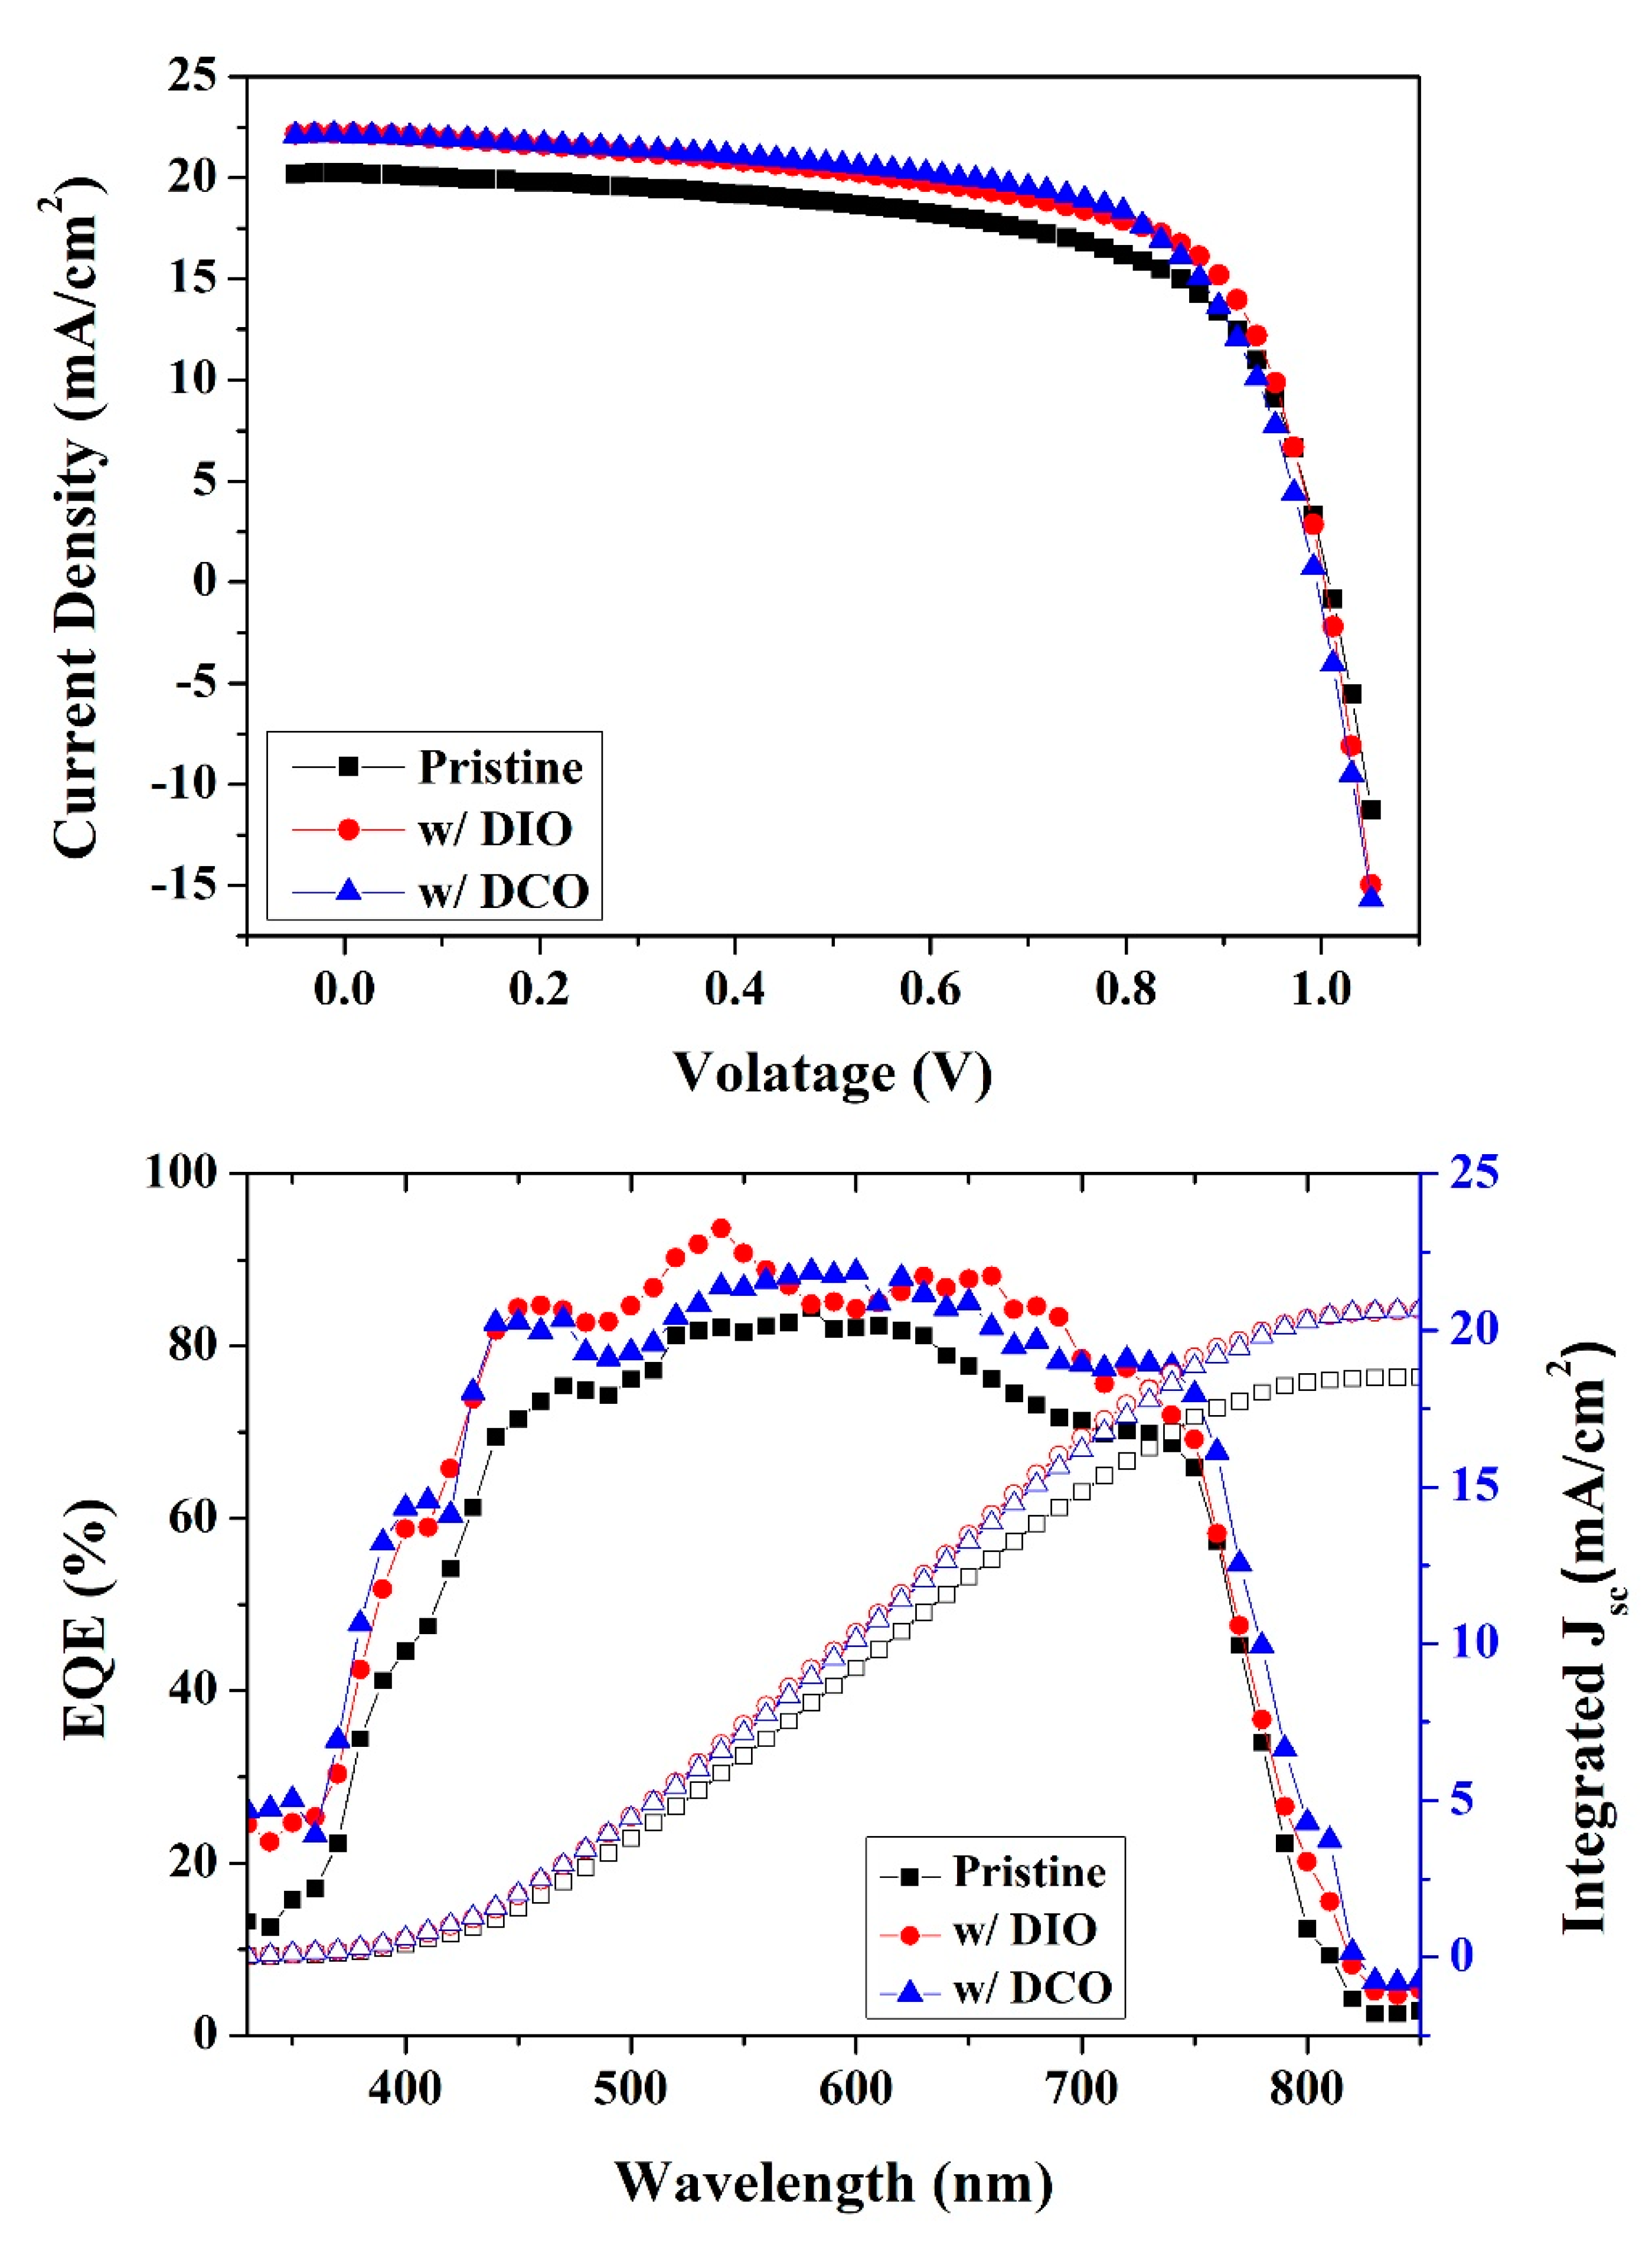
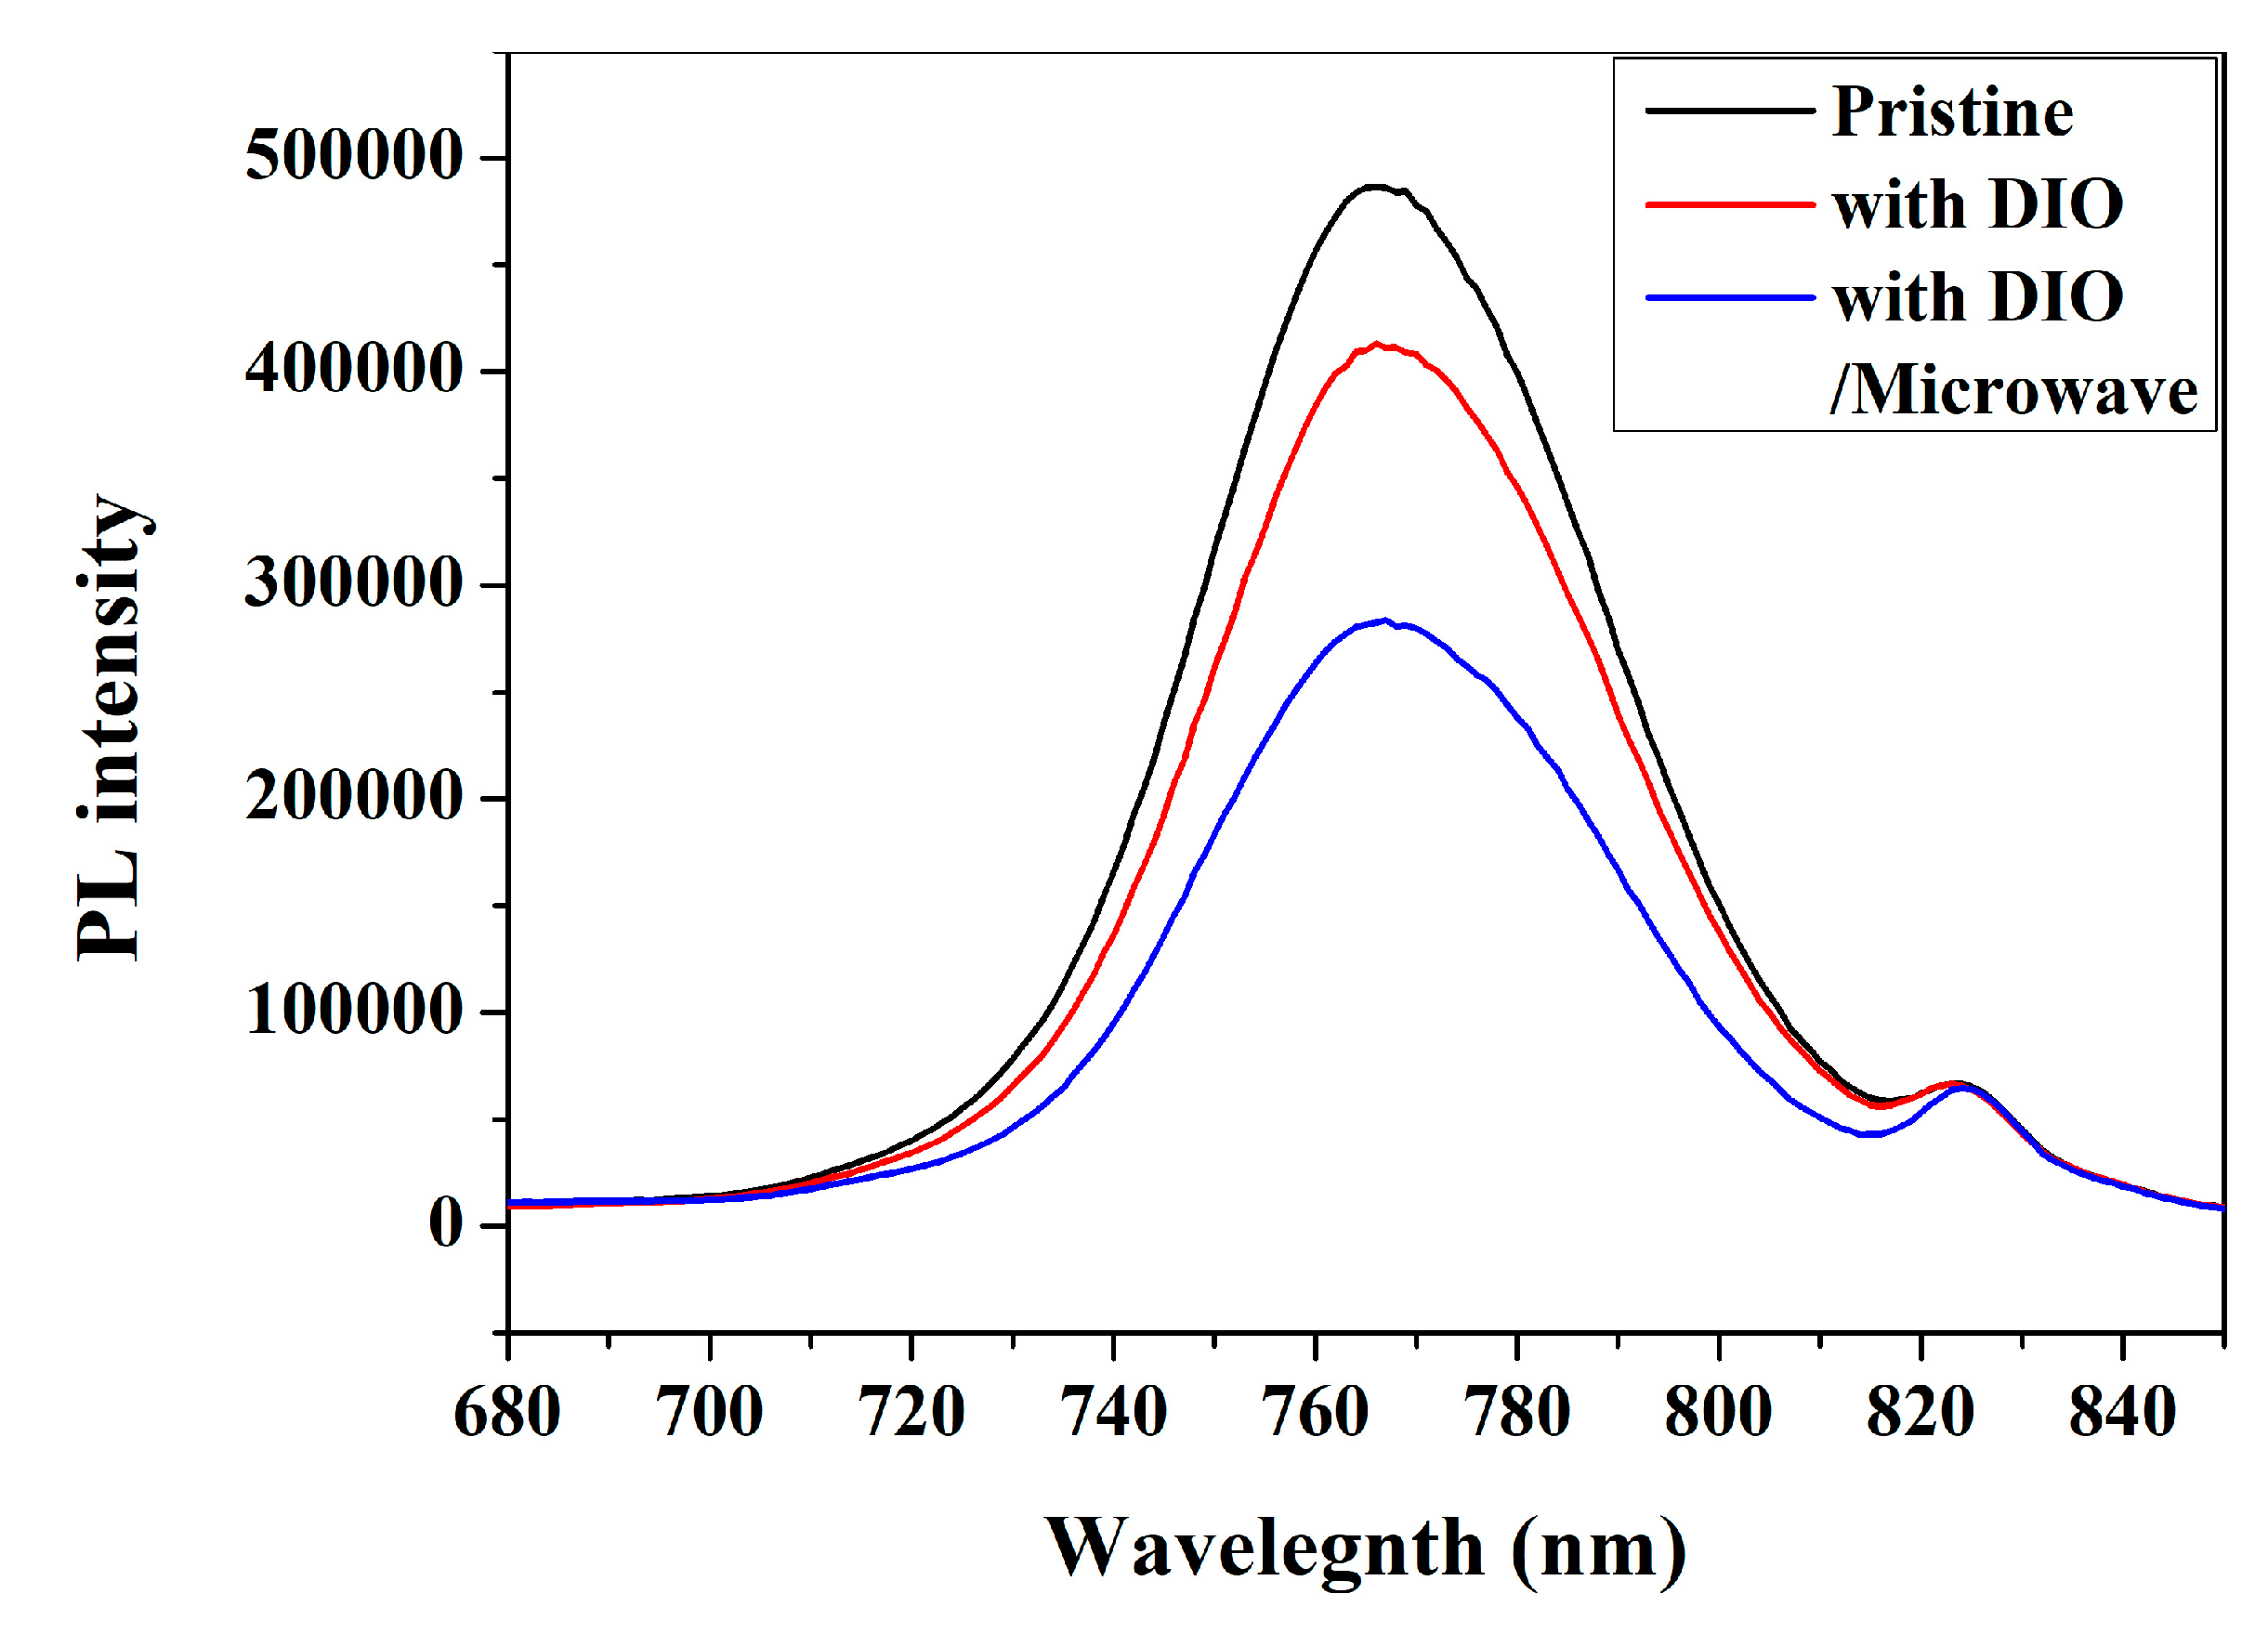
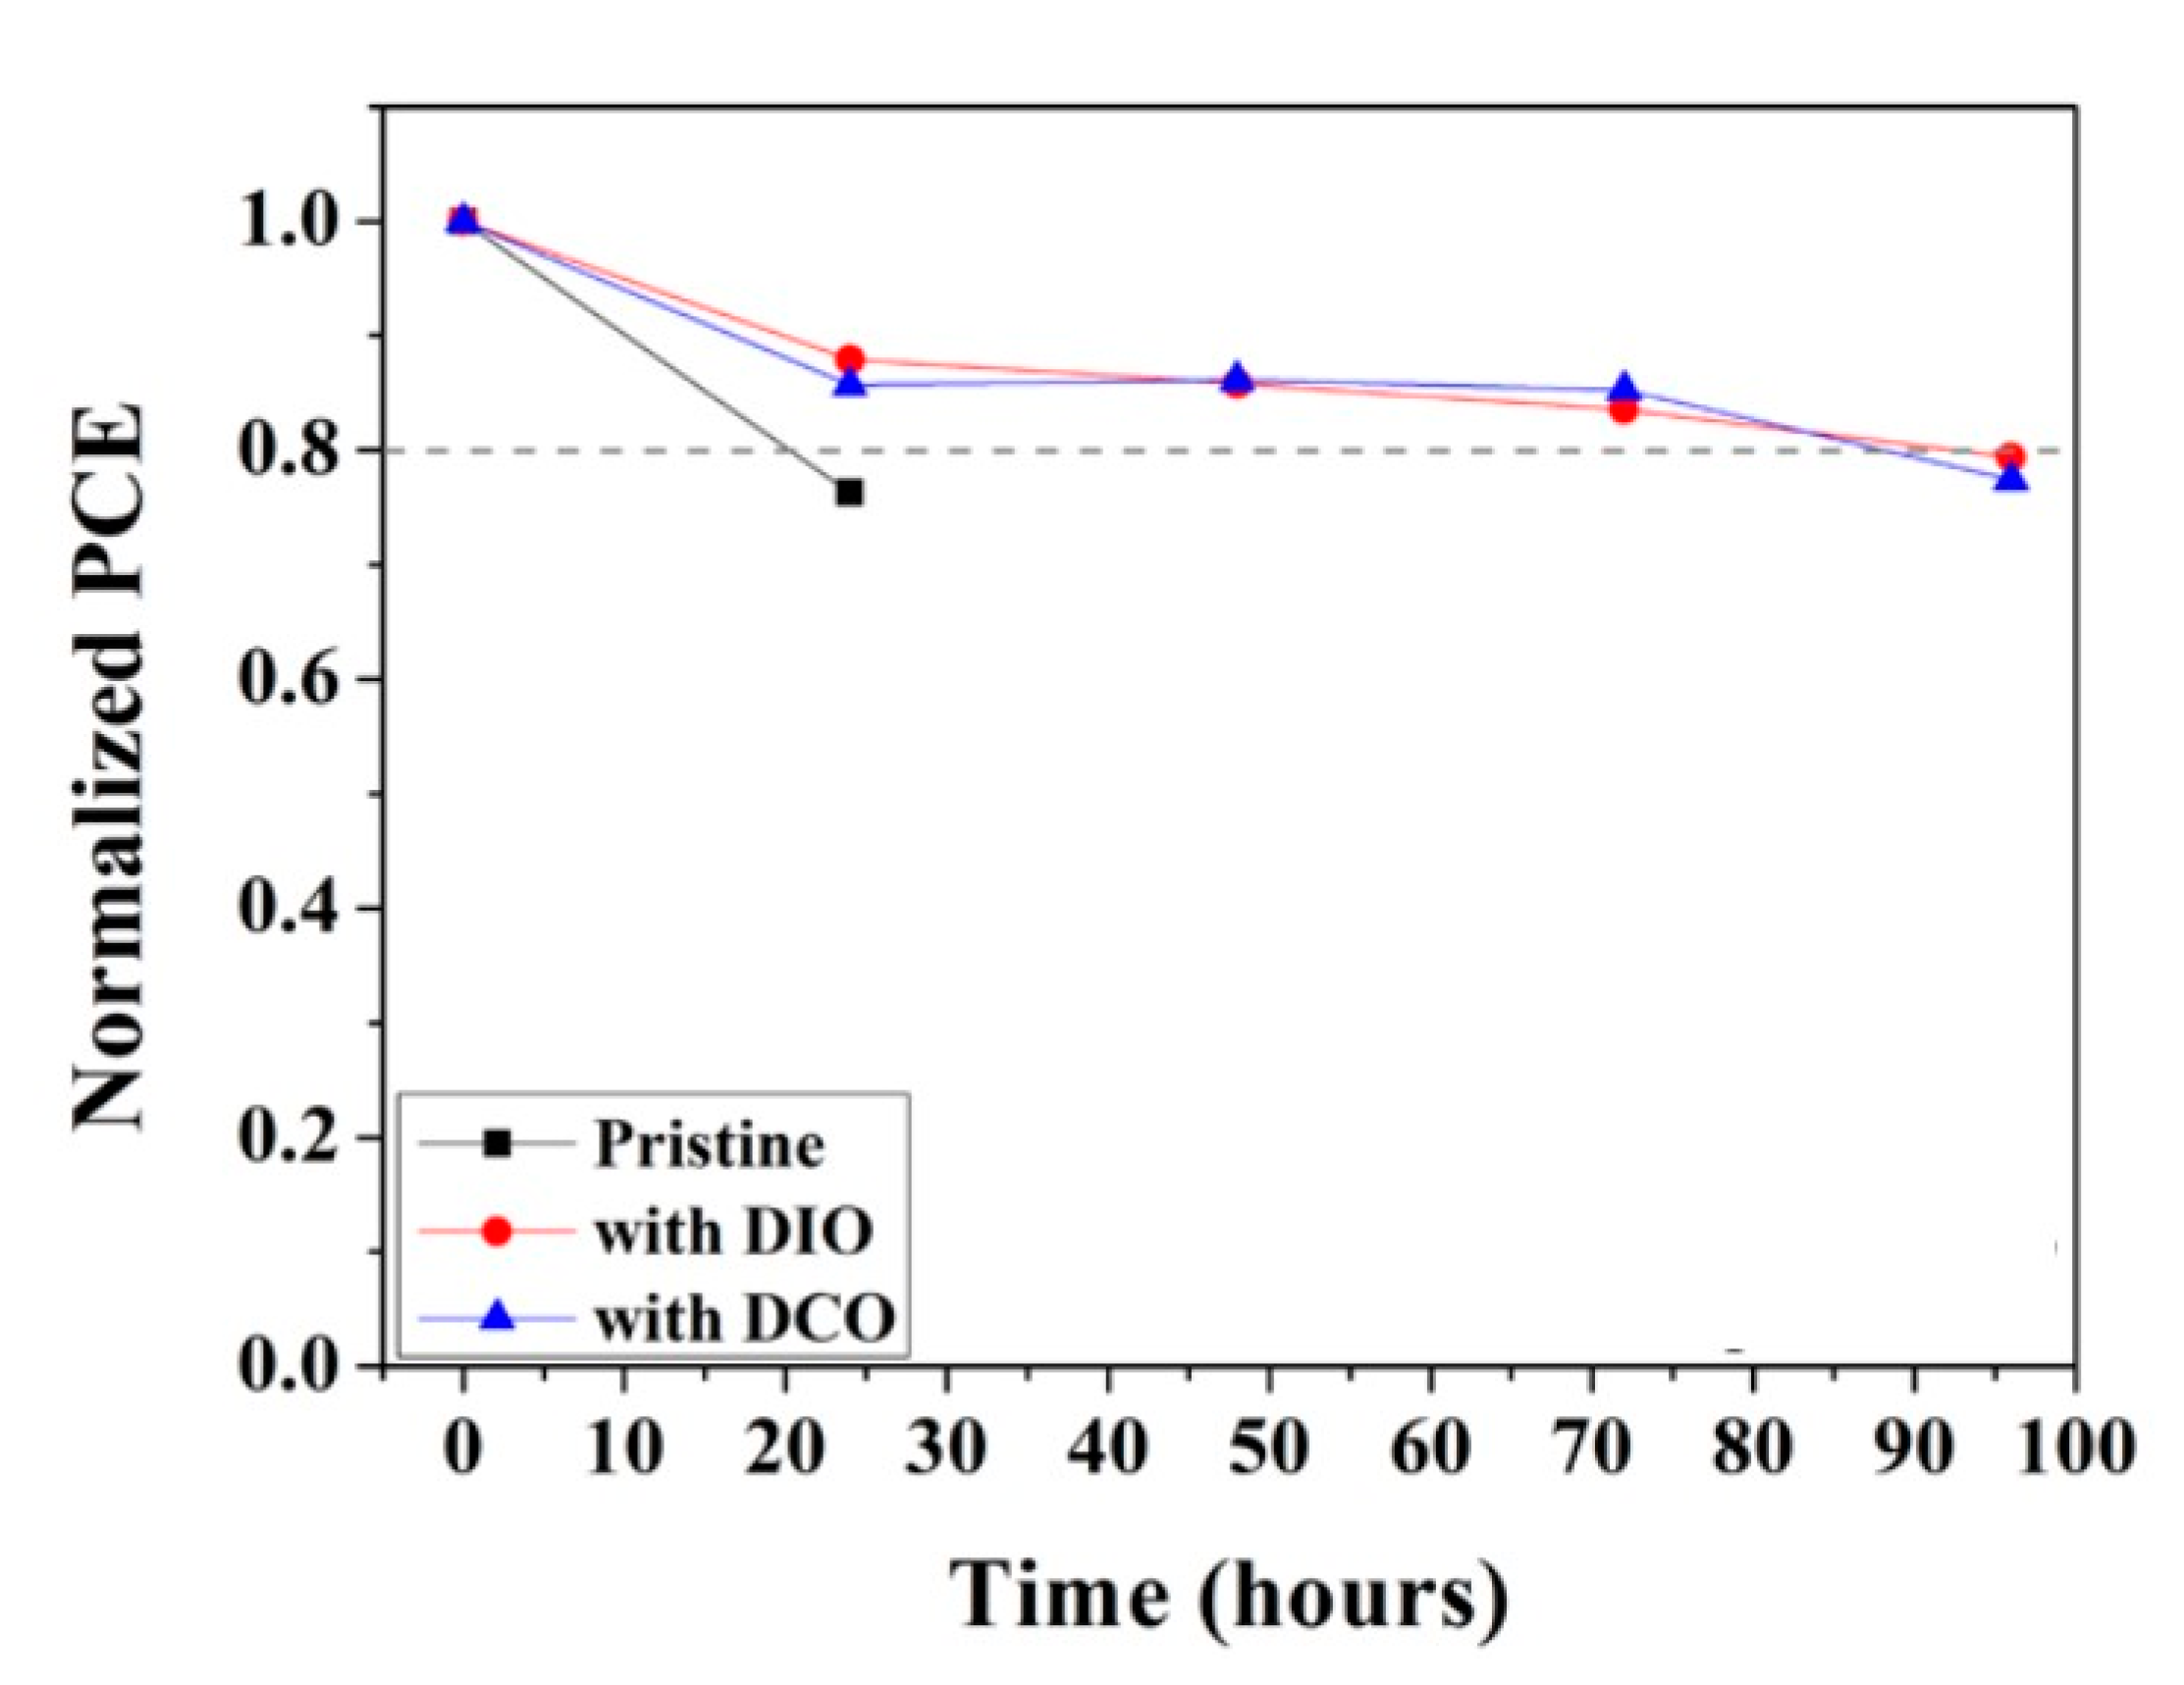
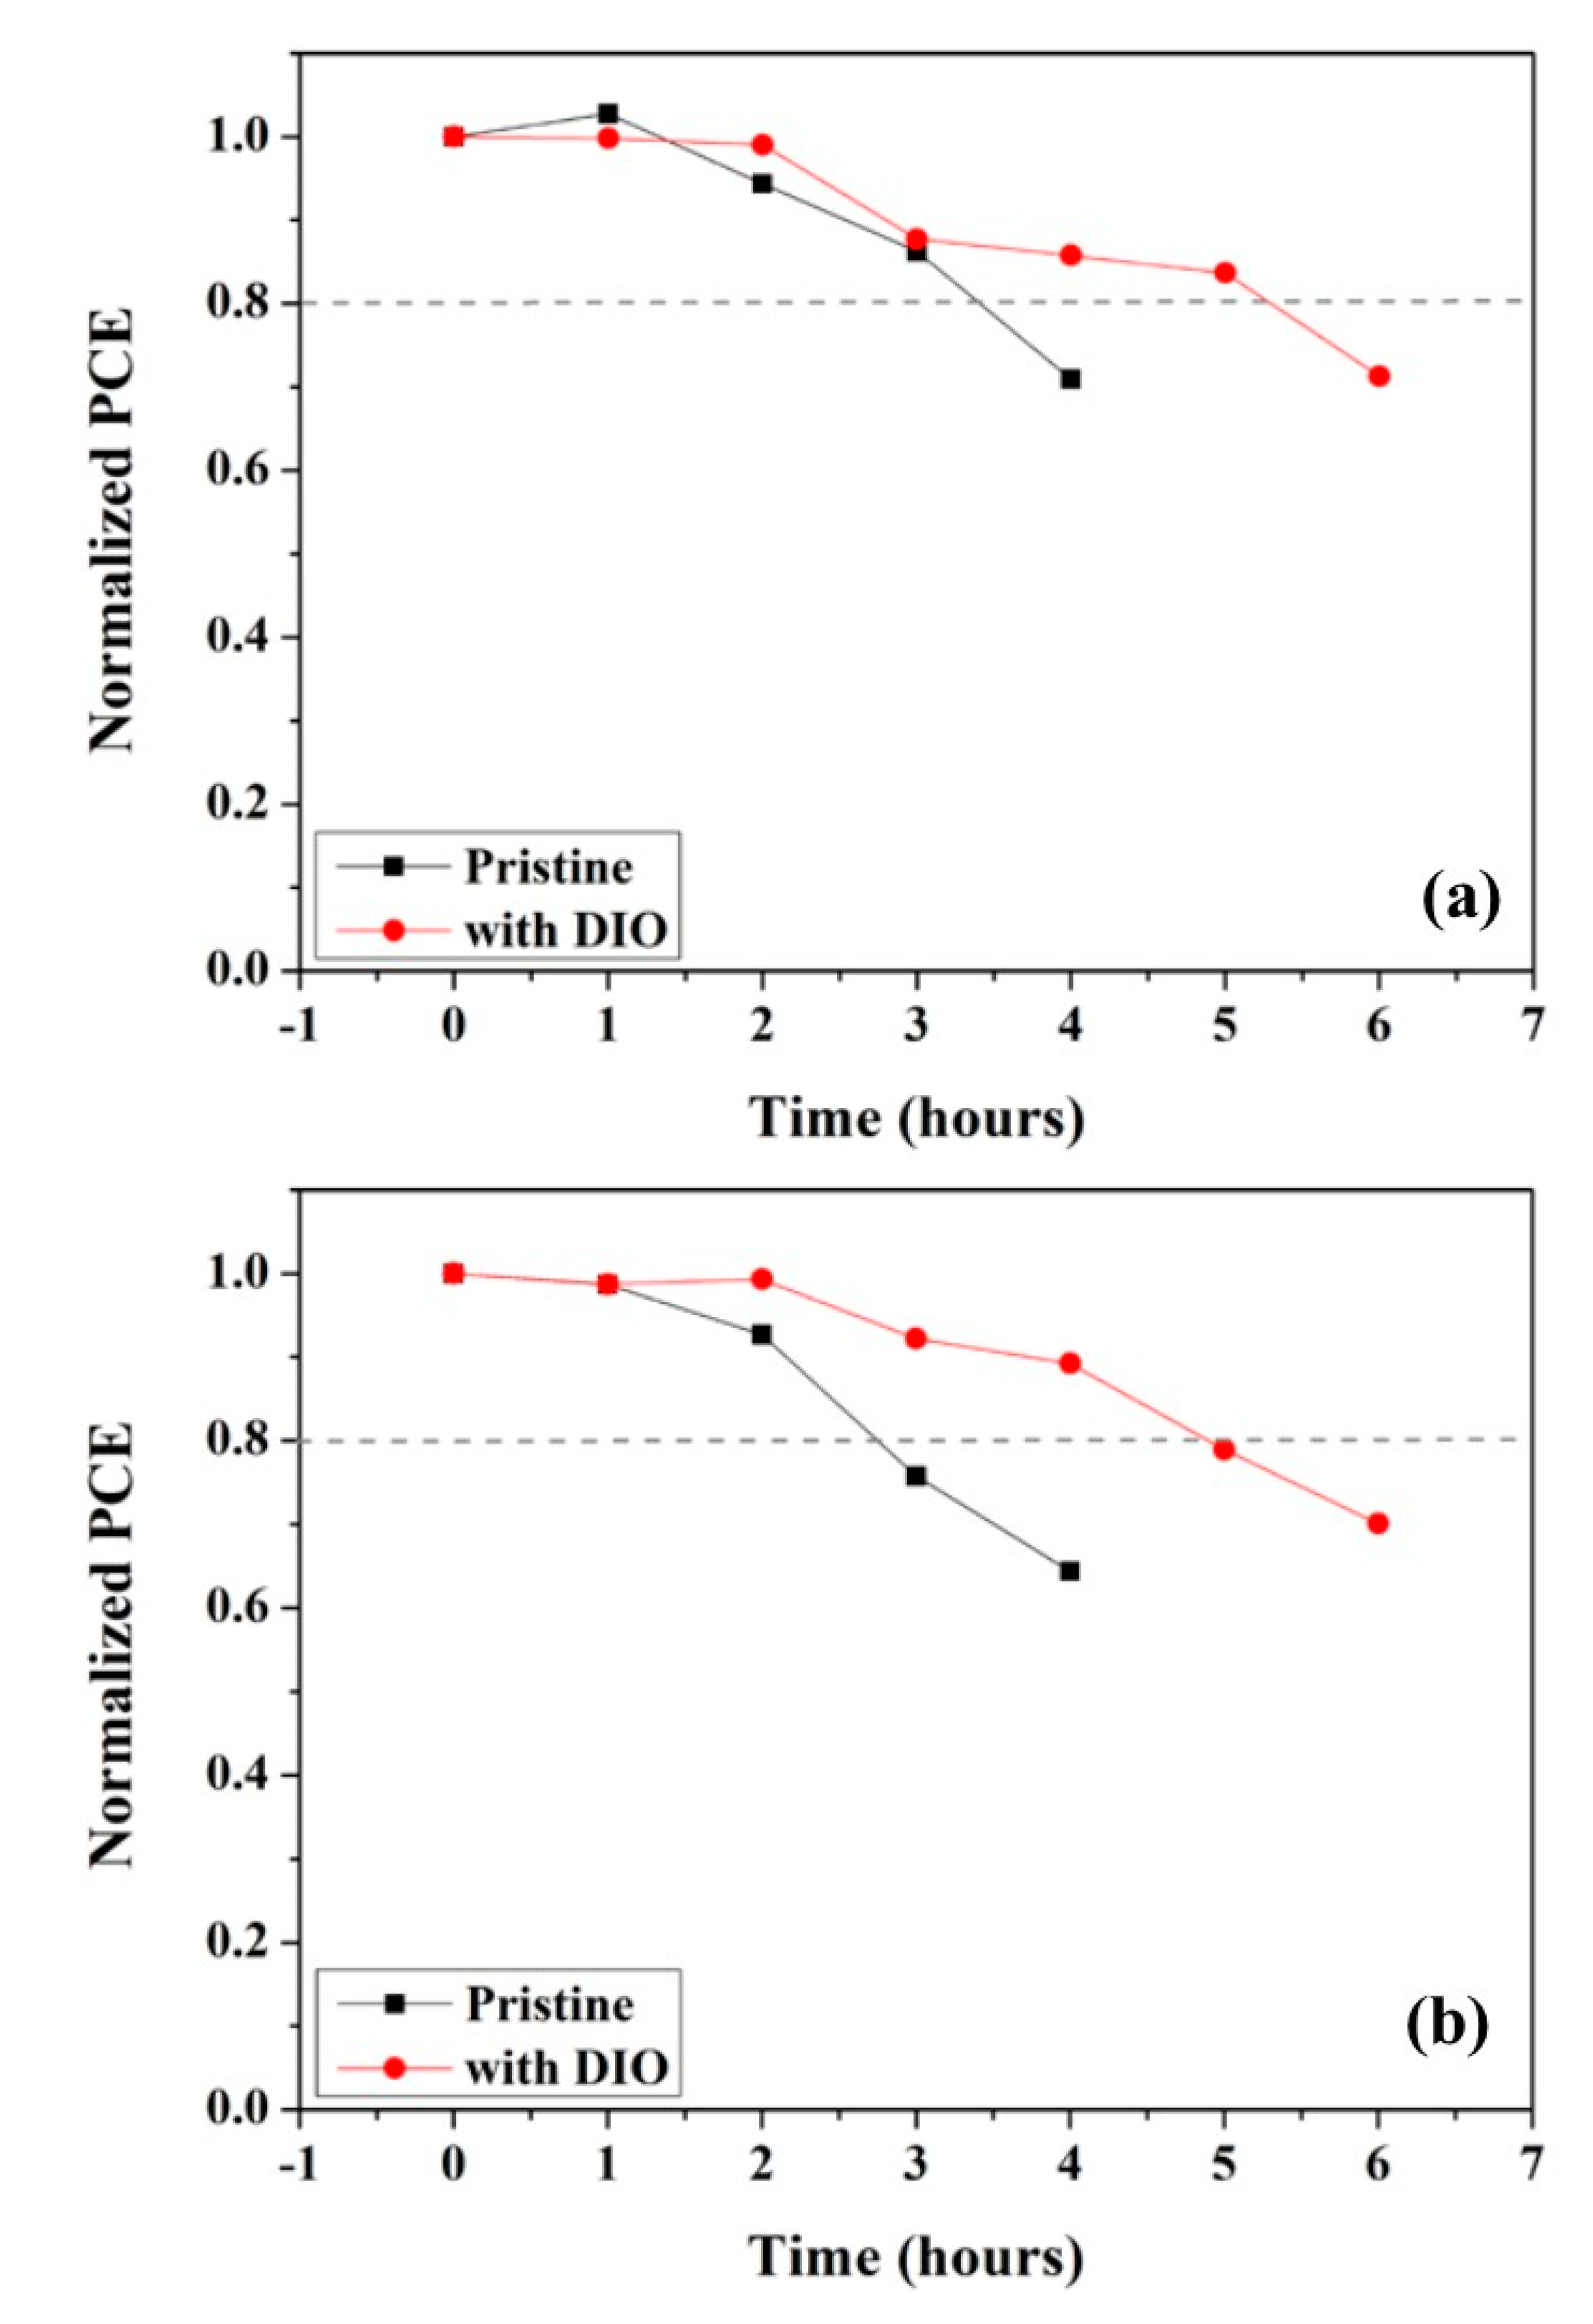
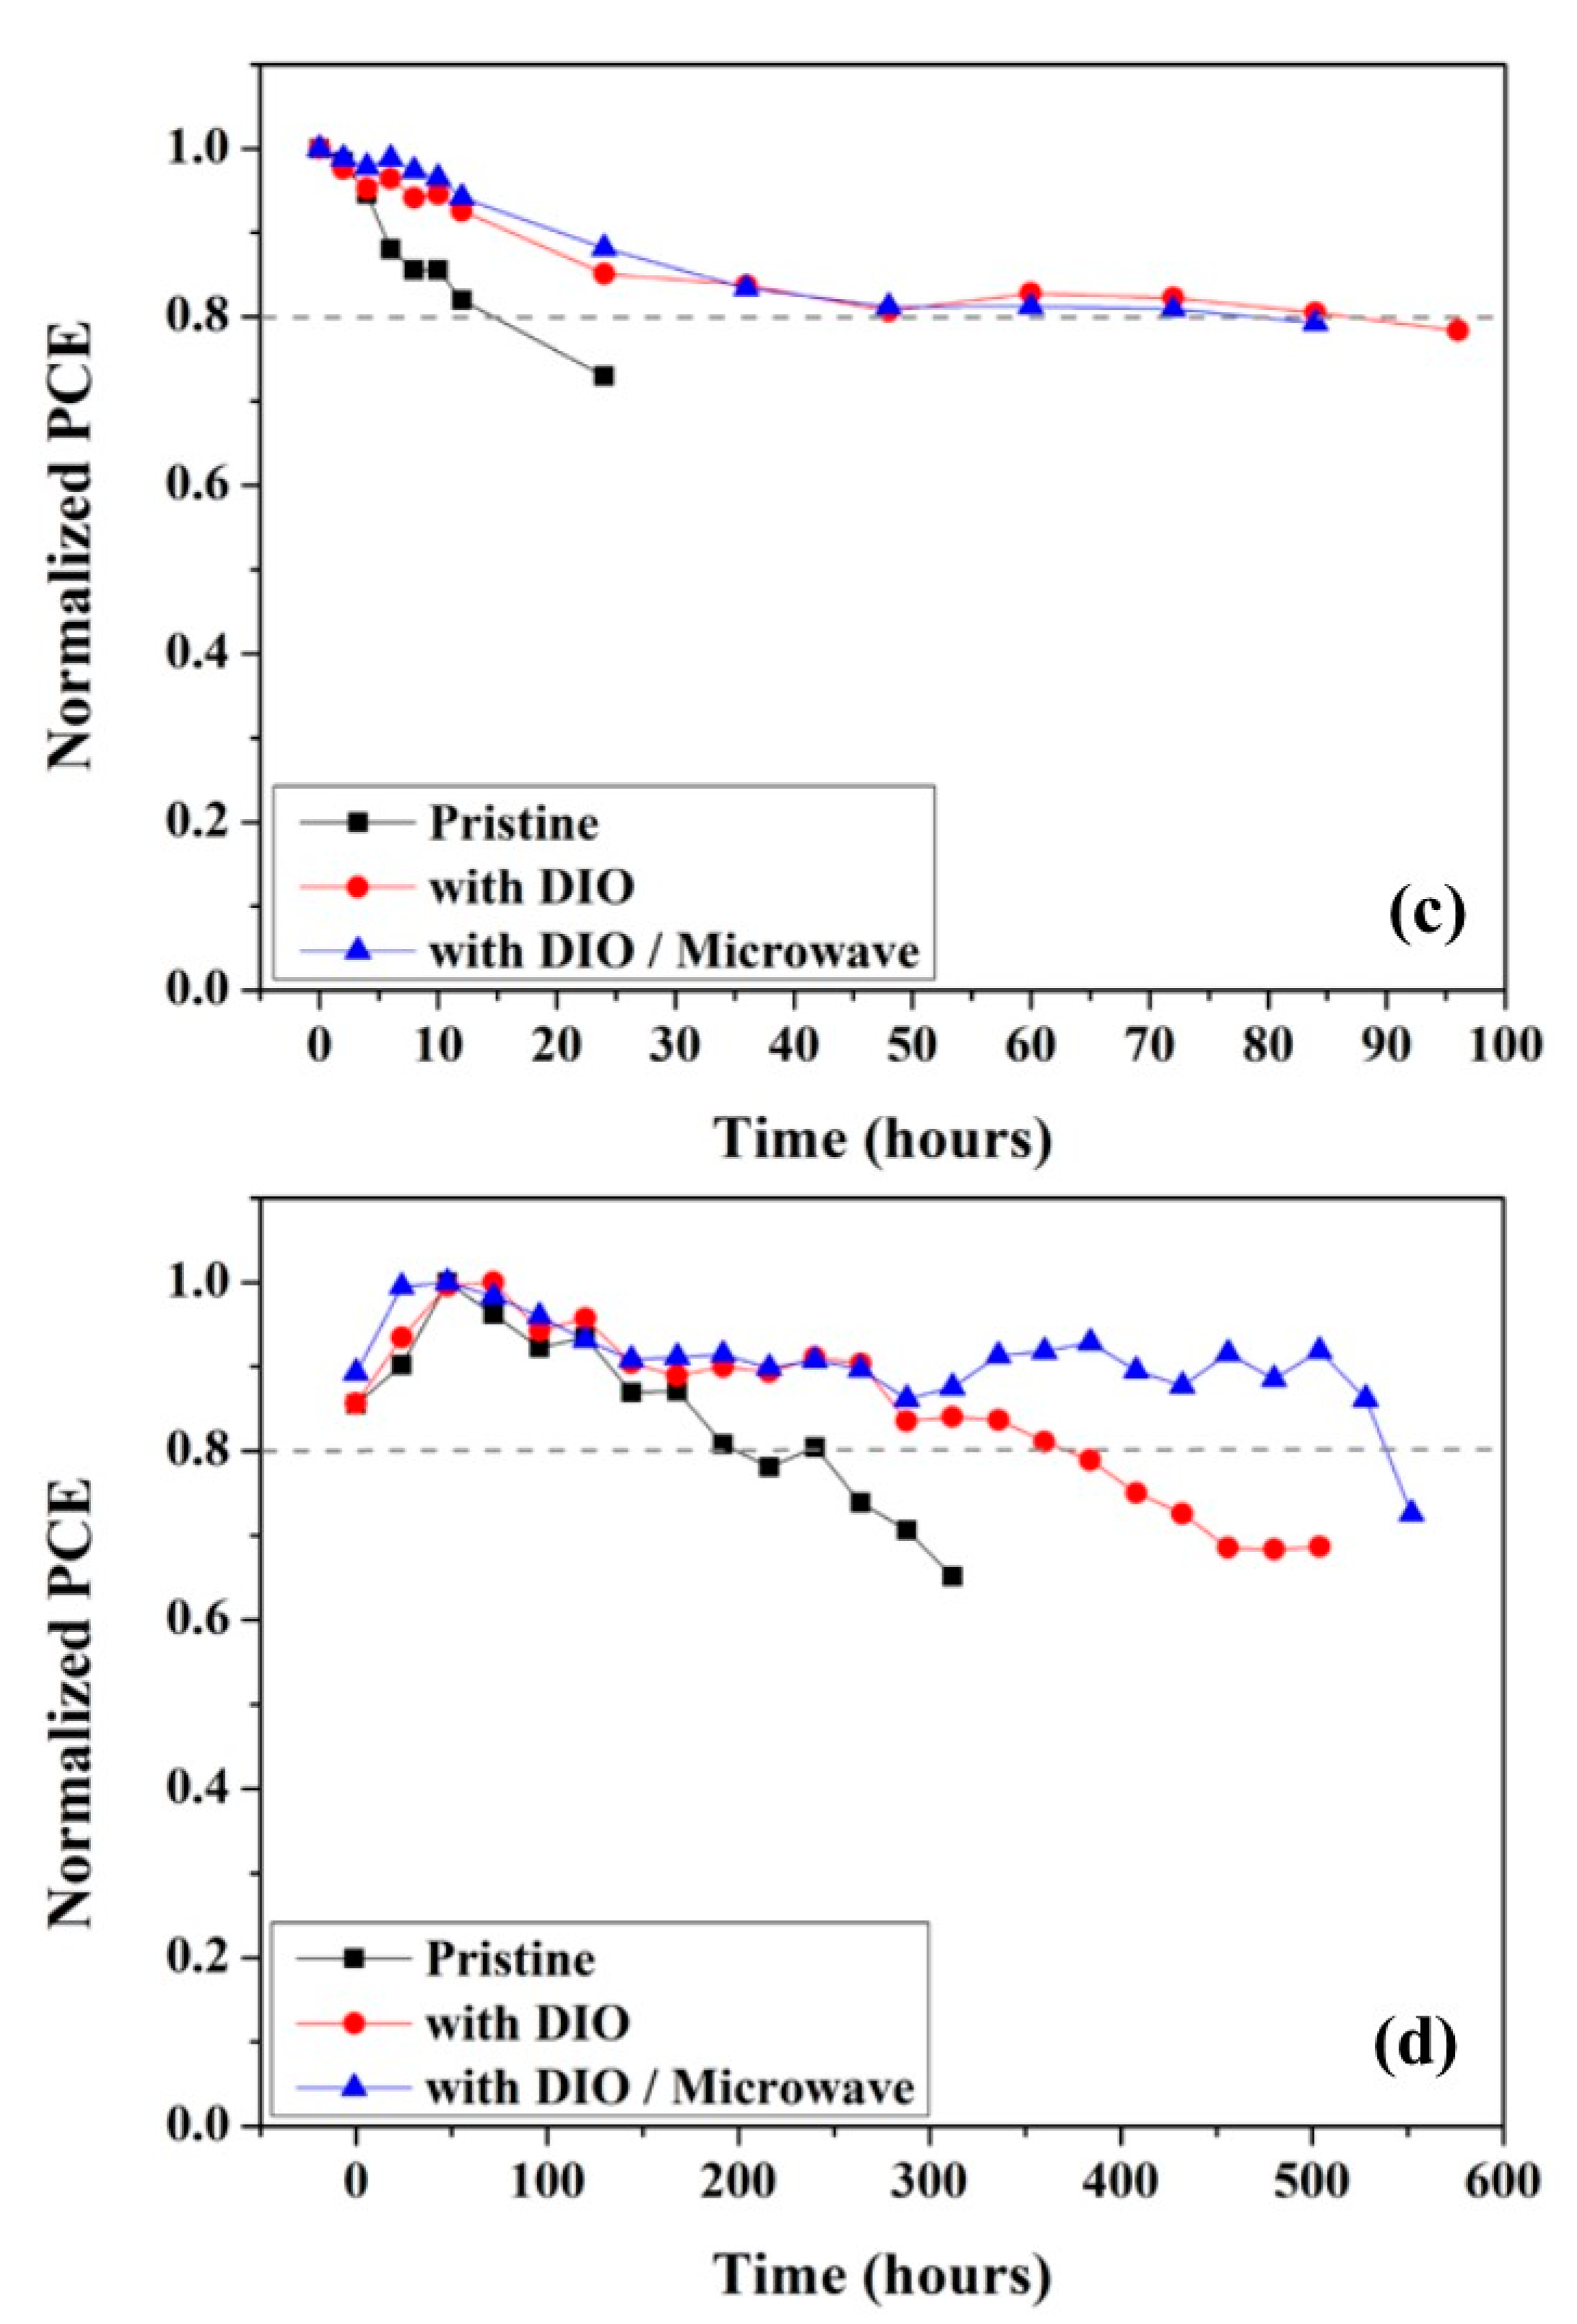
| C (wt%) | VOC (V) | JSC (mA/cm2) | FF (%) | PCE (%) |
|---|---|---|---|---|
| 0 | 0.964±0.008 | 20.30±0.26 | 67.47±2.34 | 13.20±0.31 |
| 1 | 0.971±0.010 | 20.35±0.67 | 67.93±1.57 | 13.42±0.60 |
| 1.5 | 0.970±0.010 | 20.97±0.88 | 68.91±3.23 | 14.01±0.50 |
| 2.5 | 0.940±0.048 | 20.07±0.54 | 71.37±3.19 | 13.44±0.64 |
| C (wt%) | VOC (V) | JSC (mA/cm2) | FF (%) | PCE (%) |
|---|---|---|---|---|
| 0 | 1.023±0.005 | 19.37±0.59 | 66.85±0.88 | 13.24±0.23 |
| 0.5 | 1.031±0.003 | 20.77±0.71 | 64.34±3.52 | 13.76±0.31 |
| 0.75 | 1.031±0.008 | 21.00±0.89 | 65.57±3.81 | 14.17±0.52 |
| 1 | 1.027±0.008 | 20.68±0.62 | 67.29±3.78 | 14.27±0.52 |
| 1.25 | 1.026±0.025 | 19.91±1.41 | 68.96±4.22 | 14.06±0.48 |
| Conditions | VOC (V) | JSC (mA/cm2) | FF (%) | PCE (%) |
|---|---|---|---|---|
| Thermal, undoped | 0.964±0.008 | 20.30±0.26 | 67.47±2.34 | 13.20±0.31 |
| Thermal, 2wt% DIO | 0.991±0.024 | 21.04±0.86 | 69.20±0.97 | 14.42±0.39 |
| Microwave, 2wt% DIO | 0.988±0.019 | 20.64±1.09 | 70.91±2.83 | 14.44±0.54 |
| As prepared (%) |
1 day (%) |
2 days (%) |
3 days (%) |
4 days (%) |
5 days (%) |
||
|---|---|---|---|---|---|---|---|
| Undoped | Before Microwave | 12.69 | 9.01 | - | - | - | - |
| After Microwave | 13.20 | 10.07 | - | - | - | - | |
| DIO doped | Before Microwave | 14.44 | 12.10 | 11.88 | 11.57 | 11.37 | 10.71 |
| After Microwave | 14.61 | 12.84 | 12.54 | 12.21 | 11.60 | 11.19 | |
| Conditions | VOC (V) | JSC (mA/cm2) | FF (%) | PCE (%) |
|---|---|---|---|---|
| Undoped (0.09cm2) | 0.963 | 20.40 | 69.32 | 13.62 |
| 2wt% DIO (0.09cm2) | 0.958 | 22.40 | 70.04 | 15.03 |
| 2wt% + Microwave (0.09cm2) | 0.990 | 21.35 | 70.77 | 14.96 |
| Undoped (0.36cm2) | 0.849 | 19.19 | 61.15 | 9.96 |
| 2wt% DIO (0.36cm2) | 0.872 | 21.11 | 65.97 | 12.15 |
| 2wt% + Microwave (0.36cm2) | 0.869 | 21.25 | 66.14 | 12.21 |
Disclaimer/Publisher’s Note: The statements, opinions and data contained in all publications are solely those of the individual author(s) and contributor(s) and not of MDPI and/or the editor(s). MDPI and/or the editor(s) disclaim responsibility for any injury to people or property resulting from any ideas, methods, instructions or products referred to in the content. |
© 2023 by the authors. Licensee MDPI, Basel, Switzerland. This article is an open access article distributed under the terms and conditions of the Creative Commons Attribution (CC BY) license (http://creativecommons.org/licenses/by/4.0/).


