1. Introduction
According to the 2011 European Commission (EC) CBRN Glossary [
1]: «CBRN is an acronym for chemical, biological, radiological, and nuclear issues that could harm the society through their accidental or deliberate release, dissemination, or impacts. The term CBRN is a replacement for the cold war term NBC (nuclear, biological, and chemical), which had replaced the previous term ABC (atomic, biological, and chemical) that was used in the fifties. “N” covers the impact by an explosion of nuclear bombs and the misuse of fissile material, “R” stands for dispersion of radioactive material e.g. by a dirty bomb.», and CBRNe: «Is an acronym which includes beside CBRN explosive substances or events.».
CBRNe materials can be weaponized (W-CBRNe) or non-weaponized (NW-CBRNe). W-CBRNe materials include weapons of mass destruction (WMD) and are intentionally used in criminal and terrorist activities. NW-CBRNe materials, also referred to as hazardous materials (HAZMAT), are linked to unintentional incidents or military operations as a secondary hazard. In both cases, serious consequences are expected for the affected population, such as intoxication, infection, irradiation, and–not least–the spread of panic.
Although the use of noxious gases has already been reported in historical times, the first large-scale use of chemical warfare agents (CWA) on the battlefield dates to World War I [
2]: infamously known is the Second Battle of Ypres (22 April 1915) in which the Germans used chlorine gas. Despite the Chemical Weapons Convention [
3], their use has also been reported in recent times, for example in the Syrian crisis [
4]. In addition, CWAs are now among the arrows in terrorists’ bows, as happened in the Tokyo subway [
5]. Spy agencies also employed them as in the poisoning of Sergei and Yulia Skripal [
6].
As mentioned, the occurrence of serious CBRNe accidents can also be unintentional, as the two following well-known chemical incidents demonstrate: 1) Seveso accident, 1976 (no fatalities but hundreds chloracne cases, decreased fertility, and increased risk of cancer and cardiometabolic outcomes) [
7]; 2) Bhopal Disaster, 1984 (about 4000 fatalities) [
8].
Since 2017 [
9], the Diagnostics and Metrology Laboratory (NUC-TECFIS-DIM) of the Italian National Agency for New Technologies, Energy and Sustainable Economic Development (ENEA) has been carrying out research in laser photoacoustic spectroscopy (LPAS) [
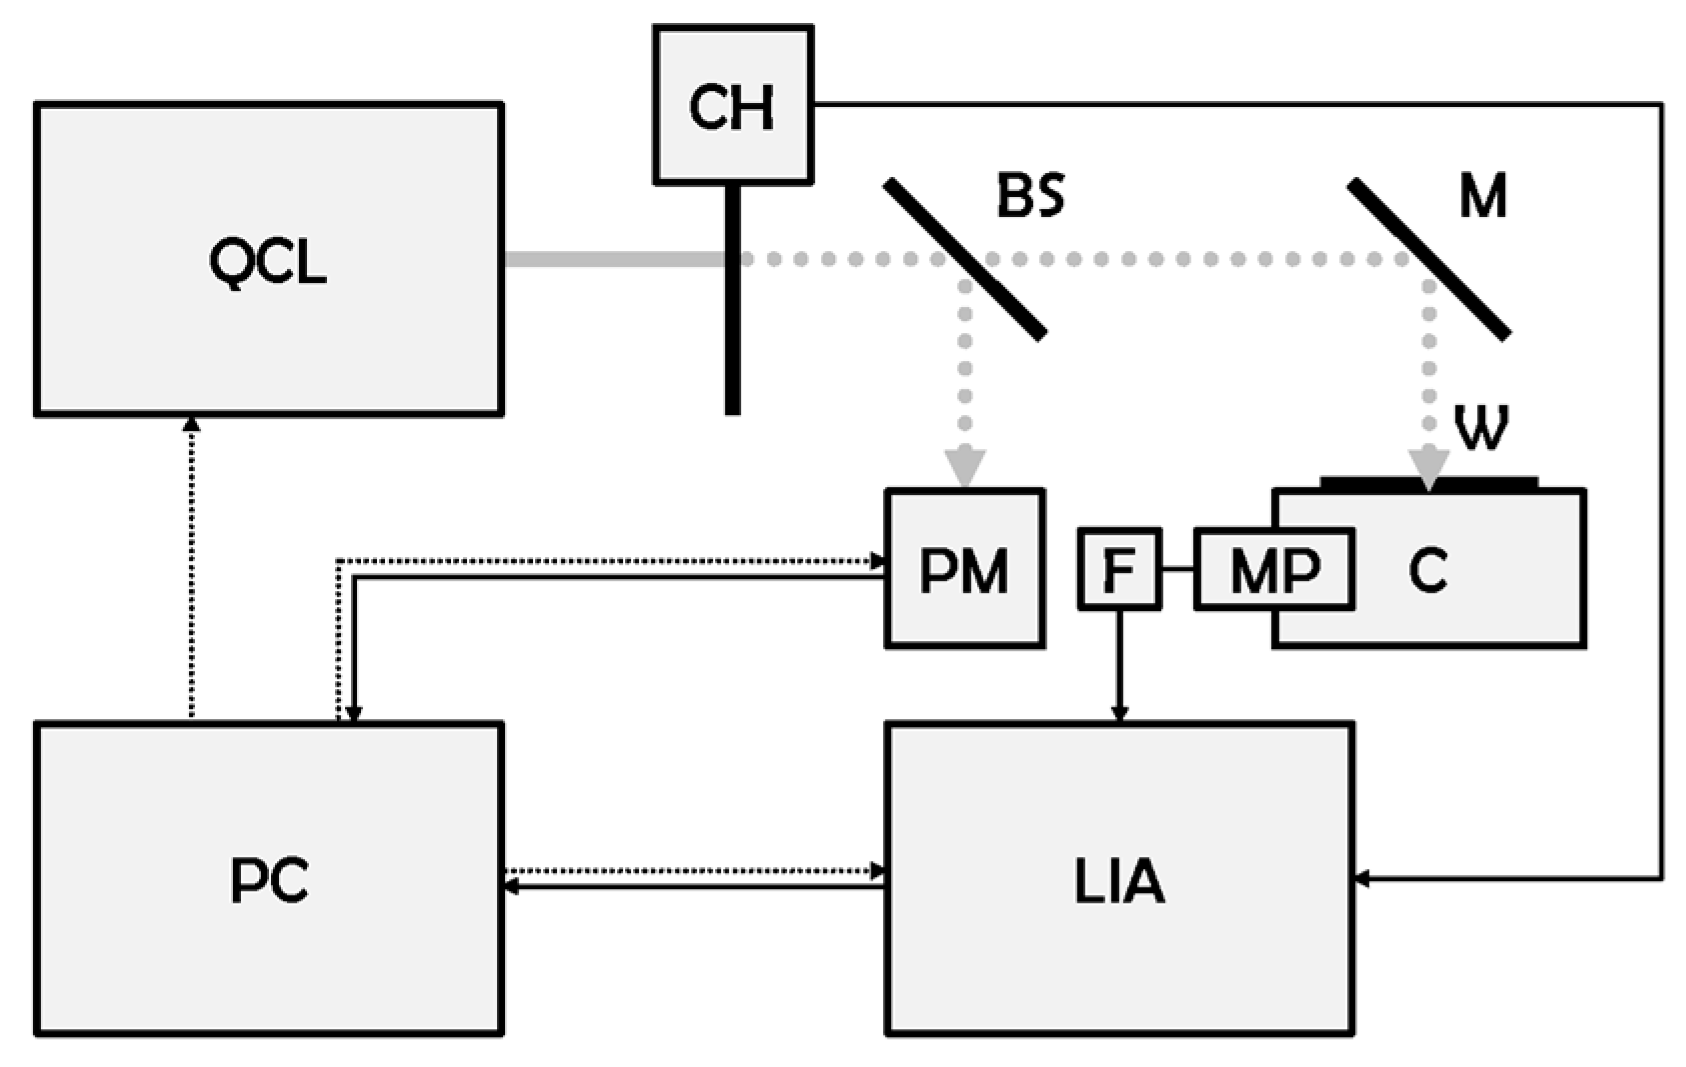
10]. In an LPAS experiment, a laser beam is modulated at an audio frequency and directed into an acoustic cell where it is absorbed by the sample under investigation. The heating and resulting increase in volume in the irradiated area causes a pressure wave that is detected by a microphone connected to a lock-in amplifier (LIA) synchronised with the modulator, which produces an output signal proportional to the absorption of the sample. Laser wavelength scanning is typically used to obtain the spectrum in the “fingerprint region”, a broad infrared (IR) band in which many organic compounds can be detected. The main advantage of LPAS over traditional lamp-based IR spectroscopy is the unparalleled power of the source, which offers rapidity, sensitivity, specificity, simplicity, repeatability, in situ measurement, uncomplicated sampling, ease of use and cost-effectiveness.
Although LPAS is most often applied to aeriform [
11], recent research at NUC-TECFIS-DIM has focused on liquid and–more often–solid samples and a quantum cascade laser (QCL) based LPAS system has been developed [
12], upgraded [
13] and patented [
14]. The system has been applied to assess the safety and authenticity of fruit juices, oil, milk, pollen, rice (flour and cereals), seafood and spices [
15] In particular, it has been used to detect saffron fraud [
16], to spot the production zones of various olive cultivars [
17] and to identify oregano adulteration [
18,
19].
Chemometric techniques have largely proven to be a powerful tool to accurately extract valuable information from a set of seemingly indistinguishable spectra. Recent research at NUC-TECFIS-DIM has demonstrated that it is possible to obtain the multivariate calibration of the system to measure the amount of oregano in an unknown sample within minutes with a detection limit of the order of a few per cent [
18].
The EC funded MoSaiC project [
20] is aimed at real-time monitoring of CBRNe events coupled with innovative sampling to improve the dynamic mapping of threats and vulnerabilities, and response skills, including addressing CBRNe forensic priorities. The initiative adds abilities to existing detection, identification, and monitoring (DIM) platforms by working on a range of sensing capabilities and their integration. These capabilities include:
Research into innovative and low-cost chemical and biological monitoring technologies, with a focus on miniaturisation of existing technological solutions.
Sampling technologies based on the concept of “smart swabs” to enable rapid and non-destructive analysis of a sample for later laboratory analysis.
Unmanned aerial vehicles (UAV) and unmanned ground vehicles (UGV) for surveillance and sampling.
Real-time indoor and outdoor three-dimensional (3D) mapping and data processing of affected areas.
Real-time four-dimensional (4D)–i.e., 3D + time–visualisation for incident commanders, providing cost-effective monitoring capabilities, including data flow.
Real-time communication between vehicles/sensors and command and control (C2) systems for decision support.
NUC-TECFIS-DIM contributes to the following three “key areas of innovation”:
Smart swab for chemical and biological sampling and monitoring. A sample is taken from a surface using a SERS-active swab to enable (i) near real-time non-destructive on-site detection and classification of a chemical or biological threat and, if positive, (ii) off-site analysis of the same sample in the laboratory using standard forensic methods. The swabbing, on-site analysis and storage of the sample can be performed by a small UGV equipped with a robotic arm, a Raman probe, and simple opto-electro-mechanical interfaces.
Laser-induced breakdown spectroscopy (LIBS) for stand-off monitoring of biological threats. A compact LIBS instrument for on-board UGV operation and stand-off detection of biological agents in aerosols and on surfaces has been developed with the ability to discriminate between interferants/substrates and with a processing algorithm to reduce false positives/negatives.
LPAS for chemical threat monitoring. The instrument is based on a QCL, and the development of a LIA built on a field programmable gate array (FPGA). Chemometric techniques–principal component analysis (PCA), partial least square regression (PLS) or others–are used to analyse the acoustic signals generated by the thermal relaxation of the IR laser absorption of the analytes. The sensor is compact and autonomous for operation on board robotic UGVs.
The results achieved to date in the latter “key area of innovation” i.e. a preliminary application to the detection of CWAs by LPAS combined with chemometrics [
21] will be reported in this paper.
2. Materials and Methods
2.1. LPAS System
The LPAS system has already been described in detail in this journal [
18]. However, we reproduce here for the convenience of the reader:
main specifications of the QCL, its core device (
Table 2).
2.2. Experiment Control
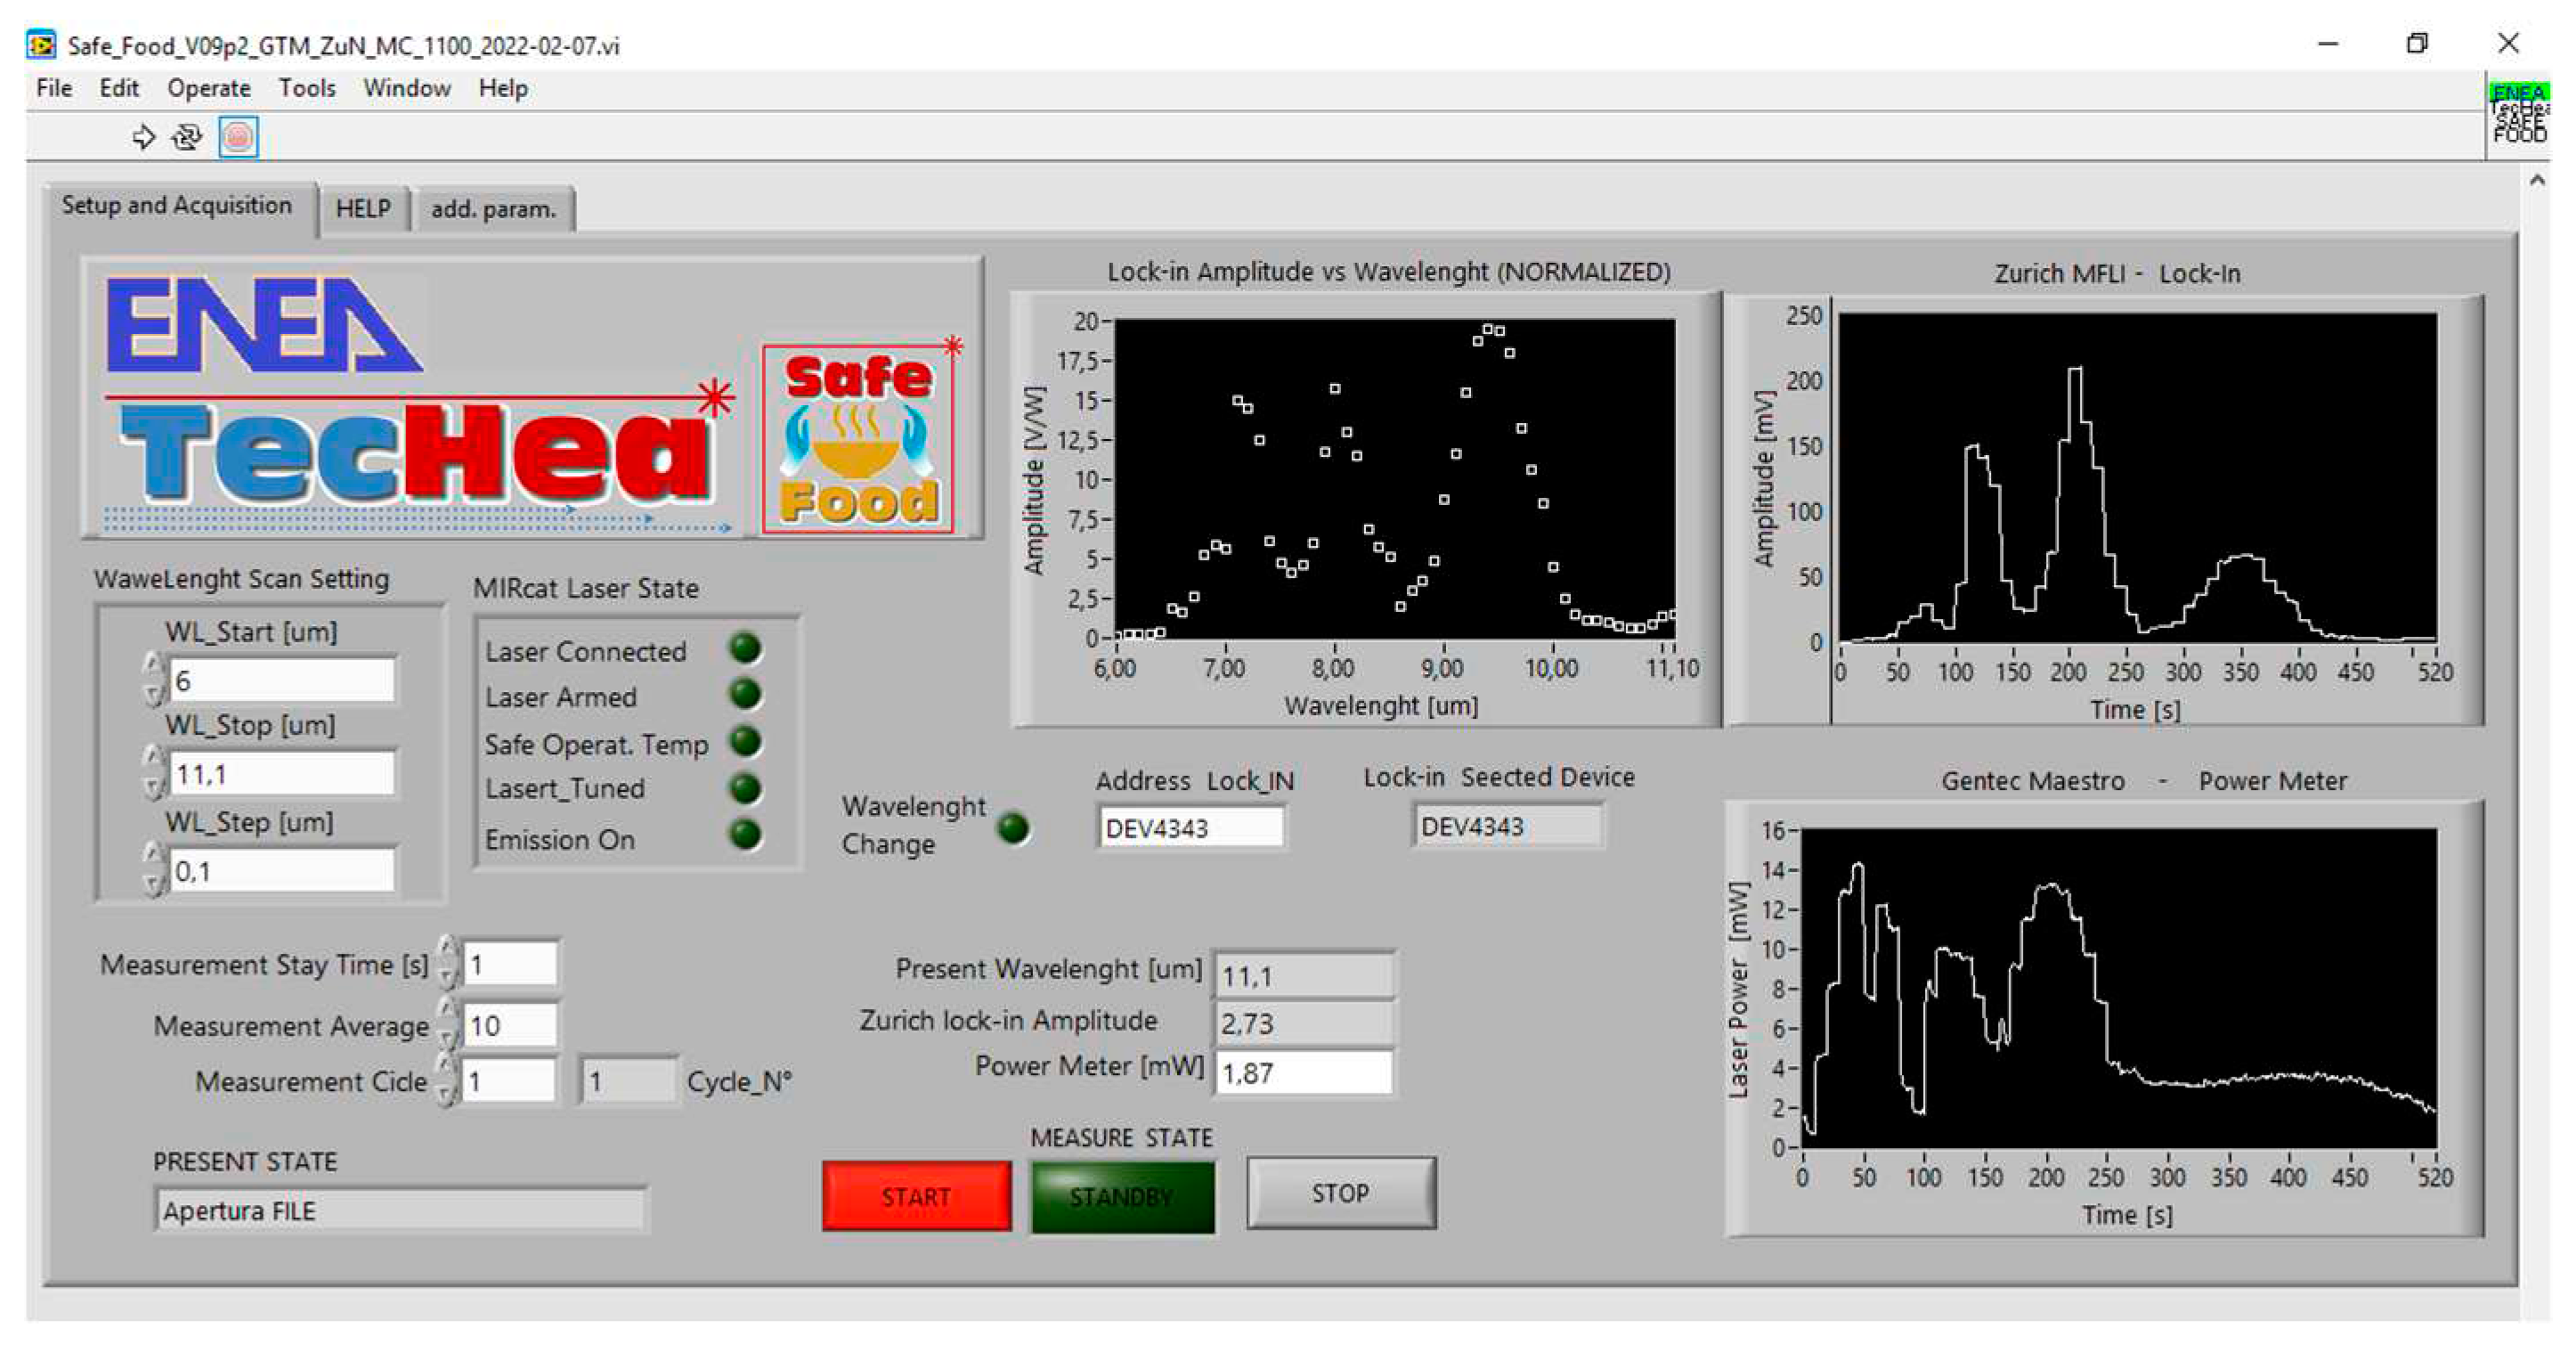
The experiment is controlled by a LabVIEW application developed at NUC-TECFIS-DIM. The LIA communicates through an Electronic Industries Alliance recommended standard 232 (RS-232) serial interface. Digital interface with the PC is accomplished via a universal serial bus (USB) virtual serial port converter. Data format complies with Unicode transformation format, 8 bit (UTF-8) American standard code for information interchange (ASCII). The communication protocol is handled by a home-made LabVIEW driver. QCL and power meter are connected to a USB hub which–in turn–is linked to the PC. The output file uses a plain ASCII format, which is easily readable and can be imported into MATLAB, Excel, or other post-processing applications. Data file names are automatically generated, to make it impossible to accidentally overwrite previous measurements.
The graphic user interface (GUI) (
Figure 2) requires the three parameters of the spectrum (wavelength minimum, maximum and step) and the number of measurements to be repeated at each wavelength (typical measurement duration: 1 s). Any point of the graphic of photoacoustic signal vs. wavelength (LPAS spectrum) is calculated by dividing the average of LIA voltages by the average of laser powers. Each measurement cycle can be repeated automatically, and the cycle number appears on the screen.
2.3. Sample Preparation
As was mentioned in the introduction, in this study we focused on CWAs that can be used in battlefields, terrorist attacks and espionage wars. We cited the Syrian crisis, the Tokyo underground attack and the poisoning of Sergei and Yulia Skripal as examples. In all these cases, a nerve agent was used. To avoid the risks associated with such compounds, simulants are usually used in the laboratory. A typical nerve agent simulant is dimethyl methylphosphonate (DMMP) [
25]. Since both compounds have a phosphorous-oxygen double bond, they have an absorption peak at about 7.9 µm, which makes them detectable with the photoacoustic laser system.
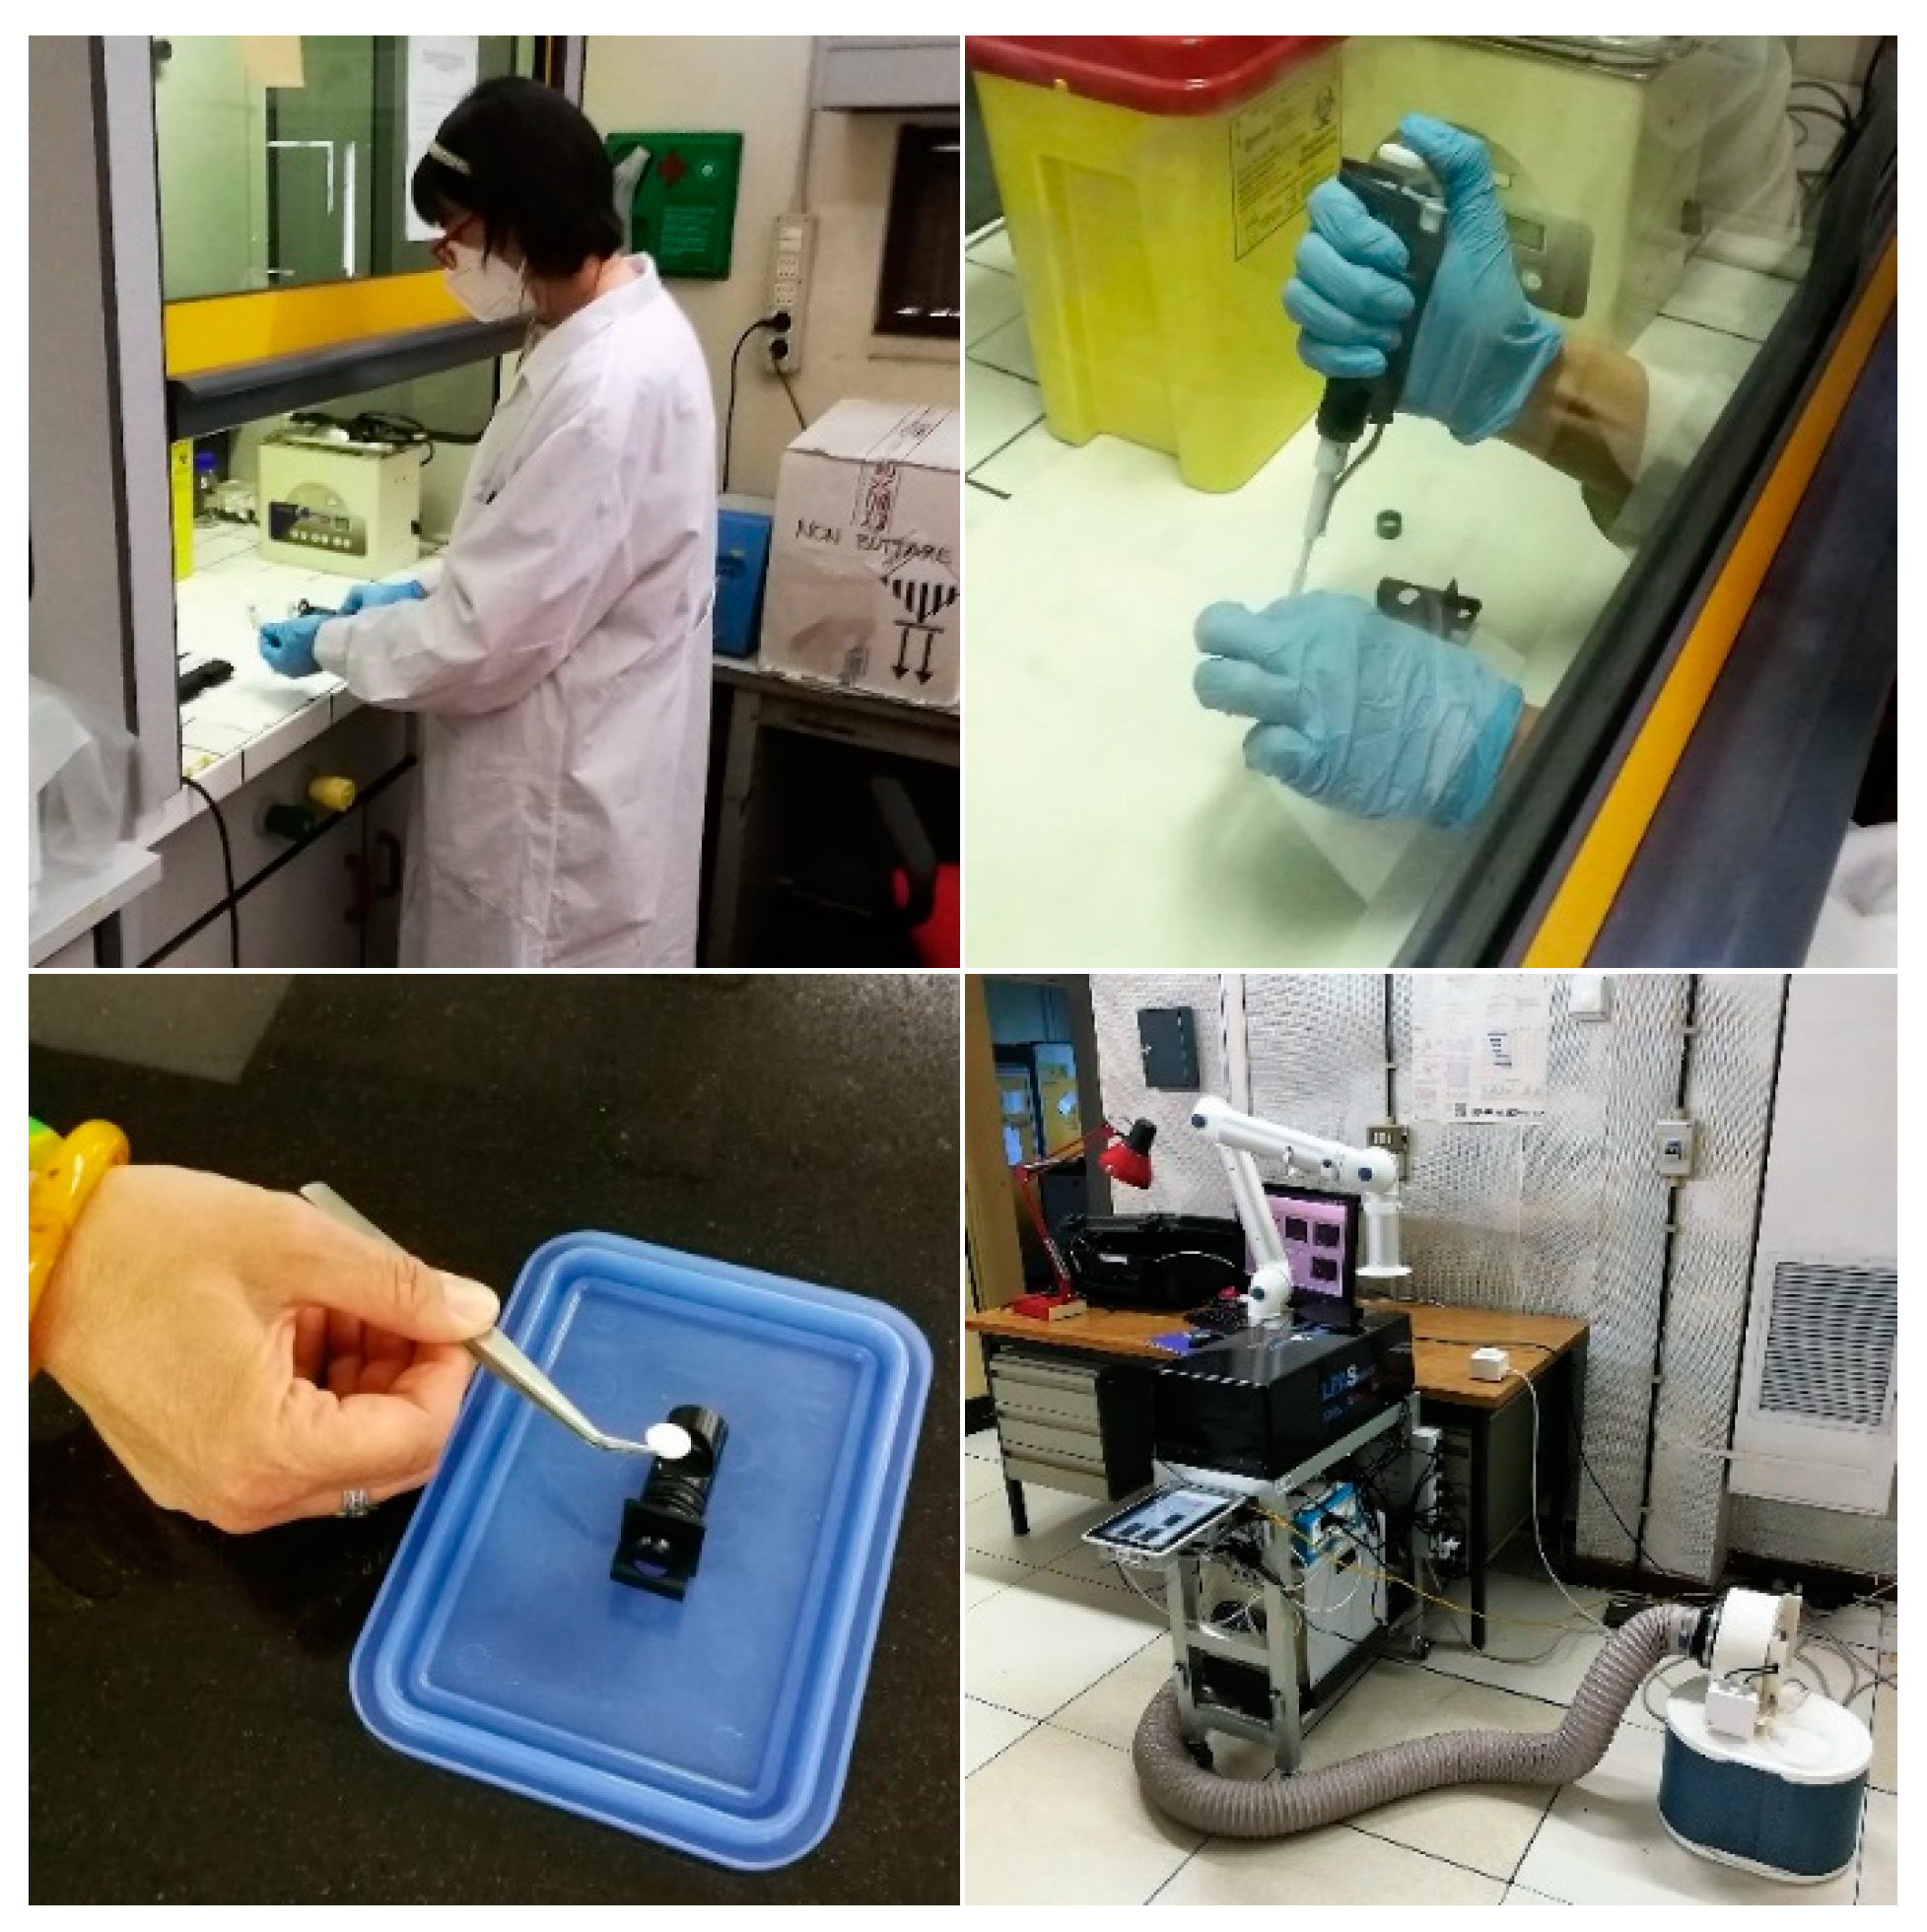
The scenario envisaged by the MoSaiC project involves a UGV travelling to the hot area and using a robotic arm to carry out a wipe test on a potentially contaminated surface by means of a paper smear, which is inserted into the photoacoustic cell via a motorised sample drawer. For this, samples were prepared by dropping 3 µl of DMMP onto 10 mm diameter filter paper discs simulating paper smears (
Figure 3) [
26].
For comparison, samples were also prepared by dropping 3 µl of ethanol onto discs of the same type. Then, after thoroughly testing the photoacoustic laser system with a standard material (activated carbon), the LPAS spectra of DMMP, ethanol and blank disc were measured.
2.4. Data Analysis
All spectra shown below were obtained as follows:
The QCL scanned the wavelengths from 7.00 to 10.00 μm with a step of 0.03 μm (101 wavelengths). Bearing in mind that the typical measurement time is 1 s, 101 wavelengths are scanned in approximately 2 minutes.
The LIA and power meter measured the photoacoustic signal (V) and laser power (W), respectively. Each measurement took 1 s and was repeated 60 times (note that this corresponds to the acquisition of 60 raw spectra).
The 60 measurements of signal and power were averaged (note that this is equivalent to acquiring a single average spectrum).
In both cases (raw and averaged spectra), the LPAS signal (V/W) is given by the ratio of the signal and power measurements (thus normalising the photoacoustic signal to the laser power). In other words, the LPAS signal of the nth raw spectrum at a given wavelength is simply the ratio of the photoacoustic signal of the nth raw spectrum at that wavelength to the simultaneous laser power measurement. Similarly, the LPAS signal of the averaged spectrum at a given wavelength is the ratio of the average of the 60 photoacoustic signals at that wavelength to the average of the 60 simultaneous laser power measurements.
The averaged spectra were plotted and compared with standard data from the US National Institute of Standards and Technology (NIST) [
27]. Finally, PCA and PLS [
28] were applied to the experimental data using OriginPro [
29] and ChemFlow [
30].
3. Results and Discussion
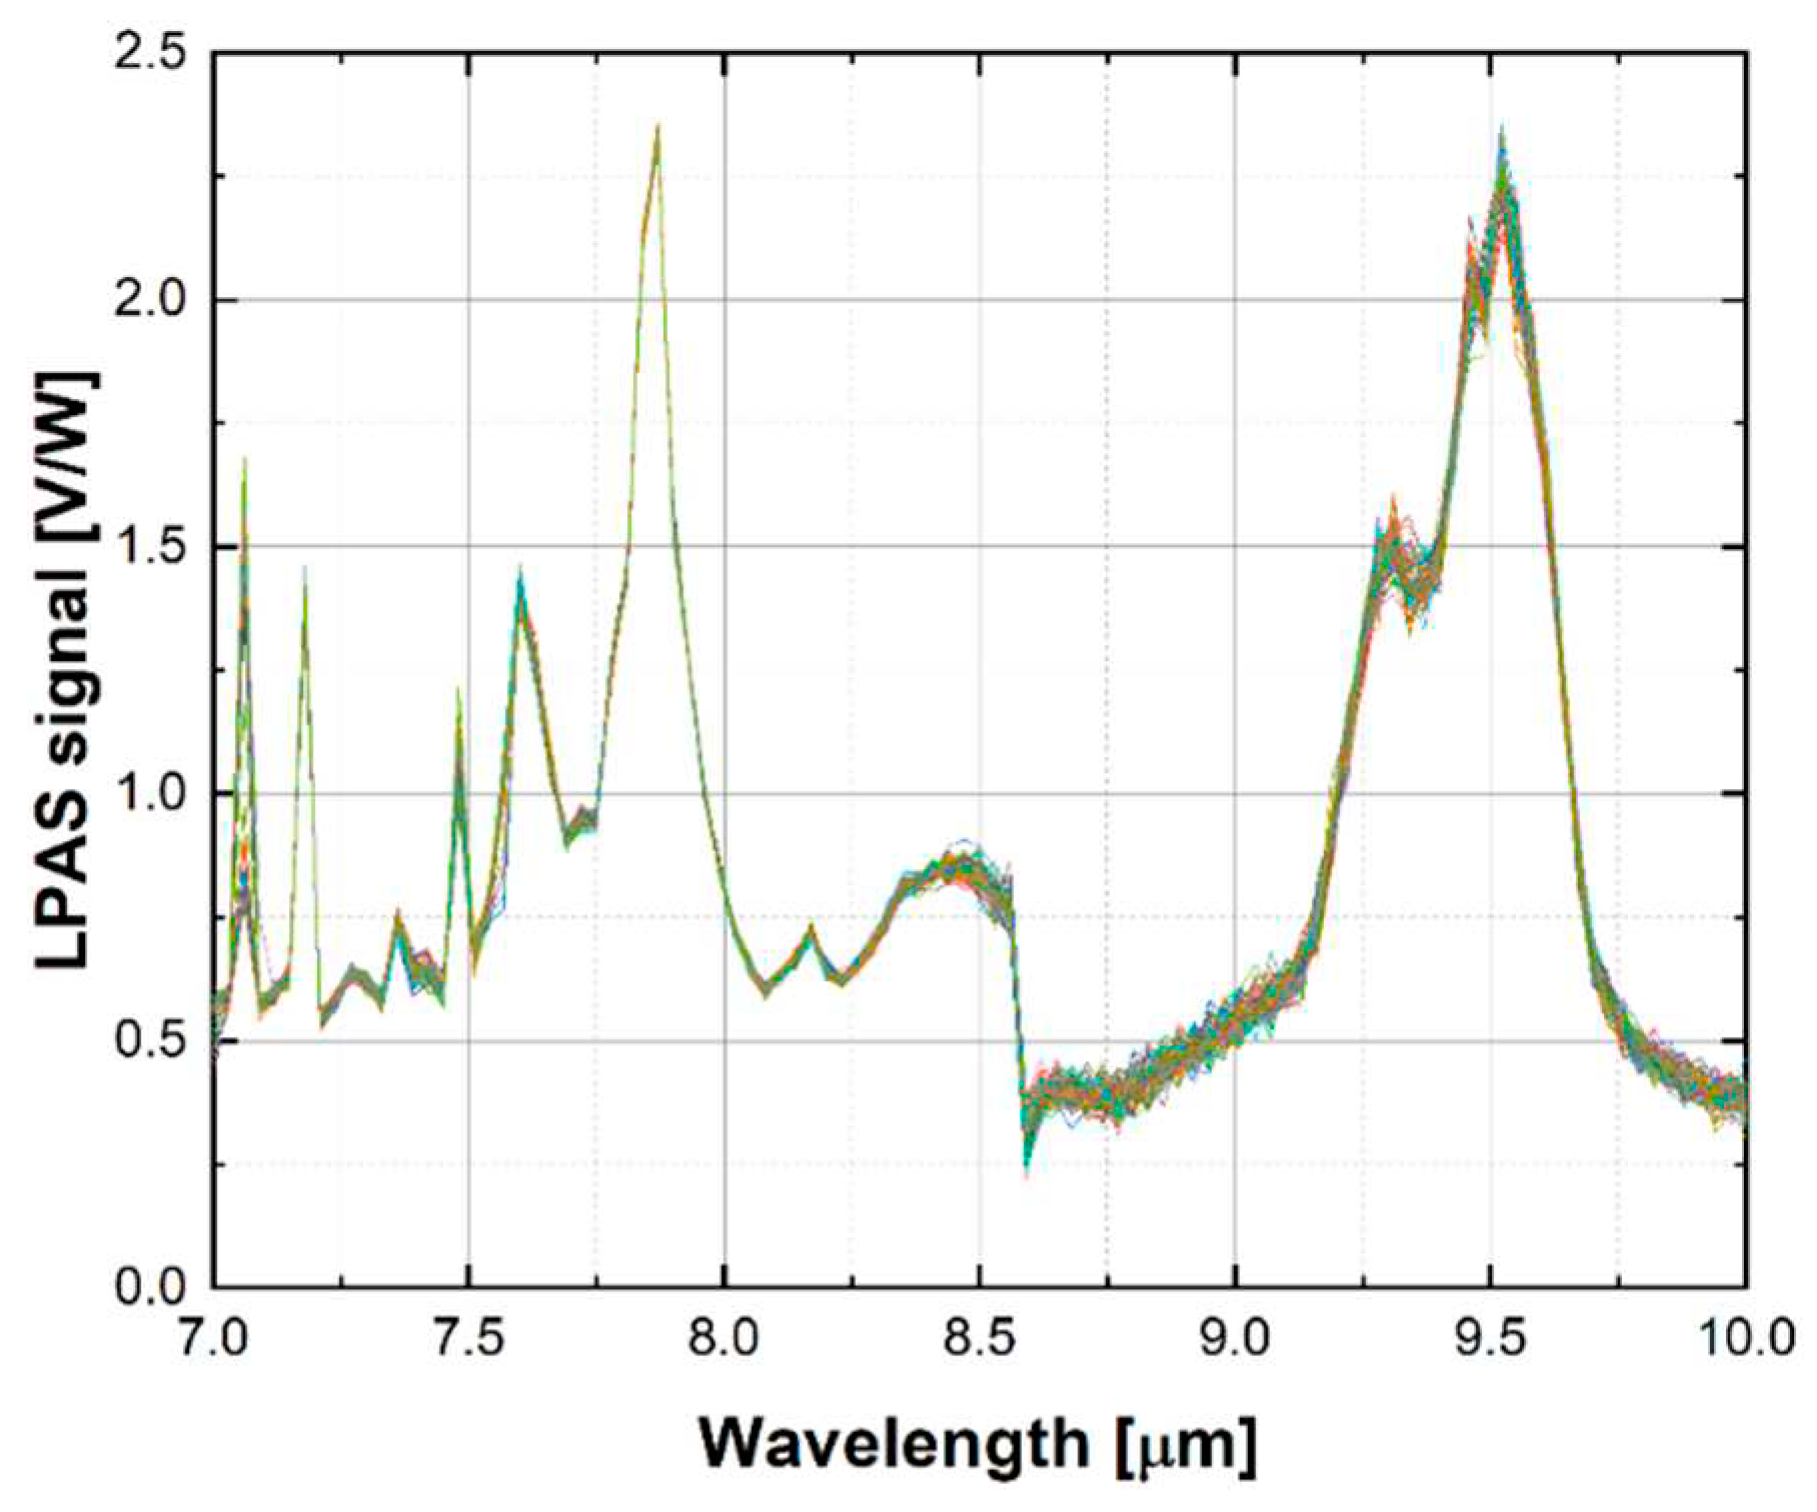
The 60 raw spectra show good repeatability, as illustrated for example for DMMP in
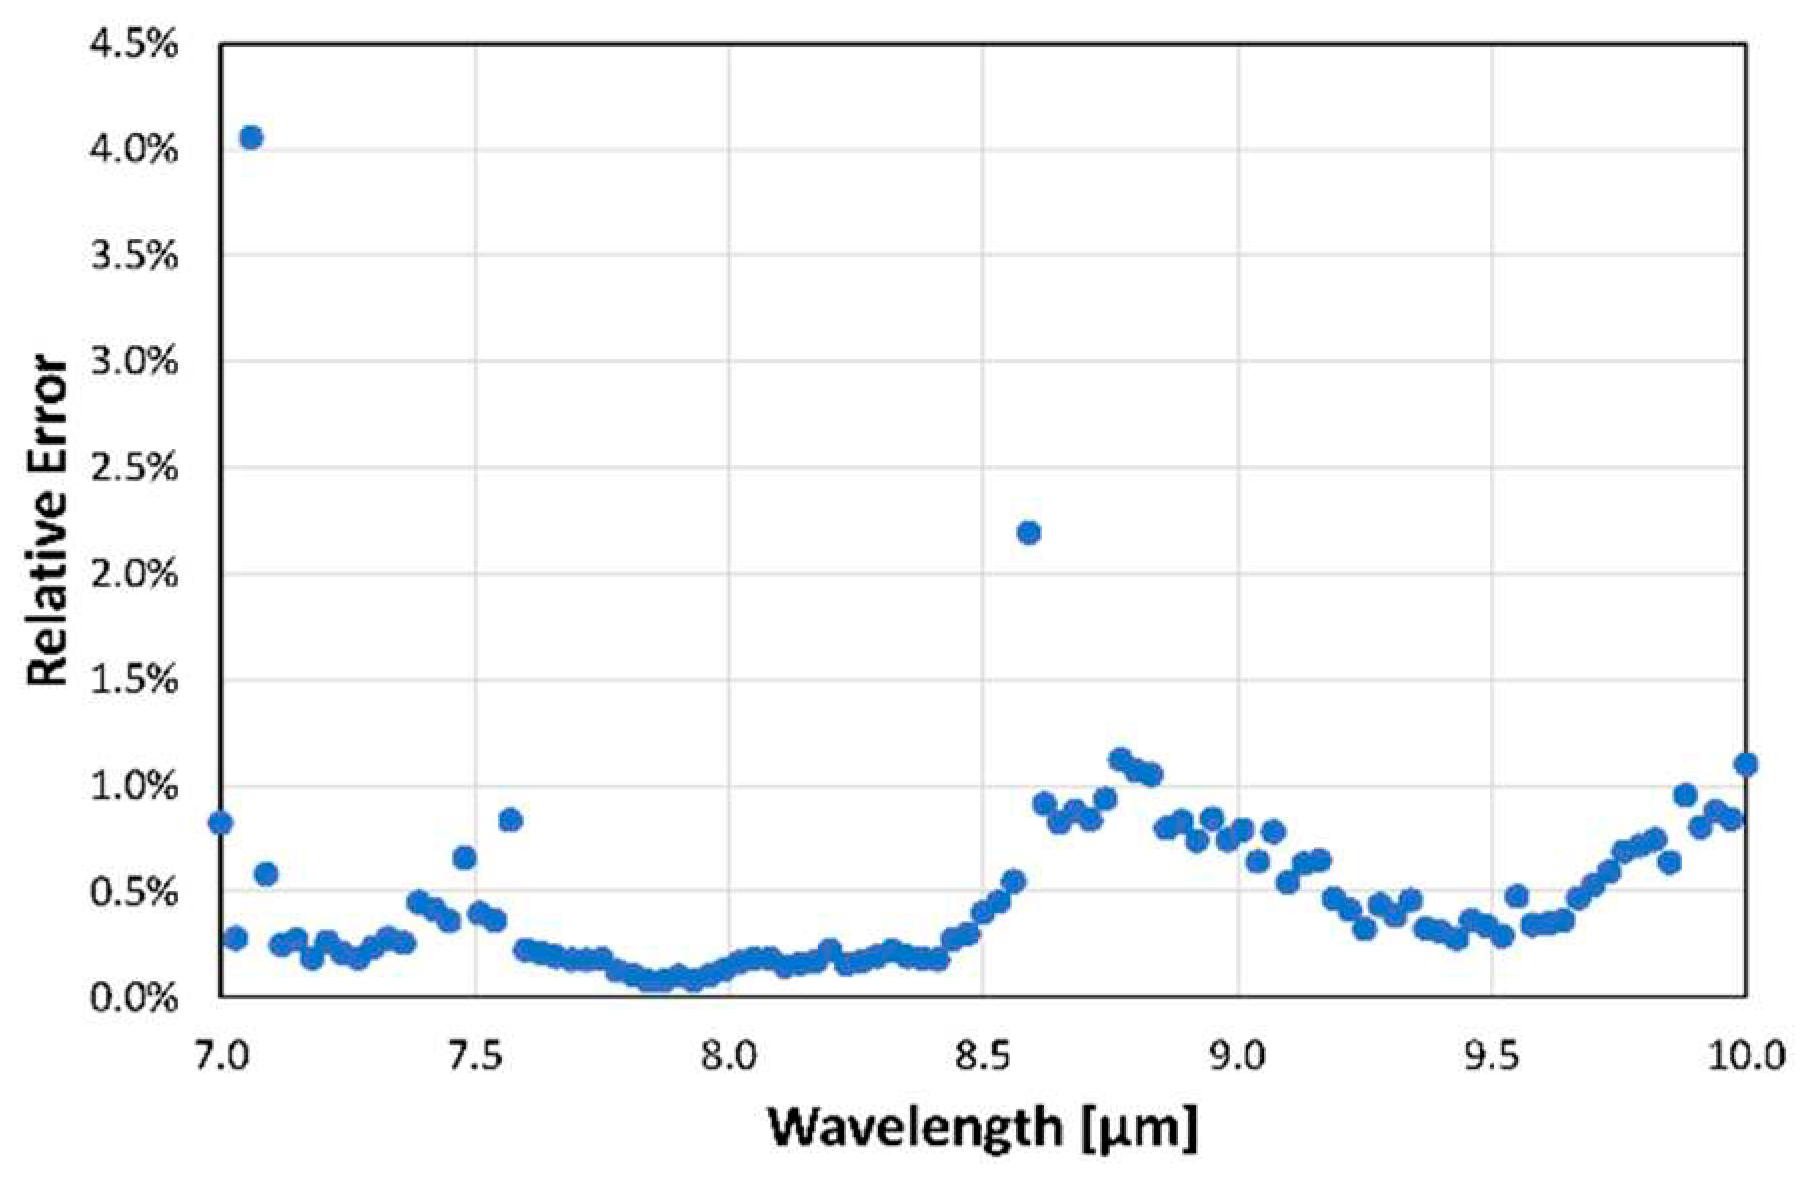
Figure 4. Looking closely at the graph, one can see that the LPAS signal is unstable at 7.1 µm, jumps at 8.6 µm and is noisy between 8.6 and 10 µm. This behaviour is confirmed by the plot of the relative error of the LPAS signal (
Figure 5) which is anomalously high at 7.1 and 8.6 µm and is relatively higher between 8.6 and 10 µm.
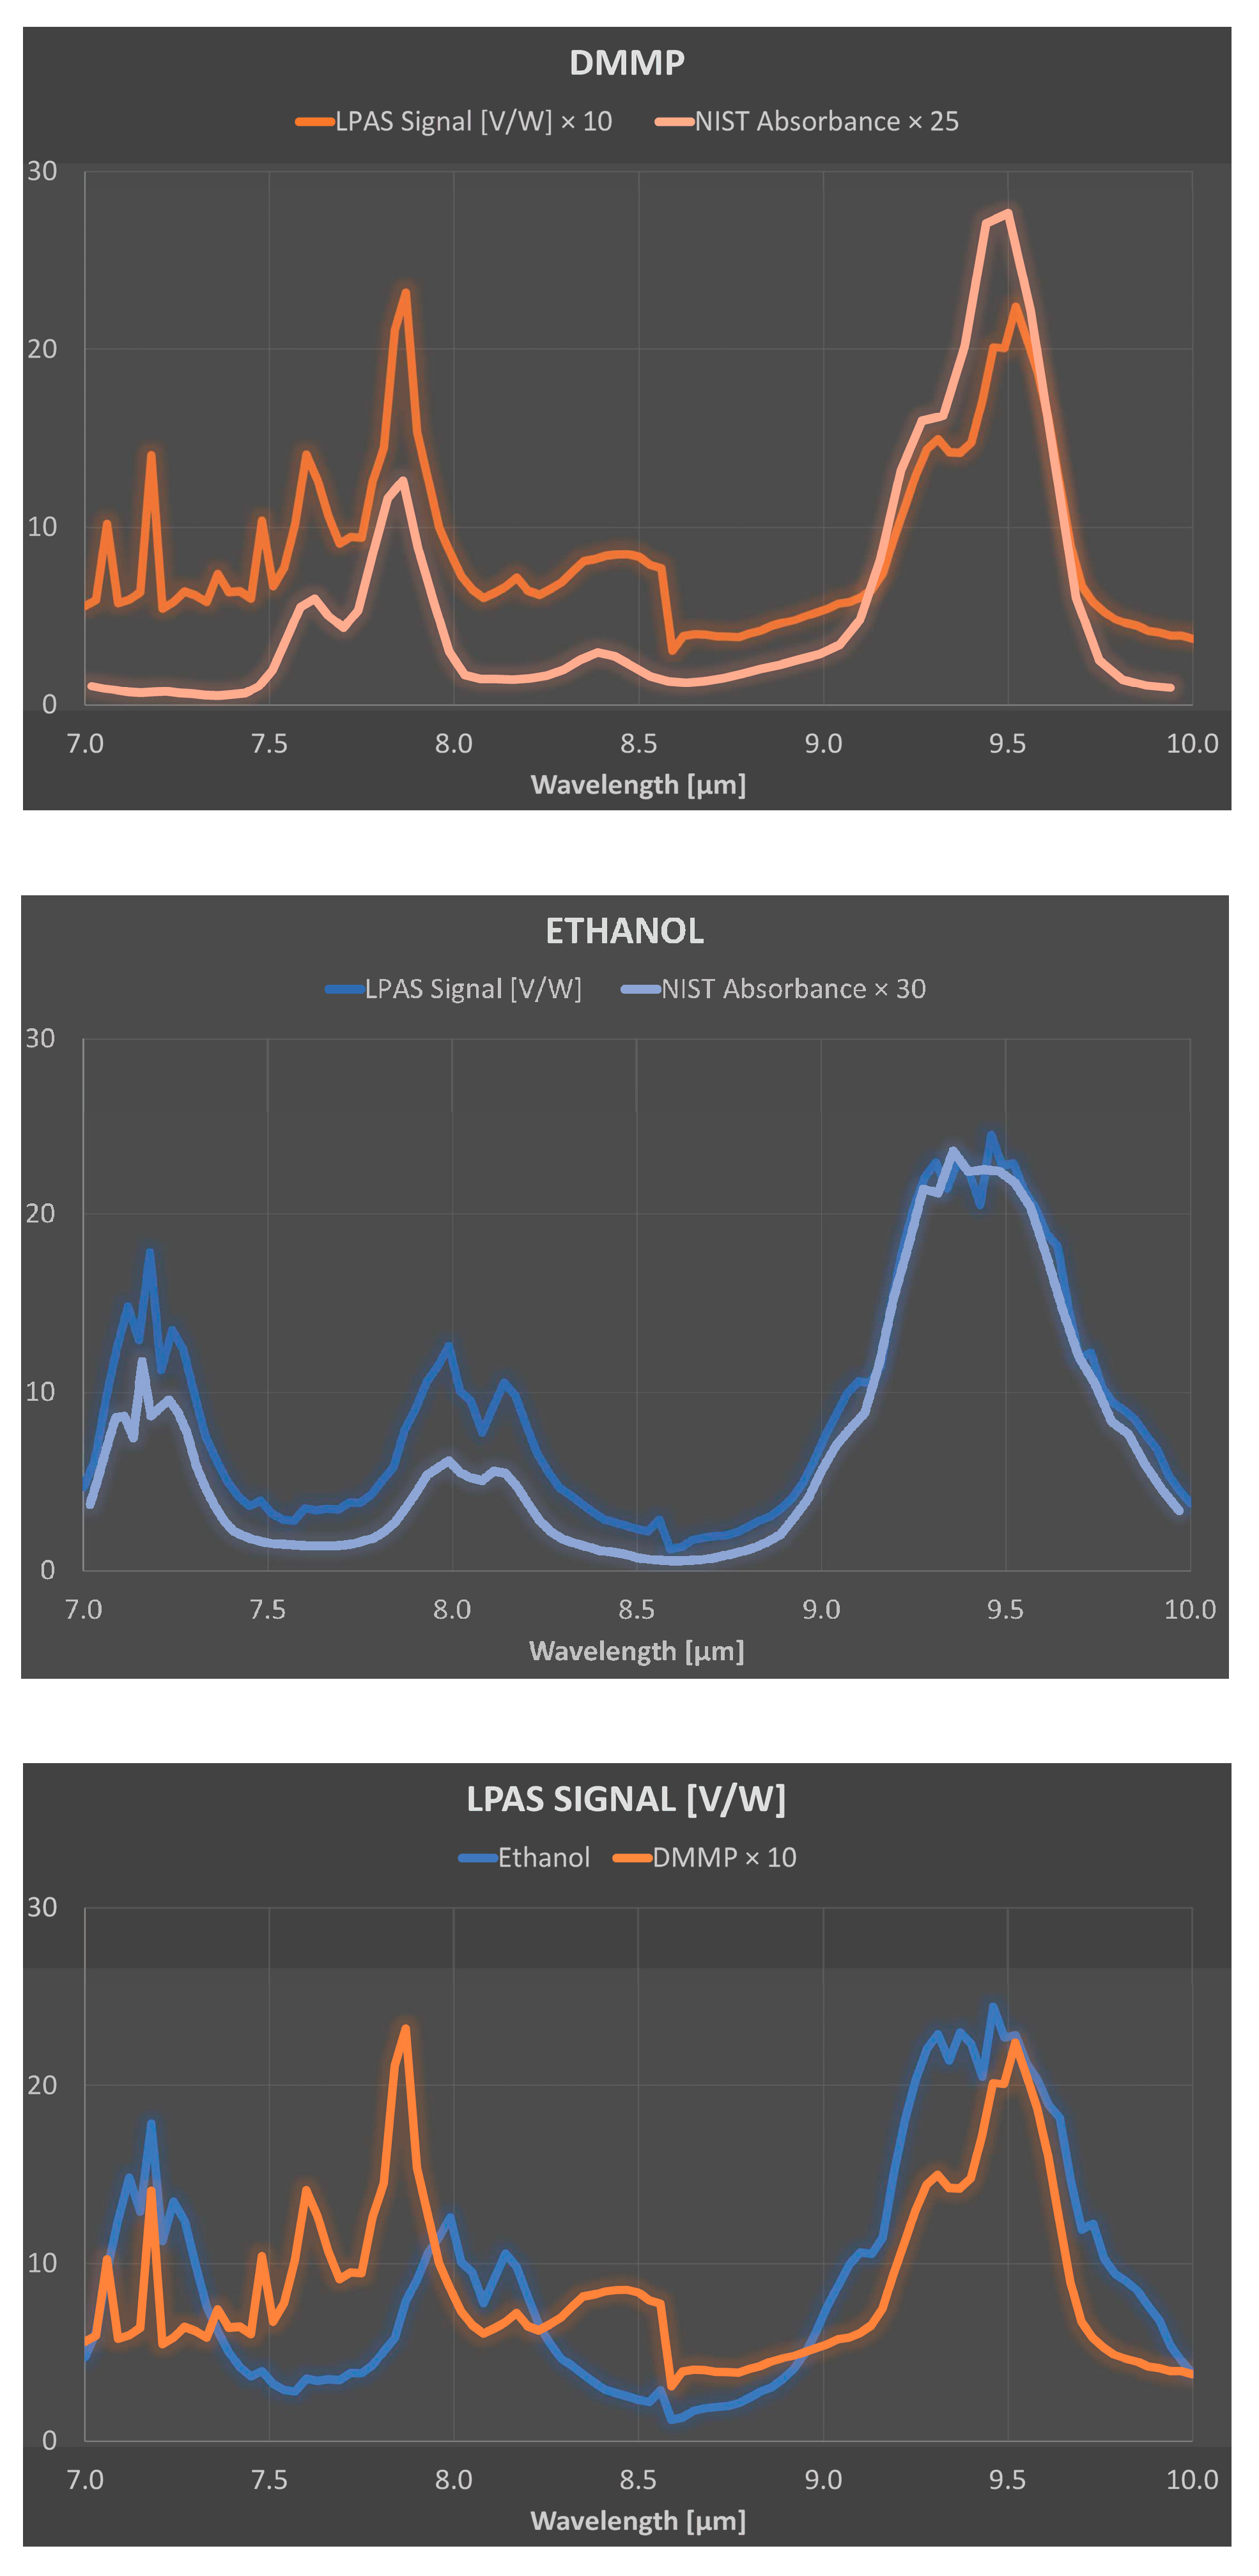
Fortunately, the reason for the above behaviour at 7.1 µm, 8.6 µm and between 8.6 and 10 µm is straightforward. Let us start with the higher relative error between 8.6 and 10 µm, which can be easily explained by the lower laser power in this spectral range. As for the instability at 7.1 µm, it is probably related to an observed temporal power fluctuation of the QCL, which has a noticeable drop in efficiency at this wavelength. The step at 8.6 µm is possibly related to a certain non-linearity of the photoacoustic laser system: the QCL consists of four modules and when switching from module 3 to module 4 at 8.6 µm there is an evident decrease in laser power, but the LPAS signal is reduced more than one would expect if it were proportional to the laser power. This behaviour can be related to the effectiveness of the source in heating the sample. It is not unreasonable to think that the material only heats up if the laser power exceeds a certain threshold and that therefore the effective power for heating between 8.6 and 10 µm is less than expected. In fact, as we shall see, this non-linearity is barely perceptible for ethanol, which shows a much higher LPAS signal, linked precisely to a greater effectiveness of the source in heating the sample due, in this case, to the strong absorption of the latter compound. This is evident in
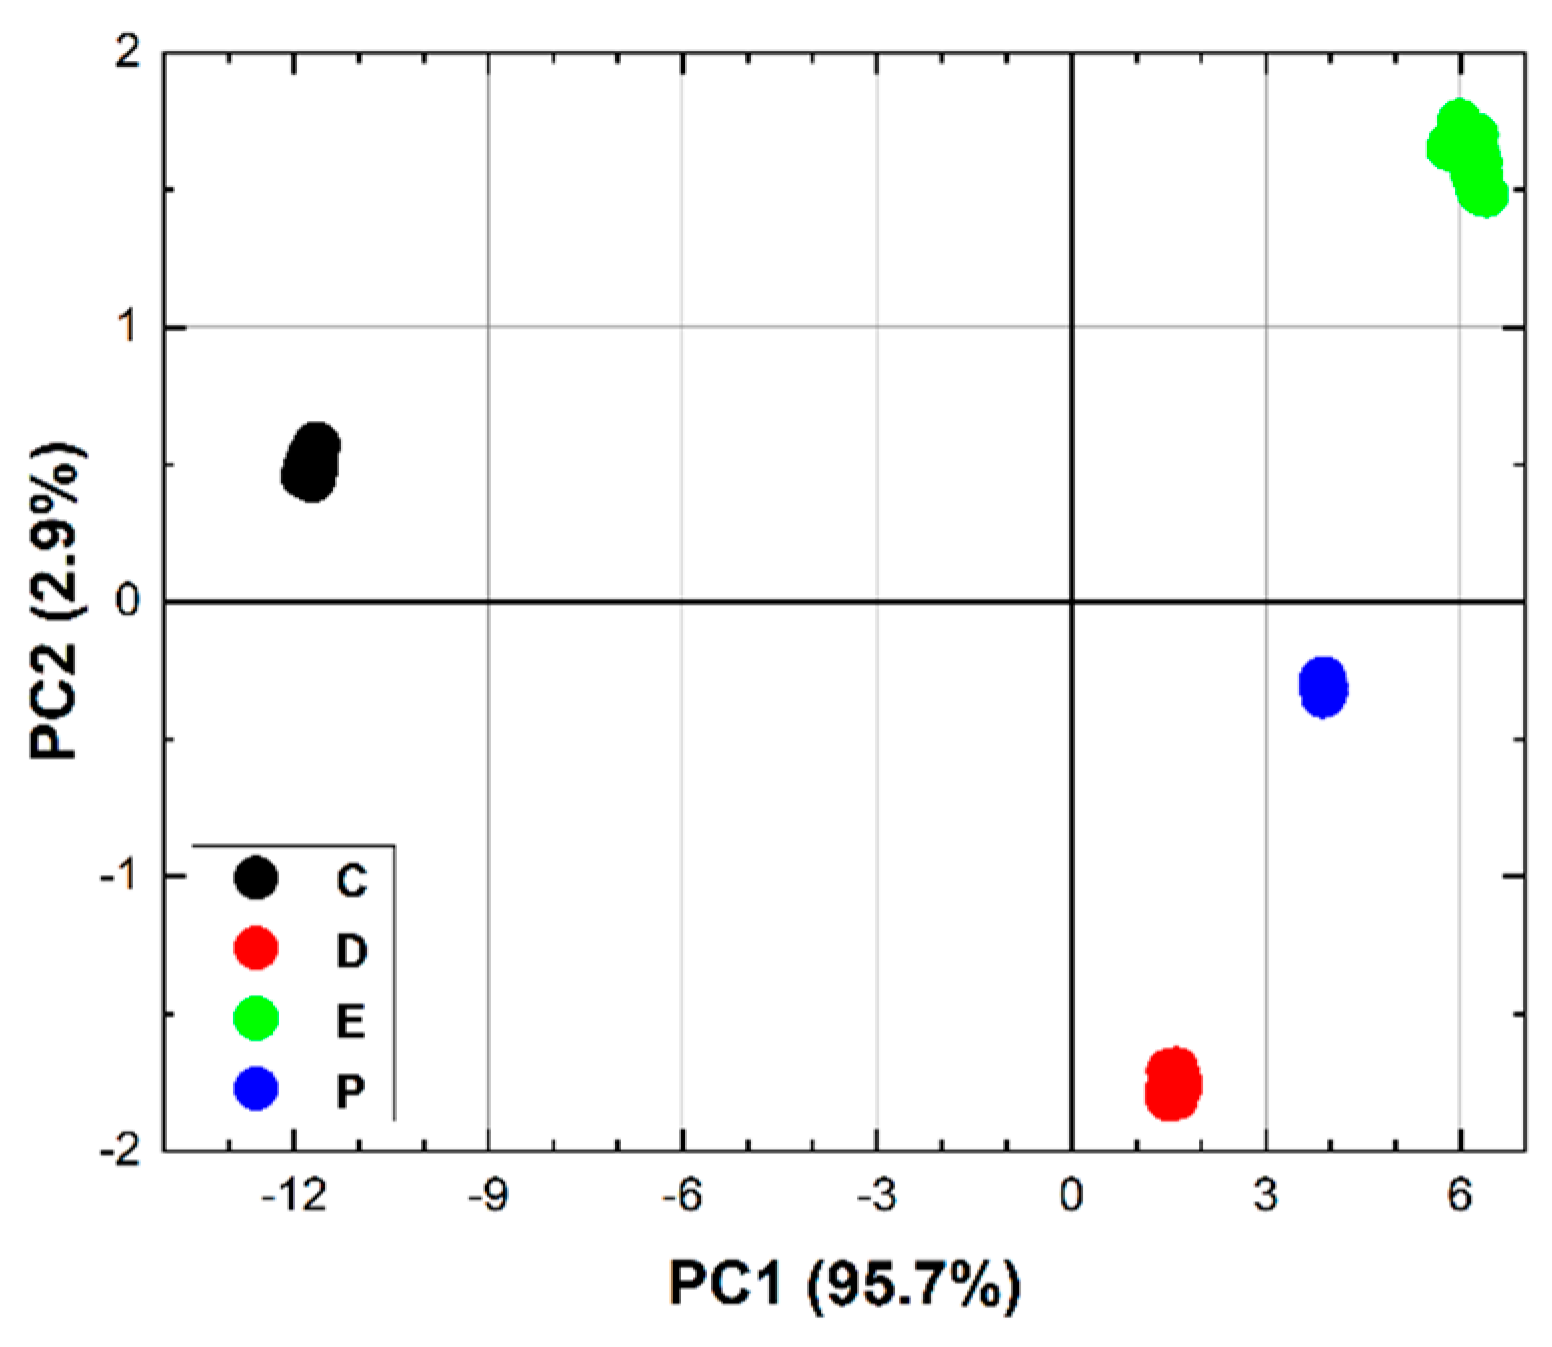
Figure 6 (bottom) which shows the average spectra of DMMP and ethanol. The same figure also shows that the LPAS signal and the NIST absorbance are in good agreement for both DMMP (top) and ethanol (middle) and, very importantly for measurement purposes, these two compounds have very different spectra from 7.0 and 8.5 µm (bottom). It was therefore decided to apply chemometric analysis in this spectral range. The results (
Figure 7) are very encouraging: PCA perfectly discriminates the four sample types already in the two-dimensional (2D) plots. When PCA is extended to 3D space, it explains 99.9% of the variance.
The next step is to apply PLS to calibrate the photoacoustic laser system. For this, samples at various DMMP concentrations are needed. Consequently, the following samples were prepared with the same procedure explained in the previous section:
P: filter paper disc;
H: filter paper disc soaked with 3 µl of water;
0: filter paper disc soaked with 3 µl of DMMP (3000 nl of DMMP);
1: filter paper disc soaked with 3 µl of DMMP diluted 10 times in water (300 nl of DMMP);
2: filter paper disc soaked with 3 µl of DMMP diluted 100 times in water (30 nl of DMMP);
3: filter paper disc soaked with 3 µl of DMMP diluted 1000 times in water (3 nl of DMMP);
and 10 spectra were measured for each sample from 7.00 to 8.50 μm with a step of 0.03 μm (51 wavelengths), corresponding to a total of approximately 10 minutes of operation.
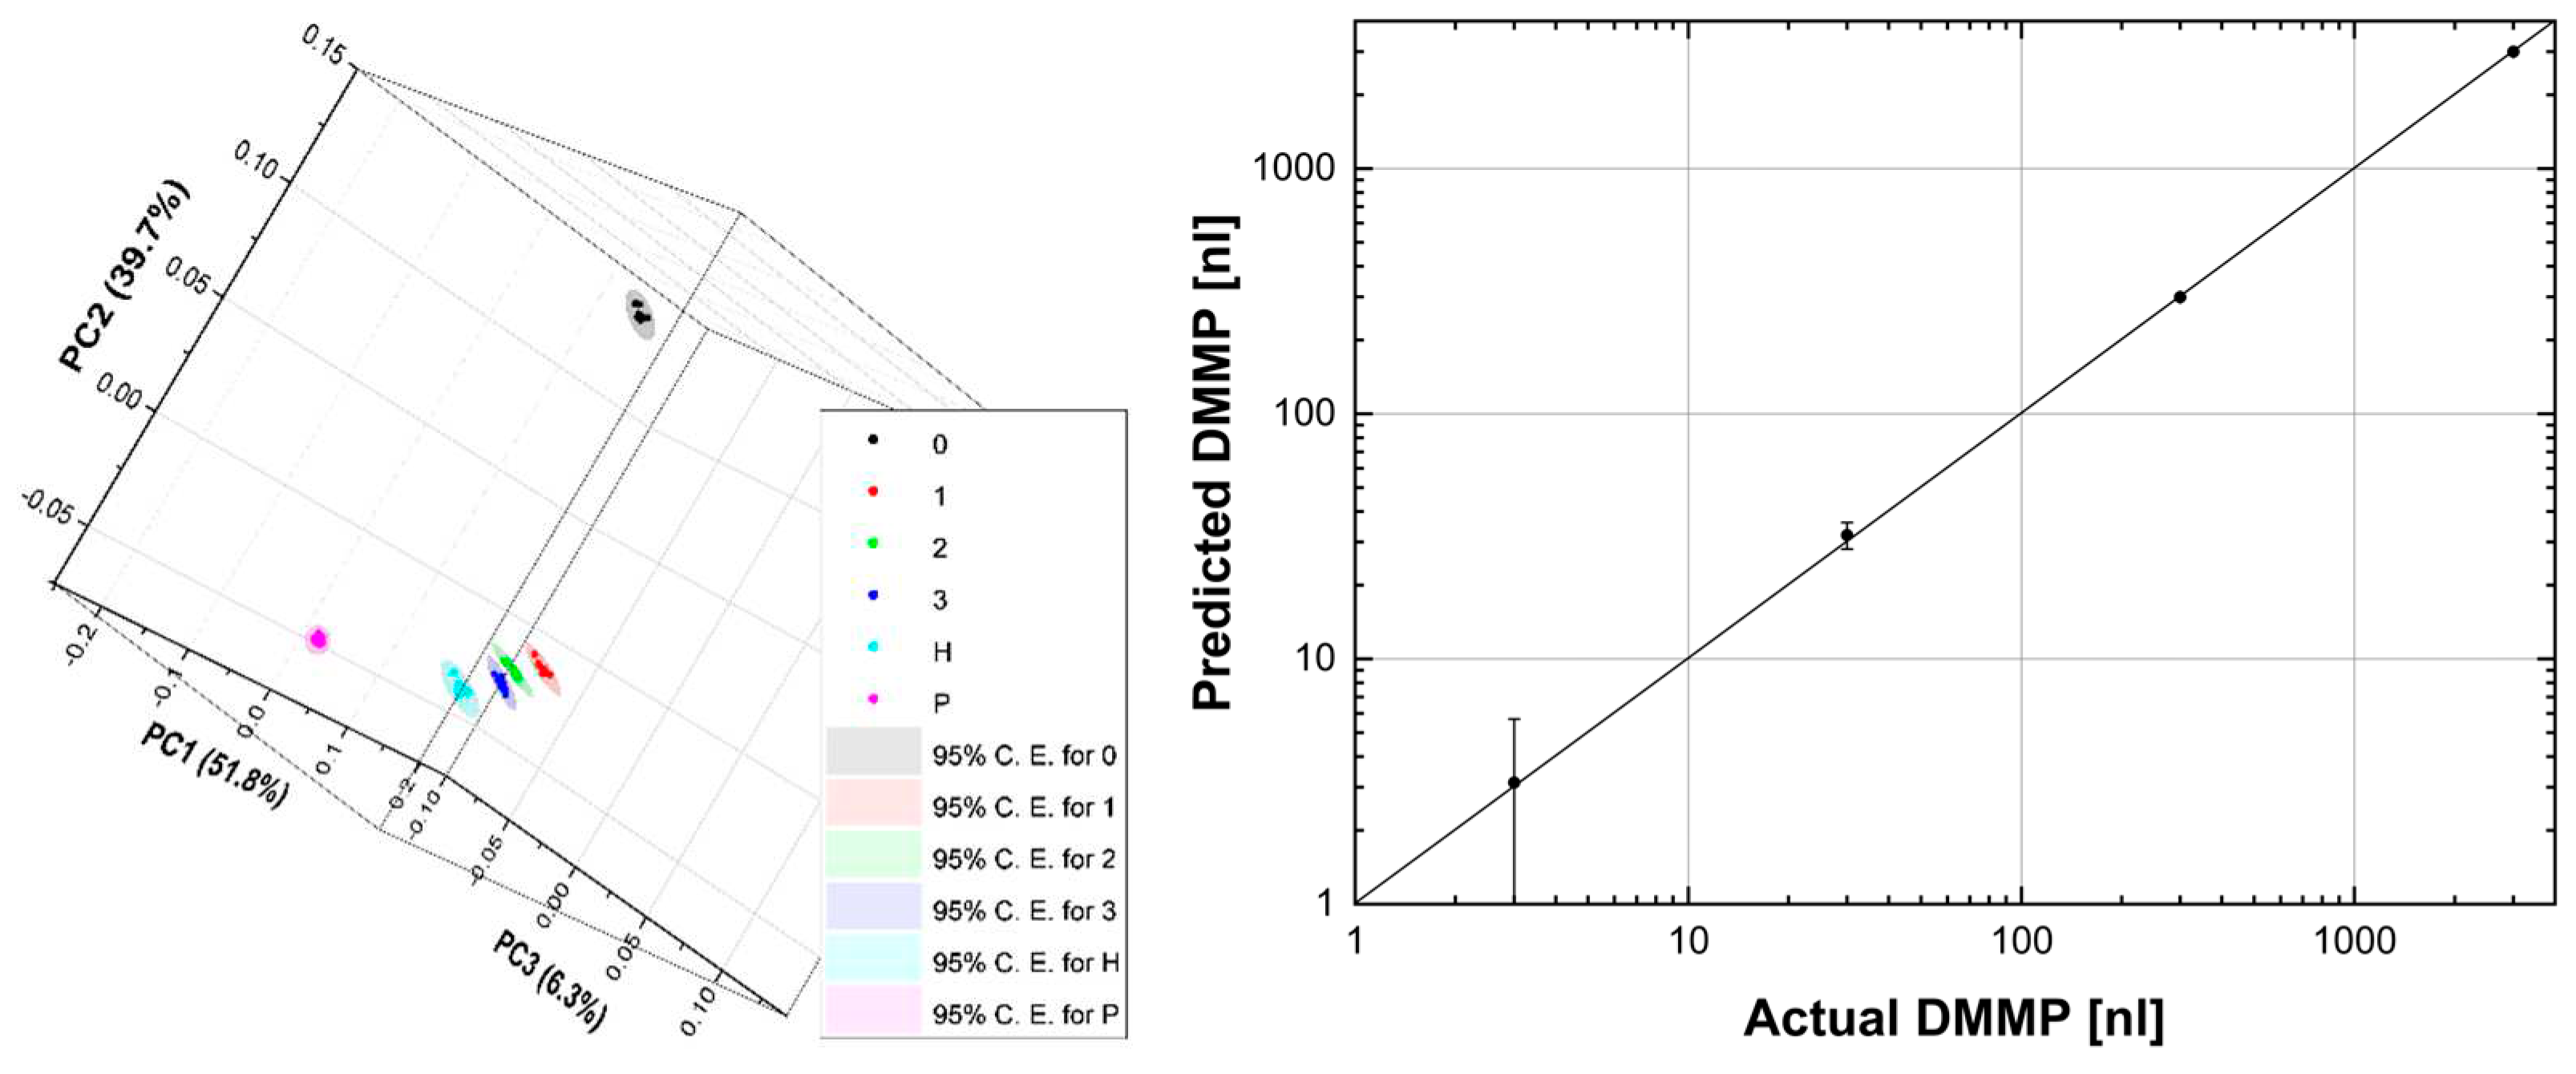
Again, the PCA is comforting, as shown in
Figure 8 (left): the point clouds are discriminated and arranged, as one would expect, from P to 0 (going from right to left in the graph) passing, in order, through H, 3, 2 and 1. The explained variance is 97.8% with three principal components. These results were encouraging for the application of PLS, which indeed converged with 6 factors, thus explaining 99.0% of the variance for X (effects) variables and 99.9% of the variance for Y (responses) variables. Convergence was assessed by the root mean square of the predicted residual sum of squares (PRESS) [
28].
Figure 8 (right) shows the difference between the predicted and actual DMMP which is rather small.
Table 3 summarises the PLS results. The maximum absolute difference, i.e., the absolute value of the difference between the observed value and the predicted value (residual), is 2.0 nl. The maximum statistical error is 4.0 nl. The absolute difference is less than statistical error for all samples. The mean of absolute differences and statistical errors is 0.9 nl and 2.9 nl, respectively. All that considered, a limit of detection (LOD) of 1 nl seems within the reach of the photoacoustic laser system, also bearing in mind that, as we saw in the first run of measurements, the number of spectra can easily be increased, thus reducing the statistical error. Of course, in preventing CBRNe events, the time factor is crucial, and the most convenient trade-off might be to reduce the measurement time by accepting an increase in LOD. From this point of view, the photoacoustic laser system allows maximum flexibility, remembering that the measurement parameters can be chosen by the user.
4. Conclusions and perspectives
4.1. Current achievements
Having reached the end of this paper, it seems important to take stock of the situation. In the introduction, it was stated that the LPAS technique has the following advantages: rapidity, sensitivity, specificity, simplicity, repeatability, in situ measurement, uncomplicated sampling, ease of use, and cost-effectiveness. It will then be useful to try to conclude where the system described here stands regarding these characteristics.
4.1.1. Rapidity
As mentioned above, the measurement achieving LOD of the order of nl requires the acquisition of 10 spectra from 7.00 to 8.50 μm with a step of 0.03 μm (51 wavelengths). Remembering that the measurement at each wavelength takes 1 s, the whole operation lasts about 10 minutes. Compared to the usual chemical analyses performed in wet labs that can take hours if not days, the photoacoustic laser system can be described as rapid.
4.1.2. Sensitivity
Frankly speaking, the fact of being able to detect a few nl of a nerve gas simulant, moreover by sampling only 3 µl of liquid, with a relatively small filter paper disc, seems promising, bearing in mind that the system is in full development.
4.1.3. Specificity
As candidly as we welcomed the sensitivity of the instrument, we must admit that there is still much to be done on this point, although the spectra of DMMP and substances not containing the phosphorous-oxygen double bond, such as ethanol, promise good specificity.
4.1.4. Simplicity
The photoacoustic laser system is certainly complex from the point of view of mechanical, electronic, and optical realisation, adjustments and chemometric analysis, but imagining automating the latter, the instrument, once fine-tuned, can be put into the hands of a not particularly trained person.
4.1.5. Repeatability
This also needs further investigation. Nevertheless, not only are the replicas of the spectra performed subsequently clearly superimposable, but also the spectra acquired in the first (May 2023) and second (October 2023) run of measurements are perfectly consistent, which bodes well.
4.1.6. In situ measurement
This is certainly a great advantage of the photoacoustic laser system. As we have mentioned, the project involves mounting the instrument in a UGV that travels to the hot zone to perform the CWAs presence measurements.
4.1.7. Uncomplicated sampling
Paradoxically, it was perhaps more complicated to prepare the samples in the laboratory and insert them into the instrument, adhering to a strict safety protocol, than to imagine its use in the field, which, as has been mentioned, will involve remotely piloted robotic arm insertion of the paper disc with which the wipe test was performed.
4.1.8. Ease of use
This theme is related to the previous one. From the point of view of the operator driving the UGV and, with a few commands, ordering the execution of sampling and measurement, once well engineered, the photoacoustic laser system could be within the capability of any user.
4.1.9. Cost-effectiveness
Finally, it is necessary to reason about the cost-effectiveness of the photoacoustic laser system. While a significant initial investment is needed to purchase the QCL (on the order of a few tens of thousands of €), the system is virtually capable of working decades without consumables, spare parts, or maintenance work.
4.2. Future perspectives
The most immediate future perspective that opens for the photoacoustic laser system is its deployment in terrorist attack or battlefield scenarios, at least simulated, as envisaged by the project. For this, a compact version of the instrument of reduced size and weight compared to the cart-mounted instrument has already been planned. The reduction in size and weight will be possible on the one hand thanks to a new QCL already available at ENEA, and on the other hand through the development in our laboratory of an FPGA-based LIA, which is much smaller than those available off-the-shelf. Of course, in the longer term, a field deployment of a miniaturised and engineered photoacoustic laser system is desirable.
4.3. Open issues
The interference of other substances in the scenario remains an important issue to be studied: what happens if organophosphate-based pesticides, compounds containing a phosphorous-oxygen double bond, are used at the terrorist attack site or battlefield? Future lines of research will have to include studying the literature on common compounds found in real-world scenarios to see where there is overlap with nerve agent absorption to find a region where IR spectra clearly discriminate their presence. Subsequently, it will be necessary to first perform laboratory experiments and then field tests of nerve agent measurements in the presence of relevant interferents.
To make the photoacoustic laser system capable of real-time detection, chemometric analysis will have to be integrated into the software that controls the instrument and not as post-processing of the spectra that are the actual output of the system.
A further reduction in weight, size and power consumption could be achieved by using miniaturised QCLs that emit a wavelength comb: with a judicious choice of wavelengths, it should be possible to intercept the key features of the nerve agent absorption even without the emission of a continuous spectrum as is the case now. With this significant improvement, it is not unreasonable to consider the possibility of fitting a photoacoustic laser system to a UAV in the future.
Author Contributions
Conceptualisation, L.F.; software, F.P.; formal analysis, L.F.; investigation, C.C. and I.G.; writing—original draft preparation, L.F. All authors have read and agreed to the published version of the manuscript.
Funding
This work has been supported by the TecHea project (Technologies for health), funded by ENEA (deliberation of the board of directors no. 80/2018/CA of 9 November 2018), by the TESLA project (Laser techniques for the safety of food and water), funded by Latium Region (ERDF-ROP program, no. A0375-2020-36403, call Research groups 2020 and by the MoSaiC project (Real-time monitoring and sampling of CB menaces for improved dynamic mapping of threats, vulnerabilities and response capacities), funded by the EC (EDF program, grant agreement 101103010, call EDF-2021-MCBRN-R).
Data Availability Statement
The data presented in this study are available on request from the corresponding author.
Acknowledgements
The authors thank Ivano Menicucci and Marcello Nuvoli for technical assistance. This work was presented by one of us (L.F.) at the CBRNe Conference SICC 2023 and formed the basis of his thesis in the Second Level Master Course in Protection against CBRNe Events (University of Rome Tor Vergata), both activities coordinated by Andrea Malizia, who is kindly acknowledged together with Francesco Colao and Pasqualino Gaudio, external and university tutor respectively.
Conflicts of Interest
The authors declare no conflict of interest.
References
- European Commission. CBRN Glossary; European Commission: Brussels, Belgium, 2011; Available online: http://encircle-cbrn.eu/wp-content/uploads/2021/04/cbrn_glossary_en.pdf (accessed on 8 December 2023).
- Garrett, B.C. Historical Dictionary of Nuclear, Biological, and Chemical Warfare, 2nd ed.; Rowman & Littlefield: Lanham, MD, USA, 2017. [Google Scholar]
- Organization for the Prohibition of Chemical Weapons. Chemical Weapons Convention; Organization for the Prohibition of Chemical Weapons: The Hague, The Netherlands, 1993. Available at: https://www.opcw.org/chemical-weapons-convention (accessed on 8 December 2023). [Google Scholar]
- Postol, T.A. A Preliminary Analysis of the Nerve Agent Attack of August 21, 2013 Against Unprotected Civilians in the Suburbs of Damascus, Syria; The New York Times: New York, NY, USA, 2013. Available at: https://graphics8.nytimes.com/packages/pdf/world/syria/iraq_syria.pdf (accessed on 8 December 2023). [Google Scholar]
- Taneda, K. The sarin nerve gas attack on the Tokyo subway system: hospital response to mass casualties and psychological issues in hospital planning. Traumatol. 2005, 11(2), 75–85. [Google Scholar] [CrossRef]
- Vale, J.A.; Marrs, T.C.; Maynard, R.L. Novichok: a murderous nerve agent attack in the UK. Clin. Toxicol. 2018, 56(11), 1093–1097. [Google Scholar] [CrossRef] [PubMed]
- Eskenazi, B.; Warner, M.; Brambilla, P.; Signorini, S.; Ames, J.; Mocarelli, P. The Seveso accident: a look at 40 years of health research and beyond. Environ. Int. 2018, 121(1), 71–84. [Google Scholar] [CrossRef] [PubMed]
- Broughton, E. The Bhopal disaster and its aftermath: a review. Environ. Health 2005, 4, 6. [Google Scholar] [CrossRef] [PubMed]
- Fiorani, L.; Giubileo, G.; Mangione, L.; Puiu, A.; Saleh, W. Food Fraud Detection by Laser Photoacoustic Spectroscopy; RT/2017/41/ENEA; ENEA: Rome, Italy, 2017; Available online: https://iris.enea.it/retrieve/handle/20.500.12079/6809/558/RT-2017-41-ENEA.pdf (accessed on 8 December 2023).
- Haisch, C. Photoacoustic spectroscopy for analytical measurements. Meas. Sci. Technol. 2012, 23, 012001. [Google Scholar] [CrossRef]
- Sigrist, M.W. Trace gas monitoring by laser-photoacoustic spectroscopy. Infrared Phys. Technol. 1995, 36(1), 415–425. [Google Scholar] [CrossRef]
- Fiorani, L.; Giubileo, G.; Mannori, S.; Puiu, A.; Saleh, W. QCL Based Photoacoustic Spectrometer for Food Safety; RT/2019/1/ENEA; ENEA: Rome, Italy, 2019; Available online: https://iris.enea.it/retrieve/handle/20.500.12079/6831/580/RT-2019-01-ENEA.pdf (accessed on 8 December 2023).
- Fiorani, L.; Artuso, F.; Giardina, I.; Nuvoli, M.; Pollastrone, F. Application of quantum cascade laser to rapid detection of food adulteration. Atmos. Oceanic Opt. 2022, 35, 550–554. [Google Scholar] [CrossRef]
- Fiorani, L.; Pollastrone, F.; Puiu, A.; Nuvoli, M.; Menicucci, I. Un apparato e un metodo fotoacustico per rilevare un analita in un campione di un materiale da ispezionare, patent 102021000032276. Available online: https://brevetti.enea.it/elenco.php (accessed on 8 December 2023).
- Fiorani, L.; Artuso, F.; Bertolami, S.; Ciceroni, C.; Di Paolo, F.; Fantauzzi, S.; Giardina, I.; Menicucci, I.; Nuvoli, M.; Pollastrone, F.; Valletti, L. Non-destructive laser spectroscopic sensing of organophosphate compounds, In Book of Abstracts of the 2nd SensorFINT International Conference, Pérez Marin D., Ed..; JKI: Berlin, Germany, 2023; p. 36. Available online: https://www.sensorfint.eu/wp-content/uploads/2023/06/BOOK-OF-ABSTRACTS.-Berlin-2023-sensorFINT-conference_final.pdf (accessed on 8 December 2023).
- Fiorani, L.; Artuso, F.; Giardina, I.; Lai, A.; Mannori, S.; Puiu, A. Photoacoustic laser system for food fraud detection. Sensors 2021, 21, 4178. [Google Scholar] [CrossRef] [PubMed]
- Pucci, E.; Palumbo, D.; Puiu, A.; Lai, A.; Fiorani, L.; Zoani, C. Characterization and discrimination of Italian olive (Olea europaea sativa) cultivars by production area using different analytical methods combined with chemometric analysis. Foods 2022, 11, 1085. [Google Scholar] [CrossRef] [PubMed]
- Fiorani, L.; Lai, A.; Puiu, A.; Artuso, F.; Ciceroni, C.; Giardina, I.; Pollastrone, F. Laser sensing and chemometric analysis for rapid detection of oregano fraud. Sensors 2023, 23, 6800. [Google Scholar] [CrossRef] [PubMed]
- Sammarco, G.; Alinovi, M.; Fiorani, L.; Rinaldi, M.; Suman, M.; Lai, A.; Puiu, A.; Giardina, I.; Pollastrone, F. Oregano herb adulteration detection through rapid spectroscopic approaches: Fourier transform-near infrared and laser photoacoustic spectroscopy facilities. J. Food Compos. Anal. 2023, 124, 105672. [Google Scholar] [CrossRef]
- MoSaiC. Available online: https://mosaicproject.safe-europe.eu/ (accessed on 8 December 2023).
- Fiorani, L.; Artuso, F.; Bertolami, S.; Ciceroni, C.; Di Paolo, F.; Fantauzzi, S.; Giardina, I.; Menicucci, I.; Nuvoli, M.; Pollastrone, F.; Valletti, L. Chemical agent detection by laser photoacoustic spectroscopy, In: SICC Series CBRNe Conference 2023 - Book of Abstracts, Dekorsy, T., Manenti, A., Eds. TEXMAT: Rome, Italy, 2023; p. 108.
- Ansys. Available online: https://www.ansys.com/ (accessed on 8 December 2023).
- Pollastrone, F.; Ciceroni, C.; Artuso, F.; Bertolami, S.; Di Paolo, F.; Fantauzzi, S.; Fiorani, L.; Giardina, I.; Menicucci, I.; Nuvoli, M.; Valletti, L. Study for the development of the laser photoacoustic spectroscopy system for CBNRe detection, In: SICC Series CBRNe Conference 2023 - Book of Abstracts, Dekorsy, T., Manenti, A., Eds. TEXMAT: Rome, Italy, 2023; p. 171.
- TecHea. Available online: https://www.techea.enea.it/work-package/techea-wp1.html (accessed on 8 December 2023).
- Mott, A.J.; Rez, P. Calculated infrared spectra of nerve agents and simulants. Spectrochim. Acta, Part A 2012, 91, 256–260. [Google Scholar] [CrossRef] [PubMed]
- Giardina, I.; Artuso, F. ; Ciceroni; Fiorani L.; Menicucci I.; Nuvoli M.; Pollastrone F. Laser photoacoustic spectroscopy detection of the nerve simulant dimethyl methylphosphonate (DMMP), In: SICC Series CBRNe Conference 2023 - Book of Abstracts, Dekorsy, T., Manenti, A., Eds. TEXMAT: Rome, Italy, 2023; p. 149. [Google Scholar]
- Linstrom, P.J. , Mallard, W.G., Eds. NIST Chemistry WebBook; NIST: Gaithersburg, MD, USA, 2023; Available online: https://webbook.nist.gov/chemistry/ (accessed on 8 December 2023).
- Kalivas, J.H.; Brown, S.D. Calibration methodologies. In Comprehensive Chemometrics, 2nd ed.; Brown, S.D., Tauler, R., Walczak, B., Eds.; Elsevier: Amsterdam, The Netherlands, 2020; Volume 3, pp. 213–247. [Google Scholar] [CrossRef]
- OriginPro. Available online: https://www.originlab.com/ (accessed on 8 December 2023).
- ChemFlow. Available online: https://vm-chemflow-francegrille.eu/ (accessed on 8 December 2023).
|
Disclaimer/Publisher’s Note: The statements, opinions and data contained in all publications are solely those of the individual author(s) and contributor(s) and not of MDPI and/or the editor(s). MDPI and/or the editor(s) disclaim responsibility for any injury to people or property resulting from any ideas, methods, instructions or products referred to in the content. |
© 2023 by the authors. Licensee MDPI, Basel, Switzerland. This article is an open access article distributed under the terms and conditions of the Creative Commons Attribution (CC BY) license (http://creativecommons.org/licenses/by/4.0/).
