1. Introduction
Increased discharge of colored wastewater from industries such as paper, plastic, textile, pharmaceutical, leather, carpet, food, cosmetics, and printing press industries [
1] has become a public health and environmental risk [
2]. Among the used dyes, methylene blue (MB) dye has serious health problems. Methylene Blue (MB) is a complex aromatic cationic dye that is used to color cotton and silk. Exposure to MB dye causes irreversible eye damage in humans and animals, as well as local burns, nausea and vomiting, mental problems, and Methemoglobinemia [
3]. Long-term methylene blue exposure can potentially cause cancer or genetic changes in humans and other organisms. This augmented concern for health and the environment has prompted the appropriate treatment of dye wastewater [
4]. Adsorption is less expensive than conventional treatment procedures such as electrodialysis, ion exchange, reverse osmosis, micro- and ultra-filtration, oxidation, and solvent extraction. Adsorption is a superior alternative to other methods in terms of cost, ease of design and operation, availability, effectiveness, and lack of sensitivity to harmful compounds [
5]. Several studies have been conducted in order to develop low-cost adsorbents for removing MB dyes from wastewater [
6].
The use of abundant waste and natural materials to create adsorbents for the removal of MB dye from wastewater could reduce operating costs and prevent dye accumulation in the environment [
7]. Some research groups have recently embraced agricultural wastes to create activated carbon and biochar due to their high carbon content, low inorganics, mechanical strength, low levels of ash content, and inexpensive cost [
8]. Maize is one of Uganda's most important grain crops. Smallholder farmers, in particular, rely on it for food and as a cash crop [
9]. This generates large amounts of maize stalks as waste. Maize stalk is high in cellulose, hemicellulose, pectin, lignin, and other nutrients which when carbonized, provide avenues for adsorption [
7]. The hydroxyl groups (-OH) in cellulose, the major component of maize stalks, have some adsorption capacity; however, the adsorption capacity of hydroxyl groups (-OH) in cellulose is normally lower due to -OH groups implicated in cellulose intermolecular hydrogen bonds. To address the issue, numerous researchers have continued to try to modify maize stalks by pretreating and functionalizing them [
10]. In summary, recent research on maize stalk-modified biochar has usually focused on the utilization of various modifiers and raw materials, primarily in the realm of adsorption [
11]. For instance, corn stalks modified with H
3PO
4 yielded an adsorption capacity of 129 mg/g for MB dye from an aqueous solution [
10]. However, when the H
3PO
4 modification was performed on the corn stalk biochar, the adsorption capacity for MB dye increased to 406.43 mg/g [
12]. In another study by [
13], the biochar was modified with Fe
3O
4 and the adsorption capacity of MB dye was 166.67 mg/g. Moreover, lignin biochar modified with MnO
2 yielded an adsorption capacity of 248.96 mg/g for MB dye [
14].
With respect to optimisation, the Taguchi method can also be used to optimize the adsorption process [
15]. Taguchi design is the most basic, practical, and methodical technique based on a fractional factorial design matrix since it maximizes each parameter and specific response [
16]. The Taguchi technique is a strong and reliable statistical analytic tool that allows for independent evaluation of outcomes with the fewest number of experimental runs possible [
17]. In the design of the experiments, orthogonal arrays and signal-to-noise ratio are employed to suggest the optimal control parameter configurations rather than the answers themselves, and as a result, variations caused by uncontrollable factors are ignored [
18]. This method, on the other hand, just clarifies the linear relationship between the causes and effects [
19]. In the literature, there is little research on the Taguchi approach for adsorption investigations.
This work, therefore, focuses on the removal of methylene blue dye from an aqueous solution using manganese (iv) oxide-modified maize stalk biochar with optimisation of the adsorption studies conducted using Taguchi design of experiments technique. To discuss the adsorption feasibility of the modified maize stalk biochar, various adsorption equilibrium and kinetic models were chosen.
2. Materials and Methods
2.1. Adsorbent Peparation
Maize straw biomass was collected from Bubugo maize scheme, Jinja, Uganda. The biomass was washed with deionized water to remove fines and contaminants. The biomass was dried overnight in an oven at 110°C. The oven-dried stalks (10 g) were pyrolyzed at 400°C for 1 hour in a nitrogen atmosphere to produce maize stalk biochar (MSB). The obtained MSB was then crushed and sieved to produce a uniform powder. 4 g of MSB was added to 100 mL 0.002 M manganese chloride solution and vigorously stirred at 600 rpm for 6 hours. 200 mL of 0.02 M potassium permanganate was added to the mixture portion-wise until the suspension turned dark brown. The suspension was filtered, and dried overnight. The obtained sample is the manganese (iv) oxide-modified maize stalk biochar (MMSB). The modification mechanism of manganese (iv) oxide is shown in Equation (1);
2.2. Characterization of the Adsorbent
The MMSB was characterised in order to establish the functional groups on the MMSB. This necessitated the use of an FTIR spectrometer. This confirmed the presence of functional groups responsible for MB adsorption on MMSB surfaces. Under regular working conditions, an FTIR spectrometer was used to create the FTIR spectra of FMSB at a scan rate of 32 scans per minute, a resolution of 2 cm-1, and a wave number range of 400-4000 cm-1. Busitema University's materials and metallurgy laboratory conducted the FTIR analysis.
2.3. Adsorbate Preparation
MB dye was sourced from the chemistry department, directorate of the government analytical laboratory (DGAL), Kampala, Uganda. The synthetic dye wastewater was prepared by dissolving 1 g of the dye powder in 1000 mL of distilled water to make a 1000 ppm stock solution. The subsequent concentrations were prepared by diluting the stock solution with distilled water as required by the experimental runs.
2.4. Taguchi's Design of Experiments Analysis
The mean value of removal efficiency acquired from the experimental findings was utilized in this approach to determine the difference between the value tested and the desired value, which was then turned into the signal-to-noise (S/N) ratio to examine the relationship between quality and variability. The signal-to-noise ratio was used to calculate the difference between the desired values and the response, where Noise represents the unwanted value and the signal represents the desired value. In this scenario, the signal-to-noise ratio can be classified into three groups: smaller-the-better, larger-the-better, and nominal-the-better. However, because the primary purpose of this study's optimization was to achieve maximum removal efficiency, the larger the better S/N was chosen for this examination. The maximum removal efficiency value is critical for better MB dye adsorption from an aqueous solution. The S/N for the "larger, the better" criterion is given by Equation (2) [
20].
where:
S = signal
N = noise
The original values for the various levels of the process parameters were discovered through literature research and early tests. Using the Taguchi technique, the principal effects of four processing parameters in the MB dye adsorption process, namely the adsorbent dose (A), initial MB dye concentration (B), contact time (C), and pH (D), are investigated as illustrated in
Table 1. Level 2 is the mean level for the three levels which was obtained from the literature review [
1,
2,
3].
In this study, 9 tests were carried out utilizing a L9 (34) orthogonal array (OA) Taguchi design. Minitab version 17 was used to conduct the Taguchi design of experiments and analysis.
To establish the relationship between the response and the process parameters, a Taguchi linear model, as shown in Equation (3), was devised.
where:
Re = predicted response;
β0 = constant of coefficient
βi = linear coefficient
The significant impacts of the factors in each model on removal efficiency were tested using ANOVA with a significance level (alpha-value) of 5%. This criterion of statistical significance served as the foundation for model reduction. A p-value of less than 0.05 indicates that the effect of the parameter in question is significant and will be retained in the model. Otherwise, it indicates that the effect of the parameter in question is insignificant, and it is thus removed from the model.
The purpose of Taguchi method optimization was to achieve maximum removal efficiency, therefore among the three optimization S/N criteria, large-is-better was chosen, and the respective ranks based on S/N were achieved. S/N and analysis of variance (ANOVA) studies were used to identify the optimal arrangement of the process parameters. An experiment confirms the best process parameters discovered during parameter design.
2.5. Batch Experimental Studies
Batch tests were carried out to investigate the effect of various parameters on adsorption capacity and removal efficiency. These variables were the adsorbent dose, the starting dye concentration, the contact period, and the pH. In 250 mL stoppered conical flasks, 100 mL of aqueous solution of dyes produced with varied MB dye concentrations was taken for each experimental run. Each flask received the required dose of MMSB based on the experimental run. These flasks were agitated in an orbital shaking incubator at a constant shaking speed of 150 rpm at the requisite time and temperature of 30°C. The batches were centrifuged separately at 4,000 rpm, 30°C temperature and 20 minutes. The clear solution was decanted off and filtered using a Polytetrafluoroethylene (PTFE) 0.45 µm membrane filter. The residual MB dye concentration in the solution (Ce) was determined using a UV-Vis spectrophotometer (Model: UV -2450) at a wavelength of 664 nm. The experiments were conducted in triplicate. Equations (4) and (5) were used to calculate the adsorption capacity (qe) and removal efficiency (Re) [
1,
2].
where:
C0 = initial MB dye concentration in (mg/L);
Ce = is the equilibrium MB dye concentration (mg/L);
m = adsorbent dose (g/L);
qe = amount of adsorbate adsorbed by the adsorbent at equilibrium (mg/g)
Re = removal efficiency (%).
2.6. Adsorption Isotherms
The adsorption isotherm and the influence of the initial MB dye concentration on the equilibrium adsorption capacities (qe) and removal efficiencies (Re) were evaluated using initial MB dye concentrations (Co) ranging from 100 to 300 mg/L. To analyze the adsorption isotherm, the commonly used Langmuir (Equation (5)) and Freundlich (Equation (6)) adsorption models were used to mimic and comprehend the adsorption mechanism [
3].
where:
Ce = equilibrium MB dye concentration in aqueous solution (g/L);
qm = maximum adsorption capacity;
qe = amount of B dye adsorbed on MMSB (mg/g);
KL = Langmuir constant;
n = Freundlich constants related to the adsorption capacity;
KF = Freundlich constants related to adsorption intensity.
Langmuir isotherm suggests that a limited adsorption capacity is exhibited by the solid adsorbent [
21]. All active sites are indistinguishable and can only complex a single molecule of solute (monolayer adsorption). The molecules that have been adsorbed do not interact [
22]. On the other hand, to illustrate the multi-layer adsorption on heterogamous surfaces, the Freundlich isotherm was applied [
23].
2.7. Adsorption Kinetics
The adsorption kinetics of MB dye by MMSB samples were studied using the previously specified process parameters. A predetermined number of samples were placed in a 250 mL Erlenmeyer flask and mixed with 50 mL of 100 mg/L methylene blue solution. The experiment was carried out at 30 0C with a frequency of 150 rpm stirring. Adsorption is a complicated process that usually involves both surface adsorption and diffusion into the pores.
2.7.1. Lagergren’s Pseudo-First-Order (PFO)
The pseudo-first-order (PSO) model explains a species' adsorption kinetics in an adsorbent particle using the (ODE) ordinary first-order differential Equation (7) [
23], which has a unique solution.
where;
qe = equilibrium adsorption capacity (mg/g);
q(t)= adsorption capacity at time, t.
Integrating the differential Equation (7) for the boundary condition, q(0)=0, yielded the pseudo-first-order Lagergren equation (Equation (8)):
Where;
qe = equilibrium adsorption capacity (mg/g);
q(t) = adsorption capacity at time, t.
k1 = constant rate of Lagergren’s Pseudo first order
t = time (minutes).
2.7.2. Ho’s Pseudo Second Order (PSO)
Adsorption happens on two surface sites in pseudo-second order kinetics (referred to by some writers as "Blanchard's model") and can thus be described by the second-order differential equation 9 [
12].
where:
qe = equilibrium adsorption capacity;
k2 = constant rate of Ho’s pseudo second order;
t = time (minutes).
Following the pseudo-second-order kinetic model, Equation (10) was generated as the mathematical equation by integrating the differential Equation (9) for the boundary conditions of q(0) = 0.
where;
qe = amount of adsorbate in the adsorbent at equilibrium (mg/g);
q(t) = amount of adsorbate in the adsorbent at time t (mg/g);
t = time of contact (minutes);
k2 = constant rate of Ho’s Pseudo Second Order.
In order to check this kinetic model, it is appropriate to represent t⁄(q(t)) graphically as a function of the contact time (t) and to note the coefficient of determination R2.
3. Results
3.1. Characterization of MMSB
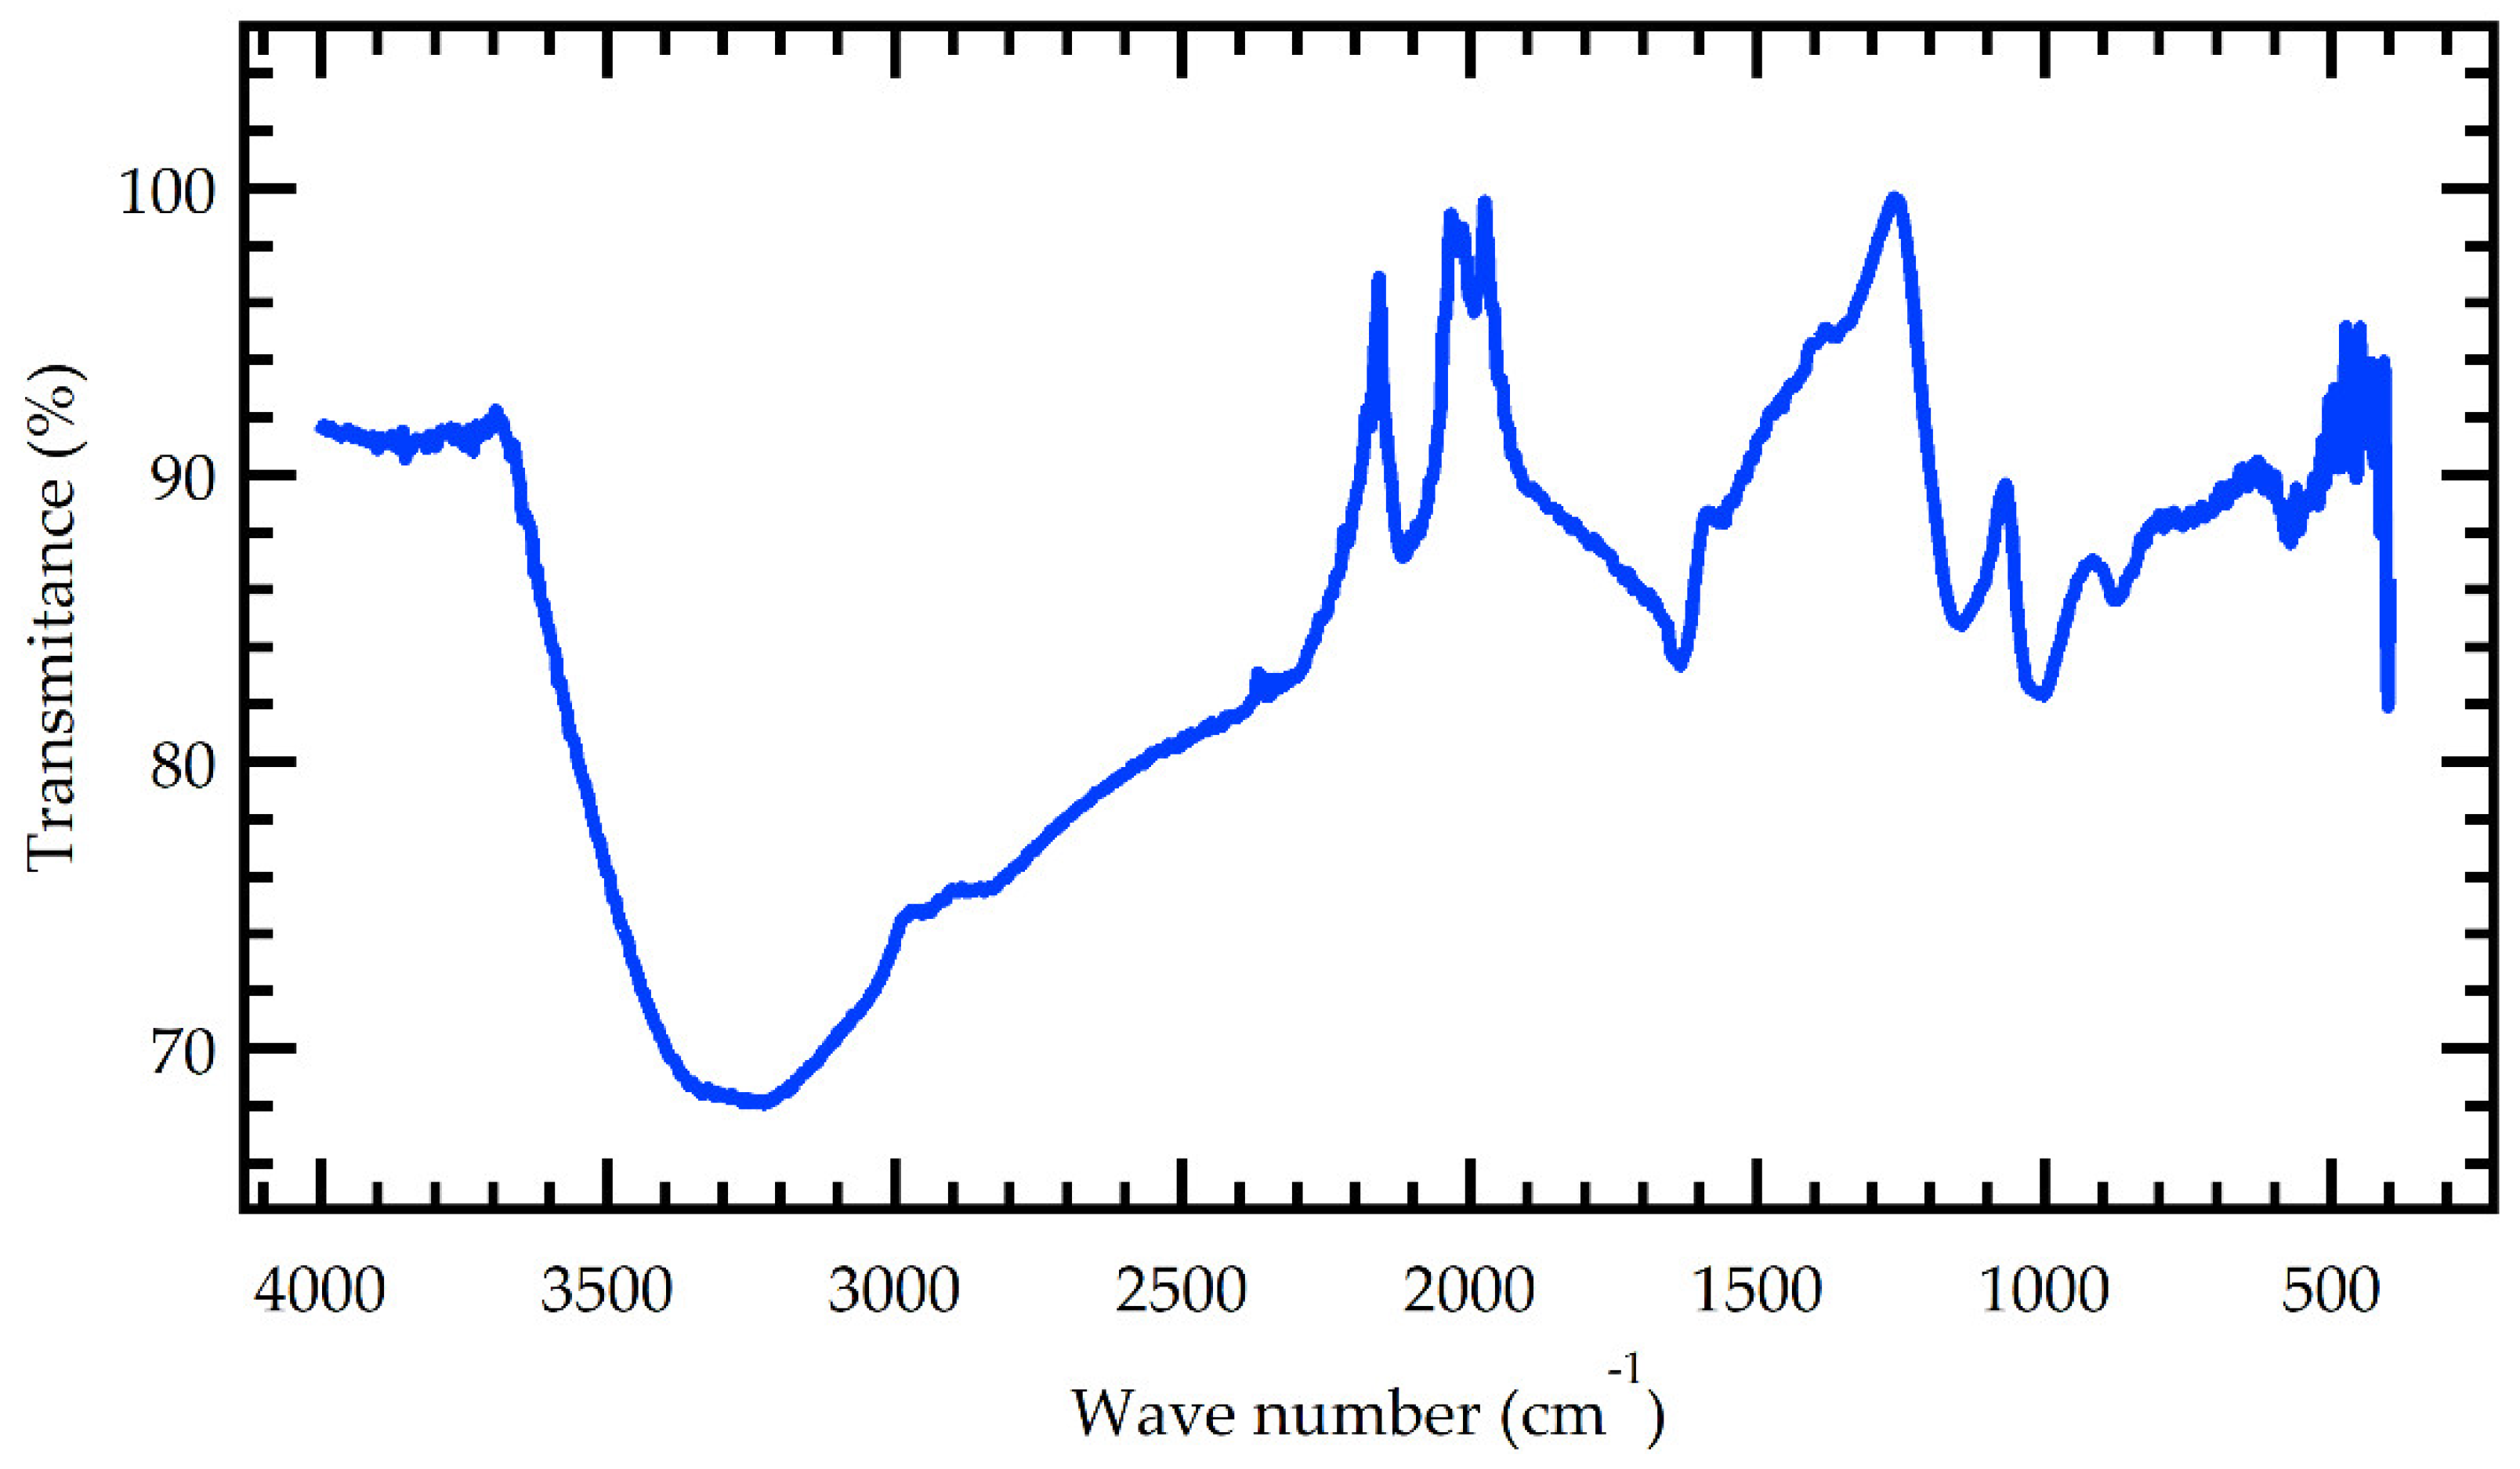
The MMSB functional groups were characterized using Fourier transform infrared (FTIR) analysis.
Figure 1 depicts the sample's FTIR spectrum. The FTIR spectrum shows that a large number of oxygen-containing functional groups are formed on the surface of MMSB during the preparation procedure.
The main absorption peaks of its infrared spectrum were: 3248, 2931, 2348, 1625, 1542, 1018, 872 and 557 cm
-1. The stretching vibration peak of the alcoholic hydroxyl group (-OH) and the N-H stretching vibration peak of the intermolecular hydrogen bond association were the primary absorption peaks at 3248 cm
-1. A similar range was obtained by X. J. Liu et al [14. The absorption peaks at 2931 and 2348 cm
-1 corresponded to the stretching vibration peaks of the alkanes -CH
3 and -CH
2, respectively. This is in agreement with [
7]. The vibration of the benzene ring skeleton was responsible for the peak at 1625 to 1542 cm
-1. The modification of manganese (iv) oxide further promotes the aromatization process. This is supported by Tang et al [
10]. The C-O stretching vibration of phenols and oxyhydrogen groups was ascribed to the absorption peak at 1018 cm
-1. The peak at 872 cm
-1 could be due to the absorption vibration peak created by the weaker aromatization peak. The hydroxyl, methyl, and methylene groups were reduced after manganese alteration and new peaks were formed, which increased the degree of biochar aromatization [
11].
3.2. Statistical Analysis
Table 2 shows the reaction with its associated S/N ratio for each experimental run.
Table 4 and
Table 5 for response means and S/N ratio respectively were developed and utilized to examine the impact of each process parameter (A, B, C, and D) on removal efficiency.
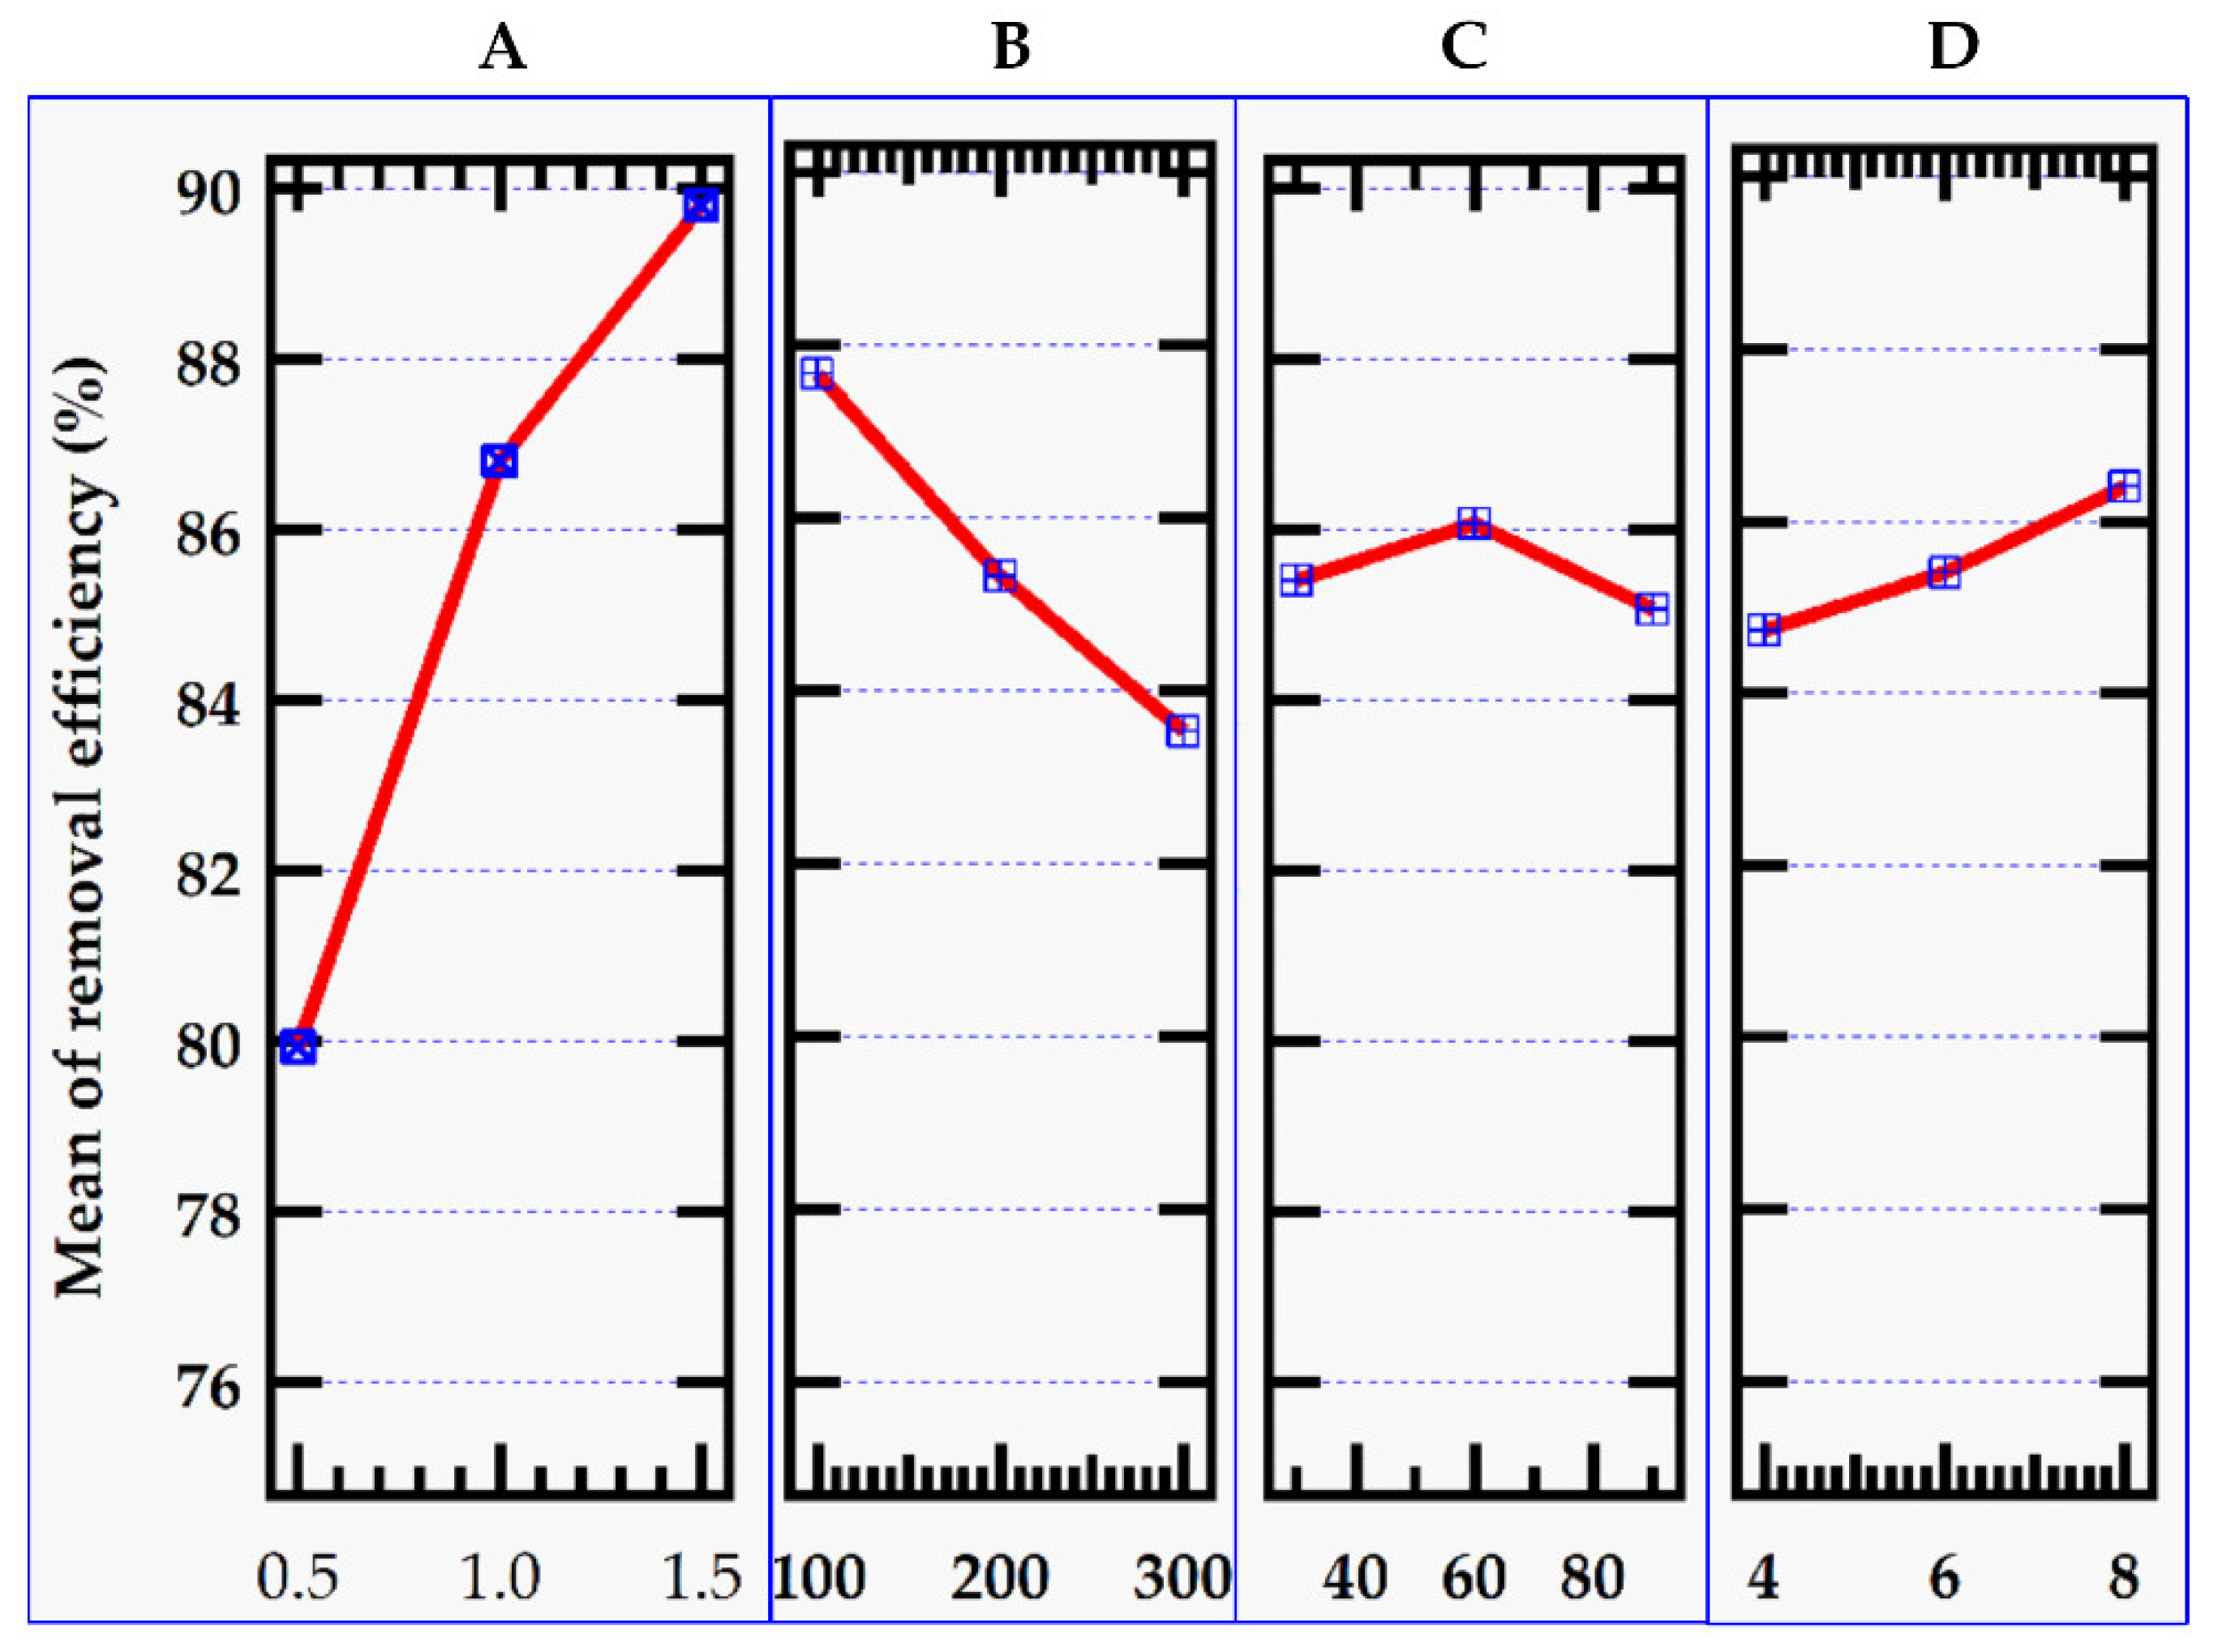
Figure 2 shows graphs of the level values of the control parameters for removal efficiency indicated in
Table 2, while
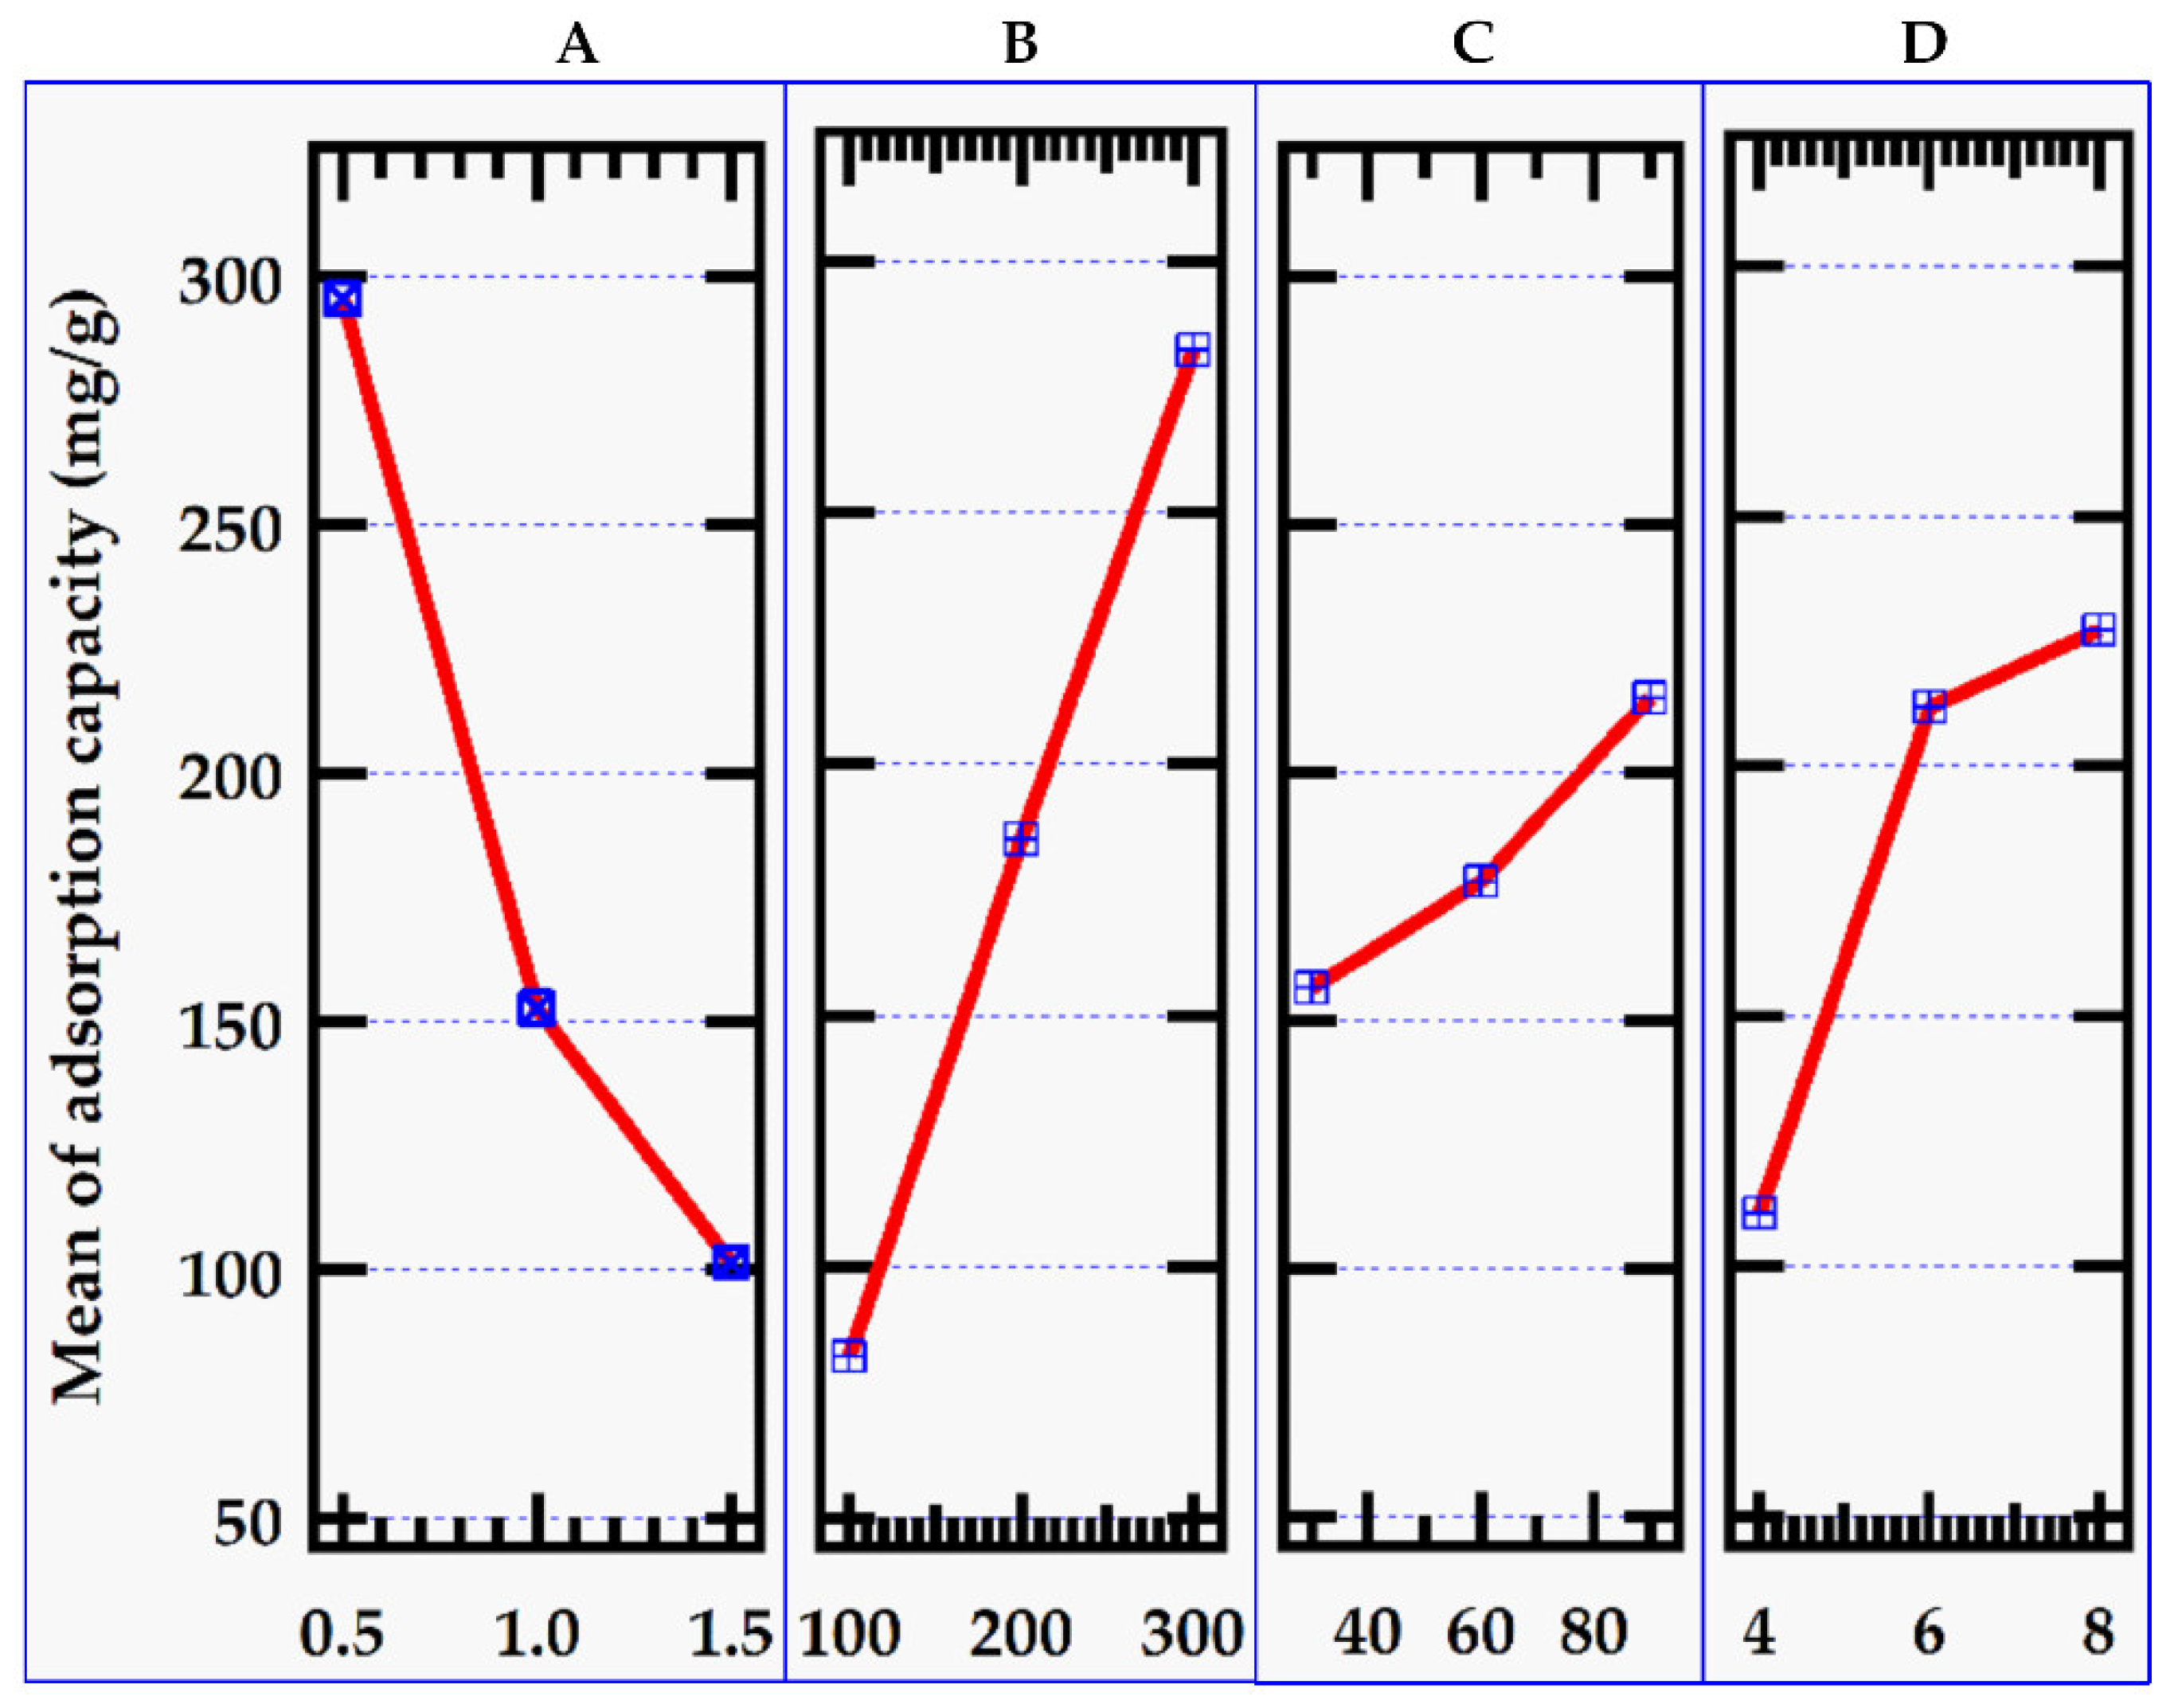
Figure 3 shows the matching S/N ratio.
Figure 2.
Effect of factors on the removal efficiency.
Figure 2.
Effect of factors on the removal efficiency.
Figure 3.
Effect of factors on adsorption capacity.
Figure 3.
Effect of factors on adsorption capacity.
Table 2.
Taguchi experimental runs with respective removal efficiency and S/N ratio.
Table 2.
Taguchi experimental runs with respective removal efficiency and S/N ratio.
| Runs |
A |
B |
C |
D |
Ce |
qe |
Re |
S/N ratio |
| 1 |
0.5 |
100 |
30 |
4 |
18.8 |
162.4 |
81.2 |
38.19112 |
| 2 |
0.5 |
200 |
60 |
6 |
39.6 |
320.8 |
80.2 |
38.08349 |
| 3 |
0.5 |
300 |
90 |
8 |
64.8 |
470.4 |
78.4 |
37.88632 |
| 4 |
1 |
100 |
60 |
8 |
9.6 |
90.4 |
90.4 |
39.12337 |
| 5 |
1 |
200 |
90 |
4 |
29.2 |
170.8 |
85.4 |
38.62916 |
| 6 |
1 |
300 |
30 |
6 |
46.2 |
253.8 |
84.6 |
38.54741 |
| 7 |
1.5 |
100 |
90 |
6 |
8.6 |
60.9 |
91.4 |
39.21892 |
| 8 |
1.5 |
200 |
30 |
8 |
19.2 |
120.5 |
90.4 |
39.12337 |
| 9 |
1.5 |
300 |
60 |
4 |
37.2 |
175.2 |
87.6 |
38.85008 |
Table 3.
ANOVA for response means.
Table 3.
ANOVA for response means.
| Source |
DF |
Adj SS |
Adj MS |
F-Value |
P-Value |
| Regression |
4 |
175.987 |
43.997 |
19.42 |
0.007 |
| A |
1 |
146.027 |
146.027 |
64.46 |
0.001 |
| B |
1 |
25.627 |
25.627 |
11.31 |
0.028 |
| C |
1 |
0.167 |
0.167 |
0.07 |
0.800 |
| D |
1 |
4.167 |
4.167 |
1.84 |
0.247 |
| Error |
4 |
9.062 |
2.266 |
|
|
| Total |
8 |
185.049 |
|
|
|
Table 4.
Signal-to-noise ratio with larger is better.
Table 4.
Signal-to-noise ratio with larger is better.
| Level |
A |
B |
C |
D |
| 1 |
38.05 |
38.84 |
38.62 |
38.56 |
| 2 |
38.77 |
38.61 |
38.69 |
38.62 |
| 3 |
39.06 |
38.43 |
38.58 |
38.71 |
| Delta |
1.01 |
0.42 |
0.11 |
0.15 |
| Rank |
1 |
2 |
4 |
3 |
Table 5.
Means of removal efficiency.
Table 5.
Means of removal efficiency.
| Level |
A |
B |
C |
D |
| 1 |
79.93 |
87.67 |
85.40 |
84.73 |
| 2 |
86.80 |
85.33 |
86.07 |
85.40 |
| 3 |
89.80 |
83.53 |
85.07 |
86.40 |
| Delta |
9.87 |
4.13 |
1.00 |
1.67 |
| Rank |
1 |
2 |
4 |
3 |
3.2.1. Effect of Adsorbent Dose
The removal rate of methylene blue increased as the adsorbent dosage was increased (
Figure 2). This was due to a greater number of adsorption sites. At modest levels of MMSB, the concentration of methylene blue in the system was high, and there were numerous active sites for adsorption, therefore the adsorption capacity was high. However, as the addition amount increased, the removal rate tended to increase with the increase in dose due to an increase in the availability of vacancy adsorption sites [
14].
3.2.2. Effect of Initial MB Dye Concentration
At the start, the removal efficiency of methylene blue solution over MMSB was 87.67%. However, as the initial concentration increased, the clearance rate dropped due to the fewer active sites required for high dye concentrations (
Figure 2). Adsorption capacity, on the other hand, rose significantly due to the high solution concentration and adsorption impulse (
Figure 3), ensuring complete contact between the adsorbent and methylene blue dye [
24]. At the highest level of initial MB dye concentration of 300 mg/L, the adsorption capacity reached 200.16 mg/g though the adsorption capacity did not increase indefinitely.
3.2.3. Effect of Contact Time
The adsorption process is highly affected by the time spent where the adsorbent and MB dye are in contact. It can be seen (
Figure 2) that performance improves over time until equilibrium is reached which is consistent with prior investigations on cationic dye removal [
25]. The adsorption process reaches equilibrium in 60 minutes, with no change in the removal percentage. This could be due to dye molecules saturating reactive sites [
26].
3.2.4. Effect of pH
With increasing pH, removal efficiency and adsorption capacity rose as well (
Figure 2). At pH 4.0, the elimination efficiency of methylene blue was 84.7 %. When the methylene blue dye's pH hit 8.0, its removal efficiency approached 86.4 %, while its adsorption capacity increased from 110. 80 to 227.11 mg/g. The capacity of hydrogen ions combined binding sites on biochar was limited in acidic conditions, whereas methylene blue was a positively charged cationic dye, which was likewise positively charged. This would result in the electrostatic repulsion of methylene blue and MMSB thus reducing the adsorption capacity [
27]. Higher pH reduces hydrogen ion competition in the alkaline environment, and electrostatic attraction between MMSB and methylene blue molecules was strengthened by increasing the negative charge on the adsorbent surface hence higher adsorption capacity and efficiency were registered [
23].
3.2.5. Regression Model
The significant model terms were determined using ANOVA and a linear regression model. Equation (11) with its coded terms provides the model. The model was statistically significant, with a P-value of 0.007, an R
2 of 0.951, an adjusted R
2 of 0.902 and a predicted R
2 of 0.695.
Where Y denotes the removal efficiency (response) and A, B, C, and D denote the adsorbent dose, initial MB dye concentration, contact time, and pH respectively.
The ANOVA for means was carried out as shown in
Table 3. A and B are statistically significant terms in the model at the 5% significance level whereas C and D are not.
3.2.6. Optimization
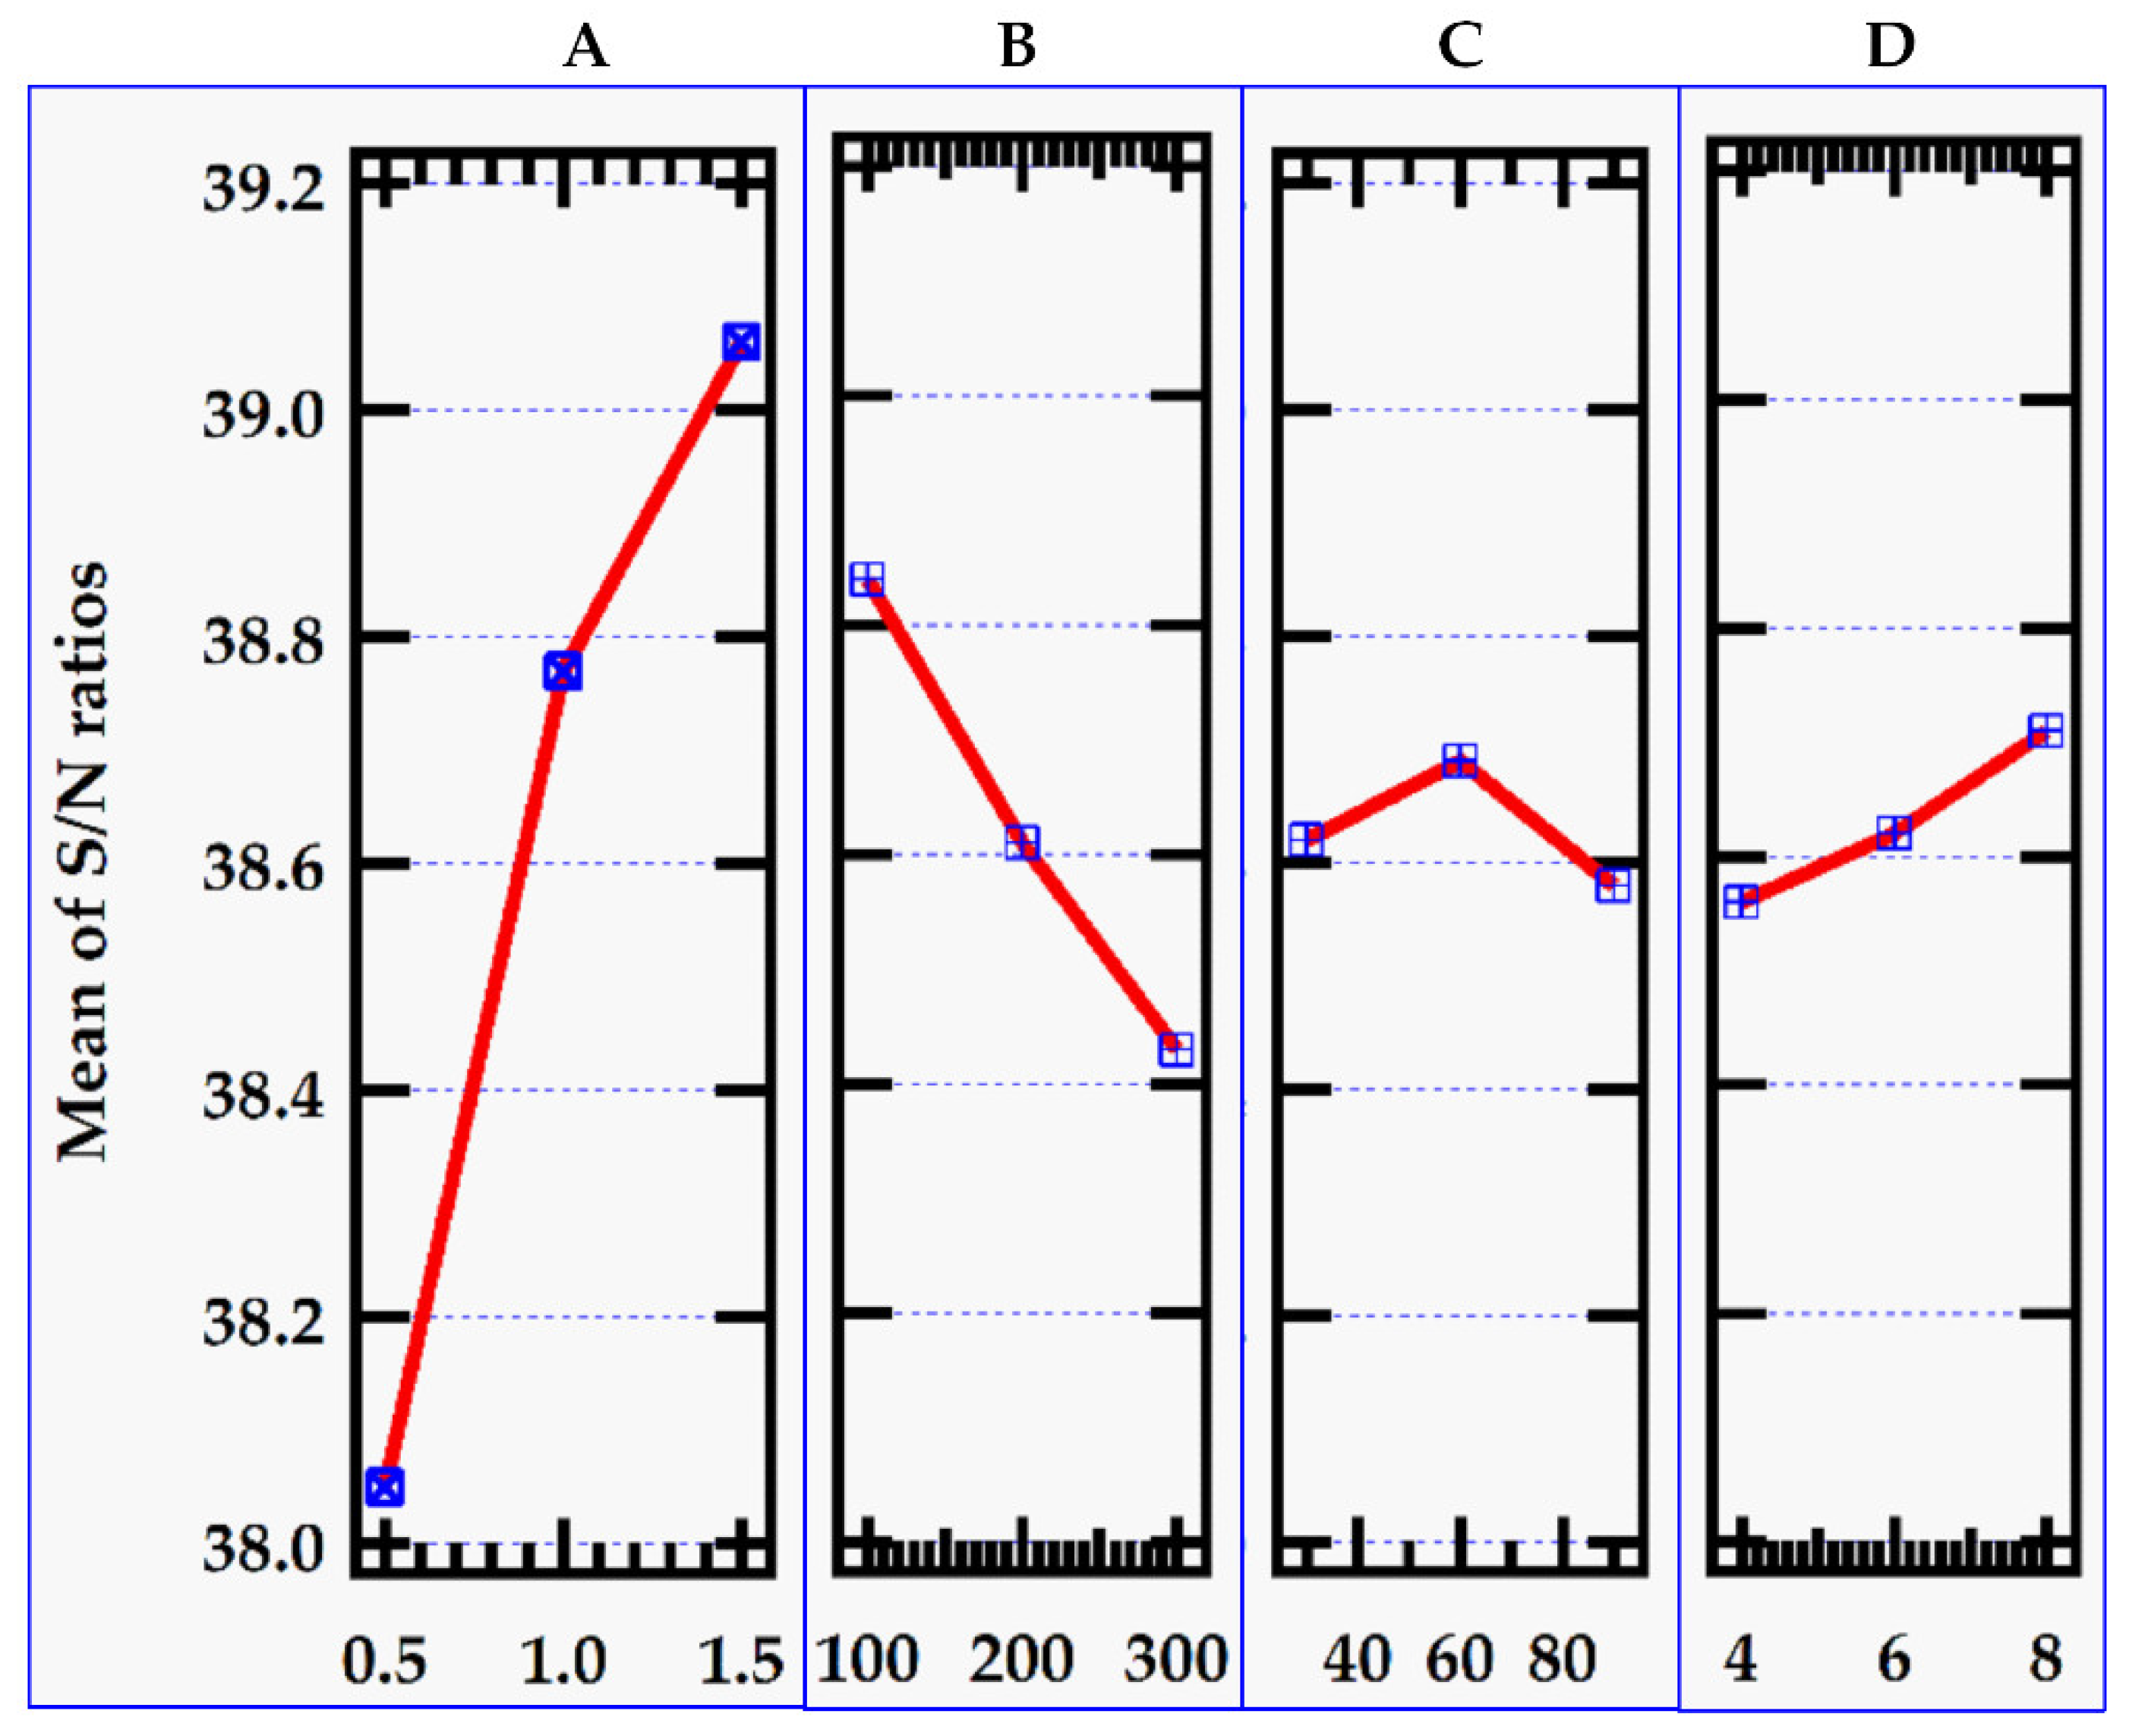
The Taguchi optimization proceeded with reference to the signal-to-noise ratio parameter. The best level for each control factor was found according to the highest S/N ratio in the levels of that control factor. Accordingly, the levels and S/N ratio in
Table 4 for the factors giving the best removal efficiency value were specified as factor A (Level 3, S/N ratio = 39.06), factor B (Level 1, S/N ratio = 38.84), factor C (Level 2, S/N ratio = 38.69) and factor D (Level 3, S/N ratio = 38.71.
Figure 4.
S/N ratio for the removal efficiency.
Figure 4.
S/N ratio for the removal efficiency.
This implies that optimum control values for the adsorbent dose, initial MB dye concentration, contact time and pH are 1.0 g, 100 mg/L, 60 min and 8 respectively which yielded the mean maximum of 87. 49 % removal efficiency and 206. 53 mg/g adsorption capacity as illustrated in
Table 5 and
Table 6.
3.3. Adsorption Isotherms
A total of five (5) experiments were conducted to determine the adsorption equilibrium mechanism of MMSB. The MB dye concentration was varied through 100, 150, 200, 250 and 300 mg/L as shown in
Table 6 while the other factors were maintained at the optimum points as determined by Taguchi analysis.
When the dye concentration was increased from 100 to 300 mg/L, the utilization rate of the effective active sites on the MMSB adsorbent gradually rose, as did the adsorption capacity (qe) of the MMSB adsorbent for MB dye as demonstrated in
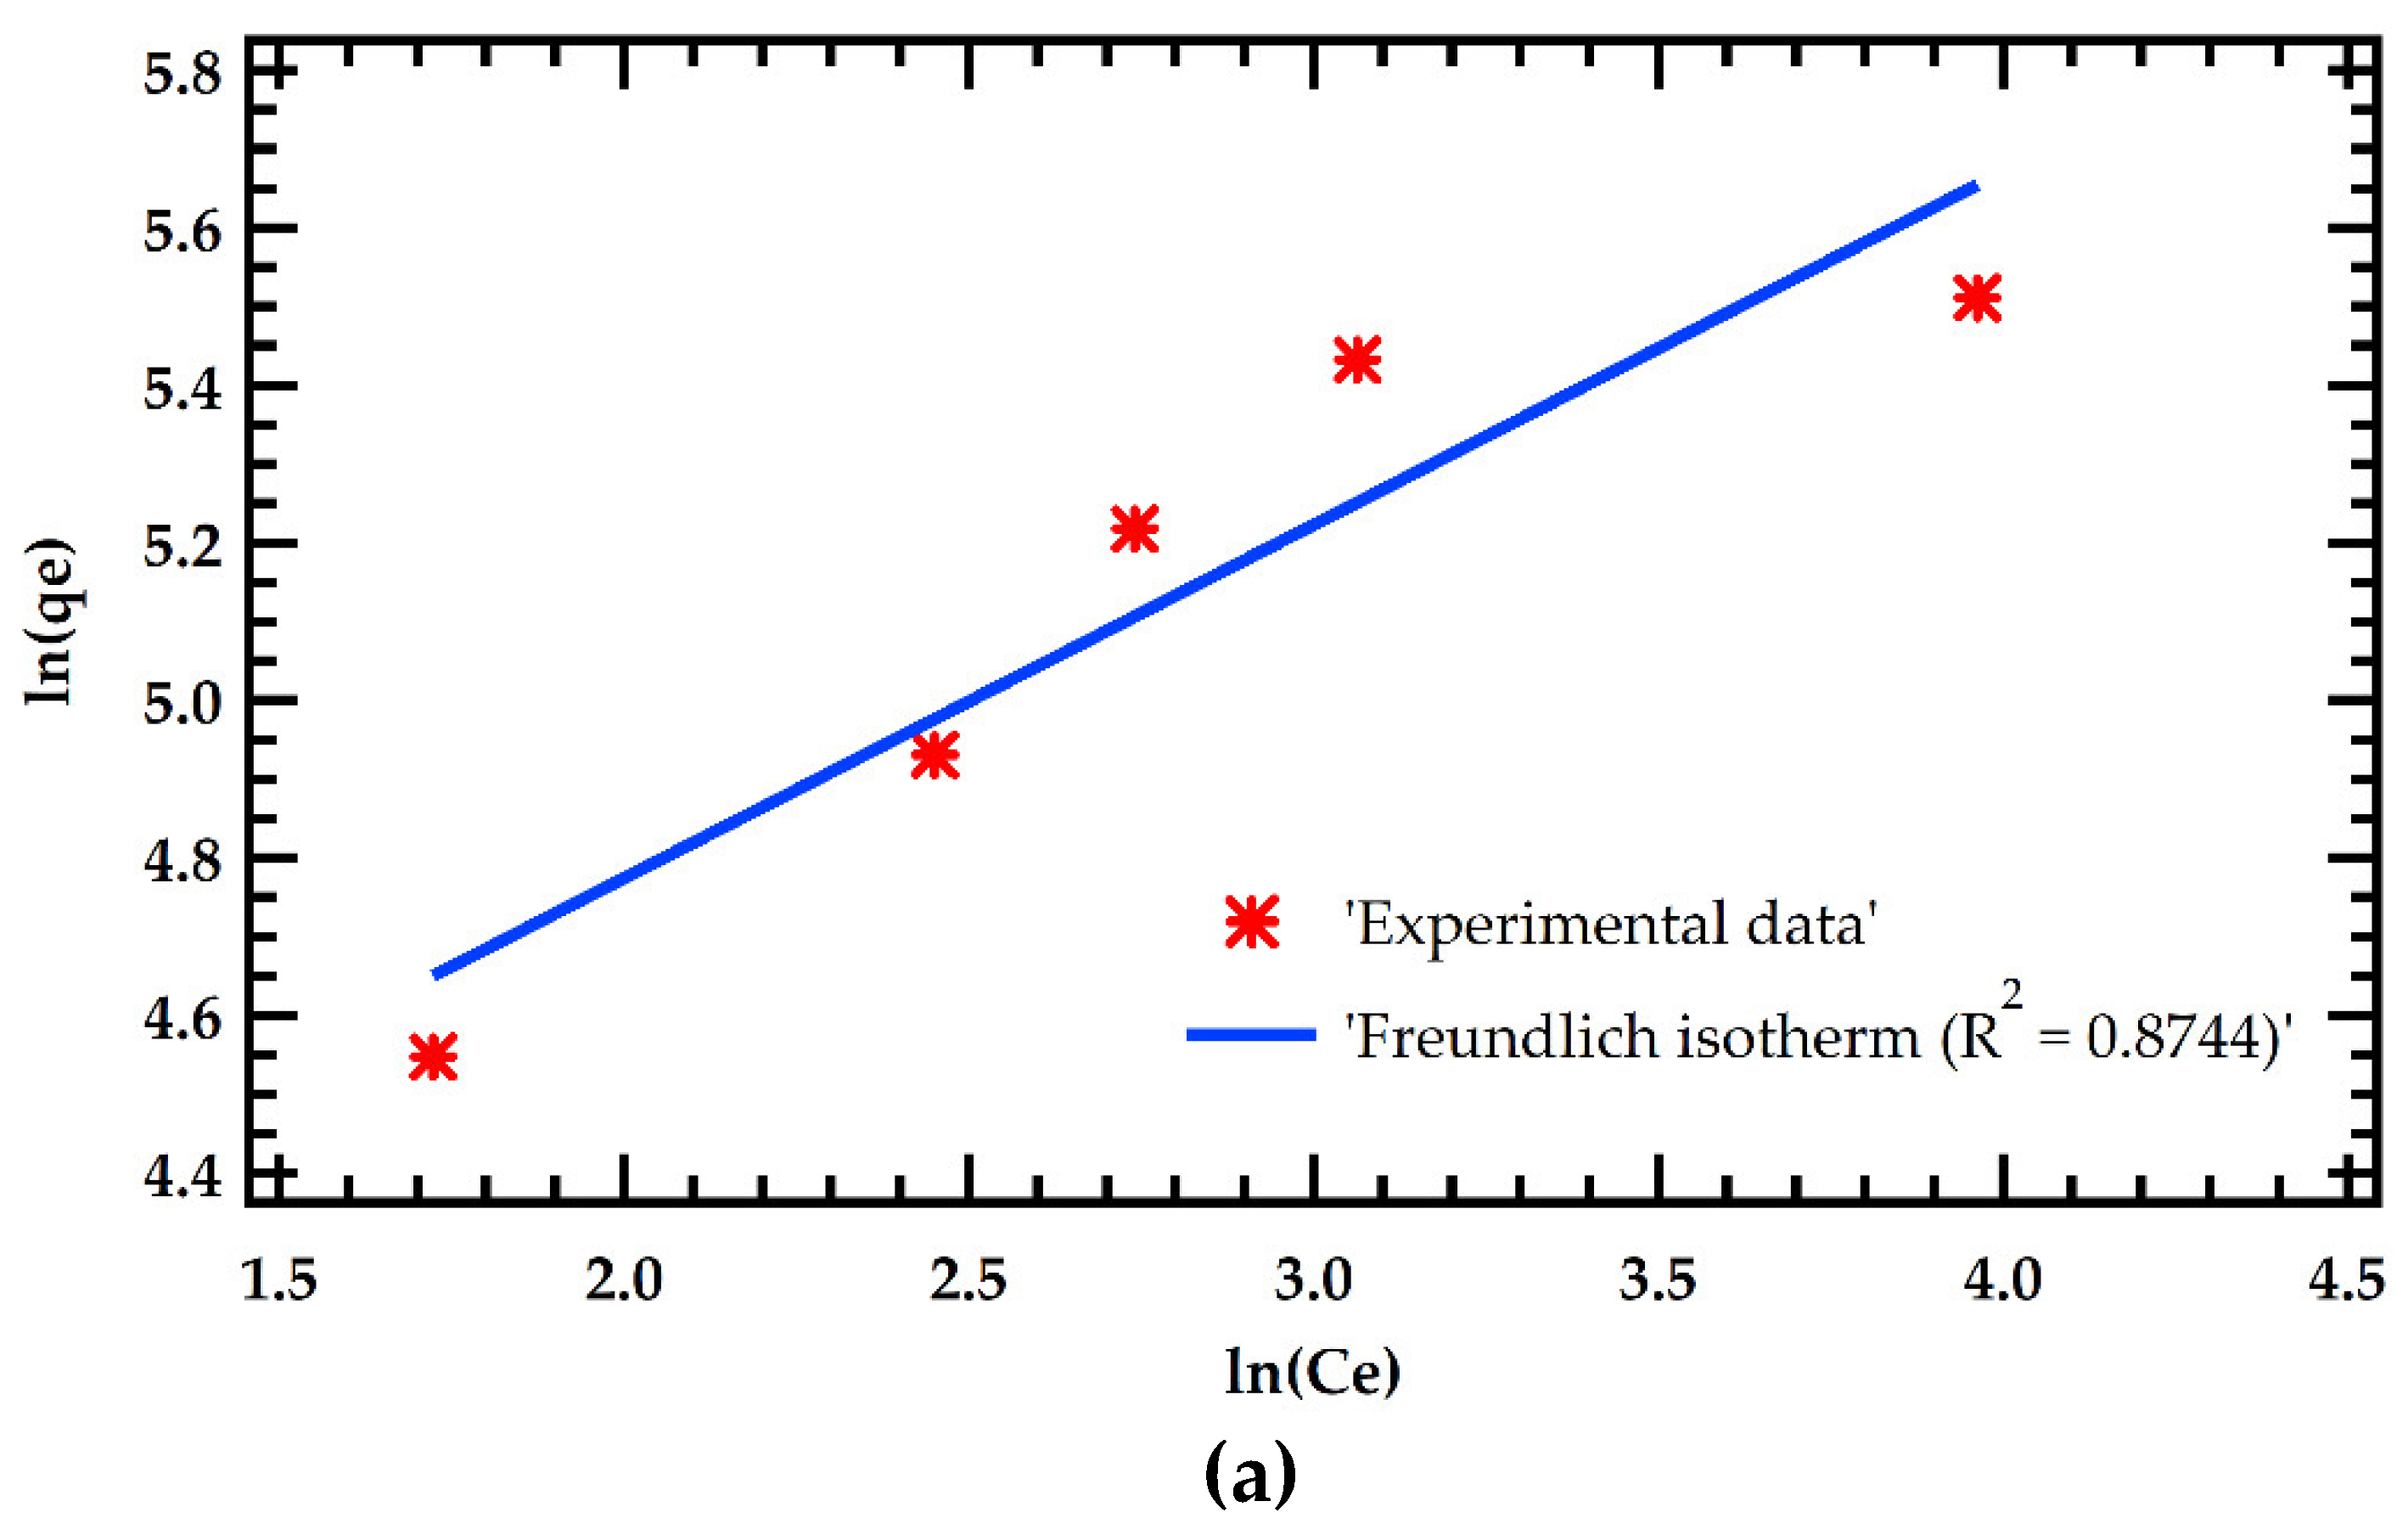
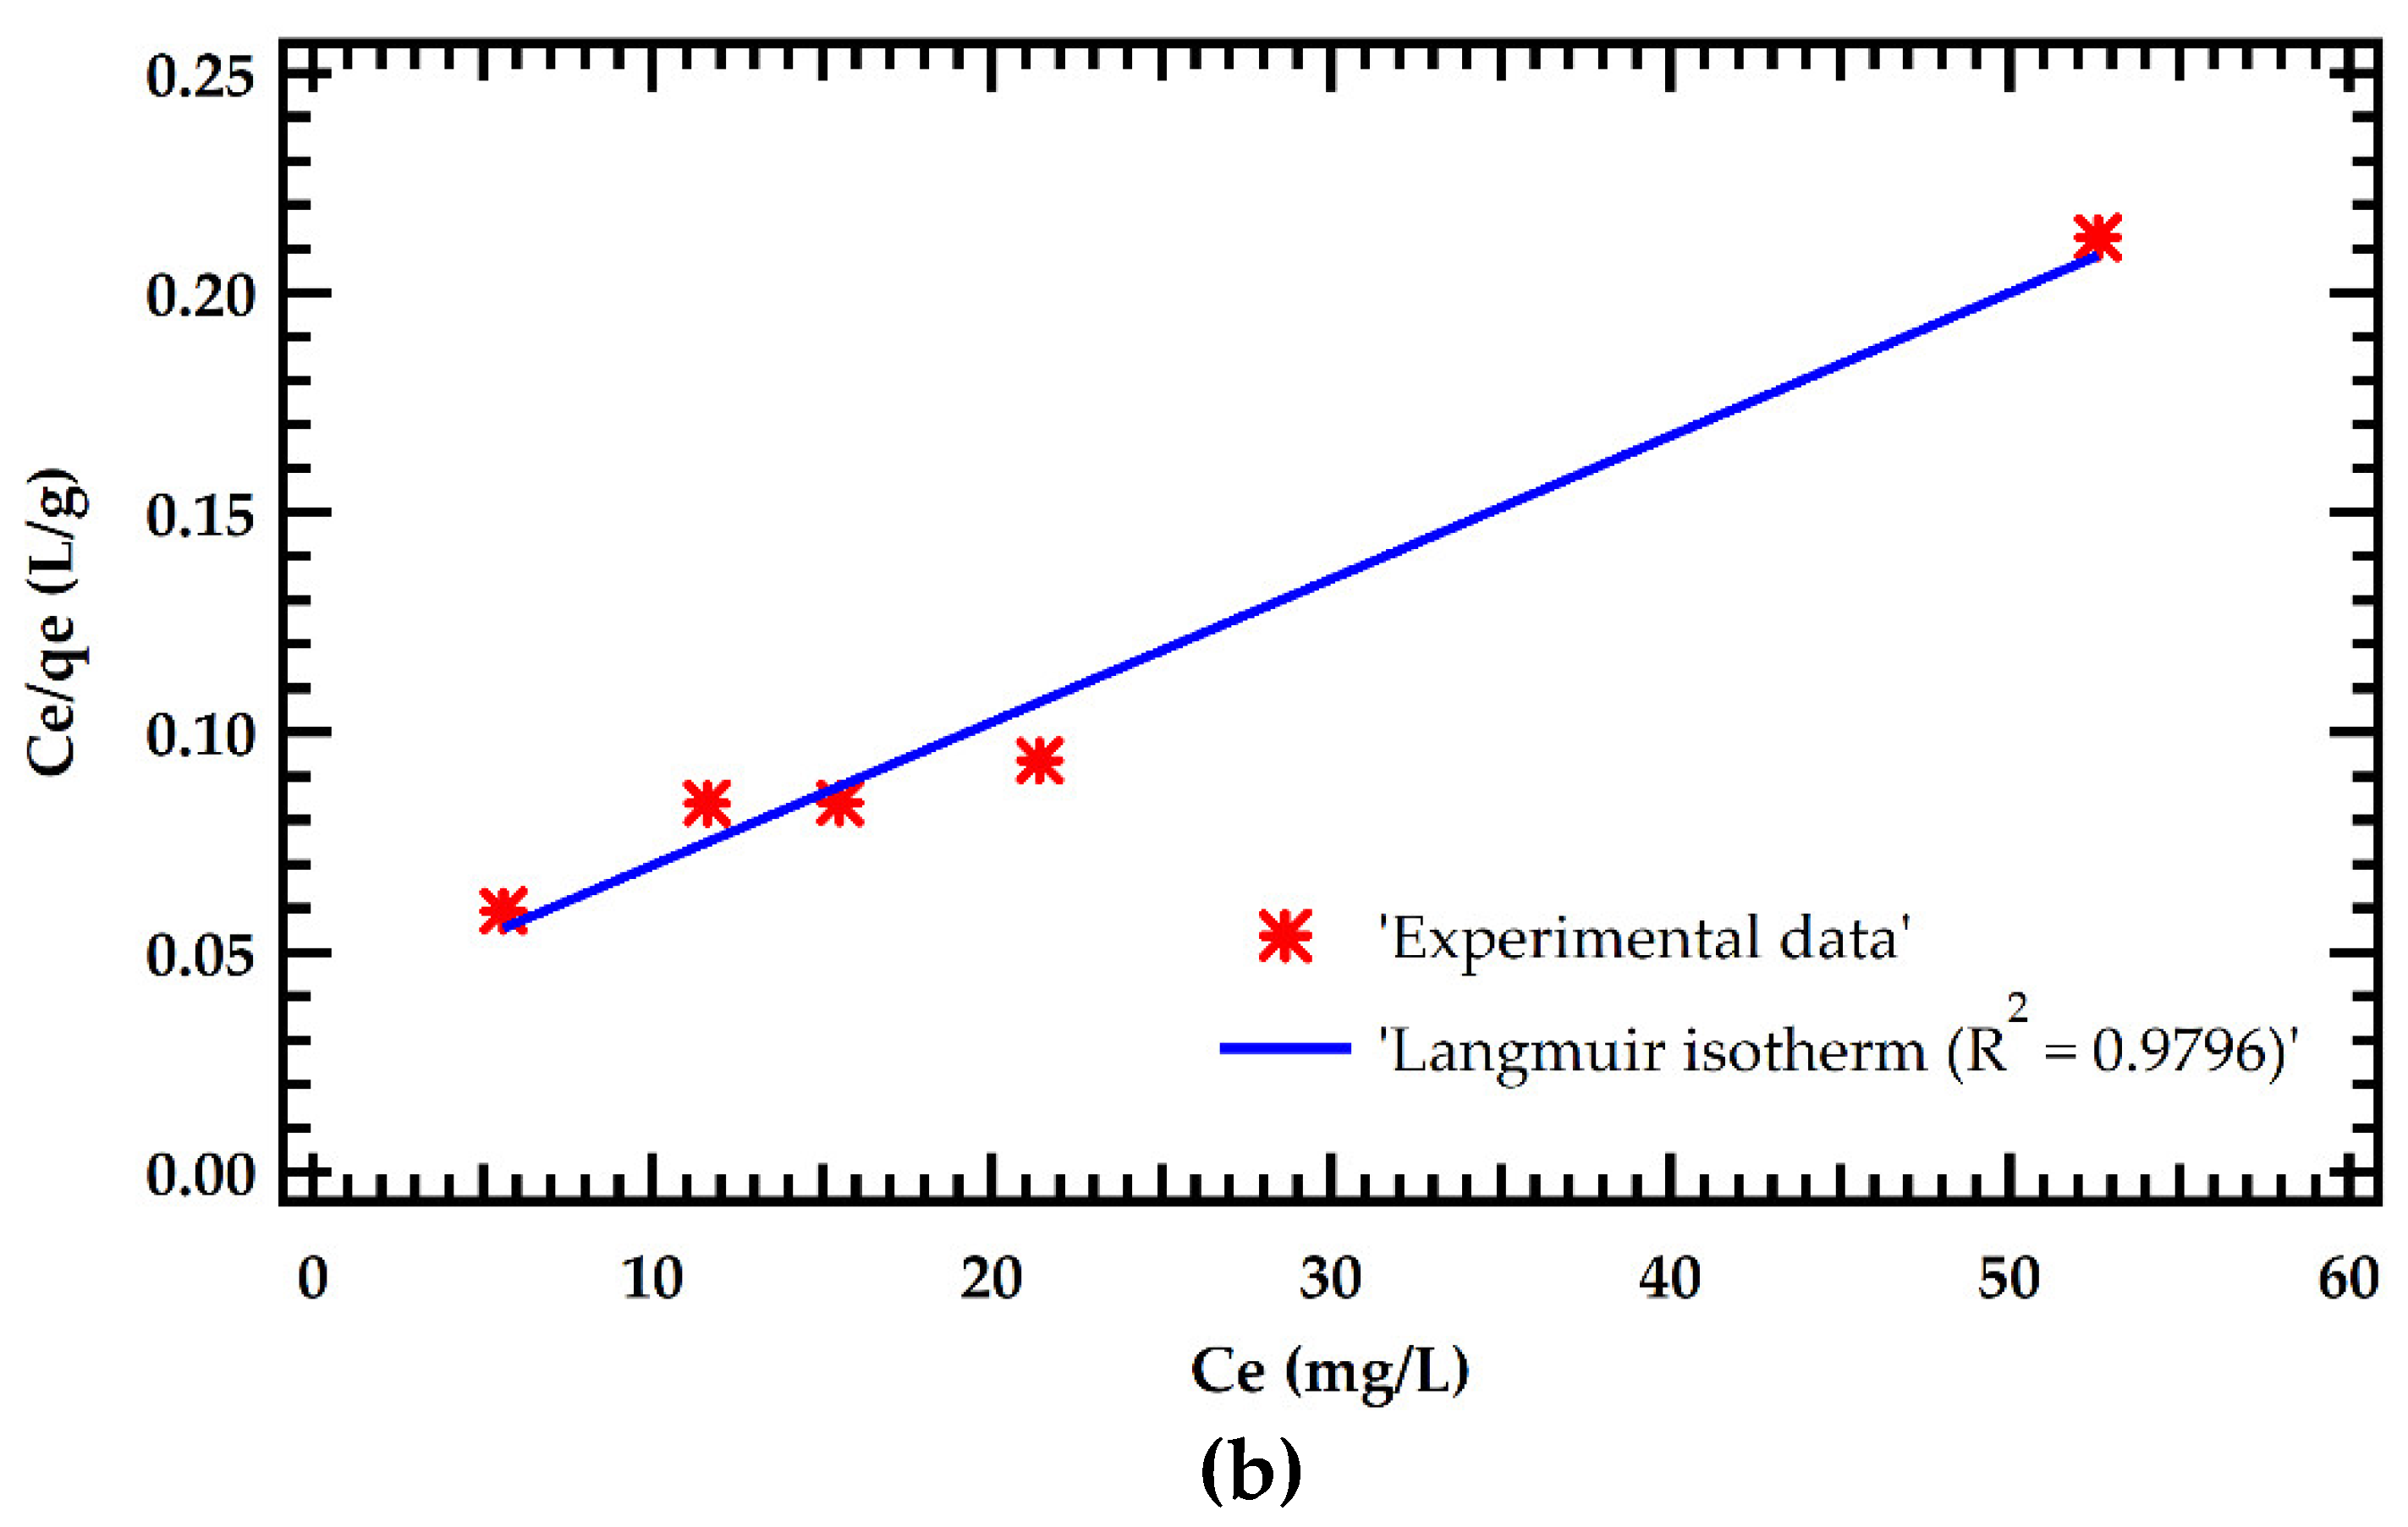
Table 6. The results were fitted with Langmuir and Freundlich adsorption models as illustrated in Figure 5. The Langmuir model significantly outperformed the Freundlich model in simulating adsorption isotherms. This is demonstrated by a greater R
2 of 0.9795 for the Langmuir model against 0.8744 for the Freundlich model. This implies that MB dye adsorption on MMSB surfaces is chemisorption with homogeneous monolayer coverage. This is in agreement with [
7,
14]. Furthermore, the theoretical equilibrium adsorption amount determined by Langmuir isothermal fitting was 154.6 mg/g, which was close to the experimental equilibrium adsorption amount.
3.4. Adsorption Kinetics
MB dye concentration was prepared with optimized values obtained from Taguchi analysis. The initial dye concentration was 100 mg/L and adjusted to pH of 8.0 and then 1 g of MMSB was added. The adsorption batch experiments were performed at a constant temperature of 300°C while varying the contact time with 30, 45, 60, 75 and 90 minutes as shown in
Table 7.
At the first contact time, adsorption increases rapidly with increasing contact time, and then steadily increases with increasing contact time until equilibrium adsorption capacity is reached. The fitting results of the pseudo-second-order kinetic model and the pseudo-first-order kinetic model are shown in
Figure 6. As seen in
Figure 6, the adsorption data fit the pseudo-second-order kinetic model remarkably well. The pseudo-second-order kinetic model has a stronger linear coefficient of determination (R
2 = 0.999968) than the pseudo-first-order kinetic model (R
2 = 0.9911). This could be explained by the fact that the methylene blue adsorption process by MMSB was primarily governed by the chemisorption mechanism rather than the material transport phase [
11,
12]. Similar kinetic results for the adsorption kinetics of numerous water contaminants by carbon-based adsorbents have been published in the literature [
10,
24].
5. Conclusions
The results established that there is a remarkable influence of manganese (iv) oxide on the maize stalk biochar. The FTIR analysis of the MSSB disclosed that hydroxyl, methyl, and methylene groups were reduced after manganese alteration and new peaks were formed, which increased the degree of biochar aromatization It increased the adsorption capacity from 166.4 mg/g to 206.53 mg/g. Among the investigated factors adsorbent dose and initial dye concentration significantly affected the removal efficiency and adsorption capacity. Pseudo-second-order kinetics and Langmuir isotherm models could be used to describe the adsorption of manganese (iv) oxide-modified maize stalk biochar to methylene blue in aqueous solution. The results showed that manganese compound modification is a promising technique for the development of maize stalk biochar-derived adsorbents for methylene blue in industrial effluents.
Author Contributions
Conceptualization, D.T.; methodology, D.T and B.O.A.; software, D.T.; validation, D.T. and B.O.A; formal analysis, D.T. and K.M.; investigation, D.T.; resources, D.T. and B.O.A; data curation, D.T. and K.M.; writing—original draft preparation, D.T.; writing—review and editing, D.T.; B.O.A. K.M.; and Y.J.L; visualization, D.T. and Y.J.L; supervision, B.O.A.; project administration, B.O.A.; funding acquisition, B.O.A. All authors have read and agreed to the published version of the manuscript.
Funding
This research was funded by the Kenyan German Centre for Mining, Environmental Engineering and Resource Management (CEMEREM), Taita Taveta University.
Data Availability Statement
The data presented in this study are available on request from the corresponding author.
Acknowledgments
We wish to thank the Materials and Metallurgy Laboratory, Busitema University, The Kenyan German Centre for Mining, Environmental Engineering and Resource Management (CEMEREM), Taita Taveta University for their support.
Conflicts of Interest
The authors declare no conflict of interest.
References
- Gupta, T.B.; Lataye, D.H. Adsorption of indigo carmine and methylene blue dye: Taguchi’s design of experiment to optimize removal efficiency. Sadhana Acad. Proc. Eng 2018, 43, 170. [Google Scholar] [CrossRef]
- Yusuff, A.S.; Ajayi, O.A.; Popoola, L.T. Application of Taguchi design approach to parametric optimization of adsorption of crystal violet dye by activated carbon from poultry litter. Sci. Afr. 2021, 13, e00850. [Google Scholar] [CrossRef]
- Igwegbe, C.A.; Mohmmadi, L.; Ahmadi, S.; Rahdar, A.; Khadkhodaiy, D.; Dehghani, R.; Rahdar, S. Modeling of adsorption of Methylene Blue dye on Ho-CaWO4 nanoparticles using Response Surface Methodology (RSM) and Artificial Neural Network (ANN) techniques. MethodsX 2019, 6, 1779–1797. [Google Scholar] [CrossRef]
- Bouyahia, C.; Rahmani, M.; Bensemlali, M.; El Hajjaji, S.; Slaoui, M.; Bencheikh, I.; Azoulay, K.; Labjar, N. Influence of extraction techniques on the adsorption capacity of methylene blue on sawdust: Optimization by full factorial design. Mater Sci Energy Technol. 2023, 6, 114–123. [Google Scholar] [CrossRef]
- Mulushewa, Z.; Dinbore, W.T.; Ayele, Y. Removal of methylene blue from textile waste water using kaolin and zeolite-x synthesized from Ethiopian kaolin. Environ Anal Health Toxicol. 2021, 36, 1–13. [Google Scholar] [CrossRef] [PubMed]
- Nnaji, P.C.; Anadebe, V.C.; Agu, C.; Ezemagu, I.G.; Edeh, J.C.; Ohanehi, A.A.; Onukwuli, O.D.; Eluno, E.E. Statistical computation and artificial neural algorithm modeling for the treatment of dye wastewater using mucuna sloanei as coagulant and study of the generated sludge. Results Eng.; 2023, 19, 101216. [Google Scholar] [CrossRef]
- Zuo, H.; Qin, X.; Liu, Z.; Fu, Y. Preparation and characterization of modified corn stalk biochar. BioResour, 2021, 16(4), 7428–7443. [CrossRef]
- Senthil, K.P.; Janet, J.G.; Femina, C. C.; Varshini, P.; Priyadharshini, S.; Arun Karthick, M.S.; Jothirani, R. A critical review on recent developments in the low-cost adsorption of dyes from wastewater. Desalin. Water Treat, 2019, 172, 395–416. [Google Scholar] [CrossRef]
- Epule, T.E.; Dhiba, D.; Etongo, D.; Peng, C.; Lepage, L. Identifying maize yield and precipitation gaps in Uganda. SN Appl. Sci.; 2021, 3, 1–12. [Google Scholar] [CrossRef]
- Tang, Y.; Zhao, Y.; Lin, T.; Li, Y.; Zhou, R.; Peng, Y. Adsorption performance and mechanism of methylene blue by H3PO4- modified corn stalks. J. Environ. Chem. Eng. 2019, 7, 103398. [Google Scholar] [CrossRef]
- Guel-Nájar, N.A.; Rios-Hurtado, J.C.; Muzquiz-Ramos, E.M.; Dávila-Pulido, G.I.; González-Ibarra, A.A.; Pat-Espadas, A.M. Magnetic biochar obtained by chemical coprecipitation and pyrolysis of corn cob residues: characterization and methylene blue adsorption. Materials 2023, 16. [Google Scholar] [CrossRef]
- Liu, L.; Li, Y.; Fan, S. Preparation of KOH and H3PO4 modified biochar and its application in methylene blue removal from aqueous solution. Processes 2019, 7, 891. [Google Scholar] [CrossRef]
- Xie, J.; Lin, R.; Liang, Z.; Zhao, Z.; Yang, C.; Cui, F. Effect of cations on the enhanced adsorption of cationic dye in Fe3O4-loaded biochar and mechanism. J. Environ. Chem. Eng. 2021, 9, 105744. [Google Scholar] [CrossRef]
- Liu, X.J.; Li, M.F.; Singh, S.K. Manganese-modified lignin biochar as adsorbent for removal of methylene blue. J. Mater. Res. Technol.; 2021, 12, 1434–1445. [Google Scholar] [CrossRef]
- Praveena, S. M.; Rashid, U.; Abdul Rashid, S. Optimization of nutrients removal from synthetic greywater by low-cost activated carbon: application of Taguchi method and response surface methodology. Toxin Rev.; 2022, 4, 506–515. [Google Scholar] [CrossRef]
- Lala, M.A.; Ntamu, T. E.; Adesina, O.A.; Popoola, L.T.; Yusuff, A.S.; Adeyi, A.A. Adsorption of hexavalent chromium from aqueous solution using cationic modified rice husk: Parametric optimization via Taguchi design approach. Sci. Afr. 2023, 20, e01633. [Google Scholar] [CrossRef]
- Ziaeifar, N.; Khosravi, M.; Behnajady, M. A.; Sohrabi, M. R.; Modirshahla, N. Optimizing adsorption of Cr(VI) from aqueous solutions by NiO nanoparticles using Taguchi and response surface methods. Water Sci. Technol. 2015, 72, 721–729. [Google Scholar] [CrossRef]
- Mbachu, A.; Kamoru, B.A.; Chinedu, E.T.; Ifeanyichukwu, I.J.; Jacinta, A.I.; Mustapha, S. Green synthesis of iron oxide nanoparticles by Taguchi design of experiment method for effective adsorption of methylene blue and methyl orange from textile wastewater. Results Eng. 2023, 19, 101198. [Google Scholar] [CrossRef]
- Shojaei, S.; Shojaei, S.; Band, S.S.; Farizhandi, A.A.K.; Ghoroqi, M.; Mosavi, A. Application of Taguchi method and response surface methodology into the removal of malachite green and auramine-O by NaX nanozeolites. Sci. Rep. 2021, 1–13. [Google Scholar] [CrossRef] [PubMed]
- Manikandan, S.; Saraswathi, R. Textile dye effluent treatment using advanced sono-electrocoagulation techniques: A Taguchi and particle swarm optimization modeling approach. Energy Sources,A: Recovery, Util. Environ. Eff. 2023, 45, 4501–4519. [Google Scholar] [CrossRef]
- Onu, C.E.; Ekwueme, B.N.; Ohale, P.E.; Onu, C.P.; Asadu, C.O.; Obi, C.C.; Dibia, K.T.; Onu, O.O. Decolourization of bromocresol green dye solution by acid functionalized rice husk: Artificial intelligence modeling, GA optimization, and adsorption studies. J. Hazard. Mater. Adv. 2023, 9, 100224. [Google Scholar] [CrossRef]
- Hosseini Nia, R.; Ghaedi, M.; Ghaedi, A. M. Modeling of reactive orange 12 (RO 12) adsorption onto gold nanoparticle-activated carbon using artificial neural network optimization based on an imperialist competitive algorithm. J. Mol. Liq. 2014, 195, 219–229. [Google Scholar] [CrossRef]
- Moharm, A.E.; El Naeem, G.A.; Soliman, H.M.A.; Abd-Elhamid, A.I.; El-Bardan, A.A.; Kassem, T.S.; Nayl, A.A.; Bräse, S. Fabrication and Characterization of Effective Biochar Biosorbent Derived from Agricultural Waste to Remove Cationic Dyes from Wastewater. Polym.; 2022, 14, 2587. [Google Scholar] [CrossRef] [PubMed]
- Suwunwong, T.; Hussain, N.; Chantrapromma, S.; Phoungthong, K. Facile synthesis of corncob biochar via in-house modified pyrolysis for removal of methylene blue in wastewater. Mater. Res. Express 2020, 7, 015518. [Google Scholar] [CrossRef]
- Nirmaladevi, S.; Palanisamy, N. A comparative study of the removal of cationic and anionic dyes from aqueous solutions using biochar as an adsorbent. Desalin. Water Treat.; 2020, 175, 282–292. [Google Scholar] [CrossRef]
- Abd-Elhamid, A. I.; Emran, M.; El-Sadek, M. H.; El-Shanshory, A. A.; Soliman, H. M. A.; Akl, M. A.; Rashad, M. Enhanced removal of cationic dye by eco-friendly activated biochar derived from rice straw. Appl. Water Sci. 2020, 10, 1–11. [Google Scholar] [CrossRef]
- Park, J.H.; Wang, J.J.; Meng, Y.; Wei, Z.; DeLaune, R.D.; Seo, D.C. Adsorption/desorption behavior of cationic and anionic dyes by biochars prepared at normal and high pyrolysis temperatures. Colloids Surf. A Physicochem. 2019, 572, 274–282. [Google Scholar] [CrossRef]
|
Disclaimer/Publisher’s Note: The statements, opinions and data contained in all publications are solely those of the individual author(s) and contributor(s) and not of MDPI and/or the editor(s). MDPI and/or the editor(s) disclaim responsibility for any injury to people or property resulting from any ideas, methods, instructions or products referred to in the content. |
© 2023 by the authors. Licensee MDPI, Basel, Switzerland. This article is an open access article distributed under the terms and conditions of the Creative Commons Attribution (CC BY) license (http://creativecommons.org/licenses/by/4.0/).
